Recensioni Notebook con Intel UHD Graphics 620 la scheda grafica
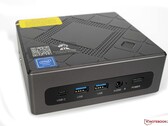
Recensione del NiPoGi CK10 con Intel Core i7-10810U: Piccolo PC da ufficio che offre spazio per tre SSD
In tempi di continui aumenti dei prezzi dell'energia, i PC compatti sono eccezionalmente popolari perché hanno un consumo energetico notevolmente inferiore rispetto ai loro tradizionali fratelli desktop. Con il NiPoGi CK10, abbiamo messo alla prova questo piccolo PC da ufficio a sei core. È un dispositivo estremamente silenzioso, ma quanto è scattante il suo SoC? Nella nostra recensione vi sveliamo tutto quello che c'è da sapere sul NiPoGi CK10 basato su Intel Core i7-10810U.
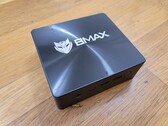
Intel Core i7-10810U, UHD Graphics 620, 468 grRecensione del mini PC BMAX B5 Pro G7H8: Debutto dell'Intel Core i5-8260U
Una CPU Intel di 8a generazione, vecchia di anni, può tenere il passo con le ultime opzioni di 12a generazione? Sorprendentemente sì, a patto che non si preveda di eseguire attività ad alta intensità grafica. Il prezzo al dettaglio di meno di 300 dollari è difficile da rifiutare per molte configurazioni HTPC.
Intel Core i5-8260U, UHD Graphics 620, 369 grRecensione del portatile rugged Getac B360: Luminoso touchscreen da 1400 nit
Il B360 è uno dei pochi portatili rugged da 13,3 pollici sul mercato, ma non lesina sulle caratteristiche accessibili o sulla qualità del display. Tuttavia, il suo uso di un vecchio processore Comet Lake-U significa che i proprietari mancheranno le caratteristiche più avanzate di Intel Tiger Lake.
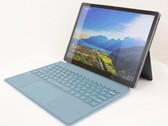
Intel Core i7-10710U, UHD Graphics 620, 13.3", 2.4 kgRecensione del KUU LeBook 12.6 convertibile 2-in-1: Un'alternativa più economica al Microsoft Surface Pro
Ci sono molti tablet Windows 10 tra cui scegliere oltre a quelli Microsoft. Il KUU LeBook è forse il più vicino in termini di design estetico e prestazioni, pur costando potenzialmente centinaia di dollari in meno, ma manca il bersaglio in alcune aree.
Intel Core i7-8550U, UHD Graphics 620, 12.6", 859 grRecensione dell'MSI Cubi 5 10M con Core i3-10110U e monitor da 27 pollici MD271
MSI Cubi 5 10M è un PC da ufficio compatto senza molti fronzoli. Insieme al Cubi 5 10M, abbiamo anche dato un'occhiata più da vicino al monitor MSI Modern MD271 e alla MSI Modern LED Lux Lightbar.
Intel Core i3-10110U, UHD Graphics 620, 27"Panasonic Toughbook FZ-G2: Intel Core i5-10310U, 10.10", 1.5 kg
recensione » Recensione del convertibile rugged Panasonic Toughbook FZ-G2: Tablet con archiviazione PCIe M.2 rimovibile
Huawei MateBook X Silver Frost (2020): Intel Core i5-10210U, 13.00", 1 kg
recensione » Recensione del Huawei MateBook X: Ultra-sottile, estremamente leggero e assolutamente silenzioso
Lenovo IdeaPad Flex 5 CB 13IML05 82B80010GE: Intel Core i5-10210U, 13.30", 1.4 kg
recensione » Recensione del computer portatile Lenovo IdeaPad Flex 5 Chromebook 13IML05: Dispositivo 2-in-1 con una penna opzionale
Acer Chromebook Spin 713 CP713-2W-560V: Intel Core i5-10210U, 13.50", 1.4 kg
recensione » Recensione dell'Acer Chromebook Spin 713 CP713-2W: Touchscreen con formato 3:2
Dell Latitude 12 7210 2-in-1: Intel Core i7-10610U, 12.30", 0.9 kg
recensione » Recensione del Laptop Dell Latitude 12 7210 2-in-1: la Comet Lake offre una migliore durata della batteria
HP EliteBook x360 1040 G7, i7-10810U: Intel Core i7-10810U, 14.00", 1.4 kg
recensione » Recensione del computer portatile HP EliteBook x360 1040 G7: Uno Spectre per professionisti
Prime Computer PrimeMini 5 i7 NUC8v7PNB: Intel Core i7-8665U, 1.3 kg
recensione » Recensione del Mini PC Prime Computer PrimeMini 5 i7 (Intel Provo Canyon NUC8v7PNB): Whiskey Lake a raffreddamento passivo per le imprese
Fujitsu LifeBook U9310X: Intel Core i5-10210U, 13.30", 1 kg
recensione » Recensione del Fujitsu Lifebook U9310X - convertibile business con LTE, che pesa appena 1 kg.
Dell Latitude 5310-23VP6: Intel Core i5-10310U, 13.30", 1.3 kg
recensione » Recensione del convertibile Dell Latitude 5310 2-in-1: un'autonomia di 11 ore
Dell Latitude 15 3510 NK2MC: Intel Core i3-10110U, 15.60", 1.9 kg
recensione » Recensione del Laptop Dell Latitude 3510: Buona durata della batteria nonostante la piccola batteria
HP EliteBook x360 1030 G7: Intel Core i7-10810U, 13.30", 1.2 kg
recensione » Recensione del Convertibile HP EliteBook x360 1030 G7: Uno Spectre Dragonfly ibrido
Dynabook Portégé X40-G-10K: Intel Core i5-10210U, 14.00", 1.3 kg
recensione » Recensione del Dynabook Portégé X40-G: notebook business di lusso che offre una protezione del display contro sguardi indesiderati
Lenovo Yoga Duet 7 13IML05-82AS000WGE: Intel Core i5-10210U, 13.00", 1.2 kg
recensione » Recensione del laptop Lenovo Yoga Duet 7: Il concorrente del Surface Pro 7 ha solo pochi punti deboli
Dell Latitude 7410 Chromebook Enterprise 2-in-1: Intel Core i5-10310U, 14.00", 1.5 kg
recensione » Recensione del Laptop Dell Latitude 7410 Chromebook Enterprise 2-in-1 (Core i5-10310U, 16 GB di RAM)
Fujitsu LifeBook U7310: Intel Core i5-10210U, 13.30", 1.2 kg
recensione » Recensione del laptop Fujitsu LifeBook U7310: Buon portatile business da 13" senza ambizioni di performance, ma con un punto di forza unico
Dell Latitude 7410 Chromebook Enterprise: Intel Core i5-10310U, 14.00", 1.4 kg
recensione » Recensione Dell Latitude 7410 Chromebook Enterprise (Core i5-10310U, 16 GB RAM)
Dynabook Satellite Pro C50-E-105: Intel Core i5-8250U, 15.60", 1.8 kg
recensione » Recensione Laptop Dynabook Satellite Pro C50-E: Business notebook hardware discutibile.
Dell Latitude 14 5410-RJ80D: Intel Core i5-10310U, 14.00", 1.6 kg
recensione » Recensione del Laptop Dell Latitude 14 5410: Limitato dalla mancanza dell'opzione AMD Ryzen
Dell Latitude 15 5510-D90XK: Intel Core i5-10310U, 15.60", 1.8 kg
recensione » Recensione del Laptop Dell Latitude 15 5510: notebook da ufficio con WWAN adeguata
Dell Latitude 5310-GXX0D: Intel Core i5-10310U, 13.30", 1.2 kg
recensione » Recensione del Laptop Dell Latitude 5310 in review: Business laptop con ampia autonomia
Zotac ZBOX MI642 Nano: Intel Core i5-10210U, 0.5 kg
recensione » Hands-On Zotac ZBOX MI642 Nano Desktop
Lenovo ThinkBook Plus 13 i7: Intel Core i7-10510U, 13.30", 1.4 kg
recensione » Recensione del Laptop Lenovo ThinkBook Plus: il particolare Display E-Ink si accoppia ad Hardware medio
Lenovo ThinkPad X13 Yoga 20SX0004GE: Intel Core i7-10510U, 13.30", 1.3 kg
recensione » Recensione del Lenovo ThinkPad X13 Yoga: un convertibile business con tante dotazioni
HP EliteBook 830 G7: Intel Core i7-10810U, 13.30", 1.3 kg
recensione » Recensione del Laptop HP EliteBook 830 G7: Premium per la massa
Asus VivoBook 17 F712FA-AU518T: Intel Core i5-10210U, 17.30", 2.3 kg
recensione » Recensione dell'Asus VivoBook 17 F712FA: Un portatile da 17,3 pollici poco luminoso per utilizzo domestico
Dell Latitude 14 9410 2-in-1 P110G: Intel Core i7-10610U, 14.00", 1.5 kg
recensione » Recensione del Convertibile Dell Latitude 14 9410 2-in-1: dentro è un Latitude 7400
Acer TravelMate P6 P614-51T-G2-72ZU: Intel Core i7-10510U, 14.00", 1.2 kg
recensione » Recensione del Laptop Acer TravelMate P6: un leggero computer portatile business con un'ampia autonomia.
Acer TravelMate P215-52: Intel Core i7-10510U, 15.60", 1.8 kg
recensione » Recensione del Laptop Acer TravelMate P2 TMP215-52: dispositivo Business economico
Lenovo ThinkPad X13-20T20033GE: Intel Core i5-10210U, 13.30", 1.3 kg
recensione » Recensione del Laptop Lenovo ThinkPad X13: piccolo, leggero e 4G compatibile
Lenovo ThinkPad T14s-20T00044GE: Intel Core i5-10210U, 14.00", 1.3 kg
recensione » Recensione del Laptop Lenovo ThinkPad T14s Gen 1: il modello Intel è la scelta peggiore
Zotac ZBox MI643: Intel Core i5-10210U, 0.6 kg
recensione » Recensione dello Zotac ZBox Edge MI643: Mini PC sottile e di basso profilo
Samsung Galaxy Book Ion 13.3: Intel Core i5-10210U, 13.30", 1 kg
recensione » Recensione del Subnotebook Samsung Galaxy Book Ion 13.3: Subnotebook Display QLED
Lenovo ThinkPad X1 Yoga 2020-20UCS03S00: Intel Core i7-10510U, 14.00", 1.3 kg
recensione » Recensione del Laptop Lenovo ThinkPad X1 Yoga 2020: convertibile business con qualche miglioramento
Lenovo ThinkPad X1 Carbon 2020-20U9003BGE: Intel Core i7-10510U, 14.00", 1.1 kg
recensione » Recensione del Laptop Lenovo ThinkPad X1 Carbon 2020: un portatile Business con 4K display che impatta sull'autonomia
Dell Latitude 9510 2-in-1: Intel Core i7-10810U, 15.00", 1.7 kg
recensione » Recensione del convertibile Dell Latitude 9510 2-in-1: un convertibile 5G da 15" Non è enorme o poco maneggevole
Dell Latitude 7310: Intel Core i7-10610U, 13.30", 1.2 kg
recensione » Recensione del Laptop Dell Latitude 7310 Core i7: look migliorato, prestazioni invariate
Lenovo ThinkPad T14-20S1S06B00: Intel Core i5-10210U, 14.00", 1.5 kg
recensione » Recensione del Laptop Lenovo ThinkPad T14: aggiornamento Comet Lake che non apporta molto
Fujitsu Lifebook U939 i5: Intel Core i5-8265U, 13.30", 0.9 kg
recensione » Recensione del Laptop Fujitsu Lifebook U939 Laptop Review: un business notebook compatto con LTE
Dell Latitude 7410: Intel Core i7-10610U, 14.00", 1.4 kg
recensione » Recensione del Laptop Dell Latitude 7410: il Lenovo X1 Carbon ha raggiunto il suo obiettivo
Durabook R11: Intel Core i5-8250U, 11.60", 1.2 kg
recensione » Recensione del Tabet Rinforzato Durabook R11: un tipo tosto
Fujitsu Lifebook U939X: Intel Core i5-8265U, 13.30", 1 kg
recensione » Recensione del Fujitsu Lifebook U939X: un convertibile business con molte funzionalità
Lenovo ThinkPad X1 Carbon 2020-20UAS04T00: Intel Core i7-10510U, 14.00", 1.1 kg
recensione » Recensione del Laptop ThinkPad X1 Carbon 2020: un popolare laptop business con un nuovo alimentatore
Asus VivoBook 17 S712FA-DS76: Intel Core i7-10510U, 17.30", 2.3 kg
recensione » Recensione del Laptop Asus VivoBook 17 S712FA: peso contenuto, prezzo basso
HP Envy x360 15-dr1679cl: Intel Core i7-10510U, 15.60", 2.1 kg
recensione » Recensione de Convertibile HP Envy x360 15 Core i7 2020: un po' troppo familiare
Huawei MateBook 13 2020 i5: Intel Core i5-10210U, 13.00", 1.3 kg
recensione » Recensione del Subnotebook Huawei MateBook 13 2020 – Aggiornamento Comet Lake senza vantaggi prestazionali
HP ProBook 430 G7-8VU53EA: Intel Core i7-10510U, 13.30", 1.4 kg
recensione » Recensione del Laptop HP ProBook 430 G7: non ci sono grandi miglioramenti con la Comet Lake
Asus ZenBook Flip 14 UX463FA-AI039T: Intel Core i5-10210U, 14.00", 1.4 kg
recensione » Recensione del Laptop Asus ZenBook Flip 14 UX463FA: un convertibile di classe ad un prezzo contenuto
Asus ExpertBook B9450FA, i7-10510U: Intel Core i7-10510U, 14.00", 1 kg
recensione » Recensione del Laptop Asus ExpertBook B9450FA: Ultra leggero e duraturo
Dynabook Portege X30L-G1331: Intel Core i5-10210U, 13.30", 0.9 kg
recensione » Recensione del Laptop Dynabook Portege X30L-G: un nuovo e leggero punto di riferimento
HP 17-by2437ng: Intel Core i3-10110U, 17.30", 2.4 kg
recensione » Recensione del laptop HP 17: un semplice notebook da ufficio con materizzatore DVD
Schenker VIA 14: Intel Core i5-10210U, 14.00", 1.1 kg
recensione » Recensione del Laptop Schenker VIA 14: materiali leggeri combinati con una grande batteria
Durabook S15ABG2: Intel Core i5-8265U, 15.60", 2.6 kg
recensione » Recensione del Laptop rinfornzato Durabook S15ABG2
Lenovo ThinkPad X1 Yoga 20SA000GUS: Intel Core i7-10510U, 14.00", 1.3 kg
recensione » Recensione del Convertibile Lenovo ThinkPad X1 Yoga 4th Gen Core i7: un ThinkPad X1 Carbon sotto mentite spoglie
HP Elite Dragonfly-8MK79EA: Intel Core i5-8265U, 13.30", 1.1 kg
recensione » Recensione del Convertibile business HP Elite Dragonfly: Più leggero di 1 kg solo con la batteria più piccola
LG Gram 14T90N: Intel Core i7-10510U, 14.00", 1.2 kg
recensione » Recensione del Convertibile LG Gram 14T90N: un Downgrade della CPU
Lenovo ThinkPad X1 Carbon G7 20R1-000YUS: Intel Core i7-10510U, 14.00", 1.2 kg
recensione » Recensione del Laptop Lenovo ThinkPad X1 Carbon G7 2020: stesso Look, Processore nuovo
Lenovo ThinkPad L13 Yoga 20R6S00800: Intel Core i5-10210U, 13.30", 1.4 kg
recensione » Recensione del Laptop Lenovo ThinkPad L13 Yoga: convertibile Business con buone dotazioni
Acer Chromebook 715 CB715-1WT-527F: Intel Core i5-8350U, 15.60", 2 kg
recensione » Recensione del Latptop Acer Chromebook 715
HP EliteBook x360 1030 G4 7YL44EA: Intel Core i7-8565U, 13.30", 1.3 kg
recensione » Recensione del Convertibile HP EliteBook x360 1030 G4: ha angoli di visuale limitati
Lenovo ThinkPad T490 20RY0002US: Intel Core i7-10510U, 14.00", 1.5 kg
recensione » Recensione del Laptop Lenovo ThinkPad T490: Aggiornamento Comet Lake-U
Lenovo ThinkPad E14 20RA001MGE: Intel Core i5-10210U, 14.00", 1.6 kg
recensione » Recensione del Laptop Lenovo ThinkPad E14: design sottile
Lenovo Yoga C740-14IML: Intel Core i5-10210U, 14.00", 1.4 kg
recensione » Recensione del Convertibile Lenovo Yoga C740-14IML: Look top, prezzo medio
Lenovo ThinkBook 14-IML-20RV006TGE: Intel Core i5-10210U, 14.00", 1.6 kg
recensione » Look di primo livello, prezzo medio Laptop Lenovo ThinkBook 14: dispositivo Business con ottima connettività
Acer Aspire 5 A514-52: Intel Core i5-10210U, 14.00", 1.7 kg
recensione » Recensione del Laptop Acer Aspire 5 A514: Intel Comet Lake non al suo meglio
HP Pavilion x360 14-dh1153ng: Intel Core i5-10210U, 14.00", 1.6 kg
recensione » Recensione del Convertibile HP Pavilion x360 14: un 14" con penna opzionale
Acer Extensa 15 EX215-51-56UX: Intel Core i5-10210U, 15.60", 1.9 kg
recensione » Recensione dell'Acer Extensa 15 EX215-51: un dispositivo con display deludente
Intel NUC10i5FNK: Intel Core i5-10210U, 0.00", 0.5 kg
recensione » Recensione dell'Intel Frost Canyon NUC con SoC Comet Lake i5 SoC
Intel NUC10i7FNH: Intel Core i7-10710U, 0.00", 0.7 kg
recensione » Recensione dell'Intel Frost Canyon NUC con 6 cores e 12 threads
HP Pavilion x360 15-dq0065cl: Intel Core i7-8565U, 15.60", 1.9 kg
recensione » Recensione del Convertibile HP Pavilion x360 15 2019: non scegliete questa configurazione
Lenovo ThinkBook 15 : Intel Core i5-10210U, 15.60", 1.9 kg
recensione » Recensione del Laptop Lenovo ThinkBook 15: un economico dispositivo da ufficio con un processore Lake
Lenovo ThinkCentre M90n-1 Nano IoT: Intel Core i3-8145U, 0.7 kg
recensione » Recensione del Lenovo ThinkCentre M90n-1 Nano IoT - un desktop silenzioso con prestazioni zoppicanti
Lenovo Yoga C740-15IML: Intel Core i7-10510U, 15.60", 1.9 kg
recensione » Recensione del Laptop Lenovo Yoga C740-15IML: batteria potente, Display deludente
Lenovo ThinkPad X1 Carbon 2019-20QD00M7GE: Intel Core i5-8265U, 14.00", 1.2 kg
recensione » Recensione del Lenovo ThinkPad X1 Carbon 2019 Privacy Guard: Un laptop Business con ePrivacy non perfetto
Lenovo ThinkCentre M90n-1 Nano: Intel Core i5-8265U, 0.00", 0.5 kg
recensione » Recensione del Lenovo ThinkCentre M90n Nano Desktop
Schenker Slim 15 L19: Intel Core i5-10210U, 15.60", 1.6 kg
recensione » Recensione dello Schenker Slim 15: laptop Wi-fi 6 che non sfrutta a pieno le capacità
Acer TravelMate X514-51-511Q: Intel Core i5-8265U, 14.00", 1 kg
recensione » Recensione del Laptop Acer TravelMate X514: un piccolo dispositivo da 14" rivolto ai professionisti
Dell XPS 13 7390 Core i7-10710U: Intel Core i7-10710U, 13.30", 1.2 kg
recensione » Recensione del Laptop Dell XPS 13 7390 Core i7-10710U: Più veloce dell'XPS 15 Core i5
Dynabook Portégé X30-F-10N: Intel Core i5-8265U, 13.30", 1.1 kg
recensione » Recensione del Laptop Dynabook Portégé X30-F: Leggero, sottile, duraturo.
Dynabook Portege A30-E-174: Intel Core i7-8550U, 13.30", 1.2 kg
recensione » Recensione del Laptop Dynabook Portégé A30-E: Great display, unstable case
Dynabook Tecra X50-F: Intel Core i7-8665U, 15.60", 1.4 kg
recensione » Recensione del Laptop Dynabook Tecra X50: Un Ultrabook leggero e duraturo
Lenovo ThinkPad L590-20Q70019GE: Intel Core i5-8265U, 15.60", 2 kg
recensione » Recensione del Laptop Lenovo ThinkPad L590: Un portatile business con buoni dispositivi di input
HP EliteBook x360 830 G6: Intel Core i7-8565U, 13.30", 1.5 kg
recensione » Recensione del Laptop HP EliteBook x360 830 G6: Convertible HP che impressiona quasi su tutto
Lenovo ThinkPad L580-20LW000VGE: Intel Core i5-8250U, 15.60", 2 kg
recensione » Recensione del Laptop Lenovo ThinkPad L580: affidabile portatile da ufficio con una buona tastiera
Dell Latitude 7200: Intel Core i5-8365U, 12.30", 1.2 kg
recensione » Recensione del Laptop Dell Latitude 7200 2-in-1: dispositivo ibrido che fa una buona impressione nonostante la tastiera che cede
Dell Latitude 7400-8N6DH: Intel Core i7-8665U, 14.00", 1.5 kg
recensione » Recensione del Laptop Dell Latitude 7400: Anche la fascia alta non è esente da debolezze
HP Spectre x360 13-ap0312ng: Intel Core i7-8565U, 13.30", 1.3 kg
recensione » Recensione del convertibile HP Spectre x360 13: un dispositivo di classe
Dell Latitude 3400: Intel Core i3-8145U, 14.00", 1.7 kg
recensione » Recensione del Laptop Dell Latitude 3400: un economico portatile business von una buona autonomia
Panasonic Toughbook FZ-55: Intel Core i5-8365U, 14.00", 2.2 kg
recensione » Recensione del Laptop Panasonic Toughbook FZ-55 MK1
Dell Latitude 7300-P99G: Intel Core i7-8665U, 13.30", 1.4 kg
recensione » Recensione del Computer Portatile Dell Latitude 7300: un subnotebook business che manca di poco l'obiettivo
HP EliteBook x360 1030 G3-4QZ12ES: Intel Core i7-8550U, 13.30", 1.3 kg
recensione » Recensione del Laptop HP EliteBook x360 1030 G3: un convertibile estremameto luminoso con touchscreen opaco e funzioni privacy
Lenovo ThinkPad X1 Carbon 2019-20QES01L00: Intel Core i7-8565U, 14.00", 1.1 kg
recensione » Recensione del Laptop Lenovo ThinkPad X1 Carbon 2019 con Full HD: più luminoso e con una autonomia superiore
Asus VivoBook 14 X403FA: Intel Core i5-8265U, 14.00", 1.3 kg
recensione » Recensione del Notebook Asus VivoBook 14 X403FA: elegante e duraturo
Lenovo ThinkPad L490 20Q6S08600: Intel Core i5-8265U, 14.00", 1.7 kg
recensione » Recensione del Laptop Lenovo ThinkPad L490: Whiskey Lake delude in questo portatile da ufficio
Dell Latitude 5500: Intel Core i7-8665U, 15.60", 1.9 kg
recensione » Recensione del Laptop Dell Latitude 5500: un portatile business con molte opzioni
Dell Inspiron 7390 2-in-1: Intel Core i7-8565U, 13.30", 1.4 kg
recensione » Recensione del Convertibile Dell Inspiron 7390 2-in-1 Black Edition
Dell Latitude 5300: Intel Core i5-8365U, 13.30", 1.4 kg
recensione » Recensione del Laptop Dell Latitude 5300: un piccolo computer portatile business con LTE
Lenovo ThinkPad X1 Yoga 2019-20QGS00A00: Intel Core i7-8565U, 14.00", 1.3 kg
recensione » Recensione del Computer Portatile Lenovo ThinkPad X1 Yoga 2019: Unibody in alluminio e otttime casse
Lenovo ThinkBook 13s-20R90071GE: Intel Core i5-8265U, 13.30", 1.3 kg
recensione » Recensione del Computer Portatile Lenovo ThinkBook 13s: un portatile Business ma senza TrackPoint
Lenovo ThinkPad X1 Carbon 2019-20QE000VGE: Intel Core i7-8665U, 14.00", 1.1 kg
recensione » Recensione del Computer portatile Lenovo ThinkPad X1 Carbon 2019 WQHD: è ancora un punto di riferimento tra i portatili business?
Lenovo Flex 14IWL: Intel Core i5-8265U, 14.00", 1.7 kg
recensione » Recensione del Computer Portatile Lenovo Flex 14 (2019, Core i5-8265U) - Un convertibile medio ad un buon prezzo.
Lenovo IdeaPad S940-14IWL: Intel Core i7-8565U, 14.00", 1.2 kg
recensione » Recensione del Computer Portatile Lenovo IdeaPad S940: più sottile e leggero
Dell Latitude 13 5300 2-in-1: Intel Core i5-8365U, 13.30", 1.4 kg
recensione » Recensione del Convertibile Dell Latitude 13 5300 2-in-1: un'alternativa al ThinkPad X390 Yoga
Lenovo ThinkPad T490-20N2004EGE: Intel Core i5-8265U, 14.00", 1.4 kg
recensione » Recensione del Computer Portatile Lenovo ThinkPad T490: un dispositivo business con ampia autonomia e una iGPU
Dell Latitude 15 3590: Intel Core i5-8250U, 15.60", 2.1 kg
recensione » Recensione del Computer Portatile Dell Latitude 3590: portatile da ufficio con qualche pecca evidente
Dell Latitude 13 3390: Intel Core i5-8250U, 13.30", 1.6 kg
recensione » Recensione del Convertibile Dell Latitude 3390 (Core i5-8250U, Full HD, 256 GB SSD)
Lenovo ThinkPad X390 Yoga-20NQS05R00: Intel Core i7-8565U, 13.30", 1.3 kg
recensione » Recensione del Convertibile Lenovo ThinkPad X390 Yoga (i7, FHD)
Dell Latitude 7400 2-in-1: Intel Core i7-8665U, 14.00", 1.5 kg
recensione » Recensione del Convertibile Dell Latitude 7400 2-in-1 (i7-8665U)
Huawei Matebook 13-53010FYW: Intel Core i7-8565U, 13.00", 1.3 kg
recensione » Recensione del Computer Portatile Huawei MateBook 13 (i7, UHD Graphics 620)
Lenovo ThinkPad E490-20N8000RGE: Intel Core i5-8265U, 14.00", 1.8 kg
recensione » Recensione del Computer Portatile Lenovo ThinkPad E490 (i5-8265U, SSD, FHD)
Dell Inspiron 15 5000 5584: Intel Core i7-8565U, 15.60", 1.9 kg
recensione » Recensione del Computer Portatile Dell Inspiron 15 5000 5584 (i7-8565U)
Lenovo ThinkPad T490s-20NYS02A00: Intel Core i5-8265U, 14.00", 1.3 kg
recensione » Recensione del Computer Portatile Lenovo ThinkPad T490s (i5, Low Power FHD)
Lenovo ThinkPad X390-20Q1S02M00: Intel Core i5-8265U, 13.30", 1.3 kg
recensione » Recensione del Computer Portatile Lenovo ThinkPad X390 (i5-8265U, FHD)
VAIO SX14: Intel Core i5-8265U, 14.00", 1 kg
recensione » Recensione del Computer Portatile Vaio SX14 (i5-8265U, FHD)
LG Gram 17Z990-R.AAS7U1: Intel Core i7-8565U, 17.00", 1.3 kg
recensione » Recensione del Computer Portatile LG Gram 17Z990 (i7-8565U. WQXGA)
LG Gram 14Z980-U.AAW5U1: Intel Core i5-8250U, 14.00", 1 kg
recensione » Recensione del Computer Portatile LG Gram 14Z980 (i5-8250U)
HP 250 G7 6HM85ES: Intel Core i5-8265U, 15.60", 1.9 kg
recensione » Recensione del Computer Portatile HP 250 G7 (Core i5-8265U, 8 GB RAM, FHD, 512 GB SSD)
Asus VivoBook Flip 14 TP412UA-EC969T: Intel Core i3-8130U, 14.00", 1.5 kg
recensione » Recensione del Convertibile Asus VivoBook Flip 14 TP412UA (i3-8130U, SSD, FHD)
HP Chromebook x360 14 G1: Intel Core i5-8350U, 14.00", 1.6 kg
recensione » Recensione del Convertibile HP Chromebook x360 14 G1 (Core i5-8350U, eMMC, FHD)
Lenovo ThinkPad E590-20NC0003GE: Intel Core i7-8565U, 15.60", 1.9 kg
recensione » Recensione del Computer Portatile Lenovo ThinkPad E590 (i7-8565U, UHD 620, FHD)
Lenovo ThinkPad X1 Tablet G3-20KJ001NGE: Intel Core i5-8250U, 13.00", 1.3 kg
recensione » Recensione del Convertibile Lenovo ThinkPad X1 Tablet 2018 (i5, 3K-IPS)
HP ProBook 430 G6-5TJ89EA: Intel Core i5-8265U, 13.30", 1.4 kg
recensione » Recensione del Computer Portatile HP ProBook 430 G6 (Core i5-8265U, 8 GB RAM, 256 GB SSD, FHD)
HP ProBook 440 G6-5TK01EA: Intel Core i7-8565U, 14.00", 1.6 kg
recensione » Recensione del Computer Portatile HP ProBook 440 G6 (i7, 512 GB, FHD)
Lenovo Ideapad S530-13IWL: Intel Core i5-8265U, 13.30", 1.2 kg
recensione » Recensione del Subnotebook Lenovo IdeaPad S530 (i5-8265U, UHD620)
Schenker Slim 15-RE-E19: Intel Core i5-8265U, 15.60", 1.5 kg
recensione » Recensione del Portatile Schenker Slim 15 RED (i5-8265U, UHD620)
Dell Inspiron 13 7380: Intel Core i7-8565U, 13.30", 1.4 kg
recensione » Recensione del Portatile Dell Inspiron 13 7380 (Core i7-8565U, SSD, FHD)
Lenovo IdeaPad 730S-13IWL 81JB0004US: Intel Core i5-8265U, 13.30", 1.1 kg
recensione » Recensione del Portatile Lenovo IdeaPad 730S-13IWL (i5-8265U, FHD)
HP Elitebook x360 1040 G5: Intel Core i7-8650U, 14.00", 1.4 kg
recensione » Recensione del Convertibile HP Elitebook x360 1040 G5 (i7-8650U, FHD)
Dell Inspiron 13 7386: Intel Core i7-8565U, 13.30", 1.5 kg
recensione » Recensione del Convertibile Dell Inspiron 13 7386 2-in-1 Black Edition (i7-8565U, 16 GB RAM, 512 GB SSD)
Lenovo ThinkPad L390 Yoga-20NT000XGE: Intel Core i5-8265U, 13.30", 1.5 kg
recensione » Recensione del Convertibile Lenovo ThinkPad L390 Yoga (Core i5-8265U, 256 GB, FHD)
Lenovo V330-14IKB-81B0004MGE: Intel Core i5-8250U, 14.00", 1.7 kg
recensione » Recensione del Portatile Lenovo V330-14IKB (i5, FHD)
Acer Swift 3 SF313-51-59SZ: Intel Core i5-8250U, 13.30", 1.3 kg
recensione » Recensione del Portatile Acer Swift 3 SF313 (Core i5-8250U, 8 GB, 256 SSD, FHD)
Lenovo Yoga Chromebook C630-81JX0008UX: Intel Core i5-8250U, 15.60", 2 kg
recensione » Recensione del Convertibile Lenovo Yoga Chromebook C630
Lenovo ThinkPad L390-20NR0013GE: Intel Core i5-8265U, 13.30", 1.5 kg
recensione » Recensione del Portatile Lenovo ThinkPad L390 (i5-8265U, FHD)
Dell XPS 13 9380 i7 4K: Intel Core i7-8565U, 13.30", 1.2 kg
recensione » Recensione del Portatile Dell XPS 13 9380 (i7-8565U, 4K UHD)
Acer Swift 5 SF515-51T-76B6: Intel Core i7-8565U, 15.60", 1 kg
recensione » Recensione del Portatile Acer Swift 5 SF515-51T (i7-8565U, SSD, FHD)
Tuxedo Book BU1307: Intel Core i7-8550U, 13.30", 1.4 kg
recensione » Recensione del Portatile Tuxedo Book BU1307 (Core i7-8550U, UHD 620)
Asus Zenbook 14 UX433FA-A6018T: Intel Core i5-8265U, 14.00", 1.2 kg
recensione » Recensione del Portatile ASUS ZenBook 14 UX433FA (Core i5-8265U, SSD, FHD)
Samsung Notebook 9 NP930QAA: Intel Core i7-8550U, 13.30", 1 kg
recensione » Recensione del Convertibile Samsung Notebook 9 Pen NP930QAA (i7-8550U)
Tuxedo InfinityBook Pro 14: Intel Core i7-8565U, 14.00", 1.4 kg
recensione » Recensione del Portatile Tuxedo InfinityBook Pro 14 (i7-8565U, SSD, FHD)
Acer TravelMate X3410-M-866T: Intel Core i7-8550U, 14.00", 1.7 kg
recensione » Recensione del Portatile Acer TravelMate X3410 (i7-8550U, 16 GB RAM, 512 GB SSD)
Dell Inspiron 7486 Chromebook 14 2-in-1: Intel Core i3-8130U, 14.00", 1.8 kg
recensione » Recensione del Convertibile Dell Inspiron 7486 Chromebook 14 2-in-1
Lenovo V320-17IKB-81CN000MGE: Intel Core i5-8250U, 17.30", 2.8 kg
recensione » Recensione del Computer Portatile Lenovo V320-17IKB (i5-8250U, SSD, FHD)
Lenovo ThinkPad X1 Carbon 2018-20KGS5DU00: Intel Core i7-8550U, 14.00", 1.1 kg
recensione » Recensione del Computer Portatile Lenovo ThinkPad X1 Carbon 2018 (matte WQHD, i7)
Huawei MateBook D 14 W50F: Intel Core i5-8250U, 14.00", 1.5 kg
recensione » Recensione del Portatile Huawei MateBook D 14 W50F (Core i5-8250U, 8 GB, 256 GB)
HP Pavilion x360 14-cd0002ng: Intel Core i3-8130U, 14.00", 1.6 kg
recensione » Recensione del Convertibile HP Pavilion x360 (Core i3-8130U, 256 GB SSD)
Toshiba Portege X30T-E-109: Intel Core i7-8550U, 13.30", 1.4 kg
recensione » Recensione del Portatile Toshiba Portege X30T-E (i7-8550U, UHD620)
Acer Swift 3 SF314-55-31N8: Intel Core i3-8145U, 14.00", 1.5 kg
recensione » Recensione del Portatile Acer Swift 3 SF314-55 (i3-8145U, SSD, FHD)
Asus ZenBook 13 UX333FA: Intel Core i5-8265U, 13.30", 1.2 kg
recensione » Recensione del Portatile Asus ZenBook 13 UX333FA (i5-8265U)
Asus VivoBook S13 S330UA-EY034T: Intel Core i7-8550U, 13.30", 1.2 kg
recensione » Recensione del Portatile Asus VivoBook S13 S330UA (i7, FHD)
Toshiba Tecra A50-E-110: Intel Core i5-8250U, 15.60", 2 kg
recensione » Recensione del Portatile Toshiba Tecra A50-E-110 (Core i5-8250U, 256 GB SSD, 8 GB RAM)
Dell Inspiron 14 5000 5482 2-in-1: Intel Core i7-8565U, 14.00", 1.8 kg
recensione » Recensione del Convertibile Dell Inspiron 14 5000 5482 2-in-1 (i7-8565U)
Asus ZenBook 14 UX433FA: Intel Core i7-8565U, 14.00", 1.2 kg
recensione » Recensione del Portatile Asus ZenBook 14 UX433F (i7-8565U)
Microsoft Surface Pro 6, Core i7, 512 GB: Intel Core i7-8650U, 12.30", 1.1 kg
recensione » Recensione del Convertibile Microsoft Surface Pro 6 (2018) (Core i7, 512GB, 16GB)
HP EliteBook x360 1030 G3 45X96UT: Intel Core i7-8650U, 13.30", 1.3 kg
recensione » Recensione del Convertibile HP EliteBook x360 1030 G3 (i7-8650U, FHD)
Microsoft Surface Pro 6, Core i5, 128 GB: Intel Core i5-8250U, 12.30", 0.8 kg
recensione » Recensione del Convertibile Microsoft Surface Pro 6 (2018) (i5, 128 GB, 8 GB)
Lenovo Yoga C930-13IKB 81C4: Intel Core i7-8550U, 13.90", 1.4 kg
recensione » Recensione del Convertibile Lenovo Yoga C930-13IKB (i7-8550U, FHD)
HP Elite x2 1013 G3-2TT14EA: Intel Core i5-8350U, 13.00", 1.2 kg
recensione » Recensione del 2-in-1 HP Elite x2 1013 G3 (i5-8350U, SSD, 3k)
Lenovo Yoga C930-13IKB: Intel Core i5-8250U, 13.90", 1.4 kg
recensione » Recensione del Convertibile Lenovo Yoga C930-13IKB (i5-8250U, FHD)
Lenovo Yoga 530-14IKB-81EK00CWGE: Intel Core i5-8250U, 14.00", 1.6 kg
recensione » Recensione del Convertibile Lenovo Yoga 530-14IKB (i5-8250U, 8 GB, 256 GB SSD)
Schenker Slim 14 M18: Intel Core i7-8550U, 14.00", 1.4 kg
recensione » Recensione del portatile Schenker Slim 14 M18 (Clevo N141WU, i7-8550U, UHD620)
Getac S410: Intel Core i7-8550U, 14.00", 3.2 kg
recensione » Recensione del portatile rinforzato Getac S410 (i5-8550U)
HP ProBook x360 440 G1: Intel Core i5-8250U, 14.00", 1.7 kg
recensione » Recensione del convertibile HP ProBook x360 440 G1 (i5-8250U, 256GB, FHD, Touch)
Asus VivoBook Flip 14 TP412UA-DB51T: Intel Core i5-8250U, 14.00", 1.5 kg
recensione » Recensione del Convertibile Asus VivoBook Flip 14 TP412UA (i5-8250U)
Zotac ZBOX-CI660 Nano: Intel Core i7-8550U, 1.1 kg
recensione » Recensione del Zotac Mini PC ZBOX-CI660 Nano (i7-8550U)
Asus ZenBook S UX391U: Intel Core i7-8550U, 13.30", 1 kg
recensione » Recensione del portatile Asus ZenBook S UX391U (Core i7, FHD)
Lenovo IdeaPad 330S-15IKB-81F500N5GE: Intel Core i5-8250U, 15.60", 1.9 kg
recensione » Recensione del Portatile Lenovo IdeaPad 330S-15IKB (i5-8250U, UHD620)
Lenovo ThinkPad X1 Carbon G6-20KG0025UK: Intel Core i5-8350U, 14.00", 1.1 kg
recensione » Recensione del Portatile Lenovo ThinkPad X1 Carbon G6 2018 (i5-8350U, Full-HD Touch, 256GB)
HP 14-ma0312ng: Intel Core i5-8250U, 14.00", 1.5 kg
recensione » Recensione del Portatile HP 14 (i5-8250U, Intel Optane Memory, HD Display)
Lenovo Ideapad 530S-15IKB: Intel Core i5-8250U, 15.60", 1.7 kg
recensione » Recensione del Lenovo Ideapad 530S-15IKB (i5-8250U, FHD)
Lenovo ThinkPad T580-20L9001AUS: Intel Core i7-8650U, 15.60", 2 kg
recensione » Recensione del portatile Lenovo ThinkPad T580 (i7-8650U, FHD)
HP EliteBook x360 1030 G3: Intel Core i5-8250U, 13.30", 1.3 kg
recensione » Recensione di HP EliteBook x360 1030 G3 (i5-8250U. FHD) Convertibile
LG Gram 15Z980-B.AA78B: Intel Core i7-8550U, 15.60", 1.1 kg
recensione » Recensione del Laptop LG Gram 15Z980 (i7-8550U, Full-HD)
Lenovo Yoga 730-13IKB: Intel Core i7-8550U, 13.30", 1.2 kg
recensione » Recensione del Convertibile Lenovo Yoga 730-13IKB (i7-8550U, 4K)
HP Pavilion 15-cs0053cl: Intel Core i5-8250U, 15.60", 1.8 kg
recensione » Recensione del Portatile HP Pavilion 15-cs0053cl (i5-8250U, HD)
Fujitsu Stylistic Q738: Intel Core i5-8350U, 13.30", 1.4 kg
recensione » Recensione del Convertibile Fujitsu Stylistic Q738 (i5-8350U, UHD620)
Lenovo ThinkPad X380 Yoga-20LH000LUS: Intel Core i5-8250U, 13.30", 1.4 kg
recensione » Recensione del Convertibile Lenovo ThinkPad X380 Yoga (i5-8250U, FHD)
Lenovo ThinkPad T480-20L50010US: Intel Core i7-8650U, 14.00", 1.6 kg
recensione » Recensione del Portatile Lenovo ThinkPad T480 (Core i7-8650U, FHD)
Fujitsu Lifebook U938: Intel Core i5-8250U, 13.30", 0.9 kg
recensione » Recensione del Subnotebook Fujitsu LifeBook U938 (i5-8250U, LTE, SSD, FHD)
Toshiba Tecra X40-E-10W: Intel Core i5-8250U, 14.00", 1.3 kg
recensione » Recensione del Portatile Toshiba Tecra X40-E (i5-8250U, SSD, LTE, FHD)
Fujitsu LifeBook U728: Intel Core i5-8250U, 12.50", 1.1 kg
recensione » Recensione del portatile Fujitsu LifeBook U728 (i5-8250U, FHD)
Lenovo ThinkPad T480s-20L7002AUS: Intel Core i5-8250U, 14.00", 1.4 kg
recensione » Recensione del Portatile Lenovo ThinkPad T480s (i5-8250U, FHD)
HP ProBook 650 G4 3UP57EA: Intel Core i5-8250U, 15.60", 2.2 kg
recensione » Recensione del Portatile HP ProBook 650 G4 (i5-8250U, FHD IPS)
Dell Latitude 7490: Intel Core i5-8350U, 14.00", 1.6 kg
recensione » Recensione del Portatile Dell Latitude 7490 (i5-8350U, FHD) Laptop Review
Acer Swift 5 SF514-52T-59HY: Intel Core i5-8250U, 14.00", 0.9 kg
recensione » Recensione del Portatile Acer Swift 5 SF514 (i5-8250U, UHD 620)
Dell Inspiron 15 5579-9672: Intel Core i5-8250U, 15.60", 2.1 kg
recensione » Recensione del Convetibile Dell Inspiron 15 5579 (i5-8250U, SSD, IPS, Touch)
Fujitsu Lifebook T938: Intel Core i5-8250U, 13.30", 1.3 kg
recensione » Recensione del Portatile Fujitsu Lifebook T938 (i5-8250U, UHD620)
Fujitsu Lifebook P728, Core i5-8250U: Intel Core i5-8250U, 12.50", 1.2 kg
recensione » Recensione del Portatile Fujitsu LifeBook P728 (i5-8250U, UHD620)
Dell Latitude 3490: Intel Core i5-8250U, 14.00", 1.8 kg
recensione » Recensione del Portatile Dell Latitude 3490 (Core i5, FHD)
HP EliteBook 840 G5-3JX61EA: Intel Core i7-8550U, 14.00", 1.5 kg
recensione » Recensione del Portatile HP EliteBook 840 G5 (i7-8550U, SSD, FHD)
Dell Latitude 7390: Intel Core i7-8650U, 13.30", 1.3 kg
recensione » Recensione del Portatile Dell Latitude 7390 (Core i7-8650U, Touchscreen)
Dell Latitude 5490: Intel Core i7-8650U, 14.00", 1.7 kg
recensione » Recensione del Portatile Dell Latitude 5490 (Core i7-8650U, Touchscreen)
Lenovo Yoga 730-13IKB-81CT: Intel Core i5-8250U, 13.30", 1.2 kg
recensione » Recensione del Convertibile Lenovo Yoga 730-13IKB (i5-8250U, FHD)
HP EliteBook 830 G5-3JX74EA: Intel Core i7-8550U, 13.30", 1.3 kg
recensione » Recensione del Portatile HP EliteBook 830 G5 (i7, FHD, SureView)
Fujitsu LifeBook U758: Intel Core i7-8650U, 15.60", 1.7 kg
recensione » Recensione del Portatile Fujitsu LifeBook U758 (i7-8650U, UHD)
Lenovo V330-15IKB: Intel Core i3-7130U, 15.60", 1.8 kg
recensione » Recensione del Portatile Lenovo V330-15IKB (i3-7130U, SSD, FHD)
Acer Aspire 3 A315-51-30YA: Intel Core i3-8130U, 15.60", 2.1 kg
recensione » Recensione del Portatile Acer Aspire 3 A315-51 (i3-8130U, SSD, FHD)
Fujitsu Lifebook E558 E5580MP581DE: Intel Core i5-8250U, 15.60", 2 kg
recensione » Recensione del Portatile Fujitsu LifeBook E558 (i5-8250U, SSD, FHD)
Fujitsu LifeBook U748: Intel Core i5-8250U, 14.00", 1.6 kg
recensione » Recensione del Portatile Fujitsu LifeBook U748 (i5-8250U, FHD, Touch)
Dell Latitude 5290: Intel Core i5-8250U, 12.50", 1.4 kg
recensione » Recensione del Portatile Dell Latitude 5290 (i5-8250U, HD)
HP EliteBook 850 G5 3JX58EA: Intel Core i5-8250U, 15.60", 1.8 kg
recensione » Recensione del Portatile HP EliteBook 850 G5 (i5-8250U, FHD)
Fujitsu Lifebook E548: Intel Core i5-8250U, 14.00", 1.8 kg
recensione » Recensione del Portatile Fujitsu LifeBook E548 (i5-8250U, UHD620)
Acer Spin 3 SP314-51-548L: Intel Core i5-8250U, 14.00", 1.7 kg
recensione » Recensione del Convertibile Acer Spin 3 SP314-51 (i5-8250U, SSD, FHD)
Dell XPS 13 9370 i7 UHD: Intel Core i7-8550U, 13.30", 1.2 kg
recensione » Recensione del Portatile Dell XPS 13 9370 (i7-8550U, 4K UHD)
Lenovo ThinkPad L380-20M5000WGE: Intel Core i5-8250U, 13.30", 1.4 kg
recensione » Recensione del portatile Lenovo ThinkPad L380 (i5-8250U, UHD620)
Lenovo ThinkPad X1 Yoga 2018-20LD0015US: Intel Core i5-8250U, 14.00", 1.4 kg
recensione » Recensione del Convertibile Lenovo ThinkPad X1 Yoga 2018 (Core i5-8250U, FHD)
LG Gram 13Z980-A: Intel Core i5-8250U, 13.30", 1 kg
recensione » Recensione del Portatile LG Gram 13Z980-A (i5-8250U)
Dell Latitude 7490: Intel Core i7-8650U, 14.00", 1.6 kg
recensione » Recensione del Dell Latitude 7490 (i7-8650U, FHD Touchscreen)
Dell Latitude 7390: Intel Core i5-8350U, 13.30", 1.3 kg
recensione » Recensione laptop Dell Latitude 7390 (i5-8350U, SSD 256 GB)
HP EliteBook 840 G5-3JX66EA: Intel Core i5-8250U, 14.00", 1.5 kg
recensione » Recensione del Portatile HP EliteBook 840 G5 (i5-8250U, SSD, Full HD)
Lenovo ThinkPad L380 Yoga-20M7001BGE: Intel Core i5-8250U, 13.30", 1.5 kg
recensione » Recensione del Convertibile Lenovo ThinkPad L380 Yoga (i5-8250U, FHD)
Dell Latitude 5290 2-in-1: Intel Core i5-8350U, 12.30", 1.3 kg
recensione » Recensione del Convertibile Dell Latitude 5290 2-in-1 (i5-8350U)
HP ProBook 430 G5-3KX72ES: Intel Core i5-8250U, 13.30", 1.5 kg
recensione » Recensione del Portatile HP ProBook 430 G5 (i5-8250U, FHD)
Asus ZenBook Flip 14 UX461UA: Intel Core i5-8250U, 14.00", 1.4 kg
recensione » Recensione del Convertibile Asus ZenBook Flip 14 UX461UA (i5-8250U, SSD, FHD)
Dell Latitude 7390 2-in-1: Intel Core i7-8650U, 13.30", 1.4 kg
recensione » Recensione del Convertibile Dell Latitude 7390 2-in-1 (i7-8650U, FHD)
Lenovo ThinkPad X1 Yoga 2018-20LES01W00: Intel Core i7-8550U, 14.00", 1.4 kg
recensione » Recensione del Convertibile Lenovo ThinkPad X1 Yoga 2018 (i7-8550U, HDR WQHD)
Lenovo ThinkPad E580-20KSCTO1WW: Intel Core i5-8250U, 15.60", 1.9 kg
recensione » Recensione del Portatile Lenovo ThinkPad E580 (i5-8250U, UHD 620, SSD)
Lenovo ThinkPad L480-20LS001AGE: Intel Core i5-8250U, 14.00", 1.7 kg
recensione » Recensione del Portatile Lenovo ThinkPad L480 (i5-8250U, UHD 620, IPS, SSD)
Lenovo ThinkPad X380 Yoga 20LJS02W00: Intel Core i7-8550U, 13.30", 1.4 kg
recensione » Recenione del Convertibile Lenovo ThinkPad X380 Yoga (i7-8550U, FHD)
HP Spectre x360 13-ae048ng: Intel Core i7-8550U, 13.30", 1.3 kg
recensione » Recensione del Portatile HP Spectre x360 13t (i7-8550U, FHD, SSD)
Dell Latitude 5490-TD70X: Intel Core i5-8350U, 14.00", 1.7 kg
recensione » Recensione del Portatile Dell Latitude 5490 (i5-8350U, FHD)
Lenovo ThinkPad X280-20KES01S00: Intel Core i5-8250U, 12.50", 1.1 kg
recensione » Recensione Completa del Portatile Lenovo ThinkPad X280 (i5-8250U, FHD)
HP Spectre 13-af033ng: Intel Core i7-8550U, 13.30", 1.1 kg
recensione » Recensione completa del laptop HP Spectre 13-af033 (i7-8550U, FHD)
Lenovo ThinkPad E480-20KNCTO1WW: Intel Core i5-8250U, 14.00", 1.8 kg
recensione » Recensione breve del Portatile Lenovo ThinkPad E480 (i5-8250U, UHD 620, SSD)
HP ProBook 440 G5-3KX87ES: Intel Core i5-8250U, 14.00", 1.6 kg
recensione » Recensione breve del Portatile HP ProBook 440 G5 (i5-8250U, FHD)
HP ProBook 450 G5-2UB53EA: Intel Core i5-8250U, 15.60", 2.1 kg
recensione » Recensione breve del Portatile HP ProBook 450 G5 (i5-8250U, FHD)
Lenovo ThinkPad X1 Carbon 2018-20KGS03900: Intel Core i7-8550U, 14.00", 1.1 kg
recensione » Recensione Completa del portatile Lenovo ThinkPad X1 Carbon 2018 (WQHD HDR, i7,)
Lenovo ThinkPad T480s-20L8S02D00: Intel Core i5-8250U, 14.00", 1.4 kg
recensione » Prime Impressioni: portatile Lenovo ThinkPad T480s (i5, WQHD)
Dell Inspiron 17-5770-0357: Intel Core i5-8250U, 17.30", 2.7 kg
recensione » Recensione breve del Portatile Dell Inspiron 17-5770-0357 (8250U, SSD, HDD, FHD)
Asus VivoBook Flip 15 TP510UA-E8073T: Intel Core i5-8250U, 15.60", 2.3 kg
recensione » Recensione breve del Convertibile Asus VivoBook Flip 15 TP510UA (i5-8250U, SSD, FHD)
Lenovo Miix 520-12IKB 20M3000LGE: Intel Core i7-8550U, 12.20", 1.3 kg
recensione » Recensione breve del Convertibile Lenovo Miix 520-12IKB (i7-8550U, SSD, WUXGA)
Dell Inspiron 13-5379-9573: Intel Core i5-8250U, 13.30", 1.6 kg
recensione » Recensione breve del Convertibile Dell Inspiron 13 5379 (i5-8250U, UHD 620)
HP Spectre x360 13t-ae000: Intel Core i7-8550U, 13.30", 1.3 kg
recensione » Recensione completa del Convertibile HP Spectre x360 13t-ae000 (i7-8550U, 4K UHD)
Lenovo Ideapad 720S-13IKB: Intel Core i5-8250U, 13.30", 1.1 kg
recensione » Recensione breve del Portatile Lenovo Ideapad 720S-13IKB (i5-8250U, UHD 620)
Dell XPS 13 9370 i5 UHD: Intel Core i5-8250U, 13.30", 1.2 kg
recensione » Recensione breve del Portatile Dell XPS 13 9370 (i5-8250U, 4K UHD)
Asus VivoBook S14 S406UA-BV023T: Intel Core i5-8250U, 14.00", 1.2 kg
recensione » Recensione breve del Portatile Asus VivoBook S14 S406UA (i5-8250U, SSD, HD)
Dell XPS 13 9370 FHD i5: Intel Core i5-8250U, 13.30", 1.2 kg
recensione » Recensione breve del Portatile Dell XPS 13 9370 (Core i5, FHD)
Schenker Slim 15 L17: Intel Core i7-8550U, 15.60", 2 kg
recensione » Recensione breve del Portatile Schenker Slim 15 L17 (Clevo N751WU, i7-8550U, FHD)
LG Gram 15Z975: Intel Core i5-8250U, 15.60", 1.1 kg
recensione » Recensione breve del Portatile LG Gram 15 (i5-8250U, FHD)
Schenker Slim 14 L17: Intel Core i5-8250U, 14.00", 1.6 kg
recensione » Recensione breve del Portatile Schenker Slim 14 (i5-8250U, UHD 620)
Lenovo Yoga 720-13IKB: Intel Core i7-8550U, 13.30", 1.3 kg
recensione » Recensione breve del Convertibile Lenovo Yoga 720-13IKB (i7-8550U, SSD, FHD)
Lenovo Miix 520-12IKB 81CG: Intel Core i5-8250U, 12.20", 1.2 kg
recensione » Recensione breve del Convertibile Lenovo Miix 520 (i5-8250U, FHD)
Razer Blade Stealth QHD i7-8550U: Intel Core i7-8550U, 13.30", 1.4 kg
recensione » Recensione breve del Portatile Razer Blade Stealth (QHD i7-8550U)
Dell XPS 13 i5-8250U: Intel Core i5-8250U, 13.30", 1.3 kg
recensione » Recensione breve del Portatile Dell XPS 13 9360R (i5-8250U, QHD)
Acer Spin 5 SP513-52N-54SF: Intel Core i5-8250U, 13.30", 1.5 kg
recensione » Recensione breve del Convertibile Acer Spin 5 SP513-52N-54SF (i5-8250U, FHD)
Dell Inspiron 13 7370: Intel Core i5-8250U, 13.30", 1.4 kg
recensione » Recensione breve del Portatile Dell Inspiron 13 7370 (i5-8250U)
Lenovo Yoga 920-13IKB-80Y7: Intel Core i7-8550U, 13.90", 1.4 kg
recensione » Recensione completa del convertibile Lenovo Yoga 920-13IKB (i7-8550U, FHD)
Tuxedo InfinityBook Pro 13 2017: Intel Core i7-8550U, 13.30", 1.5 kg
recensione » Recensione breve del Portatile Tuxedo InfinityBook Pro 13 2017 (i7-8550U, 500 GB, 32 GB, FHD)
Dell XPS 13 i7-8550U: Intel Core i7-8550U, 13.30", 1.3 kg
recensione » Recensione breve del Portatile Dell XPS 13 (i7-8550U, QHD)
HP Pavilion x360 14-cd0957nd: Intel Core i5-8250U, 14.00", 1.6 kg
Recensioni esterne » HP Pavilion x360 14-cd0957nd
Durabook R11: Intel Core i5-8250U, 11.60", 1.2 kg
Recensioni esterne » Durabook R11
HP Spectre x360 13-ap0312ng: Intel Core i7-8565U, 13.30", 1.3 kg
Recensioni esterne » HP Spectre x360 13-ap0312ng
Medion Akoya E15415-MD62481: Intel Core i5-10210U, 15.60", 1.9 kg
Recensioni esterne » Medion Akoya E15415-MD62481
Asus ExpertBook P2451FA, i3-10110U: Intel Core i3-10110U, 14.00", 1.5 kg
Recensioni esterne » Asus ExpertBook P2451FA, i3-10110U
Dell Latitude 15 5510-YKY1M: Intel Core i7-10610U, 15.60", 1.8 kg
Recensioni esterne » Dell Latitude 15 5510-YKY1M
Huawei MateBook D 15 2020, i5-10210U: Intel Core i5-10210U, 15.60", 1.5 kg
Recensioni esterne » Huawei MateBook D 15 2020, i5-10210U
HP 14-ck2010tu: Intel Core i5-10210U, 14.00", 1.5 kg
Recensioni esterne » HP 14-ck2010tu
Honor MagicBook X 15, i3-10110U: Intel Core i3-10110U, 15.60", 1.6 kg
Recensioni esterne » Honor MagicBook X 15, i3-10110U
MSI Modern 14 B10MW-421XES: Intel Core i5-10210U, 14.00", 1.3 kg
Recensioni esterne » MSI Modern 14 B10MW-421XES
Asus VivoBook Flip 14 TP412FA-EC641T: Intel Core i3-10110U, 14.00", 1.5 kg
Recensioni esterne » Asus VivoBook Flip 14 TP412FA-EC641T
Lenovo V15 IML-82NB002RUS: Intel Core i3-10110U, 15.60", 1.9 kg
Recensioni esterne » Lenovo V15 IML-82NB002RUS
HP EliteBook x360 1030 G7-26K00US: Intel Core i7-10610U, 13.30", 1.2 kg
Recensioni esterne » HP EliteBook x360 1030 G7-26K00US
Acer TravelMate P6 TMP614-51-G2-788Z: Intel Core i7-10510U, 14.00", 1.1 kg
Recensioni esterne » Acer TravelMate P6 TMP614-51-G2-788Z
Kuu LeBook 12.6 Core i7-8550U: Intel Core i7-8550U, 12.60", 0.9 kg
Recensioni esterne » Kuu LeBook 12.6 Core i7-8550U
Panasonic Toughbook FZ-G2: Intel Core i5-10310U, 10.10", 1.5 kg
Recensioni esterne » Panasonic Toughbook FZ-G2
HP Pavilion x360 14-dh0807nd: Intel Core i5-8265U, 14.00", 1.6 kg
Recensioni esterne » HP Pavilion x360 14-dh0807nd
Asus VivoBook Flip 14 TP412FA-EC707T: Intel Core i5-10210U, 14.00", 1.5 kg
Recensioni esterne » Asus VivoBook Flip 14 TP412FA-EC707T
MSI Modern 14 B10MW-604: Intel Core i5-10210U, 14.00", 1.3 kg
Recensioni esterne » MSI Modern 14 B10MW-604
Lenovo ThinkPad E14-20RA0016S: Intel Core i5-10210U, 14.00", 1.7 kg
Recensioni esterne » Lenovo ThinkPad E14-20RA0016S
Acer Aspire 5 A514-52-582Y: Intel Core i5-10210U, 14.00", 1.6 kg
Recensioni esterne » Acer Aspire 5 A514-52-582Y
Asus ExpertBook P2451FA, i5-10210U: Intel Core i5-10210U, 14.00", 1.5 kg
Recensioni esterne » Asus ExpertBook P2451FA, i5-10210U
Dell Latitude 12 7210 2-in-1, i5-10210U: Intel Core i5-10210U, 12.30", 0.9 kg
Recensioni esterne » Dell Latitude 12 7210 2-in-1, i5-10210U
Lenovo ThinkPad E14-20RA003WSP: Intel Core i5-10210U, 14.00", 2.2 kg
Recensioni esterne » Lenovo ThinkPad E14-20RA003WSP
HP 15-dw1023ns: Intel Core i5-10210U, 15.60", 1.8 kg
Recensioni esterne » HP 15-dw1023ns
Honor MagicBook X 14, i5-10210U: Intel Core i5-10210U, 14.00", 1.4 kg
Recensioni esterne » Honor MagicBook X 14, i5-10210U
Lenovo IdeaPad 3 14IML-81WA004PPB: Intel Core i5-10210U, 14.00", 1.5 kg
Recensioni esterne » Lenovo IdeaPad 3 14IML-81WA004PPB
Honor MagicBook X 14, i3-10110U: Intel Core i3-10110U, 14.00", 1.4 kg
Recensioni esterne » Honor MagicBook X 14, i3-10110U
Honor MagicBook X 15, i5-10210U: Intel Core i5-10210U, 15.60", 1.6 kg
Recensioni esterne » Honor MagicBook X 15, i5-10210U
Huawei MateBook D 15 2020, i3-10110U: Intel Core i3-10110U, 15.60", 1.5 kg
Recensioni esterne » Huawei MateBook D 15 2020, i3-10110U
Dell Latitude 12 7210 2-in-1: Intel Core i7-10610U, 12.30", 0.9 kg
Recensioni esterne » Dell Latitude 12 7210 2-in-1
Asus ZenBook 14 UX434FAC-A5144T: Intel Core i7-10510U, 14.00", 1.2 kg
Recensioni esterne » Asus ZenBook 14 UX434FAC-A5144T
Lenovo Chromebook Flex 5 13IML05-82B80006UX: Intel Core i3-10110U, 13.30", 1.4 kg
Recensioni esterne » Lenovo Chromebook Flex 5 13IML05-82B80006UX
HP Chromebook x360 13c-ca0013dx: Intel Core i5-10210U, 13.50", 1.4 kg
Recensioni esterne » HP Chromebook x360 13c-ca0013dx
Dynabook Portégé X50-G-10V: Intel Core i7-10510U, 15.60", 1.4 kg
Recensioni esterne » Dynabook Portégé X50-G-10V
Dell Latitude 14 5420, i7-10610U: Intel Core i7-10610U, 14.00", 1.4 kg
Recensioni esterne » Dell Latitude 14 5420, i7-10610U
Panasonic Toughbook 33 2021: Intel Core i5-10310U, 12.00", 1.5 kg
Recensioni esterne » Panasonic Toughbook 33 2021
HP Chromebook x360 14c-ca0004nd: Intel Core i5-10210U, 14.00", 1.7 kg
Recensioni esterne » HP Chromebook x360 14c-ca0004nd
Honor MagicBook Pro, i5-10510U: Intel Core i7-10510U, 16.10", 1.7 kg
Recensioni esterne » Honor MagicBook Pro, i5-10510U
HP EliteBook x360 1040 1Q6B5ES: Intel Core i5-10210U, 14.00", 1.4 kg
Recensioni esterne » HP EliteBook x360 1040 1Q6B5ES
Lenovo IdeaPad Flex 5 CB 13IML05-82B80000MX : Intel Core i5-10210U, 13.30", 1.4 kg
Recensioni esterne » Lenovo IdeaPad Flex 5 CB 13IML05-82B80000MX
Samsung Galaxy Chromebook 2, i3-10110U: Intel Core i3-10110U, 13.30", 1.3 kg
Recensioni esterne » Samsung Galaxy Chromebook 2, i3-10110U
HP EliteBook x360 1040 G7 1Q6B4ES: Intel Core i7-10710U, 14.00", 1.4 kg
Recensioni esterne » HP EliteBook x360 1040 G7 1Q6B4ES
Medion Akoya P6645 30026189: Intel Core i5-8265U, 15.60", 1.8 kg
Recensioni esterne » Medion Akoya P6645 30026189
HP Elite c1030, i7-10610U: Intel Core i7-10610U, 13.50", 1.3 kg
Recensioni esterne » HP Elite c1030, i7-10610U
Lenovo ThinkPad X13 Yoga-20SX002UGE: Intel Core i5-10210U, 13.30", 1.3 kg
Recensioni esterne » Lenovo ThinkPad X13 Yoga-20SX002UGE
Lenovo ThinkPad X1 Carbon G8-20U90044UK: Intel Core i7-10510U, 14.00", 1.1 kg
Recensioni esterne » Lenovo ThinkPad X1 Carbon G8-20U90044UK
Acer Chromebook Spin 713 CP713-2W-59SE: Intel Core i5-10210U, 13.50", 1.4 kg
Recensioni esterne » Acer Chromebook Spin 713 CP713-2W-59SE
Dell Latitude 14 3410, i7-10510U: Intel Core i7-10510U, 14.00", 1.6 kg
Recensioni esterne » Dell Latitude 14 3410, i7-10510U
Lenovo ThinkPad X13 Yoga 20SX0004GE: Intel Core i7-10510U, 13.30", 1.3 kg
Recensioni esterne » Lenovo ThinkPad X13 Yoga 20SX0004GE
HP EliteBook 830 G7, i7-10510U: Intel Core i7-10510U, 13.30", 1.2 kg
Recensioni esterne » HP EliteBook 830 G7, i7-10510U
Dell Latitude 7310, i5-10310U: Intel Core i5-10310U, 13.30", 1.2 kg
Recensioni esterne » Dell Latitude 7310, i5-10310U
HP EliteBook x360 1040 G7, i7-10810U: Intel Core i7-10810U, 14.00", 1.4 kg
Recensioni esterne » HP EliteBook x360 1040 G7, i7-10810U
HP EliteBook 840 G7, i7-10610U: Intel Core i7-10610U, 14.00", 1.2 kg
Recensioni esterne » HP EliteBook 840 G7, i7-10610U
HP EliteBook x360 830 G7, i7-10510U: Intel Core i7-10510U, 13.30", 1.3 kg
Recensioni esterne » HP EliteBook x360 830 G7, i7-10510U
Acer Enduro N3 EN314-51W-563C: Intel Core i5-10210U, 14.00", 2 kg
Recensioni esterne » Acer Enduro N3 EN314-51W-563C
Acer Enduro N3 EN314-51W-78KN: Intel Core i7-10510U, 14.00", 2.5 kg
Recensioni esterne » Acer Enduro N3 EN314-51W-78KN
HP Spectre 13-ap0690nd x360: Intel Core i5-8265U, 13.30", 1.4 kg
Recensioni esterne » HP Spectre 13-ap0690nd x360
Asus VivoBook Flip 14 TP412FA-EC381T: Intel Core i3-10110U, 14.00", 1.5 kg
Recensioni esterne » Asus VivoBook Flip 14 TP412FA-EC381T
Acer Aspire 5 A514-52-531Q: Intel Core i5-10210U, 14.00", 1.7 kg
Recensioni esterne » Acer Aspire 5 A514-52-531Q
Asus Zenbook 15 UX534FTC-A8094T: Intel Core i7-10510U, 15.60", 1.6 kg
Recensioni esterne » Asus Zenbook 15 UX534FTC-A8094T
MSI Modern 14 B10MW-050XES: Intel Core i7-10510U, 14.00", 1.3 kg
Recensioni esterne » MSI Modern 14 B10MW-050XES
MSI Modern 14 B10MW-026XES: Intel Core i7-10510U, 14.00", 1.3 kg
Recensioni esterne » MSI Modern 14 B10MW-026XES
Lenovo Thinkpad E15-20RD004JSP: Intel Core i5-10210U, 15.60"
Recensioni esterne » Lenovo Thinkpad E15-20RD004JSP
Lenovo Yoga S730-81J00060EN: Intel Core i7-8565U, 13.30", 1.1 kg
Recensioni esterne » Lenovo Yoga S730-81J00060EN
Lenovo ThinkPad X1 Yoga-20QF001WSP: Intel Core i5-8265U, 14.00", 1.4 kg
Recensioni esterne » Lenovo ThinkPad X1 Yoga-20QF001WSP
Lenovo ThinkPad T14s-20T00044GE: Intel Core i5-10210U, 14.00", 1.3 kg
Recensioni esterne » Lenovo ThinkPad T14s-20T00044GE
Lenovo ThinkPad X1 Carbon 2020-20U9003BGE: Intel Core i7-10510U, 14.00", 1.1 kg
Recensioni esterne » Lenovo ThinkPad X1 Carbon 2020-20U9003BGE
Lenovo ThinkPad X1 Carbon 2020-20UAS04T00: Intel Core i7-10510U, 14.00", 1.1 kg
Recensioni esterne » Lenovo ThinkPad X1 Carbon 2020-20UAS04T00
Lenovo IdeaPad Flex 5 CB 13IML05, i5-10210U: Intel Core i5-10210U, 13.30", 1.4 kg
Recensioni esterne » Lenovo Chromebook Flex 5 13, i5-10210U
Dell Latitude 15 9510, i7-10810U: Intel Core i7-10810U, 15.60", 1.4 kg
Recensioni esterne » Dell Latitude 15 9510, i7-10810U
Dell Latitude 14 9410 2-in-1, i5-10310U: Intel Core i5-10310U, 14.00", 1.4 kg
Recensioni esterne » Dell Latitude 14 9410 2-in-1, i5-10310U
Dell Latitude 7410 Chromebook Enterprise: Intel Core i5-10310U, 14.00", 1.4 kg
Recensioni esterne » Dell Latitude 7410 Chromebook Enterprise
Dell Latitude 14 9410 2-in-1 P110G: Intel Core i7-10610U, 14.00", 1.5 kg
Recensioni esterne » Dell Latitude 14 9410 2-in-1 P110G
Dell Latitude 14 5410, i7-10610U: Intel Core i7-10610U, 14.00", 1.5 kg
Recensioni esterne » Dell Latitude 14 5410, i7-10610U
HP EliteBook 840 G7, i5-10210U: Intel Core i5-10210U, 14.00", 1.3 kg
Recensioni esterne » HP EliteBook 840 G7, i5-10210U
Dell Latitude 5310-GXX0D: Intel Core i5-10310U, 13.30", 1.2 kg
Recensioni esterne » Dell Latitude 5310-GXX0D
Asus ExpertBook B9450FA-BM0367R: Intel Core i7-10510U, 14.00", 0.9 kg
Recensioni esterne » Asus ExpertBook B9450FA-BM0367R
HP EliteBook 830 G7: Intel Core i7-10810U, 13.30", 1.3 kg
Recensioni esterne » HP EliteBook 830 G7
Lenovo ThinkPad L14, i5-10210U: Intel Core i5-10210U, 14.00", 1.6 kg
Recensioni esterne » Lenovo ThinkPad L14, i5-10210U
Acer Chromebook Spin 713 CP713-2W-51EJ: Intel Core i5-10210U, 13.50", 1.4 kg
Recensioni esterne » Acer Chromebook Spin 713 CP713-2W-51EJ
Lenovo ThinkBook 13s-IML-20RR0003GE: Intel Core i7-10510U, 13.30", 1.3 kg
Recensioni esterne » Lenovo ThinkBook 13s-IML-20RR0003GE
Lenovo ThinkPad X1 Yoga 2019-20QF00AEMH: Intel Core i7-8565U, 14.00", 1.4 kg
Recensioni esterne » Lenovo ThinkPad X1 Yoga 2019-20QF00AEMH
MSI Modern 14 B10RBSW-063XES: Intel Core i7-10510U, 14.00"
Recensioni esterne » MSI Modern 14 B10RBSW-063XES
Lenovo IdeaPad Flex 5 CB 13IML05-82B80013MH: Intel Celeron 5205U, 13.30", 1.4 kg
Recensioni esterne » Lenovo IdeaPad Flex 5 CB 13IML05-82B80013MH
Lenovo ThinkPad X1 Yoga 2020-20UB000NUS: Intel Core i7-10610U, 14.00", 1.4 kg
Recensioni esterne » Lenovo ThinkPad X1 Yoga 2020-20UB000NUS
HP EliteBook 840 G7, i7-10810U: Intel Core i7-10810U, 14.00", 1.2 kg
Recensioni esterne » HP EliteBook 840 G7, i7-10810U
Dell Latitude 15 3510, i3-10110U: Intel Core i3-10110U, 15.60", 1.9 kg
Recensioni esterne » Dell Latitude 15 3510, i3-10110U
Acer Enduro N3 EN314-51W-54EA: Intel Core i5-10210U, 14.00", 2 kg
Recensioni esterne » Acer Enduro N3 EN314-51W-54EA
Lenovo Chromebook C340-15, i3-8130U: Intel Core i3-8130U, 15.60", 2 kg
Recensioni esterne » Lenovo Chromebook C340-15, i3-8130U
Acer Chromebook 715 CB715-1WT-39HZ: Intel Core i3-8130U, 15.60", 2 kg
Recensioni esterne » Acer Chromebook 715 CB715-1WT-39HZ
Dell Latitude 15 5510-D90XK: Intel Core i5-10310U, 15.60", 1.8 kg
Recensioni esterne » Dell Latitude 15 5510-D90XK
Lenovo Yoga Duet 7 13IML05, i7-10510U: Intel Core i7-10510U, 13.00", 0.8 kg
Recensioni esterne » Lenovo Yoga Duet 7 13IML05, i7-10510U
MSI Modern 14 A10M-1034XES: Intel Core i5-10210U, 14.00", 1.2 kg
Recensioni esterne » MSI Modern 14 A10M-1034XES
Lenovo Yoga Duet 7 13IML05, i5-10210U: Intel Core i5-10210U, 13.00", 0.8 kg
Recensioni esterne » Lenovo Yoga Duet 7 13IML05, i5-10210U
Lenovo ThinkBook 13s-20RR0003GE: Intel Core i7-10510U, 13.30", 1.3 kg
Recensioni esterne » Lenovo ThinkBook 13s-20RR0003GE
HP EliteBook 840 G7-1J6E9EA: Intel Core i7-10710U, 14.00", 1.5 kg
Recensioni esterne » HP EliteBook 840 G7-1J6E9EA
Asus VivoBook Flip 14 TP412FA-EC369T: Intel Core i5-10210U, 14.00", 1.5 kg
Recensioni esterne » Asus VivoBook Flip 14 TP412FA-EC369T
Lenovo ThinkPad L13 Yoga 20R5000SUK: Intel Core i7-10510U, 13.30", 1.4 kg
Recensioni esterne » Lenovo ThinkPad L13 Yoga 20R5000SUK
Lenovo ThinkPad L13 20R3000GGE: Intel Core i7-10510U, 13.30", 1.4 kg
Recensioni esterne » Lenovo ThinkPad L13 20R3000GGE
Lenovo Ideapad C340-14IMLI7: Intel Core i7-10510U, 14.00", 1.7 kg
Recensioni esterne » Lenovo Ideapad C340-14IMLI7
Acer Aspire 3 A315-54K: Intel Core i3-8130U, 15.60", 1.9 kg
Recensioni esterne » Acer Aspire 3 A315-54K
Dell Latitude 9510-P94F: Intel Core i5-10310U, 15.60", 1.5 kg
Recensioni esterne » Dell Latitude 9510-P94F
Asus VivoBook 14 A412FA i3-10110U: Intel Core i3-10110U, 14.00", 1.4 kg
Recensioni esterne » Asus VivoBook 14 A412FA i3-10110U
Dell Latitude 9510 2-in-1: Intel Core i7-10810U, 15.00", 1.7 kg
Recensioni esterne » Dell Latitude 9510 2-in-1
Asus ExpertBook P2451FA, i7-10510U: Intel Core i7-10510U, 14.00", 1.6 kg
Recensioni esterne » Asus ExpertBook P2451FA, i7-10510U
HP Pro c640 Chromebook, i7-10610U: Intel Core i7-10610U, 14.00", 1.5 kg
Recensioni esterne » HP Pro c640 Chromebook, i7-10610U
Fujitsu LifeBook U9310X, i7-10610U: Intel Core i7-10610U, 13.30", 1 kg
Recensioni esterne » Fujitsu LifeBook U9310X, i7-10610U
Lenovo ThinkPad X13-20T20033GE: Intel Core i5-10210U, 13.30", 1.3 kg
Recensioni esterne » Lenovo ThinkPad X13-20T20033GE
Dell Latitude 7490, i5-8350U: Intel Core i5-8350U, 14.00", 1.4 kg
Recensioni esterne » Dell Latitude 7490, i5-8350U
Asus VivoBook S14 S412FA-EK678T: Intel Core i5-10210U, 14.00", 1.5 kg
Recensioni esterne » Asus VivoBook S14 S412FA-EK678T
Acer Chromebook Spin 13 CP713-2W-356L: Intel Core i3-10110U, 13.50", 1.4 kg
Recensioni esterne » Acer Chromebook Spin 13 CP713-2W-356L
Lenovo ThinkPad X1 Yoga 2020-20UCS03S00: Intel Core i7-10510U, 14.00", 1.3 kg
Recensioni esterne » Lenovo ThinkPad X1 Yoga 2020-20UCS03S00
Lenovo ThinkPad X1 Carbon G8, Core i7-10610U: Intel Core i7-10610U, 14.00", 1.1 kg
Recensioni esterne » Lenovo ThinkPad X1 Carbon G8, Core i7-10610U
Acer Aspire 5 A515-54-74MM: Intel Core i7-10510U, 15.60", 1.8 kg
Recensioni esterne » Acer Aspire 5 A515-54-74MM
Asus VivoBook S14 S433FA-EB491: Intel Core i7-10510U, 14.00", 1.5 kg
Recensioni esterne » Asus VivoBook S14 S433FA-EB491
Fujitsu LifeBook U9310X, i5-10210U: Intel Core i5-10210U, 13.30", 1 kg
Recensioni esterne » Fujitsu LifeBook U9310X, i5-10210U
Asus VivoBook S15 S533FA-BQ017T: Intel Core i7-10510U, 15.60", 1.8 kg
Recensioni esterne » Asus VivoBook S15 S533FA-BQ017T
HP Chromebook x360 14-ca0241ng: Intel Core i3-10110U, 14.00", 1.7 kg
Recensioni esterne » HP Chromebook x360 14-ca0241ng
Fujitsu LifeBook U7410, i7-10510U: Intel Core i7-10510U, 14.00", 1.5 kg
Recensioni esterne » Fujitsu LifeBook U7410, i7-10510U
Lenovo ThinkPad T15, i5-10210U: Intel Core i5-10210U, 15.60", 1.9 kg
Recensioni esterne » Lenovo ThinkPad T15, i5-10210U
Lenovo ThinkPad L15, i5-10210U: Intel Core i5-10210U, 15.60", 2 kg
Recensioni esterne » Lenovo ThinkPad L15, i5-10210U
Lenovo ThinkPad X13 Yoga 20SX0026US: Intel Core i5-10310U, 13.30", 1.3 kg
Recensioni esterne » Lenovo ThinkPad X13 Yoga 20SX0026US
Dell Latitude 14 9410-40DHN 2-in-1: Intel Core i7-10610U, 14.00", 1.4 kg
Recensioni esterne » Dell Latitude 14 9410-40DHN 2-in-1
Acer Chromebook Spin 713 CP713-2W-560V: Intel Core i5-10210U, 13.50", 1.4 kg
Recensioni esterne » Acer Chromebook Spin 13 CP713-2W-560V
Fujitsu Lifebook U939X: Intel Core i5-8265U, 13.30", 1 kg
Recensioni esterne » Fujitsu Lifebook U939X
Dell Latitude 7410: Intel Core i7-10610U, 14.00", 1.4 kg
Recensioni esterne » Dell Latitude 7410
Acer Aspire 3 A317-51-51DW: Intel Core i5-10210U, 17.30", 2.7 kg
Recensioni esterne » Acer Aspire 3 A317-51-51DW
Dell Vostro 15 3590, i5-10210U: Intel Core i5-10210U, 15.60"
Recensioni esterne » Dell Vostro 15 3590, i5-10210U
LG Gram 15Z980-B.AA78B: Intel Core i7-8550U, 15.60", 1.1 kg
Recensioni esterne » LG Gram 15Z980-B.AA78B
Lenovo ThinkPad L13 Yoga 20R5002AUS: Intel Core i5-10310U, 13.30", 1.4 kg
Recensioni esterne » Lenovo ThinkPad L13 Yoga 20R5002AUS
Lenovo ThinkPad X1 Carbon 2020 i5-10210U: Intel Core i5-10210U, 14.00", 1.1 kg
Recensioni esterne » Lenovo ThinkPad X1 Carbon 2020 i5-10210U
Lenovo ThinkPad X1 Carbon 2020-20U9005NUS: Intel Core i5-10310U, 14.00", 1.1 kg
Recensioni esterne » Lenovo ThinkPad X1 Carbon 2020-20U9005NUS
Samsung Galaxy Book Ion 15 NP950XCJ-K01DE: Intel Core i7-10510U, 15.60", 1.3 kg
Recensioni esterne » Samsung Galaxy Book Ion 15 NP950XCJ-K01DE
Acer Chromebook Spin 13 CP713-2W-76P2: Intel Core i7-10610U, 13.50", 1.4 kg
Recensioni esterne » Acer Chromebook Spin 13 CP713-2W-76P2
HP 15-dw1002nu: Intel Core i3-10110U, 15.60", 1.8 kg
Recensioni esterne » HP 15-dw1002nu
Lenovo ThinkBook Plus 13 i5: Intel Core i5-10210U, 13.30", 1.4 kg
Recensioni esterne » Lenovo ThinkBook Plus 13 i5
Acer Chromebook 715 CB715-1WT-33NB: Intel Core i3-8130U, 15.60", 2 kg
Recensioni esterne » Acer Chromebook 715 CB715-1WT-33NB
Dell Latitude 7310: Intel Core i7-10610U, 13.30", 1.2 kg
Recensioni esterne » Dell Latitude 7310
Lenovo ThinkPad L13 Yoga 20R6S00800: Intel Core i5-10210U, 13.30", 1.4 kg
Recensioni esterne » Lenovo ThinkPad L13 Yoga 20R6S00800
Acer Enduro N7 EN714-51W-559L: Intel Core i5-8250U, 14.00", 2.9 kg
Recensioni esterne » Acer Enduro N7 EN714-51W-559L
HP 14s-dq0007ns: Intel Core i3-8130U, 14.00", 1.5 kg
Recensioni esterne » HP 14s-dq0007ns
Acer Aspire 5 A515-54-59W2: Intel Core i5-10210U, 15.60", 1.8 kg
Recensioni esterne » Acer Aspire 5 A515-54-59W2
HP Pavilion x360 14-dh1012ns: Intel Core i5-10210U, 14.00", 1.6 kg
Recensioni esterne » HP Pavilion x360 14-dh1012ns
Acer Aspire 3 A317-51-37PX: Intel Core i3-10110U, 17.30", 2.8 kg
Recensioni esterne » Acer Aspire 3 A317-51-37PX
HP Elitebook x360 1040 G6: Intel Core i5-8265U, 14.00", 1.4 kg
Recensioni esterne » HP Elitebook x360 1040 G6
MSI Modern 14 A10M-812XES: Intel Core i5-10210U, 14.00", 1.2 kg
Recensioni esterne » MSI Modern 14 A10M-812XES
Acer Swift 3 SF314-58-59KV: Intel Core i5-10210U, 14.00", 1.5 kg
Recensioni esterne » Acer Swift 3 SF314-58-59KV
Huawei Matebook D 15 (2018): Intel Core i3-8130U, 15.60", 1.9 kg
Recensioni esterne » Huawei Matebook D 15 (2018)
HP ProBook 430 G7, i5-10210U: Intel Core i5-10210U, 13.30", 1.5 kg
Recensioni esterne » HP ProBook 430 G7, i5-10210U
HP Pavilion x360 14-dh1153ng: Intel Core i5-10210U, 14.00", 1.6 kg
Recensioni esterne » HP Pavilion x360 14-dh1153ng
Samsung Galaxy Book Ion 13.3: Intel Core i5-10210U, 13.30", 1 kg
Recensioni esterne » Samsung Galaxy Book Ion 13.3
Lenovo IdeaPad Flex 5 CB 13IML05, i3-10110U: Intel Core i3-10110U, 13.30", 1.4 kg
Recensioni esterne » Lenovo Chromebook Flex 5 13, i3-10110U
MSI PS42 8M-072ES: Intel Core i7-8550U, 14.00", 1.2 kg
Recensioni esterne » MSI PS42 8M-072ES
MSI Modern 15 A10M-088XES: Intel Core i5-10210U, 15.60", 1.6 kg
Recensioni esterne » MSI Modern 15 A10M-088XES
Huawei MateBook 13 2020 i5: Intel Core i5-10210U, 13.00", 1.3 kg
Recensioni esterne » Huawei MateBook 13 2020 i5
Acer Aspire A515-54-36HG: Intel Core i3-10110U, 15.60", 1.8 kg
Recensioni esterne » Acer Aspire A515-54-36HG
Acer TravelMate P614-51-G2-57MS: Intel Core i5-10210U, 14.00", 1.2 kg
Recensioni esterne » Acer TravelMate P614-51-G2-57MS
Lenovo ThinkPad L13 Yoga 20R50004GE: Intel Core i5-10210U, 13.30", 1.4 kg
Recensioni esterne » Lenovo ThinkPad L13 Yoga 20R50004GE
Asus VivoBook S14 S433FA-EB123T: Intel Core i7-10510U, 14.00", 1.5 kg
Recensioni esterne » Asus VivoBook S14 S433FA-EB123T
Lenovo Yoga C640-13IML-81UE000TUK: Intel Core i3-10110U, 13.30", 1.4 kg
Recensioni esterne » Lenovo Yoga C640-13IML-81UE000TUK
Asus VivoBook S14 S433FA-EB010T: Intel Core i5-10210U, 14.00", 1.5 kg
Recensioni esterne » Asus VivoBook S14 S433FA-EB010T
Lenovo ThinkPad E15, i5-10210U: Intel Core i5-10210U, 15.60", 1.9 kg
Recensioni esterne » Lenovo ThinkPad E15, i5-10210U
HP ProBook 450 G7-8VU93EA: Intel Core i5-10210U, 15.60", 2 kg
Recensioni esterne » HP ProBook 450 G7-8VU93EA
Asus Chromebook Flip C436FA, i3-10110U: Intel Core i3-10110U, 14.00", 1.2 kg
Recensioni esterne » Asus Chromebook Flip C436FA, i3-10110U
HP ProBook 440 G7-3C084ES: Intel Core i5-10210U, 14.00", 1.6 kg
Recensioni esterne » HP ProBook 440 G7-3C084ES
Lenovo Yoga 530-14IKB-81EK00TNGE: Intel Core i5-8250U, 14.00", 1.6 kg
Recensioni esterne » Lenovo Yoga 530-14IKB-81EK00TNGE
Acer ChromeBook 714 CB714-1WT-52QC: Intel Core i5-8250U, 14.00", 1.6 kg
Recensioni esterne » Acer ChromeBook 714 CB714-1WT-52QC
Lenovo Chromebook S340-15: Intel Core i3-8130U, 15.60", 2 kg
Recensioni esterne » Lenovo Chromebook S340-15
Lenovo ThinkBook 14-IML-20RV00BRIH: Intel Core i3-10110U, 14.00", 1.5 kg
Recensioni esterne » Lenovo ThinkBook 14-IML-20RV00BRIH
Dell Vostro 15 3590, i7-10510U: Intel Core i7-10510U, 15.60", 2 kg
Recensioni esterne » Dell Vostro 15 3590, i7-10510U
Dynabook Satellite Pro L50-G-151: Intel Core i7-10710U, 15.60", 1.7 kg
Recensioni esterne » Dynabook Satellite Pro L50-G-151
Lenovo ThinkPad E14 20RA001BGE: Intel Core i7-10510U, 14.00", 1.8 kg
Recensioni esterne » Lenovo ThinkPad E14 20RA001BGE
Asus VivoBook S15 S533FA-BQ009T: Intel Core i5-10210U, 15.60", 1.8 kg
Recensioni esterne » Asus VivoBook S15 S533FA-BQ009T
HP Pavilion x360 14-dh1004ns: Intel Core i5-10210U, 14.00", 1.6 kg
Recensioni esterne » HP Pavilion x360 14-dh1004ns
Lenovo Yoga C740-14IML-81TC006VGE: Intel Core i5-10210U, 14.00", 1.4 kg
Recensioni esterne » Lenovo Yoga C740-14IML-81TC006VGE
Asus ZenBook Flip 14 UX463FA-AI027T: Intel Core i5-10210U, 14.00", 1.4 kg
Recensioni esterne » Asus ZenBook Flip 14 UX463FA-AI027T
Huawei MateBook 13 2020: Intel Core i7-10510U, 13.00", 1.3 kg
Recensioni esterne » Huawei MateBook 13 2020
Lenovo ThinkPad E14 20RA001MGE: Intel Core i5-10210U, 14.00", 1.6 kg
Recensioni esterne » Lenovo ThinkPad E14 20RA001MGE
Lenovo Yoga S940-14IWL-81Q7003WGE: Intel Core i7-8565U, 14.00", 1.2 kg
Recensioni esterne » Lenovo Yoga S940-14IWL-81Q7003WGE
Acer Aspire 3 A317-51G-569Z: Intel Core i5-10210U, 17.30", 2.7 kg
Recensioni esterne » Acer Aspire 3 A317-51G-569Z
LG Gram 14T90N-R.AAS8U1: Intel Core i7-10510U, 14.00", 1.2 kg
Recensioni esterne » LG Gram 14T90N-R.AAS8U1
HP 15-dw0017ns: Intel Core i5-8265U, 15.60", 1.8 kg
Recensioni esterne » HP 15-dw0017ns
Asus ZenBook 14 UX431FA-AM149T: Intel Core i5-10210U, 14.00", 1.4 kg
Recensioni esterne » Asus ZenBook 14 UX431FA-AM149T
Asus ZenBook 14 UX434FAC-A5188T: Intel Core i7-10510U, 14.00", 1.2 kg
Recensioni esterne » Asus ZenBook 14 UX434FAC-A5188T
Acer Aspire 3 A315-54-52UL: Intel Core i5-10210U, 15.60", 1.9 kg
Recensioni esterne » Acer Aspire 3 A315-54-52UL
Lenovo ThinkPad T480s-20L7001LMH: Intel Core i7-8550U, 14.00", 1.3 kg
Recensioni esterne » Lenovo ThinkPad T480s-20L7001LMH
Lenovo Yoga C740-15IML-81TD002MMH: Intel Core i7-10510U, 15.60", 1.9 kg
Recensioni esterne » Lenovo Yoga C740-15IML-81TD002MMH
HP Envy 13-aq1048tu: Intel Core i5-10210U, 13.30", 1.2 kg
Recensioni esterne » HP Envy 13-aq1048tu
HP 348 G7-9PH06PA: Intel Core i5-10210U, 14.00", 1.5 kg
Recensioni esterne » HP 348 G7-9PH06PA
HP Envy 13-aq1004ns: Intel Core i5-10210U, 13.30", 1.3 kg
Recensioni esterne » HP Envy 13-aq1004ns
Asus VivoBook 14 A412F-EK739T: Intel Core i5-10210U, 14.00", 1.4 kg
Recensioni esterne » Asus VivoBook 14 A412F-EK739T
Acer Aspire 5 A514-52-713B: Intel Core i7-10510U, 14.00", 1.5 kg
Recensioni esterne » Acer Aspire 5 A514-52-713B
HP Spectre x360 13-ap0017nl: Intel Core i7-8565U, 13.30", 1.3 kg
Recensioni esterne » HP Spectre x360 13-ap0017nl
MSI Modern 15 A10M-028: Intel Core i7-10510U, 15.60", 1.6 kg
Recensioni esterne » MSI Modern 15 A10M-028
Acer TravelMate X3 TMX314-51-M-561H: Intel Core i5-8265U, 14.00", 1.6 kg
Recensioni esterne » Acer TravelMate X3 TMX314-51-M-561H
Dell Latitude 13 3301, i5-8265U: Intel Core i5-8265U, 13.30", 1.2 kg
Recensioni esterne » Dell Latitude 3301, i5-8265U
Lenovo V14-IWL-81YB0000GE: Intel Core i3-8145U, 14.00", 1.6 kg
Recensioni esterne » Lenovo V14-IWL-81YB0000GE
Lenovo Yoga C740-15IML-81TD001MGE: Intel Core i5-10210U, 15.60", 1.9 kg
Recensioni esterne » Lenovo Yoga C740-15IML-81TD001MGE
HP Envy 13-aq0044nr: Intel Core i7-8565U, 13.30", 1.2 kg
Recensioni esterne » HP Envy 13-aq0044nr
Acer TravelMate P6 TMP614-51T-G2-59VT: Intel Core i5-10210U, 14.00", 1.2 kg
Recensioni esterne » Acer TravelMate P6 TMP614-51T-G2-59VT
Asus ZenBook Flip 14 UX463FL-AI025R: Intel Core i7-10510U, 14.00", 1.4 kg
Recensioni esterne » Asus ZenBook Flip 14 UX463FL-AI025R
Lenovo V15-IWL-81YE0005GE: Intel Core i5-8265U, 15.60", 2.1 kg
Recensioni esterne » Lenovo V15-IWL-81YE0005GE
Lenovo Yoga C740-15IML: Intel Core i7-10510U, 15.60", 1.9 kg
Recensioni esterne » Lenovo Yoga C740-15IML
Schenker VIA 14: Intel Core i5-10210U, 14.00", 1.1 kg
Recensioni esterne » Schenker VIA 14
HP Pavilion x360 14-dh1000ns: Intel Core i7-10510U, 14.00", 1.6 kg
Recensioni esterne » HP Pavilion x360 14-dh1000ns
HP Pavilion x360 14-dh1011ns: Intel Core i3-10110U, 14.00", 1.6 kg
Recensioni esterne » HP Pavilion x360 14-dh1011ns
Asus ZenBook 14 UX431FA-AM132T : Intel Core i5-10210U, 14.00", 1.5 kg
Recensioni esterne » Asus ZenBook 14 UX431FA-AM132T
MSI Modern 14 A10M-669: Intel Core i5-10210U, 14.00", 1.2 kg
Recensioni esterne » MSI Modern 14 A10M-669
Huawei MateBook X Pro 2020, Core i5-10210U: Intel Core i5-10210U, 13.90", 1.3 kg
Recensioni esterne » Huawei MateBook X Pro 2020, Core i5-10210U
Lenovo ThinkBook 14-20RV0000MX: Intel Core i7-10510U, 14.00", 1.5 kg
Recensioni esterne » Lenovo ThinkBook 14-20RV0000MX
HP Envy 13-aq0004np: Intel Core i7-8565U, 13.30", 1.2 kg
Recensioni esterne » HP Envy 13-aq0004np
HP Elite Dragonfly i5-8365U: Intel Core i5-8365U, 13.30", 1 kg
Recensioni esterne » HP Elite Dragonfly i5-8365U
Acer Spin 3 SP314-51-58JC: Intel Core i5-8250U, 14.00", 1.7 kg
Recensioni esterne » Acer Spin 3 SP314-51-58JC
Lenovo ThinkPad X1 Carbon 2019-20QES01L00: Intel Core i7-8565U, 14.00", 1.1 kg
Recensioni esterne » Lenovo ThinkPad X1 Carbon 2019-20QES01L00
Dell Vostro 15 3590, i3-10110U: Intel Core i3-10110U, 15.60", 2 kg
Recensioni esterne » Dell Vostro 15 3590, i3-10110U
Dell Latitude 14 5400 Chromebook: Intel Core i5-8365U, 14.00", 1.5 kg
Recensioni esterne » Dell Latitude 14 5400 Chromebook
Lenovo ThinkPad X1 Yoga 2020-20U9005NUS: Intel Core i5-10310U, 14.00", 1.3 kg
Recensioni esterne » Lenovo ThinkPad X1 Yoga Gen 5
Lenovo ThinkPad X1 Carbon G8, Core i7-10810U: unknown, 14.00", 1.1 kg
Recensioni esterne » Lenovo ThinkPad X1 Carbon G8, Core i7-10810U
Dell Inspiron 14 5491-3WDPX, 2-in-1: Intel Core i5-10210U, 14.00", 1.7 kg
Recensioni esterne » Dell Inspiron 14 5491-3WDPX, 2-in-1
Samsung Galaxy Book Flex Alpha 13 (α): unknown, 13.30", 1.2 kg
Recensioni esterne » Samsung Galaxy Book Flex Alpha 13 (α)
Lenovo ThinkBook 15 : Intel Core i5-10210U, 15.60", 1.9 kg
Recensioni esterne » Lenovo ThinkBook 15
Asus VivoBook 14 A412FA-EK343T: Intel Core i5-8265U, 14.00", 1.5 kg
Recensioni esterne » Asus VivoBook 14 A412FA-EK343T
Lenovo ThinkBook Plus 13 i7: Intel Core i7-10510U, 13.30", 1.4 kg
Recensioni esterne » Lenovo ThinkBook Plus 13 i7
Asus ExpertBook B9450FA, i7-10510U: Intel Core i7-10510U, 14.00", 1 kg
Recensioni esterne » Asus ExpertBook B9450FA, i7-10510U
Lenovo ThinkPad X1 Yoga G4-20QG000UGE: Intel Core i7-8665U, 14.00", 1.4 kg
Recensioni esterne » Lenovo ThinkPad X1 Yoga G4-20QG000UGE
Dell Inspiron 13 7391 2-in-1, i5-10510U: Intel Core i7-10510U, 13.30", 1.4 kg
Recensioni esterne » Dell Inspiron 13 7391 2-in-1, i5-10510U
Dell Inspiron 14 5490-6C55V: Intel Core i7-10510U, 14.00", 1.5 kg
Recensioni esterne » Dell Inspiron 14 5490-6C55V
HP Elite Dragonfly-8UY50UT: Intel Core i7-8665U, 13.30", 1.1 kg
Recensioni esterne » HP Elite Dragonfly-8UY50UT
Asus Chromebook Flip C436FA, i5-10210U: Intel Core i5-10210U, 14.00", 1.1 kg
Recensioni esterne » Asus Chromebook Flip C436FA, i5-10210U
Samsung Galaxy Chromebook XE930QCA-K01US: Intel Core i5-10210U, 13.30", 1 kg
Recensioni esterne » Samsung Galaxy Chromebook XE930QCA-K01US
HP Pavilion x360 14m-dh0003dx: Intel Core i5-8265U, 14.00", 1.6 kg
Recensioni esterne » HP Pavilion x360 14m-dh0003dx
Dell Inspiron 14 7490-99DXP: Intel Core i5-10210U, 14.00", 1.3 kg
Recensioni esterne » Dell Inspiron 14 7490-99DXP
MSI Prestige 15 A10SC-008ES: Intel Core i7-10710U, 15.60", 1.7 kg
Recensioni esterne » MSI Prestige 15 A10SC-008ES
Asus ZenBook Flip 13 UX362FA-EL206T: Intel Core i7-8565U, 13.30", 1.3 kg
Recensioni esterne » Asus ZenBook Flip 13 UX362FA-EL206T
Lenovo Ideapad C340-14IML-81TK001SGE: Intel Core i3-10110U, 14.00", 1.7 kg
Recensioni esterne » Lenovo Ideapad C340-14IML-81TK001SGE
Acer Extensa 2540-53W6: Intel Core i5-7200U, 15.60", 2.4 kg
Recensioni esterne » Acer Extensa 2540-53W6
HP Chromebook x360 14-da0500nd: Intel Core i5-8250U, 14.00", 1.7 kg
Recensioni esterne » HP Chromebook x360 14-da0500nd
Dell Latitude 9510 2in1: Intel Core i5-10210U, 15.60", 1.5 kg
Recensioni esterne » Dell Latitude 9510 2in1
Asus VivoBook S15 S530FA-EJ335T: Intel Core i7-8565U, 15.60", 1.8 kg
Recensioni esterne » Asus VivoBook S15 S530FA-EJ335T
Acer Aspire 3 A317-51-58S7: Intel Core i5-10210U, 17.30", 2.7 kg
Recensioni esterne » Acer Aspire 3 A317-51-58S7
Fujitsu LifeBook U748: Intel Core i5-8250U, 14.00", 1.6 kg
Recensioni esterne » Fujitsu LifeBook U748
HP Elite Dragonfly-8MK79EA: Intel Core i5-8265U, 13.30", 1.1 kg
Recensioni esterne » HP Elite Dragonfly-8MK79EA
HP Envy x360 15-dr1038no: Intel Core i7-10510U, 15.60", 2.1 kg
Recensioni esterne » HP Envy x360 15-dr1038no
Lenovo ThinkBook 13s-IWL-20R90070SP: Intel Core i5-8265U, 13.30", 1.4 kg
Recensioni esterne » Lenovo ThinkBook 13s-IWL-20R90070SP
Acer TravelMate P6 TP614-51-G2: Intel Core i7-10510U, 14.00", 1.2 kg
Recensioni esterne » Acer TravelMate P6 TP614-51-G2
Acer Aspire 5 A515-54-735N: Intel Core i7-10510U, 15.60", 1.8 kg
Recensioni esterne » Acer Aspire 5 A515-54-735N
HP 15-bs182nd: Intel Core i5-8250U, 15.60", 1.9 kg
Recensioni esterne » HP 15-bs182nd
Lenovo Ideapad 530s-14IKB-81EU00N8SP: Intel Core i5-8250U, 14.00", 1.6 kg
Recensioni esterne » Lenovo Ideapad 530s-14IKB-81EU00N8SP
Acer Aspire 5 A514-52-570U: Intel Core i5-10210U, 14.00", 1.5 kg
Recensioni esterne » Acer Aspire 5 A514-52-570U
Asus R521FA-EJ545: Intel Core i7-8565U, 15.60", 1.8 kg
Recensioni esterne » Asus R521FA-EJ545
HP EliteBook 840 G5 3JX05EA: Intel Core i7-8550U, 14.00", 1.6 kg
Recensioni esterne » HP EliteBook 840 G5 3JX05EA
Asus VivoBook S15 S532FA-BN086T: Intel Core i5-8265U, 15.60", 1.7 kg
Recensioni esterne » Asus VivoBook S15 S532FA-BN086T
Dell Latitude 7400-MW4XV 2-in-1: Intel Core i5-8265U, 14.00", 1.5 kg
Recensioni esterne » Dell Latitude 7400-MW4XV 2-in-1
Dell Vostro 15 5590, i5-10210U: Intel Core i5-10210U, 15.60", 1.7 kg
Recensioni esterne » Dell Vostro 15 5590, i5-10210U
HP Chromebook x360 14-da0001nf: Intel Core i5-8250U, 14.00", 1.7 kg
Recensioni esterne » HP Chromebook x360 14-da0001nf
Lenovo Ideapad S145-15IWL-81MV010TSP: Intel Core i5-8265U, 15.60", 1.9 kg
Recensioni esterne » Lenovo Ideapad S145-15IWL-81MV010TSP
Acer ChromeBook 714 CB714-1WT-36MS: Intel Core i3-8130U, 14.00", 1.5 kg
Recensioni esterne » Acer ChromeBook 714 CB714-1WT-36MS
Medion Akoya S6445-MD61411: Intel Core i5-8265U, 15.60", 1.8 kg
Recensioni esterne » Medion Akoya S6445-MD61411
Asus UX410UA-GV426: Intel Core i7-8550U, 14.00", 1.4 kg
Recensioni esterne » Asus UX410UA-GV426
Asus VivoBook S14 S432FA-EB001T: Intel Core i5-8265U, 14.00", 1.4 kg
Recensioni esterne » Asus VivoBook S14 S432FA-EB001T
Acer Chromebook 715 CB715-1WT-5368: Intel Core i5-8250U, 15.60", 2 kg
Recensioni esterne » Acer Chromebook 715 CB715-1WT-5368
Dell Latitude 12 7220 Rugged Extreme, i7-8665U: Intel Core i3-8145U, 11.60", 1.3 kg
Recensioni esterne » Dell Latitude 12 7220 Rugged Extreme, i7-8665U
Asus F409FA-EK254T: Intel Core i5-8265U, 14.00", 1.5 kg
Recensioni esterne » Asus F409FA-EK254T
Acer Aspire 3 A315-54K-59N: Intel Core i5-10210U, 15.60", 1.9 kg
Recensioni esterne » Acer Aspire 3 A315-54K-59N
Asus ZenBook 13 UX333FA-A3283: Intel Core i7-8565U, 13.30", 1.1 kg
Recensioni esterne » Asus ZenBook 13 UX333FA-A3283
HP Pavilion x360 14-dh0009ns: Intel Core i5-8265U, 14.00", 1.7 kg
Recensioni esterne » HP Pavilion x360 14-dh0009ns
Asus ZenBook Duo UX481FL-BM040T: Intel Core i5-10210U, 14.00", 1.5 kg
Recensioni esterne » Asus ZenBook Duo UX481FL-BM040T
Asus ZenBook 14 UX434FAC-A5225T: Intel Core i5-10210U, 14.00", 1.3 kg
Recensioni esterne » Asus ZenBook 14 UX434FAC-A5225T
Lenovo ThinkBook 14-IML-20RV006TGE: Intel Core i5-10210U, 14.00", 1.6 kg
Recensioni esterne » Lenovo ThinkBook 14-IML-20RV006TGE
Lenovo ThinkPad X1 Carbon G7-20QD00L1MH: Intel Core i7-8565U, 14.00", 1.1 kg
Recensioni esterne » Lenovo ThinkPad X1 Carbon G7-20QD00L1MH
HP EliteBook 850 G6-6XE19EA: Intel Core i5-8265U, 15.60", 1.8 kg
Recensioni esterne » HP EliteBook 850 G6-6XE19EA
Dell XPS 13 7390 Core i7-10510U: Intel Core i7-10510U, 13.30", 1.2 kg
Recensioni esterne » Dell XPS 13 7390 Core i7-10510U
Lenovo ThinkBook 14-IML-20RV005WGE: Intel Core i7-10510U, 14.00", 1.5 kg
Recensioni esterne » Lenovo ThinkBook 14-IML-20RV005WGE
Acer Aspire 5 A515-51-50Y5: Intel Core i5-8250U, 15.60", 2.2 kg
Recensioni esterne » Acer Aspire 5 A515-51-50Y5
Lenovo ThinkPad L490 20Q6S08600: Intel Core i5-8265U, 14.00", 1.7 kg
Recensioni esterne » Lenovo ThinkPad L490 20Q6S08600
Asus VivoBook S14 S432FL-EB036T: Intel Core i5-8265U, 14.00", 1.5 kg
Recensioni esterne » Asus VivoBook S14 S432FL-EB036T
MSI Modern 14 A10M-600XES: Intel Core i5-10210U, 14.00", 1.2 kg
Recensioni esterne » MSI Modern 14 A10M-600XES
HP Pavilion x360 14-dh0007ns: Intel Core i7-8565U, 14.00", 1.6 kg
Recensioni esterne » HP Pavilion x360 14-dh0007ns
Acer TravelMate X3 TMX3410-MG-59Z5: Intel Core i5-8250U, 14.00", 1.6 kg
Recensioni esterne » Acer TravelMate X3 TMX3410-MG-59Z5
HP 15-dw0020ns: Intel Core i7-8565U, 15.60", 1.8 kg
Recensioni esterne » HP 15-dw0020ns
HP 15-dw0018ns: Intel Core i5-8265U, 15.60", 1.8 kg
Recensioni esterne » HP 15-dw0018ns
Acer Aspire 3 A315-53-561Y: Intel Core i5-8250U, 15.60", 2.1 kg
Recensioni esterne » Acer Aspire 3 A315-53-561Y
HP 15-dw0019ns: Intel Core i7-8565U, 15.60", 1.8 kg
Recensioni esterne » HP 15-dw0019ns
Lenovo ThinkBook 13s-IWL-20R9006YMH: Intel Core i5-8265U, 13.30", 1.3 kg
Recensioni esterne » Lenovo ThinkBook 13s-IWL-20R9006YMH
Medion Akoya S6445-MD61354: Intel Core i7-8565U, 15.60", 1.8 kg
Recensioni esterne » Medion Akoya S6445-MD61354
Acer Swift 3 SF315-52-37YA: Intel Core i3-8130U, 15.60", 1.8 kg
Recensioni esterne » Acer Swift 3 SF315-52-37YA
Dell XPS 13 7390 Core i5-10210U: Intel Core i5-10210U, 13.30", 1.3 kg
Recensioni esterne » Dell XPS 13 7390 Core i5-10210U
Lenovo Ideapad S340-15IWL-81N80038GE: Intel Core i5-8265U, 15.60", 1.8 kg
Recensioni esterne » Lenovo Ideapad S340-15IWL-81N80038GE
Lenovo IdeaPad Flex 6 14-81EM000KUS: Intel Core i5-8250U, 14.00", 1.7 kg
Recensioni esterne » Lenovo IdeaPad Flex 6 14-81EM000KUS
Dell Latitude 15 3500-V58YD: Intel Core i5-8265U, 15.60", 2 kg
Recensioni esterne » Dell Latitude 15 3500-V58YD
Dell Inspiron 13 7391 2-in-1, i5-10210U: Intel Core i5-10210U, 13.30", 1.4 kg
Recensioni esterne » Dell Inspiron 13 7391 2-in-1, i5-10210U
Lenovo ThinkPad T490-20N3001EGE: Intel Core i5-8250U, 14.00", 1.5 kg
Recensioni esterne » Lenovo ThinkPad T490-20N3001EGE
Acer TravelMate X5 TMX514-51-7411: Intel Core i7-8565U, 14.00", 1 kg
Recensioni esterne » Acer TravelMate X5 TMX514-51-7411
Dell XPS 13 7390 Core i7-10710U: Intel Core i7-10710U, 13.30", 1.2 kg
Recensioni esterne » Dell XPS 13 7390 Core i7-10710U
HP 14-cf1003ns: Intel Core i5-8265U, 14.00", 1.4 kg
Recensioni esterne » HP 14-cf1003ns
HP 15-DA1057NS: Intel Core i5-8265U, 15.60", 1.8 kg
Recensioni esterne » HP 15-DA1057NS
HP 15-DA1008NS: Intel Core i5-8265U, 15.60", 1.9 kg
Recensioni esterne » HP 15-DA1008NS
HP 15-DA1071NS: Intel Core i7-8565U, 15.60", 1.8 kg
Recensioni esterne » HP 15-DA1071NS
Acer Spin 3 SP314-52-36YC: Intel Core i3-8145U, 14.00", 1.7 kg
Recensioni esterne » Acer Spin 3 SP314-52-36YC
Acer Aspire 3 A315-53-58FF: Intel Core i5-8250U, 15.60", 2.1 kg
Recensioni esterne » Acer Aspire 3 A315-53-58FF
Asus ZenBook UX430UA-GV595: Intel Core i7-8550U, 14.00", 1.3 kg
Recensioni esterne » Asus ZenBook UX430UA-GV595
HP EliteBook x360 1040 G5 5DF84EA: Intel Core i7-8550U, 14.00", 1.4 kg
Recensioni esterne » HP EliteBook x360 1040 G5 5DF84EA
Acer Aspire 3 A315-53-55FW: Intel Core i5-8250U, 15.60", 2.1 kg
Recensioni esterne » Acer Aspire 3 A315-53-55FW
Lenovo Ideapad S340-14IWL-81N700HGGE: Intel Core i5-8265U, 14.00", 1.6 kg
Recensioni esterne » Lenovo Ideapad S340-14IWL-81N700HGGE
Asus ZenBook Duo UX481FA-BM025R: Intel Core i5-10210U, 14.00", 1.5 kg
Recensioni esterne » Asus ZenBook Duo UX481FA-BM025R
Dell Latitude 14 5400-XCC8G: Intel Core i5-8365U, 14.00", 1.5 kg
Recensioni esterne » Dell Latitude 14 5400-XCC8G
Asus VivoBook S14 S431FA-EB156T: Intel Core i5-8265U, 14.00", 1.4 kg
Recensioni esterne » Asus VivoBook S14 S431FA-EB156T
Asus VivoBook S15 S532FA-BN024T: Intel Core i7-8565U, 15.60", 1.8 kg
Recensioni esterne » Asus VivoBook S15 S532FA-BN024T
Acer Swift 3 SF314-55G-78U1: Intel Core i7-8565U, 14.00", 1.4 kg
Recensioni esterne » Acer Swift 3 SF314-55G-78U1
Asus VivoBook S15 S530FA-BQ287T: Intel Core i5-8265U, 15.60", 1.8 kg
Recensioni esterne » Asus VivoBook S15 S530FA-BQ287T
Lenovo Ideapad S145-15IWL-81MV00URLT: Intel Core i3-8145U, 15.60", 1.9 kg
Recensioni esterne » Lenovo Ideapad S145-15IWL-81MV00URLT
HP Elite Dragonfly-8MK81EA: Intel Core i7-8565U, 13.30", 1 kg
Recensioni esterne » HP Elite Dragonfly-8MK81EA
HP Envy 13-aq1015TX: Intel Core i5-10210U, 13.30", 1.2 kg
Recensioni esterne » HP Envy 13-aq1015TX
HP Pavilion 14-ce2002ns: Intel Core i5-8265U, 14.00", 1.6 kg
Recensioni esterne » HP Pavilion 14-ce2002ns
MSI PS42 Modern 8MO-208XES: Intel Core i5-8265U, 14.00", 1.2 kg
Recensioni esterne » MSI PS42 Modern 8MO-208XES
Asus ZenBook UX430UA-GV257: Intel Core i5-8250U, 14.00", 1.3 kg
Recensioni esterne » Asus ZenBook UX430UA-GV257
HP EliteBook 840 G6-6XD76EA: Intel Core i5-8265U, 14.00", 1.5 kg
Recensioni esterne » HP EliteBook 840 G6-6XD76EA
Medion Akoya S6445-MD61389: Intel Core i5-8265U, 15.60", 1.8 kg
Recensioni esterne » Medion Akoya S6445-MD61389
Lenovo ThinkPad X1 Yoga 2019-20QGS00A00: Intel Core i7-8565U, 14.00", 1.3 kg
Recensioni esterne » Lenovo ThinkPad X1 Yoga 2019-20QGS00A00
Lenovo IdeaPad S145-15IWL-81MV00V6SA: Intel Core i3-8145U, 15.60", 1.9 kg
Recensioni esterne » Lenovo IdeaPad S145-15IWL-81MV00V6SA
Acer Aspire A514-52-516K: Intel Core i5-10210U, 14.00", 1.6 kg
Recensioni esterne » Acer Aspire A514-52-516K
Asus ZenBook S13 UX392FA-AB021T: Intel Core i7-8565U, 13.90", 1.1 kg
Recensioni esterne » Asus ZenBook S13 UX392FA-AB021T
HP Spectre x360 15-df1005ng: Intel Core i7-10510U, 15.60", 2.1 kg
Recensioni esterne » HP Spectre x360 15-df1005ng
Acer Chromebook 715 CB715-1WT-527F: Intel Core i5-8350U, 15.60", 2 kg
Recensioni esterne » Acer Chromebook 715 CB715-1WT-527F
Lenovo ThinkPad L590-20Q70019GE: Intel Core i5-8265U, 15.60", 2 kg
Recensioni esterne » Lenovo ThinkPad L590-20Q70019GE
Panasonic Toughpad FZ-55: Intel Core i5-8365U, 15.60", 2.2 kg
Recensioni esterne » Panasonic Toughpad FZ-55
Lenovo ThinkBook 13s-IWL-20R90072GE: Intel Core i7-8565U, 13.30", 1.3 kg
Recensioni esterne » Lenovo ThinkBook 13s-IWL-20R90072GE
Asus VivoBook S15 S531FL, i5-8265U: Intel Core i5-8265U, 15.60", 1.8 kg
Recensioni esterne » Asus VivoBook S15 S531FL, i5-8265U
Lenovo Yoga C740-14IML-81TC002RGE: Intel Core i5-10210U, 14.00", 1.4 kg
Recensioni esterne » Lenovo Yoga C740-14IML-81TC002RGE
Asus VivoBook S14 S432FA-EB008T: Intel Core i5-8265U, 14.00", 1.4 kg
Recensioni esterne » Asus VivoBook S14 S432FA-EB008T
Medion Akoya S6445-MD61353: Intel Core i5-8265U, 15.60", 1.8 kg
Recensioni esterne » Medion Akoya S6445-MD61353
HP 15-DA1009NS: Intel Core i5-8265U, 15.60", 1.8 kg
Recensioni esterne » HP 15-DA1009NS
Asus ExpertBook P5440FA, i7-8565U: Intel Core i7-8565U, 14.00", 1.2 kg
Recensioni esterne » Asus ExpertBook P5440FA, i7-8565U
HP Pavilion 14-ce1014tu: Intel Core i3-8145U, 14.00", 1.6 kg
Recensioni esterne » HP Pavilion 14-ce1014tu
Lenovo ThinkPad X390-20Q1S02M00: Intel Core i5-8265U, 13.30", 1.3 kg
Recensioni esterne » Lenovo ThinkPad X390-20Q1S02M00
HP EliteBook x360 830 G6-6XE09EA: Intel Core i5-8365U, 13.30", 1.4 kg
Recensioni esterne » HP EliteBook x360 830 G6-6XE09EA
HP EliteBook 840 G6-7KN32EA: Intel Core i7-8565U, 14.00", 1.5 kg
Recensioni esterne » HP EliteBook 840 G6-7KN32EA
Dell Latitude 15 5500-RY7PM: Intel Core i5-8265U, 15.60", 1.8 kg
Recensioni esterne » Dell Latitude 15 5500-RY7PM
Asus ExpertBook P5440FA, i5-8265U: Intel Core i5-8265U, 14.00", 1.2 kg
Recensioni esterne » Asus ExpertBook P5440FA, i5-8265U
Asus ZenBook Flip 13 UX362FA-EL232T: Intel Core i7-8565U, 13.30", 1.3 kg
Recensioni esterne » Asus ZenBook Flip 13 UX362FA-EL232T
Acer Chromebook 714 CB714-1WT-32KD: Intel Core i3-8130U, 14.00", 1.6 kg
Recensioni esterne » Acer Chromebook 714 CB714-1WT-32KD
Panasonic Toughbook FZ-55: Intel Core i5-8365U, 14.00", 2.2 kg
Recensioni esterne » Panasonic Toughbook FZ-55
Lenovo ThinkPad X1 Carbon G7-20QD003EGE: Intel Core i5-8265U, 14.00", 1.1 kg
Recensioni esterne » Lenovo ThinkPad X1 Carbon G7-20QD003EGE
Dell Latitude 5300-s014l530013us: Intel Core i7-8665U, 13.30", 1.4 kg
Recensioni esterne » Dell Latitude 5300-s014l530013us
Dell Inspiron 14 5480-0K0TJ: Intel Core i5-8265U, 14.00", 1.9 kg
Recensioni esterne » Dell Inspiron 14 5480-0K0TJ
Asus VivoBook 14 X403, i7-8565U: Intel Core i7-8565U, 14.00", 1.3 kg
Recensioni esterne » Asus VivoBook 14 X403, i7-8565U
Lenovo Yoga C640-13IML-81UE0010GE: Intel Core i7-10510U, 13.30", 1.4 kg
Recensioni esterne » Lenovo Yoga C640-13IML-81UE0010GE
MSI PS63 Modern 8M-071ES: Intel Core i7-8565U, 15.60", 1.6 kg
Recensioni esterne » MSI PS63 Modern 8M-071ES
Asus VivoBook S15 S512FA-BR066T: Intel Core i5-8265U, 15.60", 1.6 kg
Recensioni esterne » Asus VivoBook S15 S512FA-BR066T
Asus VivoBook S14 X412FA-EK314T: Intel Core i5-8265U, 14.00", 1.5 kg
Recensioni esterne » Asus VivoBook S14 X412FA-EK314T
Microsoft Surface Laptop 2-LQN-00004: Intel Core i5-8250U, 13.50", 1.3 kg
Recensioni esterne » Microsoft Surface Laptop 2-LQN-00004
HP Pavilion x360 11-ad107tu: Intel Core i3-8130U, 11.60", 1.4 kg
Recensioni esterne » HP Pavilion x360 11-ad107tu
Asus VivoBook Flip 14 TP412FA-EC924T: Intel Core i3-8145U, 14.00", 1.5 kg
Recensioni esterne » Asus VivoBook Flip 14 TP412FA-EC924T
Asus VivoBook 14 X403FA: Intel Core i5-8265U, 14.00", 1.3 kg
Recensioni esterne » Asus VivoBook 14 X403FA
Dell Latitude 5500: Intel Core i7-8665U, 15.60", 1.9 kg
Recensioni esterne » Dell Latitude 5500
HP Spectre x360 13-ap0000ns: Intel Core i5-8265U, 13.30", 1.4 kg
Recensioni esterne » HP Spectre x360 13-ap0000ns
Lenovo Yoga C640-13IML-81UE0003GE: Intel Core i5-10210U, 13.30", 1.4 kg
Recensioni esterne » Lenovo Yoga C640-13IML-81UE0003GE
Asus VivoBook 15 A512FA-BQ113T: Intel Core i3-8145U, 15.60", 1.7 kg
Recensioni esterne » Asus VivoBook 15 A512FA-BQ113T
HP Envy 13-aq0007nf: Intel Core i5-8265U, 13.30", 1.2 kg
Recensioni esterne » HP Envy 13-aq0007nf
HP Pavilion 15-cs0814no: Intel Core i5-8250U, 15.60", 1.9 kg
Recensioni esterne » HP Pavilion 15-cs0814no
HP Envy 13-AQ0007no: Intel Core i7-8565U, 13.30", 1.2 kg
Recensioni esterne » HP Envy 13-AQ0007no
Asus VivoBook S14 S412FA-EK065T : Intel Core i5-8265U, 14.00", 1.5 kg
Recensioni esterne » Asus VivoBook S14 S412FA-EK065T
HP Pavilion x360 14-dh0006ns: Intel Core i7-8565U, 14.00", 1.6 kg
Recensioni esterne » HP Pavilion x360 14-dh0006ns
HP Envy 13-ah1013nw: Intel Core i5-8265U, 13.30", 1.3 kg
Recensioni esterne » HP Envy 13-ah1013nw
Lenovo Yoga S940-14IWL-496: Intel Core i7-8565U, 14.00", 1.2 kg
Recensioni esterne » Lenovo Yoga S940-14IWL-496
Dell Latitude 7300-P99G: Intel Core i7-8665U, 13.30", 1.4 kg
Recensioni esterne » Dell Latitude 7300-P99G
Acer Spin 3 SP314-53N-77AJ: Intel Core i7-8565U, 14.00", 1.7 kg
Recensioni esterne » Acer Spin 3 SP314-53N-77AJ
Lenovo ThinkPad X1 Carbon 2019-20QE000VGE: Intel Core i7-8665U, 14.00", 1.1 kg
Recensioni esterne » Lenovo ThinkPad X1 Carbon 2019-20QE000VGE
Fujitsu Lifebook U939X, i7-8665U: Intel Core i7-8665U, 13.30", 1 kg
Recensioni esterne » Fujitsu Lifebook U939X, i7-8665U
HP Chromebook 15-de0035cl: Intel Core i3-8130U, 15.60", 1.8 kg
Recensioni esterne » HP Chromebook 15-de0035cl
Lenovo ThinkPad X1 Yoga G4-20QF0024GE: Intel Core i7-8565U, 14.00", 1.4 kg
Recensioni esterne » Lenovo ThinkPad X1 Yoga G4-20QF0024GE
Acer Aspire 3 A315-53-589C: Intel Core i5-8250U, 15.60", 2.4 kg
Recensioni esterne » Acer Aspire 3 A315-53-589C
HP Envy 13-aq0002ng: Intel Core i7-8565U, 13.30", 1.2 kg
Recensioni esterne » HP Envy 13-aq0002ng
Dell Inspiron 13 5370-75K6D: Intel Core i3-8130U, 13.30", 1.4 kg
Recensioni esterne » Dell Inspiron 13 5370-75K6D
Lenovo Ideapad S340-15IWL-81N800P0GE: Intel Core i3-8145U, 15.60", 1.8 kg
Recensioni esterne » Lenovo Ideapad S340-15IWL-81N800P0GE
Lenovo Ideapad 330-15IKBR-81DE02RCSP: Intel Core i5-8250U, 15.60", 2.2 kg
Recensioni esterne » Lenovo Ideapad 330-15IKBR-81DE02RCSP
HP Envy 13-aq0004ns: Intel Core i7-8565U, 13.30", 1.2 kg
Recensioni esterne » HP Envy 13-aq0004ns
Acer Swift 3 SF314-56-574K: Intel Core i5-8265U, 14.00", 1.5 kg
Recensioni esterne » Acer Swift 3 SF314-56-574K
HP 15-da1614nd: Intel Core i5-8265U, 15.60", 1.8 kg
Recensioni esterne » HP 15-da1614nd
Acer TravelMate P6 TMP614-51T-737H: Intel Core i7-8565U, 14.00", 1.2 kg
Recensioni esterne » Acer TravelMate P6 TMP614-51T-737H
Lenovo ThinkBook 13s-IWL-20R9005LUS: Intel Core i5-8265U, 13.30", 1.3 kg
Recensioni esterne » Lenovo ThinkBook 13s-IWL-20R9005LUS
Dell Latitude 7200 2-in-1 (i7-8365U): Intel Core i5-8365U, 12.30", 0.9 kg
Recensioni esterne » Dell Latitude 7200 2-in-1 (i7-8365U)
Dell Latitude 7200 2-in-1 (i7-8665U): Intel Core i7-8665U, 12.30", 0.9 kg
Recensioni esterne » Dell Latitude 7200 2-in-1 (i7-8665U)
Acer Aspire 5 A515-54-30BQ: Intel Core i3-8145U, 15.60", 1.8 kg
Recensioni esterne » Acer Aspire 5 A515-54-30BQ
Dell Latitude 13 5300 2-in-1: Intel Core i5-8365U, 13.30", 1.4 kg
Recensioni esterne » Dell Latitude 13 5300 2-in-1
Dell Inspiron 7390 2-in-1: Intel Core i7-8565U, 13.30", 1.4 kg
Recensioni esterne » Dell Inspiron 7390 2-in-1
Acer TravelMate P6 TMP614-51T-54UV: Intel Core i5-8265U, 14.00", 1.2 kg
Recensioni esterne » Acer TravelMate P6 TMP614-51T-54UV
Asus VivoBook 15 R564U-EJ122T: Intel Core i5-8250U, 15.60", 1.7 kg
Recensioni esterne » Asus VivoBook 15 R564U-EJ122T
Asus Zenbook S13 UX392FA-AB017T : Intel Core i5-8265U, 13.90", 1.1 kg
Recensioni esterne » Asus Zenbook S13 UX392FA-AB017T
Acer Spin 5 SP513-53N-550T: Intel Core i5-8265U, 13.30", 1.5 kg
Recensioni esterne » Acer Spin 5 SP513-53N-550T
HP Elite x2 1013 G3-6BB82UT: Intel Core i7-8650U, 13.00", 1.2 kg
Recensioni esterne » HP Elite x2 1013 G3-6BB82UT
Dell Latitude 13 3300-DN86T: Intel Core i5-8250U, 13.30", 1.6 kg
Recensioni esterne » Dell Latitude 13 3300-DN86T
Dell Latitude 14 5400-NJVXR: Intel Core i5-8265U, 14.00", 1.5 kg
Recensioni esterne » Dell Latitude 14 5400-NJVXR
Dell Latitude 7400-FM7VX: Intel Core i5-8265U, 14.00", 1.4 kg
Recensioni esterne » Dell Latitude 7400-FM7VX
VAIO SX12-VJS121X0211A: Intel Core i7-8565U, 12.50", 0.9 kg
Recensioni esterne » VAIO SX12-VJS121X0211A
Lenovo ThinkPad L390-20NR0013GE: Intel Core i5-8265U, 13.30", 1.5 kg
Recensioni esterne » Lenovo ThinkPad L390-20NR0013GE
Lenovo Yoga Chromebook C630-81JX0004US: Intel Core i3-8130U, 15.60", 2.1 kg
Recensioni esterne » Lenovo Yoga Chromebook C630-81JX0004US
Asus VivoBook 14 X412FJ-EK215T: Intel Core i3-8145U, 14.00", 1.5 kg
Recensioni esterne » Asus VivoBook 14 X412FJ-EK215T
Fujitsu Lifebook U939X, i5-8365U: Intel Core i5-8365U, 13.30", 1 kg
Recensioni esterne » Fujitsu Lifebook U939X, i5-8365U
Acer Aspire 5 A515-52-35TB: Intel Core i3-8145U, 15.60", 1.8 kg
Recensioni esterne » Acer Aspire 5 A515-52-35TB
HP 14-df0023cl: Intel Core i3-8130U, 14.00", 1.4 kg
Recensioni esterne » HP 14-df0023cl
Acer Aspire 5 A515-54-51DJ: Intel Core i5-8265U, 15.60", 1.8 kg
Recensioni esterne » Acer Aspire 5 A515-54-51DJ
HP Chromebook x360 14 G1-6BV87UA: Intel Core i7-8650U, 14.00", 1.6 kg
Recensioni esterne » HP Chromebook x360 14 G1-6BV87UA
Lenovo ThinkPad T590-20N4000DPB: Intel Core i7-8565U, 15.60", 1.8 kg
Recensioni esterne » Lenovo ThinkPad T590-20N4000DPB
Lenovo Ideapad C340-15IWL-81N5000WGE: Intel Core i5-8265U, 15.60", 2.2 kg
Recensioni esterne » Lenovo Ideapad C340-15IWL-81N5000WGE
HP Pavilion x360 14-dh0220ng: Intel Core i5-8265U, 14.00", 1.6 kg
Recensioni esterne » HP Pavilion x360 14-dh0220ng
Lenovo ThinkPad T490s-20NX000APB: Intel Core i5-8265U, 14.00", 1.4 kg
Recensioni esterne » Lenovo ThinkPad T490s-20NX000APB
HP Pavilion 15-cs2010tx: Intel Core i5-8265U, 15.60", 1.9 kg
Recensioni esterne » HP Pavilion 15-cs2010tx
Dell Latitude 7400-2RH81 2-in-1: Intel Core i5-8365U, 14.00", 1.4 kg
Recensioni esterne » Dell Latitude 7400-2RH81 2-in-1
Dell Latitude 3400: Intel Core i3-8145U, 14.00", 1.7 kg
Recensioni esterne » Dell Latitude 14 3400-5157
Dell Inspiron 13 7386-3MVN4: Intel Core i7-8565U, 13.30", 1.5 kg
Recensioni esterne » Dell Inspiron 13 7386-3MVN4
Dell XPS 13 9380-9NDKJ: Intel Core i3-8145U, 13.30", 1.3 kg
Recensioni esterne » Dell XPS 13 9380-9NDKJ
Asus VivoBook 14 X403FA, i3-8145U: Intel Core i3-8145U, 14.00", 1.3 kg
Recensioni esterne » Asus VivoBook X403FA, i3-8145U
Asus VivoBook 14 X412FA-EK295T: Intel Core i5-8265U, 14.00", 1.5 kg
Recensioni esterne » Asus VivoBook 14 X412FA-EK295T
LG Gram 13Z990-G: Intel Core i5-8265U, 13.30", 1 kg
Recensioni esterne » LG Gram 13Z990-G
Lenovo Ideapad 330-15IKBR-81DE01P2SP: Intel Core i7-8550U, 15.60", 2.2 kg
Recensioni esterne » Lenovo Ideapad 330-15IKBR-81DE01P2SP
HP Spectre x360 13-ap0018nf: Intel Core i7-8565U, 13.30", 1.4 kg
Recensioni esterne » HP Spectre x360 13-ap0018nf
Fujitsu Lifebook U939: Intel Core i7-8665U, 13.30", 0.9 kg
Recensioni esterne » Fujitsu Lifebook U939
Asus Vivobook S14 S412DA-EK025T: Intel Core i5-8265U, 14.00", 1.4 kg
Recensioni esterne » Asus Vivobook S14 S412DA-EK025T
HP Pavilion 14-ce1001ng: Intel Core i3-8145U, 14.00", 1.6 kg
Recensioni esterne » HP Pavilion 14-ce1001ng
Acer Aspire 3 A315-54-56KY: Intel Core i5-8265U, 15.60", 1.9 kg
Recensioni esterne » Acer Aspire 3 A315-54-56KY
HP 348 G5: Intel Core i5-8250U, 14.00", 1.5 kg
Recensioni esterne » HP 348 G5
Lenovo ThinkBook 13s-20R90071GE: Intel Core i5-8265U, 13.30", 1.3 kg
Recensioni esterne » Lenovo ThinkBook 13s-20R90071GE
Lenovo Flex 14IWL: Intel Core i5-8265U, 14.00", 1.7 kg
Recensioni esterne » Lenovo Flex 14IWL
LG Gram 15Z990-V.AA52B: Intel Core i5-8265U, 15.60", 1.1 kg
Recensioni esterne » LG Gram 15Z990-V.AA52B
Acer Aspire 3 A315-53-58EJ: Intel Core i5-8250U, 15.60", 2.1 kg
Recensioni esterne » Acer Aspire 3 A315-53-58EJ
Lenovo Ideapad S145-15IWL-81MV005NSP: Intel Core i3-8145U, 15.60", 1.9 kg
Recensioni esterne » Lenovo Ideapad S145-15IWL-81MV005NSP
Lenovo Ideapad 330-15IKBR-81DE01D5SP: Intel Core i5-8250U, 15.60", 2.2 kg
Recensioni esterne » Lenovo Ideapad 330-15IKBR-81DE01D5SP
Lenovo Ideapad S145-15IWL-81MV00B6GE: Intel Core i3-8145U, 15.60", 1.9 kg
Recensioni esterne » Lenovo Ideapad S145-15IWL-81MV00B6GE
MSI PS42 Modern 8MO-023ES: Intel Core i7-8565U, 14.00", 1.2 kg
Recensioni esterne » MSI PS42 Modern 8MO-023ES
HP Pavilion x360 14-dh0103tu: Intel Core i3-8145U, 14.00", 1.6 kg
Recensioni esterne » HP Pavilion x360 14-dh0103tu
Asus Vivobook 14 X409F-EK138T: Intel Core i5-8265U, 14.00", 1.6 kg
Recensioni esterne » Asus X409F-EK138T
MSI PS42 Modern 8MO: Intel Core i5-8265U, 14.00", 1.2 kg
Recensioni esterne » MSI PS42 Modern 8MO
Asus Vivobook 15 X509FA-EJ239T: Intel Core i5-8265U, 15.60", 1.9 kg
Recensioni esterne » Asus Vivobook X509FA-EJ239T
Asus VivoBook 14 A412FA: Intel Core i3-8145U, 14.00", 1.5 kg
Recensioni esterne » Asus VivoBook 14 A412FA
Dell Inspiron 14 3480: Intel Core i5-8265U, 14.00", 1.7 kg
Recensioni esterne » Dell Inspiron 14 3480
Dell Inspiron 14 N3476: Intel Core i5-8250U, 14.00", 2 kg
Recensioni esterne » Dell Inspiron 14 N3476
Dell Vostro 15 5581-F6VF1: Intel Core i5-8265U, 15.60", 1.9 kg
Recensioni esterne » Dell Vostro 15 5581-F6VF1
HP Envy 13-aq0001ng: Intel Core i5-8265U, 13.30", 1.2 kg
Recensioni esterne » HP Envy 13-aq0001ng
Asus Vivobook S14 S430FA-EB069T: Intel Core i3-8145U, 14.00", 1.4 kg
Recensioni esterne » Asus Vivobook S14 S430FA-EB069T
HP Envy 13-ah1001ng: Intel Core i5-8265U, 13.30", 1.3 kg
Recensioni esterne » HP Envy 13-ah1001ng
Dell Vostro 15 3580: Intel Core i7-8565U, 15.60", 2.2 kg
Recensioni esterne » Dell Vostro 15 3580
Lenovo ThinkPad Yoga X390-20NN0026GE: Intel Core i5-8265U, 13.30", 1.3 kg
Recensioni esterne » Lenovo ThinkPad Yoga X390-20NN0026GE
Dell Latitude 7400-8N6DH: Intel Core i7-8665U, 14.00", 1.5 kg
Recensioni esterne » Dell Latitude 7400-8N6DH
HP Spectre x360 13-ap0101tu: Intel Core i7-8565U, 13.30", 1.3 kg
Recensioni esterne » HP Spectre x360 13-ap0101tu
Lenovo ThinkPad E490-20N8000RGE: Intel Core i5-8265U, 14.00", 1.8 kg
Recensioni esterne » Lenovo ThinkPad E490-20N8000RGE
Lenovo Ideapad 530s-14IKBR-81EU00N7SP: Intel Core i5-8250U, 14.00", 1.6 kg
Recensioni esterne » Lenovo Ideapad 530s-14IKBR-81EU00N7SP
Acer Spin 3 SP314-51-548L: Intel Core i5-8250U, 14.00", 1.7 kg
Recensioni esterne » Acer Spin 3 SP314-51-548L
Asus ZenBook 13 UX333FA-A3070T: Intel Core i5-8265U, 13.30", 1.1 kg
Recensioni esterne » Asus ZenBook 13 UX333FA-A3070T
Medion Ultrafino S6445-MD61351: Intel Core i3-8145U, 15.60", 1.7 kg
Recensioni esterne » Medion Ultrafino S6445-MD61351
HP EliteBook x360 1040 G5-5SR13EAABD: Intel Core i7-8550U, 14.00", 1.4 kg
Recensioni esterne » HP EliteBook x360 1040 G5-5SR13EAABD
Lenovo ThinkPad T490s-20NX000EMC: Intel Core i7-8565U, 14.00", 1.4 kg
Recensioni esterne » Lenovo ThinkPad T490s-20NX000EMC
Toshiba Portege X30T-E-109: Intel Core i7-8550U, 13.30", 1.4 kg
Recensioni esterne » Toshiba Portege X30T-E-109
Dell Latitude 7400 2-in-1: Intel Core i7-8665U, 14.00", 1.5 kg
Recensioni esterne » Dell Latitude 7400 2-in-1
Lenovo IdeaPad S940-14IWL: Intel Core i7-8565U, 14.00", 1.2 kg
Recensioni esterne » Lenovo IdeaPad S940-14IWL
Asus VivoBook S14 F403FA-EB114T: Intel Core i7-8565U, 14.00", 1.3 kg
Recensioni esterne » Asus VivoBook S14 F403FA-EB114T
Lenovo ThinkPad X390-20Q0003VGE: Intel Core i7-8565U, 13.30", 1.3 kg
Recensioni esterne » Lenovo ThinkPad X390-20Q0003VGE
Lenovo ThinkPad T490-20N2004AGE: Intel Core i7-8565U, 14.00", 1.5 kg
Recensioni esterne » Lenovo ThinkPad T490-20N2004AGE
Lenovo ThinkPad T490-20N20049GE: Intel Core i7-8565U, 14.00", 1.5 kg
Recensioni esterne » Lenovo ThinkPad T490-20N20049GE
HP Envy x360 15m-dr0012dx: Intel Core i7-8565U, 15.60", 2.1 kg
Recensioni esterne » HP Envy x360 15m-dr0012dx
Asus VivoBook 14 K403FA: Intel Core i5-8265U, 14.00", 1.3 kg
Recensioni esterne » Asus VivoBook K403FA
Lenovo Ideapad C340-14IWL-81N4001MGE: Intel Core i5-8265U, 14.00", 1.7 kg
Recensioni esterne » Lenovo Ideapad C340-14IWL-81N4001MGE
HP Pavilion 14-ce1003ng: Intel Core i5-8265U, 14.00", 1.6 kg
Recensioni esterne » HP Pavilion 14-ce1003ng
Acer Swift 3 SF314-56-544M: Intel Core i5-8265U, 14.00", 1.6 kg
Recensioni esterne » Acer Swift 3 SF314-56-544M
Toshiba Portege Z30-E-12L: Intel Core i7-8550U, 13.30", 1.2 kg
Recensioni esterne » Toshiba Portege Z30-E-12L
Medion Akoya S6445-30025468: Intel Core i5-8265U, 15.60", 1.8 kg
Recensioni esterne » Medion Akoya S6445-30025468
Asus VivoBook S14 S430FA-EB061: Intel Core i5-8265U, 14.00", 1.4 kg
Recensioni esterne » Asus VivoBook S14 S430FA-EB061
Lenovo Ideapad S145-14IWL-81MU0089GE: Intel Core i3-8145U, 14.00", 1.6 kg
Recensioni esterne » Lenovo Ideapad S145-14IWL-81MU0089GE
Asus Zenbook UX433FA-A6113T: Intel Core i5-8265U, 14.00", 1.2 kg
Recensioni esterne » Asus Zenbook UX433FA-A6113T
Asus Zenbook UX333FA-A4011T: Intel Core i5-8265U, 13.30", 1.2 kg
Recensioni esterne » Asus Zenbook UX333FA-A4011T
Asus Zenbook Flip 13 UX362FA-EL099T: Intel Core i5-8265U, 13.30", 1.3 kg
Recensioni esterne » Asus Zenbook Flip 13 UX362FA-EL099T
HP Chromebook x360 14 G1: Intel Core i5-8350U, 14.00", 1.6 kg
Recensioni esterne » HP Chromebook x360 14 G1
Acer Swift 3 SF313-51-873X: Intel Core i7-8550U, 13.30", 1.2 kg
Recensioni esterne » Acer Swift 3 SF313-51-873X
Asus VivoBook Flip 14 TP410UA-EC479T: Intel Core i5-8250U, 14.00", 1.6 kg
Recensioni esterne » Asus VivoBook Flip 14 TP410UA-EC479T
Lenovo Yoga 730-13IWL-81JR006AMH: Intel Core i5-8265U, 13.30", 1.2 kg
Recensioni esterne » Lenovo Yoga 730-13IWL-81JR006AMH
Acer TravelMate X3 TMX3410-M-54G3: Intel Core i5-8250U, 14.00", 1.6 kg
Recensioni esterne » Acer TravelMate X3 TMX3410-M-54G3
Toshiba Tecra X40-E-10W: Intel Core i5-8250U, 14.00", 1.3 kg
Recensioni esterne » Toshiba Tecra X40-E-10W
Huawei MateBook D 14 W50F: Intel Core i5-8250U, 14.00", 1.5 kg
Recensioni esterne » Huawei MateBook D 14 W50F
Lenovo ThinkPad X390 Yoga-20NQS05R00: Intel Core i7-8565U, 13.30", 1.3 kg
Recensioni esterne » Lenovo ThinkPad X390 Yoga-20NQS05R00
VAIO SX14: Intel Core i5-8265U, 14.00", 1 kg
Recensioni esterne » VAIO SX14
LG Gram 17Z990-R.AAS7U1: Intel Core i7-8565U, 17.00", 1.3 kg
Recensioni esterne » LG Gram 17Z990-R.AAS7U1
Asus VivoBook S13 S330UA-EY637T: Intel Core i5-8250U, 13.30", 1.2 kg
Recensioni esterne » Asus VivoBook S13 S330UA-EY637T
Medion Akoya S6445-30025466: Intel Core i7-8565U, 15.60", 1.8 kg
Recensioni esterne » Medion Akoya S6445-30025466
Acer Aspire 5 A515-52-78YZ: Intel Core i7-8565U, 15.60", 1.8 kg
Recensioni esterne » Acer Aspire 5 A515-52-78YZ
Dell Vostro 14 5481: Intel Core i5-8265U, 14.00", 1.6 kg
Recensioni esterne » Dell Vostro 14 5481
HP Spectre 13-af000nw: Intel Core i5-8250U, 13.30", 1.1 kg
Recensioni esterne » HP Spectre 13-af000nw
Asus ZenBook 14 RX433FA-A5157R: Intel Core i5-8265U, 14.00", 1.1 kg
Recensioni esterne » Asus ZenBook 14 RX433FA-A5157R
HP Pavilion x360 14-CD006NW: Intel Core i5-8250U, 14.00", 1.6 kg
Recensioni esterne » HP Pavilion x360 14-CD006NW
Acer TravelMate X5 TMX514-51T-703H: Intel Core i7-8565U, 14.00", 1 kg
Recensioni esterne » Acer TravelMate X5 TMX514-51T-703H
HP Spectre x360 13-ap0000nt: Intel Core i5-8265U, 13.30", 1.4 kg
Recensioni esterne » HP Spectre x360 13-ap0000nt
Asus VivoBook 15 X512FA-BQ064T: Intel Core i5-8265U, 15.60", 1.7 kg
Recensioni esterne » Asus VivoBook 15 X512FA-BQ064T
Acer Swift 3 SF314-56-347L: Intel Core i3-8145U, 14.00", 4.6 kg
Recensioni esterne » Acer Swift 3 SF314-56-347L
HP 250 G7-6HM83ESABD: Intel Core i5-8265U, 15.60", 1.8 kg
Recensioni esterne » HP 250 G7-6HM83ESABD
Asus VivoBook S14 S430FA-EB145T: Intel Core i3-8145U, 14.00", 1.4 kg
Recensioni esterne » Asus VivoBook S14 S430FA-EB145T
Asus Pro B9440FA-GV0004R: Intel Core i7-8565U, 14.00", 1.1 kg
Recensioni esterne » Asus Pro B9440FA-GV0004R
Huawei Matebook D 15-53010FDQ: Intel Core i5-8250U, 15.60", 1.9 kg
Recensioni esterne » Huawei Matebook D 15-53010FDQ
HP ProBook 430 G6-5TL26EAABD: Intel Core i5-8265U, 13.30", 1.5 kg
Recensioni esterne » HP ProBook 430 G6-5TL26EAABD
Acer Chromebook Spin 13 CP713-1WN-52TK: Intel Core i5-8250U, 13.50", 1.5 kg
Recensioni esterne » Acer Chromebook Spin 13 CP713-1WN-52TK
Lenovo Ideapad 330-15IKBR-81DE019TPB: Intel Core i5-8250U, 15.60", 2.2 kg
Recensioni esterne » Lenovo Ideapad 330-15IKBR-81DE019TPB
Dell XPS 13 9380 2019: Intel Core i5-8265U, 13.30", 1.2 kg
Recensioni esterne » Dell XPS 13 9380 2019
Medion Akoya S4401-MD61268: Intel Core i5-8250U, 14.00", 1.8 kg
Recensioni esterne » Medion Akoya S4401-MD61268
Medion Akoya S6445-30025467: Intel Core i3-8145U, 15.60", 1.8 kg
Recensioni esterne » Medion Akoya S6445-30025467
Medion Akoya S6445-30025464: Intel Core i3-8145U, 15.60", 1.8 kg
Recensioni esterne » Medion Akoya S6445-30025464
Asus ZenBook 14 UX433FA-A5090T: Intel Core i5-8265U, 14.00", 1.1 kg
Recensioni esterne » Asus ZenBook 14 UX433FA-A5090T
Asus VivoBook S13 S330UA-EY034T: Intel Core i7-8550U, 13.30", 1.2 kg
Recensioni esterne » Asus VivoBook S13 S330UA-EY034T
Acer Spin 3 SP314-51-532E: Intel Core i5-8250U, 14.00", 1.7 kg
Recensioni esterne » Acer Spin 3 SP314-51-532E
HP ProBook 450 G6-6HM61ES: Intel Core i5-8265U, 15.60", 2 kg
Recensioni esterne » HP ProBook 450 G6-6HM61ES
Trekstor Vaio SX14-VJS141C11L: Intel Core i7-8565U, 14.00", 1 kg
Recensioni esterne » Trekstor Vaio SX14-VJS141C11L
Asus VivoBook S13 S330FA-EY044T: Intel Core i3-8145U, 13.30", 1.2 kg
Recensioni esterne » Asus VivoBook S13 S330FA-EY044T
Acer Aspire 5 A515-51-52L5: Intel Core i5-8250U, 15.60", 2.2 kg
Recensioni esterne » Acer Aspire 5 A515-51-52L5
Acer Aspire 3 A315-53-317G: Intel Core i3-8130U, 15.60", 2.1 kg
Recensioni esterne » Acer Aspire 3 A315-53-317G
Lenovo ThinkPad L390 Yoga-20NT000XGE: Intel Core i5-8265U, 13.30", 1.5 kg
Recensioni esterne » Lenovo ThinkPad L390 Yoga-20NT000XGE
Acer Swift 5 SF515-51T-75A1: Intel Core i7-8565U, 15.60", 1 kg
Recensioni esterne » Acer Swift 5 SF515-51T-75A1
Lenovo Yoga Chromebook C630 81JX0005MX: Intel Core i5-8250U, 15.60", 1.9 kg
Recensioni esterne » Lenovo Yoga Chromebook C630 81JX0005MX
Acer TravelMate X5 TMX514-51-511Q: Intel Core i5-8265U, 14.00", 1 kg
Recensioni esterne » Acer TravelMate X5 TMX514-51-511Q
HP Spectre x360 13-ap0180nd: Intel Core i5-8265U, 13.30", 1.3 kg
Recensioni esterne » HP Spectre x360 13-ap0180nd
HP 15-da1015ns: Intel Core i5-8265U, 15.60", 1.8 kg
Recensioni esterne » HP 15-da1015ns
Lenovo Yoga 730-15IKB-81CU0056PB: Intel Core i7-8550U, 15.60", 1.9 kg
Recensioni esterne » Lenovo Yoga 730-15IKB-81CU0056PB
Acer Swift 5 SF515-51T-73HQ: Intel Core i7-8565U, 15.60", 1 kg
Recensioni esterne » Acer Swift 5 SF515-51T-73HQ
MSI PS63 Modern 8M-080CZ: Intel Core i7-8565U, 15.60", 1.6 kg
Recensioni esterne » MSI PS63 Modern 8M-080CZ
Asus ZenBook 13 UX333FA-A3076T: Intel Core i7-8565U, 13.30", 1.1 kg
Recensioni esterne » Asus ZenBook 13 UX333FA-A3076T
HP Pavilion x360 14-cd1042tx: Intel Core i7-8565U, 14.00", 1.6 kg
Recensioni esterne » HP Pavilion x360 14-cd1042tx
Acer Swift 5 SF515-51T-507P: Intel Core i5-8265U, 15.60", 1 kg
Recensioni esterne » Acer Swift 5 SF515-51T-507P
HP ProBook 440 G6-5TK03EA: Intel Core i5-8265U, 14.00", 1.6 kg
Recensioni esterne » HP ProBook 440 G6-5TK03EA
Microsoft Surface Pro 6, Core i5, 256 GB: Intel Core i5-8250U, 12.30", 0.8 kg
Recensioni esterne » Microsoft Surface Pro 6, Core i5, 256 GB
Acer Swift 5 SF514-53T-75UE: Intel Core i7-8565U, 14.00", 1 kg
Recensioni esterne » Acer Swift 5 SF514-53T-75UE
Acer Swift 5 SF514-53T-573Y: Intel Core i5-8265U, 14.00", 1 kg
Recensioni esterne » Acer Swift 5 SF514-53T-573Y
Acer Spin 3 SP314-52-31FP: Intel Core i3-8145U, 14.00", 1.7 kg
Recensioni esterne » Acer Spin 3 SP314-52-31FP
Acer Swift 5 SF515-51T-58UX: Intel Core i5-8265U, 15.60", 1 kg
Recensioni esterne » Acer Swift 5 SF515-51T-58UX
Asus Zenbook Flip 15 UX562FD 90NB0JS1-M01230: Intel Core i5-8265U, 15.60", 1.9 kg
Recensioni esterne » Asus Zenbook Flip 15 UX562FD 90NB0JS1-M01230
HP 17-by1001ng: Intel Core i5-8250U, 17.30", 2.5 kg
Recensioni esterne » HP 17-by1001ng
Lenovo Ideapad 720S-13IKBR-81BV0098SP: Intel Core i5-8250U, 13.30", 1.5 kg
Recensioni esterne » Lenovo Ideapad 720S-13IKBR-81BV0098SP
HP Envy 13-ah0005ns: Intel Core i7-8550U, 13.30", 1.3 kg
Recensioni esterne » HP Envy 13-ah0005ns
HP EliteBook x360 1030 G3 4LT83AW: Intel Core i5-8350U, 13.30", 1.3 kg
Recensioni esterne » HP EliteBook x360 1030 G3 4LT83AW
HP Chromebook x360 14-da0300nd: Intel Core i3-8130U, 14.00", 1.7 kg
Recensioni esterne » HP Chromebook x360 14-da0300nd
Acer Aspire 5 A515-52-5981: Intel Core i5-8265U, 15.60", 1.9 kg
Recensioni esterne » Acer Aspire 5 A515-52-5981
HP Elitebook x360 1040 G5: Intel Core i7-8650U, 14.00", 1.4 kg
Recensioni esterne » HP Elitebook x360 1040 G5
HP Spectre x360 13-ap0003ns: Intel Core i7-8565U, 13.30", 1.3 kg
Recensioni esterne » HP Spectre x360 13-ap0003ns
Asus VivoBook S14 S430FN-EB136T: Intel Core i5-8265U, 14.00", 1.4 kg
Recensioni esterne » Asus VivoBook S14 S430FN-EB136T
HP 15-da0039ns: Intel Core i5-8250U, 15.60", 2.1 kg
Recensioni esterne » HP 15-da0039ns
Lenovo Yoga 530-14IKB-81EK00SNMX: Intel Core i5-8250U, 14.00", 1.7 kg
Recensioni esterne » Lenovo Yoga 530-14IKB-81EK00SNMX
Acer Swift 5 SF515-51T-552D: Intel Core i5-8265U, 15.60", 1 kg
Recensioni esterne » Acer Swift 5 SF515-51T-552D
Acer TravelMate X3 TMX3410-M-50QD: Intel Core i5-8250U, 14.00", 1.6 kg
Recensioni esterne » Acer TravelMate X3 TMX3410-M-50QD
Acer Chromebook Spin 13 CP713-1WN-5979: Intel Core i5-8250U, 13.50", 1.6 kg
Recensioni esterne » Acer Chromebook Spin 13 CP713-1WN-5979
Acer Chromebook Spin 13 CP713-1WN-39C5: Intel Core i3-8130U, 13.50", 1.5 kg
Recensioni esterne » Acer Chromebook Spin 13 CP713-1WN-39C5
Huawei Matebook 13-53010FYW: Intel Core i7-8565U, 13.00", 1.3 kg
Recensioni esterne » Huawei Matebook 13-53010FYW
Huawei MateBook 13-53010HBV: Intel Core i5-8265U, 13.00", 1.3 kg
Recensioni esterne » Huawei MateBook 13-53010HBV
Lenovo IdeaPad Flex 5 15-1570-81CA001QUS: Intel Core i7-8550U, 15.60", 2 kg
Recensioni esterne » Lenovo Flex 5 15-1570-81CA001QUS
Lenovo Ideapad 330S-15IKB-81F5010MIN: Intel Core i3-8130U, 15.60", 1.9 kg
Recensioni esterne » Lenovo Ideapad 330S-15IKB-81F5010MIN
Lenovo Yoga Chromebook C630-81JX0008UX: Intel Core i5-8250U, 15.60", 2 kg
Recensioni esterne » Lenovo Yoga Chromebook C630-81JX0008UX
Lenovo IdeaPad 730S-13IWL 81JB0004US: Intel Core i5-8265U, 13.30", 1.1 kg
Recensioni esterne » Lenovo IdeaPad 730S-13IWL 81JB0004US
HP 15q-ds1000TU: Intel Core i5-8250U, 15.60", 2 kg
Recensioni esterne » HP 15q-ds1000TU
Dell Inspiron 7486 Chromebook 14 2-in-1: Intel Core i3-8130U, 14.00", 1.8 kg
Recensioni esterne » Dell Inspiron 7486 Chromebook 14 2-in-1
Fujitsu Lifebook E558-E5580MP580DE: Intel Core i5-8250U, 15.60", 2 kg
Recensioni esterne » Fujitsu Lifebook E558-E5580MP580DE
HP Spectre x360 13-ap0900nz: Intel Core i7-8565U, 13.30", 1.3 kg
Recensioni esterne » HP Spectre x360 13-ap0900nz
HP Spectre x360 13-ap0104ng: Intel Core i5-8265U, 13.30", 1.3 kg
Recensioni esterne » HP Spectre x360 13-ap0104ng
Acer Swift 3 SF314-55-31N8: Intel Core i3-8145U, 14.00", 1.5 kg
Recensioni esterne » Acer Swift 3 SF314-55-31N8
Lenovo IdeaPad 330S-15IKB-81F500N5GE: Intel Core i5-8250U, 15.60", 1.9 kg
Recensioni esterne » Lenovo IdeaPad 330S-15IKB-81F500N5GE
Acer TravelMate X3 TMX3410-M-50NL: Intel Core i5-8250U, 14.00", 1.6 kg
Recensioni esterne » Acer TravelMate X3 TMX3410-M-50NL
HP EliteBook x360 1030 G3-4QY22EA: Intel Core i7-8550U, 13.30", 1.3 kg
Recensioni esterne » HP EliteBook x360 1030 G3-4QY22EA
Lenovo Yoga C730-15: Intel Core i5-8265U, 15.60", 1.9 kg
Recensioni esterne » Lenovo Yoga C730-15
Lenovo ThinkPad X1 Carbon G7: Intel Core i7-8565U, 14.00", 1.1 kg
Recensioni esterne » Lenovo ThinkPad X1 Carbon G7
Lenovo ThinkPad X1 Yoga 2019: Intel Core i5-8265U, 14.00", 1.4 kg
Recensioni esterne » Lenovo ThinkPad X1 Yoga 2019
Lenovo Yoga S940-14IWL: Intel Core i7-8565U, 13.90", 1.2 kg
Recensioni esterne » Lenovo Yoga S940-14IWL
Acer Swift 5 SF515-51T-7828: Intel Core i7-8565U, 15.60", 1 kg
Recensioni esterne » Acer Swift 5 SF515-51T-7828
Samsung Notebook 9 Pro 13 inch 2019: Intel Core i7-8565U, 13.30", 1.3 kg
Recensioni esterne » Samsung Notebook 9 Pro 13 inch 2019
Acer Aspire A515-53-330E: Intel Core i3-8145U, 15.60", 2 kg
Recensioni esterne » Acer Aspire A515-53-330E
Acer Aspire A515-53-50ZD: Intel Core i5-8265U, 15.60", 2 kg
Recensioni esterne » Acer Aspire A515-53-50ZD
HP Pavilion 14-ce0004nm: Intel Core i3-8130U, 14.00", 1.7 kg
Recensioni esterne » HP Pavilion 14-ce0004nm
Asus Zenbook 14 UX433FA-A6018T: Intel Core i5-8265U, 14.00", 1.2 kg
Recensioni esterne » Asus Zenbook 14 UX433FA-A6018T
Asus Vivobook X407UA-BV489T: Intel Core i5-8250U, 14.00", 1.5 kg
Recensioni esterne » Asus Vivobook X407UA-BV489T
LG Gram 14 14T990-U.AAS8U1, 2-in-1: Intel Core i7-8565U, 14.00", 1.2 kg
Recensioni esterne » LG Gram 14 14T990-U.AAS8U1, 2-in-1
Dell XPS 13 9370-1CNW5: Intel Core i7-8550U, 13.30", 1.3 kg
Recensioni esterne » Dell XPS 13 9370-1CNW5
Dell Inspiron 15 3576-3504BLK: Intel Core i3-8130U, 15.60", 2.3 kg
Recensioni esterne » Dell Inspiron 15 3576-3504BLK
Acer Chromebook 13 CB713-1W-56VY: Intel Core i5-8250U, 13.50", 1.6 kg
Recensioni esterne » Acer Chromebook 13 CB713-1W-56VY
Lenovo Yoga 730-15IWL-81JS000EGE: Intel Core i5-8265U, 15.60", 1.9 kg
Recensioni esterne » Lenovo Yoga 730-15IWL-81JS000EGE
Asus ZenBook S UX391UA-EG007R: Intel Core i7-8550U, 13.30", 1 kg
Recensioni esterne » Asus ZenBook S UX391UA-EG007R
Lenovo ThinkPad X1 Carbon G6-20KH003BMD: Intel Core i7-8550U, 14.00", 1.1 kg
Recensioni esterne » Lenovo ThinkPad X1 Carbon G6-20KH003BMD
Lenovo ThinkPad X1 Yoga-20LD002MMD: Intel Core i7-8550U, 14.00", 1.4 kg
Recensioni esterne » Lenovo ThinkPad X1 Yoga-20LD002MMD
Asus ZenBook 14 UX433FA-A60225T: Intel Core i5-8265U, 14.00", 1.2 kg
Recensioni esterne » Asus ZenBook 14 UX433FA-A60225T
Lenovo Yoga 730-13IKB-81CT0075SP: Intel Core i7-8550U, 13.30", 1.2 kg
Recensioni esterne » Lenovo Yoga 730-13IKB-81CT0075SP
HP Pavilion 13-an0001ns: Intel Core i7-8565U, 13.30", 1.3 kg
Recensioni esterne » HP Pavilion 13-an0001ns
Acer Swift 5 SF515-51T-52YA: Intel Core i5-8265U, 15.60", 1 kg
Recensioni esterne » Acer Swift 5 SF515-51T-52YA
Asus VivoBook S14 S430UA-EB065T: Intel Core i5-8250U, 14.00", 1.4 kg
Recensioni esterne » Asus VivoBook S14 S430UA-EB065T
Lenovo Ideapad 530s-14IKBR-81EU00C5SP: Intel Core i7-8550U, 14.00", 1.6 kg
Recensioni esterne » Lenovo Ideapad 530s-14IKBR-81EU00C5SP
Lenovo Yoga C930-13IKB-81C4004AMX: Intel Core i5-8250U, 13.90", 1.4 kg
Recensioni esterne » Lenovo Yoga C930-13IKB-81C4004AMX
Dell XPS 13 9380 i7 4K: Intel Core i7-8565U, 13.30", 1.2 kg
Recensioni esterne » Dell XPS 13 9380 i7 4K
Acer Chromebook 13 CB713-1W-50YY: Intel Core i5-8250U, 13.50", 1.6 kg
Recensioni esterne » Acer Chromebook 13 CB713-1W-50YY
Lenovo Yoga C930-13IKB-81C4008TPB : Intel Core i7-8550U, 13.90", 1.4 kg
Recensioni esterne » Lenovo Yoga C930-13IKB-81C4008TPB
Dell Inspiron 13 5370 CN537008: Intel Core i5-8250U, 13.30", 1.4 kg
Recensioni esterne » Dell Inspiron 13 5370 CN537008
HP Envy 13-ah0007ns: Intel Core i7-8550U, 13.30", 1.3 kg
Recensioni esterne » HP Envy 13-ah0007ns
Lenovo Ideapad 330S-15IKBR-81F500V5SP: Intel Core i5-8250U, 15.60", 1.9 kg
Recensioni esterne » Lenovo Ideapad 330S-15IKBR-81F500V5SP
Acer Swift 3 SF313-51-59SZ: Intel Core i5-8250U, 13.30", 1.3 kg
Recensioni esterne » Acer Swift 3 SF313-51-59SZ
Asus ZenBook S UX391UA-ET013R: Intel Core i7-8550U, 13.30", 1 kg
Recensioni esterne » Asus ZenBook S UX391UA-ET013R
Dell XPS 13 9380 2019 FHD: Intel Core i7-8565U, 13.30", 1.2 kg
Recensioni esterne » Dell XPS 13 9380
Lenovo Ideapad 720-13IKBR-81C3008YSP: Intel Core i5-8250U, 13.30", 1.3 kg
Recensioni esterne » Lenovo Ideapad 720-13IKBR-81C3008YSP
HP 15-da1013ns: Intel Core i5-8265U, 15.60", 1.8 kg
Recensioni esterne » HP 15-da1013ns
Lenovo Yoga S730-13-81J0000AMX: Intel Core i7-8565U, 13.30", 1.1 kg
Recensioni esterne » Lenovo Yoga S730-13-81J0000AMX
Toshiba Portege X30-E-11F: Intel Core i7-8550U, 13.30", 1.1 kg
Recensioni esterne » Toshiba Portege X30-E-11F
Dell Inspiron 14 5000 5482 2-in-1: Intel Core i7-8565U, 14.00", 1.8 kg
Recensioni esterne » Dell Inspiron 14 5000 5482 2-in-1
Asus VivoBook S14 S406UA-BV121T: Intel Core i5-8250U, 14.00", 1.2 kg
Recensioni esterne » Asus VivoBook S14 S406UA-BV121T
Asus ZenBook 13 UX333FA: Intel Core i5-8265U, 13.30", 1.2 kg
Recensioni esterne » Asus ZenBook 13 UX333FA
Acer Spin 5 SP513-52N-85LZ: Intel Core i7-8550U, 13.30", 1.5 kg
Recensioni esterne » Acer Spin 5 SP513-52N-85LZ
HP Spectre x360 13-ap0001ns: Intel Core i7-8565U, 13.30", 1.4 kg
Recensioni esterne » HP Spectre x360 13-ap0001ns
Asus ZenBook UX430UA-GV408T: Intel Core i5-8250U, 14.00", 1.3 kg
Recensioni esterne » Asus ZenBook UX430UA-GV408T
Lenovo Ideapad 330-15IKBR-81DE0208SP: Intel Core i5-8250U, 15.60", 2.2 kg
Recensioni esterne » Lenovo Ideapad 330-15IKBR-81DE0208SP
Asus ZenBook 13 UX331UA-EG120T: Intel Core i5-8250U, 13.30", 1.1 kg
Recensioni esterne » Asus ZenBook 13 UX331UA-EG120T
Huawei MateBook D 14 W50F-53010CQB: Intel Core i5-8250U, 14.00", 1.5 kg
Recensioni esterne » Huawei MateBook D W50F 53010CQB
Acer Swift 5 SF515-51T-76B6: Intel Core i7-8565U, 15.60", 1 kg
Recensioni esterne » Acer Swift 5 SF515-51T-70UX
Acer Spin 5 SP513-52NP-870E: Intel Core i7-8550U, 13.30", 1.5 kg
Recensioni esterne » Acer Spin 5 SP513-52NP-870E
Asus ZenBook 14 UX433FA: Intel Core i7-8565U, 14.00", 1.2 kg
Recensioni esterne » Asus ZenBook 14 UX433FA
Acer Chromebook 13 CB713-1W-57G8: Intel Core i5-8250U, 13.50", 1.6 kg
Recensioni esterne » Acer Chromebook 13 CB713-1W-57G8
Acer Swift 5 SF515-51T-73Q7: Intel Core i7-8565U, 15.60", 1 kg
Recensioni esterne » Acer Swift 5 SF515-51T-73Q7
Asus Zenbook 14 UX433FA-A6102T: Intel Core i7-8565U, 14.00", 1.2 kg
Recensioni esterne » Asus Zenbook 14 UX433FA-A6102T
Acer Swift 5 SF514-52TP-812J: Intel Core i7-8550U, 14.00", 1 kg
Recensioni esterne » Acer Swift 5 SF514-52TP-812J
Lenovo Yoga 530-14IKBR-81EK00FYSP: Intel Core i5-8250U, 14.00", 1.6 kg
Recensioni esterne » Lenovo Yoga 530-14IKBR-81EK00FYSP
HP Pavilion 13-an0000ns: Intel Core i5-8265U, 13.30", 1.3 kg
Recensioni esterne » HP Pavilion 13-an0000ns
Lenovo Ideapad 330-15IKBR-81DE019CSP: Intel Core i3-8130U, 15.60", 2.2 kg
Recensioni esterne » Lenovo Ideapad 330-15IKBR-81DE019CSP
Lenovo Yoga 720-13IKBR-81C30090SP: Intel Core i5-8250U, 13.30", 1.3 kg
Recensioni esterne » Lenovo Yoga 720-13IKBR-81C30090SP
Asus ZenBook UX430UA-GV362T: Intel Core i7-8550U, 14.00", 1.3 kg
Recensioni esterne » Asus ZenBook UX430UA-GV362T
HP Pavilion x360 14-ba138ns: Intel Core i5-8250U, 14.00", 1.7 kg
Recensioni esterne » HP Pavilion x360 14-ba138ns
HP Pavilion x360 15-cr0930nd: Intel Core i3-8130U, 15.60", 2.1 kg
Recensioni esterne » HP Pavilion x360 15-cr0930nd
LG Gram 17Z990-R.AAS8U1: Intel Core i7-8565U, 17.00", 1.3 kg
Recensioni esterne » LG Gram 17Z990-R.AAS8U1
Dell Latitude 5290-F9YR0 2-in-1: Intel Core i5-8250U, 12.30", 1.3 kg
Recensioni esterne » Dell Latitude 5290-F9YR0 2-in-1
HP EliteBook x360 1030 G3 45X96UT: Intel Core i7-8650U, 13.30", 1.3 kg
Recensioni esterne » HP EliteBook x360 1030 G3 45X96UT
Acer Spin 5 SP513-52NP-583A: Intel Core i5-8250U, 13.30", 1.5 kg
Recensioni esterne » Acer Spin 5 SP513-52NP-583A
LG Gram 14Z980-G.AA52B: Intel Core i5-8250U, 14.00", 1 kg
Recensioni esterne » LG Gram 14Z980-G.AA52B
HP Pavilion x360 14-cd0010ns: Intel Core i5-8250U, 14.00", 1.6 kg
Recensioni esterne » HP Pavilion x360 14-cd0010ns
Asus Vivobook 15 X540UB-GQ352T: Intel Core i5-8250U, 14.00", 1.9 kg
Recensioni esterne » Asus Vivobook 15 X540UB-GQ352T
Lenovo Yoga 920-13IKBR-80Y7005YSP: Intel Core i7-8550U, 13.90", 1.4 kg
Recensioni esterne » Lenovo Yoga 920-13IKBR-80Y7005YSP
Asus K540UA-GQ676T: Intel Core i7-8550U, 15.60", 2 kg
Recensioni esterne » Asus K540UA-GQ676T
Lenovo Yoga 730-13IKB-81CT0080GE: Intel Core i7-8550U, 13.30", 1.1 kg
Recensioni esterne » Lenovo Yoga 730-13IKB-81CT0080GE
Lenovo Yoga C930-13IKB: Intel Core i5-8250U, 13.90", 1.4 kg
Recensioni esterne » Lenovo Yoga C930-13IKB
Dell Inspiron 14 5482-XDD07: Intel Core i3-8145U, 14.00", 1.9 kg
Recensioni esterne » Dell Inspiron 14 5482-XDD07
HP Elite x2 1013 G3-2TT14EA: Intel Core i5-8350U, 13.00", 1.2 kg
Recensioni esterne » HP Elite x2 1013 G3-2TT14EA
Lenovo Yoga C930-13IKB-81C4002WMH: Intel Core i7-8550U, 13.90", 1.4 kg
Recensioni esterne » Lenovo Yoga C930-13IKB-81C4002WMH
Lenovo ThinkPad T480s-20L7002AUS: Intel Core i5-8250U, 14.00", 1.4 kg
Recensioni esterne » Lenovo ThinkPad T480s-20L7002AUS
Acer Chromebook Spin 13 CP713-1WN-54GA: Intel Core i5-8250U, 13.50", 1.5 kg
Recensioni esterne » Acer Chromebook Spin 13 CP713-1WN-54GA
Lenovo Yoga C930-13IKB-81C4003UGE: Intel Core i7-8550U, 13.90", 1.4 kg
Recensioni esterne » Lenovo Yoga C930-13IKB-81C4003UGE
HP Spectre x360 13-ae015nd: Intel Core i7-8550U, 13.30", 1.3 kg
Recensioni esterne » HP Spectre x360 13-ae015nd
Asus Vivobook S15 S530UA-BQ290T: Intel Core i5-8250U, 15.60", 1.8 kg
Recensioni esterne » Asus Vivobook S15 S530UA-BQ290T
Acer Chromebook Spin 13 CP713-1WN-55HT: Intel Core i5-8250U, 13.50", 1.5 kg
Recensioni esterne » Acer Chromebook Spin 13 CP713-1WN-55HT
Acer Swift 3 SF314-54-524Y: Intel Core i5-8250U, 14.00", 1.5 kg
Recensioni esterne » Acer Swift 3 SF314-54-524Y
Asus ZenBook 13 UX331UA-AS51: Intel Core i5-8250U, 13.30", 1.1 kg
Recensioni esterne » Asus ZenBook 13 UX331UA-AS51
Lenovo Yoga C930-13IKB-81EQ000HGE: Intel Core i7-8550U, 13.90", 1.4 kg
Recensioni esterne » Lenovo Yoga C930-13IKB-81EQ000HGE
Microsoft Surface Pro 6, Core i7, 512 GB: Intel Core i7-8650U, 12.30", 1.1 kg
Recensioni esterne » Microsoft Surface Pro 6, Core i7, 512 GB
Lenovo Yoga C930-13IKB 81C4: Intel Core i7-8550U, 13.90", 1.4 kg
Recensioni esterne » Lenovo Yoga C930-13IKB 81C4
Lenovo Ideapad 720S-13IKB-81BV005AGE: Intel Core i7-8550U, 13.30", 1.1 kg
Recensioni esterne » Lenovo Ideapad 720S-13IKB-81BV005AGE
Microsoft Surface Pro 6 i5 256GB: Intel Core i5-8250U, 12.30", 1.1 kg
Recensioni esterne » Microsoft Surface Pro 6 i5 256GB
Lenovo ThinkPad X1 Carbon 2018-20KGS03800: Intel Core i7-8550U, 14.00"
Recensioni esterne » Lenovo ThinkPad X1 Carbon 2018-20KGS03800
Dell Inspiron 13 7380 CN73803: Intel Core i5-8265U, 13.30", 1.4 kg
Recensioni esterne » Dell Inspiron 13 7380 CN73803
Lenovo Yoga 530-14IKBR-81EK00FXSP: Intel Core i7-8550U, 14.00", 1.7 kg
Recensioni esterne » Lenovo Yoga 530-14IKBR-81EK00FXSP
Lenovo Ideapad 530S-14IKB-81EU00C6SP: Intel Core i5-8250U, 14.00", 1.5 kg
Recensioni esterne » Lenovo Ideapad 530S-14IKB-81EU00C6SP
HP Pavilion x360 14-CD0007NS: Intel Core i5-8250U, 14.00", 1.6 kg
Recensioni esterne » HP Pavilion x360 14-CD0007NS
HP 15-da0044ns: Intel Core i5-8250U, 15.60", 2 kg
Recensioni esterne » HP 15-da0044ns
HP Pavilion 13-an0370nd: Intel Core i5-8265U, 13.30", 1.3 kg
Recensioni esterne » HP Pavilion 13-an0370nd
Asus Vivobook Flip 14 TP412UA-EC057T: Intel Core i3-8130U, 14.00", 1.5 kg
Recensioni esterne » Asus Vivobook Flip 14 TP412UA-EC057T
Microsoft Surface Laptop 2, i7 (JKQ-00069): Intel Core i7-8650U, 13.50", 1.3 kg
Recensioni esterne » Microsoft Surface Laptop 2, i7 (JKQ-00069)
HP Chromebook x360 14-da0021nr: Intel Core i3-8130U, 14.00", 1.7 kg
Recensioni esterne » HP Chromebook x360 14-da0021nr
HP Pavilion 14-ce0820nd: Intel Core i5-8250U, 14.00", 1.6 kg
Recensioni esterne » HP Pavilion 14-ce0820nd
Lenovo Ideapad 330S-14IKB-81F400PGGE: Intel Core i5-8250U, 14.00", 1.7 kg
Recensioni esterne » Lenovo Ideapad 330S-14IKB-81F400PGGE
Medion Akoya S6425-MD61072: Intel Core i5-8250U, 15.60", 2 kg
Recensioni esterne » Medion Akoya S6425-MD61072
Acer Swift 3 SF314-54-38W3: Intel Core i3-8130U, 14.00", 1.6 kg
Recensioni esterne » Acer Swift 3 SF314-54-38W3
Asus ZenBook S UX391UA-ET012T: Intel Core i7-8550U, 13.30", 1 kg
Recensioni esterne » Asus ZenBook S UX391UA-ET012T
Lenovo Yoga 730-13IKB-81CT: Intel Core i5-8250U, 13.30", 1.2 kg
Recensioni esterne » Lenovo Yoga 730-13IKB-81CT
Asus Zenbook UX331UA-EG029T: Intel Core i7-8550U, 13.30", 1.1 kg
Recensioni esterne » Asus Zenbook UX331UA-EG029T
MSI PS42 8M-064: Intel Core i5-8250U, 14.00", 1.2 kg
Recensioni esterne » MSI PS42 8M-064
Lenovo Yoga 530-14IKB-81EK00CWGE: Intel Core i5-8250U, 14.00", 1.6 kg
Recensioni esterne » Lenovo Yoga 530-14IKB-81EK00CWGE
Lenovo Ideapad 330S-15IKB-81F500MGGE: Intel Core i3-8130U, 15.60", 1.9 kg
Recensioni esterne » Lenovo Ideapad 330S-15IKB-81F500MGGE
Microsoft Surface Laptop 2: Intel Core i5-8250U, 13.50", 1.4 kg
Recensioni esterne » Microsoft Surface Laptop 2
Lenovo Ideapad 520S-14IKBR-81BL007SSP: Intel Core i5-8250U, 14.00", 1.7 kg
Recensioni esterne » Lenovo Ideapad 520S-14IKBR-81BL007SSP
Lenovo Ideapad 330-15IKBR-81DE013QSP: Intel Core i5-8250U, 15.60", 2.2 kg
Recensioni esterne » Lenovo Ideapad 330-15IKBR-81DE013QSP
Lenovo Yoga 520-14IKBR-81C8008DSP: Intel Core i5-8250U, 14.00", 1.8 kg
Recensioni esterne » Lenovo Yoga 520-14IKBR-81C8008DSP
Lenovo Ideapad 520S-14IKBR-81BL007VSP: Intel Core i7-8550U, 14.00", 1.7 kg
Recensioni esterne » Lenovo Ideapad 520S-14IKBR-81BL007VSP
Lenovo Yoga 720-13IKBR-81C3008VSP: Intel Core i5-8250U, 13.30", 1.3 kg
Recensioni esterne » Lenovo Yoga 720-13IKBR-81C3008VSP
Medion Akoya S6425-MD61073: Intel Core i5-8250U, 15.60", 1.9 kg
Recensioni esterne » Medion Akoya S6425-MD61073
HP ProBook 450 G5-2UB53EA: Intel Core i5-8250U, 15.60", 2.1 kg
Recensioni esterne » HP ProBook 450 G5-2UB53EA
HP Envy 13-AH0002NS: Intel Core i5-8250U, 13.30", 1.3 kg
Recensioni esterne » HP Envy 13-AH0002NS
Asus Vivobook S14 S406UA-BV041T: Intel Core i5-8250U, 14.00", 1.2 kg
Recensioni esterne » Asus Vivobook S14 S406UA-BV041T
Lenovo V330-15IKB-81AX00FGGE: Intel Core i5-8250U, 15.60", 2 kg
Recensioni esterne » Lenovo V330-15IKB-81AX00FGGE
Asus VivoBook S15 S530UA-DB51-YL: Intel Core i5-8250U, 15.60", 1.8 kg
Recensioni esterne » Asus VivoBook S15 S530UA-DB51-YL
Microsoft Surface Pro 6, Core i5, 128 GB: Intel Core i5-8250U, 12.30", 0.8 kg
Recensioni esterne » Microsoft Surface Pro 6, Core i5, 128 GB
Lenovo ThinkPad X1 Carbon G6-20KG003BGE: Intel Core i7-8550U, 14.00", 1.1 kg
Recensioni esterne » Lenovo ThinkPad X1 Carbon G6-20KG003BGE
Dell Inspiron 14 5482, 2-in-1: Intel Core i5-8265U, 14.00", 1.8 kg
Recensioni esterne » Dell Inspiron 14 5482, 2-in-1
Lenovo Yoga Chromebook C630-81JX0002UK: Intel Core i5-8250U, 15.60", 1.9 kg
Recensioni esterne » Lenovo Yoga Chromebook C630-81JX0002UK
Dell Inspiron 13 7386 2-in-1: Intel Core i5-8265U, 13.30", 1.4 kg
Recensioni esterne » Dell Inspiron 13 7386 2-in-1
Dell Inspiron 14 Chromebook 2-in-1: Intel Core i3-8130U, 14.00", 1.7 kg
Recensioni esterne » Dell Inspiron 14 Chromebook 2-in-1
Lenovo ThinkPad T480s-20L7001YUS: Intel Core i7-8650U, 14.00", 1.4 kg
Recensioni esterne » Lenovo ThinkPad T480s-20L7001YUS
Asus Zenbook S UX391UA-EG047T: Intel Core i7-8550U, 13.30", 1.1 kg
Recensioni esterne » Asus Zenbook S UX391UA-EG047T
Asus VivoBook S13 X330UN: Intel Core i3-8130U, 13.30", 1.2 kg
Recensioni esterne » Asus VivoBook S13 X330UN
HP Spectre x360 13-ae046ng: Intel Core i7-8550U, 13.30", 1.3 kg
Recensioni esterne » HP Spectre x360 13-ae046ng
Lenovo ThinkPad X1 Carbon G6-20KH0079GE: Intel Core i5-8250U, 14.00", 1.1 kg
Recensioni esterne » Lenovo ThinkPad X1 Carbon G6-20KH0079GE
HP Envy 13-ah0004ng: Intel Core i5-8250U, 13.30", 1.3 kg
Recensioni esterne » HP Envy 13-ah0004ng
Acer Swift 5 SF514-52TP-546Q: Intel Core i5-8250U, 14.00", 1 kg
Recensioni esterne » Acer Swift 5 SF514-52TP-546Q
Dell Vostro 14 5471-PJ1PN: Intel Core i5-8250U, 14.00", 1.7 kg
Recensioni esterne » Dell Vostro 14 5471-PJ1PN
Lenovo ThinkPad P52s-20LB000PMH: Intel Core i7-8550U, 15.60", 2 kg
Recensioni esterne » Lenovo ThinkPad P52s-20LB000PMH
Medion Akoya S6425: Intel Core i3-8130U, 15.60", 2 kg
Recensioni esterne » Medion Akoya S6425
Acer Spin 5 SP513-52N-55NV: Intel Core i5-8250U, 13.30", 1.5 kg
Recensioni esterne » Acer Spin 5 SP513-52N-55NV
Lenovo ThinkPad E480-20KN001QGE: Intel Core i5-8250U, 14.00", 1.8 kg
Recensioni esterne » Lenovo ThinkPad E480-20KN001QGE
HP Pavilion x360 14-cd0087tu: Intel Core i5-8250U, 14.00", 1.6 kg
Recensioni esterne » HP Pavilion x360 14-cd0087tu
LG Gram 14Z980-G.AA52A1: Intel Core i5-8250U, 14.00", 1 kg
Recensioni esterne » LG Gram 14Z980-G.AA52A1
HP Pavilion x360 14-cd0008ns: Intel Core i5-8250U, 14.00", 1.6 kg
Recensioni esterne » HP Pavilion x360 14-cd0008ns
HP 15-da0045ns: Intel Core i5-8250U, 15.60", 1.8 kg
Recensioni esterne » HP 15-da0045ns
HP Pavilion 15-cs0053cl: Intel Core i5-8250U, 15.60", 1.8 kg
Recensioni esterne » HP Pavilion 15-cs0053cl
Asus VivoBook 15 X542UA-GO946T: Intel Core i5-8250U, 15.60", 2.3 kg
Recensioni esterne » Asus VivoBook 15 X542UA-GO946T
Asus Zenbook S UX391UA-EG007T: Intel Core i7-8550U, 13.30", 1 kg
Recensioni esterne » Asus Zenbook S UX391UA-EG007T
Fujitsu Lifebook S938: Intel Core i5-8250U, 13.30", 1.3 kg
Recensioni esterne » Fujitsu Lifebook S938
Lenovo Yoga 530-14IKB-81EK00G9MH: Intel Core i7-8550U, 14.00", 1.7 kg
Recensioni esterne » Lenovo Yoga 530-14IKB-81EK00G9MH
HP Pavilion x360 14-cd0650nd: Intel Core i5-8250U, 14.00", 1.6 kg
Recensioni esterne » HP Pavilion x360 14-cd0650nd
Lenovo IdeaPad 720-15IKBR 81C7001VPB: Intel Core i5-8250U, 15.60", 2.1 kg
Recensioni esterne » Lenovo IdeaPad 720-15IKBR 81C7001VPB
Asus VivoBook Flip TP412UA-EC053T: Intel Core i5-8250U, 14.00", 1.6 kg
Recensioni esterne » Asus VivoBook Flip TP412UA-EC053T
Acer Swift 3 SF314-54-54LB: Intel Core i5-8250U, 14.00", 1.8 kg
Recensioni esterne » Acer Swift 3 SF314-54-54LB
Acer Aspire 5 A515-51-58HD: Intel Core i5-8250U, 15.60", 2.2 kg
Recensioni esterne » Acer Aspire 5 A515-51-58HD
Acer Aspire E5-576-392H: Intel Core i3-8130U, 15.60", 2.4 kg
Recensioni esterne » Acer Aspire E5-576-392H
Acer Aspire S 24 S24-880: Intel Core i5-8250U, 23.80", 1.3 kg
Recensioni esterne » Acer Aspire S 24 S24-880
HP Envy 13-ah0700ng: Intel Core i5-8250U, 13.30", 1.2 kg
Recensioni esterne » HP Envy 13-ah0700ng
Asus ZenBook Flip 13 UX362FA: Intel Core i7-8565U, 13.30", 1.3 kg
Recensioni esterne » Asus ZenBook Flip 13 UX362FA
HP 15-da0049ns: Intel Core i5-8250U, 15.60", 1.8 kg
Recensioni esterne » HP 15-da0049ns
LG Gram 13Z980-G: Intel Core i5-8250U, 13.30", 1 kg
Recensioni esterne » LG Gram 13Z980-G
Toshiba Tecra X40-E-10U: Intel Core i7-8550U, 14.00", 1.3 kg
Recensioni esterne » Toshiba Tecra X40-E-10U
Lenovo Thinkpad X1 Carbon G6 2018-20KH006DSP: Intel Core i5-8250U, 14.00", 1.1 kg
Recensioni esterne » Lenovo Thinkpad X1 Carbon G6 2018-20KH006DSP
Acer Aspire 5 A517-51-5577: Intel Core i5-8250U, 17.30", 2.9 kg
Recensioni esterne » Acer Aspire 5 A517-51-5577
Lenovo Yoga 720-13IKB-80X6005BSP: Intel Core i5-7200U, 13.30", 1.3 kg
Recensioni esterne » Lenovo Yoga 720-13IKB-80X6005BSP
Lenovo Ideapad 520S-14IKBR-81BL007PSP: Intel Core i7-8550U, 14.00", 1.7 kg
Recensioni esterne » Lenovo Ideapad 520S-14IKBR-81BL007PSP
HP Envy 13-ah0100nd: Intel Core i5-8250U, 13.30", 1.3 kg
Recensioni esterne » HP Envy 13-ah0100nd
Lenovo Yoga 520-14IKB-80X800WMMH: Intel Core i3-7130U, 14.00", 1.7 kg
Recensioni esterne » Lenovo Yoga 520-14IKB-80X800WMMH
Lenovo Yoga 530-14IKB-81EK00E1MH: Intel Core i5-8250U, 15.60", 1.7 kg
Recensioni esterne » Lenovo Yoga 530-14IKB-81EK00E1MH
Asus Zenbook UX430UA-GV265T: Intel Core i5-8250U, 14.00", 1.3 kg
Recensioni esterne » Asus Zenbook UX430UA-GV265T
Asus K406UA-BM230T: Intel Core i7-8550U, 14.00", 1.2 kg
Recensioni esterne » Asus K406UA-BM230T
Lenovo Yoga 730-13IKB: Intel Core i7-8550U, 13.30", 1.2 kg
Recensioni esterne » Lenovo Yoga 730-13IKB
Acer Aspire 3 A315-39: Intel Core i3-8130U, 15.60", 2.1 kg
Recensioni esterne » Acer Aspire 3 A315-39
Lenovo ThinkPad T580-20L9001YGE: Intel Core i5-8250U, 15.60", 2.1 kg
Recensioni esterne » Lenovo ThinkPad T580-20L9001YGE
HP Envy 13-ah0001ng: Intel Core i7-8550U, 13.30", 1.3 kg
Recensioni esterne » HP Envy 13-ah0001ng
HP EliteBook x360 1030 G3: Intel Core i5-8250U, 13.30", 1.3 kg
Recensioni esterne » HP EliteBook x360 1030 G3
HP EliteBook x2 1013 G3-4YJ16UT: Intel Core i7-8650U, 13.30", 1.2 kg
Recensioni esterne » HP EliteBook x2 1013 G3-4YJ16UT
Lenovo ThinkPad X1 Yoga 2018-20LE002CMH: Intel Core i5-8350U, 14.00", 1.4 kg
Recensioni esterne » Lenovo ThinkPad X1 Yoga 2018-20LE002CMH
Lenovo ThinkPad T480s-20L7001NGE: Intel Core i7-8550U, 14.00", 1.4 kg
Recensioni esterne » Lenovo ThinkPad T480s-20L7001NGE
HP EliteBook 840 G5-3JX09EA: Intel Core i7-8550U, 14.00", 1.5 kg
Recensioni esterne » HP EliteBook 840 G5-3JX09EA
Lenovo ThinkPad T580-20L9001AUS: Intel Core i7-8650U, 15.60", 2 kg
Recensioni esterne » Lenovo ThinkPad T580-20L9001AUS
Asus VivoBook F510UA-AH51: Intel Core i5-8250U, 15.60", 1.7 kg
Recensioni esterne » Asus VivoBook F510UA-AH51
Toshiba Tecra X40-E-BTO: Intel Core i7-8650U, 14.10", 1.3 kg
Recensioni esterne » Toshiba Tecra X40-E-BTO
Sony Vaio S11-VJS1121: Intel Core i7-8550U, 13.30", 0.9 kg
Recensioni esterne » Sony Vaio S11-VJS1121
Sony Vaio S13-VJS132X0511S: Intel Core i7-8550U, 13.30", 1.1 kg
Recensioni esterne » Sony Vaio S13-VJS132X0511S
LG Gram 14Z980-A.AAS7U1: Intel Core i7-8550U, 14.00", 1 kg
Recensioni esterne » LG Gram 14Z980-A.AAS7U1
Lenovo Ideapad 530S-14IKB-81EU00CJUK: Intel Core i5-8250U, 14.10", 1.5 kg
Recensioni esterne » Lenovo Ideapad 530S-14IKB-81EU00CJUK
Lenovo IdeaPad 330S-14IKB-81F5001RUS: Intel Core i3-8130U, 14.10", 1.7 kg
Recensioni esterne » Lenovo IdeaPad 330S-14IKB-81F5001RUS
Lenovo ThinkPad X1 Tablet G3-20KJ001NGE: Intel Core i5-8250U, 13.00", 1.3 kg
Recensioni esterne » Lenovo ThinkPad X1 Tablet G3-20KJ001NGE
HP EliteBook 830 G5-3PZ05UT: Intel Core i7-8650U, 13.30", 1.3 kg
Recensioni esterne » HP EliteBook 830 G5-3PZ05UT
HP EliteBook 840 G5-3WD97UT: Intel Core i7-8650U, 14.00", 1.5 kg
Recensioni esterne » HP EliteBook 840 G5-3WD97UT
Asus VivoBook Flip 14 TP412UA-EC115T: Intel Core i7-8550U, 14.10", 1.5 kg
Recensioni esterne » Asus VivoBook Flip 14 TP412UA-EC115T
Acer Swift 5 SF514 15.6 inch: Intel Core i7-8550U, 15.60", 1 kg
Recensioni esterne » Acer Swift 5 SF514 15.6 inch
Toshiba Portege X30-E-11U: Intel Core i7-8550U, 13.30", 1.1 kg
Recensioni esterne » Toshiba Portege X30-E-11U
Lenovo ThinkPad X380 Yoga-20LH0018US: Intel Core i7-8650U, 13.30", 1.4 kg
Recensioni esterne » Lenovo ThinkPad X380 Yoga-20LH0018US
Acer Spin 3 SP314-51-38XK: Intel Core i3-8130U, 14.00", 1.7 kg
Recensioni esterne » Acer Spin 3 SP314-51-38XK
Acer Aspire E5-476-50SZ: Intel Core i5-8250U, 14.00", 1.9 kg
Recensioni esterne » Acer Aspire E5-476-50SZ
Fujitsu Stylistic Q738: Intel Core i5-8350U, 13.30", 1.4 kg
Recensioni esterne » Fujitsu Stylistic Q738
Asus VivoBook S14 S406UA-BV023T: Intel Core i5-8250U, 14.00", 1.2 kg
Recensioni esterne » Asus VivoBook S14 S406UA-BV023T
Acer Spin 5 SP513-52N-54SF: Intel Core i5-8250U, 13.30", 1.5 kg
Recensioni esterne » Acer Spin 5 SP513-52N-54SF
HP Spectre 13-af005nl: Intel Core i7-8550U, 13.30", 1.1 kg
Recensioni esterne » HP Spectre 13-af005nl
HP Elitebook 840 G5 3JX27EA: Intel Core i5-8250U, 14.00", 1.5 kg
Recensioni esterne » HP Elitebook 840 G5 3JX27EA
HP Spectre 13-AF000NS: Intel Core i7-8550U, 13.30", 1.1 kg
Recensioni esterne » HP Spectre 13-AF000NS
Lenovo Yoga 720-13IKBR-81C3008YSP: Intel Core i5-8250U, 13.30", 1.3 kg
Recensioni esterne » Lenovo Yoga 720-13IKBR-81C3008YSP
Lenovo Ideapad 320S-14IKBR-81BN0055SP: Intel Core i5-8250U, 14.00", 1.7 kg
Recensioni esterne » Lenovo Ideapad 320S-14IKBR-81BN0055SP
HP Pavilion x360 14-cd0006ns: Intel Core i3-8130U, 14.00", 1.6 kg
Recensioni esterne » HP Pavilion x360 14-cd0006ns
Dell Inspiron 15 5570 cn57005: Intel Core i5-8250U, 15.60", 2.2 kg
Recensioni esterne » Dell Inspiron 15 5570 cn57005
Acer Spin 5 SP513-52N-5210: Intel Core i5-8250U, 13.30", 1.6 kg
Recensioni esterne » Acer Spin 5 SP513-52N-5210
Acer Spin 3-314-51-54WS: Intel Core i5-8250U, 14.00", 1.7 kg
Recensioni esterne » Acer Spin 3-314-51-54WS
Asus Zenbook S UX391UA-EG022T: Intel Core i7-8550U, 13.30", 1.1 kg
Recensioni esterne » Asus Zenbook S UX391UA-EG022T
Lenovo Thinkpad L380-20M50013SP: Intel Core i5-8250U, 13.30", 1.5 kg
Recensioni esterne » Lenovo Thinkpad L380-20M50013SP
Lenovo Thinkpad L380 Yoga-20M7001BS: Intel Core i5-8250U, 13.30", 1.6 kg
Recensioni esterne » Lenovo Thinkpad L380 Yoga-20M7001BS
Lenovo Yoga 520-14IKBR-81C8008VSP: Intel Core i5-8250U, 14.00", 1.8 kg
Recensioni esterne » Lenovo Yoga 520-14IKBR-81C8008VSP
Lenovo Thinkpad T480-20L50000SP: Intel Core i5-8250U, 14.00", 1.7 kg
Recensioni esterne » Lenovo Thinkpad T480-20L50000SP
HP Elitebook 850 G5-3JX13EA: Intel Core i5-8250U, 15.60", 1.8 kg
Recensioni esterne » HP Elitebook 850 G5-3JX13EA
Asus VivoBook 15 X542UA-GQ266T: Intel Core i5-8250U, 15.60", 2.3 kg
Recensioni esterne » Asus VivoBook 15 X542UA-GQ266T
Lenovo ThinkPad X1 Carbon 2018-20KHCTO1WW: Intel Core i7-8550U, 14.00", 1.2 kg
Recensioni esterne » Lenovo ThinkPad X1 Carbon 2018-20KHCTO1WW
Lenovo ThinkPad L580-20LW000VMH: Intel Core i5-8250U, 15.60", 2 kg
Recensioni esterne » Lenovo ThinkPad L580-20LW000VMH
Lenovo Ideapad 520S-14IKBR-81BL005YMH: Intel Core i5-8250U, 14.00", 1.7 kg
Recensioni esterne » Lenovo Ideapad 520S-14IKBR-81BL005YMH
Acer Swift 5 SF514-52T-831Y: Intel Core i7-8550U, 14.00", 1 kg
Recensioni esterne » Acer Swift 5 SF514-52T-831Y
HP EliteBook 850 G5 3JX58EA: Intel Core i5-8250U, 15.60", 1.8 kg
Recensioni esterne » HP EliteBook 850 G5 3JX58EA
Lenovo ThinkPad L380-20M5000WGE: Intel Core i5-8250U, 13.30", 1.4 kg
Recensioni esterne » Lenovo ThinkPad L380-20M5000WGE
Lenovo ThinkPad L480-20LS001AGE: Intel Core i5-8250U, 14.00", 1.7 kg
Recensioni esterne » Lenovo ThinkPad L480-20LS001AGE
Lenovo ThinkPad T480-20L50010US: Intel Core i7-8650U, 14.00", 1.6 kg
Recensioni esterne » Lenovo ThinkPad T480-20L50010US
HP EliteBook 840 G5-3JX66EA: Intel Core i5-8250U, 14.00", 1.5 kg
Recensioni esterne » HP EliteBook 840 G5-3JX66EA
Asus VivoBook Flip 15 TP510UA-E8073T: Intel Core i5-8250U, 15.60", 2.3 kg
Recensioni esterne » Asus VivoBook Flip 15 TP510UA-E8073T
LG Gram 14Z980-U.AAW5U1: Intel Core i5-8250U, 14.00", 1 kg
Recensioni esterne » LG Gram 14Z980-U.AAW5U1
Fujitsu Lifebook T938: Intel Core i5-8250U, 13.30", 1.3 kg
Recensioni esterne » Fujitsu Lifebook T938
Asus ZenBook S UX391U: Intel Core i7-8550U, 13.30", 1 kg
Recensioni esterne » Asus ZenBook S UX391U
HP EliteBook 830 G5-3JX74EA: Intel Core i7-8550U, 13.30", 1.3 kg
Recensioni esterne » HP EliteBook 830 G5-3JX74EA
Lenovo ThinkPad L580-20LW000VGE: Intel Core i5-8250U, 15.60", 2 kg
Recensioni esterne » Lenovo ThinkPad L580-20LW000VGE
Acer Swift 3 SF315-52-58HG: Intel Core i5-8250U, 15.60", 1.8 kg
Recensioni esterne » Acer Swift 3 SF315-52-58HG
Lenovo ThinkPad X1 Carbon 2018-20KH0039MC: Intel Core i7-8550U, 14.00", 1.1 kg
Recensioni esterne » Lenovo ThinkPad X1 Carbon 2018-20KH0039MC
Lenovo ThinkPad E580-20KS0064MC: Intel Core i5-8250U, 15.60", 2.1 kg
Recensioni esterne » Lenovo ThinkPad E580-20KS0064MC
Acer Swift 5 SF514-52T-56ZX: Intel Core i5-8250U, 14.00", 1 kg
Recensioni esterne » Acer Swift 5 SF514-52T-56ZX
Asus Zenbook UX331UAL-EG050T: Intel Core i5-8250U, 13.30", 1 kg
Recensioni esterne » Asus Zenbook UX331UAL-EG050T
Lenovo V330-15IKB-81AX00CNSP: Intel Core i5-8250U, 15.60", 2 kg
Recensioni esterne » Lenovo V330-15IKB-81AX00CNSP
Lenovo Yoga 920-13IKB-80Y7008RSP: Intel Core i5-8250U, 13.90", 1.4 kg
Recensioni esterne » Lenovo Yoga 920-13IKB-80Y7008RSP
Lenovo Ideapad 520S-14IKB-81BL0080SP: Intel Core i7-8550U, 14.00", 1.7 kg
Recensioni esterne » Lenovo Ideapad 520S-14IKB-81BL0080SP
Lenovo Thinkpad E580 20KS004FSP: Intel Core i5-8250U, 15.60", 2.1 kg
Recensioni esterne » Lenovo Thinkpad E580 20KS004FSP
HP ENVY 13-ad113ns: Intel Core i7-8550U, 13.30", 1.3 kg
Recensioni esterne » HP ENVY 13-ad113ns
LG Gram 15Z980-G.AA52: Intel Core i5-8250U, 15.60", 1.1 kg
Recensioni esterne » LG Gram 15Z980-G.AA52
Dell Inspiron 17-5770-0357: Intel Core i5-8250U, 17.30", 2.7 kg
Recensioni esterne » Dell Inspiron 17-5770-0357
Lenovo V330-14IKB-81B0004MGE: Intel Core i5-8250U, 14.00", 1.7 kg
Recensioni esterne » Lenovo V330-14IKB-81B0004MGE
LG Gram 13Z980-A: Intel Core i5-8250U, 13.30", 1 kg
Recensioni esterne » LG Gram 13Z980-A
Dell Latitude 15 3590-6HFKG: Intel Core i5-8250U, 15.60", 2.1 kg
Recensioni esterne » Dell Latitude 15 3590-6HFKG
HP ProBook 440 G5-3KX87ES: Intel Core i5-8250U, 14.00", 1.6 kg
Recensioni esterne » HP ProBook 440 G5-3KX87ES
HP Spectre 13-af008tu: Intel Core i5-8250U, 13.30", 1.1 kg
Recensioni esterne » HP Spectre 13-af008tu
HP Spectre 13-af090tu: Intel Core i7-8550U, 13.30", 1.1 kg
Recensioni esterne » HP Spectre 13-af090tu
Lenovo ThinkPad X380 Yoga-20LH000NGE: Intel Core i5-8250U, 13.30", 1.4 kg
Recensioni esterne » Lenovo ThinkPad X380 Yoga-20LH000NGE
Lenovo ThinkPad X280-20KF0022US: Intel Core i5-8350U, 12.50", 1.1 kg
Recensioni esterne » Lenovo ThinkPad X280-20KF0022US
Lenovo Ideapad 720S-13IKB-81BV0058GE: Intel Core i7-8550U, 13.30", 1.1 kg
Recensioni esterne » Lenovo Ideapad 720S-13IKB-81BV0058GE
Lenovo ThinkPad X1 Carbon G6-20KH006MGE: Intel Core i7-8550U, 14.00", 1.1 kg
Recensioni esterne » Lenovo ThinkPad X1 Carbon G6-20KH006MGE
Lenovo Ideapad 520-15IKBR-81BF008MMH: Intel Core i5-8250U, 15.60", 2.2 kg
Recensioni esterne » Lenovo Ideapad 520-15IKBR-81BF008MMH
Lenovo Thinkpad E580-20KS001QMH: Intel Core i7-8550U, 15.60", 2.1 kg
Recensioni esterne » Lenovo Thinkpad E580-20KS001QMH
Acer Swift 5 SF5-14-52T-580N: Intel Core i5-8250U, 14.00", 1 kg
Recensioni esterne » Acer Swift 5 SF5-14-52T-580N
Asus ZenBook UX430UAR PURE14: Intel Core i7-8550U, 14.00", 1.3 kg
Recensioni esterne » Asus ZenBook UX430UAR PURE14
Dell Inspiron 13 5370-0583: Intel Core i5-8250U, 13.30", 1.4 kg
Recensioni esterne » Dell Inspiron 13 5370-0583
HP EliteBook 840 G5-3JX61EA: Intel Core i7-8550U, 14.00", 1.5 kg
Recensioni esterne » HP EliteBook 840 G5-3JX61EA
Dell Inspiron 15 5579-9689: Intel Core i7-8550U, 15.60", 2.1 kg
Recensioni esterne » Dell Inspiron 15-5579-9689
Asus Zenbook UX331UA-90NB0GZ2-M02380: Intel Core i5-8250U, 13.30", 1.1 kg
Recensioni esterne » Asus Zenbook UX331UA-90NB0GZ2-M02380
Acer Chromebook Spin 13 CP713-1W: Intel Core i5-8250U, 13.50", 1.5 kg
Recensioni esterne » Acer Chromebook Spin 13 CP713-1W
Lenovo Thinkpad E580-20KS003GHV: Intel Core i5-8250U, 15.60", 2.1 kg
Recensioni esterne » Lenovo Thinkpad E580-20KS003GHV
Fujitsu Lifebook U938: Intel Core i5-8250U, 13.30", 0.9 kg
Recensioni esterne » Fujitsu Lifebook U938
Dell Latitude 5490: Intel Core i7-8650U, 14.00", 1.7 kg
Recensioni esterne » Dell Latitude 5490
HP ENVY 13-ad107ns: Intel Core i5-8250U, 13.30", 1.3 kg
Recensioni esterne » HP ENVY 13-ad107ns
Lenovo Ideapad 320-15IKB-81BG00HASP: Intel Core i5-8250U, 15.60", 2.2 kg
Recensioni esterne » Lenovo Ideapad 320-15IKB-81BG00HASP
Asus ZenBook 3 Deluxe UX490UAR-BE094T: Intel Core i5-8250U, 14.00", 1.1 kg
Recensioni esterne » Asus ZenBook 3 Deluxe UX490UAR-BE094T
Lenovo ThinkPad E480-20KNCTO1WW: Intel Core i5-8250U, 14.00", 1.8 kg
Recensioni esterne » Lenovo ThinkPad E480-20KNCTO1WW
Dell Vostro 14 5471: Intel Core i5-8250U, 14.00", 1.7 kg
Recensioni esterne » Dell Vostro 14 5471
Acer Swift 5 SF514-52T-56JV: Intel Core i5-8250U, 14.00", 0.9 kg
Recensioni esterne » Acer Swift 5 SF514-52T-56JV
Dell Latitude 3490: Intel Core i5-8250U, 14.00", 1.8 kg
Recensioni esterne » Dell Latitude 3490
Dell Latitude 7490: Intel Core i7-8650U, 14.00", 1.6 kg
Recensioni esterne » Dell Latitude 7490
Lenovo ThinkPad L380 Yoga-20M7001BGE: Intel Core i5-8250U, 13.30", 1.5 kg
Recensioni esterne » Lenovo ThinkPad L380 Yoga-20M7001BGE
Acer Aspire E5-476-3675: Intel Core i3-8130U, 14.00", 1.9 kg
Recensioni esterne » Acer Aspire E5-476-3675
Asus Zenbook 13 UX331UAL-EG020TS: Intel Core i7-8550U, 13.30", 1 kg
Recensioni esterne » Asus Zenbook 13 UX331UAL-EG020TS
Asus ZenBook Flip 14 UX461UA: Intel Core i5-8250U, 14.00", 1.4 kg
Recensioni esterne » Asus ZenBook Flip 14 UX461UA
Lenovo ThinkPad X1 Yoga 2018-20LD0015US: Intel Core i5-8250U, 14.00", 1.4 kg
Recensioni esterne » Lenovo ThinkPad X1 Yoga 2018-20LD0015US
Lenovo Ideapad 520S-14IKBR-81BL007MSP: Intel Core i5-8250U, 14.00", 1.7 kg
Recensioni esterne » Lenovo Ideapad 520S-14IKBR-81BL007MSP
HP Spectre x360 13-ae000ns: Intel Core i5-8250U, 13.30", 1.3 kg
Recensioni esterne » HP Spectre x360 13-ae000ns
HP Envy 13-ad110ns: Intel Core i5-8250U, 13.30", 1.2 kg
Recensioni esterne » HP Envy 13-ad110ns
Lenovo Yoga 920-13IKB-80Y80029GE Star Wars: Intel Core i5-8250U, 13.30", 1.4 kg
Recensioni esterne » Lenovo Yoga 920-13IKB-80Y80029GE Star Wars
HP ProBook 430 G5-3KY87EA: Intel Core i5-8250U, 13.30", 1.5 kg
Recensioni esterne » HP ProBook 430 G5-3KY87EA
Lenovo Yoga 520-14IKB-81C8001DGE: Intel Core i5-8250U, 14.00", 1.8 kg
Recensioni esterne » Lenovo Yoga 520-14IKB-81C8001DGE
Lenovo ThinkPad X280-20KF001HMC: Intel Core i7-8550U, 12.50", 1.3 kg
Recensioni esterne » Lenovo ThinkPad X280-20KF001HMC
Acer Aspire 3 A315-51-30YA: Intel Core i3-8130U, 15.60", 2.1 kg
Recensioni esterne » Acer Aspire 3 A315-51-30YA
Asus UX410UA-GV354T: Intel Core i5-8250U, 14.00", 1.4 kg
Recensioni esterne » Asus UX410UA-GV354T
Lenovo ThinkPad X280-20KF001UUS: Intel Core i7-8650U, 12.50", 1.1 kg
Recensioni esterne » Lenovo ThinkPad X280-20KF001UUS
Lenovo ThinkPad T480-20L50011US: Intel Core i5-8350U, 14.00", 1.8 kg
Recensioni esterne » Lenovo ThinkPad T480-20L50011US
Lenovo ThinkPad X280-20KES01S00: Intel Core i5-8250U, 12.50", 1.1 kg
Recensioni esterne » Lenovo ThinkPad X280-20KES01S00
Acer Swift 5 SF514-52T-82WQ: Intel Core i7-8550U, 14.00", 1 kg
Recensioni esterne » Acer Swift 5 SF514-52T-82WQ
Asus Zenbook UX430UA-GV259T: Intel Core i5-8250U, 14.00", 1.3 kg
Recensioni esterne » Asus Zenbook UX430UA-GV259T
Lenovo ThinkPad T480-20L5000AMC: Intel Core i7-8550U, 14.00", 1.7 kg
Recensioni esterne » Lenovo ThinkPad T480-20L5000AMC
Lenovo Yoga 920 Vibes Edition: Intel Core i7-8550U, 13.90", 1.4 kg
Recensioni esterne » Lenovo Yoga 920 Vibes Edition
HP Spectre x360 13-ae010tu: Intel Core i7-8550U, 13.30", 1.3 kg
Recensioni esterne » HP Spectre x360 13-ae010tu
Dell Latitude 15 5590-K7G13: Intel Core i7-8650U, 15.60", 2 kg
Recensioni esterne » Dell Latitude 15 5590-K7G13
Dell Latitude 7390-XPWYP 2-in-1: Intel Core i5-8250U, 13.30", 1.4 kg
Recensioni esterne » Dell Latitude 7390-XPWYP 2-in-1
Lenovo V330-15IKB-81AX00CCUK: Intel Core i7-8550U, 15.60", 1.8 kg
Recensioni esterne » Lenovo V330-15IKB-81AX00CCUK
Fujitsu Lifebook P728, Core i7-8650U: Intel Core i7-8650U, 12.50", 1.2 kg
Recensioni esterne » Fujitsu Lifebook P728, Core i7-8650U
Dell XPS 13 9370 i7 UHD: Intel Core i7-8550U, 13.30", 1.2 kg
Recensioni esterne » Dell XPS 13 9370 i7 UHD
Fujitsu Lifebook E558, i5-8350U: Intel Core i5-8350U, 15.60", 2 kg
Recensioni esterne » Fujitsu Lifebook E558, i5-8350U
Lenovo ThinkPad X280-20KF001GGE: Intel Core i7-8550U, 12.50", 1.1 kg
Recensioni esterne » Lenovo ThinkPad X280-20KF001GGE
Dell Latitude 7390-93KC3: Intel Core i7-8650U, 13.30", 1.3 kg
Recensioni esterne » Dell Latitude 7390-93KC3
Dell Latitude 5490-T5Y8D: Intel Core i7-8650U, 14.00", 1.7 kg
Recensioni esterne » Dell Latitude 5490-T5Y8D
Lenovo Yoga 730-13: Intel Core i5-8250U, 13.30", 1.2 kg
Recensioni esterne » Lenovo Yoga 730-13
Lenovo Yoga 530-14: Intel Core i5-8250U, 14.00", 1.6 kg
Recensioni esterne » Lenovo Yoga 530-14
Toshiba Portege X30-E-12H: Intel Core i7-8650U, 13.30", 1.1 kg
Recensioni esterne » Toshiba Portege X30-E-12H
Asus Zenbook Flip S UX370UA-C4331T: Intel Core i5-8250U, 13.30", 1.1 kg
Recensioni esterne » Asus Zenbook Flip S UX370UA-C4331T
Acer Spin 5 SP513-52N-862L: Intel Core i7-8550U, 13.30", 1.5 kg
Recensioni esterne » Acer Spin 5 SP513-52N-862L
Acer Aspire 5 A517-51-54UG: Intel Core i5-8250U, 17.30", 2.9 kg
Recensioni esterne » Acer Aspire 5 A517-51-54UG
Samsung Notebook 7 Spin NP730QAA-K01US: Intel Core i5-8250U, 13.30", 1.5 kg
Recensioni esterne » Samsung Notebook 7 Spin NP730QAA-K01US
Asus ZenBook Flip S UX370UA-C4217T: Intel Core i7-8550U, 13.30", 1.1 kg
Recensioni esterne » Asus ZenBook Flip S UX370UA-C4217T
Lenovo ThinkPad X1 Carbon G6-20KG0027GE: Intel Core i7-8650U, 14.00", 1.3 kg
Recensioni esterne » Lenovo ThinkPad X1 Carbon G6-20KG0027GE
Lenovo ThinkPad X1 Yoga 2018-20LD0017US: Intel Core i7-8650U, 14.00", 1.4 kg
Recensioni esterne » Lenovo ThinkPad X1 Yoga 2018-20LD0017US
Lenovo ThinkPad X1 Carbon G6-20KG0039GE: Intel Core i7-8550U, 14.00", 1.1 kg
Recensioni esterne » Lenovo ThinkPad X1 Carbon G6-20KG0039GE
Dell Latitude 5290 2-in-1: Intel Core i5-8350U, 12.30", 1.3 kg
Recensioni esterne » Dell Latitude 5290 2-in-1
HP 15-bs127NS: Intel Core i5-8250U, 15.60", 1.9 kg
Recensioni esterne » HP 15-BS127NS
HP Spectre 13-af033ng: Intel Core i7-8550U, 13.30", 1.1 kg
Recensioni esterne » HP Spectre 13-af033ng
HP Probook 440 G5-2RS30EA: Intel Core i5-8250U, 14.00", 1.7 kg
Recensioni esterne » HP Probook 440 G5-2RS30EA
HP ProBook 430 G5-2SY09EA: Intel Core i5-8250U, 13.30", 1.5 kg
Recensioni esterne » HP ProBook 430 G5-2SY09EA
HP 15-bs119ns: Intel Core i5-8250U, 15.60", 1.9 kg
Recensioni esterne » HP 15-bs119ns
Acer Swift 5 SF514-52T-54QZ: Intel Core i5-8250U, 14.00", 1 kg
Recensioni esterne » Acer Swift 5 SF514-52T-54QZ
Acer Spin 3 SP314-51-53XS: Intel Core i5-8250U, 14.00", 1.7 kg
Recensioni esterne » Acer Spin 3 SP314-51-53XS
Acer Swift 5 SF514-52T-565H: Intel Core i5-8250U, 14.00", 1 kg
Recensioni esterne » Acer Swift 5 SF514-52T-565H
Lenovo ThinkPad T480s-20L8S02D00: Intel Core i5-8250U, 14.00", 1.4 kg
Recensioni esterne » Lenovo ThinkPad T480s-20L8S02D00
HP ProBook 430 G5-3KY85EA: Intel Core i5-8250U, 13.30", 1.5 kg
Recensioni esterne » HP ProBook 430 G5-3KY85EA
LG Gram 15Z980-A.AAS7U1: Intel Core i7-8550U, 15.60", 1.1 kg
Recensioni esterne » LG Gram 15Z980-A.AAS7U1
Acer Spin 5 SP513-52N-58WW: Intel Core i5-8250U, 13.30", 1.5 kg
Recensioni esterne » Acer Spin 5 SP513-52N-58WW
Dell Latitude 7390: Intel Core i5-8350U, 13.30", 1.3 kg
Recensioni esterne » Dell Latitude 7390
Lenovo ThinkPad X1 Carbon 2018-20KGS03900: Intel Core i7-8550U, 14.00", 1.1 kg
Recensioni esterne » Lenovo ThinkPad X1 Carbon 2018-20KGS03900
Asus ZenBook 13 UX331UA-EG013T: Intel Core i5-8250U, 13.30", 1.1 kg
Recensioni esterne » Asus ZenBook 13 UX331UA-EG013T
Dell Inspiron 13-7373: Intel Core i5-8250U, 13.30", 1.5 kg
Recensioni esterne » Dell Inspiron 13-7373
Dell Inspiron 15-7573: Intel Core i5-8250U, 15.60", 2.3 kg
Recensioni esterne » Dell Inspiron 15-7573
Lenovo Thinkpad X1 Tablet Gen. 3 (2018): Intel Core i7-8550U, 13.00", 1.3 kg
Recensioni esterne » Lenovo Thinkpad X1 Tablet Gen. 3 (2018)
Lenovo ThinkPad X1 Yoga 2018-20LES01W00: Intel Core i7-8550U, 14.00", 1.4 kg
Recensioni esterne » Lenovo ThinkPad X1 Yoga 2018-20LES01W00
Lenovo Yoga 720-13IKB-81C3008RGE: Intel Core i5-8250U, 13.30", 1.3 kg
Recensioni esterne » Lenovo Yoga 720-13IKB-81C3008RGE
Dell XPS 13 9370 FHD i5: Intel Core i5-8250U, 13.30", 1.2 kg
Recensioni esterne » Dell XPS 13 9370 FHD i5
Dell Latitude 7390 2-in-1: Intel Core i7-8650U, 13.30", 1.4 kg
Recensioni esterne » Dell Latitude 7390 2-in-1
HP Envy x360 15-bp180nz: Intel Core i7-8550U, 15.60", 2.1 kg
Recensioni esterne » HP Envy x360 15-bp180nz
Acer Swift 5 SF514-52T-51MW: Intel Core i5-8250U, 14.00", 1 kg
Recensioni esterne » Acer Swift 5 SF514-52T-51MW
Lenovo Yoga 920-13IKB-80Y7003JMX: Intel Core i5-8250U, 13.90", 1.4 kg
Recensioni esterne » Lenovo Yoga 920-13IKB-80Y7003JMX
Asus ZenBook Flip 14 UX461UA-E1112T: Intel Core i7-8550U, 14.00", 1.4 kg
Recensioni esterne » Asus ZenBook Flip 14 UX461UA-E1112T
HP Pavilion 15-ck003nb: Intel Core i5-8250U, 15.60", 1.9 kg
Recensioni esterne » HP Pavilion 15-ck003nb
Acer Swift 5 SF514-52T-8673: Intel Core i7-8550U, 14.00", 1 kg
Recensioni esterne » Acer Swift 5 SF514-52T-8673
Dell XPS 13 i5-8250U: Intel Core i5-8250U, 13.30", 1.3 kg
Recensioni esterne » Dell XPS 13 i5-8250U
Dell XPS 13 CNX37001: Intel Core i5-8250U, 13.30", 1.2 kg
Recensioni esterne » Dell XPS 13 CNX37001
HP Spectre 13-ae001nf x360: Intel Core i5-8250U, 13.30", 1.3 kg
Recensioni esterne » HP Spectre 13-ae001nf x360
Lenovo Miix 520-12IKB 20M3000LGE: Intel Core i7-8550U, 12.20", 1.3 kg
Recensioni esterne » Lenovo Miix 520-12IKB 20M3000LGE
HP Spectre 13-af030nd: Intel Core i7-8550U, 13.30", 1.1 kg
Recensioni esterne » HP Spectre 13-af030nd
Lenovo Yoga 520-14IKBR-81C8005HMH: Intel Core i7-8550U, 14.00", 1.7 kg
Recensioni esterne » Lenovo Yoga 520-14IKBR-81C8005HMH
Lenovo ThinkPad E580-20KSCTO1WW: Intel Core i5-8250U, 15.60", 1.9 kg
Recensioni esterne » Lenovo ThinkPad E580-20KSCTO1WW
Lenovo Yoga 920-13IKB-80Y7003MX: Intel Core i7-8550U, 13.90", 1.4 kg
Recensioni esterne » Lenovo Yoga 920-13IKB-80Y7003MX
Dell Inspiron 13-5379-9573: Intel Core i5-8250U, 13.30", 1.6 kg
Recensioni esterne » Dell Inspiron 13-5379-9573
Acer Swift 5 SF514-52T-52ZU: Intel Core i5-8250U, 14.00", 1 kg
Recensioni esterne » Acer Swift 5 SF514-52T-52ZU
HP Spectre 13-af008nc : Intel Core i7-8550U, 13.30", 1.1 kg
Recensioni esterne » HP Spectre 13-af008nc
HP Pavilion 14-bf109ns: Intel Core i5-8250U, 14.00", 1.5 kg
Recensioni esterne » HP Pavilion 14-bf109ns
HP Pavilion 14-ba135ns x360: Intel Core i5-8250U, 14.00", 1.6 kg
Recensioni esterne » HP Pavilion 14-ba135ns x360
Dell Inspiron 13 7370: Intel Core i5-8250U, 13.30", 1.4 kg
Recensioni esterne » Dell Inspiron 13 7370
HP Pavilion 15-ck000NS: Intel Core i5-8250U, 15.60", 1.8 kg
Recensioni esterne » HP Pavilion 15-CK000NS
Lenovo Ideapad 520-15IKBR-81BF004GSP: Intel Core i7-8550U, 15.60", 2.2 kg
Recensioni esterne » Lenovo Ideapad 520-15IKBR-81BF004GSP
Lenovo Yoga 920-13IKB-80Y80032CK Star Wars Special Edition: Galactic Empire: Intel Core i5-8250U, 13.90", 1.4 kg
Recensioni esterne » Lenovo Yoga 920-13IKB-80Y80032CK Star Wars Special Edition: Galactic Empire
Samsung Notebook 9 Pro NP940X3N-K01US: Intel Core i7-8550U, 13.30", 1.3 kg
Recensioni esterne » Samsung Notebook 9 Pro NP940X3N-K01US
Acer Swift 3 SF314-52-517Z: Intel Core i5-8250U, 14.00", 1.6 kg
Recensioni esterne » Acer Swift 3 SF314-52-517Z
Dell XPS 13 9370, i7-8550U: Intel Core i7-8550U, 13.30", 1.2 kg
Recensioni esterne » Dell XPS 13 9370, i7-8550U
Dell Inspiron 15 5579-9672: Intel Core i5-8250U, 15.60", 2.1 kg
Recensioni esterne » Dell Inspiron 15 5579-9672
Dell Inspiron 13 5379-9658: Intel Core i7-8550U, 13.30", 1.7 kg
Recensioni esterne » Dell Inspiron 13 5379-9658
Dell Inspiron 15 5579: Intel Core i7-8550U, 15.60", 2.1 kg
Recensioni esterne » Dell Inspiron 15 5579
Dell Inspiron 13 7373-0866: Intel Core i7-8550U, 13.30", 1.5 kg
Recensioni esterne » Dell Inspiron 13 7373-0866
HP Spectre x360 13-ae041ng: Intel Core i7-8550U, 13.30", 1.3 kg
Recensioni esterne » HP Spectre x360 13-ae041ng
Asus ZenBook UX430UA-GV334T: Intel Core i5-8250U, 14.00", 1.3 kg
Recensioni esterne » Asus ZenBook UX430UA-GV334T
Lenovo Ideapad 720S-13IKB: Intel Core i5-8250U, 13.30", 1.1 kg
Recensioni esterne » Lenovo Ideapad 720S-13IKB
Lenovo ThinkPad X1 Carbon G6-20KG0025UK: Intel Core i5-8250U, 14.00", 1.1 kg
Recensioni esterne » Lenovo ThinkPad X1 Carbon G6
Dell XPS 13 9370 i5 UHD: Intel Core i5-8250U, 13.30", 1.2 kg
Recensioni esterne » Dell XPS 13 9370 i5 UHD
Dell Inspiron 13 5379-9573: Intel Core i5-8250U, 13.30", 1.7 kg
Recensioni esterne » Dell Inspiron 13 5379-9573
HP Envy 13-ad106ns: Intel Core i5-8250U, 13.30", 1.2 kg
Recensioni esterne » HP Envy 13-ad106ns
Asus ZenBook Flip S UX370UA-C4184T: Intel Core i7-8550U, 13.30", 1.1 kg
Recensioni esterne » Asus ZenBook Flip S UX370UA-C4184T
Asus ZenBook UX430UA-GV266T: Intel Core i7-8550U, 14.00", 1.3 kg
Recensioni esterne » Asus ZenBook UX430UA-GV266T
Lenovo Miix 520-12IKB 81CG: Intel Core i5-8250U, 12.20", 1.2 kg
Recensioni esterne » Lenovo Miix 520-12IKB 81CG
Lenovo Yoga 920 13-80Y70066US: Intel Core i7-8550U, 13.90", 1.4 kg
Recensioni esterne » Lenovo Yoga 920 14-80Y70066US
HP Spectre 13-Af008Ur: Intel Core i7-8550U, 13.30", 1.1 kg
Recensioni esterne » HP Spectre 13-Af008Ur
HP ProBook 430 G5: Intel Core i7-8550U, 13.30", 1.4 kg
Recensioni esterne » HP ProBook 430 G5
HP Spectre 13-AF000no : Intel Core i5-8250U, 13.30", 1.1 kg
Recensioni esterne » HP Spectre 13-AF000no
Lenovo Yoga 920-13-80Y70058CK: Intel Core i7-8550U, 13.90", 1.4 kg
Recensioni esterne » Lenovo Yoga 920-13-80Y70058CK
Lenovo Yoga 920-13-80Y7007RMX: Intel Core i7-8550U, 13.90", 1.4 kg
Recensioni esterne » Lenovo Yoga 920-13-80Y7007RMX
HP Envy 13t-1YU00AV: Intel Core i7-8550U, 13.30", 1.3 kg
Recensioni esterne » HP Envy 13t-1YU00AV
Dell Inspiron 13-7370 2-in-1: Intel Core i5-8250U, 13.30", 1.5 kg
Recensioni esterne » Dell Inspiron 13-7370 2-in-1
Asus ZenBook UX330UA-AH55: Intel Core i5-8250U, 13.30", 1.2 kg
Recensioni esterne » Asus ZenBook UX330UA-AH55
Asus ZenBook UX430UA-DH74: Intel Core i7-8550U, 14.00", 1.3 kg
Recensioni esterne » Asus ZenBook UX430UA-DH74
HP Spectre 13-af006nf: Intel Core i7-8550U, 13.30", 1.1 kg
Recensioni esterne » HP Spectre 13-af006nf
Razer Blade Stealth QHD i7-8550U: Intel Core i7-8550U, 13.30", 1.4 kg
Recensioni esterne » Razer Blade Stealth QHD i7-8550U
Acer Swift 3 SF314-52-55UF: Intel Core i5-8250U, 14.00", 1.6 kg
Recensioni esterne » Acer Swift 3 SF314-52-55UF
HP Envy 13-ad101ns: Intel Core i5-8250U, 13.30", 1.4 kg
Recensioni esterne » HP Envy 13-ad101ns
HP Envy 13-ad112nd: Intel Core i5-8250U, 13.30", 1.3 kg
Recensioni esterne » HP Envy 13-ad112nd
Acer Spin 5 SP515-51N-54WQ: Intel Core i5-8250U, 15.60", 2.2 kg
Recensioni esterne » Acer Spin 5 SP515-51N-54WQ
Acer Spin 5 SP513-52N-856S: Intel Core i7-8550U, 13.30", 1.6 kg
Recensioni esterne » Acer Spin 5 SP513-52N-856S
HP Spectre 13-ae006no x360: Intel Core i7-8550U, 13.30", 1.3 kg
Recensioni esterne » HP Spectre 13-ae006no x360
Dell Inspiron 13 7373: Intel Core i7-8550U, 13.30", 1.5 kg
Recensioni esterne » Dell Inspiron 13 7373
Dell XPS 13 9360R MMH8D: Intel Core i7-8550U, 13.30", 1.2 kg
Recensioni esterne » Dell XPS 13 9360R MMH8D
Asus Vivobook S15 S510UA-BR409T: Intel Core i5-8250U, 15.60", 1.5 kg
Recensioni esterne » Asus Vivobook S15 S510UA-BR409T
HP Spectre 13-ae001ns x360: Intel Core i7-8550U, 13.30", 1.3 kg
Recensioni esterne » HP Spectre 13-ae001ns x360
HP Spectre 13-af002ng: Intel Core i7-8550U, 13.30", 1.1 kg
Recensioni esterne » HP Spectre 13-af002ng
HP Spectre x360 13-ae010nd: Intel Core i7-8550U, 13.30", 1.3 kg
Recensioni esterne » HP Spectre x360 13-ae010nd
Dell XPS 13 9360 CNX93R02: Intel Core i7-8550U, 13.30", 1.2 kg
Recensioni esterne » Dell XPS 13 9360 CNX93R02
Lenovo Ideapad 520s-14IKB-81BL005RMH: Intel Core i5-8250U, 14.00", 1.7 kg
Recensioni esterne » Lenovo Ideapad 520s-14IKB-81BL005RMH
Dell XPS 13 9360-5563: Intel Core i7-8550U, 13.30", 1.3 kg
Recensioni esterne » Dell XPS 13 9360-5563
Lenovo IdeaPad 320s-13IKB 81AK001VRK: Intel Core i5-8250U, 13.30", 1.2 kg
Recensioni esterne » Lenovo IdeaPad 320s-13IKB 81AK001VRK
Asus ZenBook 3 Deluxe UX490UAR-BE087T: Intel Core i7-8550U, 14.00", 1.2 kg
Recensioni esterne » Asus ZenBook 3 Deluxe UX490UAR-BE087T
Dell XPS 13 i7-8550U: Intel Core i7-8550U, 13.30", 1.3 kg
Recensioni esterne » Dell XPS 13 i7-8550U
Dell Xps 13 9360-9962: Intel Core i7-8550U, 13.30", 1.2 kg
Recensioni esterne » Dell Xps 13 9360-9962
Lenovo Yoga 920-13IKB-80Y7: Intel Core i7-8550U, 13.90", 1.4 kg
Recensioni esterne » Lenovo Yoga 920-13IKB-80Y7
Acer Spin 5 SP515-51N: Intel Core i5-8250U, 15.60", 2.2 kg
Recensioni esterne » Acer Spin 5 SP515-51N
Dell Inspiron 13 7370-9665: Intel Core i5-8250U, 13.30", 1.4 kg
Recensioni esterne » Dell Inspiron 13-7370-9665
Lenovo Yoga 920-13IKB-80Y70035GE: Intel Core i7-8550U, 13.90", 1.4 kg
Recensioni esterne » Lenovo Yoga 920-13IKB-80Y70035GE
Acer Spin 5 SP513-52N-566U: Intel Core i5-8250U, 13.30"
Recensioni esterne » Acer Spin 5 SP513-52N-566U
Acer Swift 5 SF514-52T-59HY: Intel Core i5-8250U, 14.00", 1 kg
Recensioni esterne » Acer Swift 5 SF514-52T-59HY
Acer Swift 3 SF314-52-584F : Intel Core i5-8250U, 14.00", 1.7 kg
Recensioni esterne » Acer Swift 3 SF314-52-584F
Lenovo Yoga 730-13IKB: Intel Core i7-8550U, 13.30", 1.2 kg
» Lo YouTuber installa una tastiera meccanica nel suo laptop Lenovo da 13 pollici, dopo che quella originale si è guastata due volte
Lenovo Yoga 730-13IKB-81CT: Intel Core i5-8250U, 13.30", 1.2 kg
» Lo YouTuber installa una tastiera meccanica nel suo laptop Lenovo da 13 pollici, dopo che quella originale si è guastata due volte
Dell Latitude 12 7210 2-in-1: Intel Core i7-10610U, 12.30", 0.9 kg
» Il concorrente del Surface Pro 7 di Dell è molto silenzioso
HP EliteBook x360 1040 G7, i7-10810U: Intel Core i7-10810U, 14.00", 1.4 kg
» L'HP EliteBook x360 1040 G7 è uno dei migliori convertibili che è possibile comprare se non vi preoccupa la sua debole grafica UHD
Dell Latitude 5310-23VP6: Intel Core i5-10310U, 13.30", 1.3 kg
» Il Latitude 5310 2-in-1 di Dell supera la soglia delle 11 ore
HP EliteBook x360 1030 G7: Intel Core i7-10810U, 13.30", 1.2 kg
» L'EliteBook x360 1030 G7 è uno dei migliori subnotebook convertibili HP, ma è il momento di fare il salto al 16:10
Lenovo Yoga Duet 7 13IML05-82AS000WGE: Intel Core i5-10210U, 13.00", 1.2 kg
» Il Lenovo Yoga Duet 7 non riesce a tenere il passo con il rapporto prezzo/prestazioni del Microsoft Surface Pro 7
Dell Latitude 14 5410-RJ80D: Intel Core i5-10310U, 14.00", 1.6 kg
» Il Dell Latitude 14 5410 è un ottimo strumento di lavoro - ma purtroppo non offre l'opzione AMD Ryzen 4000
Dell Latitude 7310: Intel Core i7-10610U, 13.30", 1.2 kg
» Il vecchio Dell Latitude 7300 Core i7 è veloce quanto il più recente Latitude 7310 Core i7