Recensioni Notebook con AMD Radeon 780M la scheda grafica
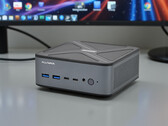
Recensione di Alliwava GH8 - Mini PC potente ed efficiente con Ryzen 9 8945HS e USB4
Alliwava GH8 mira a dimostrare quante prestazioni si possono racchiudere oggi in un mini PC. Con AMD Ryzen 9 8945HS, RAM DDR5 veloce e un SSD PCIe, il sistema compatto è dotato di hardware che di solito si trova in computer molto più grandi. Ma le prestazioni sono sufficienti per l'uso quotidiano e come si comportano in pratica il raffreddamento, la rumorosità e l'efficienza? In questa recensione andiamo a fondo di queste domande.
AMD Ryzen 9 8945HS, Radeon 780M, 516 grRecensione del portatile Dynabook Tecra A65-M: Alternativa adatta a ThinkPad E o EliteBook
Il Tecra A65-M non fa nulla di particolarmente speciale, ma le sue basi fondamentali sono solide per essere un computer portatile affidabile e senza fronzoli per la maggior parte delle attività d'ufficio che non richiedono i colori più precisi.
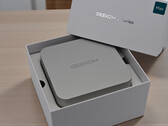
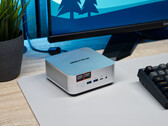
AMD Ryzen 7 250, Radeon 780M, 16", 1.7 kgRecensione del Mini-PC Geekom A7 Max: Elegante tuttofare con Ryzen 9 7940HS e prestazioni sprecate
Con Geekom A7 Max, il produttore invia in gara un potente mini PC con AMD Ryzen 9 7940HS e Radeon 780M. La RAM DDR5, l'SSD PCIe veloce e le numerose connessioni sembrano promettenti. Ma il sistema compatto è in grado di offrire queste prestazioni a lungo termine - e come si comporta in termini di raffreddamento, rumore ed efficienza nell'uso quotidiano?
AMD Ryzen 9 7940HS, Radeon 780M, 681 grRecensione del Minisforum AI X1 per creativi, utenti d'ufficio e giocatori con potenza AMD Ryzen: Mini PC economico con audio a bordo
Minisforum AI X1 è un mini PC compatto con prestazioni sorprendentemente elevate. Dotato di AMD Ryzen 7 255, di una moderna iGPU e di un raffreddamento efficiente, si rivolge agli utenti che cercano un computer versatile per il lavoro, il multimedia e il gioco leggero. Nella nostra recensione, verifichiamo le sue prestazioni in termini di prestazioni, rumorosità ed efficienza energetica.
AMD Ryzen 7 255, Radeon 780M, 658 grGeekom A8 nuova edizione 2025 con AMD Ryzen 7: mini PC potente ed efficiente per l'ufficio, la multimedialità e l'home office nella recensione
Il Geekom A8 riunisce Ryzen 7 8745HS di AMD, grafica Radeon 780M, memoria DDR5 e un SSD PCIe in uno chassis compatto e moderno. È anche più conveniente della variante top-tier, ma la configurazione leggermente meno potente può tenere il passo con la forte concorrenza? E quanto è efficiente il mini PC nell'uso quotidiano? Abbiamo sottoposto il Geekom A8 a test approfonditi per valutarne le prestazioni, l'efficienza e le capacità complessive.
AMD Ryzen 7 8745HS, Radeon 780M, 425 grAlliwava H90 Pro: AMD Ryzen 7 8745HS, 0.5 kg
recensione » Recensione del Mini-PC Alliwava H90 Pro con APU AMD Ryzen 7: Le prestazioni incontrano l'efficienza
HP EliteBook 8 G1a 14 AD3E9ET: AMD Ryzen 7 250, 14.00", 1.4 kg
recensione » Recensione del portatile HP EliteBook 8 G1a 14: Questa versione AMD Ryzen 7, più economica, è ancora vincente
GMK NucBox K12: AMD Ryzen 7 H 255, 0.9 kg
recensione » Recensione del mini PC GMK NucBox K12: Più grande, ma non necessariamente più veloce
Lenovo ThinkPad E14 Gen 7 21T0003NGE: AMD Ryzen 7 250, 14.00", 1.5 kg
recensione » Recensione del Lenovo ThinkPad E14 Gen 7: AMD è la scelta peggiore di Intel per questo portatile business
Peladn HA-4, R7 7840HS: AMD Ryzen 7 7840HS, 1 kg
recensione » Recensione di Ryzen 7 7840HS: Mini PC potente a buon prezzo? Peladn HA-4 sfida Geekom, Minisforum e co. - il miracolo dell'efficienza
Beelink SER9 Pro: AMD Ryzen 7 H 255, 0.8 kg
recensione » Recensione del mini PC Beelink SER9 Pro Ryzen 7: La versione normale non-Pro è più veloce
Ninkear M8, 32+1TB: AMD Ryzen 7 8745HS, 0.5 kg
recensione » Recensione del mini PC Ninkear M8 con AMD Ryzen 7: Meglio di Geekom e Minisforum?
Chuwi Aubox, R7 8745HS: AMD Ryzen 7 8745HS, 0.7 kg
recensione » Recensione del Chuwi AuBox con AMD Ryzen 7 8745HS: Il miglior Mini PC sotto i 450 dollari?
BOSGAME M4 Neo: AMD Ryzen 7 7840HS, 0.6 kg
recensione » Test di Bosgame M4 Neo - l'alternativa economica ai mini PC costosi
Geekom A8 Max, R7 8845HS: AMD Ryzen 7 8845HS, 0.7 kg
recensione » Recensione del mini PC Geekom A8 Max - Il miglior risultato abbinato all'AMD Ryzen 7 8845HS?
Asus VivoBook 18 M1807HA: AMD Ryzen 7 260, 18.40", 2.6 kg
recensione » Recensione del portatile Asus VivoBook 18: Il mostro del display a poco meno di 1.000 dollari
Minisforum EliteMini UM890 Pro: AMD Ryzen 9 8945HS, 0.7 kg
recensione » Recensione del Minisforum EliteMini UM890 Pro: Un potente mini PC con AMD Ryzen 9 e raffreddamento silenzioso
Lenovo IdeaPad Slim 3 14 AHP G10: AMD Ryzen 7 8840HS, 14.00", 1.5 kg
recensione » Recensione del Lenovo IdeaPad Slim 3 14 - Un portatile multimediale economico con molta potenza grazie allo Zen 4
GMK NucBox K11: AMD Ryzen 9 8945HS, 0.6 kg
recensione » Recensione del mini PC GMK NucBox K11: prestazioni elevate con l'AMD Zen 4rispetto al prezzo
Zotac ZGC-G1A1W-01: AMD Ryzen 7 8840U, 7.00", 0.7 kg
recensione » Recensione del palmare ZOTAC Gaming Zone: Precision controller, OLED brillante e compatto
BOSGAME M2: AMD Ryzen 9 7940HS, 0.8 kg
recensione » Recensione del mini PC BOSGAME M2: Corregge una delle principali lamentele dell'M1 originale
Lenovo ThinkPad P14s G5 21ME000TGE: AMD Ryzen 7 PRO 8840HS, 14.00", 1.4 kg
recensione » Recensione del laptop Lenovo ThinkPad P14s Gen 5 AMD: l'OLED si fa sentire sulla durata della batteria
HP EliteBook 845 G11: AMD Ryzen 7 PRO 8840HS, 14.00", 1.5 kg
recensione » Recensione del portatile HP EliteBook 845 G11 - Nessun cambiamento importante, ma ancora uno dei migliori notebook business
Lenovo ThinkPad T14 Gen 5 21MC003QGE: AMD Ryzen 7 8840U, 14.00", 1.5 kg
recensione » Recensione del portatile Lenovo ThinkPad T14 Gen 5: l'AMD è molto più veloce dell'Intel
Ayaneo Flip KB: AMD Ryzen 7 8840U, 7.00", 0.7 kg
recensione » Recensione dell'Ayaneo Flip KB - console portatile con grandi funzionalità alimentata dal meno efficiente AMD Ryzen 7 8840U
Lenovo Yoga 7 2-in-1 14AHP9: AMD Ryzen 7 8840HS, 14.00", 1.6 kg
recensione » Recensione del Lenovo Yoga 7 2-in-1 14AHP9: Veloce convertibile di fascia media frenato da un display debole
Lenovo IdeaPad 5 2-in-1 14AHP9: AMD Ryzen 7 8845HS, 14.00", 1.6 kg
recensione » Recensione del convertibile IdeaPad 5 2-in-1 14AHP9: Uno dei più economici di Lenovo è anche il più veloce
Ninkear A16 Pro: AMD Ryzen 7 8845HS, 16.00", 1.8 kg
recensione » Recensione del portatile Ninkear A16 Pro: economico, potente e silenzioso durante l'uso
Zotac ZGC-G1A1W-01: AMD Ryzen 7 8840U, 7.00", 0.7 kg
recensione » Recensione dello Zotac Zone: Display ottimo ed ingressi da leader di categoria
Minisforum MS-A1: AMD Ryzen 7 8700G, 1.7 kg
recensione » Recensione del Minisforum MS-A1: La workstation supporta diverse CPU AMD e offre spazio per quattro SSD
Schenker XMG Evo 14 (M24): AMD Ryzen 7 8845HS, 14.00", 1.5 kg
recensione » Recensione del portatile Schenker XMG Evo 14 (M24) - Un buon tuttofare con un Ryzen 8000 e fino a 96 GB di RAM
Geekom AX8 Pro: AMD Ryzen 9 8945HS, 0.5 kg
recensione » Recensione del Geekom AX8 Pro AI NUC PC: AMD Ryzen 9 8945HS con 32 GB di RAM DDR5 e 2 TB SSD in uno chassis da 0,47L
Lenovo ThinkPad X13 Gen 4 21J3001VGE: AMD Ryzen 7 PRO 7840U, 13.30", 1.3 kg
recensione » Recensione del laptop Lenovo ThinkPad X13 Gen 4 AMD: Macchina Ryzen compatta con prestazioni mediocri
Asus ROG Ally X: AMD Ryzen Z1 Extreme, 7.00", 0.7 kg
recensione » Recensione dell'Asus ROG Ally X - Il miglior portatile per il gaming grazie alla RAM più veloce e all'enorme batteria da 80 Wh
Geekom AE7: AMD Ryzen 9 7940HS, 0.6 kg
recensione » Recensione del Geekom AE7: Mini-PC NUC con AMD Ryzen 9 7940HS, RAM DDR5, interfacce moderne e un solo problema
Schenker VIA 14 Pro (M24): AMD Ryzen 7 8845HS, 14.00", 1.4 kg
recensione » Recensione dello Schenker VIA 14 Pro (M24) - Subnotebook AMD compatto ora con Ryzen 8000 e display più luminoso
Beelink SER8: AMD Ryzen 7 8845HS, 0.8 kg
recensione » Recensione del PC SER8 di Beelink: Design ispirato al Mac Mini con un AMD Ryzen 7 8845HS
Dell Inspiron 14 7445 2-in-1: AMD Ryzen 7 8840HS, 14.00", 1.7 kg
recensione » Recensione del convertibile 2-in-1 Dell Inspiron 14 7445: Passaggio da Ryzen-U a Ryzen-HS
Aoostar GEM12: AMD Ryzen 7 8845HS, 0.7 kg
recensione » Recensione del Mini-PC Aoostar GEM12: AMD Ryzen 7 8845HS con 32 GB di RAM, 1 TB SSD e interfaccia OCuLink
GPD Win Mini 2024 7": AMD Ryzen 7 8840U, 7.00", 0.5 kg
recensione » Recensione del palmare GPD Win Mini Zen 4: Solida alternativa all'Asus ROG Ally
Geekom A8, R9 8945HS: AMD Ryzen 9 8945HS, 0.4 kg
recensione » Recensione del Geekom A8: Mini-PC premium da 0,5 litri con AMD Ryzen 9 8945HS, 32 GB di RAM DDR5 e 2 TB SSD
Lenovo ThinkPad T16 G2 21K70035GE: AMD Ryzen 7 7840U, 16.00", 1.8 kg
recensione » Recensione del portatile Lenovo ThinkPad T16 G2 AMD: Il grande ThinkPad è ancora migliore con Ryzen 7040
BOSGAME M1: AMD Ryzen 7 7840HS, 0.8 kg
recensione » Recensione del mini PC BOSGAME M1: Ryzen 7 7840HS è ancora una bestia
HP Envy x360 2-in-1 16-ad0097nr: AMD Ryzen 7 8840HS, 16.00", 1.8 kg
recensione » Recensione dell'HP Envy x360 2-in-1 16: Ryzen 7 8840HS batte Core Ultra 7 155U
Asus Zenbook 14 OLED UM3406HA: AMD Ryzen 7 8840HS, 14.00", 1.2 kg
recensione » Recensione dell'Asus Zenbook 14 OLED - La variante AMD dello Zenbook ha ricevuto il più debole schermo OLED 1080p
Minisforum V3: AMD Ryzen 7 8840U, 14.00", 0.9 kg
recensione » Recensione del Minisforum V3 3-in-1: il primo tablet Windows in assoluto con l'APU Hawk Point di AMD, alias AMD Ryzen 7 8840U
Acemagic AM18: AMD Ryzen 7 7840HS, 0.6 kg
recensione » Recensione dell'Acemagic AM18: Mini-PC per il gaming dall'accattivante look cyberpunk con AMD Ryzen 7 7840HS e 32 GB di RAM
GMK NucBox K6: AMD Ryzen 7 7840HS, 0.5 kg
recensione » Recensione del mini PC GMK NucBox K6: Potente come gli ultimi portatili Intel Core Ultra
Lenovo IdeaPad Pro 5 14AHP9: AMD Ryzen 7 8845HS, 14.00", 1.5 kg
recensione » Recensione del portatile Lenovo IdeaPad Pro 5 14AHP9 - Il potente ultraportatile con Ryzen 8000 e OLED a 120 Hz
Minisforum Mercury Series EM780: AMD Ryzen 7 7840U, 0.2 kg
recensione » Recensione Minisforum Mercury Series EM780: Mini-PC estremamente compatto con AMD Ryzen 7 7840U, 32 GB di RAM e 1 TB SSD
Geekom A7: AMD Ryzen 9 7940HS, 0.4 kg
recensione » Recensione del Geekom A7 con case da 0,5l: Mini-PC premium con AMD Ryzen 9 7940HS, 32 GB di RAM DDR5 ed SSD da 2 TB
HP EliteBook 865 G10: AMD Ryzen 9 PRO 7940HS, 16.00", 1.9 kg
recensione » Recensione del laptop HP EliteBook 865 G10 - buon Laptop business capace rovinato dal Sure View
Asus ROG Zephyrus G14 2024 GA403U: AMD Ryzen 9 8945HS
recensione » Test dell'AMD Ryzen 8000 Hawk Point - il refresh della Zen4 supera Meteor Lake nel calcolo dei numeri e nella perfromance della GPU
ONEXPLAYER 2 Pro AR18: AMD Ryzen 7 7840U, 8.40", 0.9 kg
recensione » Recensione del OneXPlayer 2 Pro: palmare gaming, tablet o sganciabile, un dispositivo poliedrico con Ryzen 7
Ayaneo Kun: AMD Ryzen 7 7840U, 8.40", 0.9 kg
recensione » Recensione del palmare gaming Ayaneo Kun: Una bestia da prestazioni per individualisti
Lenovo ThinkPad P16s G2 21K9000CGE: AMD Ryzen 7 PRO 7840U, 16.00", 1.8 kg
recensione » Recensione del Lenovo ThinkPad P16s G2 AMD: Potenza e OLED in questo portatile workstation
Tuxedo Pulse 14 Gen3: AMD Ryzen 7 7840HS, 14.00", 1.4 kg
recensione » Recensione di Tuxedo Pulse 14 Gen3 - L'Ultrabook Linux con AMD Zen4 e un display a 120 Hz
Lenovo ThinkPad P14s G4 21K5000LGE: AMD Ryzen 7 PRO 7840U, 14.00", 1.3 kg
recensione » Recensione del Lenovo ThinkPad P14s G4 AMD: veloce, portatile, lineare
Lenovo ThinkPad Z13 Gen 2: AMD Ryzen 7 PRO 7840U, 13.30", 1.2 kg
recensione » Recensione del portatile ThinkPad Z13 Gen 2: La risposta di Lenovo al Dell XPS 13
Lenovo Legion Go: AMD Ryzen Z1 Extreme, 8.80", 0.8 kg
recensione » Recensione del palmare gaming Lenovo Legion Go: Buona idea, non perfettamente realizzata
Lenovo Yoga Pro 7 14APH G8: AMD Ryzen 7 7840HS, 14.50", 1.5 kg
recensione » Recensione del computer portatile Lenovo Yoga Pro 7 14 G8 - AMD Zen4 non è automaticamente migliore
Lenovo ThinkPad T14 G4 21K4S02000: AMD Ryzen 7 PRO 7840U, 14.00", 1.5 kg
recensione » Recensione del portatile Lenovo ThinkPad T14 G4 AMD: Potenza Ryzen in un compatto ThinkPad
Minisforum EliteMini UM780 XTX: AMD Ryzen 7 7840HS, 0.8 kg
recensione » Recensione del Minisforum EliteMini UM780 XTX: Il mini PC con un AMD Ryzen 7 7840HS e una Radeon 780M è stato dotato di connessioni OCuLink e USB-4
HP Pavilion Plus 14-ey0095cl: AMD Ryzen 7 7840U, 14.00", 1.4 kg
recensione » Recensione del portatile HP Pavilion Plus 14 Ryzen 7: Cambiamenti nei punti giusti
Lenovo ThinkPad T14s G4-21F8002TGE: AMD Ryzen 7 7840U, 14.00", 1.4 kg
recensione » Recensione del Lenovo ThinkPad T14s G4: laptop business migliore con AMD Zen4
Lenovo Yoga Slim 7 14APU G8: AMD Ryzen 7 7840S, 14.50", 1.3 kg
recensione » Recensione del Lenovo Yoga Slim 7 14 G8 AMD - La CPU Zen4 personalizzata incontra un ottimo OLED da 2,9K
Ayaneo Air 1S Retro Power : AMD Ryzen 7 7840U, 5.50", 0.4 kg
recensione » Recensione del palmare gaming Ayaneo Air 1S Retro Power
Acer Swift Edge SFE16 Ryzen 7 7840U: AMD Ryzen 7 7840U, 16.00", 1.2 kg
recensione » Recensione del portatile Acer Swift Edge 16 Ryzen 7 7840U: CPU Zen 4 e OLED da 3,2K 120 Hz
Framework Laptop 13.5 Ryzen 7 7840U: AMD Ryzen 7 7840U, 13.50", 1.3 kg
recensione » Recensione del portatile 13,5 Ryzen 7 7840U: Molto meglio della versione Intel
HP EliteBook 845 G10 5Z4X0ES: AMD Ryzen 7 7840U, 14.00", 1.5 kg
recensione » Recensione di HP EliteBook 845 G10: Il portatile business convince con AMD Ryzen 7 7840U e un prezzo imbattibile
Beelink SER7: AMD Ryzen 7 7840HS, 0.6 kg
recensione » Recensione del mini PC Beelink SER7: Ryzen 7 7840HS con raffreddamento a camera di vapore
HP EliteBook 845 G10 818N0EA: AMD Ryzen 9 PRO 7940HS, 14.00", 1.5 kg
recensione » Recensione dell'HP EliteBook 845 G10: portatile business quasi perfetto con AMD Zen4
recensione » Test delle prestazioni delle iGPU AMD Radeon 780M e 760M con i nuovi driver
Minisforum Venus Series UM790 Pro: AMD Ryzen 9 7940HS, 0.7 kg
recensione » Recensione del Minisforum Venus Series UM790 Pro: Migliore dei suoi concorrenti grazie a un AMD Ryzen 9 7940HS e a una Radeon 780M
Beelink GTR7 7840HS: AMD Ryzen 7 7840HS, 0.9 kg
recensione » Recensione del mini PC Beelink GTR7: Debutto delle prestazioni di AMD Ryzen 7 7840HS
Asus ROG Ally Z1 Extreme: AMD Ryzen Z1 Extreme, 7.00", 0.6 kg
recensione » Recensione dell'Asus ROG Ally Z1 Extreme - Palmare gaming con display da 120 Hz e AMD Zen4
Asus ROG Zephyrus G14 GA402XY: AMD Ryzen 9 7940HS, 14.00"
recensione » Analisi dell'iGPU AMD Radeon 780M - La nuova GPU RDNA-3 di AMD sfida la concorrenza
recensione » Analisi di AMD Ryzen 9 7940HS - Zen4 Phoenix è idealmente efficiente quanto Apple
Asus ROG Ally X: AMD Ryzen Z1 Extreme
Recensioni esterne » Asus ROG Ally X - Recensioni e Specifiche
HP ProBook 4 G1a 14: AMD Ryzen 7 250, 14.00", 1.4 kg
Recensioni esterne » HP ProBook 4 G1a 14
Lenovo IdeaPad Slim 3 15AHP10: AMD Ryzen 7 8840HS, 15.30", 1.6 kg
Recensioni esterne » Lenovo IdeaPad Slim 3 15AHP10
Acer TravelMate P4 TMP414-42: AMD Ryzen 7 8840U, 14.00", 1.5 kg
Recensioni esterne » Acer TravelMate P4 TMP414-42
HP EliteBook 8 G1a 14 AD3E9ET: AMD Ryzen 7 250, 14.00", 1.4 kg
Recensioni esterne » HP EliteBook 8 G1a 14
HP Omnibook 5 16-bc1000: AMD Ryzen 7 8840U, 16.00", 1.8 kg
Recensioni esterne » HP Omnibook 5 16-bc1000
HP EliteBook 865 G11: AMD Ryzen 7 8840U, 1.00", 1.9 kg
Recensioni esterne » HP EliteBook 865 G11
Lenovo ThinkPad T14 G4 21K4S02000: AMD Ryzen 7 PRO 7840U, 14.00", 1.5 kg
Recensioni esterne » Lenovo ThinkPad T14 G4 21K4S02000
Lenovo IdeaPad 5 16AHP9: AMD Ryzen 7 8845HS, 16.00", 1.9 kg
Recensioni esterne » Lenovo IdeaPad 5 16AHP9
Asus Vivobook S 15 OLED M5506UA: AMD Ryzen 7 8845HS, 15.60", 1.5 kg
Recensioni esterne » Asus Vivobook S 15 OLED M5506UA
Acer Nitro Blaze 11: AMD Ryzen 7 8840HS, 10.95", 1.1 kg
Recensioni esterne » Acer Nitro Blaze 11
Lenovo IdeaPad 5 2-in-1 14AHP9, R7 8845HS: AMD Ryzen 7 8845HS, 14.00", 1.6 kg
Recensioni esterne » Lenovo IdeaPad 5 2-in-1 14AHP9, R7 8845HS
Acer Nitro Blaze 7: AMD Ryzen 7 8840HS, 7.00", 0.7 kg
Recensioni esterne » Acer Nitro Blaze 7
HP EliteBook 845 G11: AMD Ryzen 7 PRO 8840HS, 14.00", 1.5 kg
Recensioni esterne » HP EliteBook 845 G11
Acer Swift Go 14 SFG14-63, R7 8845HS: AMD Ryzen 7 8845HS, 14.00", 1.3 kg
Recensioni esterne » Acer Swift Go 14 SFG14-63, R7 8845HS
Lenovo ThinkPad T14 G5: AMD Ryzen 7 8840U, 14.00", 1.4 kg
Recensioni esterne » Lenovo ThinkPad T14 G5
Acer Aspire 15 A15-41M: AMD Ryzen 7 8840HS, 15.60", 1.7 kg
Recensioni esterne » Acer Aspire 15 A15-41M
Honor MagicBook X16 Plus 2024: AMD Ryzen 7 8845HS, 16.00", 1.8 kg
Recensioni esterne » Honor MagicBook X16 Plus 2024
Acer Swift Edge SFE16-44: AMD Ryzen 7 8840U, 16.00", 1.2 kg
Recensioni esterne » Acer Swift Edge SFE16-44
HP Envy x360 14-fa0000: AMD Ryzen 7 8840HS, 14.00", 1.4 kg
Recensioni esterne » HP Envy x360 14-fa0000
HP Pavilion Aero 13-bg0000: AMD Ryzen 7 8840HS, 13.30", 1 kg
Recensioni esterne » HP Pavilion Aero 13-bg0000
Lenovo Yoga 7 14AHP9: AMD Ryzen 7 8840HS, 14.00", 1.5 kg
Recensioni esterne » Lenovo Yoga 7 14AHP9
Dell Inspiron 14 7445 2-in-1: AMD Ryzen 7 8840HS, 14.00", 1.7 kg
Recensioni esterne » Dell Inspiron 14 7445 2-in-1
Asus Vivobook S 14 OLED M5406UA: AMD Ryzen 7 8845HS, 14.00", 1.3 kg
Recensioni esterne » Asus Vivobook S 14 OLED M5406UA
Asus VivoBook S 14 OLED S5406UA: AMD Ryzen 9 8945HS, 14.00", 1.3 kg
Recensioni esterne » Asus VivoBook S 14 OLED S5406UA
Asus ROG Ally X: AMD Ryzen Z1 Extreme, 7.00", 0.7 kg
Recensioni esterne » Asus ROG Ally X
Lenovo ThinkPad T16 G2 21K70035GE: AMD Ryzen 7 7840U, 16.00", 1.8 kg
Recensioni esterne » Lenovo ThinkPad T16 G2 21K70035GE
HP Envy x360 2-in-1 16-ad0097nr: AMD Ryzen 7 8840HS, 16.00", 1.8 kg
Recensioni esterne » HP Envy x360 2-in-1 16-ad0097nr
HP ZBook Firefly 14 G10, R7 7840HS: AMD Ryzen 7 7840HS, 14.00", 1.5 kg
Recensioni esterne » HP ZBook Firefly 14 G10, R7 7840HS
Asus Zenbook 14 OLED UM3406HA: AMD Ryzen 7 8840HS, 14.00", 1.2 kg
Recensioni esterne » Asus Zenbook 14 OLED UM3406HA
HP EliteBook 865 G10, R7 PRO 7840U: AMD Ryzen 7 PRO 7840U, 16.00", 1.8 kg
Recensioni esterne » HP EliteBook 865 G10, R7 PRO 7840U
Lenovo ThinkPad P14s G4 21K5000LGE: AMD Ryzen 7 PRO 7840U, 14.00", 1.3 kg
Recensioni esterne » Lenovo ThinkPad P14s G4 21K5000LGE
HP EliteBook 865 G10: AMD Ryzen 9 PRO 7940HS, 16.00", 1.9 kg
Recensioni esterne » HP EliteBook 865 G10
Lenovo IdeaPad Pro 5 16APH8: AMD Ryzen 7 7840HS, 16.00", 1.9 kg
Recensioni esterne » Lenovo IdeaPad Pro 5 16APH8
Lenovo IdeaPad Pro 5 14AHP9: AMD Ryzen 7 8845HS, 14.00", 1.5 kg
Recensioni esterne » Lenovo IdeaPad Pro 5 14AHP9
HP EliteBook 845 G10 5Z4X0ES: AMD Ryzen 7 7840U, 14.00", 1.5 kg
Recensioni esterne » HP EliteBook 845 G10 5Z4X0ES
Lenovo ThinkPad Z13 Gen 2: AMD Ryzen 7 PRO 7840U, 13.30", 1.2 kg
Recensioni esterne » Lenovo ThinkPad Z13 Gen 2
HP ZBook Firefly 14 G10: AMD Ryzen 9 PRO 7940HS, 14.00", 1.5 kg
Recensioni esterne » HP ZBook Firefly 14 G10
Asus ROG Ally Z1 Extreme: AMD Ryzen Z1 Extreme, 7.00", 0.6 kg
Recensioni esterne » Asus ROG Ally Z1 Extreme
Schenker VIA 14 Pro (L23): AMD Ryzen 7 PRO 7840HS, 14.00", 1.4 kg
Recensioni esterne » SCHENKER VIA 14 Pro (L23)
Lenovo ThinkPad T14s G4-21F8002TGE: AMD Ryzen 7 7840U, 14.00", 1.4 kg
Recensioni esterne » Lenovo ThinkPad T14s G4-21F8002TGE
HP Pavilion Plus 14-ey0095cl: AMD Ryzen 7 7840U, 14.00", 1.4 kg
Recensioni esterne » HP Pavilion Plus 14-ey0095cl
Acer Swift Edge SFE16 Ryzen 7 7840U: AMD Ryzen 7 7840U, 16.00", 1.2 kg
Recensioni esterne » Acer Swift Edge SFE16 Ryzen 7 7840U
Lenovo Yoga Pro 7 14APH G8: AMD Ryzen 7 7840HS, 14.50", 1.5 kg
Recensioni esterne » Lenovo Yoga Pro 7 14APH8
Lenovo IdeaPad 5 Pro 16APH8: AMD Ryzen 7 7840HS, 16.00", 1.9 kg
Recensioni esterne » Lenovo IdeaPad 5 Pro 16APH8
Lenovo Legion Go: AMD Ryzen Z1 Extreme, 8.80", 0.8 kg
Recensioni esterne » Lenovo Legion Go
Xiaomi RedmiBook Pro 15 2023: AMD Ryzen 7 7840HS, 15.60", 1.8 kg
Recensioni esterne » Xiaomi RedmiBook Pro 15 2023
Acer Swift Edge SFE16-43: AMD Ryzen 7 7840U, 16.00", 1.3 kg
Recensioni esterne » Acer Swift Edge SFE16-43
Lenovo Yoga Slim 6 14APU8 7840U: AMD Ryzen 7 7840U, 14.00", 1.4 kg
Recensioni esterne » Lenovo Yoga Slim 6
Acemagic AM18: AMD Ryzen 7 7840HS, 0.6 kg
» Anniversario Acemagic 2026: grande campagna di sconti su mini PC, computer portatili e sistemi NAS
Alliwava GH8, R9 8945HS: AMD Ryzen 9 8945HS, 0.5 kg
» Recensione del Mini-PC Alliwava GH8: Il modello top con la potenza di AMD Ryzen 9 attacca Minisforum, Geekom & Co
Geekom A7 Max, R9 7940HS: AMD Ryzen 9 7940HS, 0.7 kg
» Mini PC con AMD Ryzen 9: Geekom A7 Max Edition 2026 vale la pena?
Dynabook Tecra A60 A65-M: AMD Ryzen 7 250, 16.00", 1.7 kg
» Dynabook Tecra A65-M mostra l'importanza della RAM a doppio canale per le prestazioni della grafica integrata
» Questo unico svantaggio fa crollare il nuovo Dynabook Tecra A65-M
Minisforum AI X1, Ryzen 7 255: AMD Ryzen 7 255, 0.7 kg
» Minisforum AI X1 inizia in modo economico: Mini PC con AMD Ryzen 7 255 e altoparlanti integrati recensito
Geekom A8, R7 8745HS: AMD Ryzen 7 8745HS, 0.4 kg
» Geekom A8 con Ryzen 7 8745HS: il mini-PC vale la pena?
HP EliteBook 8 G1a 14 AD3E9ET: AMD Ryzen 7 250, 14.00", 1.4 kg
» Il ritorno di un vecchio standard: HP reintroduce la porta RJ45-Ethernet in molti modelli aziendali
GMK NucBox K12: AMD Ryzen 7 H 255, 0.9 kg
» Il design del GMK NucBox K12 ha un piccolo ma fastidioso difetto
» Il nuovo Ryzen 7 H 255 ha prestazioni quasi identiche a quelle del Ryzen 7 7840HS di 3 anni fa
Lenovo ThinkPad E14 Gen 7 21T0003NGE: AMD Ryzen 7 250, 14.00", 1.5 kg
» Finalmente con i processori AMD Zen 4, ma ancora una generazione indietro: ThinkPad E14 Gen 7 AMD di Lenovo migliore che mai
Peladn HA-4, R7 7840HS: AMD Ryzen 7 7840HS, 1 kg
» L'elegante mini PC Ryzen 7 in prova - Peladn HA-4 ottiene il massimo dell'efficienza e l'illuminazione RGB
Beelink SER9 Pro: AMD Ryzen 7 H 255, 0.8 kg
» Ryzen 7 H 255 è un rebadged di Ryzen 7 8845HS nei primi benchmark
Minisforum EliteMini UM890 Pro: AMD Ryzen 9 8945HS, 0.7 kg
» Minisforum EliteMini UM890 Pro: Il mini PC perfetto con APU AMD Ryzen 9?
Framework Laptop 13.5 Ryzen 7 7840U: AMD Ryzen 7 7840U, 13.50", 1.3 kg
» Framework 12 è stato annunciato come laptop 2-in-1 'entry-level' riparabile con un design robusto
Lenovo ThinkPad P14s G5 21ME000TGE: AMD Ryzen 7 PRO 8840HS, 14.00", 1.4 kg
» Maturo per Strix Halo: la prossima versione del ThinkPad P14s AMD ha bisogno di Ryzen AI Max
» Disparità di trattamento: Come Lenovo peggiora la variante AMD del ThinkPad P14s Gen 5
Lenovo Legion Go: AMD Ryzen Z1 Extreme, 8.80", 0.8 kg
» I controller Lenovo Legion Go 2 saranno retrocompatibili con Legion Go e saranno disponibili per l'acquisto "presto"
HP EliteBook 845 G11: AMD Ryzen 7 PRO 8840HS, 14.00", 1.5 kg
» L'EliteBook 845 di HP è uno dei migliori computer portatili business, ma le prestazioni di raffreddamento sono ancora un punto debole
Asus Zenbook 14 OLED UM3406HA: AMD Ryzen 7 8840HS, 14.00", 1.2 kg
» 2025 I notebook Asus Zenbook 14 OLED sono ora dotati di APU Intel Core Ultra 200H e Ryzen AI 300
Asus ROG Ally X: AMD Ryzen Z1 Extreme, 7.00", 0.7 kg
» MSI Claw 8 AI+ vs Rog Ally X: Secondo quanto riferito, l'APU Lunar Lake consente a MSI di colmare il divario in termini di prestazioni e durata della batteria
Asus ROG Ally Z1 Extreme: AMD Ryzen Z1 Extreme, 7.00", 0.6 kg
» MSI Claw 8 AI+ vs Rog Ally X: Secondo quanto riferito, l'APU Lunar Lake consente a MSI di colmare il divario in termini di prestazioni e durata della batteria
Lenovo Legion Go: AMD Ryzen Z1 Extreme, 8.80", 0.8 kg
» MSI Claw 8 AI+ vs Rog Ally X: Secondo quanto riferito, l'APU Lunar Lake consente a MSI di colmare il divario in termini di prestazioni e durata della batteria
Ayaneo Air 1S Retro Power : AMD Ryzen 7 7840U, 5.50", 0.4 kg
» Console portatile Ayaneo Flip KB: funzionalità eccellente, prestazioni di fascia media
Ayaneo Flip KB: AMD Ryzen 7 8840U, 7.00", 0.7 kg
» Console portatile Ayaneo Flip KB: funzionalità eccellente, prestazioni di fascia media
Ayaneo Kun: AMD Ryzen 7 7840U, 8.40", 0.9 kg
» Console portatile Ayaneo Flip KB: funzionalità eccellente, prestazioni di fascia media
GPD Win Mini 2024 7": AMD Ryzen 7 8840U, 7.00", 0.5 kg
» GPD svela i prezzi di Pocket 4: In arrivo un portatile ultraportatile alimentato da AMD
Asus ROG Ally X: AMD Ryzen Z1 Extreme, 7.00", 0.7 kg
» SteamOS si avvicina ai palmari di terze parti con il display Asus ROG Ally e il supporto VRR in Gamescope
Framework Laptop 13.5 Ryzen 7 7840U: AMD Ryzen 7 7840U, 13.50", 1.3 kg
» Framework Laptop Brick System espande il notebook con piedini Lego, ruote, supporti per cavi e altro ancora..
Minisforum Mercury Series EM780: AMD Ryzen 7 7840U, 0.2 kg
» Minisforum Mercury Series EM780 racchiude un AMD Ryzen 7 7840U e 32 GB di RAM DDR5 in uno chassis da 1/4 di litro
Lenovo ThinkPad P16s G2 21K9000CGE: AMD Ryzen 7 PRO 7840U, 16.00", 1.8 kg
» Veloce, luminoso, pratico: il Lenovo ThinkPad P16s G2 AMD con Ryzen 7 e una Radeon 780M recensito
Asus ROG Ally Z1 Extreme: AMD Ryzen Z1 Extreme, 7.00", 0.6 kg
» ASUS ROG Ally: l'esecutivo conferma che i gamers possono rinunciare al recente e problematico aggiornamento del BIOS
» ASUS ROG Ally: aperti i preordini, seguirà il modello AMD Ryzen Z1 più economico