Notebookcheck Logo

NVIDIA GeForce RTX 4050 Laptop GPU

NVIDIA NVIDIA GeForce RTX 4050 Laptop GPU

La GPU per laptop NVIDIA GeForce RTX 4050 (nome in codice GN21-X2) è una GPU per laptop di fascia media. Si basa sul chip AD107 e utilizza l'architettura Ada Lovelace. Il laptop RTX 4050 offre 2560 shader e utilizza 6 GB di memoria grafica dedicata GDDR6 con una velocità di clock di 16 Gbps (effettivi) e un bus di memoria a 96 Bit. Il TGP (Total Graphics Power) può essere configurato tra 35 e 115 Watt (+ 10-25 Watt Dynamic Boost dalla CPU) portando a diversi livelli di prestazioni. Il boost clock dipende dalle impostazioni del TGP e varia da 1605 MHz (35 Watt) a 2370 MHz (115 Watt). Le prestazioni quindi dipendono fortemente anche dalle impostazioni del laptop e del TDP.

Nei nostri benchmark, l'RTX 4050 rimane leggermente indietro rispetto alla vecchia RTX 3060 mobile, ma è chiaramente più veloce della RTX 3050 Ti mobile. Pertanto, è più adatto per i giochi 1920x1080 con impostazioni da alte a ultra a seconda del gioco (vedere benchmark sotto).

L'RTX 4050 offre 80 tensor cores e quindi supporta DLSS 3 inclusa la generazione di frame che può avere un grande impatto nei giochi supportati. I cores raytracing, tuttavia, verranno utilizzati meno, in quanto l'RTX 4050 non offre prestazioni sufficienti per impostazioni di dettaglio elevate e raytracing nei giochi impegnativi.

Il chip AD107 è prodotto in 5 nm presso TSMC (processo 4N).

GeForce RTX 4000 Laptop GPU Serie

NVIDIA GeForce RTX 4090 Laptop GPU 9728 @ 2.04 GHz256 Bit @ 20000 MHz
NVIDIA GeForce RTX 4080 Laptop GPU 7424 @ 1.86 - 2.28 GHz192 Bit @ 20000 MHz
NVIDIA GeForce RTX 4070 Laptop GPU 4608 @ 1.61 - 2.18 GHz128 Bit @ 16000 MHz
NVIDIA GeForce RTX 4060 Laptop GPU 3072 @ 2.37 GHz128 Bit @ 16000 MHz
NVIDIA GeForce RTX 4050 Laptop GPU 2560 @ 2.37 GHz96 Bit @ 16000 MHz
Nome in codiceGN21-X2
ArchitetturaAda Lovelace
Pipelines2560 - unified
TMUs80
ROPs32
Raytracing Cores20
Tensor / AI Cores80
Velocità del core2370 (Boost) MHz
Theoretical Performance9 TFLOPS FP32, 0.14 TFLOPS FP64
CacheL2: 12 MB
Velocità della memoria16000 effective = 2000 MHz
Larghezza del bus di memoria96 Bit
Tipo di memoriaGDDR6
Max. quantità di memoria6 GB
Memoria condivisano
Memory Bandwidth192 GB/s
APIDirectX 12 Ultimate, Shader 6.7, OpenGL 4.6, OpenCL 3.0, Vulkan 1.3
Consumo di corrente115 Watt (35 - 115 Watt TGP)
tecnologia5 nm
PCIe4.0 x16
Displays4 Displays (max.), HDMI 2.1, DisplayPort 1.4a
Dimensione del portatilegrande
Data dell'annuncio03.01.2023
Link alla pagina del produttorewww.nvidia.com
PredecessorGeForce RTX 3050 4GB Laptop GPU

Benchmark

Performance Rating - 3DMark 11 + Fire Strike + Time Spy
10.1 pt (30%)
3DMark - 3DMark Time Spy Score
min: 5395     media: 7975     media: 8555.5 (25%)     massimo: 9236 Points
3DMark - 3DMark Time Spy Graphics
min: 5107     media: 7763     media: 8225.5 (22%)     massimo: 9040 Points
3DMark - 3DMark Ice Storm Unlimited Graphics
min: 544225     media: 552112     media: 552112 (63%)     massimo: 559999 Points
3DMark - 3DMark Cloud Gate Score
min: 25240     media: 50084     media: 52806.5 (56%)     massimo: 65111 Points
3DMark - 3DMark Cloud Gate Graphics
min: 51138     media: 126241     media: 136776 (36%)     massimo: 161152 Points
3DMark - 3DMark Fire Strike Standard Score
min: 12382     media: 18429     media: 19609.5 (35%)     massimo: 21537 Points
3DMark - 3DMark Fire Strike Standard Graphics
min: 13591     media: 21045     media: 22194 (25%)     massimo: 24007 Points
3DMark - 3DMark Ice Storm Graphics
min: 150943     media: 301370     media: 303129 (36%)     massimo: 433961 Points
3DMark - 3DMark Wild Life Unlimited
min: 46236     media: 50214     media: 50213.5 (25%)     massimo: 54191 Points
3DMark - 3DMark Wild Life Extreme Unlimited
min: 9394     media: 13655     media: 13488 (16%)     massimo: 16529 Points
3DMark - 3DMark Night Raid
min: 41436     media: 45517     media: 44735 (42%)     massimo: 51162 Points
3DMark - 3DMark Night Raid Graphics Score
min: 68530     media: 87295     media: 90323.5 (35%)     massimo: 100002 Points
3DMark 11 - 3DM11 Performance Score
min: 13881     media: 25107     media: 27008 (37%)     massimo: 29150 Points
3DMark 11 - 3DM11 Performance GPU
min: 13339     media: 28539     media: 30513.5 (26%)     massimo: 32642 Points
3DMark Vantage
3DM Vant. Perf. total +
3DM Vant. Perf. GPU no PhysX +
3DMark 06 3DMark 06 - Standard 1280x1024 +
3DMark 06
min: 43233     media: 48996     media: 50886 (66%)     massimo: 52966 Points
Blender - Blender 3.3 Classroom CUDA *
min: 47     media: 56.7     media: 52 (8%)     massimo: 175 Seconds
Blender - Blender 3.3 Classroom OPTIX *
min: 25     media: 29     media: 28 (10%)     massimo: 37 Seconds
Blender - Blender 3.3 Classroom HIP *
345 Seconds (28%)
SPECviewperf 13 specvp13 sw-04 +
SPECviewperf 13 - specvp13 sw-04
93.4 fps (25%)
specvp13 snx-03 +
specvp13 showcase-02 +
specvp13 medical-02 +
SPECviewperf 13 - specvp13 medical-02
59.9 fps (13%)
specvp13 maya-05 +
specvp13 energy-02 +
specvp13 creo-02 +
SPECviewperf 13 - specvp13 creo-02
173 fps (25%)
specvp13 catia-05 +
SPECviewperf 13 - specvp13 catia-05
124.6 fps (14%)
specvp13 3dsmax-06 +
SPECviewperf 2020 specvp2020 solidworks-05 1080p +
SPECviewperf 2020 - specvp2020 solidworks-05 1080p
min: 177.8     media: 184     media: 186 (36%)     massimo: 188.3 fps
specvp2020 snx-04 1080p +
SPECviewperf 2020 - specvp2020 snx-04 1080p
min: 18.3     media: 20.3     media: 20.7 (3%)     massimo: 21.4 fps
specvp2020 medical-03 1080p +
SPECviewperf 2020 - specvp2020 medical-03 1080p
min: 25.7     media: 28.3     media: 28.6 (29%)     massimo: 30.1 fps
specvp2020 maya-06 1080p +
SPECviewperf 2020 - specvp2020 maya-06 1080p
min: 281.4     media: 307.3     media: 307 (45%)     massimo: 333.9 fps
specvp2020 energy-03 1080p +
SPECviewperf 2020 - specvp2020 energy-03 1080p
min: 28.2     media: 29.2     media: 29 (23%)     massimo: 30.7 fps
specvp2020 creo-03 1080p +
SPECviewperf 2020 - specvp2020 creo-03 1080p
min: 79.3     media: 87.3     media: 87.8 (43%)     massimo: 94.5 fps
specvp2020 catia-06 1080p +
SPECviewperf 2020 - specvp2020 catia-06 1080p
min: 47.9     media: 49.3     media: 49.4 (32%)     massimo: 50.7 fps
specvp2020 3dsmax-07 1080p +
SPECviewperf 2020 - specvp2020 3dsmax-07 1080p
min: 76.2     media: 78.2     media: 78.4 (36%)     massimo: 79.7 fps
specvp2020 solidworks-05 4k +
specvp2020 snx-04 4k +
specvp2020 medical-03 4k +
SPECviewperf 2020 - specvp2020 medical-03 4k
9.2 fps (9%)
specvp2020 maya-06 4k +
specvp2020 energy-03 4k +
specvp2020 creo-03 4k +
specvp2020 catia-06 4k +
SPECviewperf 2020 - specvp2020 catia-06 4k
27.9 fps (18%)
specvp2020 3dsmax-07 4k +
Cinebench R10 Cinebench R10 Shading (32bit) +
Cinebench R10 - Cinebench R10 Shading (32bit)
min: 14167     media: 16109     media: 16035 (11%)     massimo: 18124 punti
Cinebench R11.5 Cinebench R11.5 OpenGL 64 Bit +
Cinebench R11.5 - Cinebench R11.5 OpenGL 64 Bit
min: 102.32     media: 147.9     media: 159.9 (55%)     massimo: 169.44 fps
Cinebench R15
Cinebench R15 OpenGL 64 Bit +
Cinebench R15 - Cinebench R15 OpenGL 64 Bit
min: 141.3     media: 196.1     media: 192 (11%)     massimo: 270 fps
Cinebench R15 OpenGL Ref. Match 64 Bit +
Cinebench R15 - Cinebench R15 OpenGL Ref. Match 64 Bit
99.6 % (100%)
GFXBench - GFXBench 5.0 4K Aztec Ruins High Tier Offscreen
90 fps (37%)
GFXBench - GFXBench 5.0 Aztec Ruins High Tier Offscreen
208 fps (38%)
3.3 -98%
...
Apple M3 10-Core GPU
118.5 -43%
Apple M1 Pro 14-Core GPU
147 -29%
153 -26%
161.4 -22%
Apple M1 Pro 16-Core GPU
166 -20%
178.7 -14%
181.1 -13%
185.4 -11%
187 -10%
NVIDIA GeForce RTX 4050 Laptop GPU
208
210.6 1%
219.7 6%
Apple M1 Max 24-Core GPU
240 15%
242.3 16%
248.5 19%
261.5 26%
288.5 39%
Apple M1 Max 32-Core GPU
309.4 49%
326.1 57%
...
536 158%
0%
100%
GFXBench - GFXBench 5.0 Aztec Ruins Normal Tier Offscreen
568 fps (42%)
GFXBench - GFXBench Car Chase Offscreen
470 fps (53%)
GFXBench 3.1 - GFXBench Manhattan ES 3.1 Offscreen
592 fps (13%)
GFXBench 3.0 - GFXBench 3.0 Manhattan Offscreen
801 fps (47%)
GFXBench (DX / GLBenchmark) 2.7
GFXBench T-Rex HD Offscreen C24Z16 +
GFXBench (DX / GLBenchmark) 2.7 - GFXBench T-Rex HD Offscreen C24Z16
2143 fps (17%)
Basemark GPU 1.2 - Basemark GPU 1.2 Vulkan Official Medium Offscreen 1080
min: 61.3     media: 218.4     media: 228 (1%)     massimo: 884 fps
Basemark GPU 1.2 - Basemark GPU 1.2 Vulkan Official High Offscreen 2160
min: 3.64     media: 7.2     media: 3.6 (1%)     massimo: 17.9 fps
Geekbench 6.2 - Geekbench 6.2 GPU OpenCL
min: 60815     media: 78903     media: 80921 (23%)     massimo: 86892 punti
Geekbench 6.2 - Geekbench 6.2 GPU Vulkan
min: 4454     media: 47132     media: 34832.5 (11%)     massimo: 82430 punti
ComputeMark v2.1 - ComputeMark v2.1 Result
16302 punti (18%)
Power Consumption - Furmark Stress Test Power Consumption - external Monitor *
min: 54.3     media: 125.2     media: 127.8 (18%)     massimo: 276 Watt
0153045607590105120135150165180195210225240255270285Tooltip
Power Consumption - The Witcher 3 Power Consumption - external Monitor *
min: 61.9     media: 125.1     media: 134 (19%)     massimo: 244 Watt
0153045607590105120135150165180195210225240Tooltip
Power Consumption - Witcher 3 Power Consumption *
min: 65.6     media: 127.7     media: 129.5 (28%)     massimo: 265 Watt
020406080100120140160180200220240260280300Tooltip
Power Consumption - Witcher 3 ultra Power Efficiency
min: 0.2415     media: 0.6     media: 0.6 (60%)     massimo: 0.845 fps per Watt
Power Consumption - Witcher 3 ultra Power Efficiency - external Monitor
min: 0.2623     media: 0.6     media: 0.6 (51%)     massimo: 0.874 fps per Watt
Emissions Witcher 3 Fan Noise +
Emissions - Witcher 3 Fan Noise
min: 32.1     media: 46.2     media: 46 (74%)     massimo: 55.4 dB(A)
Clock Speed - GPU Clock Witcher 3 ultra
min: 2340     media: 2451     media: 2415 (95%)     massimo: 2550 MHz
- Valori di benchmark per questa scheda grafica
- Valori medi di benchmark per questa scheda grafica
* Numeri più piccoli rappresentano prestazioni supeiori

Benchmarks per i giochi

I seguenti benchmarks deirivano dai benchmarks dei portatili recensiti. Le prestazioni dipendono dalla scheda grafica utilizzata, dal clock rate, dal processore, dai settaggi di sistema, dai drivers, e dai sistemi operativi. Quindi i risultati non sono rappresentativi per i portatili con questa GPU. Per informazioni dettagliate sui risultati del benchmark, cliccate sul numero di fps.

Dragon's Dogma 2

Dragon's Dogma 2

2024
basso 1920x1080
62.2  fps    + Confronta + 📈 Graph
alto 1920x1080
52.9  fps    + Confronta + 📈 Graph
QHD 2560x1440
36  fps    + Confronta
4K 3840x2160
18.4  fps    + Confronta + 📈 Graph
3840x2160
19.5  fps    + Confronta + 📈 Graph
» Giocabile con tutti i portatili testati con dettagli alto.
Horizon Forbidden West

Horizon Forbidden West

2024
medio 1920x1080
75.7  fps    + Confronta + 📈 Graph
alto 1920x1080
51.9  fps    + Confronta + 📈 Graph
ultra 1920x1080
45  fps    + Confronta + 📈 Graph
QHD 2560x1440
31.6  fps    + Confronta + 📈 Graph
4K 3840x2160
18.6  fps    + Confronta + 📈 Graph
3840x2160
22.1  fps    + Confronta + 📈 Graph
» Giocabile con tutti i portatili testati con dettagli ultra.
Alone in the Dark

Alone in the Dark

2024
basso 1920x1080
173  fps    + Confronta
medio 1920x1080
157  fps    + Confronta
alto 1920x1080
137  fps    + Confronta
ultra 1920x1080
54  fps    + Confronta
QHD 2560x1440
31  fps    + Confronta
4K 3840x2160
7  fps    + Confronta
3840x2160
20  fps    + Confronta
» Giocabile con tutti i portatili testati con dettagli ultra.
Last Epoch

Last Epoch

2024
medio 1920x1080
148.4  fps    + Confronta + 📈 Graph
alto 1920x1080
122.8  fps    + Confronta + 📈 Graph
ultra 1920x1080
90.4  fps    + Confronta + 📈 Graph
QHD 2560x1440
48.2  fps    + Confronta + 📈 Graph
4K 3840x2160
25.6  fps    + Confronta + 📈 Graph
» Giocabile con tutti i portatili testati con dettagli ultra.
Skull & Bones

Skull & Bones

2024
medio 1920x1080
93  fps    + Confronta
alto 1920x1080
76  fps    + Confronta
ultra 1920x1080
57  fps    + Confronta
QHD 2560x1440
42  fps    + Confronta
4K 3840x2160
21  fps    + Confronta
3840x2160
37  fps    + Confronta
» Giocabile con tutti i portatili testati con dettagli ultra.
Helldivers 2

Helldivers 2

2024
basso 1920x1080
106.5  fps    + Confronta + 📈 Graph
medio 1920x1080
82.2  fps    + Confronta + 📈 Graph
alto 1920x1080
74.4  fps    + Confronta + 📈 Graph
ultra 1920x1080
72.1  fps    + Confronta + 📈 Graph
QHD 2560x1440
44.5  fps    + Confronta + 📈 Graph
4K 3840x2160
17.8  fps    + Confronta + 📈 Graph
» Giocabile con tutti i portatili testati con dettagli ultra.
Enshrouded

Enshrouded

2024
medio 1920x1080
45.8 58.6 ~ 52 fps    + Confronta + 📈 Graph
alto 1920x1080
45.1 47.2 ~ 46 fps    + Confronta + 📈 Graph
ultra 1920x1080
37.3 37.7 ~ 38 fps    + Confronta + 📈 Graph
QHD 2560x1440
28  fps    + Confronta + 📈 Graph
4K 3840x2160
16.2  fps    + Confronta + 📈 Graph
3840x2160
26.5  fps    + Confronta + 📈 Graph
» Giocabile con tutti i portatili testati con dettagli ultra.
Palworld

Palworld

2024
medio 1920x1080
93.3 99.1 ~ 96 fps    + Confronta + 📈 Graph
alto 1920x1080
72.5 76.3 ~ 74 fps    + Confronta + 📈 Graph
ultra 1920x1080
71.9 74.9 ~ 73 fps    + Confronta + 📈 Graph
QHD 2560x1440
50.6  fps    + Confronta + 📈 Graph
4K 3840x2160
26  fps    + Confronta + 📈 Graph
3840x2160
36.3  fps    + Confronta + 📈 Graph
» Giocabile con tutti i portatili testati con dettagli ultra.
Prince of Persia The Lost Crown

Prince of Persia The Lost Crown

2024
medio 1920x1080
352 358 ~ 355 fps    + Confronta + 📈 Graph
alto 1920x1080
350 357 ~ 354 fps    + Confronta + 📈 Graph
ultra 1920x1080
349 353 ~ 351 fps    + Confronta + 📈 Graph
QHD 2560x1440
290  fps    + Confronta
4K 3840x2160
127.1  fps    + Confronta + 📈 Graph
» Giocabile con tutti i portatili testati con dettagli ultra.
Ready or Not

Ready or Not

2023
medio 1920x1080
148.3 198.1 ~ 173 fps    + Confronta + 📈 Graph
alto 1920x1080
134.2 155.4 ~ 145 fps    + Confronta + 📈 Graph
ultra 1920x1080
95.1 107.1 ~ 101 fps    + Confronta + 📈 Graph
QHD 2560x1440
56.6  fps    + Confronta + 📈 Graph
4K 3840x2160
26  fps    + Confronta + 📈 Graph
3840x2160
53.6  fps    + Confronta + 📈 Graph
» Giocabile con tutti i portatili testati con dettagli ultra.
The Finals

The Finals

2023
medio 1920x1080
130.2 154.7 ~ 142 fps    + Confronta + 📈 Graph
alto 1920x1080
113.7 133.5 ~ 124 fps    + Confronta + 📈 Graph
ultra 1920x1080
91.8 99.2 ~ 96 fps    + Confronta + 📈 Graph
QHD 2560x1440
54.6  fps    + Confronta + 📈 Graph
4K 3840x2160
27.3  fps    + Confronta + 📈 Graph
3840x2160
40.6  fps    + Confronta + 📈 Graph
» Giocabile con tutti i portatili testati con dettagli ultra.
Additional Benchmarks
Epic Preset + Epic RTX Global Illumination 1920x1080
96.8
Avatar Frontiers of Pandora

Avatar Frontiers of Pandora

2023
medio 1920x1080
53 55 ~ 54 fps    + Confronta
alto 1920x1080
46 47 ~ 47 fps    + Confronta
ultra 1920x1080
35 35 ~ 35 fps    + Confronta
QHD 2560x1440
23  fps    + Confronta
4K 3840x2160
11  fps    + Confronta
3840x2160
21  fps    + Confronta
» Giocabile con tutti i portatili testati con dettagli alto.
Call of Duty Modern Warfare 3 2023

Call of Duty Modern Warfare 3 2023

2023
basso 1920x1080
73  fps    + Confronta
medio 1920x1080
65 118 ~ 92 fps    + Confronta
alto 1920x1080
48 85 ~ 67 fps    + Confronta
ultra 1920x1080
45 80 ~ 63 fps    + Confronta
QHD 2560x1440
29 53 ~ 41 fps    + Confronta
4K 3840x2160
32  fps    + Confronta
3840x2160
37  fps    + Confronta
» Giocabile con tutti i portatili testati con dettagli ultra.
EA Sports WRC

EA Sports WRC

2023
medio 1920x1080
71.2 79 ~ 75 fps    + Confronta + 📈 Graph
alto 1920x1080
66.6 72.9 ~ 70 fps    + Confronta + 📈 Graph
ultra 1920x1080
61 67.3 ~ 64 fps    + Confronta + 📈 Graph
QHD 2560x1440
42.9  fps    + Confronta + 📈 Graph
4K 3840x2160
22  fps    + Confronta + 📈 Graph
3840x2160
38.2  fps    + Confronta + 📈 Graph
» Giocabile con tutti i portatili testati con dettagli ultra.
Alan Wake 2

Alan Wake 2

2023
basso 1920x1080
58.9  fps    + Confronta + 📈 Graph
medio 1920x1080
48  fps    + Confronta + 📈 Graph
alto 1920x1080
46.7  fps    + Confronta + 📈 Graph
QHD 2560x1440
26.4  fps    + Confronta + 📈 Graph
4K 3840x2160
13.8  fps    + Confronta + 📈 Graph
3840x2160
2.4  fps    + Confronta + 📈 Graph
» Giocabile con tutti i portatili testati con dettagli alto.
Additional Benchmarks
High Preset + High Ray Tracing 1920x1080
21.6
Lords of the Fallen

Lords of the Fallen

2023
medio 1920x1080
54.1 62.9 ~ 59 fps    + Confronta + 📈 Graph
alto 1920x1080
38.6 45.9 ~ 42 fps    + Confronta + 📈 Graph
ultra 1920x1080
27.3 32.1 ~ 30 fps    + Confronta + 📈 Graph
QHD 2560x1440
21.2  fps    + Confronta + 📈 Graph
4K 3840x2160
8.9  fps    + Confronta + 📈 Graph
3840x2160
20.4  fps    + Confronta + 📈 Graph
» Giocabile con tutti i portatili testati con dettagli alto.
Total War Pharaoh

Total War Pharaoh

2023
medio 1920x1080
147 212 ~ 180 fps    + Confronta
alto 1920x1080
84.1 128 ~ 106 fps    + Confronta
ultra 1920x1080
59.7 101 ~ 80 fps    + Confronta
QHD 2560x1440
66.6  fps    + Confronta
4K 3840x2160
32.3  fps    + Confronta
» Giocabile con tutti i portatili testati con dettagli ultra.
Assassin's Creed Mirage

Assassin's Creed Mirage

2023
medio 1920x1080
89 107 ~ 98 fps    + Confronta
alto 1920x1080
84 97 ~ 91 fps    + Confronta
ultra 1920x1080
63 70 ~ 67 fps    + Confronta
QHD 2560x1440
53  fps    + Confronta
4K 3840x2160
28  fps    + Confronta
3840x2160
39  fps    + Confronta
» Giocabile con tutti i portatili testati con dettagli ultra.
EA Sports FC 24

EA Sports FC 24

2023
medio 1920x1080
163.8  fps    + Confronta + 📈 Graph
alto 1920x1080
144  fps    + Confronta + 📈 Graph
ultra 1920x1080
132.5  fps    + Confronta + 📈 Graph
QHD 2560x1440
100.9  fps    + Confronta + 📈 Graph
4K 3840x2160
56.8  fps    + Confronta + 📈 Graph
» Giocabile con tutti i portatili testati con dettagli ultra.
Counter-Strike 2

Counter-Strike 2

2023
medio 1920x1080
127 204 ~ 166 fps    + Confronta + 📈 Graph
alto 1920x1080
112.4 142.6 ~ 128 fps    + Confronta + 📈 Graph
ultra 1920x1080
80.9 110.2 ~ 96 fps    + Confronta + 📈 Graph
QHD 2560x1440
79  fps    + Confronta + 📈 Graph
4K 3840x2160
40.6  fps    + Confronta + 📈 Graph
» Giocabile con tutti i portatili testati con dettagli ultra.
Cyberpunk 2077 2.0 Phantom Liberty

Cyberpunk 2077 2.0 Phantom Liberty

2023
basso 1920x1080
67.2 74.2 79.3 ~ 74 fps    + Confronta
medio 1920x1080
50.1 54.3 63.3 88.6 ~ 64 fps    + Confronta
alto 1920x1080
42.4 45.7 53.5 75 ~ 54 fps    + Confronta
ultra 1920x1080
35.8 39.4 46 67.3 ~ 47 fps    + Confronta
QHD 2560x1440
20.6 23.3 27.5 40.6 ~ 28 fps    + Confronta
4K 3840x2160
17.5  fps    + Confronta
3840x2160
8.3  fps    + Confronta
» Giocabile con tutti i portatili testati con dettagli ultra.
Additional Benchmarks
Low Preset (FSR off) 1280x720
83.1
Ray Tracing Ultra Preset (DLSS off) 1920x1080
27.2
15.2
Steam Deck 1280x720
83.6
Ultra Preset (FSR on) 1920x1080
56
Lies of P

Lies of P

2023
basso 1920x1080
158.7  fps    + Confronta + 📈 Graph
medio 1920x1080
132.8 137.1 138.5 ~ 136 fps    + Confronta + 📈 Graph
alto 1920x1080
113.3 117.7 118.5 ~ 117 fps    + Confronta + 📈 Graph
ultra 1920x1080
101.4 104.2 105.7 ~ 104 fps    + Confronta + 📈 Graph
QHD 2560x1440
69 69.2 ~ 69 fps    + Confronta + 📈 Graph
4K 3840x2160
34.2  fps    + Confronta + 📈 Graph
3840x2160
53  fps    + Confronta + 📈 Graph
» Giocabile con tutti i portatili testati con dettagli ultra.
Additional Benchmarks
Low Preset 1280x720
211
The Crew Motorfest

The Crew Motorfest

2023
basso 1920x1080
60  fps    + Confronta
medio 1920x1080
60 60 60 ~ 60 fps    + Confronta
alto 1920x1080
60 60 60 ~ 60 fps    + Confronta
ultra 1920x1080
59 59 59 ~ 59 fps    + Confronta
QHD 2560x1440
46 47 ~ 47 fps    + Confronta
4K 3840x2160
25  fps    + Confronta
» Giocabile con tutti i portatili testati con dettagli ultra.
Additional Benchmarks
Low Preset 1280x720
60
Starfield

Starfield

2023
basso 1920x1080
63.8  fps    + Confronta + 📈 Graph
medio 1920x1080
53.6 54.5 55.9 ~ 55 fps    + Confronta + 📈 Graph
alto 1920x1080
41.7 42.5 43.7 ~ 43 fps    + Confronta + 📈 Graph
ultra 1920x1080
35.7 36.3 37.3 ~ 36 fps    + Confronta + 📈 Graph
QHD 2560x1440
27.8 28.9 ~ 28 fps    + Confronta + 📈 Graph
4K 3840x2160
17.4  fps    + Confronta + 📈 Graph
» Giocabile con tutti i portatili testati con dettagli ultra.
Additional Benchmarks
Low Preset 1280x720
87.4
basso 1920x1080
102.8  fps    + Confronta + 📈 Graph
medio 1920x1080
100.4 103.8 105.2 ~ 103 fps    + Confronta + 📈 Graph
alto 1920x1080
96.7 98.9 99.8 ~ 98 fps    + Confronta + 📈 Graph
ultra 1920x1080
79 87.1 87.8 ~ 85 fps    + Confronta + 📈 Graph
QHD 2560x1440
61.4 61.8 ~ 62 fps    + Confronta + 📈 Graph
4K 3840x2160
29.2  fps    + Confronta + 📈 Graph
» Giocabile con tutti i portatili testati con dettagli ultra.
Additional Benchmarks
Low Preset 1280x720
105.8
basso 1920x1080
54.9 55.6 ~ 55 fps    + Confronta + 📈 Graph
alto 1920x1080
47.3 49 ~ 48 fps    + Confronta + 📈 Graph
ultra 1920x1080
36.4 42.4 ~ 39 fps    + Confronta + 📈 Graph
QHD 2560x1440
24.5 28 ~ 26 fps    + Confronta + 📈 Graph
» Giocabile con tutti i portatili testati con dettagli ultra.
Additional Benchmarks
Low 1280x720
87.1
85.4
basso 1920x1080
127.9  fps    + Confronta + 📈 Graph
medio 1920x1080
104.3 114.3 121.7 ~ 113 fps    + Confronta + 📈 Graph
alto 1920x1080
97.5 104.1 113 ~ 105 fps    + Confronta + 📈 Graph
ultra 1920x1080
81.1 83.3 94.2 ~ 86 fps    + Confronta + 📈 Graph
QHD 2560x1440
62.7 62.8 ~ 63 fps    + Confronta + 📈 Graph
4K 3840x2160
33.4  fps    + Confronta + 📈 Graph
» Giocabile con tutti i portatili testati con dettagli ultra.
Additional Benchmarks
Low Preset 1280x720
175.2
basso 1920x1080
73.4 84.9 95.6 ~ 85 fps    + Confronta + 📈 Graph
medio 1920x1080
56 71.4 78.5 84.4 85.9 ~ 75 fps    + Confronta + 📈 Graph
alto 1920x1080
49.8 64 66.8 71.3 71.9 ~ 65 fps    + Confronta + 📈 Graph
ultra 1920x1080
48.3 63.1 65.8 69.3 71 ~ 64 fps    + Confronta + 📈 Graph
QHD 2560x1440
32.4 42.5 44 49.8 ~ 42 fps    + Confronta + 📈 Graph
4K 3840x2160
24  fps    + Confronta + 📈 Graph
3840x2160
40.6  fps    + Confronta + 📈 Graph
» Giocabile con tutti i portatili testati con dettagli ultra.
Additional Benchmarks
Low Preset 1280x720
148.9
basso 1920x1080
80.7  fps    + Confronta + 📈 Graph
medio 1920x1080
67.1 67.7 70.6 ~ 68 fps    + Confronta + 📈 Graph
alto 1920x1080
40.2 48.5 49.4 ~ 46 fps    + Confronta + 📈 Graph
ultra 1920x1080
32.9 41.6 45.8 ~ 40 fps    + Confronta + 📈 Graph
QHD 2560x1440
31.4 33.6 ~ 33 fps    + Confronta + 📈 Graph
4K 3840x2160
15.6  fps    + Confronta + 📈 Graph
» Giocabile con la maggior parte dei portatili testati con dettagli ultra.
Additional Benchmarks
Very Low Preset 1280x720
96.6
Very High Preset + Very High Raytracing TAA 1920x1080
25.6
29.3
Very High Preset + Very High Raytracing + DLSS Quality + FG 3840x2160
6
F1 23

F1 23

2023
basso 1920x1080
102.9 145.5 197 197.9 217 228 231 232 259 262 ~ 207 fps    + Confronta
medio 1920x1080
113.5 137 188.7 190 194.8 200 208 210 214 215 222 235 ~ 194 fps    + Confronta
alto 1920x1080
93.5 93.7 133.2 139.8 140.7 143 150.7 156.2 158.4 158.9 164.5 165 165.2 ~ 143 fps    + Confronta
ultra 1920x1080
25.7 27.3 39.5 39.7 40.5 42 44.1 44.5 44.9 45.3 48.2 50.5 51.1 60.8 ~ 43 fps    + Confronta
QHD 2560x1440
16.7 16.7 25.6 30 31 34.1 34.8 36.9 38.1 38.5 40.8 ~ 31 fps    + Confronta
4K 3840x2160
14  fps    + Confronta
3840x2160
21  fps    + Confronta
» Giocabile con la maggior parte dei portatili testati con dettagli ultra.
Additional Benchmarks
Ultra Low Preset TAA 1280x720
269
271
196.1
279
209
242
224
215
Diablo 4

Diablo 4

2023
basso 1920x1080
204  fps    + Confronta + 📈 Graph
medio 1920x1080
181.6  fps    + Confronta + 📈 Graph
alto 1920x1080
160  fps    + Confronta + 📈 Graph
ultra 1920x1080
134.2  fps    + Confronta + 📈 Graph
QHD 2560x1440
86.6  fps    + Confronta + 📈 Graph
4K 3840x2160
43.1  fps    + Confronta + 📈 Graph
3840x2160
56.9  fps    + Confronta + 📈 Graph
» Giocabile con tutti i portatili testati con dettagli ultra.
basso 1920x1080
60.6 63 99.2 ~ 74 fps    + Confronta + 📈 Graph
medio 1920x1080
54.6 56 58 85.8 86.3 ~ 68 fps    + Confronta + 📈 Graph
alto 1920x1080
51.6 53 53.6 56 60 62.9 65.9 ~ 58 fps    + Confronta + 📈 Graph
ultra 1920x1080
48.4 49 49.4 50.7 52 53 56 ~ 51 fps    + Confronta + 📈 Graph
QHD 2560x1440
30.4 31 32.5 35 ~ 32 fps    + Confronta + 📈 Graph
4K 3840x2160
15.8  fps    + Confronta + 📈 Graph
» Giocabile con tutti i portatili testati con dettagli ultra.
Additional Benchmarks
Low Preset 1280x720
101.2
92.1
Epic Preset + Ray Tracing 1920x1080
41.3
39.5
42
38.6
Dead Island 2

Dead Island 2

2023
basso 1920x1080
196 201 ~ 199 fps    + Confronta + 📈 Graph
medio 1920x1080
171.7 171.8 192.8 ~ 179 fps    + Confronta + 📈 Graph
alto 1920x1080
125.9 133.1 142.3 ~ 134 fps    + Confronta + 📈 Graph
ultra 1920x1080
90.9 120.6 133.5 ~ 115 fps    + Confronta + 📈 Graph
QHD 2560x1440
61.8 76.5 ~ 69 fps    + Confronta + 📈 Graph
4K 3840x2160
40.8  fps    + Confronta + 📈 Graph
» Giocabile con tutti i portatili testati con dettagli ultra.
Additional Benchmarks
Low Preset Low TAA 1280x720
201
226
The Last of Us

The Last of Us

2023
basso 1920x1080
82.2 93 ~ 88 fps    + Confronta + 📈 Graph
medio 1920x1080
53.4 67.4 69.4 74.8 ~ 66 fps    + Confronta + 📈 Graph
alto 1920x1080
44.6 56.2 56.8 61.6 ~ 55 fps    + Confronta + 📈 Graph
ultra 1920x1080
0 (!) 35.7 42.8 50.2 ~ 32 fps    + Confronta + 📈 Graph
QHD 2560x1440
23.4 31.9 ~ 28 fps    + Confronta + 📈 Graph
4K 3840x2160
6.7  fps    + Confronta + 📈 Graph
» Giocabile con tutti i portatili testati con dettagli ultra.
Additional Benchmarks
Low Preset 1280x720
102.9
132.7
basso 1920x1080
81  fps    + Confronta + 📈 Graph
medio 1920x1080
57.7 88.6 88.9 ~ 78 fps    + Confronta + 📈 Graph
alto 1920x1080
53.4 80.9 82.6 ~ 72 fps    + Confronta + 📈 Graph
ultra 1920x1080
0 (!) 36.8 53.9 ~ 30 fps    + Confronta + 📈 Graph
QHD 2560x1440
0 (!) 23.8 ~ 12 fps    + Confronta + 📈 Graph
4K 3840x2160
0 (!)  fps    + Confronta
» Giocabile con tutti i portatili testati con dettagli ultra.
Additional Benchmarks
Prioritize Performance Preset 1280x720
118.1
basso 1920x1080
116.4  fps    + Confronta
medio 1920x1080
106.2 127 161 ~ 131 fps    + Confronta
alto 1920x1080
70.2 79 114 ~ 88 fps    + Confronta
ultra 1920x1080
68.7 79.7 113 ~ 87 fps    + Confronta
QHD 2560x1440
55.7 82.5 ~ 69 fps    + Confronta
4K 3840x2160
45.4  fps    + Confronta
» Giocabile con tutti i portatili testati con dettagli ultra.
Additional Benchmarks
Minimum Settings 1280x720
133.3
medio 1920x1080
68.9 78.8 ~ 74 fps    + Confronta + 📈 Graph
alto 1920x1080
63.5 74.5 75 76 ~ 72 fps    + Confronta + 📈 Graph
ultra 1920x1080
61.9 70 73 76 ~ 70 fps    + Confronta + 📈 Graph
QHD 2560x1440
42.4 56 ~ 49 fps    + Confronta + 📈 Graph
4K 3840x2160
24.5  fps    + Confronta + 📈 Graph
» Giocabile con tutti i portatili testati con dettagli ultra.
basso 1920x1080
95 169.9 ~ 132 fps    + Confronta + 📈 Graph
medio 1920x1080
76.1 124 131.9 ~ 111 fps    + Confronta + 📈 Graph
alto 1920x1080
47.8 72 76.8 ~ 66 fps    + Confronta + 📈 Graph
ultra 1920x1080
37.8 57.1 58.4 ~ 51 fps    + Confronta + 📈 Graph
QHD 2560x1440
28.2 43.4 43.5 ~ 38 fps    + Confronta + 📈 Graph
4K 3840x2160
24.6  fps    + Confronta + 📈 Graph
» Giocabile con tutti i portatili testati con dettagli ultra.
Additional Benchmarks
Low Preset 1280x720
99.9
189.8
Returnal

Returnal

2023
basso 1920x1080
59 64 66 ~ 63 fps    + Confronta
medio 1920x1080
57 63 66 87 ~ 68 fps    + Confronta
alto 1920x1080
52 59 63 79 ~ 63 fps    + Confronta
ultra 1920x1080
44 52 53 68 ~ 54 fps    + Confronta
QHD 2560x1440
34 49 ~ 42 fps    + Confronta
4K 3840x2160
26  fps    + Confronta
» Giocabile con tutti i portatili testati con dettagli ultra.
Additional Benchmarks
Low Preset 1280x720
64
Epic Preset + Epic Ray-Tracing 1920x1080
33
basso 1920x1080
84 92 122 ~ 99 fps    + Confronta + 📈 Graph
medio 1920x1080
49.4 64 74 74.2 105.9 109 ~ 79 fps    + Confronta + 📈 Graph
alto 1920x1080
44.8 53.1 59 59.6 64 67 89 93.6 ~ 66 fps    + Confronta + 📈 Graph
ultra 1920x1080
39 49 51.1 51.9 52 53 53 77.3 ~ 53 fps    + Confronta + 📈 Graph
QHD 2560x1440
23.9 35 58.4 ~ 39 fps    + Confronta + 📈 Graph
4K 3840x2160
22.3  fps    + Confronta + 📈 Graph
» Giocabile con tutti i portatili testati con dettagli ultra.
Additional Benchmarks
Low Preset Low TAA 1280x720
122.2
Ultra Preset + Full Ray Tracing High TAA 1920x1080
21.9
25.6
basso 1920x1080
47.9 67 ~ 57 fps    + Confronta + 📈 Graph
medio 1920x1080
47.7 64 ~ 56 fps    + Confronta + 📈 Graph
alto 1920x1080
40.2 55 ~ 48 fps    + Confronta + 📈 Graph
ultra 1920x1080
39.8 54 ~ 47 fps    + Confronta + 📈 Graph
QHD 2560x1440
25.1 35 ~ 30 fps    + Confronta + 📈 Graph
4K 3840x2160
17  fps    + Confronta
» Giocabile con tutti i portatili testati con dettagli ultra.
Additional Benchmarks
Low Preset TAA 1280x720
67
basso 1920x1080
106 113.4 ~ 110 fps    + Confronta + 📈 Graph
medio 1920x1080
76 82.5 ~ 79 fps    + Confronta + 📈 Graph
alto 1920x1080
43 68 ~ 56 fps    + Confronta + 📈 Graph
ultra 1920x1080
38.1 59 ~ 49 fps    + Confronta + 📈 Graph
QHD 2560x1440
23.8 37 ~ 30 fps    + Confronta + 📈 Graph
4K 3840x2160
17  fps    + Confronta
» Giocabile con tutti i portatili testati con dettagli ultra.
Additional Benchmarks
Low Preset / Off 1280x720
161.5
RT Ultra Preset / On FXAA 1920x1080
21
16.4
basso 1920x1080
104.9  fps    + Confronta + 📈 Graph
medio 1920x1080
78.1 138.3 ~ 108 fps    + Confronta + 📈 Graph
alto 1920x1080
65.3 111.9 ~ 89 fps    + Confronta + 📈 Graph
ultra 1920x1080
57.3 87.1 ~ 72 fps    + Confronta + 📈 Graph
QHD 2560x1440
35.7 50.8 ~ 43 fps    + Confronta + 📈 Graph
4K 3840x2160
22.9  fps    + Confronta + 📈 Graph
» Giocabile con tutti i portatili testati con dettagli ultra.
Additional Benchmarks
Low Preset 1280x720
138
basso 1920x1080
74 119 137 ~ 110 fps    + Confronta
medio 1920x1080
62.5 96 97 ~ 85 fps    + Confronta
alto 1920x1080
59.3 60 93.3 ~ 71 fps    + Confronta
ultra 1920x1080
41.4 59 63.1 ~ 55 fps    + Confronta
QHD 2560x1440
29.5 42 46.7 ~ 39 fps    + Confronta
4K 3840x2160
21  fps    + Confronta
» Giocabile con tutti i portatili testati con dettagli ultra.
Additional Benchmarks
Low Preset (without FSR Upscaling) 1280x720
74.4
145.9
Ultra Preset (without FSR Upscaling) + Full Ray-Tracing 1920x1080
44
31
49.9
basso 1920x1080
51.2  fps    + Confronta + 📈 Graph
medio 1920x1080
42.8 104.3 ~ 74 fps    + Confronta + 📈 Graph
alto 1920x1080
37 74.4 ~ 56 fps    + Confronta + 📈 Graph
ultra 1920x1080
28.9 66.8 ~ 48 fps    + Confronta + 📈 Graph
QHD 2560x1440
26.7 42.2 ~ 34 fps    + Confronta + 📈 Graph
4K 3840x2160
18.8  fps    + Confronta + 📈 Graph
» Giocabile con la maggior parte dei portatili testati con dettagli ultra.
Additional Benchmarks
Low Preset 1280x720
54
basso 1920x1080
72.9 112 ~ 92 fps    + Confronta + 📈 Graph
medio 1920x1080
67.1 101 ~ 84 fps    + Confronta + 📈 Graph
alto 1920x1080
56.9 96 ~ 76 fps    + Confronta + 📈 Graph
ultra 1920x1080
51.5 85 ~ 68 fps    + Confronta + 📈 Graph
QHD 2560x1440
42.5 53 ~ 48 fps    + Confronta + 📈 Graph
4K 3840x2160
26  fps    + Confronta
» Giocabile con tutti i portatili testati con dettagli ultra.
Additional Benchmarks
Very Low Preset 1280x720
106.2
Very High Preset + Ray-Tracing TAA 1920x0180
44
28.5
basso 1920x1080
79 128 ~ 104 fps    + Confronta
medio 1920x1080
73 101 109 ~ 94 fps    + Confronta
alto 1920x1080
56 75 81 ~ 71 fps    + Confronta
ultra 1920x1080
54 70 77 ~ 67 fps    + Confronta
QHD 2560x1440
36 47 53 ~ 45 fps    + Confronta
4K 3840x2160
31  fps    + Confronta
3840x2160
50  fps    + Confronta
» Giocabile con tutti i portatili testati con dettagli ultra.
Additional Benchmarks
Basic Quality Preset T2X SMAA 1280x720
83
basso 1920x1080
75.1 76.6 ~ 76 fps    + Confronta + 📈 Graph
medio 1920x1080
71.1 73.2 ~ 72 fps    + Confronta + 📈 Graph
alto 1920x1080
67.2 67.5 ~ 67 fps    + Confronta + 📈 Graph
ultra 1920x1080
62.6 64.2 ~ 63 fps    + Confronta + 📈 Graph
QHD 2560x1440
39.1  fps    + Confronta + 📈 Graph
» Giocabile con tutti i portatili testati con dettagli ultra.
basso 1920x1080
58.6  fps    + Confronta + 📈 Graph
medio 1920x1080
49 57.2 ~ 53 fps    + Confronta + 📈 Graph
alto 1920x1080
42.8 48.8 ~ 46 fps    + Confronta + 📈 Graph
ultra 1920x1080
36.3 41.6 ~ 39 fps    + Confronta + 📈 Graph
QHD 2560x1440
27.5 29.3 ~ 28 fps    + Confronta + 📈 Graph
4K 3840x2160
16.1  fps    + Confronta + 📈 Graph
» Giocabile con tutti i portatili testati con dettagli ultra.
Additional Benchmarks
Low Preset 1280x720
64.9
basso 1920x1080
91  fps    + Confronta + 📈 Graph
medio 1920x1080
68.8 108.1 ~ 88 fps    + Confronta + 📈 Graph
alto 1920x1080
57 87.6 ~ 72 fps    + Confronta + 📈 Graph
ultra 1920x1080
44.6 67.4 ~ 56 fps    + Confronta + 📈 Graph
QHD 2560x1440
28.5 42.3 ~ 35 fps    + Confronta + 📈 Graph
4K 3840x2160
10.6  fps    + Confronta + 📈 Graph
» Giocabile con tutti i portatili testati con dettagli ultra.
Additional Benchmarks
Low Preset 1280x720
126
F1 22

F1 22

2022
basso 1920x1080
100.9 135.3 156.5 157.9 159.4 169.5 182.4 191.2 192.7 207 210 214 214 215 217 232 233 237 244 ~ 193 fps    + Confronta
medio 1920x1080
101.8 127.4 146.6 149 149.6 159.2 184.3 191.4 193.1 194.4 197.2 198.1 199.8 203 207 223 224 234 ~ 182 fps    + Confronta
alto 1920x1080
94.4 97.5 100.8 116.8 124.6 133.6 147.2 149 150.8 151.3 152.1 152.3 154.4 161.2 163.2 166.8 167.3 172.3 174.7 ~ 144 fps    + Confronta
ultra 1920x1080
10.9 33.3 36.2 40.7 42 42.6 44.2 47.5 48.4 48.5 51.3 52.5 52.6 52.9 53.8 54.1 54.7 55 55 55.7 56.4 ~ 47 fps    + Confronta
QHD 2560x1440
6.6 23.1 25.1 26.7 26.9 27.1 29.6 29.9 31 31.7 32.3 33.2 33.9 ~ 27 fps    + Confronta
4K 3840x2160
15.9  fps    + Confronta
» Giocabile con la maggior parte dei portatili testati con dettagli ultra.
Additional Benchmarks
Ultra Low Preset 16xAF TAA 1280x720
254
364
225
197
290
232
315
232
288
258
308
281
175.1
medio 1920x1080
219  fps    + Confronta + 📈 Graph
alto 1920x1080
204  fps    + Confronta + 📈 Graph
ultra 1920x1080
183.9  fps    + Confronta + 📈 Graph
QHD 2560x1440
116.7  fps    + Confronta + 📈 Graph
4K 3840x2160
54.5  fps    + Confronta + 📈 Graph
» Giocabile con tutti i portatili testati con dettagli ultra.
medio 1920x1080
138.2  fps    + Confronta + 📈 Graph
alto 1920x1080
136.9  fps    + Confronta + 📈 Graph
ultra 1920x1080
135.1  fps    + Confronta + 📈 Graph
QHD 2560x1440
80  fps    + Confronta + 📈 Graph
4K 3840x2160
36.1  fps    + Confronta + 📈 Graph
» Giocabile con tutti i portatili testati con dettagli ultra.
Additional Benchmarks
Highest Settings + Maximum Ray Tracing 1920x1080
51
basso 1920x1080
104.5 135.1 169.2 183.3 ~ 148 fps    + Confronta
medio 1920x1080
93.4 113.4 142.8 148.8 ~ 125 fps    + Confronta
alto 1920x1080
63.3 75.4 91.5 99.5 ~ 82 fps    + Confronta
ultra 1920x1080
49.8 59.1 70.2 77.3 ~ 64 fps    + Confronta
QHD 2560x1440
33.6 40.4 47.7 ~ 41 fps    + Confronta
» Giocabile con tutti i portatili testati con dettagli ultra.
Additional Benchmarks
Lowest Preset (DX12) 1280x720
109.3
basso 1920x1080
71 72 85 97.5 98 103 103.3 108 111.2 112.6 117 121.3 ~ 100 fps    + Confronta
medio 1920x1080
54.7 56 60 72.8 74.4 77 82 83 85.3 85.5 86.1 105.9 106.4 ~ 79 fps    + Confronta
alto 1920x1080
48 52 53 60.7 62.2 65.5 67 71 72 72.9 72.9 78.7 82.2 91.3 ~ 68 fps    + Confronta
ultra 1920x1080
44.4 49 50 57.4 57.8 61 64.1 65 66 66.1 67.8 70.1 71.8 79.4 ~ 62 fps    + Confronta
QHD 2560x1440
27.2 30 31 32 36 37.7 38.5 40.4 41 43.1 ~ 36 fps    + Confronta
4K 3840x2160
18  fps    + Confronta
» Giocabile con tutti i portatili testati con dettagli ultra.
Additional Benchmarks
Low Preset 1280x720
67.4
121.3
140.1
109.5
111.1
Ray Tracing Ultra Preset (DLSS off) 1920x1080
27
15.8
24
65.6
24.2
Elex 2

Elex 2

2022
basso 1920x1080
116.3  fps    + Confronta + 📈 Graph
medio 1920x1080
115.7  fps    + Confronta + 📈 Graph
alto 1920x1080
103.4  fps    + Confronta + 📈 Graph
ultra 1920x1080
81.4  fps    + Confronta + 📈 Graph
» Giocabile con tutti i portatili testati con dettagli ultra.
Additional Benchmarks
Low / Off 1280x720
118
basso 1920x1080
155.8 206.2 ~ 181 fps    + Confronta
medio 1920x1080
141.1 171.4 ~ 156 fps    + Confronta
alto 1920x1080
130.1 140.9 ~ 136 fps    + Confronta
ultra 1920x1080
109.8 113.2 ~ 112 fps    + Confronta
QHD 2560x1440
91  fps    + Confronta
» Giocabile con tutti i portatili testati con dettagli ultra.
Additional Benchmarks
Low Preset 1280x720
210.5
157.6
basso 1920x1080
88 122.1 ~ 105 fps    + Confronta
medio 1920x1080
74 75.2 ~ 75 fps    + Confronta
alto 1920x1080
62 62.4 ~ 62 fps    + Confronta
QHD 2560x1440
41  fps    + Confronta
4K 3840x2160
21  fps    + Confronta
» Giocabile con tutti i portatili testati con dettagli alto.
Additional Benchmarks
Low Quality 1280x720
146
High Quality Raytracing 1920x1080
27.2
basso 1920x1080
139 208 ~ 174 fps    + Confronta
medio 1920x1080
115 166 ~ 141 fps    + Confronta
alto 1920x1080
111 159 ~ 135 fps    + Confronta
ultra 1920x1080
89 125 ~ 107 fps    + Confronta
QHD 2560x1440
56  fps    + Confronta
» Giocabile con tutti i portatili testati con dettagli ultra.
Additional Benchmarks
Ultra Low Preset (with Fixed Resolution Quality) 1280x720
188
308
basso 1920x1080
113.7 121 ~ 117 fps    + Confronta + 📈 Graph
medio 1920x1080
86.8 93.3 102 ~ 94 fps    + Confronta + 📈 Graph
alto 1920x1080
71.1 74.7 81 ~ 76 fps    + Confronta + 📈 Graph
ultra 1920x1080
50.1 52.8 55 ~ 53 fps    + Confronta + 📈 Graph
QHD 2560x1440
42.3 44 ~ 43 fps    + Confronta + 📈 Graph
4K 3840x2160
28  fps    + Confronta
» Giocabile con tutti i portatili testati con dettagli ultra.
medio 1920x1080
122.8  fps    + Confronta + 📈 Graph
alto 1920x1080
104.6  fps    + Confronta + 📈 Graph
ultra 1920x1080
85.9  fps    + Confronta + 📈 Graph
» Giocabile con tutti i portatili testati con dettagli ultra.
Additional Benchmarks
Low Preset 1920x1080
143.6
basso 1280x720
119 230 ~ 175 fps    + Confronta
medio 1920x1080
68 162 ~ 115 fps    + Confronta
alto 1920x1080
69 146 ~ 108 fps    + Confronta
ultra 1920x1080
42 55 ~ 49 fps    + Confronta
QHD 2560x1440
36 47 ~ 42 fps    + Confronta
» Giocabile con tutti i portatili testati con dettagli ultra.
Additional Benchmarks
Low Preset 1920x1080
83
186
basso 1280x720
138 164 ~ 151 fps    + Confronta
medio 1920x1080
72 131 ~ 102 fps    + Confronta
alto 1920x1080
67 107 ~ 87 fps    + Confronta
ultra 1920x1080
63 96 ~ 80 fps    + Confronta
QHD 2560x1440
44  fps    + Confronta
» Giocabile con tutti i portatili testati con dettagli ultra.
Additional Benchmarks
Low Preset 1920x1080
80
155
basso 1280x720
144  fps    + Confronta
medio 1920x1080
120  fps    + Confronta
alto 1920x1080
119  fps    + Confronta
ultra 1920x1080
113  fps    + Confronta
» Giocabile con tutti i portatili testati con dettagli ultra.
Additional Benchmarks
Low Preset 1920x1080
123
Ultra Preset + Ultra Ray-Tracing 1920x1080
59
basso 1280x720
332  fps    + Confronta + 📈 Graph
medio 1920x1080
221  fps    + Confronta + 📈 Graph
alto 1920x1080
166.1  fps    + Confronta + 📈 Graph
ultra 1920x1080
155.3  fps    + Confronta + 📈 Graph
» Giocabile con tutti i portatili testati con dettagli ultra.
Additional Benchmarks
Low Preset (DX12) 1920x1080
266
Far Cry 6

Far Cry 6

2021
basso 1280x720
153.2 166 ~ 160 fps    + Confronta + 📈 Graph
medio 1920x1080
125.3 133 ~ 129 fps    + Confronta + 📈 Graph
alto 1920x1080
107.3 114 ~ 111 fps    + Confronta + 📈 Graph
ultra 1920x1080
76.7 82 93.1 ~ 84 fps    + Confronta + 📈 Graph
QHD 2560x1440
58  fps    + Confronta
» Giocabile con tutti i portatili testati con dettagli ultra.
Additional Benchmarks
Low Graphics Quality 1920x1080
140.9
Ultra Graphics Quality + HD Textures + DXR TAA 1920x1080
48
basso 1280x720
161.5  fps    + Confronta + 📈 Graph
medio 1920x1080
98.3 137.7 ~ 118 fps    + Confronta + 📈 Graph
alto 1920x1080
86.7 131.6 ~ 109 fps    + Confronta + 📈 Graph
QHD 2560x1440
63.2 97.2 ~ 80 fps    + Confronta + 📈 Graph
» Giocabile con tutti i portatili testati con dettagli alto.
Additional Benchmarks
Low Preset 1920x1080
116.7
157.3
F1 2021

F1 2021

2021
basso 1280x720
132.5 283 309 323 377 ~ 285 fps    + Confronta
medio 1920x1080
119.7 191.5 245 260 263 291 292 ~ 237 fps    + Confronta
alto 1920x1080
111.5 157.7 194.5 203 209 219 222 ~ 188 fps    + Confronta
ultra 1920x1080
70.7 87.2 105.4 106.5 109.7 110.3 119.5 ~ 101 fps    + Confronta
QHD 2560x1440
56.2 62.1 74 74.3 76.1 ~ 69 fps    + Confronta
4K 3840x2160
38  fps    + Confronta
» Giocabile con tutti i portatili testati con dettagli ultra.
basso 1280x720
150.1  fps    + Confronta + 📈 Graph
ultra 1920x1080
135.1  fps    + Confronta + 📈 Graph
» Giocabile con tutti i portatili testati con dettagli ultra.
Hitman 3

Hitman 3

2021
basso 1280x720
193.9  fps    + Confronta
medio 1920x1080
111.4  fps    + Confronta
alto 1920x1080
101  fps    + Confronta
ultra 1920x1080
94.2  fps    + Confronta
QHD 2560x1440
60.1  fps    + Confronta
» Giocabile con tutti i portatili testati con dettagli ultra.
Additional Benchmarks
Minimum Settings 1920x1080
123.3
basso 1280x720
171  fps    + Confronta
medio 1920x1080
112  fps    + Confronta
alto 1920x1080
101  fps    + Confronta
ultra 1920x1080
93  fps    + Confronta
» Giocabile con tutti i portatili testati con dettagli ultra.
basso 1280x720
184  fps    + Confronta
medio 1920x1080
117  fps    + Confronta
alto 1920x1080
92  fps    + Confronta
ultra 1920x1080
70  fps    + Confronta
» Giocabile con tutti i portatili testati con dettagli ultra.
basso 1280x720
121.3 138 ~ 130 fps    + Confronta + 📈 Graph
medio 1920x1080
116.3 120 ~ 118 fps    + Confronta + 📈 Graph
alto 1920x1080
105 107 ~ 106 fps    + Confronta + 📈 Graph
ultra 1920x1080
49 54.9 ~ 52 fps    + Confronta + 📈 Graph
QHD 2560x1440
32.8 37 ~ 35 fps    + Confronta + 📈 Graph
4K 3840x2160
26  fps    + Confronta
» Giocabile con tutti i portatili testati con dettagli ultra.
Additional Benchmarks
Ultra Preset + Ultra Ray Tracing (DX12) 1920x1080
18
17.8
basso 1280x720
242 291 ~ 267 fps    + Confronta + 📈 Graph
medio 1920x1080
121.1 182.7 ~ 152 fps    + Confronta + 📈 Graph
alto 1920x1080
49.5 75.1 ~ 62 fps    + Confronta + 📈 Graph
ultra 1920x1080
41.6 62 ~ 52 fps    + Confronta + 📈 Graph
QHD 2560x1440
28.6 42.2 ~ 35 fps    + Confronta + 📈 Graph
» Giocabile con tutti i portatili testati con dettagli ultra.
basso 1280x720
107.2 115.7 ~ 111 fps    + Confronta + 📈 Graph
medio 1920x1080
57.6 85.9 ~ 72 fps    + Confronta + 📈 Graph
alto 1920x1080
40.5 65.1 ~ 53 fps    + Confronta + 📈 Graph
ultra 1920x1080
30.6 47.2 ~ 39 fps    + Confronta + 📈 Graph
QHD 2560x1440
22.9 35 ~ 29 fps    + Confronta + 📈 Graph
» Giocabile con la maggior parte dei portatili testati con dettagli ultra.
Additional Benchmarks
Low-End TAAAA 1920x1080
76.2
114
basso 1280x720
170  fps    + Confronta
medio 1920x1080
131  fps    + Confronta
alto 1920x1080
114  fps    + Confronta
ultra 1920x1080
98  fps    + Confronta
QHD 2560x1440
72  fps    + Confronta
4K 3840x2160
39  fps    + Confronta
» Giocabile con tutti i portatili testati con dettagli ultra.
basso 1280x720
174.8 195.9 ~ 185 fps    + Confronta + 📈 Graph
medio 1920x1080
140.5 145.2 ~ 143 fps    + Confronta + 📈 Graph
alto 1920x1080
132 134.1 ~ 133 fps    + Confronta + 📈 Graph
ultra 1920x1080
128.8 129.5 ~ 129 fps    + Confronta + 📈 Graph
QHD 2560x1440
88.6  fps    + Confronta + 📈 Graph
» Giocabile con tutti i portatili testati con dettagli ultra.
basso 1280x720
268.5 341.6 ~ 305 fps    + Confronta
medio 1920x1080
141.8 204.1 ~ 173 fps    + Confronta
alto 1920x1080
95.2 133.9 ~ 115 fps    + Confronta
ultra 1920x1080
64.8 96.7 ~ 81 fps    + Confronta
QHD 2560x1440
44.8  fps    + Confronta
» Giocabile con tutti i portatili testati con dettagli ultra.
basso 1280x720
228 391 ~ 310 fps    + Confronta + 📈 Graph
medio 1920x1080
135.6 234 ~ 185 fps    + Confronta + 📈 Graph
alto 1920x1080
124.7 208 ~ 166 fps    + Confronta + 📈 Graph
ultra 1920x1080
114.3 160.9 ~ 138 fps    + Confronta + 📈 Graph
QHD 2560x1440
82.5 102.4 ~ 92 fps    + Confronta + 📈 Graph
» Giocabile con tutti i portatili testati con dettagli ultra.
basso 1280x720
171  fps    + Confronta
medio 1920x1080
139  fps    + Confronta
alto 1920x1080
96  fps    + Confronta
ultra 1920x1080
73  fps    + Confronta
QHD 2560x1440
50  fps    + Confronta
4K 3840x2160
26  fps    + Confronta
» Giocabile con tutti i portatili testati con dettagli ultra.
Control

Control

2019
medio 1920x1080
100  fps    + Confronta
alto 1920x1080
74  fps    + Confronta
QHD 2560x1440
48  fps    + Confronta
4K 3840x2160
24  fps    + Confronta
» Giocabile con tutti i portatili testati con dettagli alto.
basso 1280x720
130  fps    + Confronta
medio 1920x1080
83  fps    + Confronta
alto 1920x1080
69  fps    + Confronta
ultra 1920x1080
53  fps    + Confronta
QHD 2560x1440
35  fps    + Confronta
» Giocabile con tutti i portatili testati con dettagli ultra.
basso 1280x720
199  fps    + Confronta
medio 1920x1080
109  fps    + Confronta
alto 1920x1080
82  fps    + Confronta
ultra 1920x1080
64  fps    + Confronta
QHD 2560x1440
50  fps    + Confronta
4K 3840x2160
45  fps    + Confronta
» Giocabile con tutti i portatili testati con dettagli ultra.
Additional Benchmarks
Ultra Quality DXR 16xAF 1920x1080
54
basso 1280x720
215  fps    + Confronta
medio 1920x1080
102 150 ~ 126 fps    + Confronta
alto 1920x1080
95 134 ~ 115 fps    + Confronta
ultra 1920x1080
86 116 ~ 101 fps    + Confronta
QHD 2560x1440
60 73 ~ 67 fps    + Confronta
4K 3840x2160
33  fps    + Confronta
» Giocabile con tutti i portatili testati con dettagli ultra.
Strange Brigade

Strange Brigade

2018
basso 1280x720
239 277 299 309 321 321 326 355 355 391 396 402 403 417 429 447 449 467 475 476 481 ~ 383 fps    + Confronta
medio 1920x1080
130 150.5 153.5 158 167.9 171.1 187.4 189.5 191.9 194.8 197.1 202 203 204 205 206 207 209 211 211 211 213 214 214 218 221 ~ 194 fps    + Confronta
alto 1920x1080
105 117 120.1 127 134.9 137.4 142.6 145.3 151.6 155.2 159 159.4 164.7 166.5 167.6 168.3 169.3 171 171.4 171.8 171.8 171.9 173 174.8 174.8 175.4 177 178 ~ 157 fps    + Confronta
ultra 1920x1080
21.2 92 100.2 103.9 113 117 121.3 123.1 124.8 125.1 132 135.2 137 139.1 141.7 144 144.1 145.1 146.8 146.9 146.9 147 147.2 147.7 148.7 149.2 149.3 149.4 151.2 152 152.8 153 156.6 ~ 133 fps    + Confronta
QHD 2560x1440
11.7 61 72.7 77 78 79.8 81.2 83.5 83.7 94.9 95.5 96.3 97.2 100 100.7 ~ 81 fps    + Confronta
4K 3840x2160
53  fps    + Confronta
» Giocabile con la maggior parte dei portatili testati con dettagli ultra.
Far Cry 5

Far Cry 5

2018
basso 1280x720
97 108 131 132 146 147 148 151 155 156 166 170 172 174 197 ~ 150 fps    + Confronta + 📈 Graph
medio 1920x1080
73 85 87 89 93 93 111 114 114 122 125 128 131 135 135 136 140 141 146 ~ 116 fps    + Confronta + 📈 Graph
alto 1920x1080
51 74 80 81 88 95 103 105 107 108 110 118 122 123 126 126 128 131 131 133 135 ~ 108 fps    + Confronta + 📈 Graph
ultra 1920x1080
50 71 76 76 80 87 94 99 102 102 104 109 113 116 119 119 119 121 123 124 127 ~ 101 fps    + Confronta + 📈 Graph
QHD 2560x1440
47 51 53 56 58 64 68 69 79 83 86 87 88 ~ 68 fps    + Confronta + 📈 Graph
4K 3840x2160
43  fps    + Confronta
» Giocabile con tutti i portatili testati con dettagli ultra.
Additional Benchmarks
Low Preset TAA 1920x1080
151
98
153
148
127
148
147
149
134
142
basso 1280x720
77.8 100.6 103.5 109.8 110.3 113 113.2 114.3 114.4 115.3 121.5 122.4 124.3 128.5 138.1 139.9 141.6 143.6 144.7 146.6 148.5 149.2 152.4 152.9 153 153.1 153.9 157.2 158.8 159.2 159.9 161 165.2 ~ 135 fps    + Confronta
medio 1920x1080
76 84 86.2 86.7 88.2 94.5 97 98.4 101.1 101.4 101.6 104.2 105.1 106 121.4 121.8 122.4 122.9 124 124.7 125.1 128.6 130.6 132.7 134.6 134.7 138.8 139.5 139.6 139.8 142.3 144.9 147.6 ~ 117 fps    + Confronta
alto 1920x1080
65 69.7 70.7 77 77.1 77.8 79 79.3 79.7 79.8 81.3 81.3 81.4 81.5 81.5 97 97.6 97.8 98.2 98.2 98.6 100.2 100.9 103.2 104.4 106.1 106.5 108.4 108.5 110 110.2 110.3 111.4 113.1 117 ~ 93 fps    + Confronta
4K 3840x2160
83.2 97.9 108.6 ~ 97 fps    + Confronta
» Giocabile con tutti i portatili testati con dettagli alto.
basso 1280x720
47.8 99.2 105 123.3 130.2 132.7 142.6 166.8 167 178.9 180.2 183 183.5 186.9 187.4 187.5 188 190.5 192.9 212 214 215 ~ 164 fps    + Confronta
medio 1920x1080
20 70.8 77.2 77.5 77.8 82.7 85.7 94.5 104.3 105.1 107.2 110.5 112.7 114.1 115.5 116.2 116.2 116.9 118.6 118.6 120.3 120.3 120.7 121.2 122.3 122.4 122.4 122.9 ~ 104 fps    + Confronta
alto 1920x1080
15.5 52.3 56.2 56.7 56.9 58.5 59.9 65.1 68.6 71.1 75.6 76.5 76.9 79.2 80.3 81 81.5 82 82.4 82.6 82.8 83.5 83.5 83.6 84 84.1 84.6 84.6 84.8 85 85.2 86.1 86.3 122.3 ~ 76 fps    + Confronta
QHD 2560x1440
9.9 38 40.7 41 41.5 41.6 47.4 48.6 49.6 53.6 58.2 58.5 58.9 59.7 60 60 60.9 62 62.3 ~ 50 fps    + Confronta
4K 3840x2160
22.5 33.3 ~ 28 fps    + Confronta
» Giocabile con la maggior parte dei portatili testati con dettagli alto.
basso 1280x720
113.7 119.7 137.4 142 144.4 144.5 147.6 148 151 153.7 159.4 159.7 161.8 162.2 162.7 166.8 169.6 170 171.3 172.1 175 175.1 175.9 177.6 178.8 180 180.9 181.5 182.3 192.6 193.2 196.3 ~ 164 fps    + Confronta
medio 1366x768
100.1 112 118.5 124.2 127.2 134.2 134.9 136.5 138.7 139.4 141.1 141.8 143.6 147.6 151.7 152.5 152.7 153.7 156.1 157.1 157.8 158.1 159.7 160.3 162.5 163.4 165.6 166.1 167.9 176.1 178.3 181.6 ~ 149 fps    + Confronta
alto 1920x1080
79.2 95.2 101.7 116.5 119.6 127 129 130 130.7 132.1 132.6 135.1 136.5 139.8 140.1 141.3 141.4 142.8 146.5 147.9 150.3 150.5 150.5 154.1 155 156.3 156.4 158.9 159 169.1 171.1 175.8 191.8 ~ 141 fps    + Confronta
ultra 1920x1080
73.5 88.2 103.6 106.4 107.1 115.8 120.3 121.8 122.5 123.1 123.9 123.9 125.2 126 126.8 127.2 129.1 131.9 135.3 138.6 139.1 140.2 142.5 142.5 143.9 145 146.8 147 148 148.8 160.7 161.7 162.2 175.6 ~ 132 fps    + Confronta
4K 3840x2160
69.7 101.2 106.6 115.2 ~ 98 fps    + Confronta
» Giocabile con tutti i portatili testati con dettagli ultra.
basso 1024x768
230 268.5 286.5 299 307.8 309 356 365 369 382.6 390 393.7 395 405.1 410.2 465 ~ 352 fps    + Confronta + 📈 Graph
medio 1366x768
157 168.5 184.1 209.6 219 251.2 253.3 258 262.4 265.3 271.1 278.6 282 283 286 286 293 319 ~ 252 fps    + Confronta + 📈 Graph
alto 1920x1080
87 96 98 107.1 120.1 121 121.7 123 138.7 149.7 150.9 154.4 155 156.2 160.2 160.9 161 164 164.7 165 166 167.6 170 171 175 177 ~ 145 fps    + Confronta + 📈 Graph
ultra 1920x1080
18.5 52.4 54.5 59.5 60.1 61 62.7 64 66 67.7 71 71.9 73 74.7 76.6 76.7 78 78 80 80.1 80.5 81 81 82.2 83 83.4 83.8 83.9 84 84.5 84.9 85 85.6 86 88 89 89 94.7 ~ 75 fps    + Confronta + 📈 Graph
QHD 2560x1440
39 46 56.1 59.2 60.3 61.3 ~ 54 fps    + Confronta + 📈 Graph
4K 3840x2160
44.7 50 ~ 47 fps    + Confronta + 📈 Graph
» Giocabile con la maggior parte dei portatili testati con dettagli ultra.
Additional Benchmarks
Ultra Graphics & Postprocessing (HBAO+) 3840x2160
30
Medium Graphics & Postprocessing 1920x1080
193
134.4
180.5
187.6
165.7
190
GTA V

GTA V

2015
basso 1024x768
163.6 171.3 182.1 182.2 183.4 183.5 183.7 184.8 184.8 185.6 185.9 186.6 186.7 ~ 182 fps    + Confronta
medio 1366x768
119.9 156 161.4 161.7 162.2 166.5 168.6 172.4 176.4 176.6 177.3 178 179.1 179.7 180 180.1 180.2 180.6 180.9 184.2 185.1 ~ 172 fps    + Confronta
alto 1920x1080
106 132.9 133.2 135.3 142.4 142.8 143.6 153.1 158.2 160.7 161.5 161.6 162.4 163.2 167.8 168.6 168.9 169.1 171.1 172.4 172.7 174.6 175.8 176.3 177.3 ~ 158 fps    + Confronta
ultra 1920x1080
14.9 53.5 55.9 60.6 62.7 65.3 67.6 72.7 74.3 76.7 78.4 78.7 81.9 83.5 86.9 88.8 89 89.1 90.7 92.2 92.4 93.2 93.7 94.2 94.5 96.5 96.6 96.8 97.7 101.7 ~ 81 fps    + Confronta
QHD 2560x1440
8.2 44.3 46.5 48.1 50.5 55.7 57.3 57.7 58.3 63 64.1 65.1 66 66 67.5 ~ 55 fps    + Confronta
4K 3840x2160
63.5  fps    + Confronta
» Giocabile con la maggior parte dei portatili testati con dettagli ultra.
Additional Benchmarks
Highest Settings possible 16xAF 4xMSAA + FXAA 3840x2160
26.9
Normal/Off 4xAF 1920x1080
179.7
181.2
185.2
164.8
161.4
180.6
174.2
154.9
177.2
177.9
179.2
178.7
179.1
174.3
170.2
158.4
Lowest Settings possible 1920x1080
186.3
183.3
182.9
185.9
178.1
166.6
184.7
177.3
163.1
182.9
181.3
180.3
184.3
162.7
bassomedioaltoultraQHD4K
Dragon's Dogma 262.252.93618.4
Horizon Forbidden West75.751.94531.618.6
Alone in the Dark17315713754317
Last Epoch148.4122.890.448.225.6
Skull & Bones9376574221
Helldivers 2106.582.274.472.144.517.8
Enshrouded5246382816.2
Palworld96747350.626
Prince of Persia The Lost Crown355354351290127.1
Ready or Not17314510156.626
The Finals1421249654.627.3
Avatar Frontiers of Pandora5447352311
Call of Duty Modern Warfare 3 2023739267634132
EA Sports WRC75706442.922
Alan Wake 258.94846.726.413.8
Lords of the Fallen59423021.28.9
Total War Pharaoh1801068066.632.3
Assassin's Creed Mirage9891675328
EA Sports FC 24163.8144132.5100.956.8
Counter-Strike 2166128967940.6
Cyberpunk 2077 2.0 Phantom Liberty746454472817.5
Lies of P158.71361171046934.2
The Crew Motorfest606060594725
Starfield63.85543362817.4
Armored Core 6102.810398856229.2
Immortals of Aveum55483926
Atlas Fallen127.9113105866333.4
Baldur's Gate 3857565644224
Ratchet & Clank Rift Apart80.76846403315.6
F1 23207194143433114
Diablo 4204181.6160134.286.643.1
Star Wars Jedi Survivor746858513215.8
Dead Island 21991791341156940.8
The Last of Us88665532286.65
Resident Evil 4 Remake8178723012
Company of Heroes 3116.413188876945.4
Sons of the Forest7472704924.5
Atomic Heart13211166513824.6
Returnal636863544226
Hogwarts Legacy997966533922.3
Dead Space Remake575648473017
The Witcher 3 v4.001107956493017
High On Life104.910889724322.9
The Callisto Protocol1108571553921
Need for Speed Unbound51.27456483418.8
Spider-Man Miles Morales928476684826
Call of Duty Modern Warfare 2 20221049471674531
Uncharted Legacy of Thieves Collection7672676339.1
A Plague Tale Requiem58.65346392816.1
FIFA 2394.3
The Quarry918872563510.6
F1 22193182144472715.9
Vampire Bloodhunt219204183.9116.754.5
Ghostwire Tokyo138.2136.9135.18036.1
Tiny Tina's Wonderlands148125826441
Cyberpunk 2077 1.61007968623618
Elex 2116.3115.7103.481.4
GRID Legends18115613611291
Dying Light 210575624121
Rainbow Six Extraction17414113510756
God of War1179476534328
Halo Infinite122.8104.685.9
Forza Horizon 51751151084942
Riders Republic151102878044
Guardians of the Galaxy144120119113
Back 4 Blood332221166.1155.3
Far Cry 61601291118458
Alan Wake Remastered161.511810980
F1 20212852371881016938
Mass Effect Legendary Edition150.1135.1
Hitman 3193.9111.410194.260.1
Immortals Fenyx Rising17111210193
Assassin´s Creed Valhalla1841179270
Watch Dogs Legion130118106523526
Crysis Remastered267152625235
Flight Simulator 202011172533929
Horizon Zero Dawn170131114987239
Death Stranding18514313312988.6
Gears Tactics3051731158144.8
Doom Eternal31018516613892
Borderlands 317113996735026
Control100744824
The Division 213083695335
Metro Exodus19910982645045
Shadow of the Tomb Raider2151261151016733
Strange Brigade3831941571338153
Far Cry 51501161081016843
X-Plane 11.111351179397
Final Fantasy XV Benchmark164104765028
Dota 2 Reborn16414914113298
The Witcher 3352252145755447
GTA V182172158815563.5
< 30 fps
< 60 fps
< 120 fps
≥ 120 fps

5
27
39

7
46
35

17
50
23

31
42
11
12
48
22
1
44
19
3
1

Per conoscere altri giochi che potrebbero essere utilizzabili e per una lista completa di tutti i giochi e delle schede grafiche visitate la nostra Gaming List

v1.26
log 25. 15:22:19

#0 no ids found in url (should be separated by "_") +0s ... 0s

#1 not redirecting to Ajax server +0s ... 0s

#2 did not recreate cache, as it is less than 5 days old! Created at Thu, 25 Apr 2024 05:40:10 +0200 +0.001s ... 0.001s

#3 no comparison url found in template nbc.compare_page_1 needed +0.046s ... 0.047s

#4 no comparison url found in template nbc.compare_page_1 needed +0s ... 0.047s

#5 no comparison url found in template nbc.compare_page_1 needed +0s ... 0.048s

#6 no comparison url found in template nbc.compare_page_1 needed +0s ... 0.048s

#7 composed specs +0.001s ... 0.049s

#8 did output specs +0s ... 0.049s

#9 start showIntegratedCPUs +0s ... 0.049s

#10 getting avg benchmarks for device 11457 +0.032s ... 0.082s

#11 got single benchmarks 11457 +0.156s ... 0.237s

#12 got avg benchmarks for devices +0s ... 0.237s

#13 min, max, avg, median took s +1.228s ... 1.465s

#14 before gaming benchmark output +0.001s ... 1.466s

#15 Got 1815 rows for game benchmarks. +0.551s ... 2.017s

#16 composed SQL query for gamebenchmarks +0s ... 2.017s

#17 got data and put it in $dataArray +0.066s ... 2.083s

#18 benchmarks composed for output. +5.116s ... 7.199s

#19 no comparison url found in template nbc.compare_page_1 needed +0.013s ... 7.212s

#20 return log +0s ... 7.212s

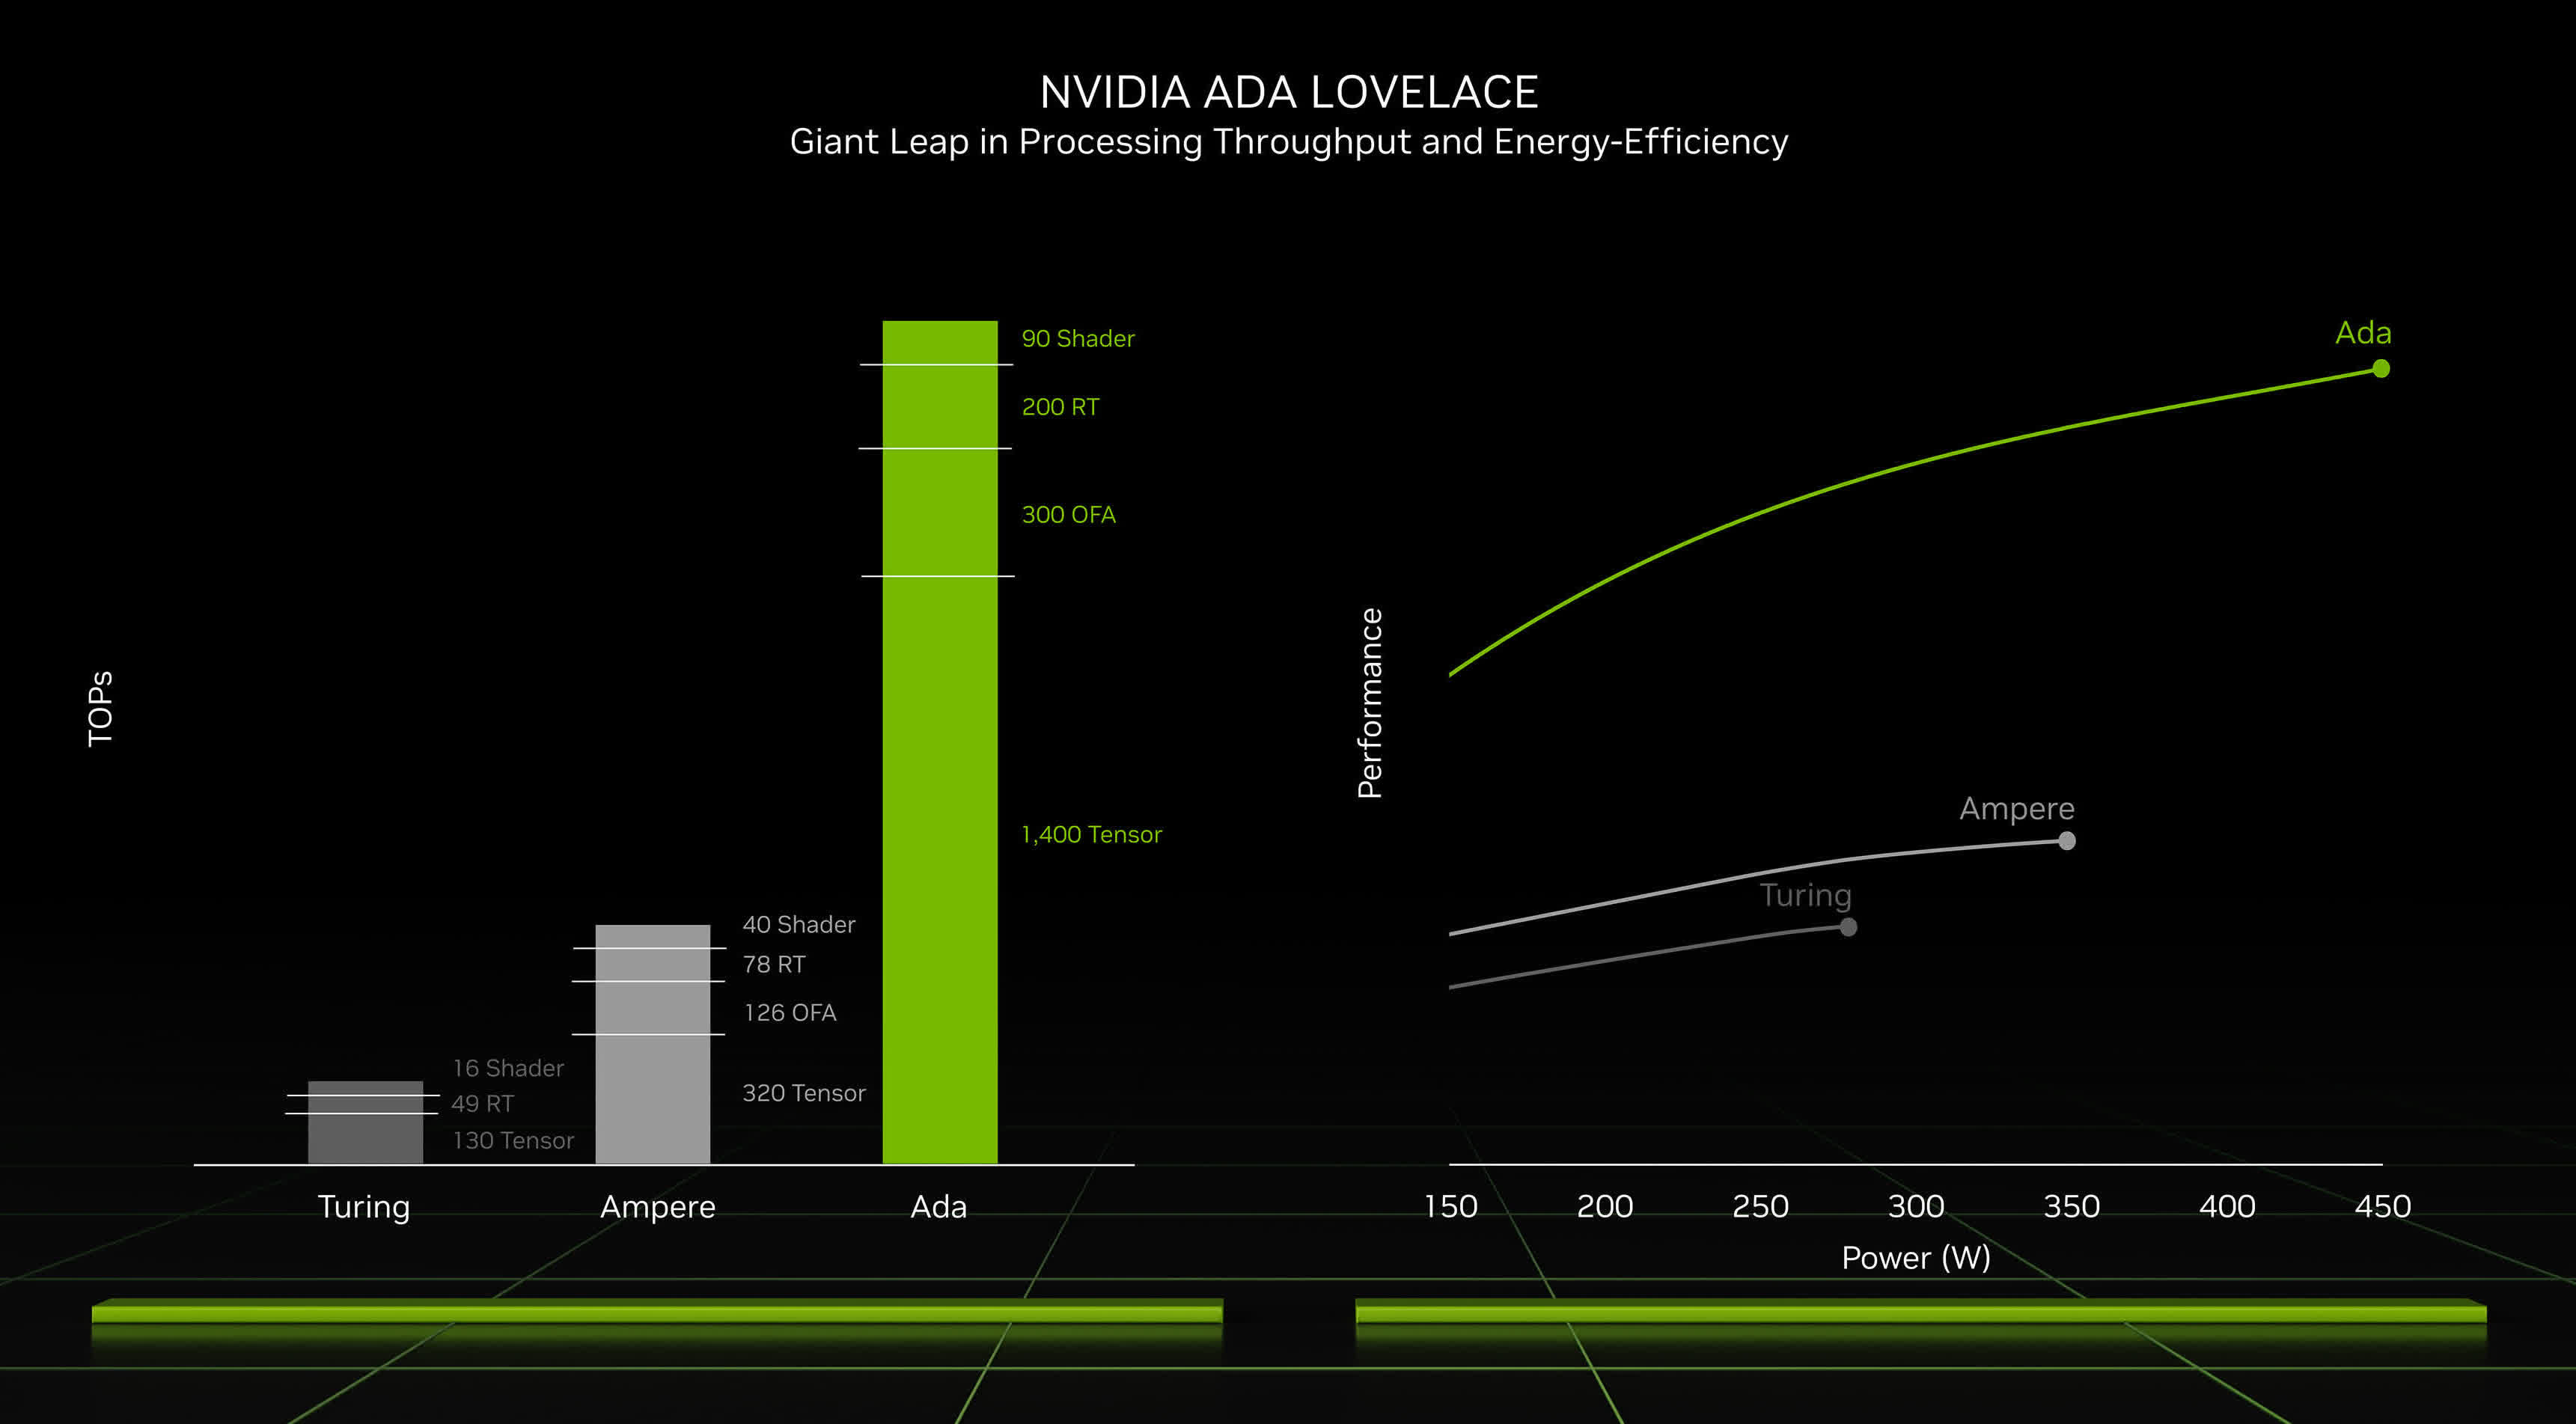
Recensioni Notebook con NVIDIA GeForce RTX 4050 Laptop GPU la scheda grafica
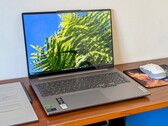
Recensione del Dell XPS 14 2024 - Il portatile multimediale con la RTX 4050 più lenta al mondo

Recensione del Dell XPS 14 2024 - Il portatile multimediale con la RTX 4050 più lenta al mondo

Dell ha presentato l'XPS 14, un nuovo computer portatile multimediale di cui abbiamo testato la variante di fascia alta con un pannello OLED e la GeForce RTX 40...
Intel Core Ultra 7 155H | NVIDIA GeForce RTX 4050 Laptop GPU | 14.50" | 1.8 kg
Recensione del Samsung Galaxy Book4 Ultra - Un portatile multimediale con OLED a 120 Hz e RTX 4050

Recensione del Samsung Galaxy Book4 Ultra - Un portatile multimediale con OLED a 120 Hz e RTX 4050

Il laptop multimediale Galaxy Book4 Ultra da 16 pollici è la risposta di Samsung al Apple MacBook Pro 16. Oltre al pannello AMOLED ad alta risoluzione da 120 Hz...
Intel Core Ultra 7 155H | NVIDIA GeForce RTX 4050 Laptop GPU | 16.00" | 1.8 kg
Recensione del convertibile HP Spectre x360 16: Ora con grafica RTX 4050 da 55 W GeForce

Recensione del convertibile HP Spectre x360 16: Ora con grafica RTX 4050 da 55 W GeForce

La GPU RTX 4050 di GeForce fa il giro della configurazione Arc 8 integrata. Tuttavia, i bug del throttling della CPU impediscono alla configurazione dGPU di ess...
Intel Core Ultra 7 155H | NVIDIA GeForce RTX 4050 Laptop GPU | 16.00" | 2 kg
Recensione del laptop gaming HP Victus 15 con Raptor Lake e Ada Lovelace

Recensione del laptop gaming HP Victus 15 con Raptor Lake e Ada Lovelace

Chi è alla ricerca di un notebook da gioco nella fascia di prezzo di 1.000 dollari potrebbe essersi già imbattuto nella serie Victus di HP. Abbiamo testato l'ul...
Intel Core i5-13500H | NVIDIA GeForce RTX 4050 Laptop GPU | 15.60" | 2.3 kg
Recensione del Dell G15 5530: Computer portatile gaming con RTX 4050 in grigio scuro (Dark Shadow Gray)

Recensione del Dell G15 5530: Computer portatile gaming con RTX 4050 in grigio scuro (Dark Shadow Gray)

Per il G15 5530, Dell va contro la tendenza a snellire i dispositivi e ha dato al portatile da 15 pollici uno chassis piuttosto ingombrante e pesante. Abbiamo c...
Intel Core i5-13450HX | NVIDIA GeForce RTX 4050 Laptop GPU | 15.60" | 2.7 kg

Acer Nitro V 15 ANV15-51-582S: Intel Core i5-13420H, 15.60", 2.1 kg
  recensione » Recensione dell'Acer Nitro V 15 ANV15-51: gaming Laptop economico con RTX 4050

Medion Erazer Crawler E40 - MD 62518: Intel Core i5-13500H, 15.60", 2.3 kg
  recensione » Recensione del computer portatile Medion Erazer Crawler E40: Un gamer economico con buone prestazioni RTX 4050

Asus VivoBook Pro 16 K6602VU: Intel Core i9-13900H, 16.00", 1.9 kg
  recensione » Recensione del laptop Asus VivoBook Pro 16 (2023): Core i9-13900H, RTX 4050 e OLED 3.2K sono di buon auspicio per i creatori hobbisti

Acer Predator Helios Neo 16 NH.QLTEG.002: Intel Core i5-13500HX, 16.00", 2.6 kg
  recensione » Recensione del computer portatile Predator Helios Neo 16: Acer ha creato una chimera gaming

Lenovo LOQ 15IRH8 Core i7: Intel Core i7-13620H, 15.60", 2.4 kg
  recensione » Recensione del Lenovo LOQ 15 Core i7: Un'alternativa conveniente a Legion che pone un dilemma Intel vs AMD

SCHENKER XMG Apex 15 (Late 23): AMD Ryzen 7 7840HS, 15.60", 2.2 kg
  recensione » Recensione dell'XMG Apex 15 (Late 23): portatile gaming con RTX 4050 che offre una buona autonomia

HP Victus 16-r0076TX: Intel Core i5-13500HX, 16.10", 2.3 kg
  recensione » Recensione del portatile HP Victus 16: Una potenza gaming a 1080p con pochi compromessi

Acer Nitro 16 AN16-41-R7YE: AMD Ryzen 5 7535HS, 16.00", 2.6 kg
  recensione » Recensione dell'Acer Nitro 16 AN16-41: gaming Laptop economico con RTX 4050 e buona autonomia

Lenovo Slim Pro 9i 16IRP8: Intel Core i9-13905H, 16.00", 2.2 kg
  recensione » Recensione del portatile Lenovo Slim Pro 9i 16IRP8: L'alternativa al MacBook Pro 16 di Apple

Lenovo Legion Pro 5 16ARX8 (R5 7645HX, RTX 4050): AMD Ryzen 5 7645HX, 16.00", 2.5 kg
  recensione » Recensione del Lenovo Legion Pro 5 16ARX8: Gaming Laptop con RTX 4050 in grande forma

Lenovo LOQ 15APH8: AMD Ryzen 7 7840HS, 15.60", 2.5 kg
  recensione » Recensione del portatile Lenovo LOQ 15 Ryzen 7 7840HS: Non chiamatelo Legion

Acer Predator Triton 14 PT14-51: Intel Core i7-13700H, 14.00", 1.7 kg
  recensione » Recensione dell'Acer Predator Triton 14: Un portatile gaming da 14 pollici con un display luminoso e una RTX 4050

Lenovo Yoga Pro 9-14IRP G8: Intel Core i7-13705H, 14.50", 1.7 kg
  recensione » Recensione dello Yoga Pro 9i 14: Il miglior portatile multimediale di Lenovo con pannello Mini-LED AdobeRGB

SCHENKER XMG Focus 15 (E23): Intel Core i9-13900HX, 15.60", 2.4 kg
  recensione » Recensione del portatile gaming economico Schenker XMG Focus 15 (E23): prestazioni elevate a un prezzo inferiore rispetto al Pro 15

MSI Stealth 14 Studio A13V: Intel Core i7-13700H, 14.00", 1.7 kg
  recensione » Recensione dell'MSI Stealth 14 Studio - Un portatile gaming costoso che ha fatto troppi compromessi

Acer Swift X SFX14-71G: Intel Core i7-13700H, 14.50", 1.5 kg
  recensione » Recensione dell'Acer Swift X 14 2023 OLED - Il portatile multimediale con RTX 4050 è impressionante solo sulla carta

Acer Nitro 5 AN517-55-5552: Intel Core i5-12500H, 17.30", 3 kg
  recensione » Recensione dell'Acer Nitro 5 AN517: Un portatile gaming con una silenziosa RTX 4050

Asus TUF A15 FA507: AMD Ryzen 7 7735HS, 15.60", 2.2 kg
  recensione » Recensione del portatile Asus TUF Gaming A15 - Un computer economico con RTX 4050 e schermo a 144 Hz

Medion Erazer Scout E20: Intel Core i7-13700H, 17.30", 2.8 kg
  recensione » Recensione del Medion Erazer Scout E20: Laptop gaming FHD economico con RTX 4050

Lenovo Yoga Pro 7 14IRH G8: Intel Core i7-13700H, 14.50", 1.5 kg
  recensione » Recensione del notebook Lenovo Yoga Pro 7 14 G8: GeForce Il laptop RTX 4050 alimenta il display 3K a 120 Hz

Gigabyte Aero 14 OLED BMF: Intel Core i7-13700H, 14.00", 1.4 kg
  recensione » Recensione del portatile Gigabyte Aero 14 OLED BMF: Notebook da studio compatto con display a colori

Samsung Galaxy Book3 Ultra 16: Intel Core i7-13700H, 16.00", 1.8 kg
  recensione » Recensione del Samsung Galaxy Book3 Ultra 16: Ultrabook da 16 pollici resistente con RTX 4050

MSI Katana 15 B12VEK: Intel Core i7-12650H, 15.60", 2.3 kg
  recensione » Recensione del portatile MSI Katana 15: Gamer economico con RTX 4050 e CPU Alder Lake

Asus TUF Gaming A16 FA607J: Intel Core i7-13650HX, 16.00", 2.3 kg
  Recensioni esterne » Asus TUF Gaming A16 FA607J

MSI Katana 15 AI B8VE: AMD Ryzen 7 8845HS, 15.60", 2.3 kg
  Recensioni esterne » MSI Katana 15 AI B8VE

Lenovo LOQ 15IRX9, i5-13450HX: Intel Core i5-13450HX, 15.60", 2.4 kg
  Recensioni esterne » Lenovo LOQ 15IRX9, i5-13450HX

HP Spectre x360 16 RTX 4050: Intel Core Ultra 7 155H, 16.00", 2 kg
  Recensioni esterne » HP Spectre x360 16 RTX 4050

Acer Predator Triton 14 PT14-51: Intel Core i7-13700H, 14.00", 1.7 kg
  Recensioni esterne » Acer Predator Triton 14 PT14-51

HP Victus 15-fa1000na: Intel Core i5-12500H, 15.60", 2.3 kg
  Recensioni esterne » HP Victus 15-fa1000na

Samsung Galaxy Book4 Ultra: Intel Core Ultra 7 155H, 16.00", 1.8 kg
  Recensioni esterne » Samsung Galaxy Book4 Ultra

HP Omen Transcend 14-fb0000: Intel Core Ultra 7 155H, 14.00", 1.6 kg
  Recensioni esterne » HP Omen Transcend 14-fb0000

Acer Nitro 5 AN515-58, i7-12650H RTX 4050: Intel Core i7-12650H, 15.60", 2.5 kg
  Recensioni esterne » Acer Nitro 5 AN515-58, i7-12650H RTX 4050

Dell XPS 14 2024 OLED: Intel Core Ultra 7 155H, 14.50", 1.8 kg
  Recensioni esterne » Dell XPS 14 2024 OLED

Acer Swift X SFX16-61G-R0SU: AMD Ryzen 7 7840HS, 16.00", 2 kg
  Recensioni esterne » Acer Swift X SFX16-61G-R0SU

Acer Nitro 17 AN17-51: Intel Core i5-13500H, 17.30", 3 kg
  Recensioni esterne » Acer Nitro 17 AN17-51

Acer Nitro V 15 ANV15-51, i7-13620H: Intel Core i7-13620H, 15.60", 2.1 kg
  Recensioni esterne » Acer Nitro V 15 ANV15-51, i7-13620H

HP Omen 16-wd0000: Intel Core i5-13420H, 16.10", 2.4 kg
  Recensioni esterne » HP Omen 16-wd0000

Asus ROG Zephyrus G14 GA402NU: AMD Ryzen 7 7735HS, 14.00", 1.7 kg
  Recensioni esterne » Asus ROG Zephyrus G14 GA402NU

Acer Nitro V 15 ANV15-51: Intel Core i5-13420H, 15.60", 2.1 kg
  Recensioni esterne » Acer Nitro V 15 ANV15-51

Asus VivoBook Pro 16 OLED K6602V: Intel Core i9-13900H, 16.00", 1.9 kg
  Recensioni esterne » Asus VivoBook Pro 16 OLED K6602V

HP Victus 16-s0152ng: AMD Ryzen 5 7640HS, 16.10", 2.3 kg
  Recensioni esterne » HP Victus 16-s0152ng

Acer Nitro 5 AN517-55: Intel Core i5-12500H, 17.30", 3 kg
  Recensioni esterne » Acer Nitro 5 AN517-55

Asus ROG Strix G16 G614JU, i7-13650HX: Intel Core i7-13650HX, 16.00", 2.5 kg
  Recensioni esterne » Asus ROG Strix G16 G614JU, i7-13650HX

HP Victus 16-s0000ng: AMD Ryzen 7 7840HS, 16.10", 2.3 kg
  Recensioni esterne » HP Victus 16-s0000ng

Lenovo Yoga Pro 9-14IRP G8: Intel Core i7-13705H, 14.50", 1.7 kg
  Recensioni esterne » Lenovo Yoga Pro 9-14IRP G8

Lenovo Slim Pro 9 14IRP8: Intel Core i7-13705H, 14.50", 1.7 kg
  Recensioni esterne » Lenovo Slim Pro 9 14IRP8

HP Victus 15-fa1000ng: Intel Core i5-13420H, 15.60", 2.3 kg
  Recensioni esterne » HP Victus 15-fa1000ng

Acer Swift X SFX16-61G: AMD Ryzen 9 7940HS, 16.00", 2 kg
  Recensioni esterne » Acer Swift X SFX16-61G

MSI Cyborg 15 A12VE, i5-12450H: Intel Core i5-12450H, 15.60", 2 kg
  Recensioni esterne » MSI Cyborg 15 A12VE, i5-12450H

Acer Nitro 16 AN16-51: Intel Core i7-13700H, 16.00", 2.7 kg
  Recensioni esterne » Acer Nitro 16 AN16-51

Lenovo Legion Slim 5 16IRH8, i7-13700H RTX 4050: Intel Core i7-13700H, 16.00", 2.4 kg
  Recensioni esterne » Lenovo Legion Slim 5 16IRH8, i7-13700H RTX 4050

Asus Vivobook 16X K3605ZU: Intel Core i7-12650H, 16.00", 1.8 kg
  Recensioni esterne » Asus Vivobook 16X K3605ZU

Lenovo LOQ 15APH8: AMD Ryzen 7 7840HS, 15.60", 2.5 kg
  Recensioni esterne » Lenovo LOQ 15APH8

Lenovo Slim Pro 9i 16IRP8: Intel Core i9-13905H, 16.00", 2.2 kg
  Recensioni esterne » Lenovo Slim Pro 9i 16IRP8

Lenovo LOQ 15IRH8 Core i7: Intel Core i7-13620H, 15.60", 2.4 kg
  Recensioni esterne » Lenovo LOQ 15IRH8, i7-13620H RTX 4050

HP Victus 16-r0000ng: Intel Core i7-13700H, 16.10", 2.3 kg
  Recensioni esterne » HP Victus 16-r0000ng

Acer Nitro 16 AN16-41, R5 7640HS RTX 4050: AMD Ryzen 5 7640HS, 16.00", 2.7 kg
  Recensioni esterne » Acer Nitro 16 AN16-41, R5 7640HS RTX 4050

MSI Cyborg 15 A13VE: Intel Core i7-13620H, 15.60", 2 kg
  Recensioni esterne » MSI Cyborg 15 A13VE

Lenovo LOQ 16IRH8, i7-13620H RTX 4050: Intel Core i7-13620H, 16.00", 2.6 kg
  Recensioni esterne » Lenovo LOQ 16IRH8, i7-13620H RTX 4050

Dell XPS 15 9530 RTX 4050: Intel Core i7-13700H, 15.60", 1.9 kg
  Recensioni esterne » Dell XPS 15 9530 RTX 4050

Dell G15 5530, i5-13450HX RTX 4050: Intel Core i5-13450HX, 15.60", 2.7 kg
  Recensioni esterne » Dell G15 5530, i5-13450HX RTX 4050

Acer Nitro 17 AN17-41-R6L9: AMD Ryzen 7 7840HS, 17.30", 3 kg
  Recensioni esterne » Acer Nitro 17 AN17-41-R6L9

Lenovo LOQ 15IRH8, i5-13420H: Intel Core i5-13420H, 15.60", 2.4 kg
  Recensioni esterne » Lenovo LOQ 15IRH8, i5-13420H

Acer Nitro 5 AN515-58, i5-12500H RTX 4050: Intel Core i5-12500H, 15.60", 2.5 kg
  Recensioni esterne » Acer Nitro 5 AN515-58, i5-12500H RTX 4050

Dell G15 5530, RTX 4050: Intel Core i7-13650HX, 15.60", 2.8 kg
  Recensioni esterne » Dell G15 5530, RTX 4050

HP Victus 16-r0076TX: Intel Core i5-13500HX, 16.10", 2.3 kg
  Recensioni esterne » HP Victus 16-r0076TX

Asus ROG Flow Z13 GZ301VU: Intel Core i9-13900H, 13.40", 1.2 kg
  Recensioni esterne » Asus ROG Flow Z13 GZ301VU

Asus VivoBook Pro 15 OLED K6502VU: Intel Core i9-13900H, 15.60", 1.8 kg
  Recensioni esterne » Asus VivoBook Pro 15 OLED K6502VU

Gigabyte G5 MF: Intel Core i5-12500H, 15.60", 1.9 kg
  Recensioni esterne » Gigabyte G5 MF

MSI Bravo 15 C7V: AMD Ryzen 7 7735HS, 15.60", 2.3 kg
  Recensioni esterne » MSI Bravo 15 C7V

Asus ZenBook Pro 14 Duo UX8402VU: Intel Core i9-13900H, 14.50", 1.8 kg
  Recensioni esterne » Asus ZenBook Pro 14 Duo UX8402VU

Asus TUF Gaming F15 FX507VU: Intel Core i7-13700H, 15.60", 2.2 kg
  Recensioni esterne » Asus TUF Gaming F15 FX507VU

Medion Erazer Crawler E40: Intel Core i5-13500H, 15.60", 2.3 kg
  Recensioni esterne » Medion Erazer Crawler E40

Asus TUF Gaming A15 FA507NU: AMD Ryzen 7 7735HS, 15.60", 2.2 kg
  Recensioni esterne » Asus TUF Gaming A15 FA507NU

MSI Stealth 14 Studio A13VE: Intel Core i7-13700H, 14.00", 1.7 kg
  Recensioni esterne » MSI Stealth 14 Studio A13VE

Lenovo Legion Pro 5 16IRX8, i5-13500HX RTX 4050: Intel Core i5-13500HX, 16.00", 2.6 kg
  Recensioni esterne » Lenovo Legion Pro 5 16IRX8, i5-13500HX RTX 4050

Acer Swift X SFX14-71G: Intel Core i7-13700H, 14.50", 1.5 kg
  Recensioni esterne » Acer Swift X SFX14-71G

Acer Nitro 16 AN16-41, R5 7535HS RTX 4050: AMD Ryzen 5 7535HS, 16.00", 2.7 kg
  Recensioni esterne » Acer Nitro 16 AN16-41, R5 7535HS RTX 4050

Lenovo Yoga Pro 7 14IRH G8: Intel Core i7-13700H, 14.50", 1.5 kg
  Recensioni esterne » Lenovo Yoga Pro 7 14IRH G8

MSI Cyborg 15 A12VE, i7-12650H: Intel Core i7-12650H, 15.60", 2 kg
  Recensioni esterne » MSI Cyborg 15 A12VE, i7-12650H

Lenovo Ideapad Gaming 3 15ARH7, R5 7535HS RTX 4050: AMD Ryzen 5 7535HS, 15.60", 2.3 kg
  Recensioni esterne » Lenovo Ideapad Gaming 3 15ARH7, R5 7535HS RTX 4050

MSI Cyborg 15 A12VE: Intel Core i7-12650H, 15.60", 2 kg
  Recensioni esterne » MSI Cyborg 15 A12VE

Lenovo Yoga Pro 9i 16 2023: Intel Core i7-13705H, 16.00", 2.2 kg
  Recensioni esterne » Lenovo Yoga Pro 9i 16 2023

Acer Predator Helios Neo 16 PHN16-71: Intel Core i5-13500HX, 16.00", 2.6 kg
  Recensioni esterne » Acer Predator Helios Neo 16 PHN16-71

Asus ROG Strix G16 G614JU: Intel Core i5-13450HX, 16.00", 2.5 kg
  Recensioni esterne » Asus ROG Strix G16 G614JU

MSI Prestige 16 Studio A13VE: Intel Core i7-13700H, 16.00", 2.1 kg
  Recensioni esterne » MSI Prestige 16 Studio A13VE

SCHENKER XMG Focus 15 (E23): Intel Core i9-13900HX, 15.60", 2.4 kg
  Recensioni esterne » Schenker XMG Focus 15 (E23)

Asus TUF Gaming F15 FX507ZU: Intel Core i7-12700H, 15.60", 2.2 kg
  Recensioni esterne » Asus TUF Gaming F15 FX507ZU

MSI Katana 15 B13VEK: Intel Core i7-13620H, 15.60", 2.3 kg
  Recensioni esterne » MSI Katana 15 B13VEK

MSI GF63 Thin 12VE-066US: Intel Core i7-12650H, 15.60", 1.9 kg
  Recensioni esterne » MSI GF63 Thin 12VE-066US

Asus TUF Gaming A17 FA707NU-HX032W: AMD Ryzen 7 7735HS, 17.30", 2.6 kg
  Recensioni esterne » Asus TUF Gaming A17 FA707NU-HX032W

Alienware x14 R2 2023: Intel Core i7-13620H, 14.00", 1.9 kg
  Recensioni esterne » Alienware x14 R2 2023

MSI GF63 Thin 12VE: Intel Core i5-12450H, 15.60", 1.9 kg
  Recensioni esterne » MSI GF63 Thin 12VE

Lenovo LOQ 15IRH8: Intel Core i7-13700H, 15.60", 2.4 kg
  Recensioni esterne » Lenovo LOQ 15IRH8

MSI Katana 15 B12VEK: Intel Core i7-12650H, 15.60", 2.3 kg
  Recensioni esterne » MSI Katana 15 B12VEK

Gigabyte Aero 14 OLED BMF: Intel Core i7-13700H, 14.00", 1.4 kg
  Recensioni esterne » Gigabyte Aero 14 OLED BMF

Samsung Galaxy Book3 Ultra 16: Intel Core i7-13700H, 16.00", 1.8 kg
  Recensioni esterne » Samsung Galaxy Book3 Ultra 16

Please share our article, every link counts!

Classe 1

GeForce RTX 2080 Super Mobile

Classe 2

M1 Max 32-Core GPU *
GeForce RTX 2070 Super Mobile
M1 Max 24-Core GPU *
Radeon RX 5700M *
M1 Pro 16-Core GPU *
Radeon PRO W6600M *
GeForce RTX 2070 Super Max-Q
M1 Pro 14-Core GPU *
Quadro P4200
Quadro P5000 Max-Q *
GeForce RTX 3050 4GB Laptop GPU
Quadro P4000 Max-Q
Radeon RX 580X (Laptop) *
Radeon RX 580 (Laptop)
Radeon Pro 5300M
Radeon RX 5300M
Quadro P3000 Max-Q *
Radeon Pro WX 7100 *
Radeon RX 570X (Laptop) *
Radeon RX 570 (Laptop) *
Radeon RX 470 (Laptop) *

Classe 3

GeForce GTX 1050 Ti Mobile
Radeon 680M
Quadro P2000 Max-Q
Radeon R9 M395X
GeForce GTX 1050 Ti Max-Q *
WX Vega M GL
Radeon R9 M485X
GeForce GTX 1050 Max-Q *
Radeon 660M
Radeon RX 560X (Laptop)
Radeon RX 560 (Laptop)
Radeon Pro 560X
Radeon Pro 560
Radeon Pro 460
Radeon Pro WX 4130 *
Quadro P620 *
Radeon RX 550X (Laptop)
Radeon Pro 555X
Radeon Pro 555
Radeon Pro 455
Quadro P600
Radeon RX 540X *
Radeon Pro WX 2100 *
Radeon Pro WX 3100 *
Radeon Pro 450
Radeon 630
Radeon 540X *
Quadro P520
Quadro P500 *
Iris Plus Graphics G7 (Ice Lake 64 EU) *
Vega 10 *
Iris Pro Graphics 580
Vega 9
FirePro W5130M
UHD Graphics Xe G4 48EUs *
UHD Graphics 32EUs
UHD Graphics Xe 32EUs (Tiger Lake-H) *
UHD Graphics 750
Vega 7
Radeon R7 M465
Vega 8
Iris Plus Graphics G4 (Ice Lake 48 EU)
Quadro M600M
FirePro W4190M
Radeon R7 M445
UHD Graphics 24EUs (Alder Lake-N) *
Radeon R7 M340
Radeon 610M *
UHD Graphics G1 (Ice Lake 32 EU)
UHD Graphics Xe 16EUs (Tiger Lake-H) *
Radeon R5 (Bristol Ridge)
Adreno 690 *
Adreno 685 *
Adreno 680 *

Classe 4

UHD Graphics 730
Radeon R5 M315 *
Radeon R5 M420 *
Xclipse 530
UHD Graphics 617
UHD Graphics 615
Radeon R4 (Stoney Ridge)
Radeon R2 (Stoney Ridge)
HD Graphics (Broadwell)

Classe 5

Posizione approssimativa dell'adattatore grafico

> Recensioni e prove di notebook, tablets e smartphones > Info Techniche / Tips > Confronto delle schede video > NVIDIA > NVIDIA NVIDIA GeForce RTX 4050 Laptop GPU
Klaus Hinum, 2023-11-22 (Update: 2023-11-22)