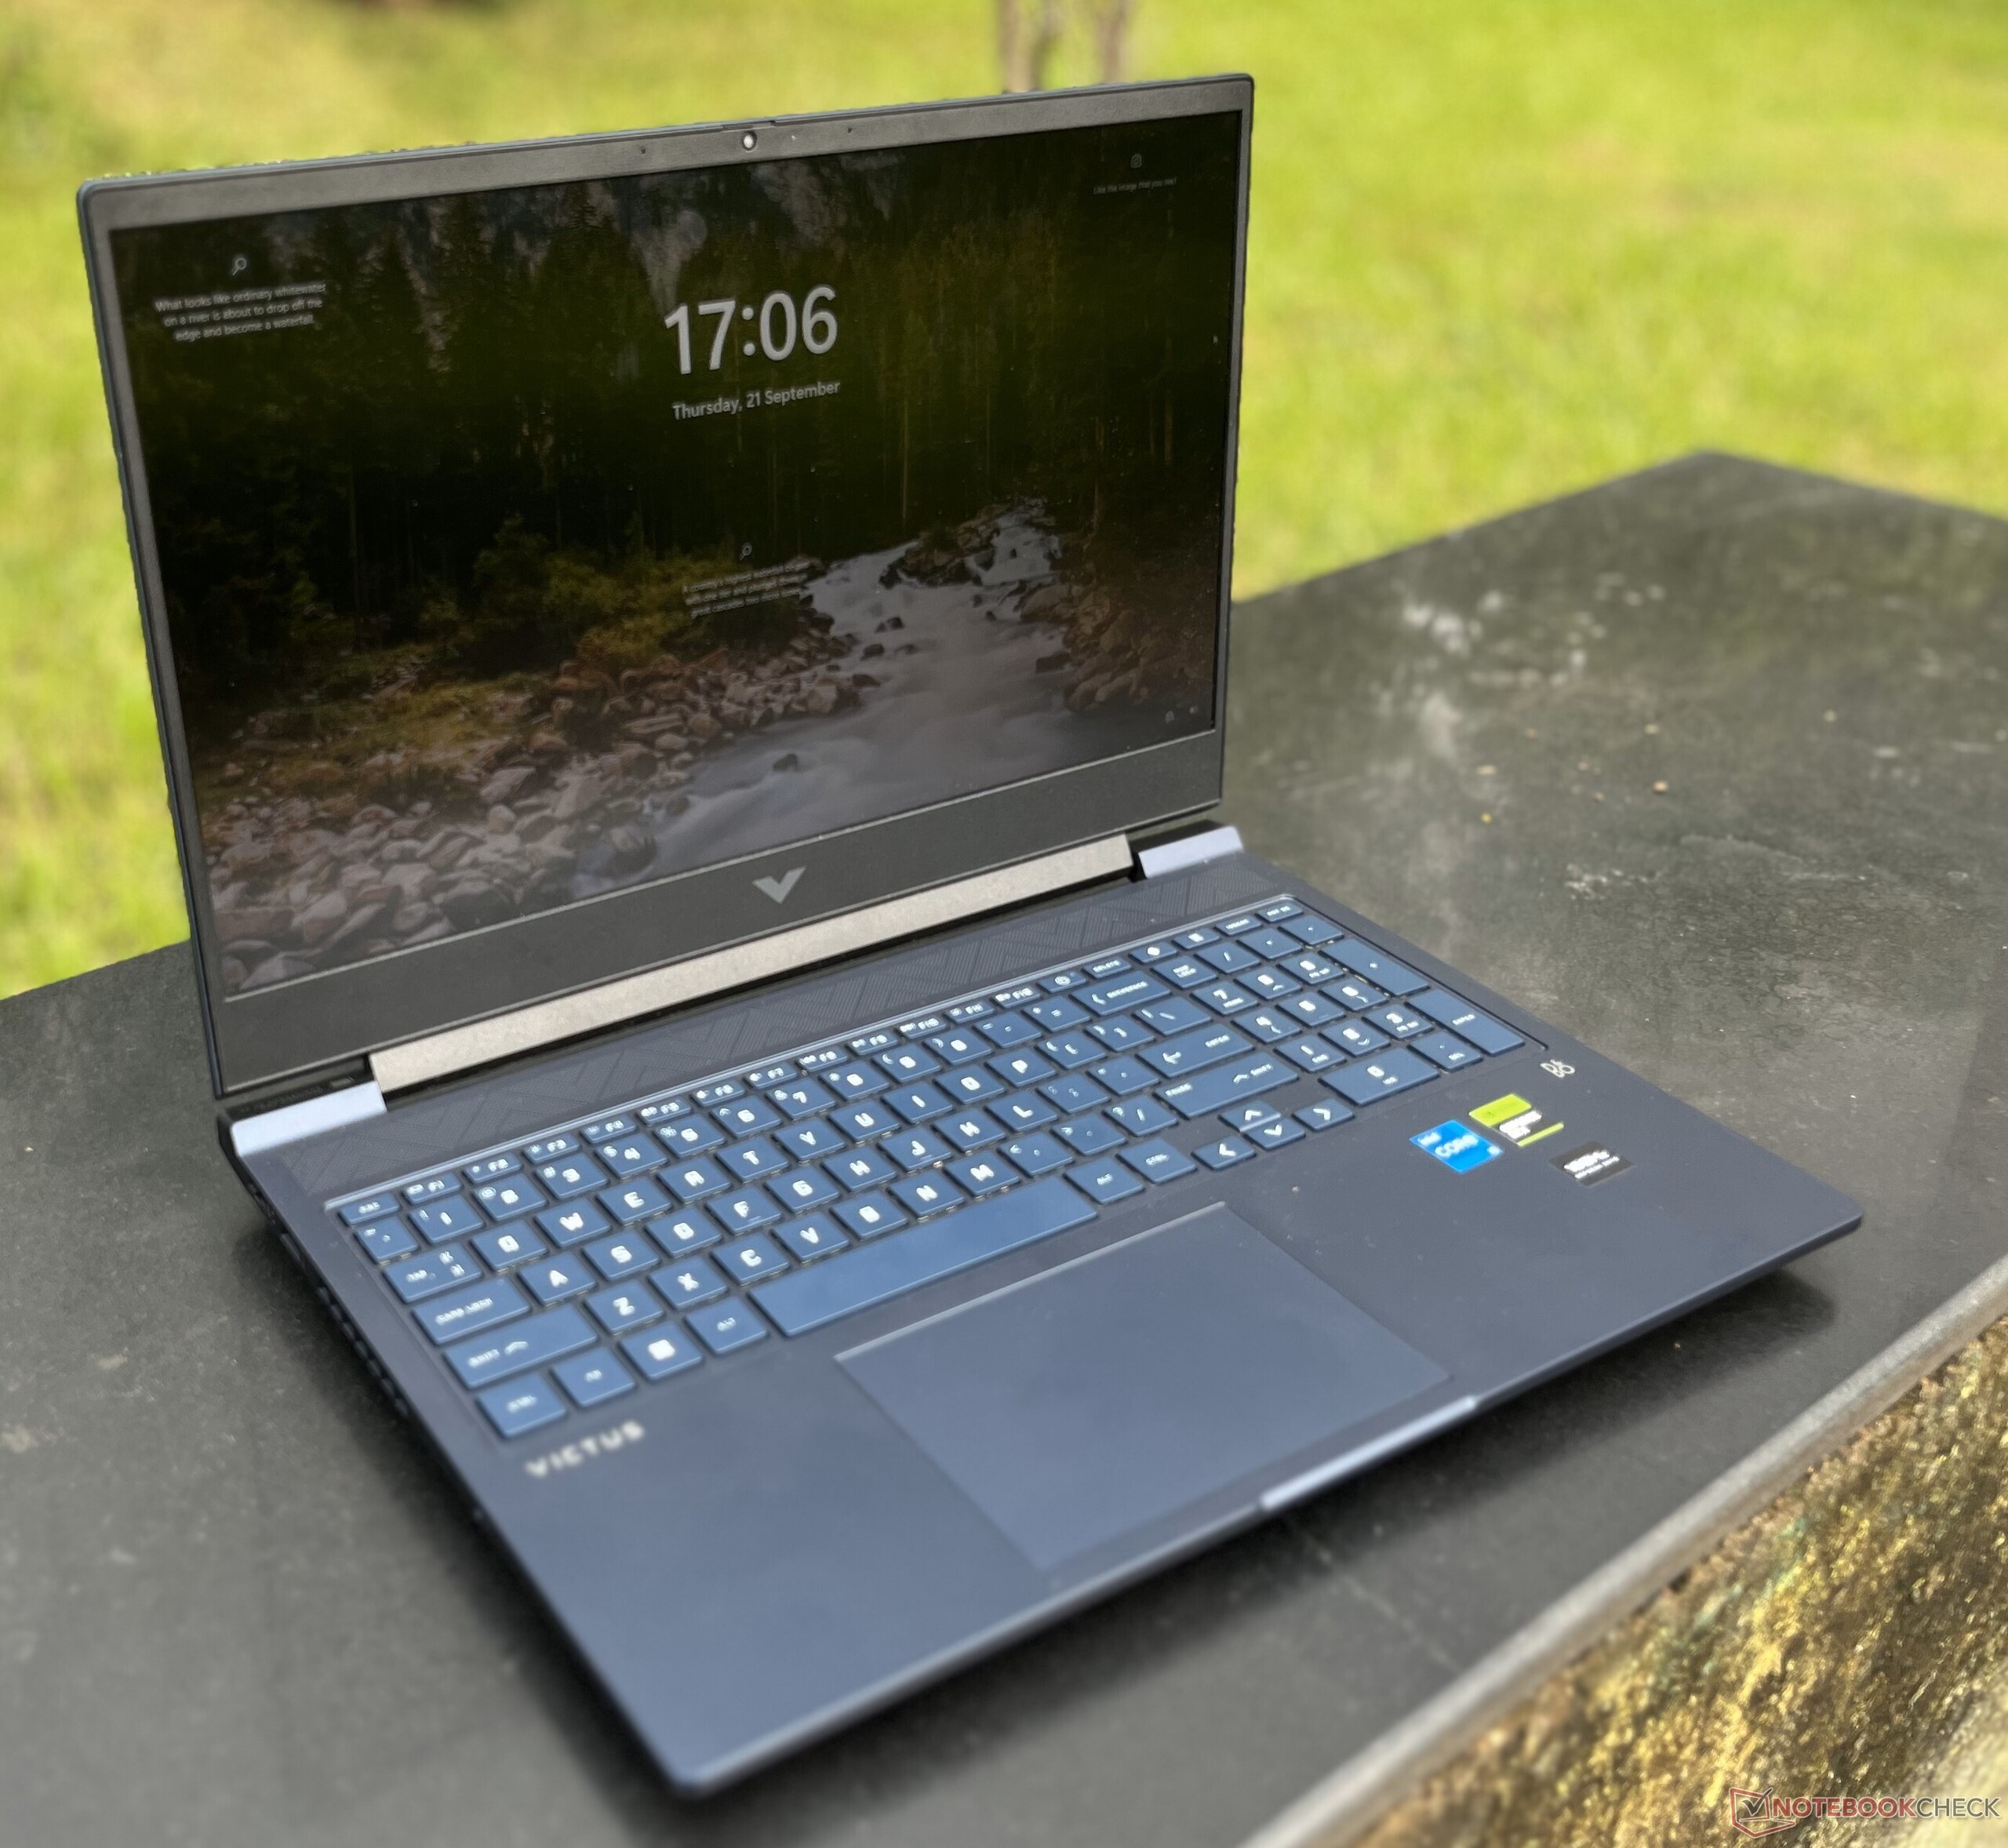
Recensione del portatile HP Victus 16: Una potenza gaming a 1080p con pochi compromessi

La linea di portatili Victus di HP si rivolge a un pubblico attento al budget e alla ricerca di soluzioni di gioco. Tuttavia, il computer è ancora in grado di utilizzare il software Omen, consolidando così la sua posizione nel repertorio dei computer portatili da gioco di HP.
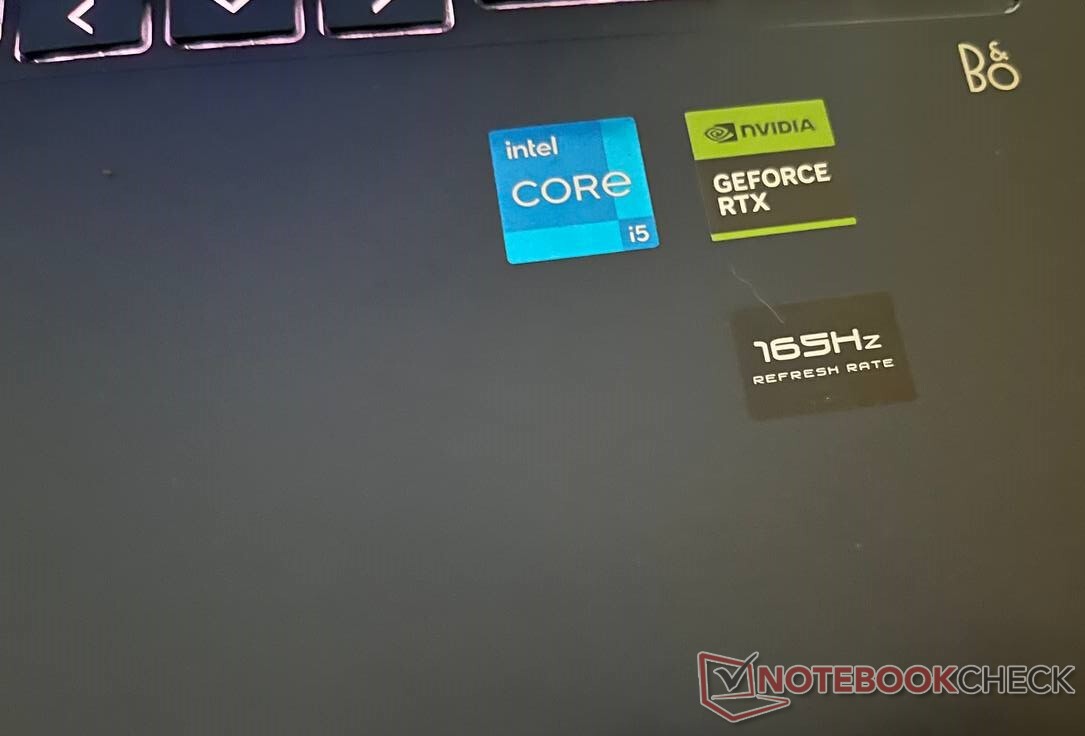
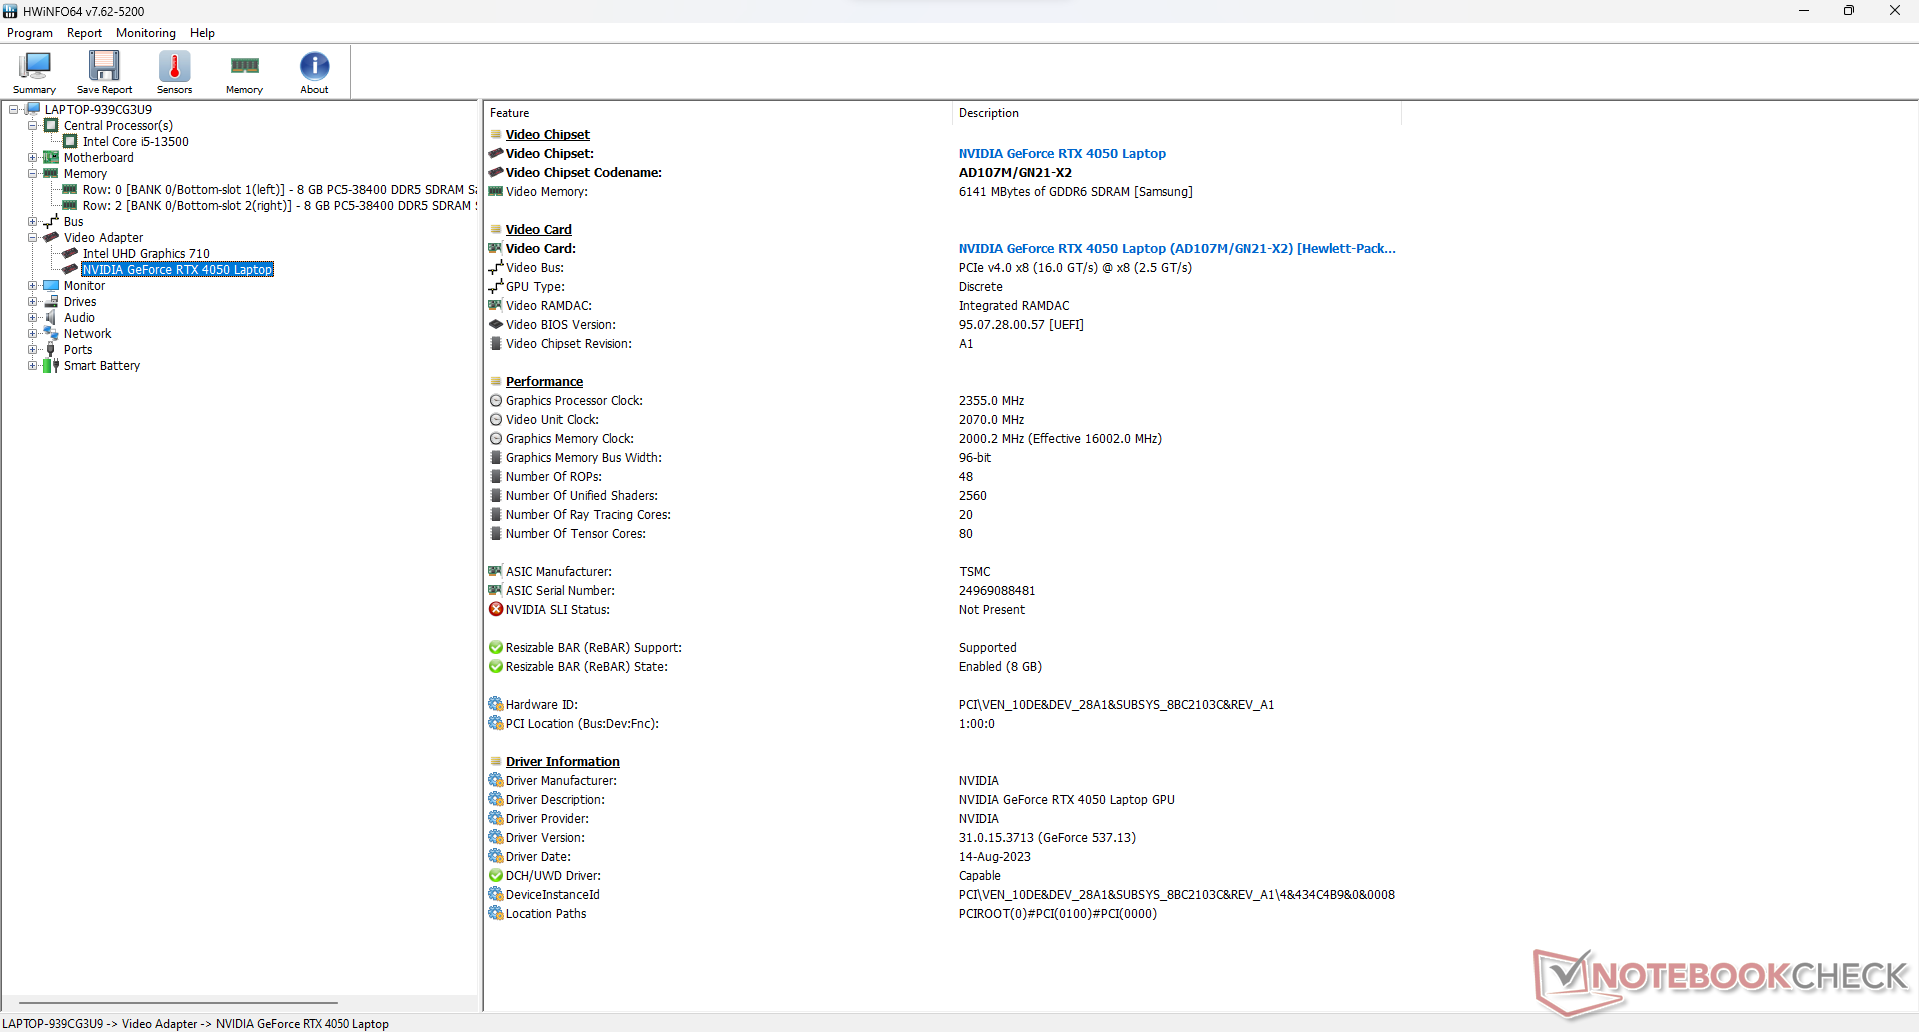
HP Victus 16-r0076TX offre un interessante mix di hardware di fascia media, con un processore Intel Core i5-13500HXraptor Lake-HX e una scheda grafica Nvidia GeForce RTX 4050 (Ada Lovelace).
Si tratta di un miglioramento significativo rispetto alla sua ultima iterazione, l'HP Victus 16-e0145ng HP Victus 16-e0145ngche montava un processore AMD Ryzen 5 5600H e Nvidia GeForce RTX 3050 Ti. Tuttavia, l'aggiornamento delle specifiche è accompagnato da un corrispondente aumento del costo.
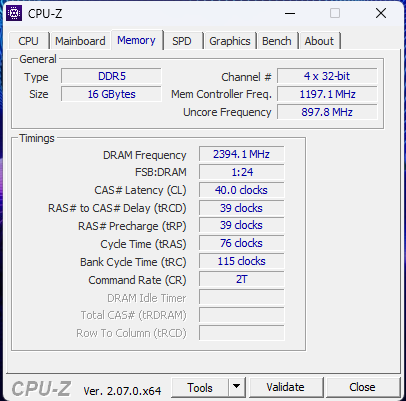
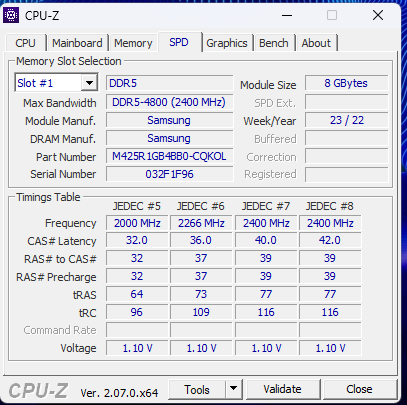
Le altre specifiche includono un pannello IPS da 16 pollici FHD (1.920 x 1.080) con clock a 165 Hz, un SSD NVMe da 512 GB e 16 GB di RAM DDR5 (4.800 MT/s). Si tratta di una macchina interessante che può soddisfare i desideri della maggior parte dei giocatori.
Potenziali concorrenti a confronto
Punteggio | Data | Modello | Peso | Altezza | Dimensione | Risoluzione | Prezzo |
|---|---|---|---|---|---|---|---|
| 85.6 % v7 (old) | 09/2023 | HP Victus 16-r0076TX i5-13500HX, GeForce RTX 4050 Laptop GPU | 2.3 kg | 22.9 mm | 16.10" | 1920x1080 | |
| 86.7 % v7 (old) | 08/2023 | Acer Nitro 16 AN16-41-R7YE R5 7535HS, GeForce RTX 4050 Laptop GPU | 2.6 kg | 27.9 mm | 16.00" | 1920x1200 | |
| 87.3 % v7 (old) | 07/2023 | Acer Predator Triton 14 PT14-51 i7-13700H, GeForce RTX 4050 Laptop GPU | 1.7 kg | 19.81 mm | 14.00" | 2560x1600 | |
| 88.3 % v7 (old) | 09/2023 | Alienware m16 R1 Intel i7-13700HX, GeForce RTX 4060 Laptop GPU | 3 kg | 25.4 mm | 16.00" | 2560x1600 | |
| 89.5 % v7 (old) | 07/2023 | Acer Predator Helios 16 PH16-71-731Q i7-13700HX, GeForce RTX 4060 Laptop GPU | 2.6 kg | 26.9 mm | 16.00" | 2560x1600 | |
| 84.2 % v7 (old) | 06/2023 | Dell G15 5530 i7-13650HX, GeForce RTX 4060 Laptop GPU | 3 kg | 26.95 mm | 15.60" | 1920x1080 | |
| 89 % v7 (old) | 08/2023 | Lenovo Legion Pro 5 16ARX8 (R5 7645HX, RTX 4050) R5 7645HX, GeForce RTX 4050 Laptop GPU | 2.5 kg | 27.3 mm | 16.00" | 2560x1600 | |
| 85.7 % v7 (old) | 07/2023 | Lenovo LOQ 15APH8 R7 7840HS, GeForce RTX 4050 Laptop GPU | 2.5 kg | 25.2 mm | 15.60" | 1920x1080 |
Custodia: corpo in plastica robusta con uno schermo fragile
Fin dall'inizio, è evidente che l'HP Victus 16 non è molto portatile. D'altra parte, i portatili da gioco sono raramente leggeri e, con un peso di 2,3 kg, il portatile si colloca effettivamente nella fascia più leggera dello spettro.
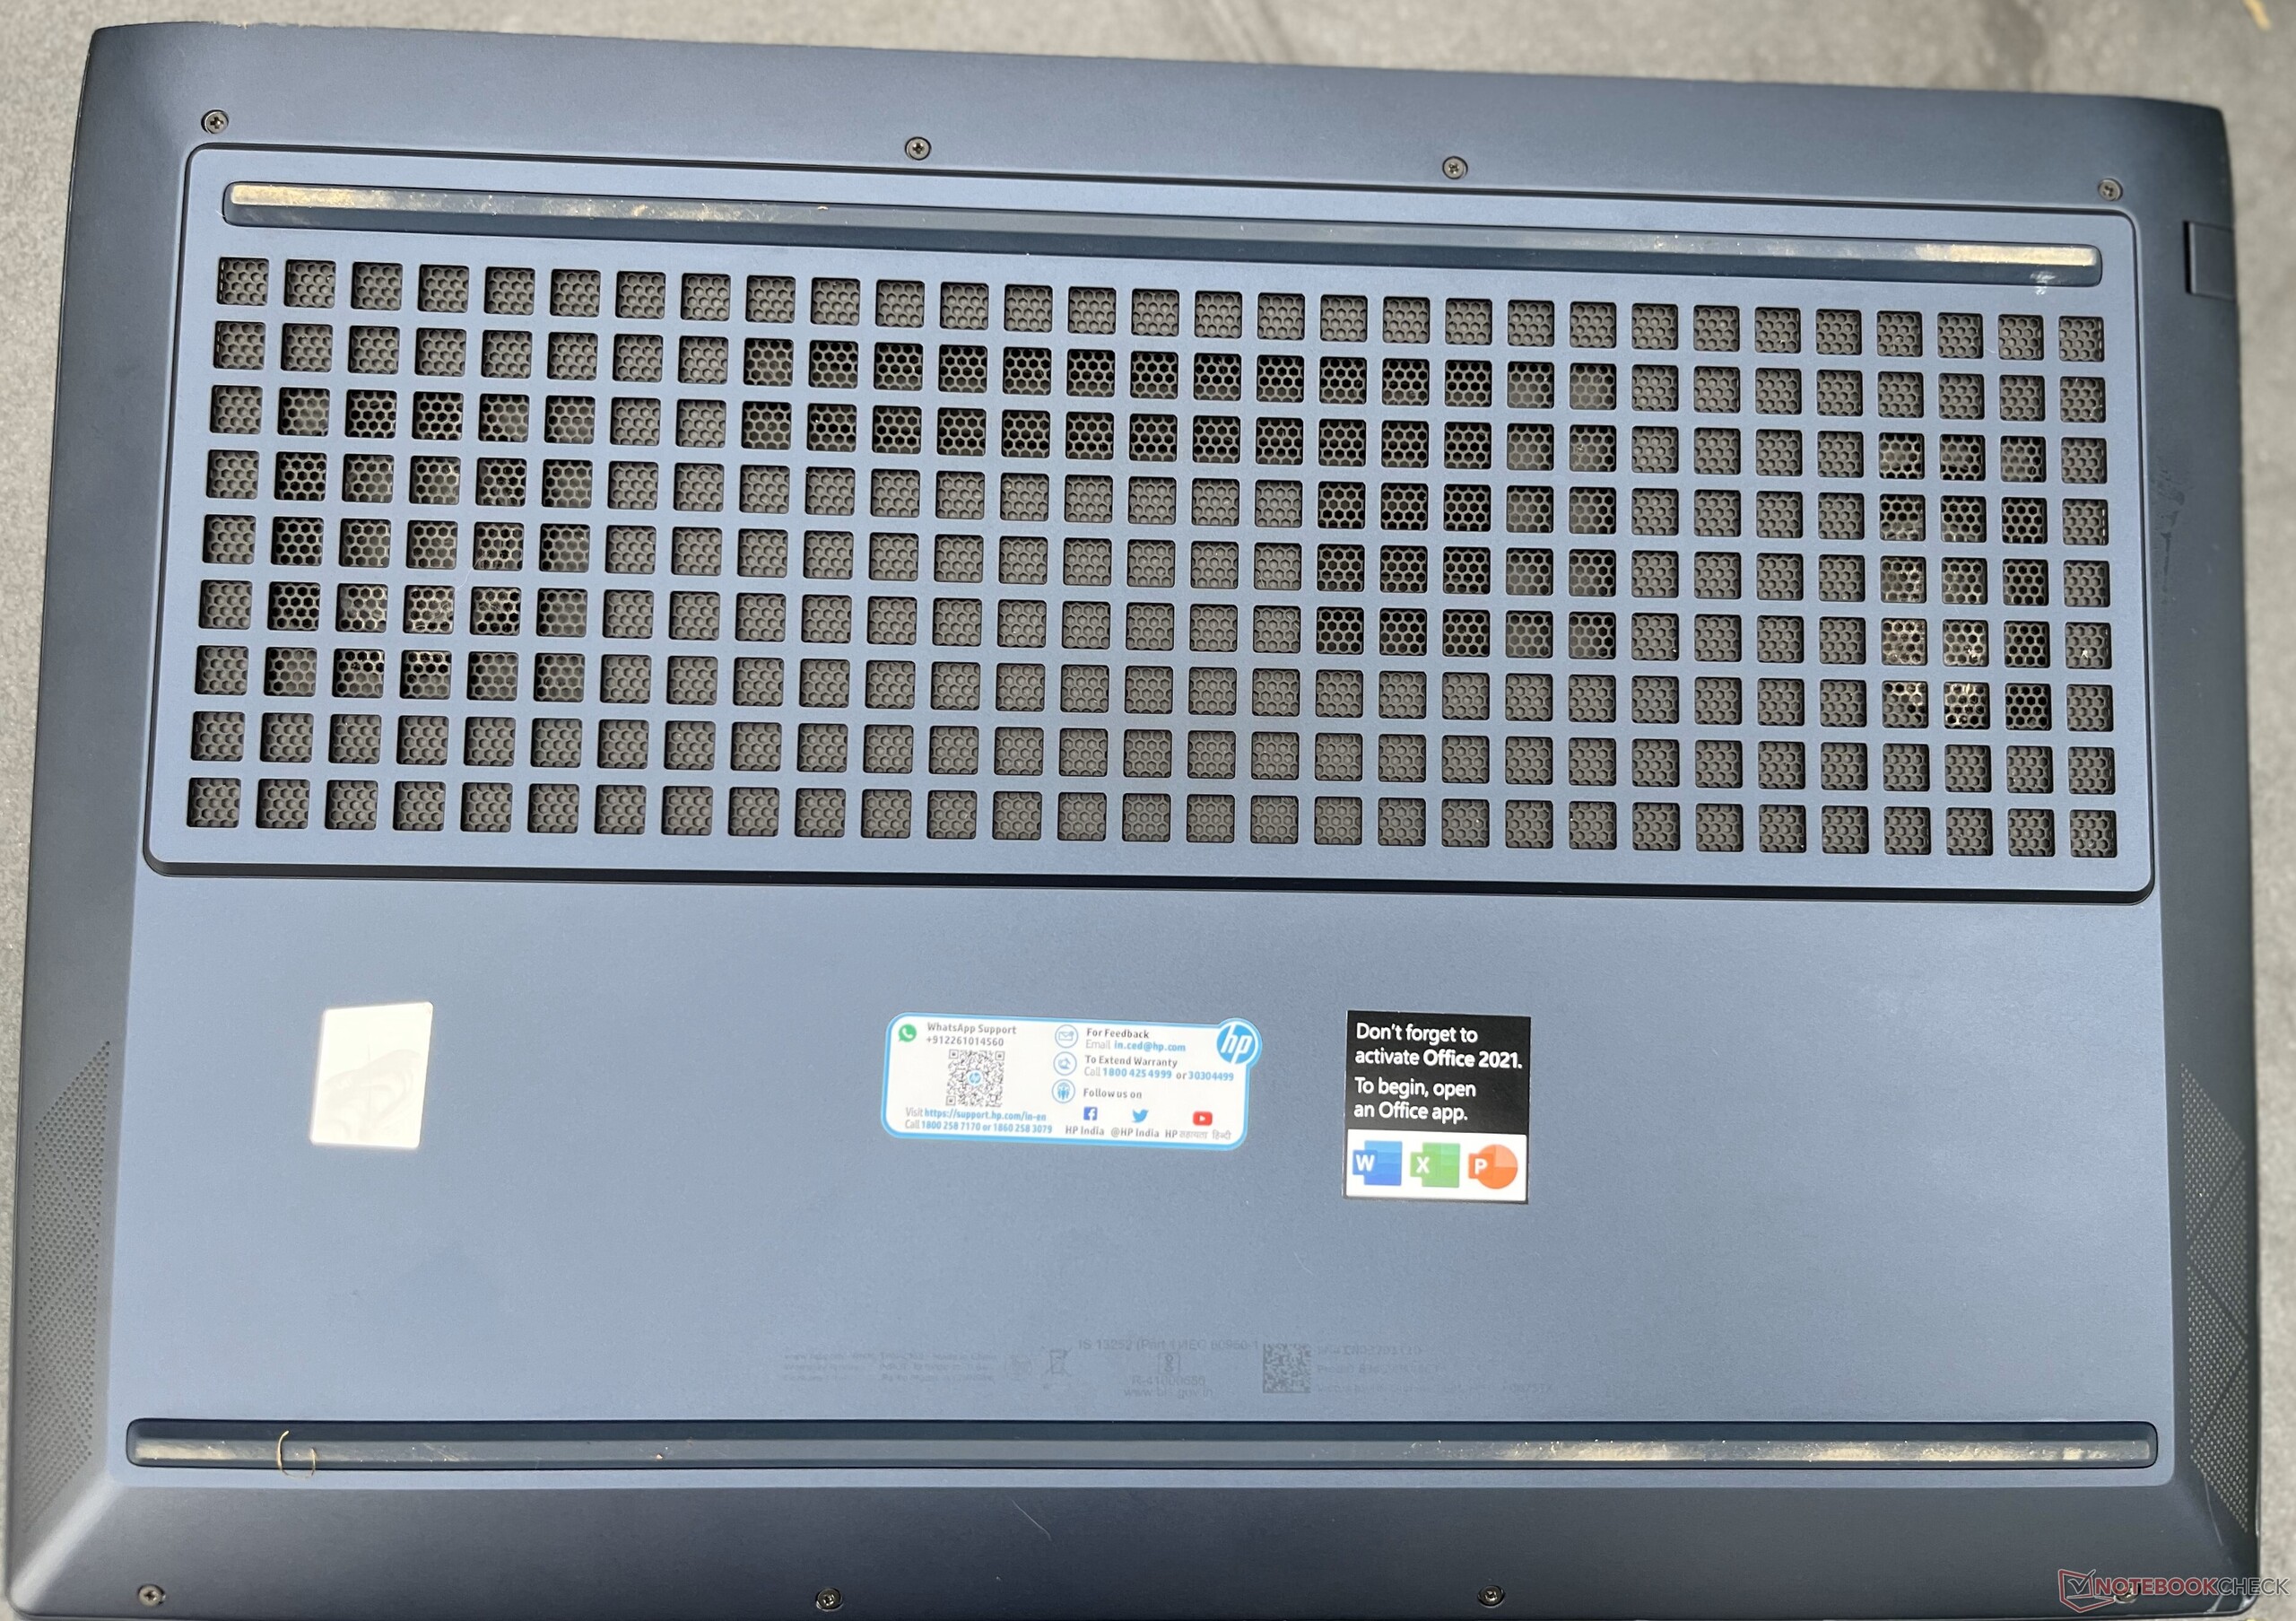
Lo chassis completamente nero non presenta molti marchi, se non una "V" sul retro e una serie di adesivi standard sulla parte anteriore. HP mira a mantenere pulito il portatile includendo un filtro antipolvere su tutte le prese d'aria.
Lo schermo da 16 pollici consente ad HP di inserire nel Victus 16 una tastiera completa (tastierino numerico incluso). Lo schermo si flette un po' troppo e sarebbe opportuno che HP lo rivedesse nelle versioni successive.
Connettività: Avrebbe potuto avere più I/O
L'I/O dell'HP Victus 16 è sorprendentemente leggero per un portatile da gioco. Sulla destra si trovano una porta USB-C, due porte USB-A (tutte e tre a 5 Gbps) e una porta HDMI 2.1 a un'estremità. Accanto c'è un connettore a barilotto per il caricabatterie. Le porte USB e HDMI sono un po' troppo vicine, soprattutto vicino alla porta HDMI.
Sull'altro lato sono presenti solo una presa Ethernet RJ-45, una porta USB Type-A e un jack audio da 3,5 mm. Qualche I/O aggiuntivo sul retro sarebbe stato gradito. La porta USB-C sembra quasi un ripensamento, data la sua scarsa velocità.


Comunicazione
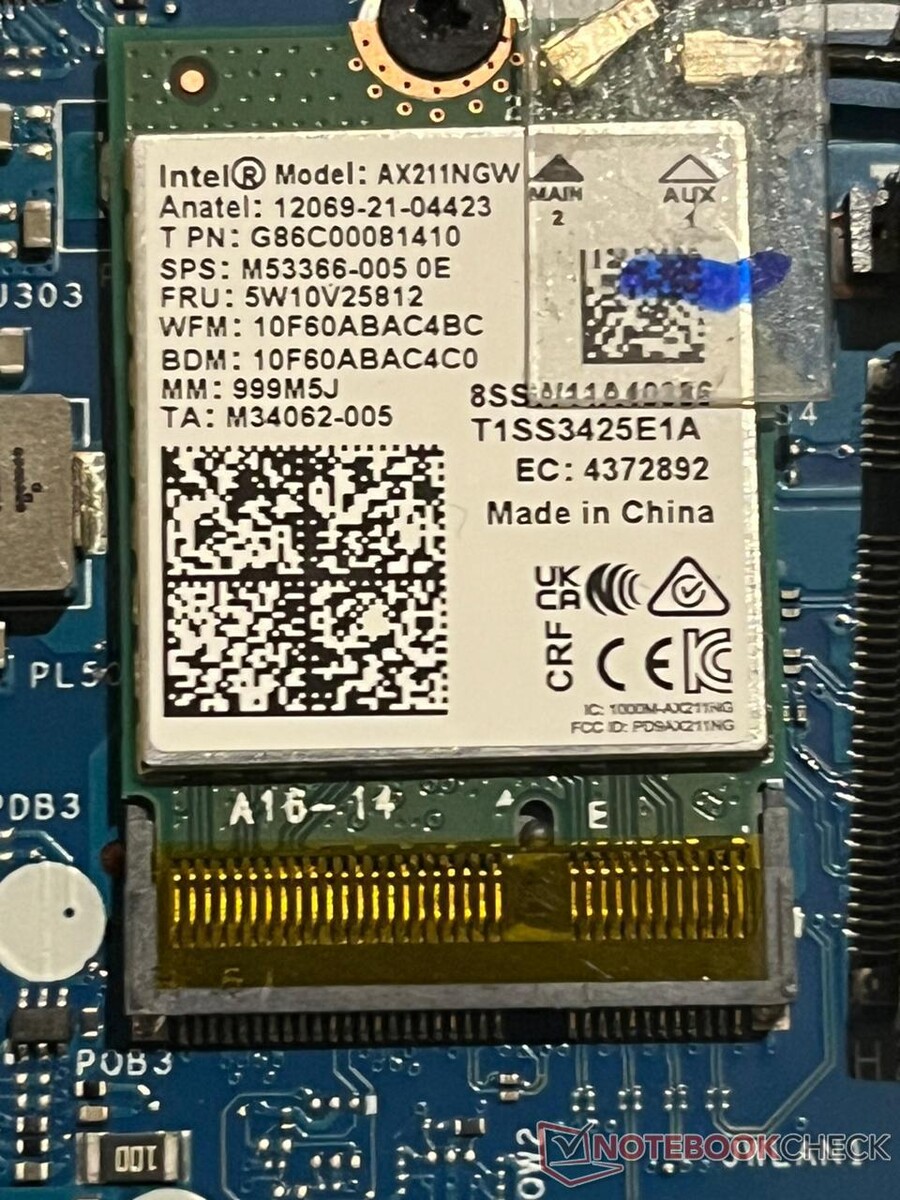
Per un computer portatile entry-level, l'HP Victus 16 ha una buona scelta di opzioni di rete. Sono disponibili il Wi-Fi 6E e una porta Ethernet, entrambi in grado di trasferire file ad alta velocità.
In iPerf3, il modem Wi-Fi 6E di Intel ha potuto ricevere dati a 1.646 Mbps con il nostro router Asus ROG Rapture AXE11000. Si tratta di una velocità molto superiore a quella dei suoi concorrenti, che spesso non dispongono della funzionalità Wi-Fi 6.
| Networking / iperf3 transmit AXE11000 | |
| Lenovo Legion Pro 5 16ARX8 (R5 7645HX, RTX 4050) | |
| Dell G15 5530 | |
| HP Victus 16-r0076TX | |
| Acer Predator Triton 14 PT14-51 | |
| Acer Nitro 16 AN16-41-R7YE | |
| Acer Predator Helios 16 PH16-71-731Q | |
| Alienware m16 R1 Intel | |
| Media della classe Gaming (560 - 1862, n=88, ultimi 2 anni) | |
| Media Intel Wi-Fi 6E AX211 (64 - 1921, n=276) | |
| Lenovo LOQ 15APH8 | |
| Networking / iperf3 receive AXE11000 | |
| Acer Predator Triton 14 PT14-51 | |
| Acer Nitro 16 AN16-41-R7YE | |
| Alienware m16 R1 Intel | |
| Lenovo Legion Pro 5 16ARX8 (R5 7645HX, RTX 4050) | |
| Dell G15 5530 | |
| HP Victus 16-r0076TX | |
| Media della classe Gaming (680 - 1745, n=88, ultimi 2 anni) | |
| Acer Predator Helios 16 PH16-71-731Q | |
| Media Intel Wi-Fi 6E AX211 (582 - 1890, n=276) | |
| Lenovo LOQ 15APH8 | |
| Networking / iperf3 transmit AXE11000 6GHz | |
| Lenovo Legion Pro 5 16ARX8 (R5 7645HX, RTX 4050) | |
| Acer Predator Helios 16 PH16-71-731Q | |
| HP Victus 16-r0076TX | |
| Media della classe Gaming (723 - 1868, n=36, ultimi 2 anni) | |
| Media Intel Wi-Fi 6E AX211 (385 - 1851, n=226) | |
| Networking / iperf3 receive AXE11000 6GHz | |
| Lenovo Legion Pro 5 16ARX8 (R5 7645HX, RTX 4050) | |
| HP Victus 16-r0076TX | |
| Media della classe Gaming (975 - 1775, n=35, ultimi 2 anni) | |
| Media Intel Wi-Fi 6E AX211 (700 - 1857, n=226) | |
| Acer Predator Helios 16 PH16-71-731Q | |
Webcam
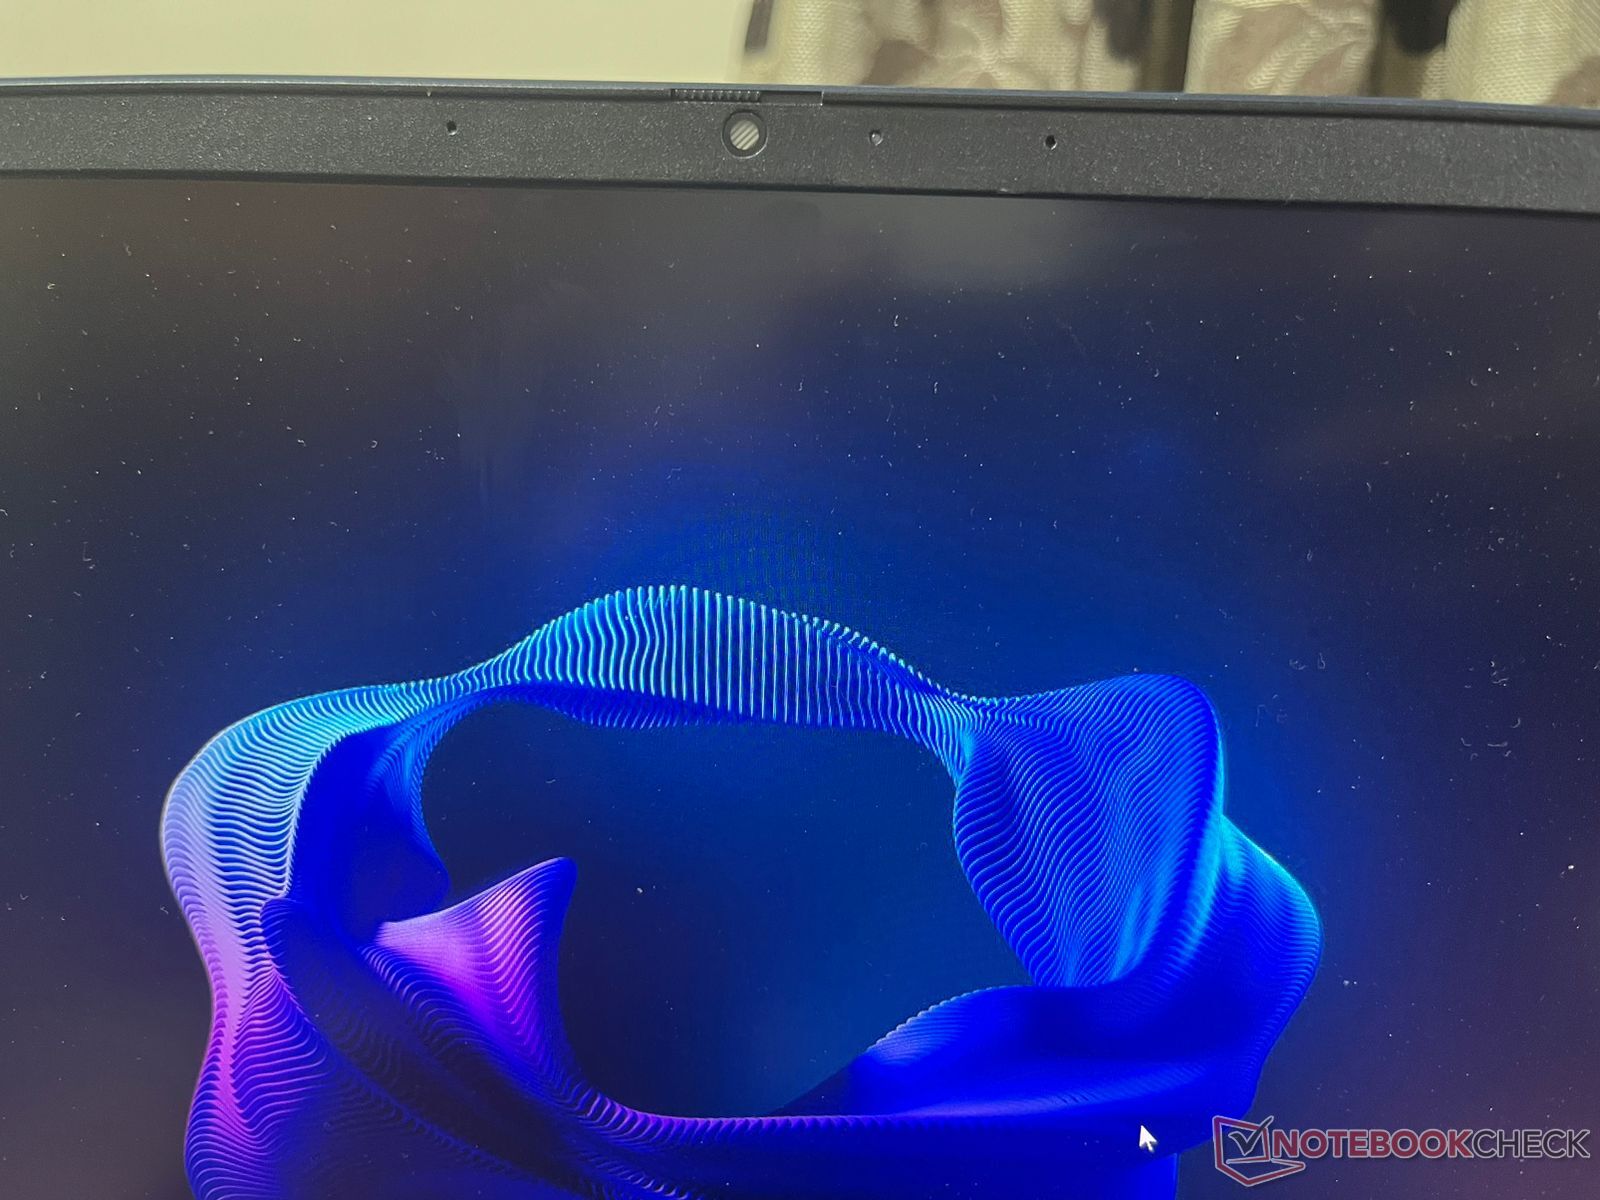
Le webcam sono una rarità nei portatili da gioco e il fatto che l'HP Victus 16 includa un modulo da 1080p (~2 MP) è a dir poco un bonus. Non è molto precisa nei colori, ma dovrebbe coprire compiti di base come videoconferenze e chiamate.
C'è anche un otturatore fisico per la privacy (difficile da trovare) che interrompe completamente la fotocamera. Inoltre, nell'Omen Gaming Hub è presente una sezione dedicata ai miglioramenti della telecamera e del microfono tramite Nvidia Broadcast.


Sicurezza
Le funzioni di sicurezza sono completamente assenti sull'HP Victus 16, fatta eccezione per il modulo TPM, necessario per Windows 11. Non c'è traccia di un sensore di impronte digitali, di Windows Hello e nemmeno di uno slot Kensington Lock. Non c'è traccia di un sensore di impronte digitali, di Windows Hello e nemmeno di uno slot Kensington Lock.
Accessori e garanzia
La confezione dell'HP Victus 16 non ha molto da dire. Si tratta di una confezione essenziale, con il solo portatile e un alimentatore. Tuttavia, quest'ultimo è notevolmente grande, come nel caso della maggior parte dei portatili da gioco.
HP India offre una garanzia limitata di un anno con il Victus 16. Con un sovrapprezzo di ₹2.999 si ottengono altri due anni di garanzia e un piano antivirus per tre anni. Tuttavia, l'offerta è valida per un periodo di tempo limitato.
Manutenzione
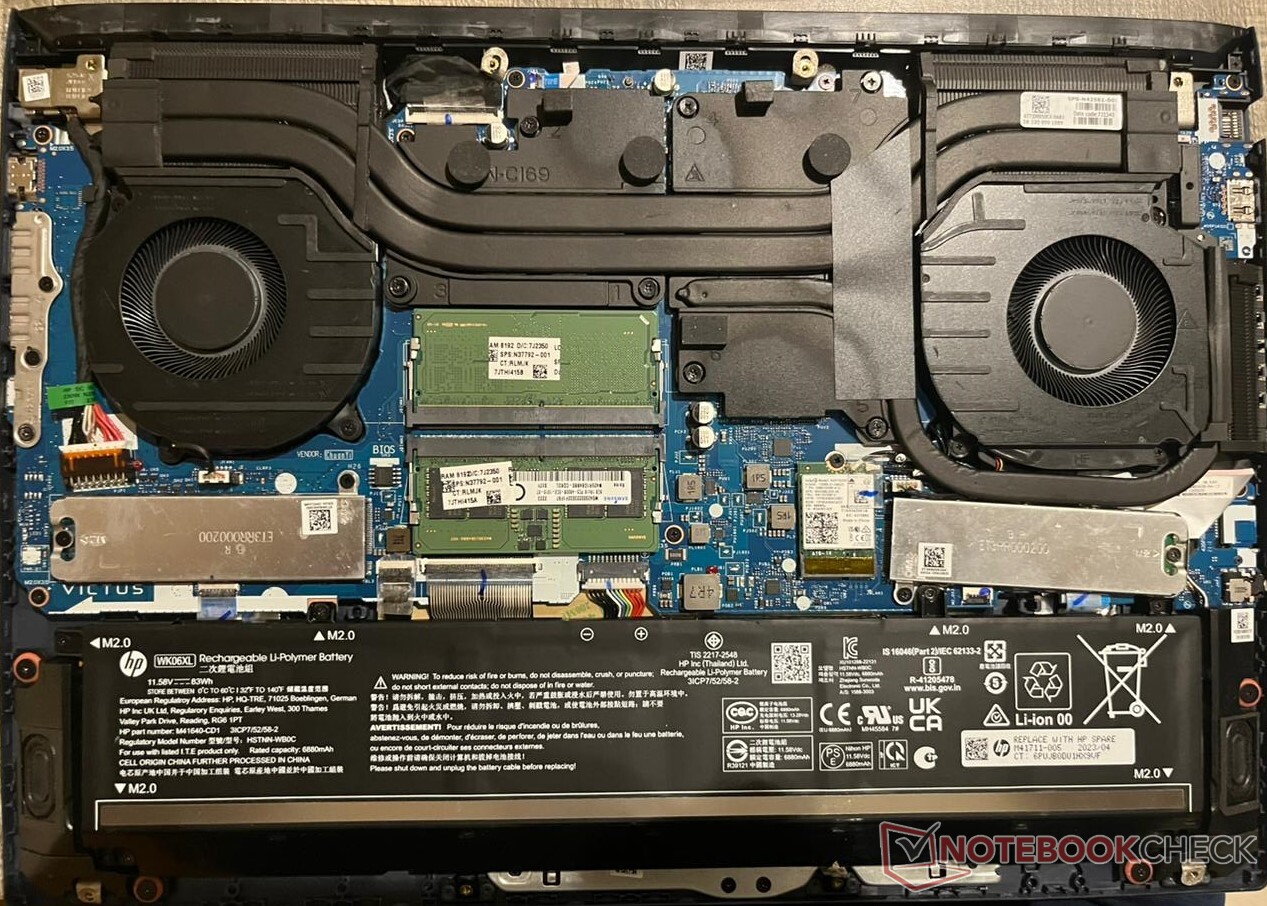
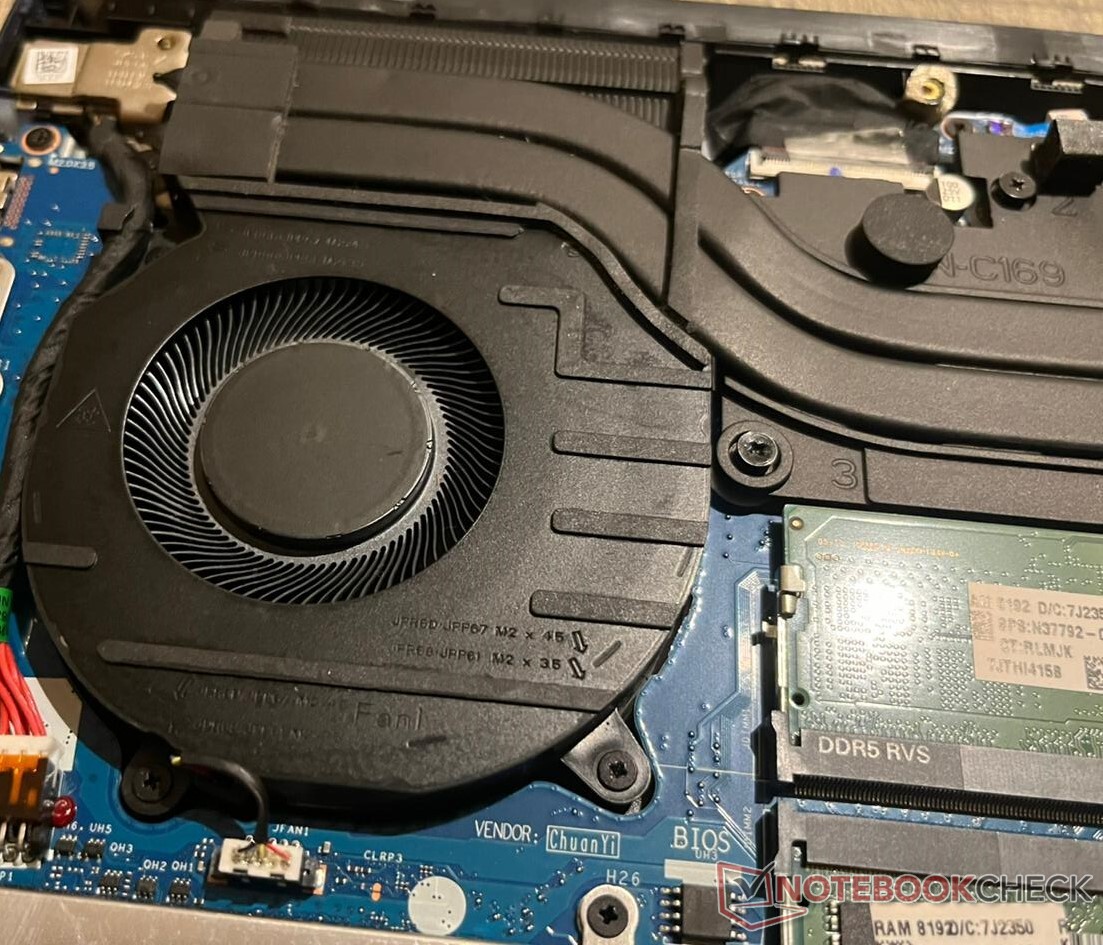
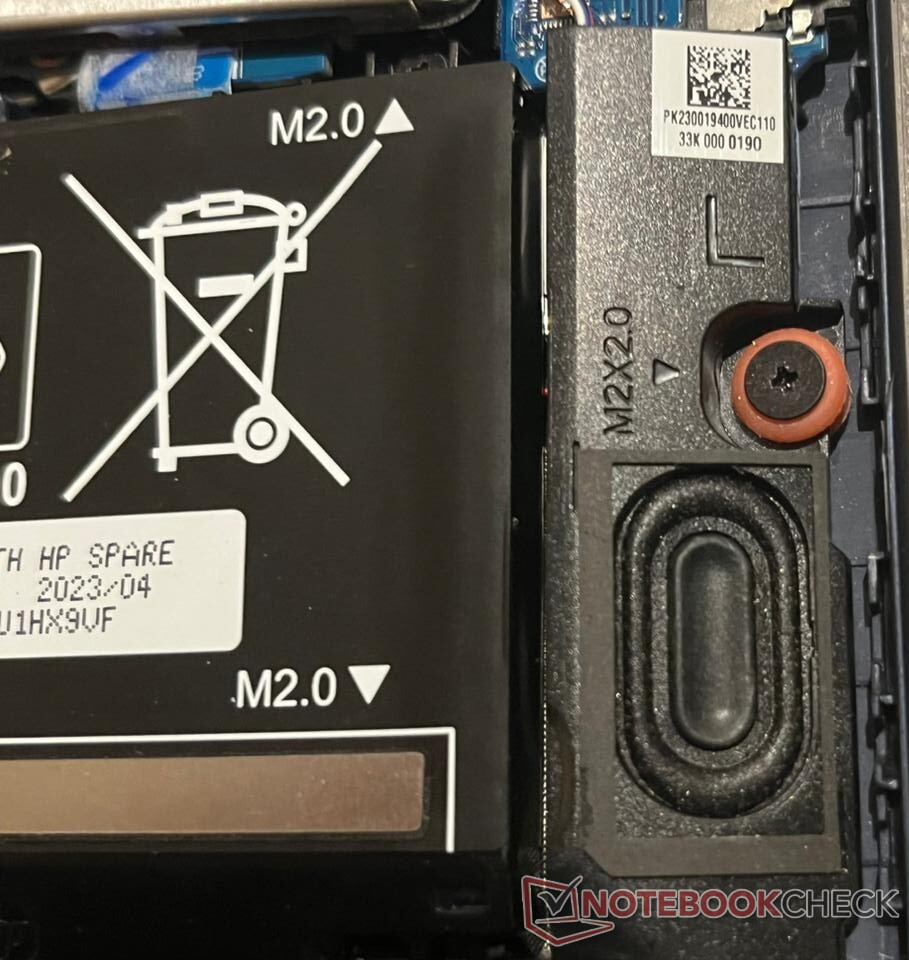
L'accesso all'HP Victus 16 è molto semplice. È sufficiente un cacciavite a croce, svitare le otto viti sul retro e fare leva sulla piastra di copertura. È possibile sostituire la scheda WLAN, la RAM DDR5 e l'unità SSD NVMe. La batteria può essere svitata e sostituita se necessario.
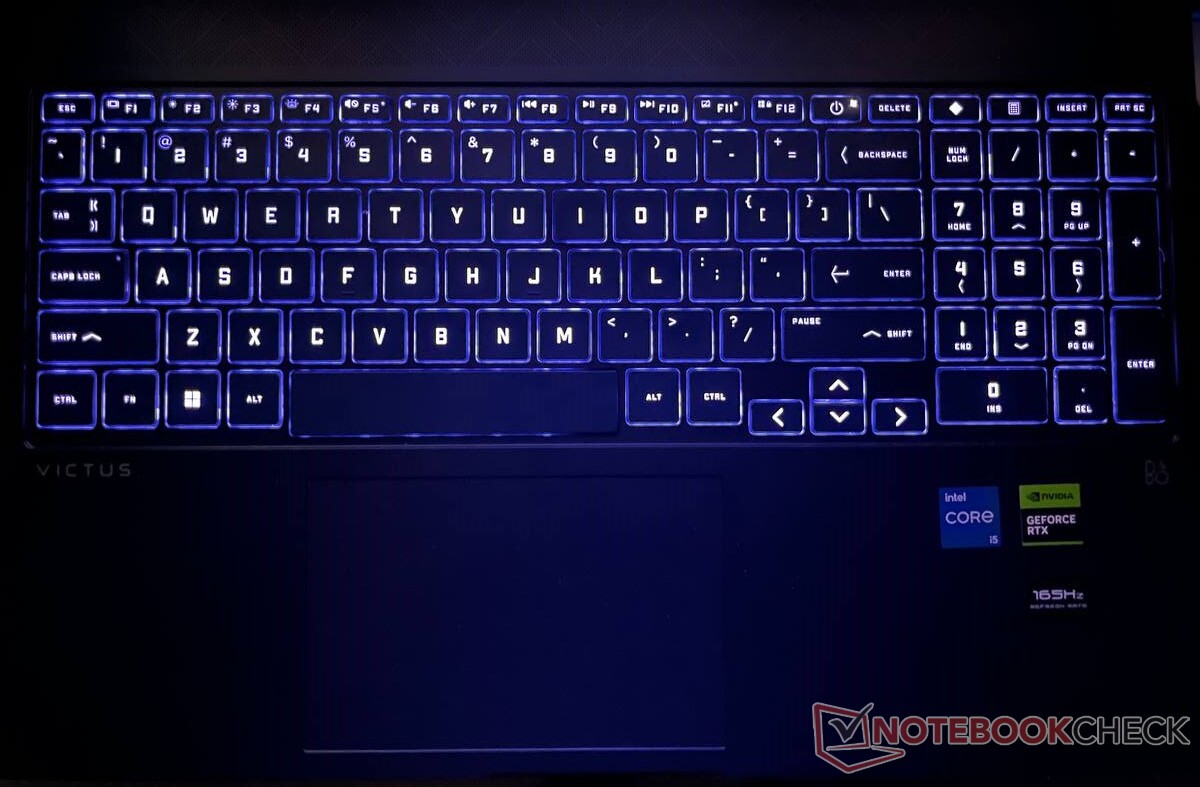
Dispositivi di input: Tastiera decente con illuminazione RGB
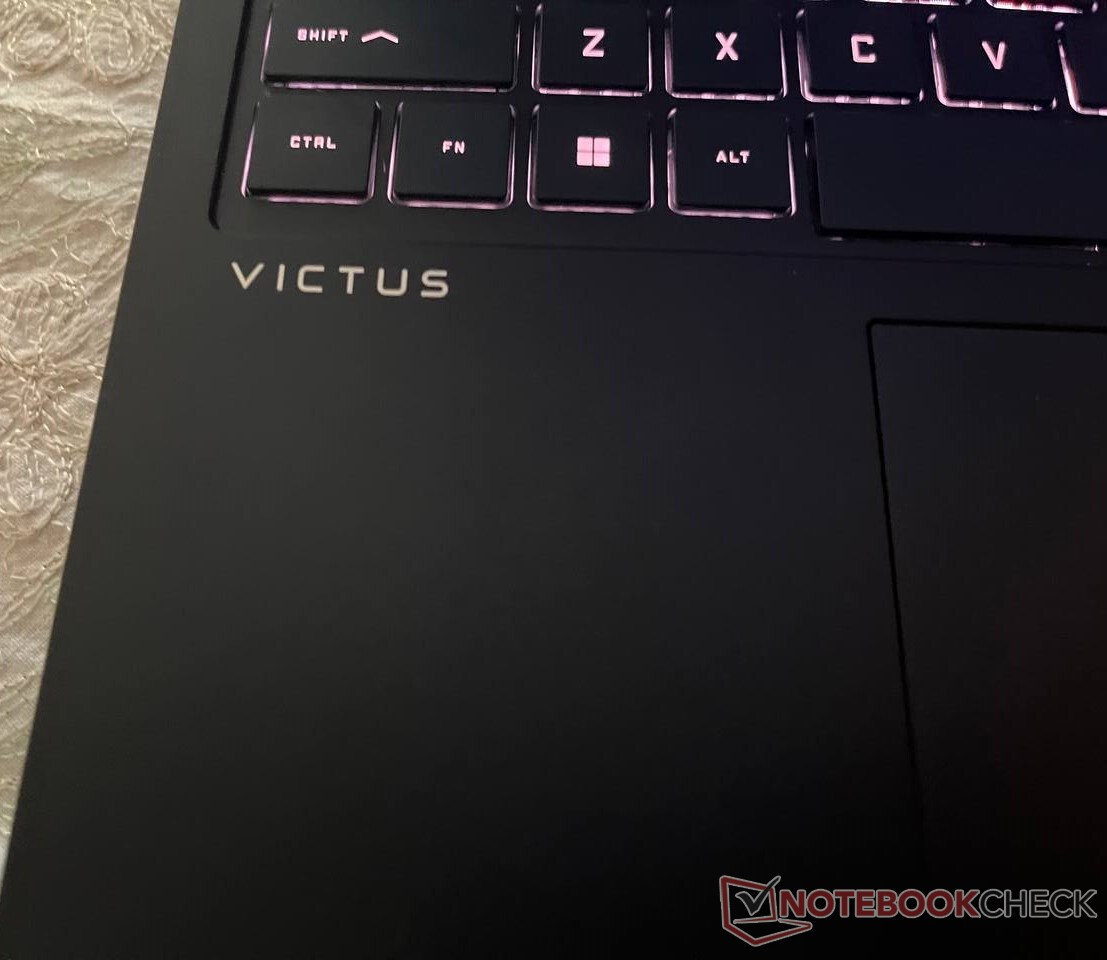
L'HP Victus 16 è dotato di una tastiera completa e di un trackpad sufficientemente ampio. I tasti sono grandi e gli utenti di desktop non dovrebbero impiegare molto a riprogrammare la loro memoria muscolare per lavorare con il portatile. Il tastierino numerico è una gradita aggiunta, ma HP ha scelto di collocare il pulsante di accensione nel peggior posto possibile, accanto al tasto di cancellazione. Ci è voluto un minuto per trovare il pulsante di accensione la prima volta, e siamo abbastanza certi che non saremo gli unici.
Tastiera
I tasti sono un po' molli, ma non troppo da rompere l'immersione. Chi desidera personalizzare l'illuminazione della tastiera può farlo tramite l'app Omen Lighting.
C'è un pulsante dedicato per aprire l'app Omen Gaming Hub e un altro per la calcolatrice.
Nonostante il telaio in plastica, la tastiera è abbastanza robusta e non si flette molto sotto pressione.
Touchpad
Il touchpad è dotato di tutti i gesti di Windows Precision. Tuttavia, l'intero touchpad non è cliccabile e una parte della parte superiore è rigida.
Anche la funzione di riconoscimento del palmo della mano è perfetta, in quanto non tiene conto dei passaggi e dei clic accidentali durante la digitazione. Il tracciamento e i gesti lungo i bordi funzionano senza problemi.
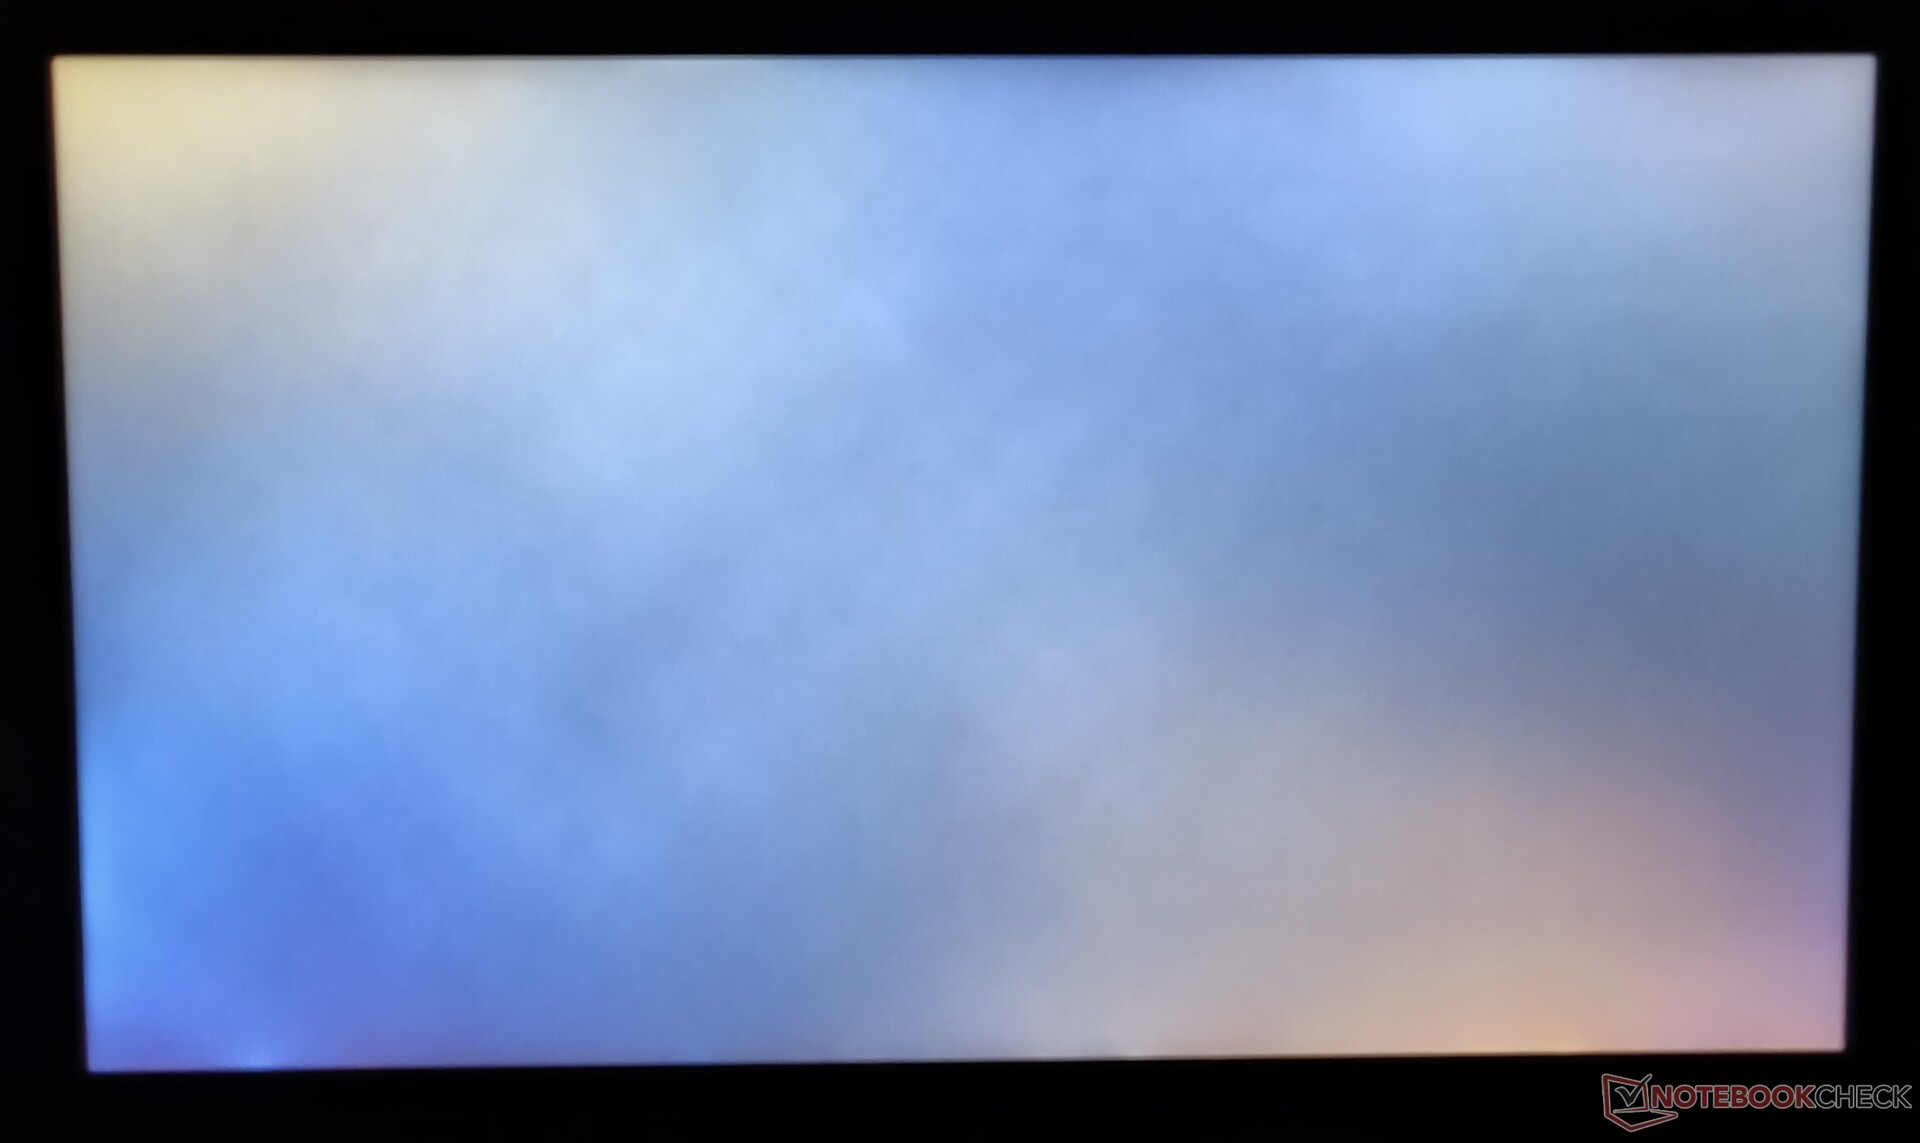
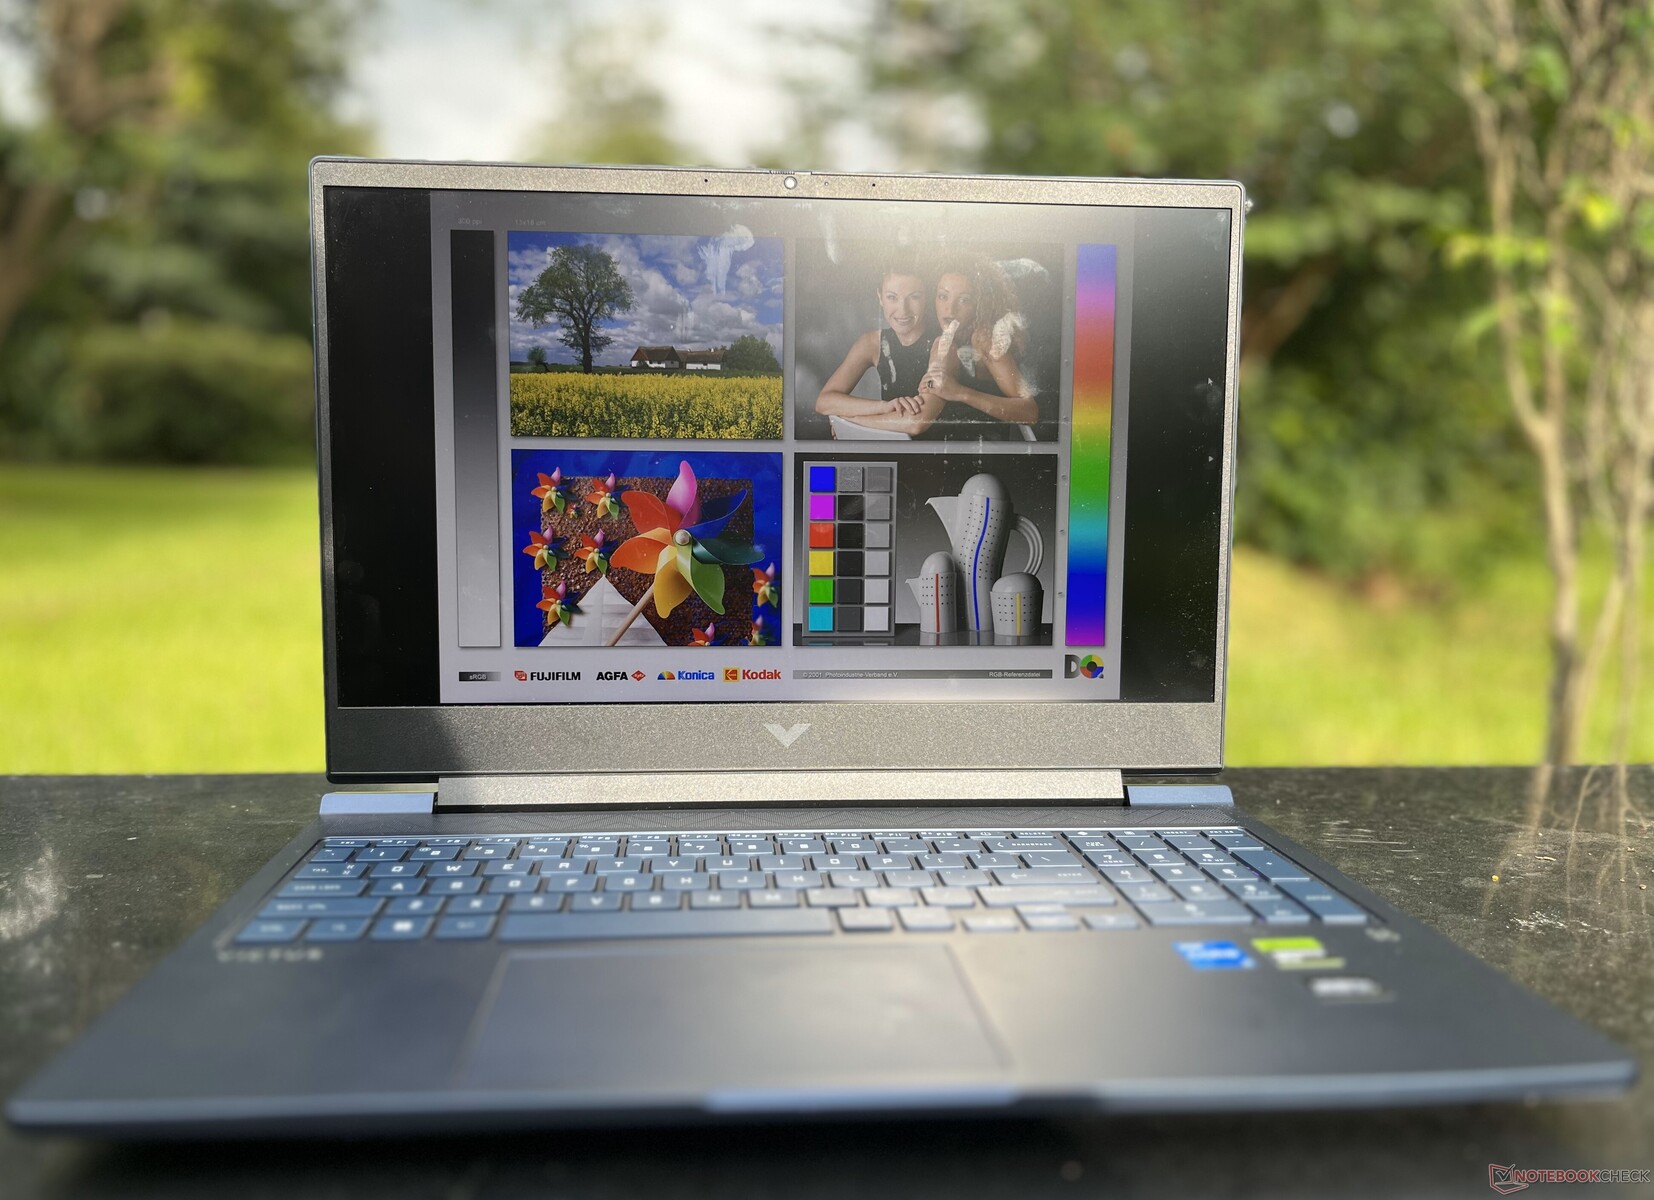
Display: Schermo a 165 Hz con luminosità inferiore alla media
Il nostro HP Victus 16 è dotato di un pannello LCD IPS da 16,1 pollici FHD (1.920 x 1.080) di Chi Mei. HP offre altre due opzioni di schermo con le SKU del Victus 16, 144 Hz FHD e 240 Hz QHD (2.550 x 1.440).
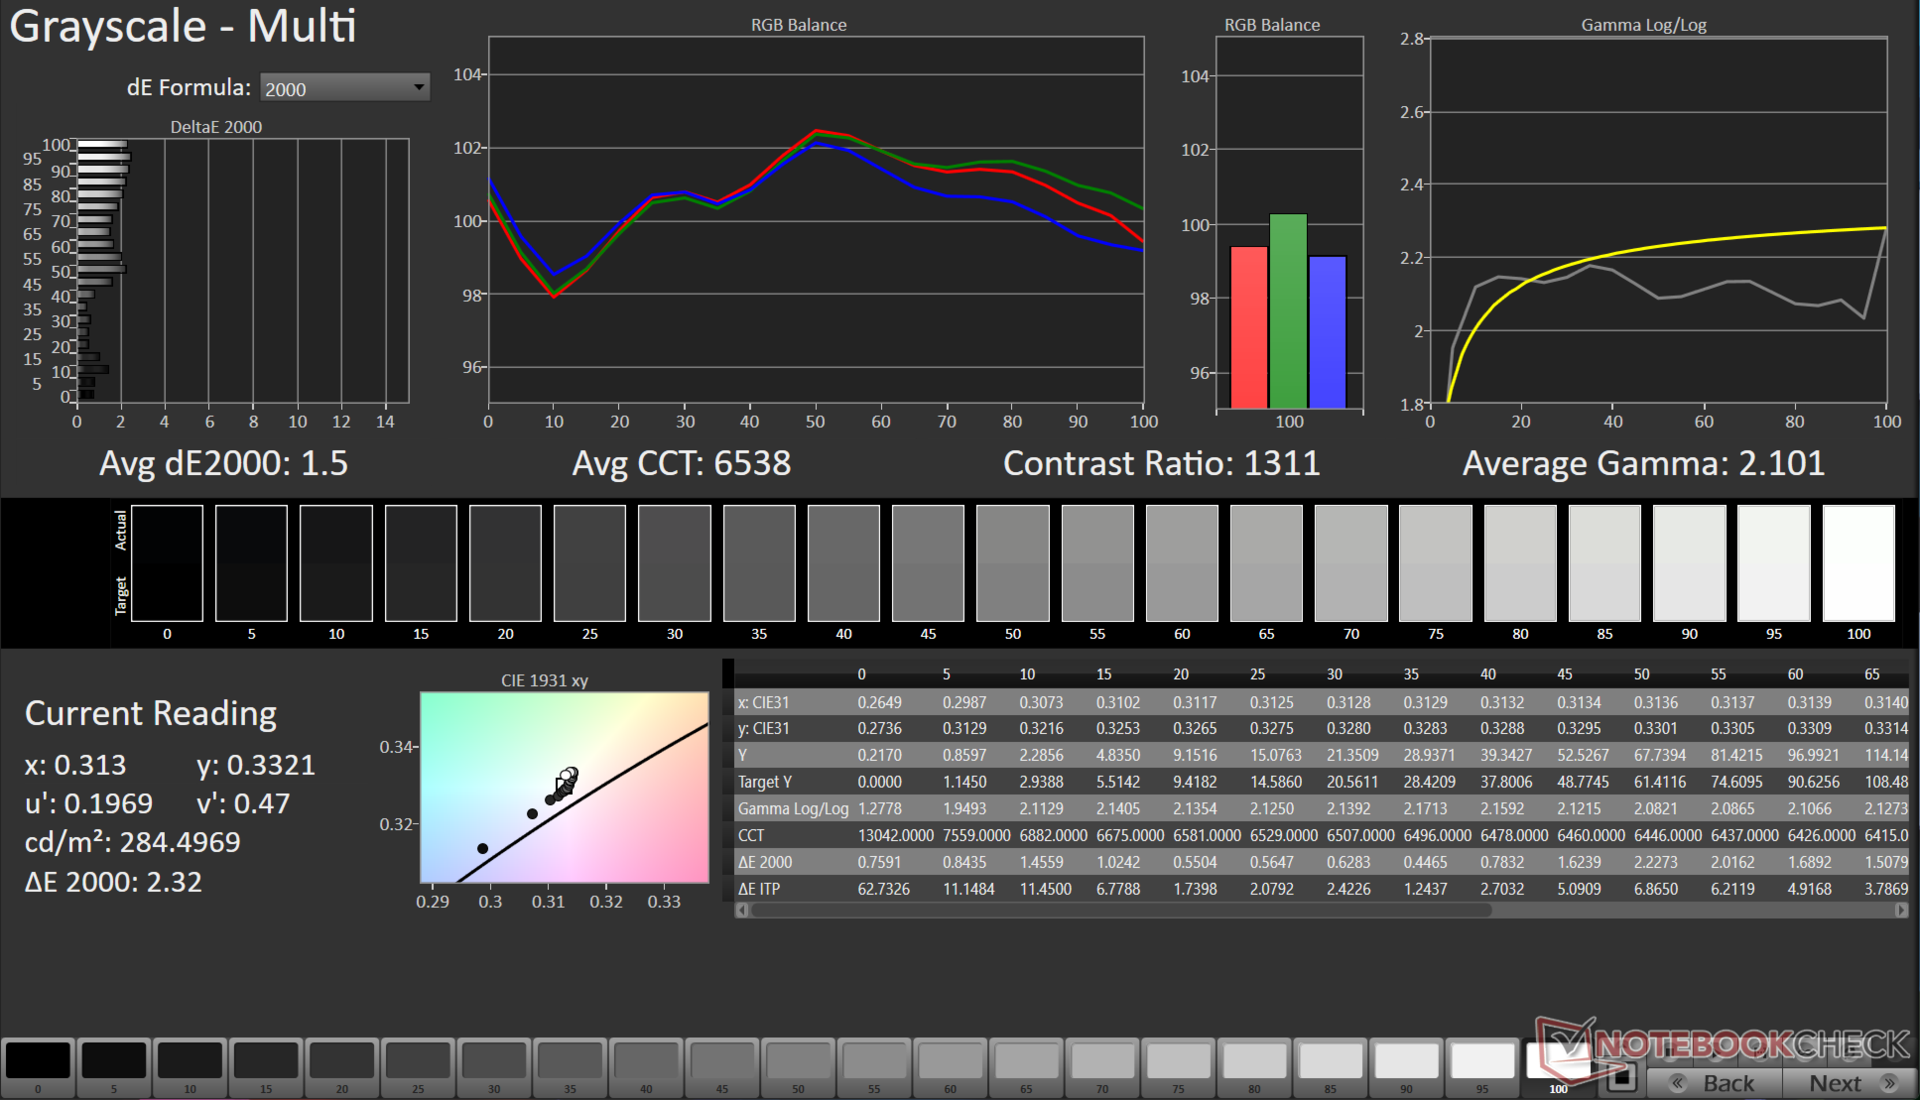
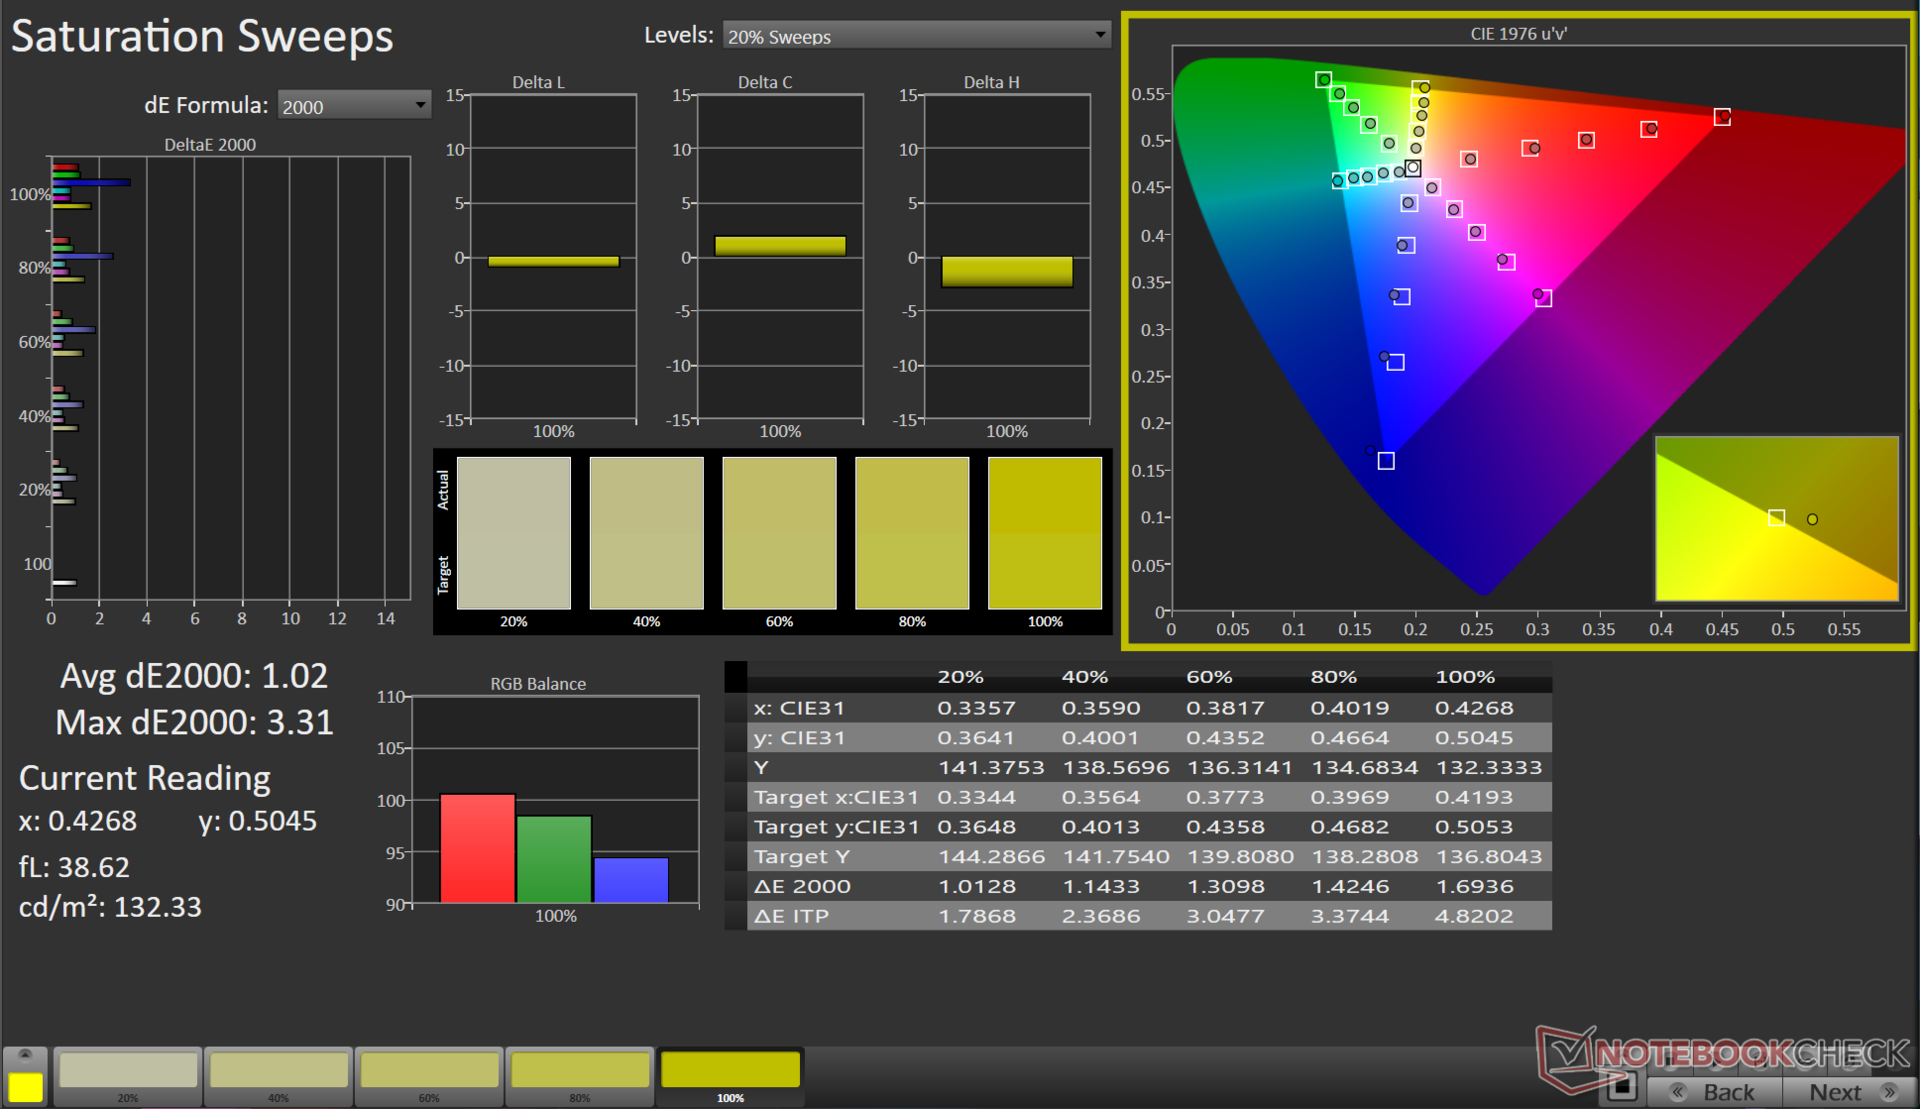
Sul sito web di HP si legge che questo particolare pannello ha una luminosità di picco di 300 nit. I nostri test confermano la cifra, ma la distribuzione è inferiore (82%). È anche un po' sbilanciata, soprattutto verso il centro-destra.
Infine, il rapporto di contrasto di 1.381:1 si colloca comodamente in un intervallo accettabile. Tuttavia, il pannello è afflitto da un brutto caso di backlight bleed, un problema ricorrente con gli schermi IPS in generale.

| |||||||||||||||||||||||||
Distribuzione della luminosità: 82 %
Al centro con la batteria: 287 cd/m²
Contrasto: 1381:1 (Nero: 0.21 cd/m²)
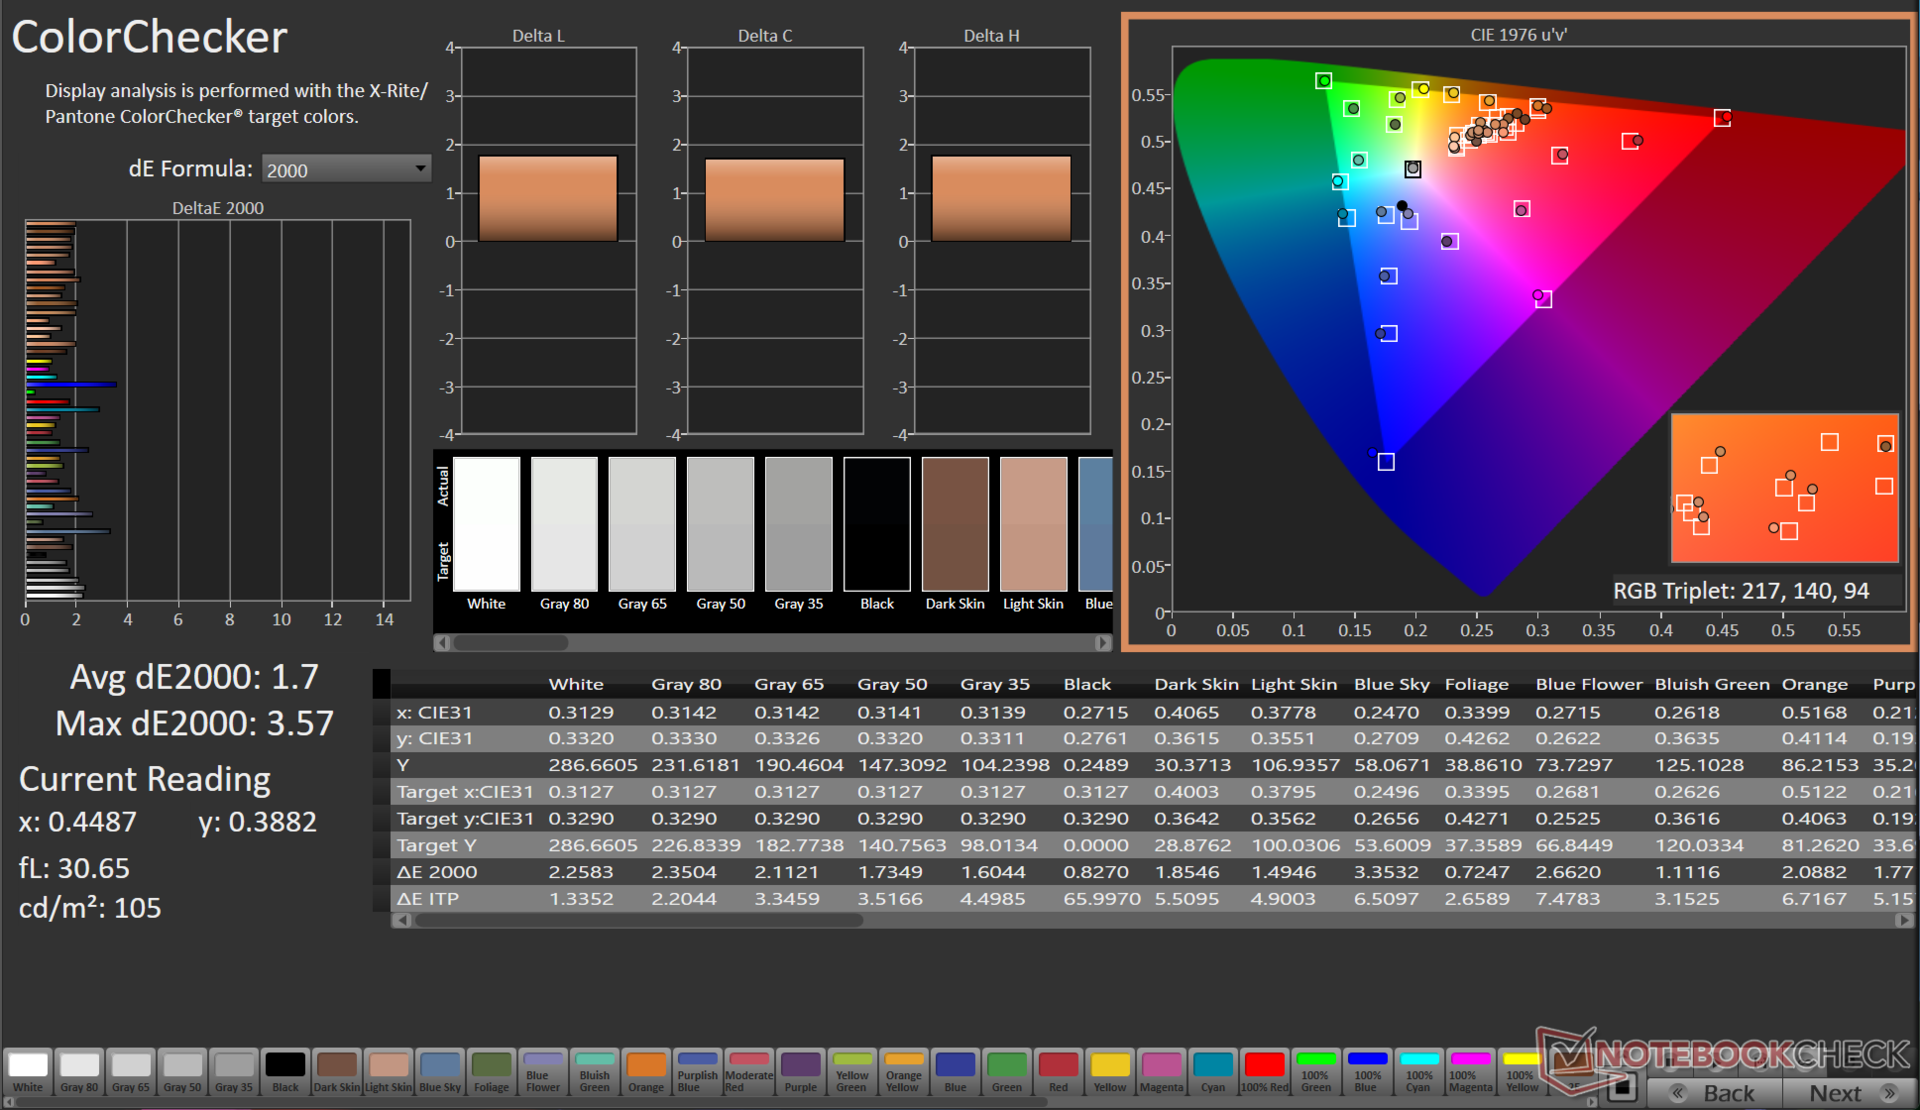
ΔE ColorChecker Calman: 1.7 | ∀{0.5-29.43 Ø4.71}
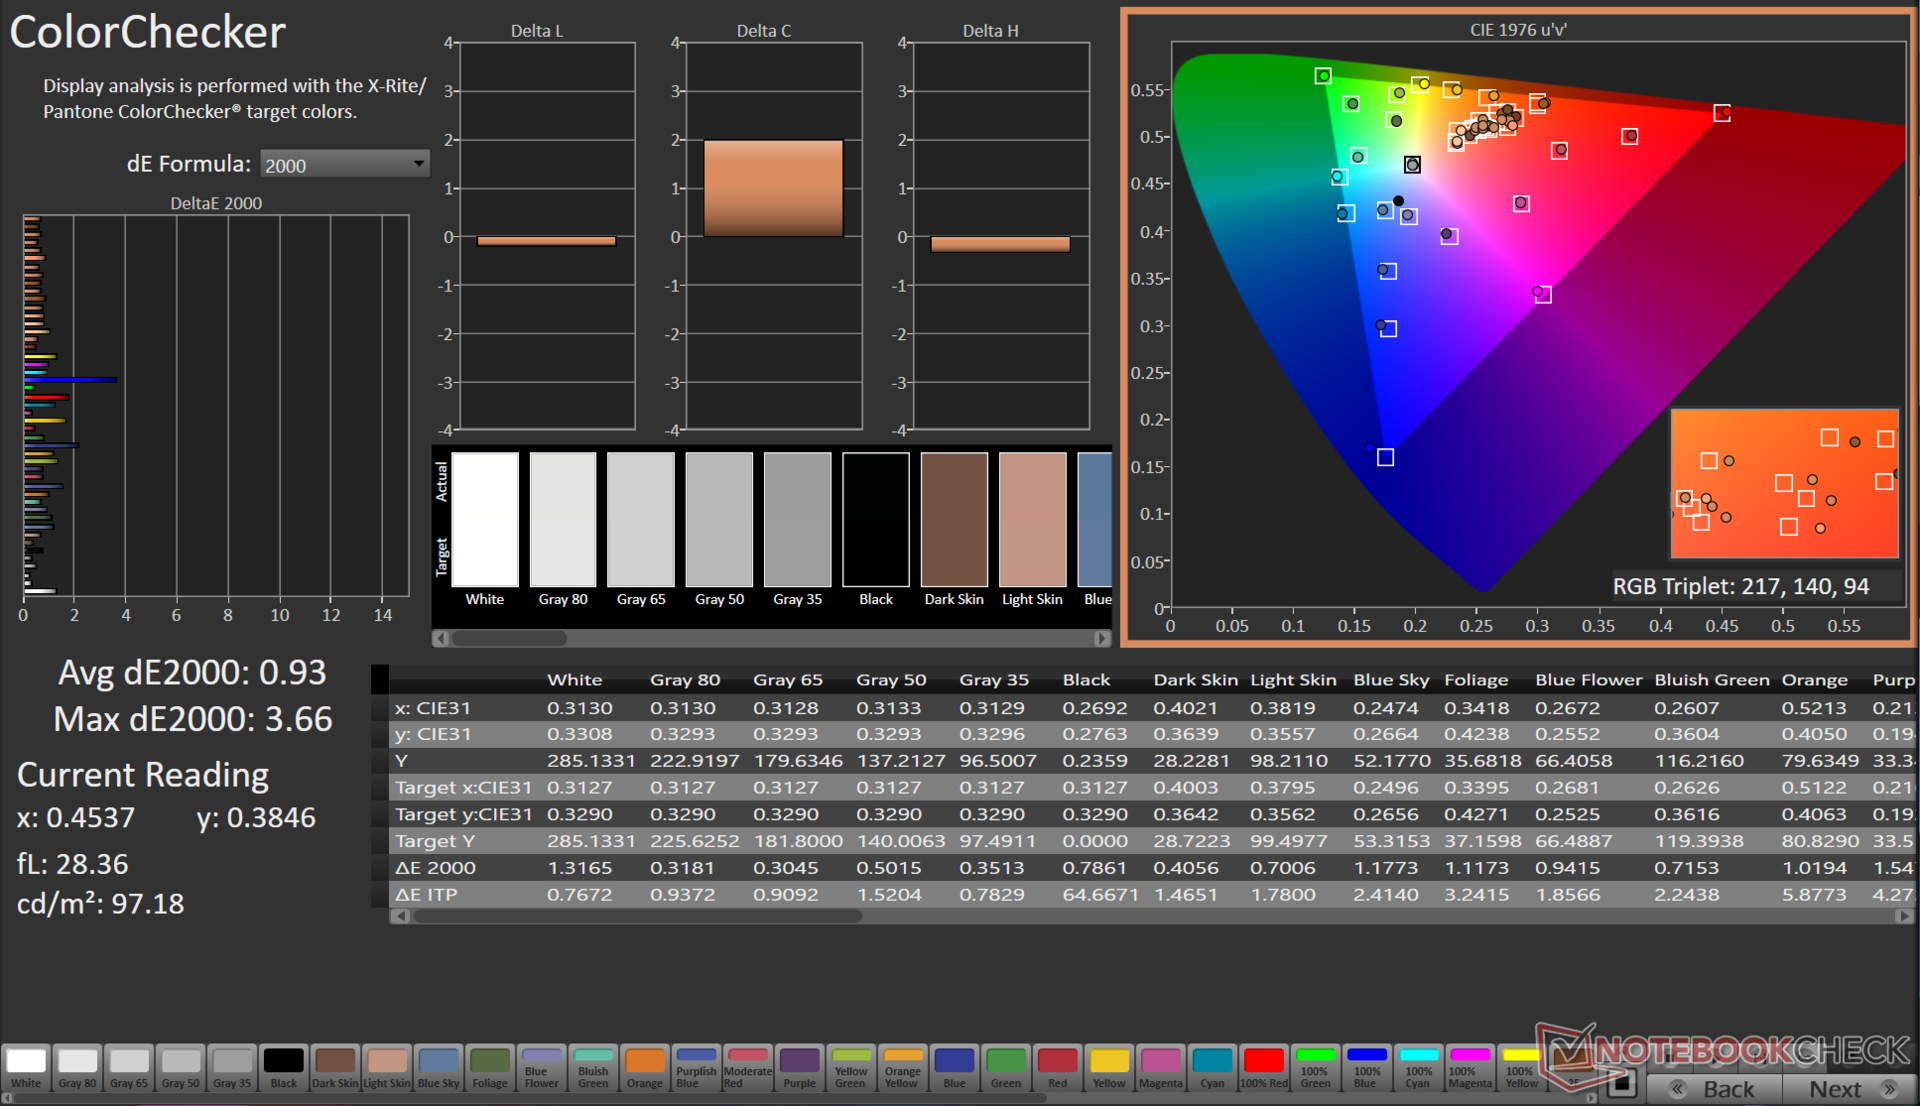
calibrated: 0.93
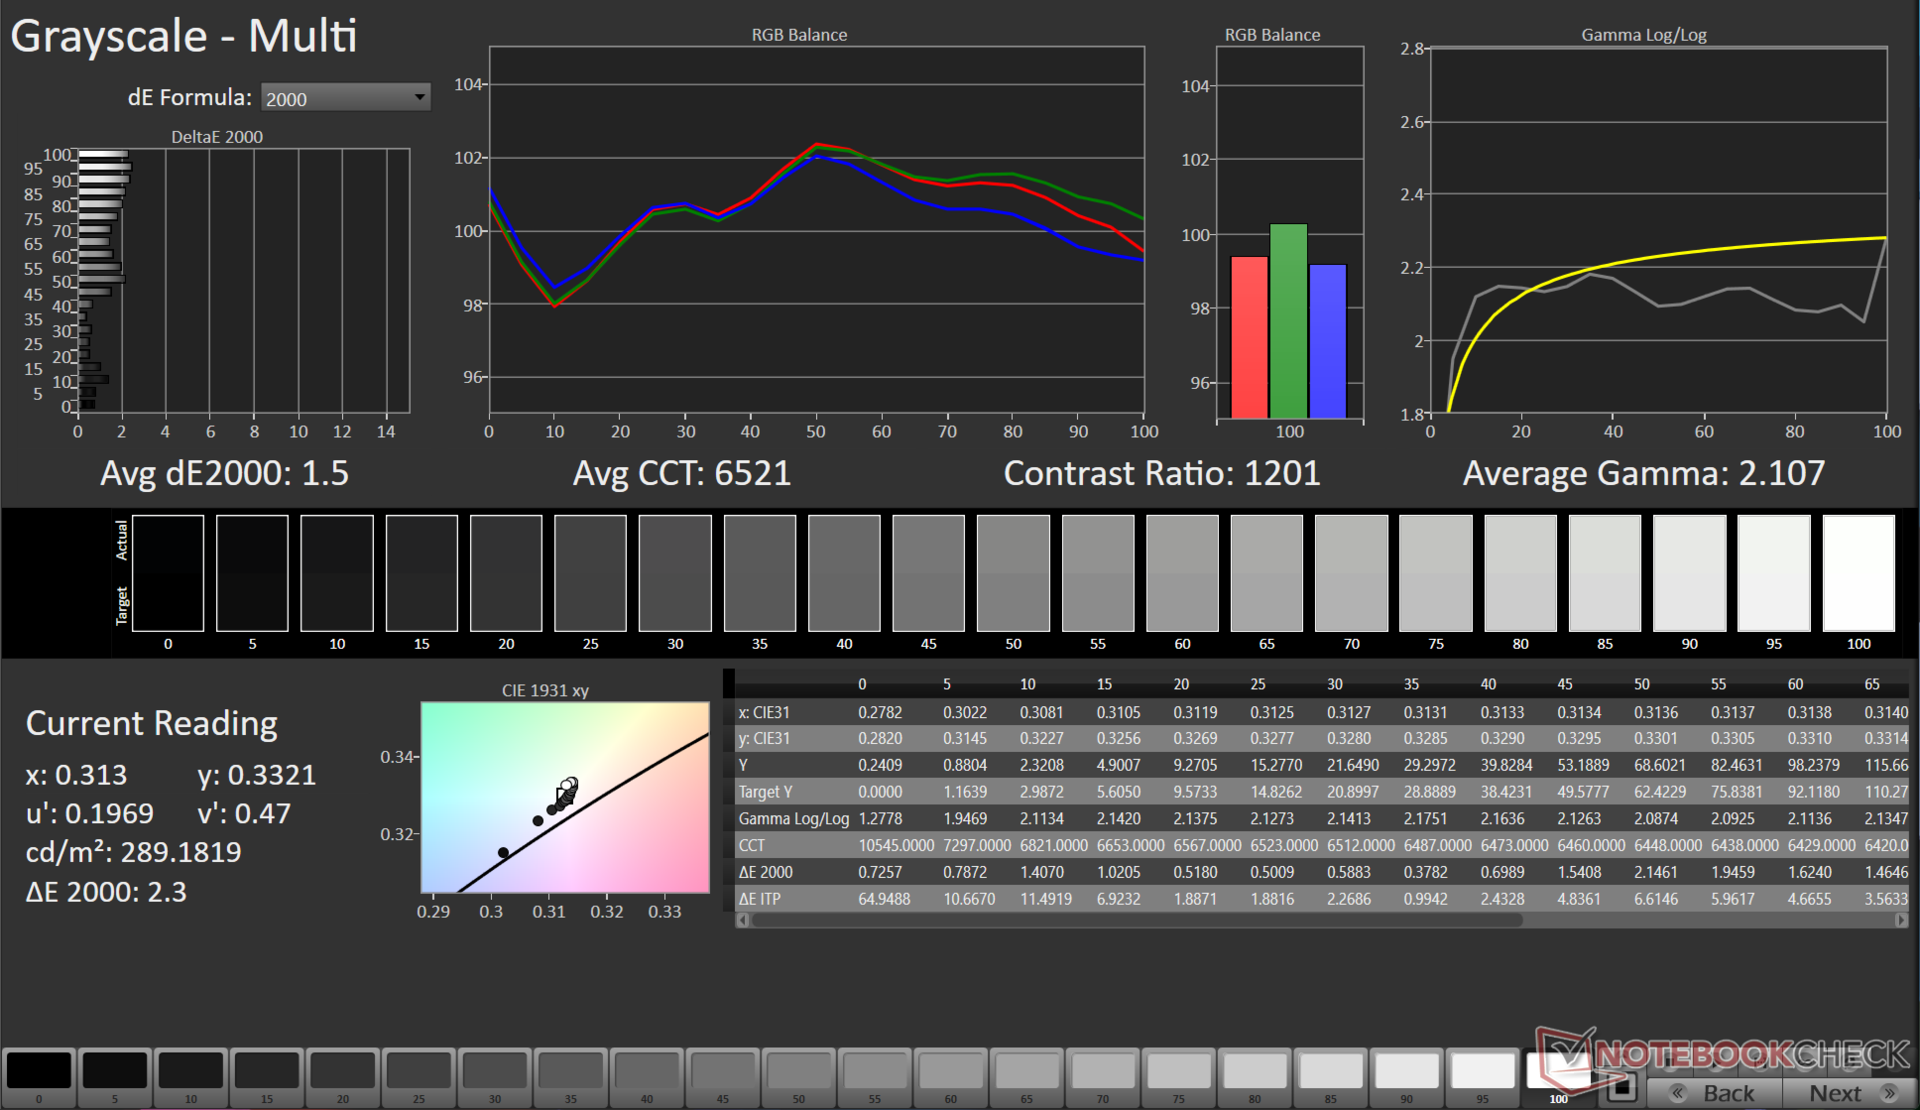
ΔE Greyscale Calman: 1.5 | ∀{0.09-98 Ø4.96}
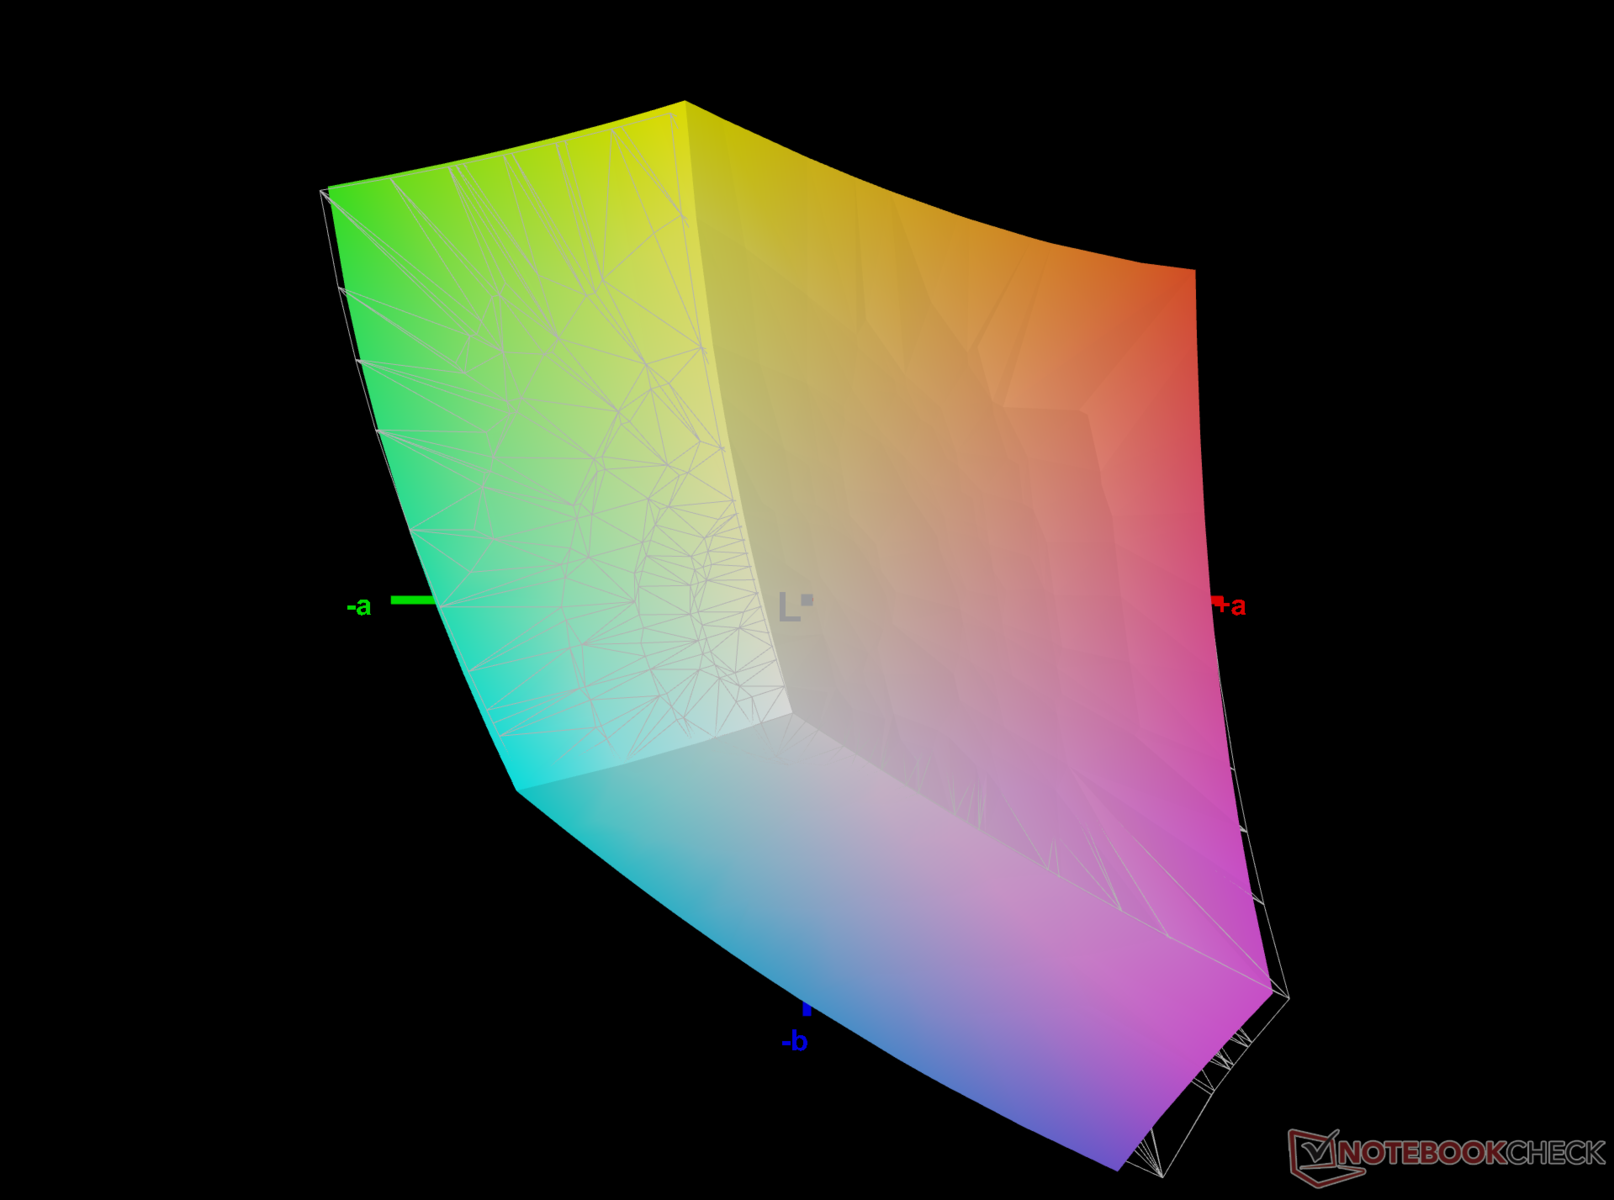
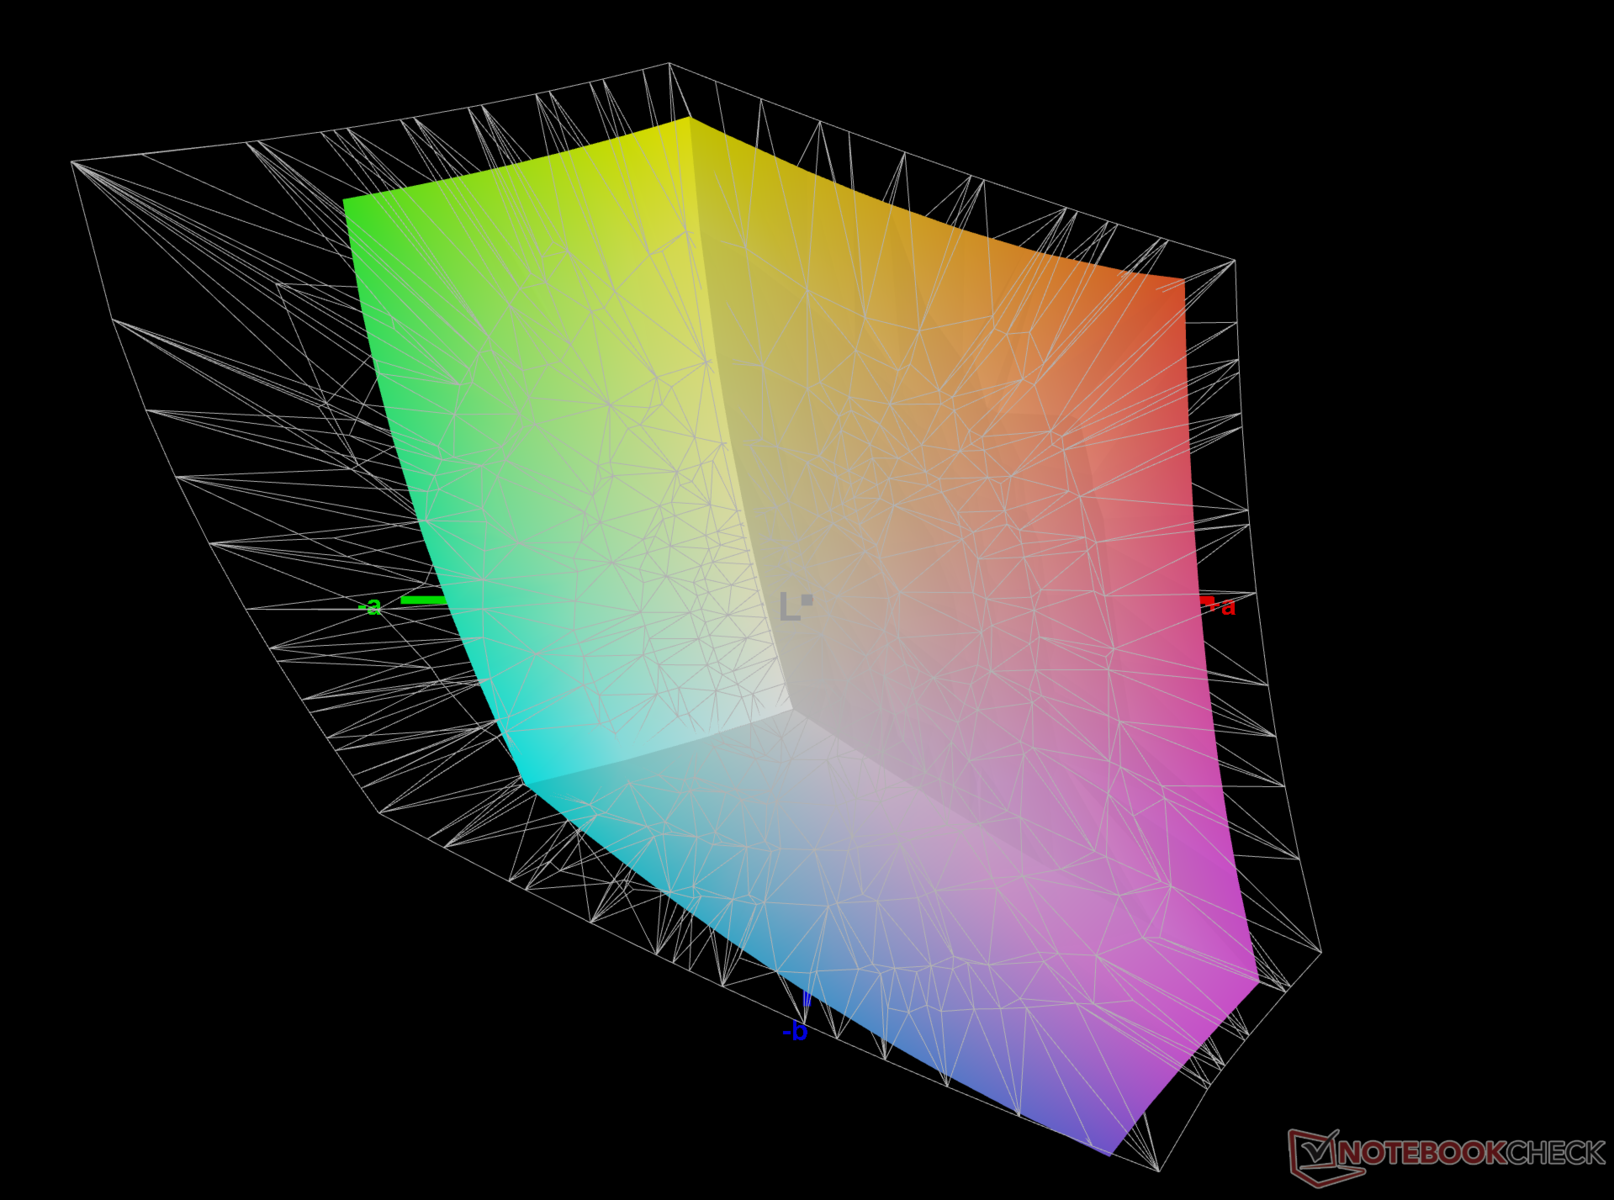
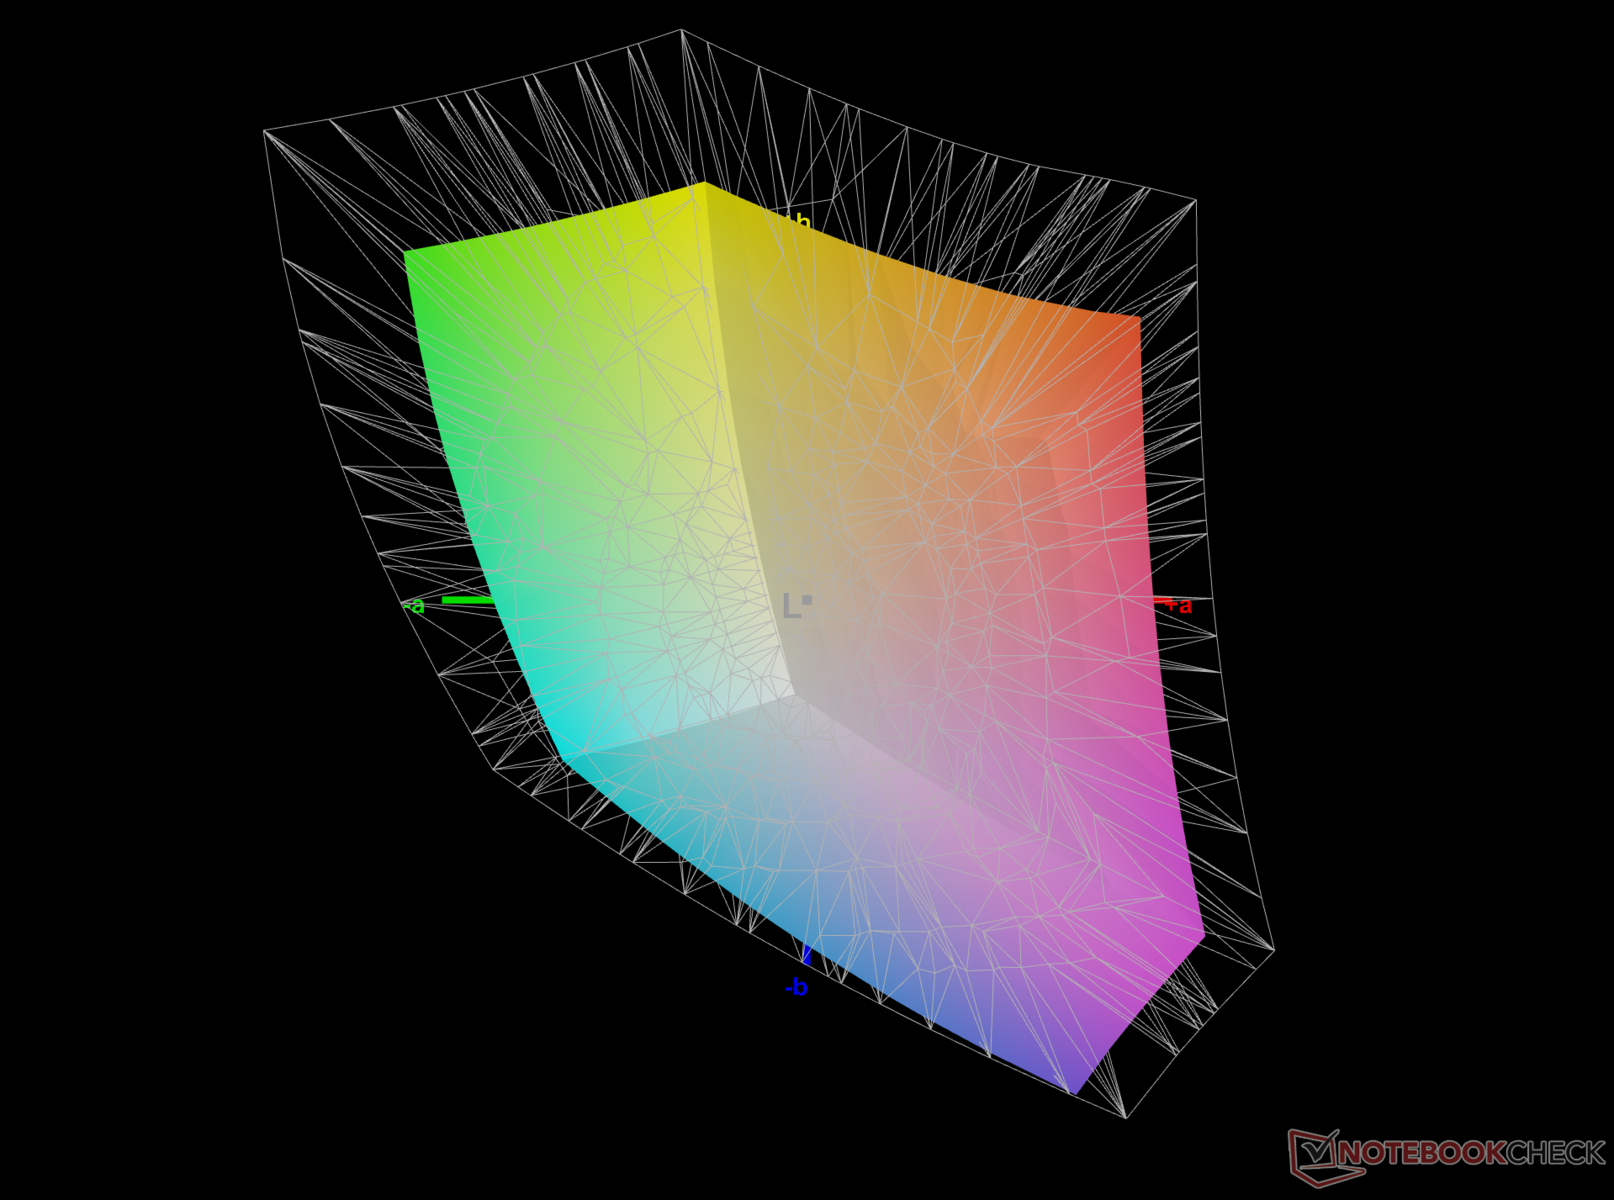
69.7% AdobeRGB 1998 (Argyll 3D)
97.5% sRGB (Argyll 3D)
67.5% Display P3 (Argyll 3D)
Gamma: 2.1
CCT: 6538 K
| HP Victus 16-r0076TX Chi Mei CMN1629, IPS, 1920x1080, 16.1" | Acer Nitro 16 AN16-41-R7YE AU Optronics B160UAN01.Q, IPS, 1920x1200, 16" | Dell G15 5530 AUO B156HAN, IPS, 1920x1080, 15.6" | Lenovo Legion Pro 5 16ARX8 (R5 7645HX, RTX 4050) CSOT T3 MNG007DA2-2, IPS, 2560x1600, 16" | Lenovo LOQ 15APH8 BOE NJ NE156FHM-NX3, IPS, 1920x1080, 15.6" | |
|---|---|---|---|---|---|
| Display | 11% | 5% | 4% | -39% | |
| Display P3 Coverage (%) | 67.5 | 80 19% | 73.1 8% | 71.6 6% | 40.2 -40% |
| sRGB Coverage (%) | 97.5 | 99.4 2% | 98.4 1% | 99.8 2% | 60.2 -38% |
| AdobeRGB 1998 Coverage (%) | 69.7 | 77.4 11% | 74.4 7% | 72.9 5% | 41.5 -40% |
| Response Times | -25% | 38% | -31% | -407% | |
| Response Time Grey 50% / Grey 80% * (ms) | 6.18 ? | 11.2 ? -81% | 3.39 ? 45% | 12 ? -94% | 42.7 ? -591% |
| Response Time Black / White * (ms) | 7.62 ? | 5.2 ? 32% | 5.35 ? 30% | 5.2 ? 32% | 24.5 ? -222% |
| PWM Frequency (Hz) | 21620 ? | ||||
| Screen | -67% | -74% | -1% | -85% | |
| Brightness middle (cd/m²) | 290 | 415 43% | 320 10% | 543 87% | 346.2 19% |
| Brightness (cd/m²) | 275 | 380 38% | 316 15% | 516 88% | 329 20% |
| Brightness Distribution (%) | 82 | 84 2% | 94 15% | 87 6% | 81 -1% |
| Black Level * (cd/m²) | 0.21 | 0.36 -71% | 0.21 -0% | 0.58 -176% | 0.31 -48% |
| Contrast (:1) | 1381 | 1153 -17% | 1524 10% | 936 -32% | 1117 -19% |
| Colorchecker dE 2000 * | 1.7 | 4.71 -177% | 4.55 -168% | 1.35 21% | 4.19 -146% |
| Colorchecker dE 2000 max. * | 3.57 | 6.98 -96% | 9.83 -175% | 3.22 10% | 19.19 -438% |
| Colorchecker dE 2000 calibrated * | 0.93 | 2.68 -188% | 1.51 -62% | 1.31 -41% | 1.66 -78% |
| Greyscale dE 2000 * | 1.5 | 3.6 -140% | 6.2 -313% | 1.03 31% | 2.6 -73% |
| Gamma | 2.1 105% | 2.182 101% | 2.07 106% | 2.38 92% | 2.19 100% |
| CCT | 6538 99% | 7153 91% | 6479 100% | 6452 101% | 6749 96% |
| Media totale (Programma / Settaggio) | -27% /
-45% | -10% /
-41% | -9% /
-4% | -177% /
-121% |
* ... Meglio usare valori piccoli
L'HP Victus 16 rinuncia all'accuratezza del colore per un'esperienza con una frequenza di aggiornamento più elevata. Copre il 97,5% della gamma di colori sRGB, il 69,7% di Adobe RGB e il 67,5% di DCI-P3. Come molti display, ha problemi a riprodurre le diverse tonalità di blu.
Tempi di risposta del Display
| ↔ Tempi di risposta dal Nero al Bianco | ||
|---|---|---|
| 7.62 ms ... aumenta ↗ e diminuisce ↘ combinato | ↗ 4.07 ms Incremento | 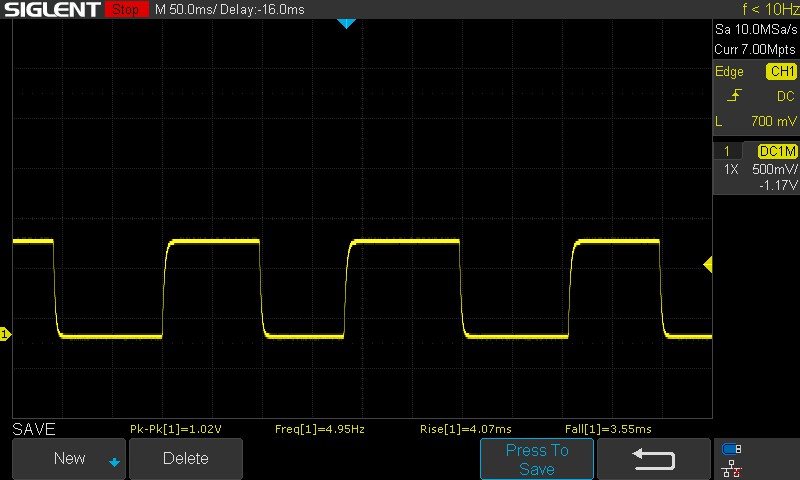 |
| ↘ 3.55 ms Calo | ||
| Lo schermo ha mostrato valori di risposta molto veloci nei nostri tests ed è molto adatto per i gaming veloce. In confronto, tutti i dispositivi di test variano da 0.1 (minimo) a 240 (massimo) ms. » 22 % di tutti i dispositivi è migliore. Questo significa che i tempi di risposta rilevati sono migliori rispettto alla media di tutti i dispositivi testati (19.8 ms). | ||
| ↔ Tempo di risposta dal 50% Grigio all'80% Grigio | ||
| 6.18 ms ... aumenta ↗ e diminuisce ↘ combinato | ↗ 3.01 ms Incremento | 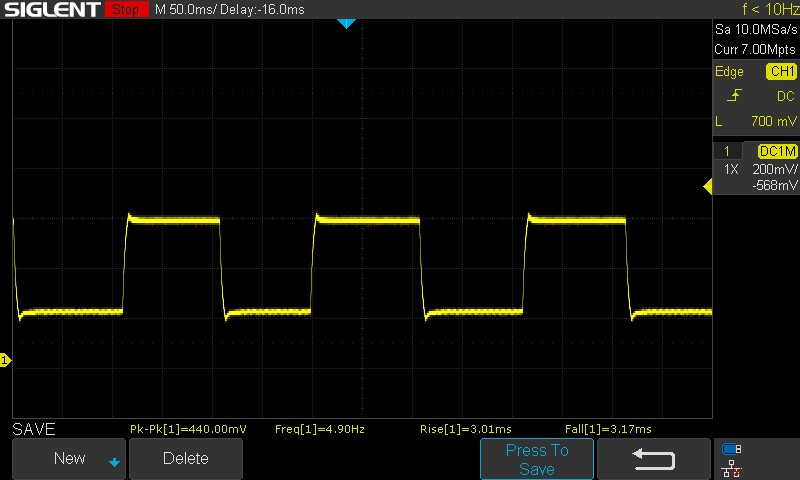 |
| ↘ 3.17 ms Calo | ||
| Lo schermo ha mostrato valori di risposta molto veloci nei nostri tests ed è molto adatto per i gaming veloce. In confronto, tutti i dispositivi di test variano da 0.165 (minimo) a 636 (massimo) ms. » 19 % di tutti i dispositivi è migliore. Questo significa che i tempi di risposta rilevati sono migliori rispettto alla media di tutti i dispositivi testati (31 ms). | ||
Sfarfallio dello schermo / PWM (Pulse-Width Modulation)
| flickering dello schermo / PWM non rilevato | ≤ 100 % settaggio luminosita' | 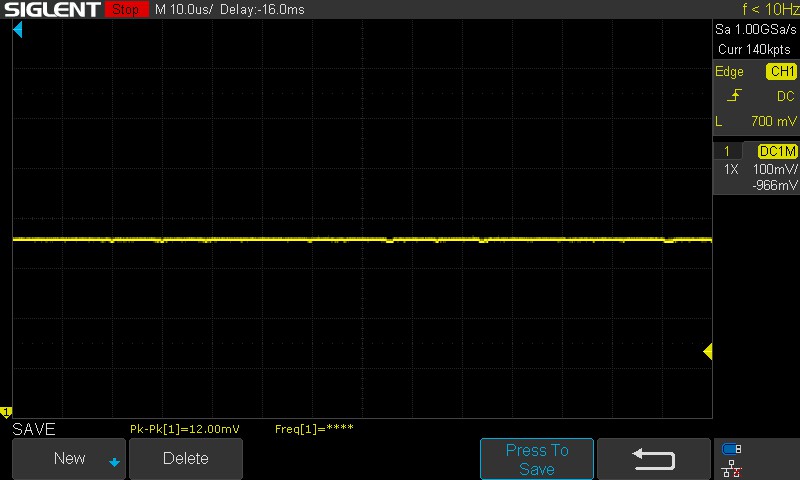 | |
In confronto: 52 % di tutti i dispositivi testati non utilizza PWM per ridurre la luminosita' del display. Se è rilevato PWM, una media di 7757 (minimo: 5 - massimo: 343500) Hz è stata rilevata. | |||
Il tempo di risposta pubblicizzato da HP (da grigio a grigio) è di 7 ms, come confermato dai nostri test, che hanno rilevato un valore di 6,18 ms. Allo stesso modo, i tempi di risposta da nero a bianco sono stati di 7,62 ms.
Un po' di lavoro con uno spettrofotometro X-rite i1Basic Pro 3 e il software di calibrazione Calman di Portrait Displays ha dato risultati solo marginalmente migliori, con i valori di deviazione della scala di grigi, ColourChecker e Saturation Sweep Delta E migliorati solo marginalmente.
Uno schermo IPS di solito garantisce angoli di visione decenti. Tuttavia, questo non è il caso del pannello Chi Mei dell'HP Omen 16. Quando si osserva lo schermo da angolazioni estreme si nota una notevole perdita di dettagli.
La visione all'aperto è superiore alla media, soprattutto per un dispositivo con una luminosità di soli 300 nit. La perdita di dettagli è stata minima all'ombra e sotto la luce diretta del sole. Tuttavia, consigliamo di tenere il portatile in casa, perché non è esattamente un dispositivo portatile.

Performance: Raptor Lake e Ada Lovelace si presentano alla grande
L'HP Victus 16 è disponibile in diverse configurazioni. La nostra è la variante base con un Intel Core i5-13500HX e GPU per computer portatili Nvidia GeForce RTX 4050. Si può optare per una GeForce RTX 4060 e RTX 4070 se necessario.
Chi cerca una CPU più potente può optare per il modello Core i7-13700HX che può essere abbinato solo a una GeForce RTX 4070. Gli utenti in cerca di memoria aggiuntiva possono anche optare per una versione con 32 GB di RAM e 1 TB di spazio di archiviazione.
Condizioni di test
Abbiamo scelto il piano "Performance" per spingere l'hardware ai suoi limiti. Alcuni test sono stati condotti con la batteria in modalità "Eco" per verificare la riduzione delle prestazioni. HWInfo non è stato in grado di mostrare le informazioni PL1 e PL2 corrette per i diversi profili, quindi abbiamo ottenuto questi valori durante il loop test di Cinebench R15.
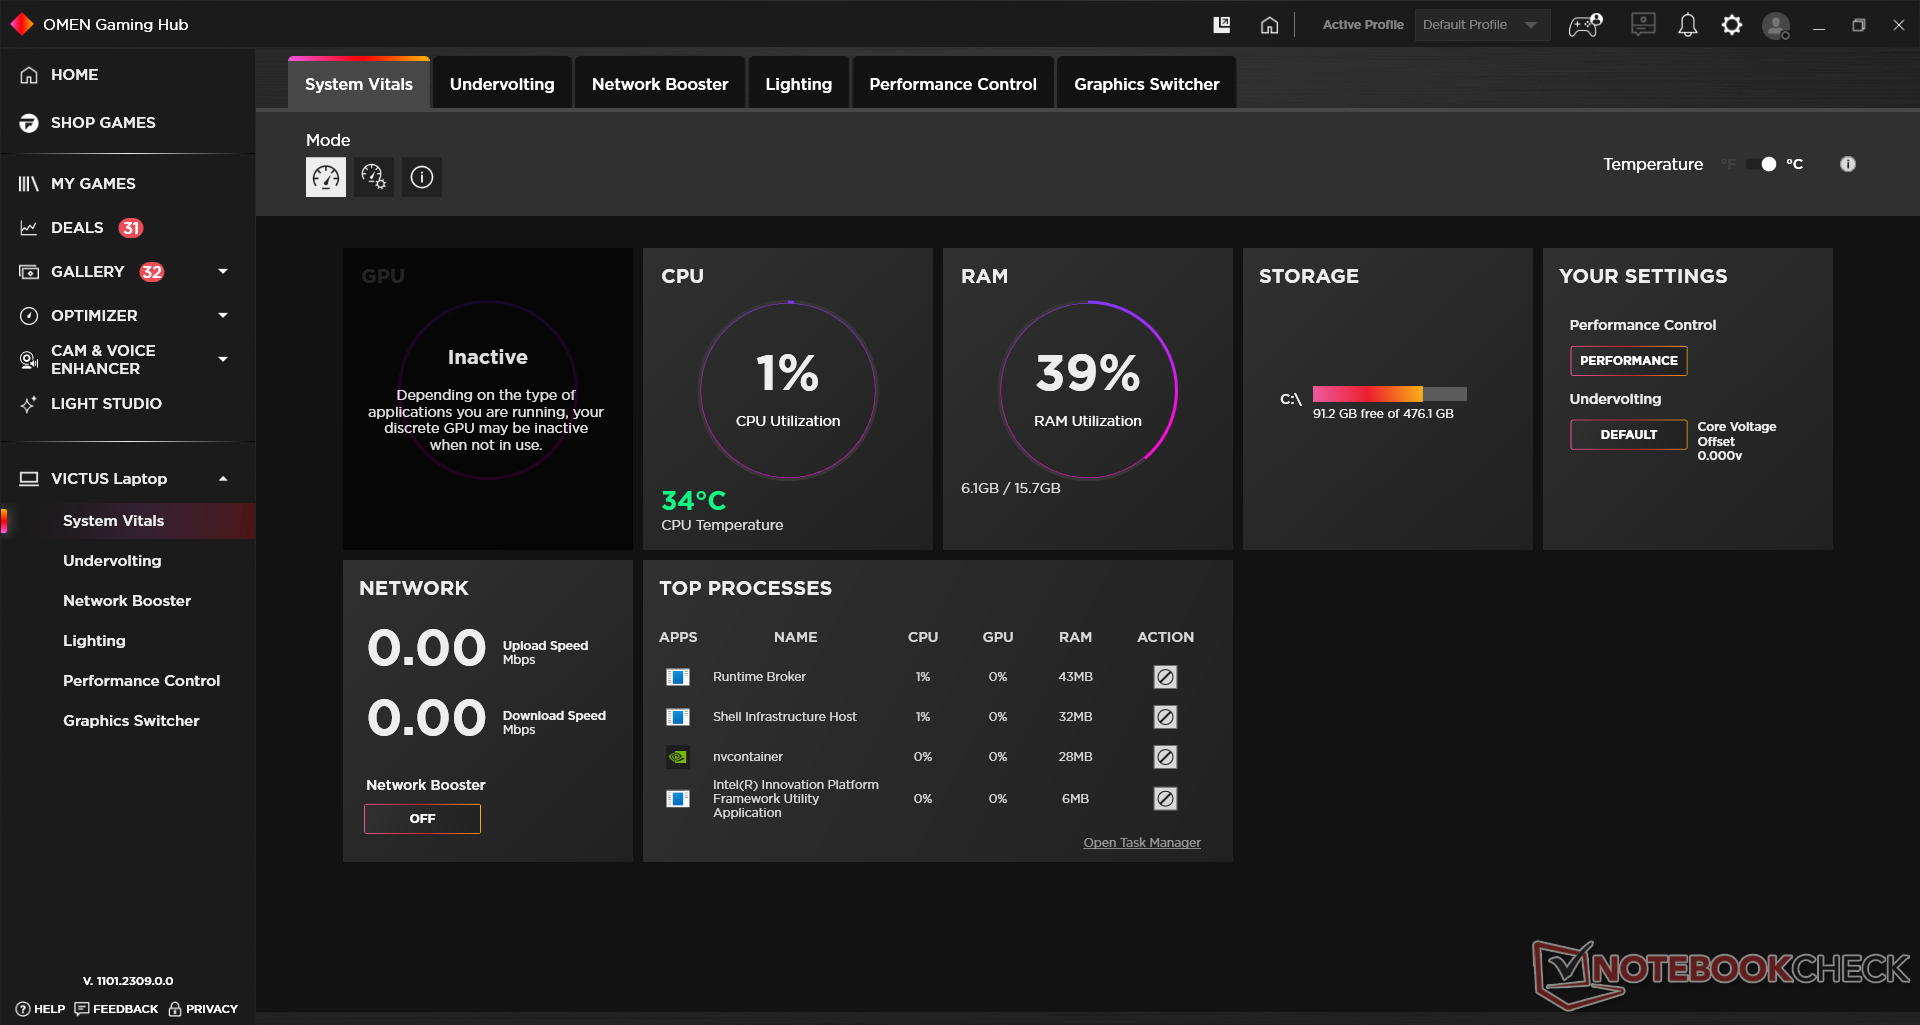
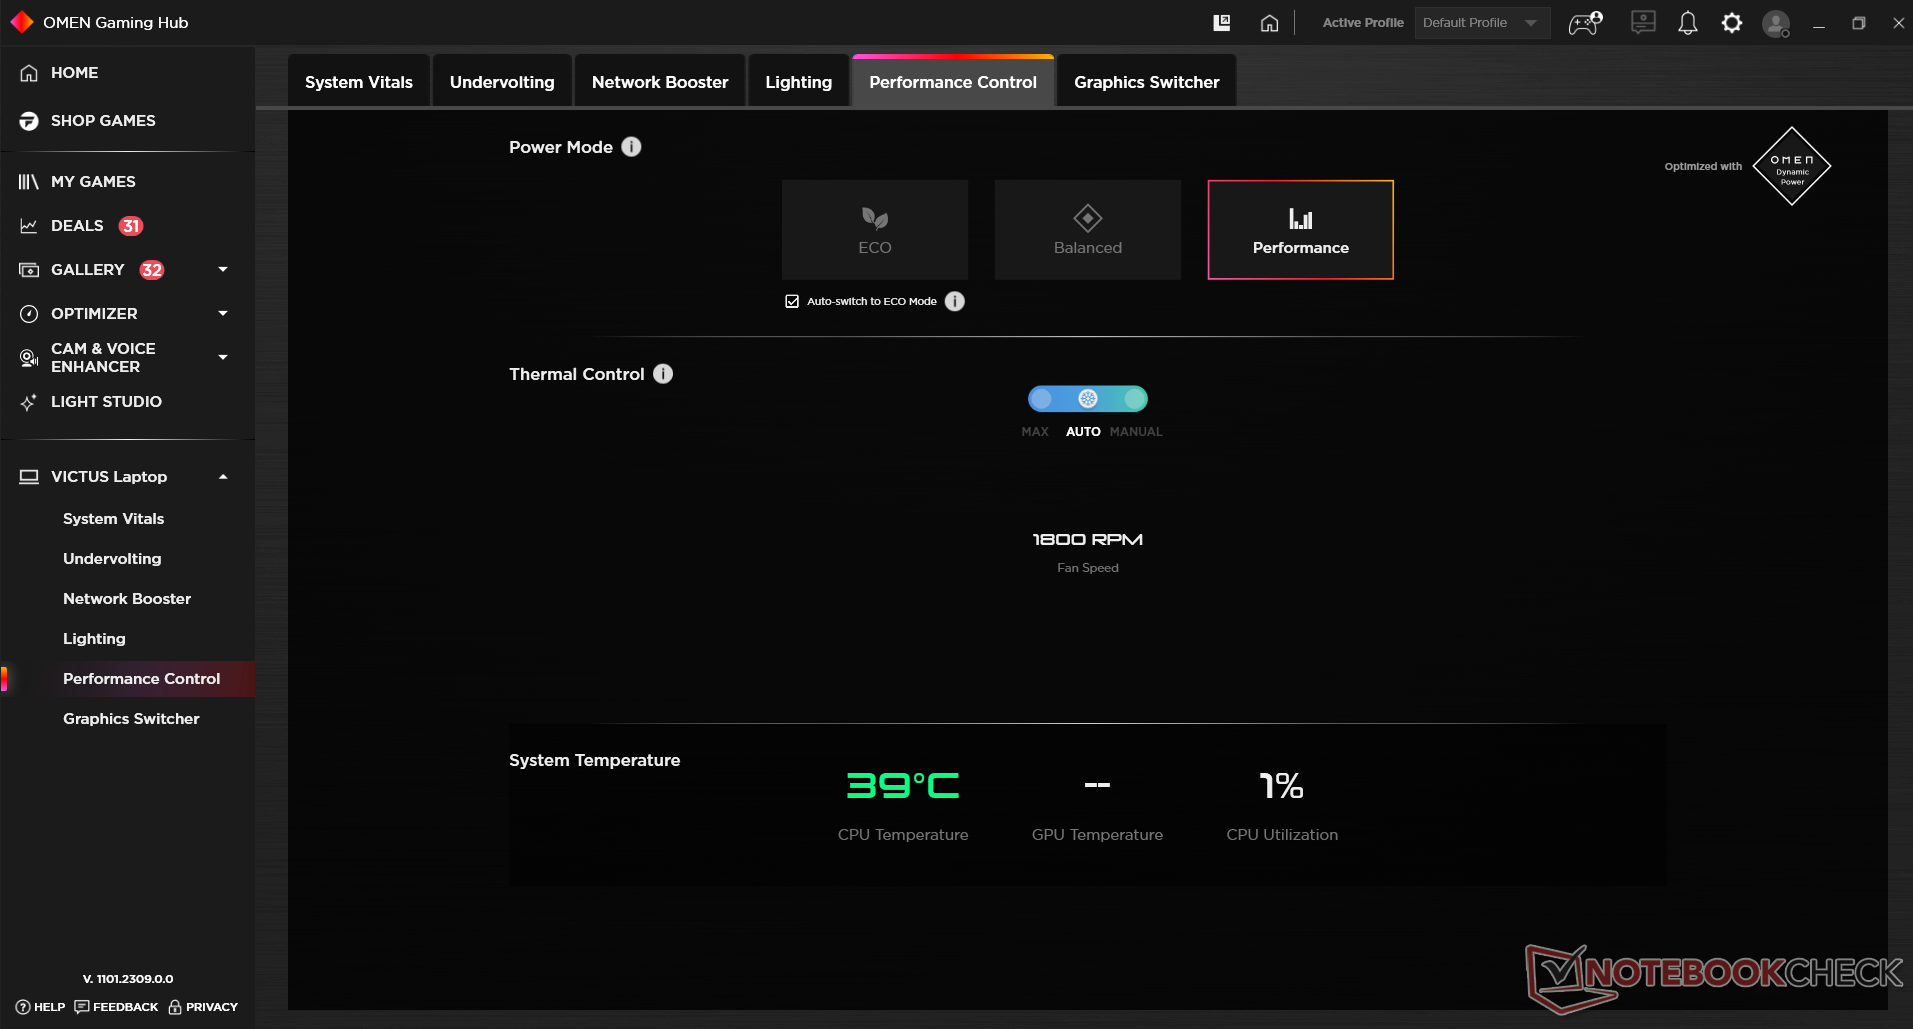
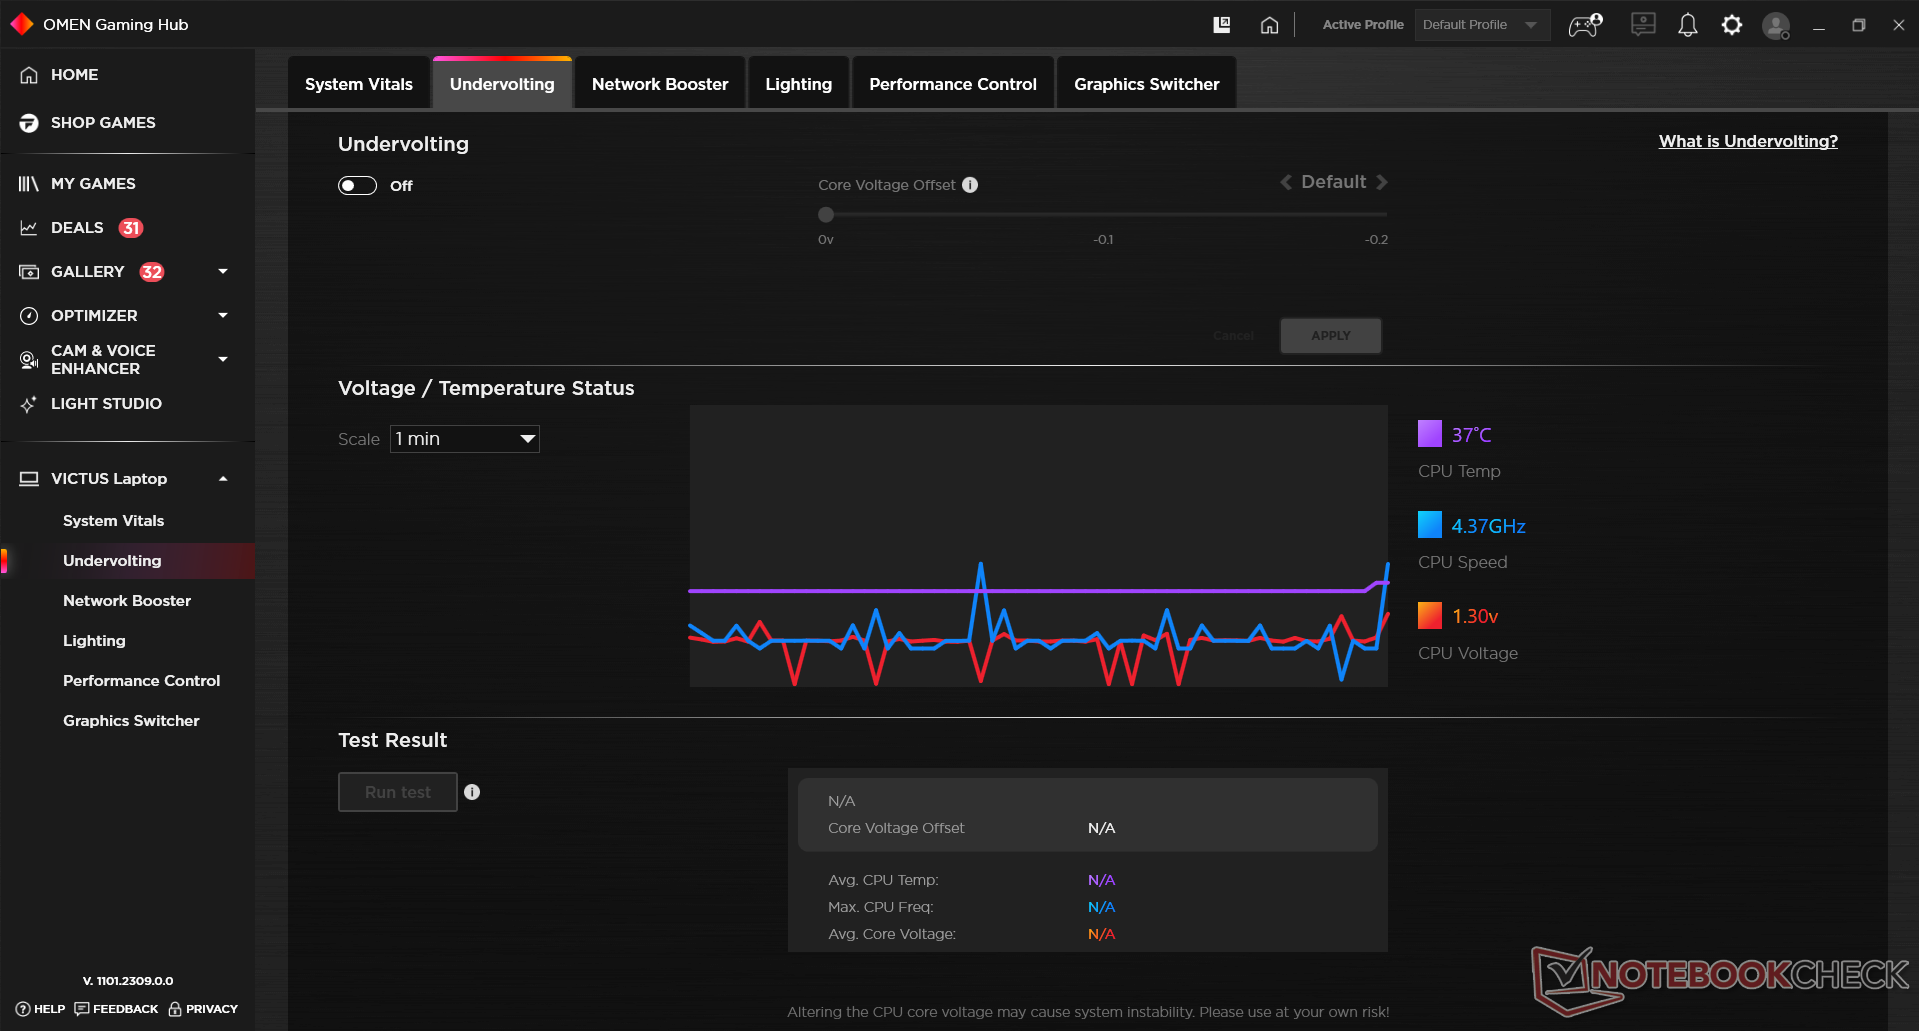
Se siete interessati a smanettare con il vostro portatile, vi troverete a passare molto tempo nell'Omen Gaming Hub. Offre una visione a volo d'uccello di tutto ciò che riguarda le temperature, i clock e le tensioni della CPU. Permette persino agli appassionati di sottotensionare i loro portatili senza dover navigare nel BIOS.
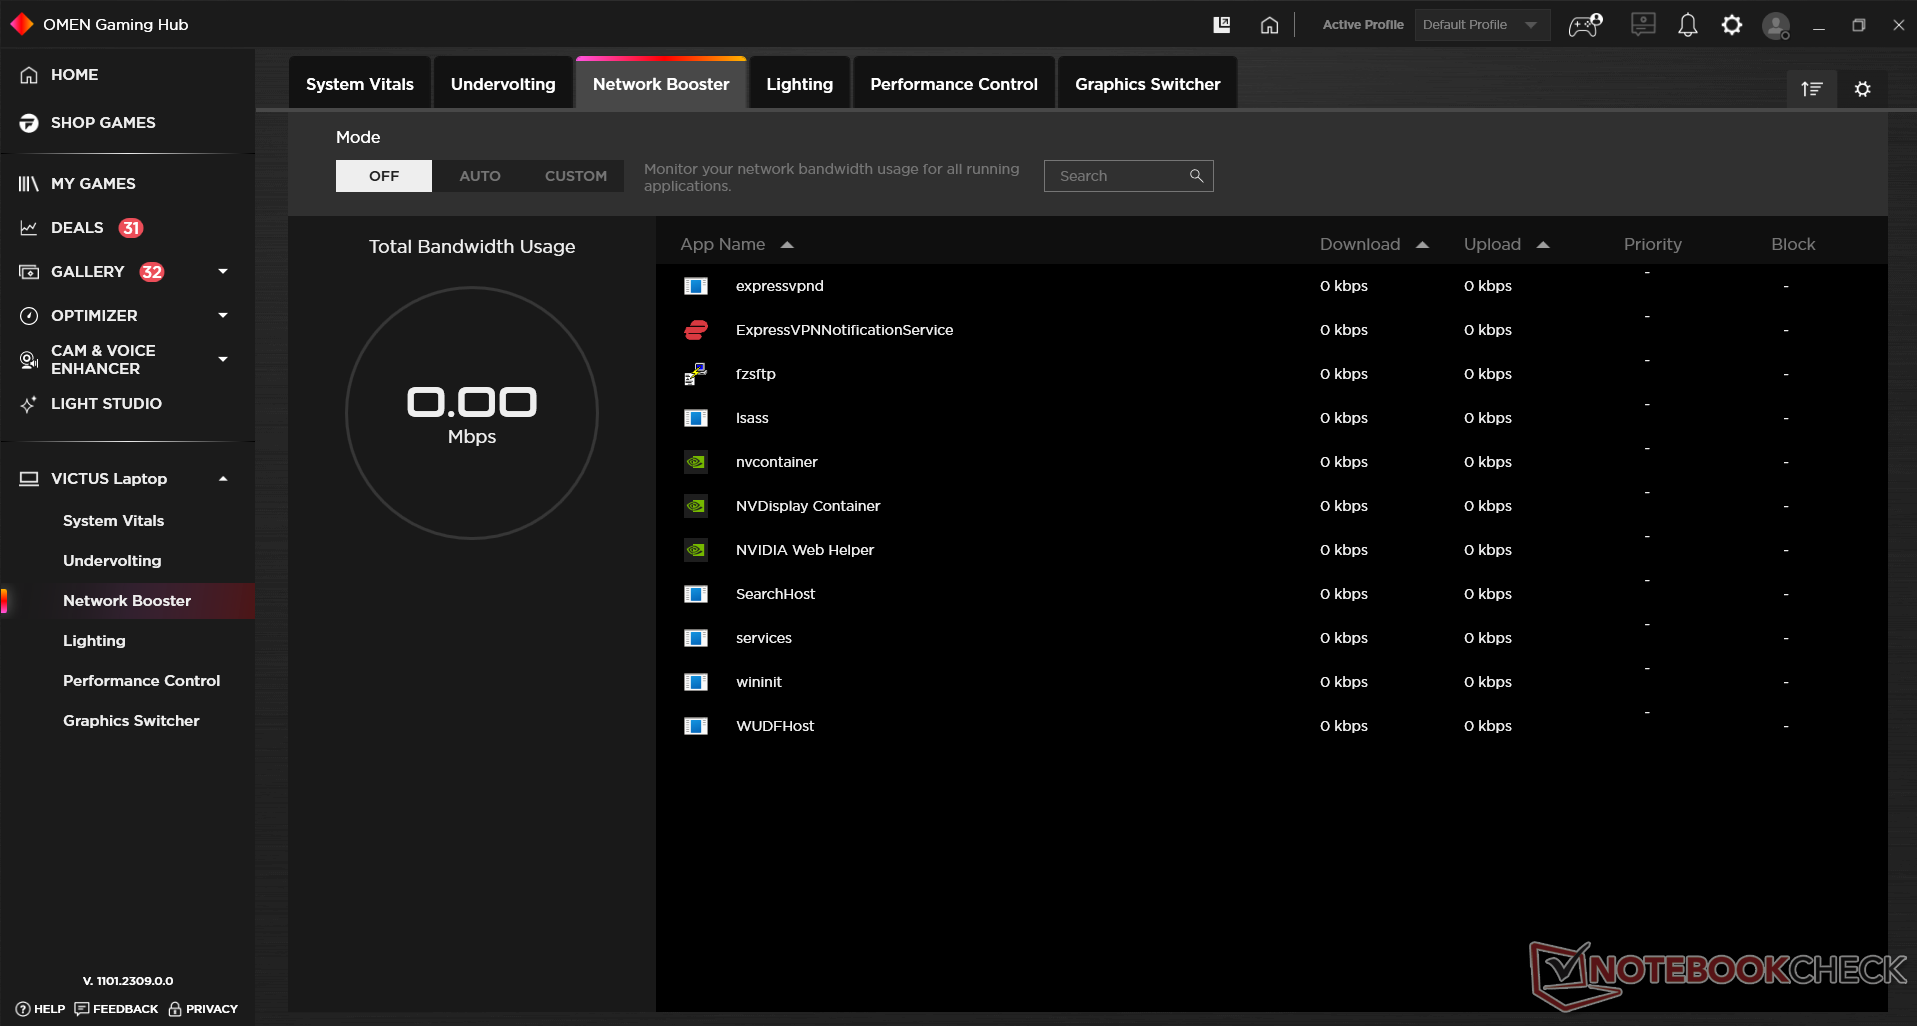
C'è poi una scheda "network booster" che dà priorità al traffico verso le attività in esecuzione e una sezione "performance control" che dà accesso ai piani energetici di cui sopra. Inoltre, consente di impostare curve personalizzate per la ventola o di averla sempre al massimo.
| Profilo | PL1 | PL2 | PL4 |
|---|---|---|---|
| Eco | 35 W | 46 W | 200 W |
| Bilanciato | 51 W | 130 W | 200 W |
| Performance | 78 W | 130 W | 200 W |
Processore
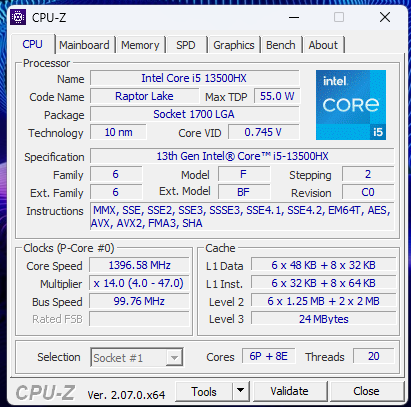
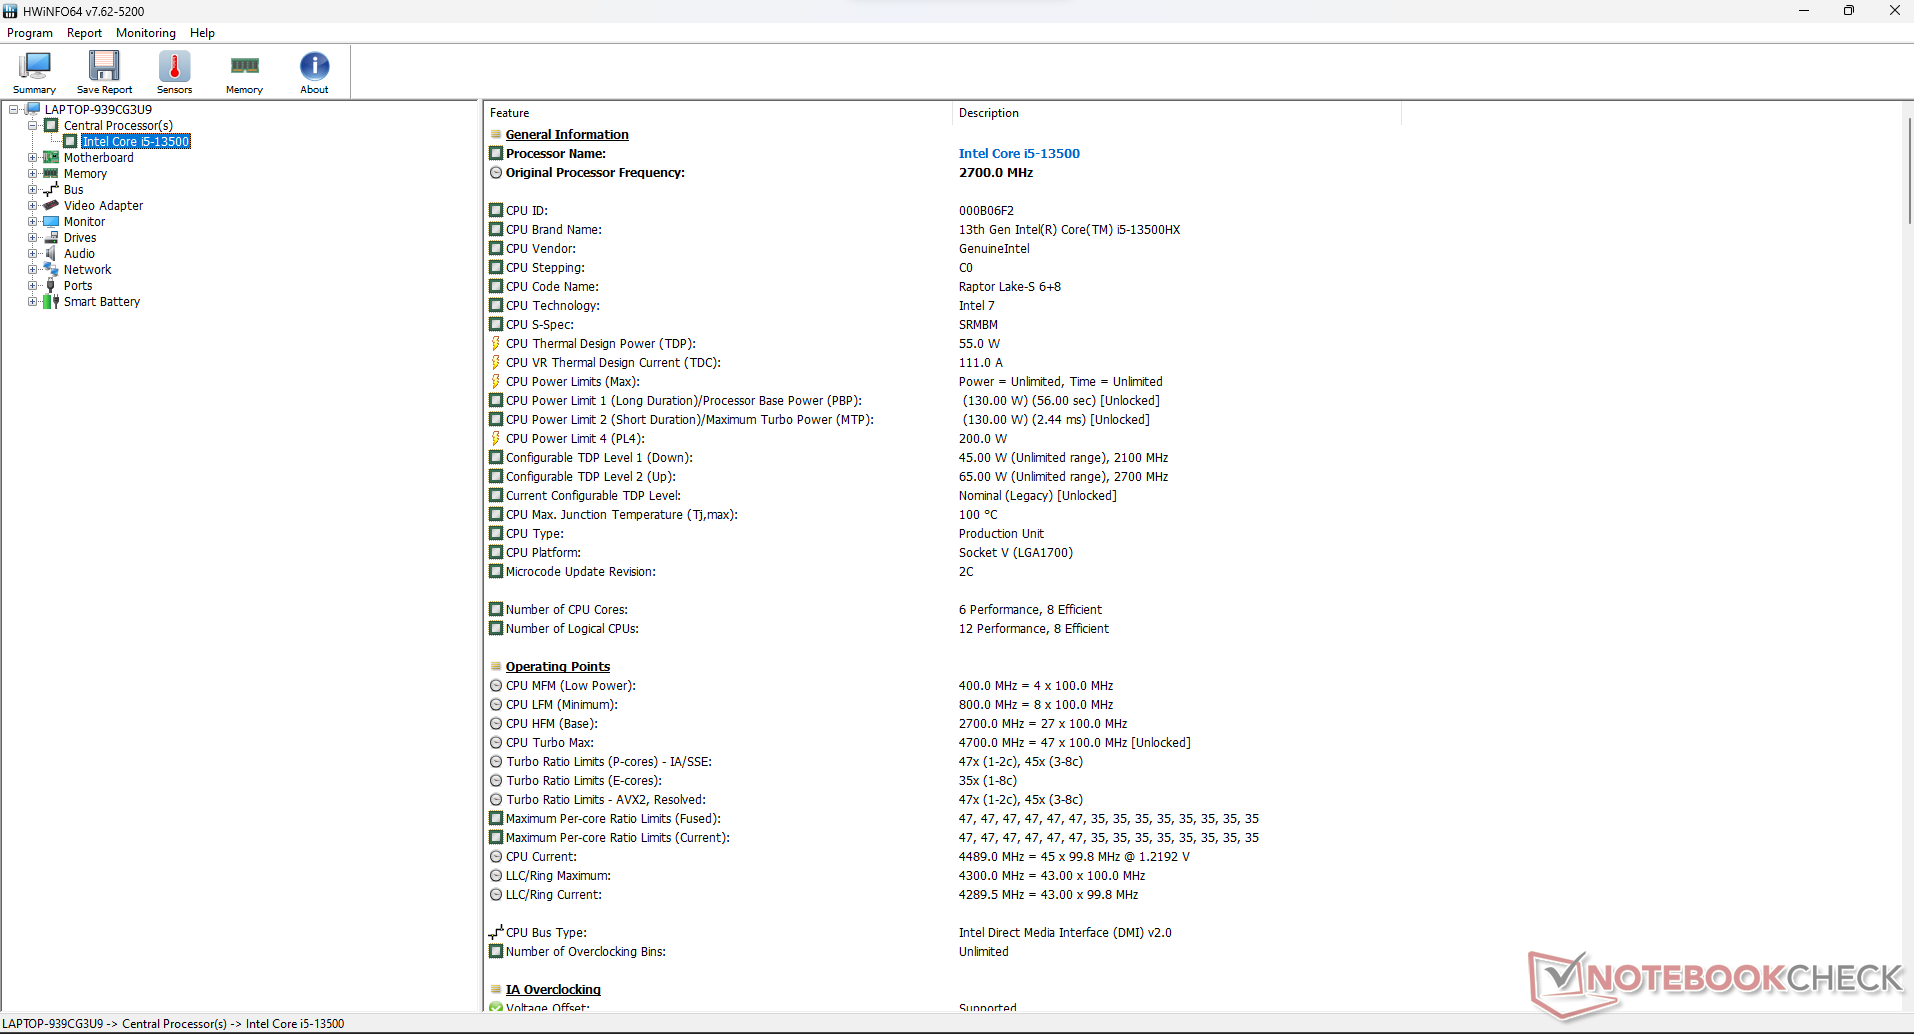
L'Intel Core i5-13500HX che equipaggia il nostro HP Victus 16 è una CPU Raptor Lake a 14 core (6 prestazioni più 8 efficienza) e 20 thread. È stata lanciata come parte della serie di chip Raptor Lake-HX, che ha aumentato il TDP di base (55 Watt) rispetto alle controparti di marca H. Oltre al TDP extra, aumenta anche il numero di core per le prestazioni.
Nonostante sia il componente Raptor Lake-HX di fascia più bassa, il Core i5-13500HX è ben al di sopra della sua classe di peso. Nello stato PL2, il processore può consumare fino a 131 Watt di energia. Tuttavia, la cifra si assesta a 83 Watt con carichi sostenuti.
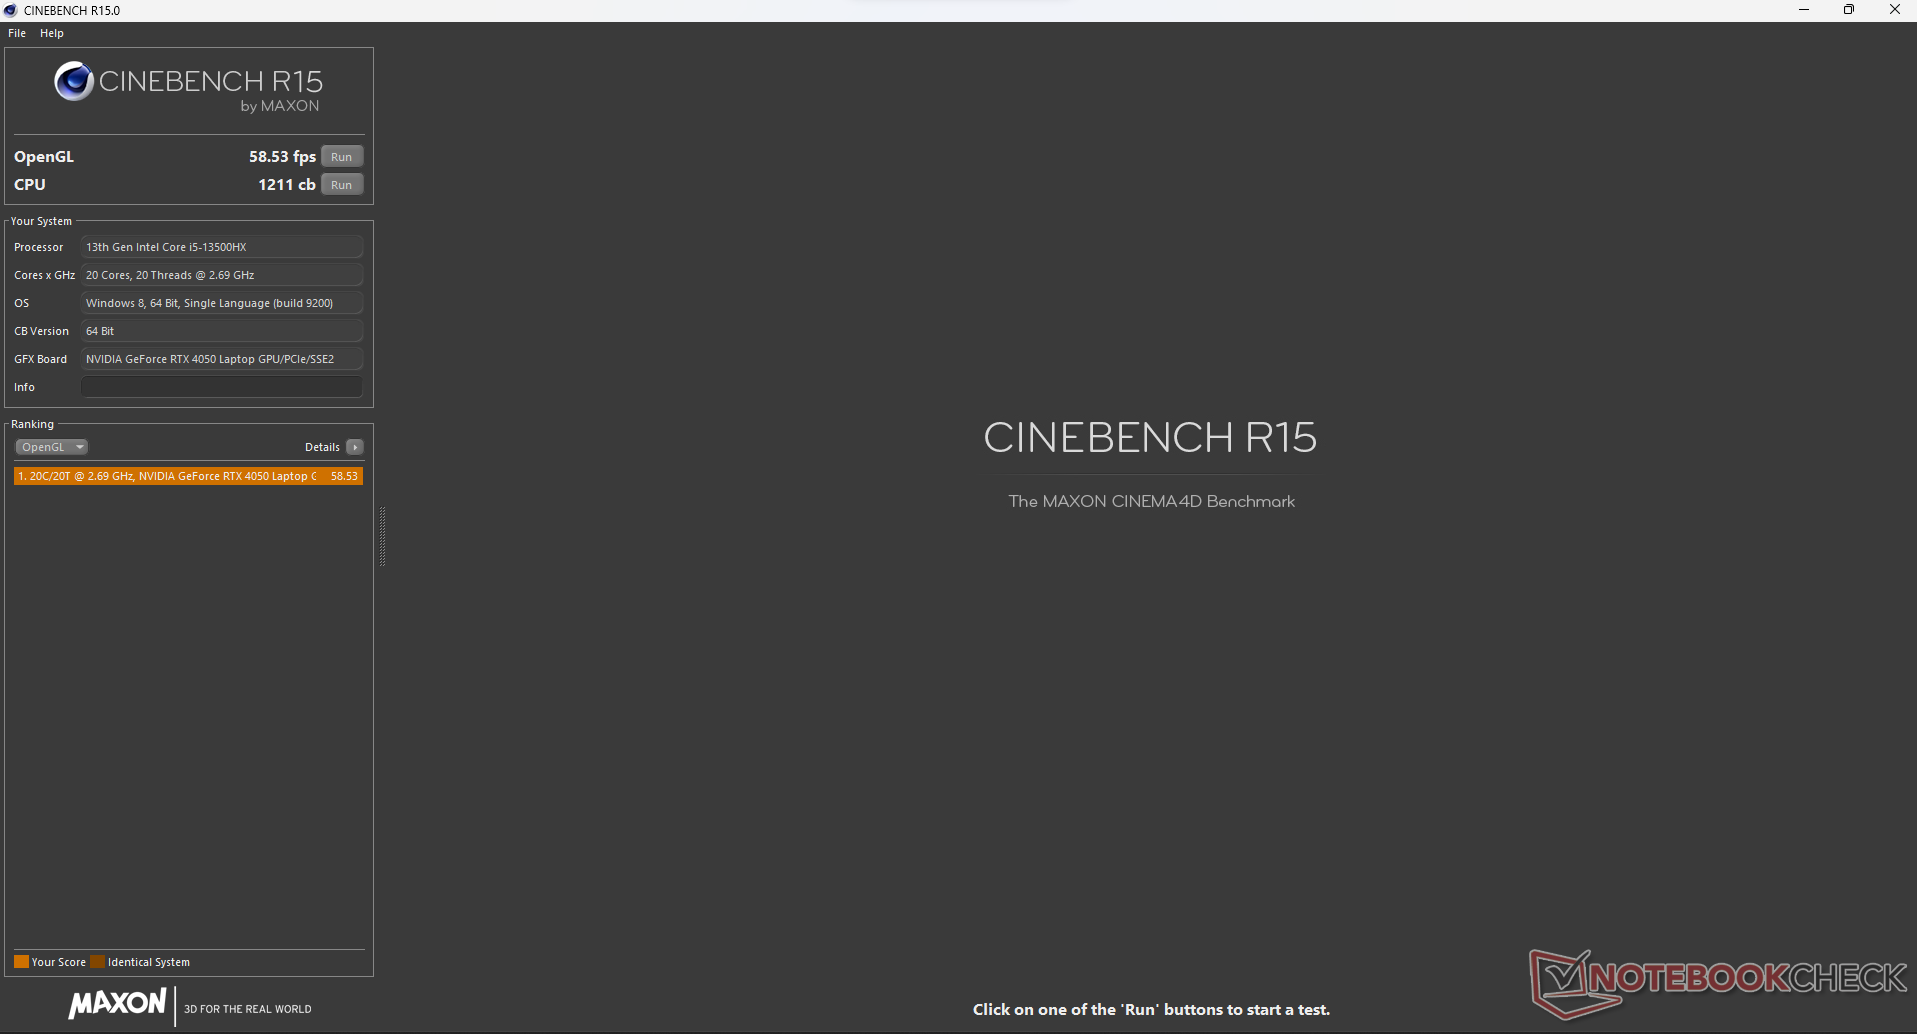
I portatili da gioco sono noti per perdere molte prestazioni con la batteria e l'HP Victus 16 non è da meno. Ad esempio, il punteggio di Cinebench R15 scende del 58% circa, passando da 2.863 a 1.211 punti quando viene scollegata l'alimentazione CA.
Cinebench R15 Multi Loop
Cinebench R23: Multi Core | Single Core
Cinebench R20: CPU (Multi Core) | CPU (Single Core)
Cinebench R15: CPU Multi 64Bit | CPU Single 64Bit
Blender: v2.79 BMW27 CPU
7-Zip 18.03: 7z b 4 | 7z b 4 -mmt1
Geekbench 5.5: Multi-Core | Single-Core
HWBOT x265 Benchmark v2.2: 4k Preset
LibreOffice : 20 Documents To PDF
R Benchmark 2.5: Overall mean
| CPU Performance rating | |
| Media della classe Gaming | |
| Acer Predator Helios 16 PH16-71-731Q | |
| Alienware m16 R1 Intel | |
| HP Victus 16-r0076TX -1! | |
| Media Intel Core i5-13500HX | |
| Acer Predator Triton 14 PT14-51 | |
| Aorus 15 BSF | |
| MSI Katana 15 B12VEK | |
| Asus TUF A15 FA507 | |
| Acer Nitro 16 AN16-41-R7YE | |
| Cinebench R23 / Multi Core | |
| Media della classe Gaming (10488 - 42661, n=107, ultimi 2 anni) | |
| Acer Predator Helios 16 PH16-71-731Q | |
| Alienware m16 R1 Intel | |
| Acer Predator Triton 14 PT14-51 | |
| Media Intel Core i5-13500HX (18235 - 19176, n=3) | |
| HP Victus 16-r0076TX | |
| Aorus 15 BSF | |
| MSI Katana 15 B12VEK | |
| Asus TUF A15 FA507 | |
| Acer Nitro 16 AN16-41-R7YE | |
| Cinebench R23 / Single Core | |
| Media della classe Gaming (1166 - 2415, n=107, ultimi 2 anni) | |
| Alienware m16 R1 Intel | |
| Aorus 15 BSF | |
| Acer Predator Helios 16 PH16-71-731Q | |
| Media Intel Core i5-13500HX (1689 - 1772, n=2) | |
| MSI Katana 15 B12VEK | |
| HP Victus 16-r0076TX | |
| Acer Predator Triton 14 PT14-51 | |
| Asus TUF A15 FA507 | |
| Acer Nitro 16 AN16-41-R7YE | |
| Cinebench R20 / CPU (Multi Core) | |
| Media della classe Gaming (4029 - 16433, n=106, ultimi 2 anni) | |
| Acer Predator Helios 16 PH16-71-731Q | |
| Alienware m16 R1 Intel | |
| Acer Predator Triton 14 PT14-51 | |
| Media Intel Core i5-13500HX (6978 - 7371, n=3) | |
| HP Victus 16-r0076TX | |
| Aorus 15 BSF | |
| MSI Katana 15 B12VEK | |
| Asus TUF A15 FA507 | |
| Acer Nitro 16 AN16-41-R7YE | |
| Cinebench R20 / CPU (Single Core) | |
| Media della classe Gaming (442 - 913, n=106, ultimi 2 anni) | |
| Alienware m16 R1 Intel | |
| Aorus 15 BSF | |
| Acer Predator Helios 16 PH16-71-731Q | |
| Media Intel Core i5-13500HX (648 - 695, n=3) | |
| MSI Katana 15 B12VEK | |
| Acer Predator Triton 14 PT14-51 | |
| HP Victus 16-r0076TX | |
| Asus TUF A15 FA507 | |
| Acer Nitro 16 AN16-41-R7YE | |
| Cinebench R15 / CPU Multi 64Bit | |
| Media della classe Gaming (1578 - 6330, n=105, ultimi 2 anni) | |
| Acer Predator Helios 16 PH16-71-731Q | |
| Acer Predator Helios 16 PH16-71-731Q | |
| Alienware m16 R1 Intel | |
| Acer Predator Triton 14 PT14-51 | |
| Media Intel Core i5-13500HX (2856 - 2964, n=3) | |
| HP Victus 16-r0076TX | |
| Aorus 15 BSF | |
| Asus TUF A15 FA507 | |
| MSI Katana 15 B12VEK | |
| Acer Nitro 16 AN16-41-R7YE | |
| Cinebench R15 / CPU Single 64Bit | |
| Media della classe Gaming (188.8 - 350, n=106, ultimi 2 anni) | |
| Alienware m16 R1 Intel | |
| Acer Predator Helios 16 PH16-71-731Q | |
| Aorus 15 BSF | |
| Media Intel Core i5-13500HX (242 - 263, n=3) | |
| Asus TUF A15 FA507 | |
| MSI Katana 15 B12VEK | |
| Acer Predator Triton 14 PT14-51 | |
| HP Victus 16-r0076TX | |
| Acer Nitro 16 AN16-41-R7YE | |
| Blender / v2.79 BMW27 CPU | |
| Acer Nitro 16 AN16-41-R7YE | |
| MSI Katana 15 B12VEK | |
| Asus TUF A15 FA507 | |
| Aorus 15 BSF | |
| HP Victus 16-r0076TX | |
| Media Intel Core i5-13500HX (178 - 193, n=3) | |
| Acer Predator Triton 14 PT14-51 | |
| Acer Predator Helios 16 PH16-71-731Q | |
| Alienware m16 R1 Intel | |
| Media della classe Gaming (79 - 330, n=104, ultimi 2 anni) | |
| 7-Zip 18.03 / 7z b 4 | |
| Media della classe Gaming (33491 - 148086, n=105, ultimi 2 anni) | |
| Alienware m16 R1 Intel | |
| Acer Predator Helios 16 PH16-71-731Q | |
| Acer Predator Triton 14 PT14-51 | |
| Media Intel Core i5-13500HX (68923 - 73701, n=3) | |
| HP Victus 16-r0076TX | |
| Aorus 15 BSF | |
| Asus TUF A15 FA507 | |
| MSI Katana 15 B12VEK | |
| Acer Nitro 16 AN16-41-R7YE | |
| 7-Zip 18.03 / 7z b 4 -mmt1 | |
| Media della classe Gaming (4199 - 7436, n=105, ultimi 2 anni) | |
| Alienware m16 R1 Intel | |
| Acer Predator Helios 16 PH16-71-731Q | |
| Aorus 15 BSF | |
| Asus TUF A15 FA507 | |
| Acer Nitro 16 AN16-41-R7YE | |
| Media Intel Core i5-13500HX (5377 - 5850, n=3) | |
| MSI Katana 15 B12VEK | |
| Acer Predator Triton 14 PT14-51 | |
| HP Victus 16-r0076TX | |
| Geekbench 5.5 / Multi-Core | |
| Media della classe Gaming (6460 - 28263, n=105, ultimi 2 anni) | |
| Acer Predator Helios 16 PH16-71-731Q | |
| Alienware m16 R1 Intel | |
| Acer Predator Triton 14 PT14-51 | |
| Aorus 15 BSF | |
| Media Intel Core i5-13500HX (12683 - 13767, n=3) | |
| HP Victus 16-r0076TX | |
| MSI Katana 15 B12VEK | |
| Asus TUF A15 FA507 | |
| Acer Nitro 16 AN16-41-R7YE | |
| Geekbench 5.5 / Single-Core | |
| Media della classe Gaming (986 - 2474, n=105, ultimi 2 anni) | |
| Acer Predator Helios 16 PH16-71-731Q | |
| Aorus 15 BSF | |
| Alienware m16 R1 Intel | |
| Media Intel Core i5-13500HX (1688 - 1779, n=3) | |
| Acer Predator Triton 14 PT14-51 | |
| HP Victus 16-r0076TX | |
| MSI Katana 15 B12VEK | |
| Asus TUF A15 FA507 | |
| Acer Nitro 16 AN16-41-R7YE | |
| HWBOT x265 Benchmark v2.2 / 4k Preset | |
| Media della classe Gaming (11.5 - 44.4, n=105, ultimi 2 anni) | |
| Acer Predator Helios 16 PH16-71-731Q | |
| Alienware m16 R1 Intel | |
| Acer Predator Triton 14 PT14-51 | |
| Media Intel Core i5-13500HX (20.3 - 20.9, n=3) | |
| HP Victus 16-r0076TX | |
| MSI Katana 15 B12VEK | |
| Asus TUF A15 FA507 | |
| Aorus 15 BSF | |
| Acer Nitro 16 AN16-41-R7YE | |
| LibreOffice / 20 Documents To PDF | |
| Asus TUF A15 FA507 | |
| Media della classe Gaming (33.2 - 88.8, n=105, ultimi 2 anni) | |
| Acer Predator Triton 14 PT14-51 | |
| Aorus 15 BSF | |
| MSI Katana 15 B12VEK | |
| Acer Nitro 16 AN16-41-R7YE | |
| Alienware m16 R1 Intel | |
| Media Intel Core i5-13500HX (42.5 - 45, n=2) | |
| Acer Predator Helios 16 PH16-71-731Q | |
| R Benchmark 2.5 / Overall mean | |
| Acer Nitro 16 AN16-41-R7YE | |
| Asus TUF A15 FA507 | |
| MSI Katana 15 B12VEK | |
| HP Victus 16-r0076TX | |
| Acer Predator Triton 14 PT14-51 | |
| Media Intel Core i5-13500HX (0.4512 - 0.4891, n=3) | |
| Alienware m16 R1 Intel | |
| Aorus 15 BSF | |
| Media della classe Gaming (0.3439 - 0.759, n=106, ultimi 2 anni) | |
| Acer Predator Helios 16 PH16-71-731Q | |
* ... Meglio usare valori piccoli
AIDA64: FP32 Ray-Trace | FPU Julia | CPU SHA3 | CPU Queen | FPU SinJulia | FPU Mandel | CPU AES | CPU ZLib | FP64 Ray-Trace | CPU PhotoWorxx
| Performance rating | |
| Media della classe Gaming | |
| Alienware m16 R1 Intel | |
| Acer Predator Helios 16 PH16-71-731Q | |
| Acer Predator Triton 14 PT14-51 | |
| Media Intel Core i5-13500HX | |
| HP Victus 16-r0076TX | |
| Asus TUF A15 FA507 | |
| Aorus 15 BSF | |
| MSI Katana 15 B12VEK | |
| Acer Nitro 16 AN16-41-R7YE | |
| AIDA64 / FP32 Ray-Trace | |
| Media della classe Gaming (10227 - 85542, n=105, ultimi 2 anni) | |
| Alienware m16 R1 Intel | |
| Acer Predator Helios 16 PH16-71-731Q | |
| Asus TUF A15 FA507 | |
| Media Intel Core i5-13500HX (15888 - 16544, n=3) | |
| Acer Predator Triton 14 PT14-51 | |
| HP Victus 16-r0076TX | |
| MSI Katana 15 B12VEK | |
| Aorus 15 BSF | |
| Acer Nitro 16 AN16-41-R7YE | |
| AIDA64 / FPU Julia | |
| Media della classe Gaming (51376 - 238426, n=105, ultimi 2 anni) | |
| Alienware m16 R1 Intel | |
| Asus TUF A15 FA507 | |
| Acer Predator Helios 16 PH16-71-731Q | |
| Acer Predator Triton 14 PT14-51 | |
| HP Victus 16-r0076TX | |
| Media Intel Core i5-13500HX (80761 - 85623, n=3) | |
| Acer Nitro 16 AN16-41-R7YE | |
| MSI Katana 15 B12VEK | |
| Aorus 15 BSF | |
| AIDA64 / CPU SHA3 | |
| Media della classe Gaming (2180 - 10115, n=105, ultimi 2 anni) | |
| Alienware m16 R1 Intel | |
| Acer Predator Helios 16 PH16-71-731Q | |
| Acer Predator Triton 14 PT14-51 | |
| Media Intel Core i5-13500HX (3868 - 4017, n=3) | |
| HP Victus 16-r0076TX | |
| Asus TUF A15 FA507 | |
| MSI Katana 15 B12VEK | |
| Aorus 15 BSF | |
| Acer Nitro 16 AN16-41-R7YE | |
| AIDA64 / CPU Queen | |
| Media della classe Gaming (49785 - 173351, n=90, ultimi 2 anni) | |
| Alienware m16 R1 Intel | |
| Acer Predator Helios 16 PH16-71-731Q | |
| Media Intel Core i5-13500HX (105168 - 107075, n=3) | |
| Aorus 15 BSF | |
| HP Victus 16-r0076TX | |
| Asus TUF A15 FA507 | |
| Acer Predator Triton 14 PT14-51 | |
| MSI Katana 15 B12VEK | |
| Acer Nitro 16 AN16-41-R7YE | |
| AIDA64 / FPU SinJulia | |
| Media della classe Gaming (4424 - 33636, n=105, ultimi 2 anni) | |
| Alienware m16 R1 Intel | |
| Acer Predator Helios 16 PH16-71-731Q | |
| Asus TUF A15 FA507 | |
| Media Intel Core i5-13500HX (10334 - 10793, n=3) | |
| Acer Predator Triton 14 PT14-51 | |
| HP Victus 16-r0076TX | |
| Acer Nitro 16 AN16-41-R7YE | |
| Aorus 15 BSF | |
| MSI Katana 15 B12VEK | |
| AIDA64 / FPU Mandel | |
| Media della classe Gaming (25115 - 128721, n=105, ultimi 2 anni) | |
| Asus TUF A15 FA507 | |
| Alienware m16 R1 Intel | |
| Acer Predator Helios 16 PH16-71-731Q | |
| Acer Nitro 16 AN16-41-R7YE | |
| Media Intel Core i5-13500HX (39805 - 41418, n=3) | |
| HP Victus 16-r0076TX | |
| Acer Predator Triton 14 PT14-51 | |
| MSI Katana 15 B12VEK | |
| Aorus 15 BSF | |
| AIDA64 / CPU AES | |
| Alienware m16 R1 Intel | |
| Acer Predator Helios 16 PH16-71-731Q | |
| Acer Predator Triton 14 PT14-51 | |
| Aorus 15 BSF | |
| Media della classe Gaming (39258 - 247074, n=105, ultimi 2 anni) | |
| Media Intel Core i5-13500HX (79903 - 154368, n=3) | |
| Acer Nitro 16 AN16-41-R7YE | |
| HP Victus 16-r0076TX | |
| MSI Katana 15 B12VEK | |
| Asus TUF A15 FA507 | |
| AIDA64 / CPU ZLib | |
| Media della classe Gaming (574 - 2531, n=105, ultimi 2 anni) | |
| Acer Predator Helios 16 PH16-71-731Q | |
| Alienware m16 R1 Intel | |
| Acer Predator Triton 14 PT14-51 | |
| Media Intel Core i5-13500HX (1104 - 1233, n=3) | |
| HP Victus 16-r0076TX | |
| Aorus 15 BSF | |
| MSI Katana 15 B12VEK | |
| Acer Nitro 16 AN16-41-R7YE | |
| Asus TUF A15 FA507 | |
| AIDA64 / FP64 Ray-Trace | |
| Media della classe Gaming (5509 - 45446, n=105, ultimi 2 anni) | |
| Alienware m16 R1 Intel | |
| Acer Predator Helios 16 PH16-71-731Q | |
| Media Intel Core i5-13500HX (8587 - 9008, n=3) | |
| Acer Predator Triton 14 PT14-51 | |
| HP Victus 16-r0076TX | |
| Asus TUF A15 FA507 | |
| MSI Katana 15 B12VEK | |
| Aorus 15 BSF | |
| Acer Nitro 16 AN16-41-R7YE | |
| AIDA64 / CPU PhotoWorxx | |
| Acer Predator Triton 14 PT14-51 | |
| Media della classe Gaming (12271 - 89891, n=105, ultimi 2 anni) | |
| Media Intel Core i5-13500HX (36861 - 42683, n=3) | |
| Aorus 15 BSF | |
| MSI Katana 15 B12VEK | |
| HP Victus 16-r0076TX | |
| Alienware m16 R1 Intel | |
| Acer Predator Helios 16 PH16-71-731Q | |
| Acer Nitro 16 AN16-41-R7YE | |
| Asus TUF A15 FA507 | |
scopri il nostro Core i5-13500HX per ulteriori informazioni e confronti
Prestazioni del sistema
Sebbene l'HP Victus 16 possa andare bene come driver quotidiano, è rimasto indietro rispetto alla concorrenza in PCMark 10, dove ha ottenuto solo 6.125 punti.
Il suo punteggio CrossMark di 1.701 lo pone davanti al Lenovo LOQ 15 e Acer Nitro 16.
La situazione è più o meno la stessa in AIDA64, dove il processore Raptor Lake-HX rimane costantemente davanti alle sue controparti AMD.
CrossMark: Overall | Productivity | Creativity | Responsiveness
AIDA64: Memory Copy | Memory Read | Memory Write | Memory Latency
| PCMark 10 / Score | |
| Media della classe Gaming (5828 - 12414, n=93, ultimi 2 anni) | |
| Lenovo Legion Pro 5 16ARX8 (R5 7645HX, RTX 4050) | |
| Acer Predator Helios 16 PH16-71-731Q | |
| Lenovo LOQ 15APH8 | |
| Acer Predator Triton 14 PT14-51 | |
| Alienware m16 R1 Intel | |
| Dell G15 5530 | |
| Acer Nitro 16 AN16-41-R7YE | |
| Media Intel Core i5-13500HX, NVIDIA GeForce RTX 4050 Laptop GPU (6125 - 6565, n=2) | |
| HP Victus 16-r0076TX | |
| PCMark 10 / Essentials | |
| Lenovo Legion Pro 5 16ARX8 (R5 7645HX, RTX 4050) | |
| Acer Predator Helios 16 PH16-71-731Q | |
| Dell G15 5530 | |
| Alienware m16 R1 Intel | |
| Media della classe Gaming (8810 - 11935, n=97, ultimi 2 anni) | |
| Lenovo LOQ 15APH8 | |
| Acer Predator Triton 14 PT14-51 | |
| Media Intel Core i5-13500HX, NVIDIA GeForce RTX 4050 Laptop GPU (9625 - 10618, n=2) | |
| Acer Nitro 16 AN16-41-R7YE | |
| HP Victus 16-r0076TX | |
| PCMark 10 / Productivity | |
| Media della classe Gaming (6845 - 25323, n=95, ultimi 2 anni) | |
| Lenovo Legion Pro 5 16ARX8 (R5 7645HX, RTX 4050) | |
| Acer Predator Helios 16 PH16-71-731Q | |
| Dell G15 5530 | |
| Lenovo LOQ 15APH8 | |
| Acer Predator Triton 14 PT14-51 | |
| Alienware m16 R1 Intel | |
| Media Intel Core i5-13500HX, NVIDIA GeForce RTX 4050 Laptop GPU (8471 - 9005, n=2) | |
| HP Victus 16-r0076TX | |
| Acer Nitro 16 AN16-41-R7YE | |
| PCMark 10 / Digital Content Creation | |
| Media della classe Gaming (7602 - 19954, n=95, ultimi 2 anni) | |
| Lenovo LOQ 15APH8 | |
| Lenovo Legion Pro 5 16ARX8 (R5 7645HX, RTX 4050) | |
| Acer Predator Triton 14 PT14-51 | |
| Acer Nitro 16 AN16-41-R7YE | |
| Acer Predator Helios 16 PH16-71-731Q | |
| Alienware m16 R1 Intel | |
| Dell G15 5530 | |
| Media Intel Core i5-13500HX, NVIDIA GeForce RTX 4050 Laptop GPU (7649 - 8031, n=2) | |
| HP Victus 16-r0076TX | |
| CrossMark / Overall | |
| Acer Predator Helios 16 PH16-71-731Q | |
| Alienware m16 R1 Intel | |
| Media della classe Gaming (1366 - 2409, n=94, ultimi 2 anni) | |
| Lenovo Legion Pro 5 16ARX8 (R5 7645HX, RTX 4050) | |
| Acer Predator Triton 14 PT14-51 | |
| Dell G15 5530 | |
| Media Intel Core i5-13500HX, NVIDIA GeForce RTX 4050 Laptop GPU (1701 - 1964, n=2) | |
| HP Victus 16-r0076TX | |
| Lenovo LOQ 15APH8 | |
| Acer Nitro 16 AN16-41-R7YE | |
| CrossMark / Productivity | |
| Acer Predator Helios 16 PH16-71-731Q | |
| Alienware m16 R1 Intel | |
| Lenovo Legion Pro 5 16ARX8 (R5 7645HX, RTX 4050) | |
| Media della classe Gaming (1386 - 2254, n=94, ultimi 2 anni) | |
| Acer Predator Triton 14 PT14-51 | |
| Dell G15 5530 | |
| Media Intel Core i5-13500HX, NVIDIA GeForce RTX 4050 Laptop GPU (1585 - 1878, n=2) | |
| Lenovo LOQ 15APH8 | |
| HP Victus 16-r0076TX | |
| Acer Nitro 16 AN16-41-R7YE | |
| CrossMark / Creativity | |
| Acer Predator Helios 16 PH16-71-731Q | |
| Media della classe Gaming (1343 - 2786, n=94, ultimi 2 anni) | |
| Alienware m16 R1 Intel | |
| Dell G15 5530 | |
| Lenovo Legion Pro 5 16ARX8 (R5 7645HX, RTX 4050) | |
| Acer Predator Triton 14 PT14-51 | |
| Media Intel Core i5-13500HX, NVIDIA GeForce RTX 4050 Laptop GPU (1912 - 2022, n=2) | |
| HP Victus 16-r0076TX | |
| Lenovo LOQ 15APH8 | |
| Acer Nitro 16 AN16-41-R7YE | |
| CrossMark / Responsiveness | |
| Acer Predator Helios 16 PH16-71-731Q | |
| Alienware m16 R1 Intel | |
| Lenovo Legion Pro 5 16ARX8 (R5 7645HX, RTX 4050) | |
| Media Intel Core i5-13500HX, NVIDIA GeForce RTX 4050 Laptop GPU (1478 - 2053, n=2) | |
| Acer Predator Triton 14 PT14-51 | |
| Media della classe Gaming (1226 - 2334, n=94, ultimi 2 anni) | |
| Dell G15 5530 | |
| HP Victus 16-r0076TX | |
| Lenovo LOQ 15APH8 | |
| Acer Nitro 16 AN16-41-R7YE | |
| AIDA64 / Memory Copy | |
| Acer Predator Triton 14 PT14-51 | |
| Media della classe Gaming (21750 - 129946, n=105, ultimi 2 anni) | |
| Dell G15 5530 | |
| Media Intel Core i5-13500HX, NVIDIA GeForce RTX 4050 Laptop GPU (56320 - 62153, n=3) | |
| Alienware m16 R1 Intel | |
| Acer Predator Helios 16 PH16-71-731Q | |
| HP Victus 16-r0076TX | |
| Acer Nitro 16 AN16-41-R7YE | |
| Lenovo Legion Pro 5 16ARX8 (R5 7645HX, RTX 4050) | |
| Lenovo LOQ 15APH8 | |
| AIDA64 / Memory Read | |
| Media della classe Gaming (22956 - 118858, n=105, ultimi 2 anni) | |
| Dell G15 5530 | |
| Alienware m16 R1 Intel | |
| Acer Predator Helios 16 PH16-71-731Q | |
| Acer Predator Triton 14 PT14-51 | |
| Media Intel Core i5-13500HX, NVIDIA GeForce RTX 4050 Laptop GPU (66057 - 66667, n=3) | |
| HP Victus 16-r0076TX | |
| Acer Nitro 16 AN16-41-R7YE | |
| Lenovo Legion Pro 5 16ARX8 (R5 7645HX, RTX 4050) | |
| Lenovo LOQ 15APH8 | |
| AIDA64 / Memory Write | |
| Acer Predator Helios 16 PH16-71-731Q | |
| Acer Predator Triton 14 PT14-51 | |
| Media della classe Gaming (22297 - 135096, n=105, ultimi 2 anni) | |
| Media Intel Core i5-13500HX, NVIDIA GeForce RTX 4050 Laptop GPU (56956 - 66135, n=3) | |
| Dell G15 5530 | |
| Alienware m16 R1 Intel | |
| HP Victus 16-r0076TX | |
| Acer Nitro 16 AN16-41-R7YE | |
| Lenovo Legion Pro 5 16ARX8 (R5 7645HX, RTX 4050) | |
| Lenovo LOQ 15APH8 | |
| AIDA64 / Memory Latency | |
| Media della classe Gaming (75.3 - 259, n=105, ultimi 2 anni) | |
| Acer Predator Triton 14 PT14-51 | |
| HP Victus 16-r0076TX | |
| Lenovo LOQ 15APH8 | |
| Media Intel Core i5-13500HX, NVIDIA GeForce RTX 4050 Laptop GPU (87.1 - 96.8, n=3) | |
| Dell G15 5530 | |
| Alienware m16 R1 Intel | |
| Acer Nitro 16 AN16-41-R7YE | |
| Acer Predator Helios 16 PH16-71-731Q | |
| Lenovo Legion Pro 5 16ARX8 (R5 7645HX, RTX 4050) | |
* ... Meglio usare valori piccoli
| PCMark 8 Home Score Accelerated | 4602 punti | |
| PCMark 8 Work Score Accelerated | 6227 punti | |
| PCMark 10 Score | 6125 punti | |
Aiuto | ||
Latenza DPC
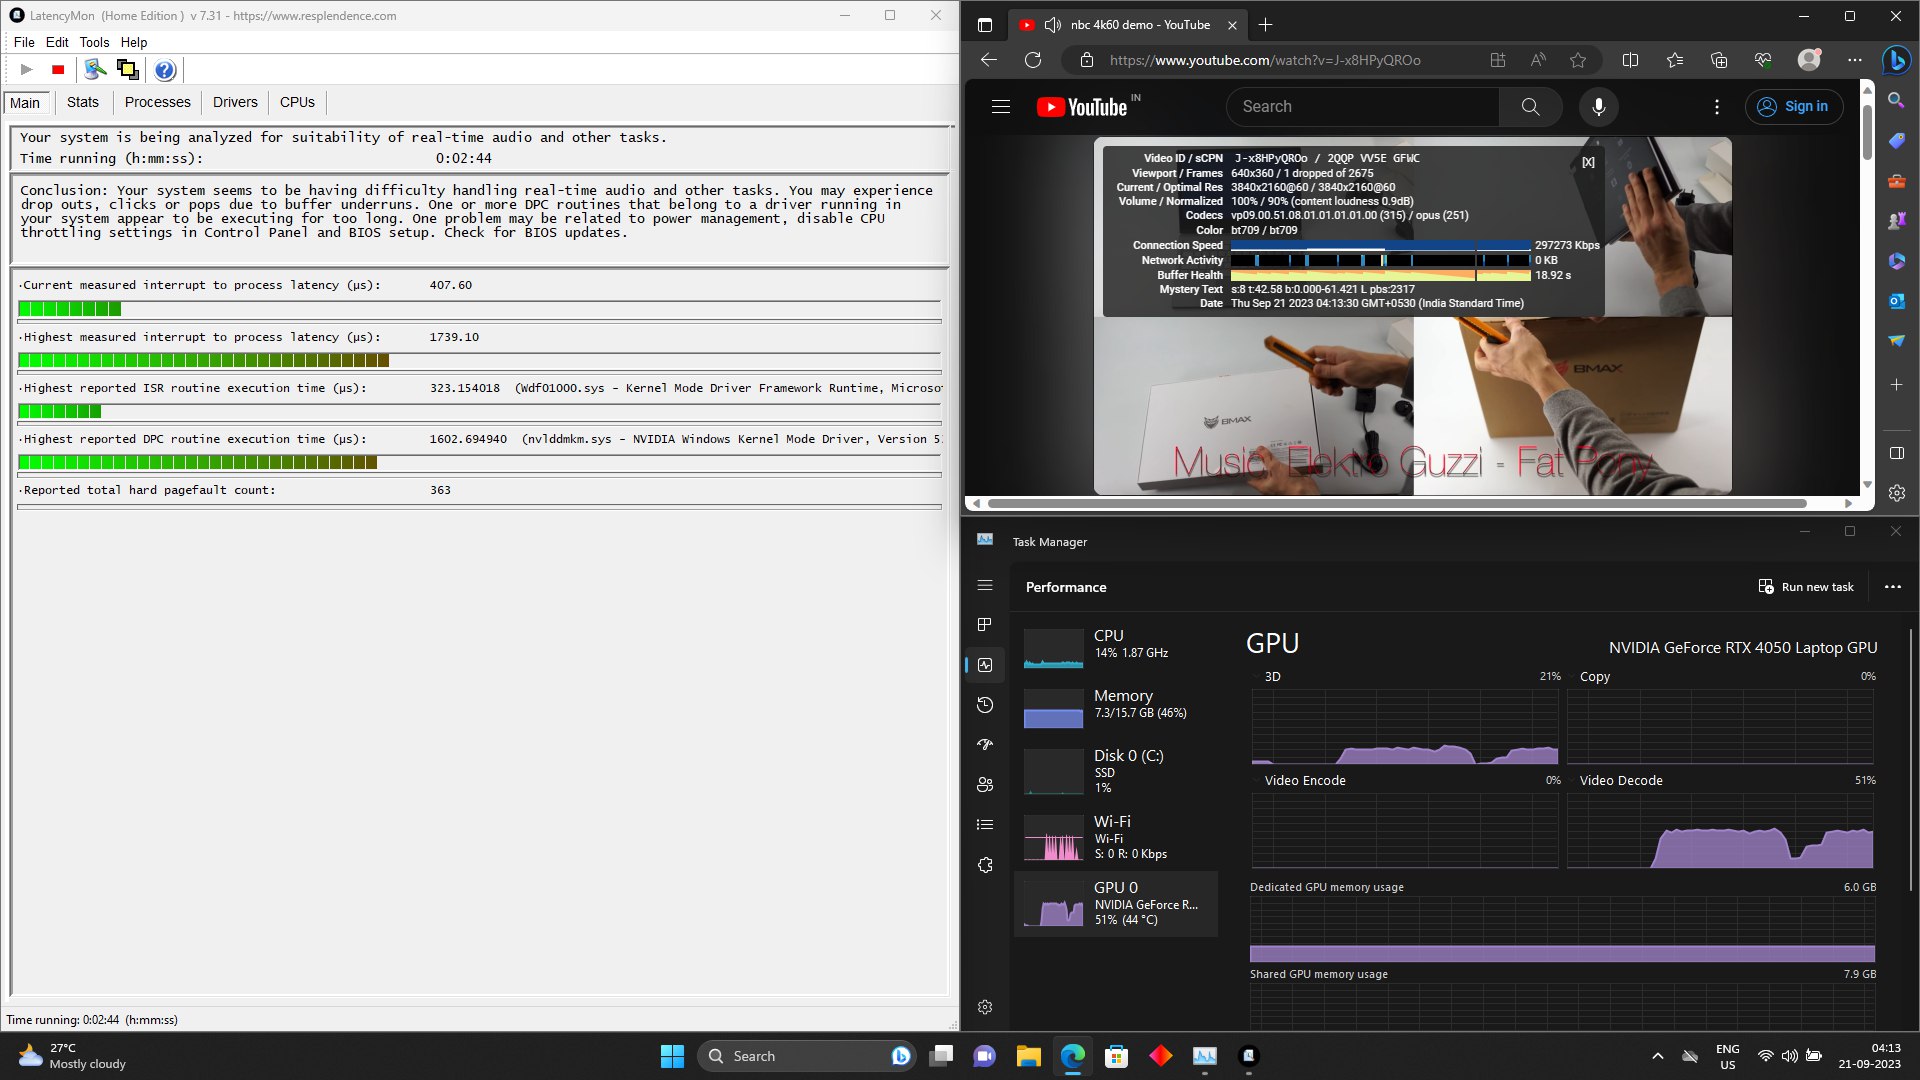
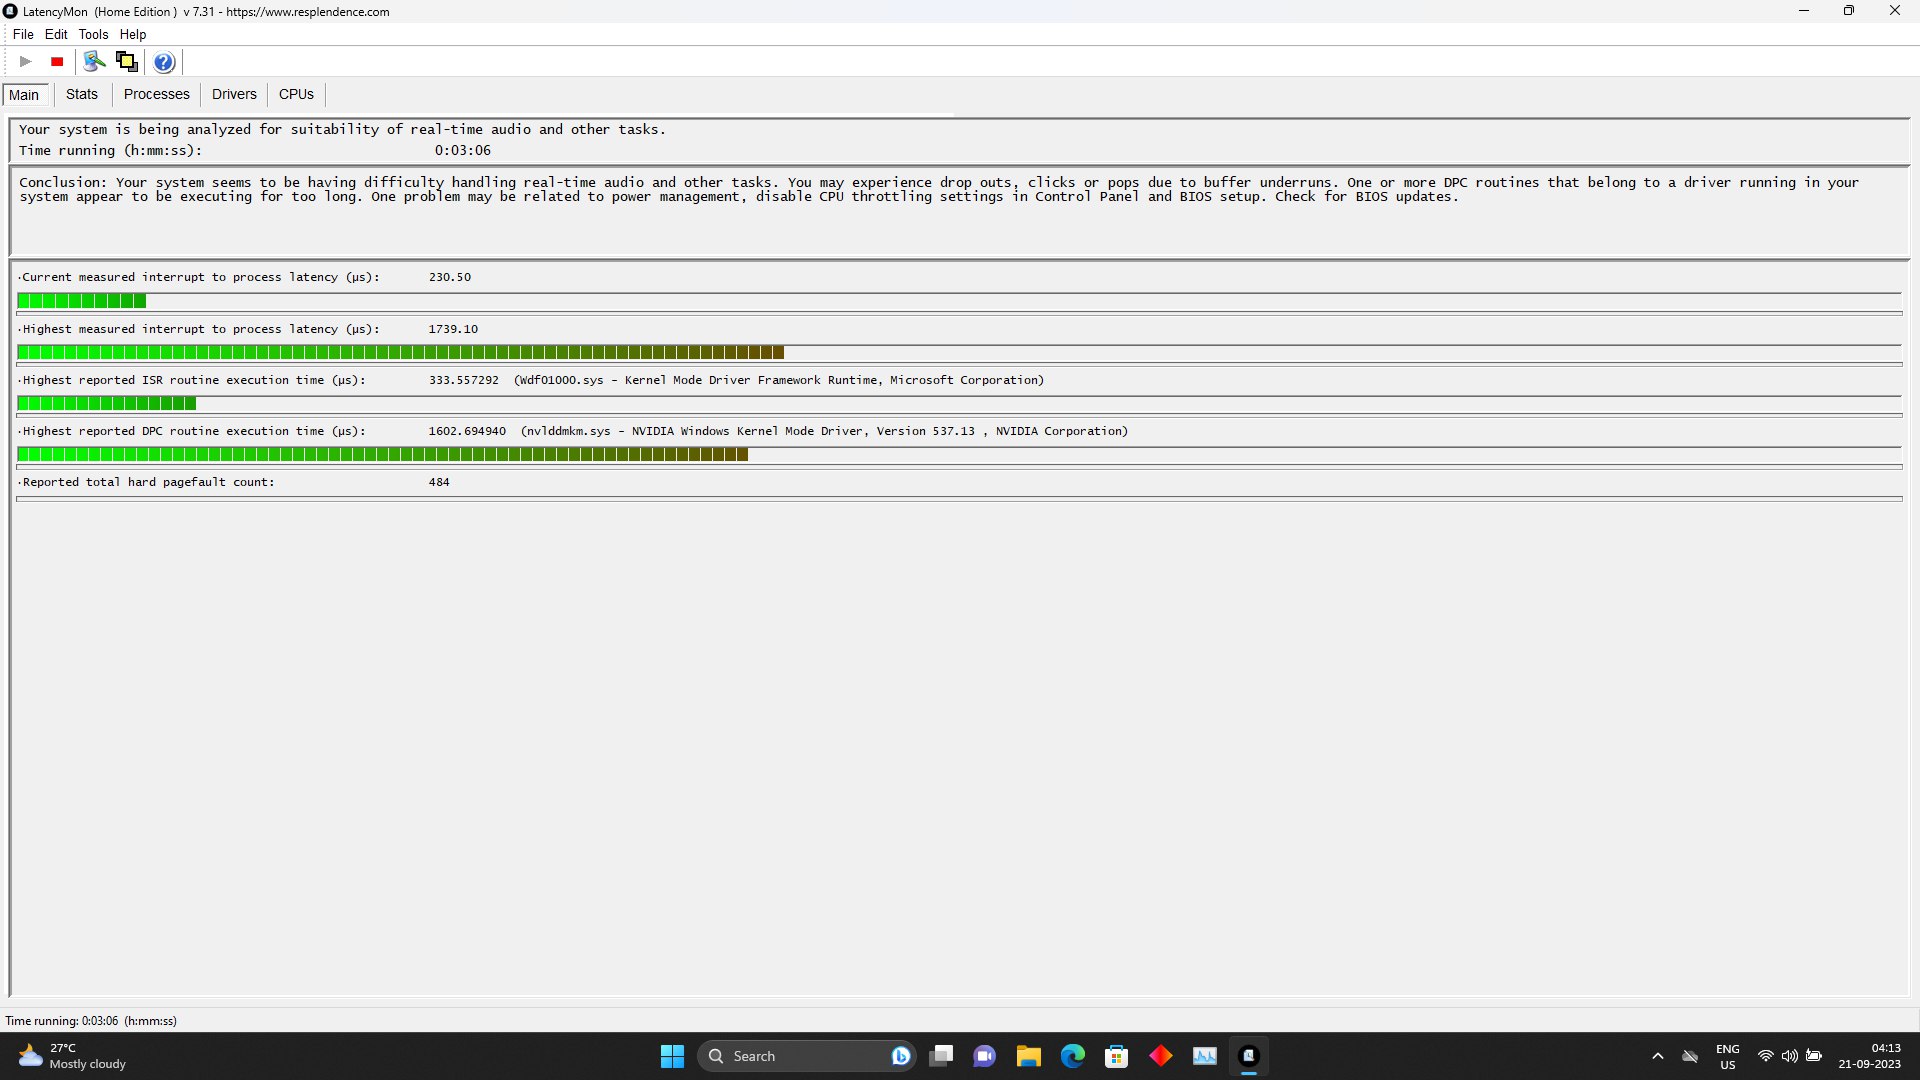
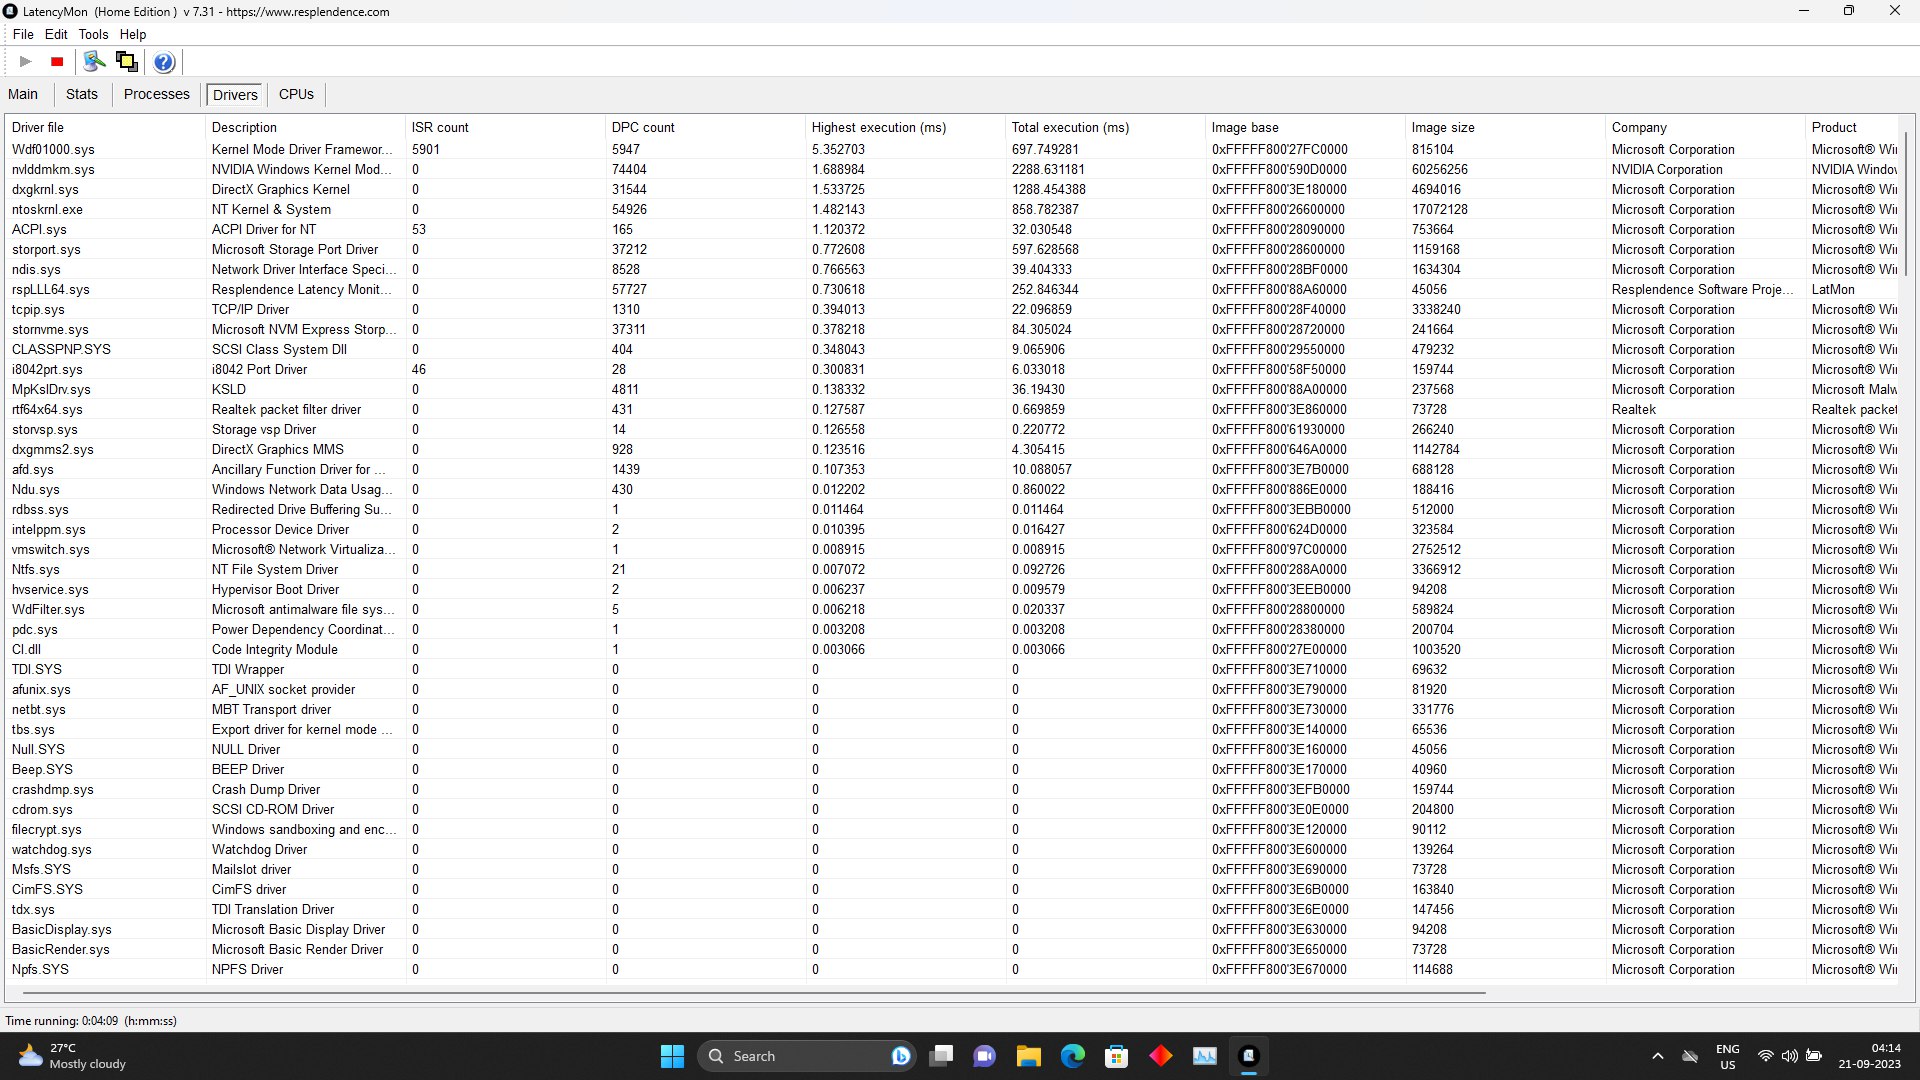
L'elevata latenza DPC è stata un problema costante delle schede grafiche Ada Lovelace per desktop fin dal lancio. Il problema sembra essersi esteso anche alle varianti per laptop. Una rapida occhiata a LatencyMon indica che il colpevole è "Wdf0100.sys" (Windows Driver Framework) e "Nvlddmkm.sys" (Nvidia Windows Kernel Module), indicando che un aggiornamento del software potrebbe risolvere il problema in seguito.
Controlla Pagina di classificazione della latenza per ulteriori risultati.
| DPC Latencies / LatencyMon - interrupt to process latency (max), Web, Youtube, Prime95 | |
| Dell G15 5530 | |
| Alienware m16 R1 Intel | |
| HP Victus 16-r0076TX | |
| Acer Predator Helios 16 PH16-71-731Q | |
| Acer Predator Triton 14 PT14-51 | |
| Lenovo LOQ 15APH8 | |
| Acer Nitro 16 AN16-41-R7YE | |
| Lenovo Legion Pro 5 16ARX8 (R5 7645HX, RTX 4050) | |
* ... Meglio usare valori piccoli
Dispositivi di archiviazione
L'unità SSD SK Hynix PC801 NVMe dell'HP Victus 16 offre una discreta velocità di trasferimento su diversi carichi di lavoro. I nostri test hanno stabilito che non si blocca nemmeno dopo un uso prolungato, grazie alla sua spessa schermatura metallica.
Tuttavia, 512 GB sono un po' pochi nel 2023, soprattutto se le dimensioni dei giochi diventano la norma. Fortunatamente HP consente agli utenti di installare un'unità aggiuntiva con relativa facilità.

* ... Meglio usare valori piccoli
Disk Throttling: DiskSpd Read Loop, Queue Depth 8
Per saperne di più sui nostri HDD e SSD benchmark.
Prestazioni della GPU
A prima vista, la Nvidia GeForce RTX 4050 non sembra la GPU più potente del mercato. Ha 6 GB di VRAM GDDR6 su un bus a 96 bit, 2.560 core CUDA e un valore TGP compreso tra 35 e 115 Watt.
Da alcune ricerche nel pannello di controllo Nvidia è emerso che il TGP massimo è di circa 100 Watt, un valore rispettabile. È interessante notare che la RTX 4050 di GeForce può "prendere in prestito" fino a 20 Watt di potenza dalla CPU.

Ciò si riflette in FurMark, dove la potenza massima della scheda balza a 122,1 Watt sotto carico. Tuttavia, non può rimanere a lungo in questo stato e dopo un po' si assesta su valori inferiori.
L'HP Victus 16 si comporta marginalmente meglio di altri portatili RTX 4050 in 3DMark 11, con un punteggio di 31.571 punti. La differenza è meno evidente nei test 3DMark più vecchi, come Ice Storm, Fire Strike e Time Spy.
In conclusione, la RTX 4050 di GeForce, nonostante la sua scheda tecnica non entusiasmante, è ancora al passo con la concorrenza e rappresenta una scheda grafica entry-level impeccabile.
| 3DMark 06 Standard Score | 46228 punti | |
| 3DMark 11 Performance | 28214 punti | |
| 3DMark Ice Storm Standard Score | 198276 punti | |
| 3DMark Cloud Gate Standard Score | 61259 punti | |
| 3DMark Fire Strike Score | 21070 punti | |
| 3DMark Fire Strike Extreme Score | 10180 punti | |
| 3DMark Time Spy Score | 9069 punti | |
Aiuto | ||
| Blender / v3.3 Classroom OPTIX/RTX | |
| Media NVIDIA GeForce RTX 4050 Laptop GPU (25 - 37, n=40) | |
| HP Victus 16-r0076TX | |
| MSI Katana 15 B12VEK | |
| Asus TUF A15 FA507 | |
| Asus TUF A15 FA507 | |
| Acer Predator Triton 14 PT14-51 | |
| Acer Nitro 16 AN16-41-R7YE | |
| Alienware m16 R1 Intel | |
| Aorus 15 BSF | |
| Acer Predator Helios 16 PH16-71-731Q | |
| Media della classe Gaming (9 - 32, n=106, ultimi 2 anni) | |
| Blender / v3.3 Classroom CUDA | |
| Media NVIDIA GeForce RTX 4050 Laptop GPU (47 - 68, n=39) | |
| MSI Katana 15 B12VEK | |
| Acer Predator Triton 14 PT14-51 | |
| Asus TUF A15 FA507 | |
| Asus TUF A15 FA507 | |
| Acer Nitro 16 AN16-41-R7YE | |
| HP Victus 16-r0076TX | |
| Acer Predator Helios 16 PH16-71-731Q | |
| Alienware m16 R1 Intel | |
| Aorus 15 BSF | |
| Media della classe Gaming (15 - 228, n=106, ultimi 2 anni) | |
| Blender / v3.3 Classroom CPU | |
| Acer Nitro 16 AN16-41-R7YE | |
| MSI Katana 15 B12VEK | |
| Media NVIDIA GeForce RTX 4050 Laptop GPU (243 - 907, n=40) | |
| Aorus 15 BSF | |
| Asus TUF A15 FA507 | |
| Asus TUF A15 FA507 | |
| HP Victus 16-r0076TX | |
| Acer Predator Triton 14 PT14-51 | |
| Acer Predator Helios 16 PH16-71-731Q | |
| Alienware m16 R1 Intel | |
| Media della classe Gaming (122 - 565, n=102, ultimi 2 anni) | |
* ... Meglio usare valori piccoli
Scopri il nostro Nvidia GeForce RTX 4050 per ulteriori informazioni e confronti.
Prestazioni di gioco
La RTX 4050 di GeForce è sorprendentemente competente nel gioco, anche con soli 6 GB di VRAM. È riuscita a far girare tutti i giochi che le abbiamo proposto a 1080p 60 FPS, con tutte le impostazioni al massimo.
Le prestazioni stellari di Cyberpunk 2077 si spiegano con l'ampia ottimizzazione del gioco da parte di Nvidia. Titoli e-sportivi come DOTA 2 funzionano bene anche sul portatile.
I miglioramenti architettonici apportati da Ada Lovelace danno alla RTX 4050 una possibilità decente come macchina da gioco a 1080p. Tuttavia, non raccomanderemmo di attivare il raytracing senza DLSS, poiché è notoriamente un'attività che richiede molta VRAM.
| The Witcher 3 - 1920x1080 Ultra Graphics & Postprocessing (HBAO+) | |
| Media della classe Gaming (104.7 - 240, n=7, ultimi 2 anni) | |
| Alienware m16 R1 Intel | |
| Dell G15 5530 | |
| Acer Predator Helios 16 PH16-71-731Q | |
| HP Victus 16-r0076TX | |
| Lenovo Legion Pro 5 16ARX8 (R5 7645HX, RTX 4050) | |
| Acer Nitro 16 AN16-41-R7YE | |
| Lenovo LOQ 15APH8 | |
| Acer Predator Triton 14 PT14-51 | |
Nei nostri test sostenuti, The Witcher 3 è stato in grado di funzionare abbastanza bene con un minimo di 90 fps in ogni momento. Sebbene il frame rate si sia aggirato intorno ai 100 fps in alcuni casi, è sceso a causa del thermal throttling. In sostanza, il portatile è in grado di eseguire giochi impegnativi con un frame rate abbastanza costante.
Witcher 3 FPS Chart
| basso | medio | alto | ultra | |
|---|---|---|---|---|
| The Witcher 3 (2015) | 365 | 282 | 160.2 | 94.7 |
| Dota 2 Reborn (2015) | 181.5 | 163.4 | 159 | 145 |
| Final Fantasy XV Benchmark (2018) | 190.5 | 120.3 | 84.8 | |
| X-Plane 11.11 (2018) | 157.2 | 138.8 | 106.5 | |
| Far Cry 5 (2018) | 155 | 122 | 110 | 109 |
| Strange Brigade (2018) | 355 | 213 | 171.8 | 149.3 |
| Cyberpunk 2077 1.6 (2022) | 111.2 | 85.3 | 65.5 | 71.8 |
| F1 22 (2022) | 214 | 207 | 154.4 | 54.1 |
| F1 23 (2023) | 217 | 210 | 156.2 | 60.8 |
Emissioni: Funziona un po' troppo forte e caldo
Rumore del sistema
Anche se HP ha fatto tutto il possibile per raffreddare il Victus 16, ha difficoltà a tenere sotto controllo l'hardware. Una delle prime cose che si notano è il rumore del portatile sotto il minimo carico, che aumenta progressivamente quando si gioca.
I nostri test hanno determinato una rumorosità massima di 55 dB(A). Sebbene sia ben al di sotto della soglia di ciò che può essere considerato forte, non è qualcosa che possa passare in secondo piano, non senza un paio di cuffie.
Rumorosità
| Idle |
| 23.68 / 23.68 / 23.68 dB(A) |
| Sotto carico |
| 39.44 / 55.37 dB(A) |
 | ||
30 dB silenzioso 40 dB(A) udibile 50 dB(A) rumoroso |
||
min: | ||
| Modalità di prestazioni | Inattivo dB(A) | Carico medio dB(A) | Carico massimo dB(A) | Il Witcher 3 1080p Ultra dB(A) |
|---|---|---|---|---|
| Eco | 23,67 | 32,50 | 40,80 | 41,03 / 84 fps |
| Bilanciato | 23,87 | 35,06 | 44,72 | 44,78 / 86 fps |
| Performance | 23,68 | 39,44 | 55,37 | 55,42 / 87 fps |
| HP Victus 16-r0076TX i5-13500HX, GeForce RTX 4050 Laptop GPU | Acer Nitro 16 AN16-41-R7YE R5 7535HS, GeForce RTX 4050 Laptop GPU | Acer Predator Triton 14 PT14-51 i7-13700H, GeForce RTX 4050 Laptop GPU | Alienware m16 R1 Intel i7-13700HX, GeForce RTX 4060 Laptop GPU | Acer Predator Helios 16 PH16-71-731Q i7-13700HX, GeForce RTX 4060 Laptop GPU | Dell G15 5530 i7-13650HX, GeForce RTX 4060 Laptop GPU | Lenovo Legion Pro 5 16ARX8 (R5 7645HX, RTX 4050) R5 7645HX, GeForce RTX 4050 Laptop GPU | Lenovo LOQ 15APH8 R7 7840HS, GeForce RTX 4050 Laptop GPU | |
|---|---|---|---|---|---|---|---|---|
| Noise | -1% | -7% | -9% | -3% | 3% | 5% | 0% | |
| off /ambiente * (dB) | 21.57 | 24 -11% | 25 -16% | 25 -16% | 24 -11% | 20.41 5% | 23 -7% | 23.1 -7% |
| Idle Minimum * (dB) | 23.68 | 25 -6% | 27 -14% | 25 -6% | 24 -1% | 26.85 -13% | 23 3% | 23.1 2% |
| Idle Average * (dB) | 23.68 | 26 -10% | 29 -22% | 26 -10% | 24 -1% | 26.85 -13% | 23 3% | 23.1 2% |
| Idle Maximum * (dB) | 23.68 | 27 -14% | 31 -31% | 27 -14% | 32.32 -36% | 26.85 -13% | 24.42 -3% | 25.2 -6% |
| Load Average * (dB) | 39.44 | 42 -6% | 42 -6% | 52 -32% | 36.66 7% | 27.65 30% | 34.94 11% | 44.3 -12% |
| Witcher 3 ultra * (dB) | 55.4 | 43 22% | 43 22% | 51 8% | 49.06 11% | 47.9 14% | 43.79 21% | 45.8 17% |
| Load Maximum * (dB) | 55.37 | 45 19% | 45 19% | 53 4% | 49.49 11% | 47.86 14% | 50 10% | 52 6% |
* ... Meglio usare valori piccoli
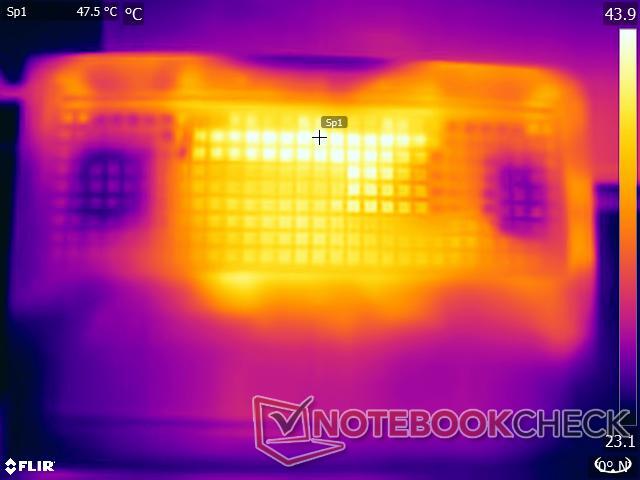
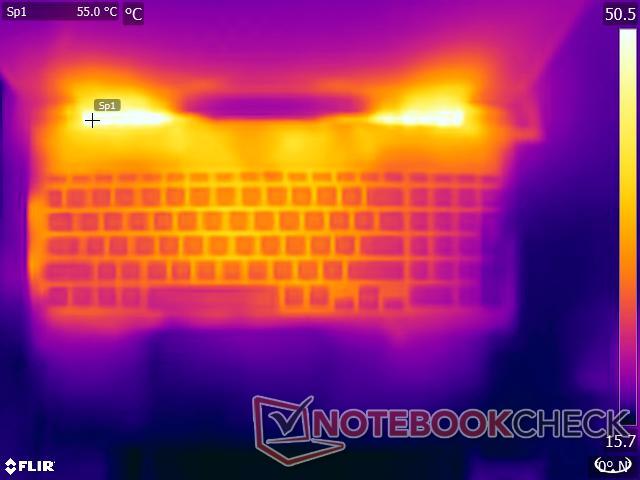
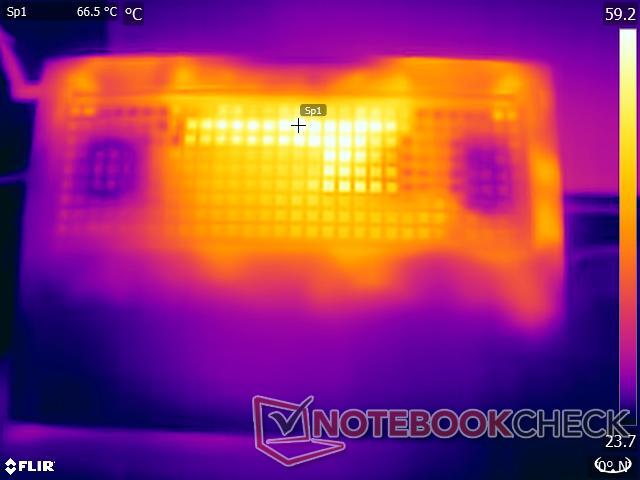
Temperatura
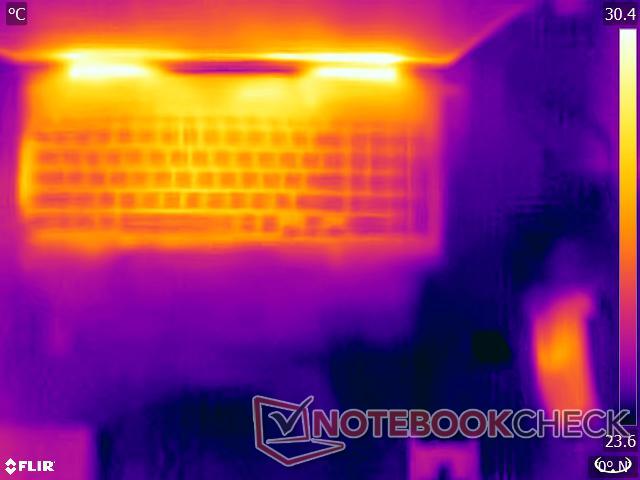
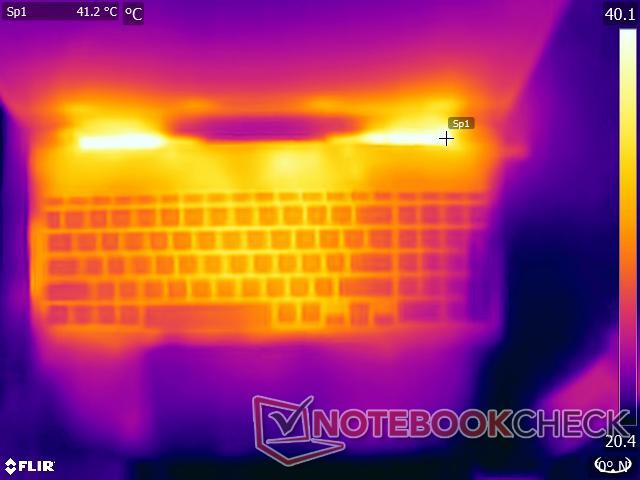
Subito dopo aver giocato, l'HP Victus 16 diventa caldo al tatto. Il suo telaio in plastica non riesce a isolare il calore generato dai suoi componenti ad alto consumo energetico. La tastiera, in particolare, si scalda notevolmente dopo pochi minuti di gioco.
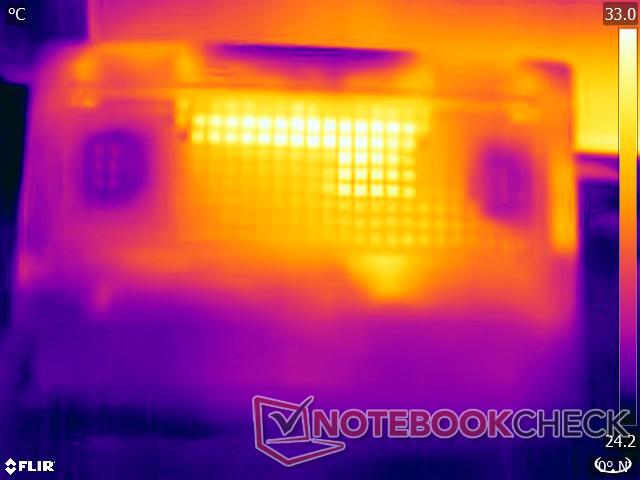
Le scelte progettuali di HP fanno sì che parte del calore venga espulso da tutte le direzioni. I nostri test hanno stabilito che l'area direttamente adiacente alla presa d'aria può raggiungere i 48° C sotto carico. Questo è il valore più alto raggiunto dal portatile, con le aree circostanti che si aggirano tra i 44° C e i 45,8°C.
(-) La temperatura massima sul lato superiore è di 48 °C / 118 F, rispetto alla media di 40.4 °C / 105 F, che varia da 21.2 a 68.8 °C per questa classe Gaming.
(-) Il lato inferiore si riscalda fino ad un massimo di 48 °C / 118 F, rispetto alla media di 43.2 °C / 110 F
(+) In idle, la temperatura media del lato superiore è di 28 °C / 82 F, rispetto alla media deld ispositivo di 33.9 °C / 93 F.
(-) Riproducendo The Witcher 3, la temperatura media per il lato superiore e' di 38.7 °C / 102 F, rispetto alla media del dispositivo di 33.9 °C / 93 F.
(+) I poggiapolsi e il touchpad sono piu' freddi della temperatura della pelle con un massimo di 31.2 °C / 88.2 F e sono quindi freddi al tatto.
(-) La temperatura media della zona del palmo della mano di dispositivi simili e'stata di 28.8 °C / 83.8 F (-2.4 °C / -4.4 F).
| HP Victus 16-r0076TX Intel Core i5-13500HX, NVIDIA GeForce RTX 4050 Laptop GPU | Acer Nitro 16 AN16-41-R7YE AMD Ryzen 5 7535HS, NVIDIA GeForce RTX 4050 Laptop GPU | Acer Predator Triton 14 PT14-51 Intel Core i7-13700H, NVIDIA GeForce RTX 4050 Laptop GPU | Alienware m16 R1 Intel Intel Core i7-13700HX, NVIDIA GeForce RTX 4060 Laptop GPU | Acer Predator Helios 16 PH16-71-731Q Intel Core i7-13700HX, NVIDIA GeForce RTX 4060 Laptop GPU | Dell G15 5530 Intel Core i7-13650HX, NVIDIA GeForce RTX 4060 Laptop GPU | Lenovo Legion Pro 5 16ARX8 (R5 7645HX, RTX 4050) AMD Ryzen 5 7645HX, NVIDIA GeForce RTX 4050 Laptop GPU | Lenovo LOQ 15APH8 AMD Ryzen 7 7840HS, NVIDIA GeForce RTX 4050 Laptop GPU | |
|---|---|---|---|---|---|---|---|---|
| Heat | -15% | -10% | -17% | -17% | -17% | -14% | 2% | |
| Maximum Upper Side * (°C) | 48 | 51 -6% | 54 -13% | 49 -2% | 41 15% | 54 -13% | 45 6% | 44.4 7% |
| Maximum Bottom * (°C) | 48 | 63 -31% | 56 -17% | 48 -0% | 66 -38% | 62.2 -30% | 54 -13% | 52 -8% |
| Idle Upper Side * (°C) | 29.6 | 34 -15% | 31 -5% | 40 -35% | 36 -22% | 33.4 -13% | 36 -22% | 28 5% |
| Idle Bottom * (°C) | 30.2 | 32 -6% | 31 -3% | 39 -29% | 37 -23% | 33.4 -11% | 38 -26% | 29.6 2% |
* ... Meglio usare valori piccoli
Stress test
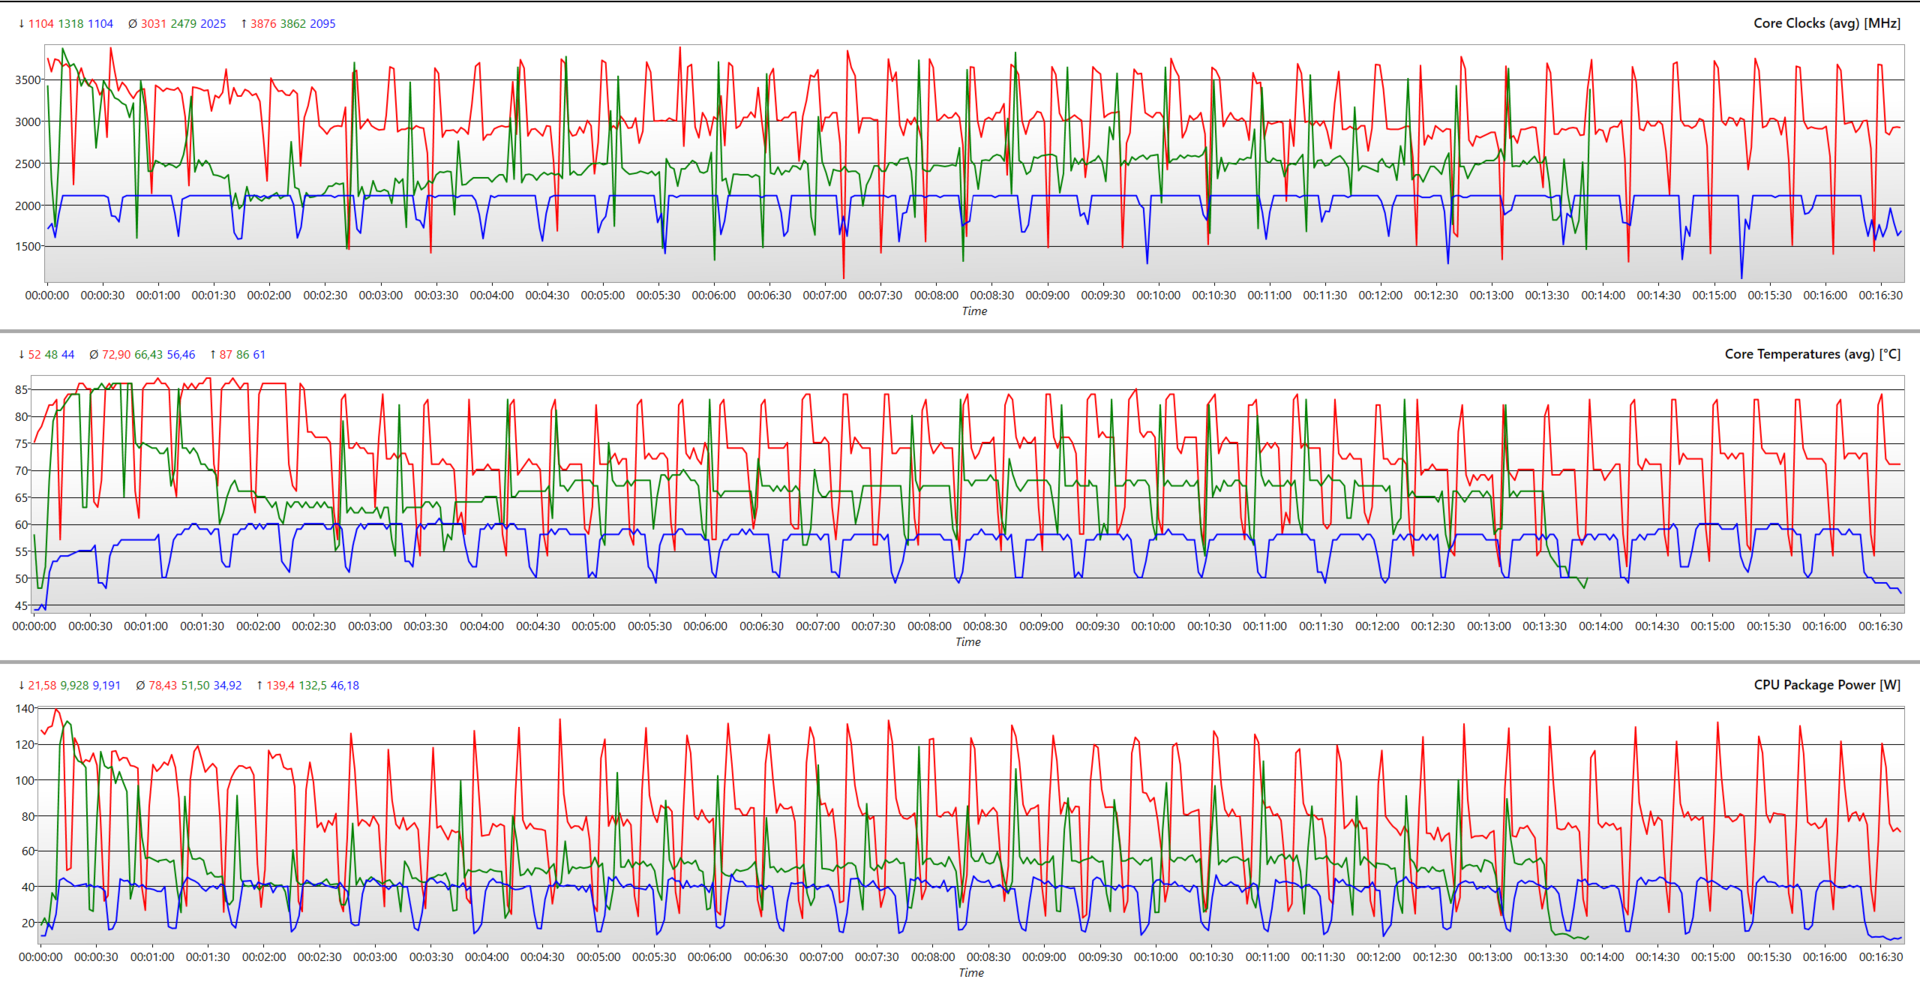
Sotto carichi prolungati, la CPU e la GPU dell'HP Victus 16 subiscono un notevole calo della velocità di clock. Il processore Core i5-13500HX può raggiungere i 2,8 GHz per un po' prima di stabilizzarsi a circa 1,69 GHz. La sua temperatura si aggira intorno ai 77°C.
Allo stesso modo, la RTX 4050 di GeForce cerca di mantenere i suoi clock a 2.580 MHz, ma alla fine si stabilizza a 2.420 MHz, che rientra nei clock di boost pubblicizzati da Nvidia. Il processore è un po' più caldo della CPU, con una temperatura media di 82,5 °C, grazie alle due robuste ventole e ai tubi di calore che incanalano il calore attraverso le prese d'aria.
Il core P può raggiungere i 4,4 GHz per un breve periodo, un po' meno dei 4,7 GHz dichiarati da Intel. Allo stesso modo, il core E raggiunge un massimo di 3,49 GHz, un po' meno di 3,50 GHz. In media, il clock boost complessivo raggiunge i 3,8 GHz. Dopo un po' si stabilizza a circa 2,53 GHz.
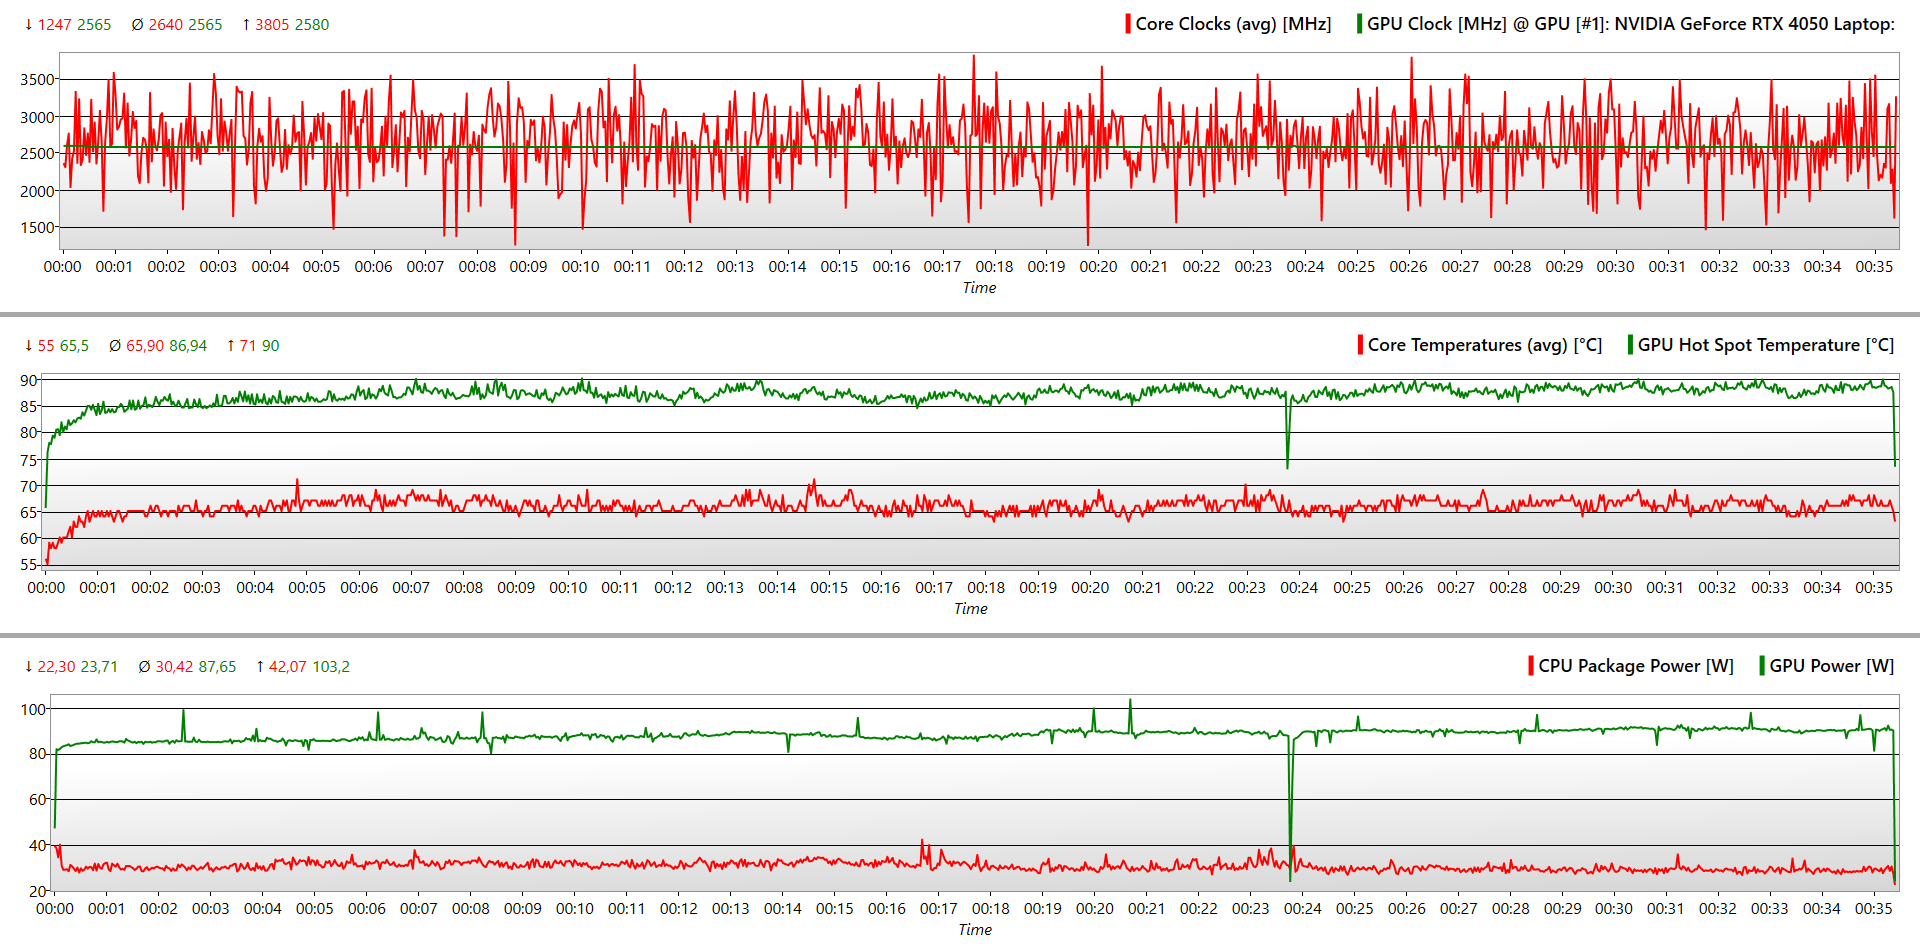
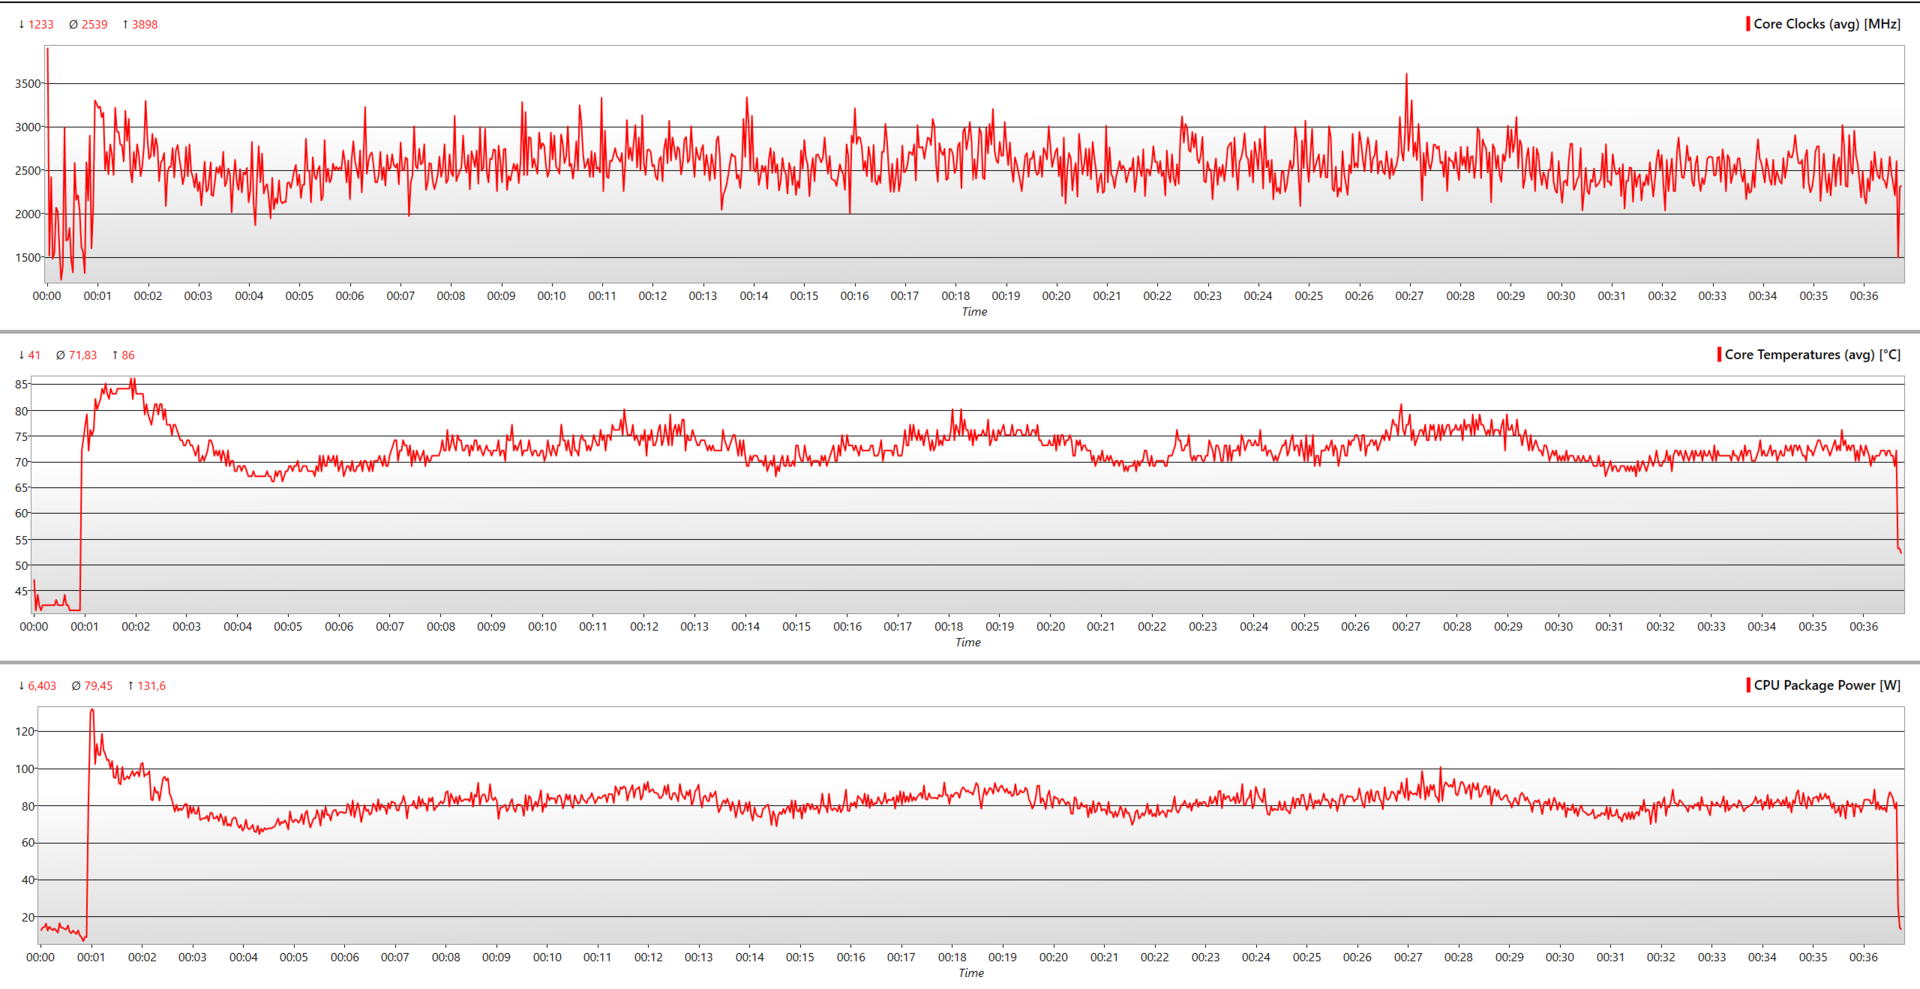
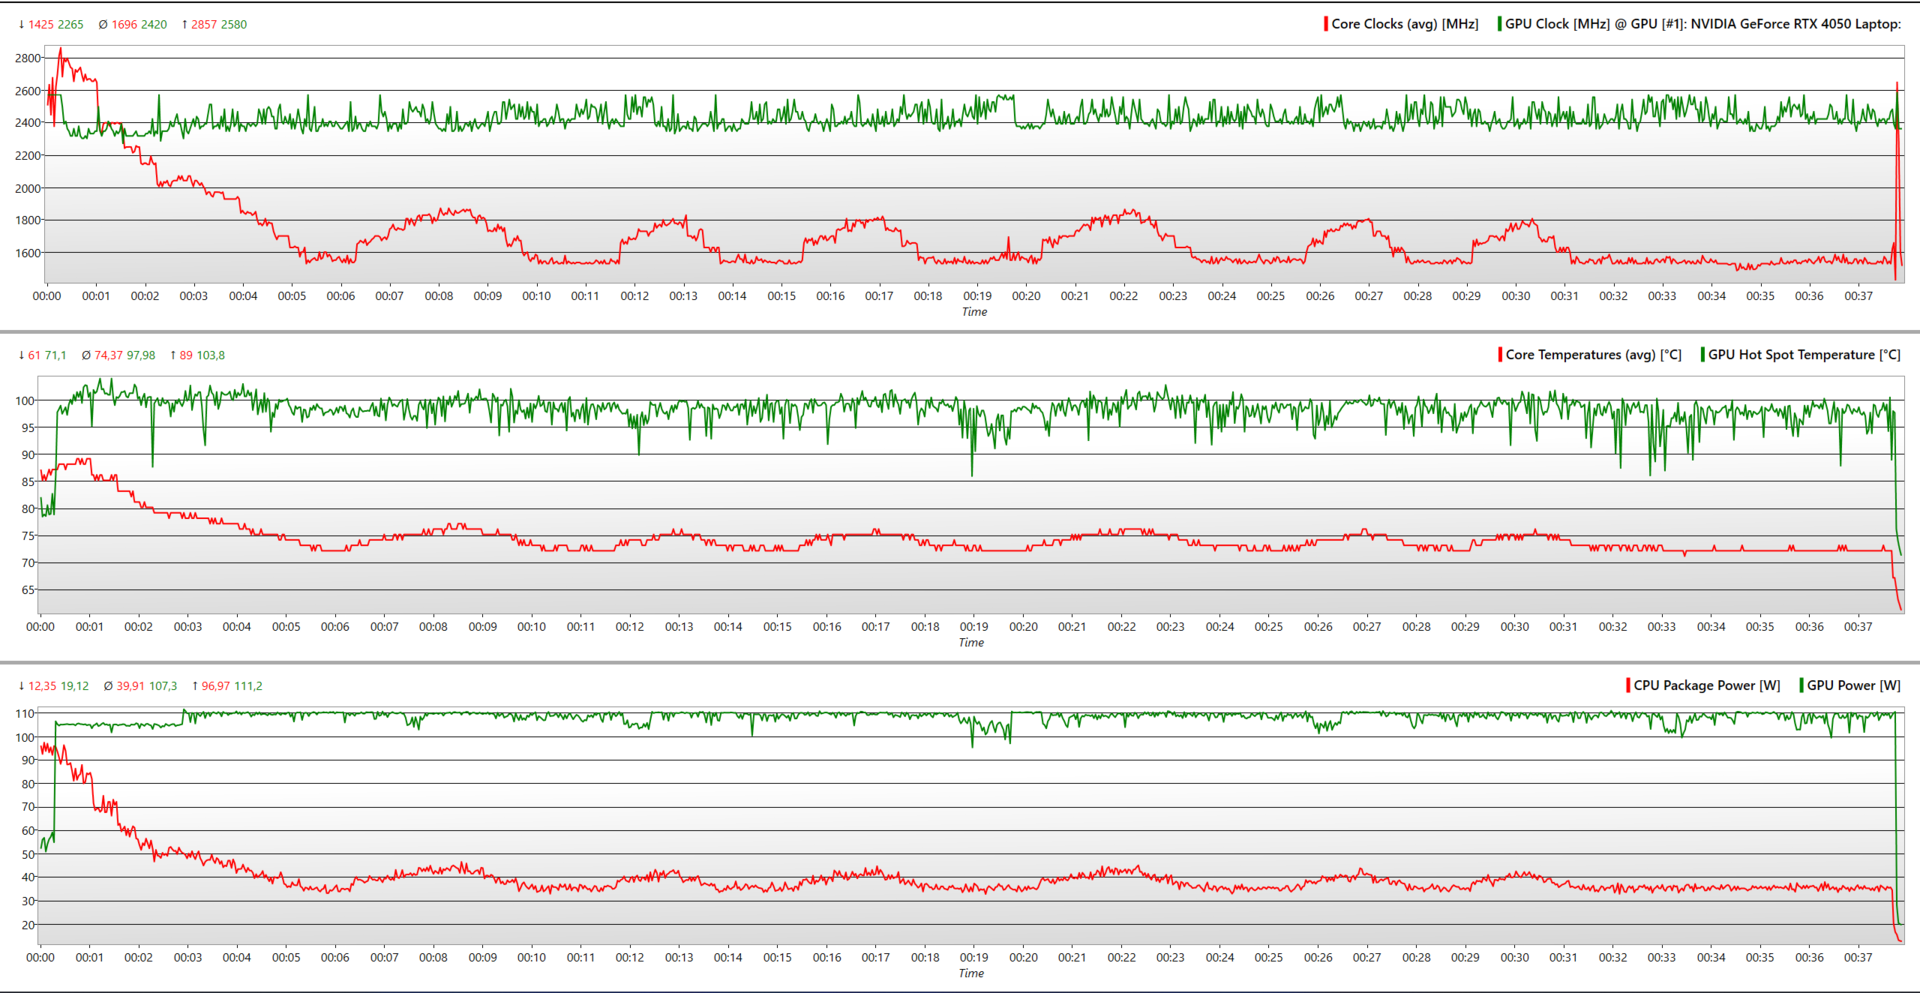
| Stress | Clock della CPU (GHz) | Clock della GPU (MHz) | Temperatura media della CPU (°C) | Temperatura media della GPU (°C) |
| Sistema inattivo | 1,755 | 700 | 41 | 45 |
| Prime95 | 2,539 | 500 | 82,5 | 63,1 |
| Prime95 + FurMark | 1,696 | 2.420 | 77,2 | 82,5 |
| Il Witcher 3 1080p Ultra | 3,047 | 2.565 | 80 | 74 |
Altoparlanti
Con un volume massimo di 70,7 dB(A), sono appena più rumorosi della ventola in condizioni di stress. Gli altoparlanti veri e propri sono minuscoli e non hanno nulla da invidiare agli altri.
Detto questo, HP si è impegnata a fondo e ha incluso la sintonizzazione B&O (Bang and Olufsen). Questo si traduce in medi e alti rispettabili, ma non si può dire lo stesso dei bassi. Va bene per il consumo video, ma la qualità audio potrebbe essere compromessa se le ventole decidono di aumentare.
In alternativa, è possibile collegare cuffie/altoparlanti tramite il jack audio da 3,5 mm o utilizzare il Bluetooth 5.3 in modalità completamente wireless.
HP Victus 16-r0076TX analisi audio
(-) | altoparlanti non molto potenti (70.7 dB)
Bassi 100 - 315 Hz
(±) | bassi ridotti - in media 9.7% inferiori alla media
(±) | la linearità dei bassi è media (7.6% delta rispetto alla precedente frequenza)
Medi 400 - 2000 Hz
(+) | medi bilanciati - solo only 3.2% rispetto alla media
(+) | medi lineari (2.5% delta rispetto alla precedente frequenza)
Alti 2 - 16 kHz
(+) | Alti bilanciati - appena 4% dalla media
(+) | alti lineari (5.7% delta rispetto alla precedente frequenza)
Nel complesso 100 - 16.000 Hz
(±) | la linearità complessiva del suono è media (15.4% di differenza rispetto alla media
Rispetto alla stessa classe
» 34% di tutti i dispositivi testati in questa classe è stato migliore, 7% simile, 59% peggiore
» Il migliore ha avuto un delta di 6%, medio di 18%, peggiore di 132%
Rispetto a tutti i dispositivi testati
» 23% di tutti i dispositivi testati in questa classe è stato migliore, 4% similare, 73% peggiore
» Il migliore ha avuto un delta di 4%, medio di 23%, peggiore di 134%
Apple MacBook Pro 16 2021 M1 Pro analisi audio
(+) | gli altoparlanti sono relativamente potenti (84.7 dB)
Bassi 100 - 315 Hz
(+) | bassi buoni - solo 3.8% dalla media
(+) | bassi in lineaa (5.2% delta rispetto alla precedente frequenza)
Medi 400 - 2000 Hz
(+) | medi bilanciati - solo only 1.3% rispetto alla media
(+) | medi lineari (2.1% delta rispetto alla precedente frequenza)
Alti 2 - 16 kHz
(+) | Alti bilanciati - appena 1.9% dalla media
(+) | alti lineari (2.7% delta rispetto alla precedente frequenza)
Nel complesso 100 - 16.000 Hz
(+) | suono nel complesso lineare (4.6% differenza dalla media)
Rispetto alla stessa classe
» 0% di tutti i dispositivi testati in questa classe è stato migliore, 0% simile, 100% peggiore
» Il migliore ha avuto un delta di 5%, medio di 17%, peggiore di 45%
Rispetto a tutti i dispositivi testati
» 0% di tutti i dispositivi testati in questa classe è stato migliore, 0% similare, 100% peggiore
» Il migliore ha avuto un delta di 4%, medio di 23%, peggiore di 134%
Gestione dell'energia: La durata della batteria avrebbe potuto essere migliore
Consumo di energia
Il processore Raptor Lake-HX e la GPU Ada Lovelace dell'HP Victus 16 sfruttano in breve tempo i 230 watt di potenza in dotazione, consumando fino a 237 watt. Tuttavia, la situazione è molto migliore in idle, con un consumo massimo di 22,1 Watt.
Questo valore non cambia molto con i processori a marchio HX di AMD presenti nella concorrenza. È interessante notare che il Dell G5 15's Core i7-13700HX è leggermente più efficiente in idle, con un consumo medio di 14,98 Watt.
| Off / Standby | |
| Idle | |
| Sotto carico |
|
Leggenda:
min: | |
| HP Victus 16-r0076TX i5-13500HX, GeForce RTX 4050 Laptop GPU, SK hynix PC801 HFS512GEJ9X101N BF, IPS, 1920x1080, 16.1" | Acer Nitro 16 AN16-41-R7YE R5 7535HS, GeForce RTX 4050 Laptop GPU, SK hynix HFS512GEJ9X125N, IPS, 1920x1200, 16" | Acer Predator Helios 16 PH16-71-731Q i7-13700HX, GeForce RTX 4060 Laptop GPU, Micron 3400 1TB MTFDKBA1T0TFH, IPS-LED, 2560x1600, 16" | Dell G15 5530 i7-13650HX, GeForce RTX 4060 Laptop GPU, SSTC CL4-3D512-Q11, IPS, 1920x1080, 15.6" | Lenovo Legion Pro 5 16ARX8 (R5 7645HX, RTX 4050) R5 7645HX, GeForce RTX 4050 Laptop GPU, SK hynix PC801 HFS512GEJ9X115N, IPS, 2560x1600, 16" | Lenovo LOQ 15APH8 R7 7840HS, GeForce RTX 4050 Laptop GPU, Micron 2450 512GB MTFDKCD512TFK, IPS, 1920x1080, 15.6" | Media NVIDIA GeForce RTX 4050 Laptop GPU | Media della classe Gaming | |
|---|---|---|---|---|---|---|---|---|
| Power Consumption | 7% | -5% | 13% | 12% | 15% | 21% | -1% | |
| Idle Minimum * (Watt) | 16.12 | 19 -18% | 15.9 1% | 8.4 48% | 13 19% | 15 7% | 9.95 ? 38% | 13 ? 19% |
| Idle Average * (Watt) | 20.47 | 20 2% | 20.5 -0% | 14.98 27% | 17.4 15% | 17.7 14% | 15.8 ? 23% | 18.7 ? 9% |
| Idle Maximum * (Watt) | 22.11 | 23 -4% | 20.9 5% | 15.56 30% | 21.8 1% | 21.5 3% | 20.1 ? 9% | 24.3 ? -10% |
| Load Average * (Watt) | 94.8 | 80 16% | 106 -12% | 96.8 -2% | 96.4 -2% | 73.5 22% | 88 ? 7% | 110.2 ? -16% |
| Witcher 3 ultra * (Watt) | 166.9 | 125.8 25% | 175 -5% | 186 -11% | 125 25% | 138.6 17% | ||
| Load Maximum * (Watt) | 237 | 184 22% | 276 -16% | 271.42 -15% | 204 14% | 176.5 26% | 176.3 ? 26% | 258 ? -9% |
* ... Meglio usare valori piccoli
Power Consumption: The Witcher 3 / Stress test
Power Consumption: External monitor
Durata della batteria
L'HP Victus 16 ha una rispettabile batteria da 83 Wh. Sarebbe stata ideale un'unità da 99 Wh, ma queste sono riservate alle SKU di fascia alta.
Nel nostro test di navigazione Wi-Fi con luminosità impostata a 150 nits, abbiamo ottenuto circa 8 ore e 51 minuti di autonomia. Aumentando la luminosità al massimo, la durata è scesa a 8 ore e 10 minuti.
È interessante notare che il portatile è andato peggio nel test Big Buck Bunny FHD H.264 con la luminosità impostata a 150 nits e tutte le radio (Wi-Fi, Bluetooth) disattivate. Ha resistito solo 7 ore e 39 minuti. In uno scenario ideale, questa cifra avrebbe dovuto essere più alta.
Infine, ha ceduto dopo appena 1 ora e 31 minuti nel nostro test The Witcher 3 con una luminosità di 150 nits e il gioco in esecuzione con impostazioni "Ultra". Questa cifra è scesa a 1 ora e 11 minuti con un carico combinato di Prime95 e FurMark.
| HP Victus 16-r0076TX i5-13500HX, GeForce RTX 4050 Laptop GPU, 83 Wh | Alienware m16 R1 Intel i7-13700HX, GeForce RTX 4060 Laptop GPU, 86 Wh | Acer Predator Helios 16 PH16-71-731Q i7-13700HX, GeForce RTX 4060 Laptop GPU, 90 Wh | Dell G15 5530 i7-13650HX, GeForce RTX 4060 Laptop GPU, 86 Wh | Lenovo Legion Pro 5 16ARX8 (R5 7645HX, RTX 4050) R5 7645HX, GeForce RTX 4050 Laptop GPU, 80 Wh | Lenovo LOQ 15APH8 R7 7840HS, GeForce RTX 4050 Laptop GPU, 60 Wh | Media della classe Gaming | |
|---|---|---|---|---|---|---|---|
| Autonomia della batteria | -30% | -13% | -30% | -38% | -13% | 4% | |
| H.264 (h) | 7.7 | 5.6 -27% | 4.8 -38% | 6.8 -12% | 5.4 -30% | 8.32 ? 8% | |
| WiFi v1.3 (h) | 8.9 | 4.8 -46% | 5.6 -37% | 6.5 -27% | 5.6 -37% | 7.4 -17% | 7.11 ? -20% |
| Witcher 3 ultra (h) | 1.5 | 1.5 0% | 0.8 -47% | 0.8 -47% | |||
| Load (h) | 1.2 | 1 -17% | 1.5 25% | 0.8 -33% | 1.1 -8% | 1.502 ? 25% | |
| Reader / Idle (h) | 6.4 | 9.8 | 8.16 ? |
Pro
Contro
Verdetto: Un discreto portatile da gioco a 1080p per chi ha un budget limitato
L'HP Victus 16 è un discreto portatile da gioco, ma non privo di difetti. Nonostante gli sforzi dell'azienda per tenere sotto controllo le temperature grazie alle due ventole e al labirinto di dissipatori, le emissioni termiche sono ancora elevate.
Fin da subito, il processore Raptor Lake-HX fa valere il suo peso, consentendo al portatile di superare concorrenti con specifiche migliori, come il Lenovo Legion Pro 5 16ARX8 con il processore Ryzen 5 7645HX e la stessa GPU.
C'è poi il problema del bloatware. A tutti noi piace un buon servizio VPN, ma diventa fastidioso quando i popup di ExpressVPN appaiono ogni pochi minuti. E no, il portatile non viene fornito con un piano ExpressVPN.
L'HP Victus 16 è una macchina da gioco a 1080p ideale per gli appassionati di e-sport con un budget limitato, grazie al suo potente processore e allo schermo a 165 Hz, se si riesce a sopportare il rumore e le temperature.
Attualmente ci sono pochissimi portatili sul mercato con processori Raptor Lake-HX entry-level. Questo aspetto da solo conferisce all'HP Victus 16 un vantaggio significativo rispetto all'Acer Nitro 16 AN16-41 Acer Nitro 16 AN16-41 e Lenovo LOQ 15.
Prezzo e disponibilità
L'HP Victus 16 può essere acquistato sul sito HP India al prezzo di ₹129.990. Una variante più economica con le stesse specifiche (Core i5-13500HX, GeForce RTX 4050, 16 GB di RAM) e uno schermo di fascia bassa a 144 Hz può essere acquistata per ₹124.990. In alternativa, la sua versione last-gen può essere acquistata su Amazon India a ₹68.400. Su Amazon US, una versione con specifiche migliori, con schermo QHD (2.560 x 1.440), un processore AMD Ryzen 7 7840HSe una RTX 4060 di GeForce può essere acquistata per 1.279 dollari.
HP Victus 16-r0076TX
- 09/25/2023 v7 (old)
Anil Ganti
Transparency
La selezione dei dispositivi da recensire viene effettuata dalla nostra redazione. Il campione di prova è stato fornito all'autore come prestito dal produttore o dal rivenditore ai fini di questa recensione. L'istituto di credito non ha avuto alcuna influenza su questa recensione, né il produttore ne ha ricevuto una copia prima della pubblicazione. Non vi era alcun obbligo di pubblicare questa recensione. In quanto società mediatica indipendente, Notebookcheck non è soggetta all'autorità di produttori, rivenditori o editori.
Ecco come Notebookcheck esegue i test
Ogni anno, Notebookcheck esamina in modo indipendente centinaia di laptop e smartphone utilizzando procedure standardizzate per garantire che tutti i risultati siano comparabili. Da circa 20 anni sviluppiamo continuamente i nostri metodi di prova e nel frattempo stabiliamo gli standard di settore. Nei nostri laboratori di prova, tecnici ed editori esperti utilizzano apparecchiature di misurazione di alta qualità. Questi test comportano un processo di validazione in più fasi. Il nostro complesso sistema di valutazione si basa su centinaia di misurazioni e parametri di riferimento ben fondati, che mantengono l'obiettività.Price comparison

