Recensione del Dell G15 5530: Una valida alternativa ad Alienware ora con Raptor Lake-HX

La serie G di Dell mira a portare la prodezza di Alienware a coloro che preferiscono non pagare cifre esorbitanti per un portatile da gioco capace. In occasione del MWC 2023, Dell ha presentato le serie serie G15 e G16 rinnovate con opzioni di GPU Intel Raptor Lake-HX e Nvidia GeForce RTX 40.
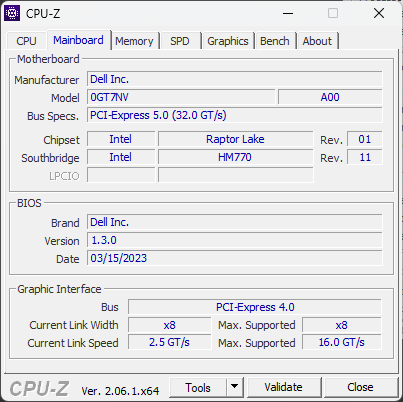
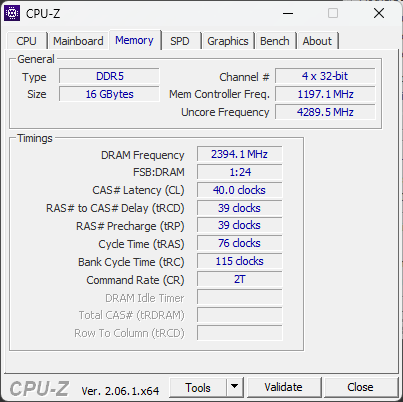
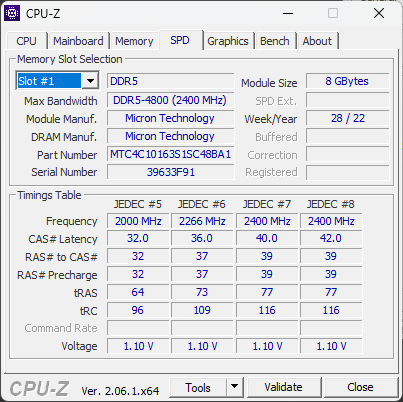
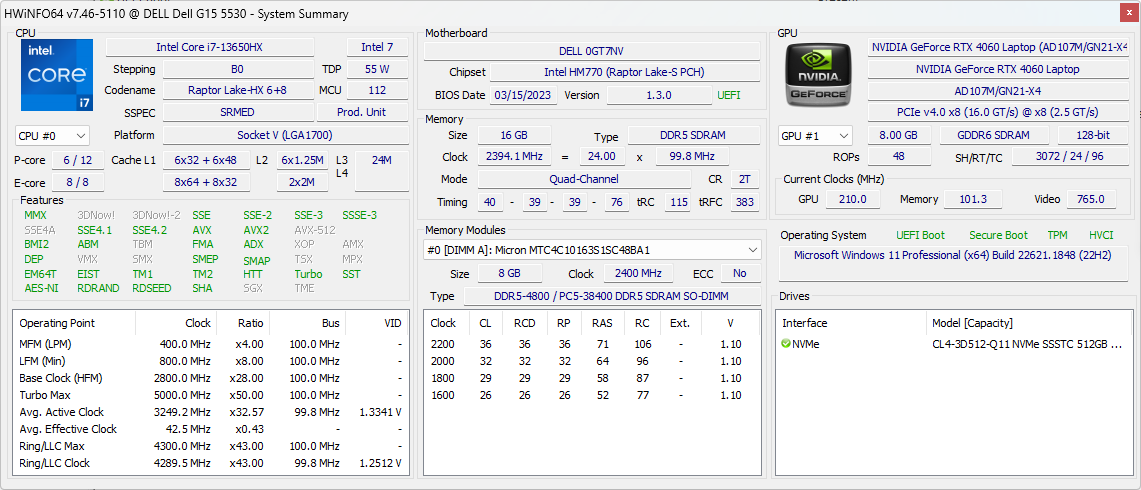
Ora abbiamo a disposizione il Dell G15 5530 con una configurazione di fascia alta caratterizzata dal processore Intel Core i7-13650HX, GPU Nvidia GeForce RTX 4060 Laptop16 GB di RAM DDR5-4800, 512 GB di SSD NVMe e un display G-Sync FHD da 15,6 pollici a 165 Hz.
In questa recensione, facciamo un giro con il Dell G15 5530 e vediamo come se la cava rispetto alla concorrenza per il prezzo richiesto di ₹1.58.990 (€1.449 o US$1659,99).
Potenziali concorrenti a confronto
Punteggio | Data | Modello | Peso | Altezza | Dimensione | Risoluzione | Prezzo |
|---|---|---|---|---|---|---|---|
| 84.2 % v7 (old) | 06/2023 | Dell G15 5530 i7-13650HX, GeForce RTX 4060 Laptop GPU | 3 kg | 26.95 mm | 15.60" | 1920x1080 | |
| 87.4 % v7 (old) | 03/2023 | Asus ROG Strix G18 G814JI i7-13650HX, GeForce RTX 4070 Laptop GPU | 3 kg | 31 mm | 18.00" | 2560x1600 | |
| 87.9 % v7 (old) | 05/2023 | Lenovo Legion Pro 5 16IRX8 i7-13700HX, GeForce RTX 4060 Laptop GPU | 2.5 kg | 26.8 mm | 16.00" | 2560x1600 | |
| 89.7 % v7 (old) | 06/2023 | Asus ROG Flow X16 GV601V i9-13900H, GeForce RTX 4060 Laptop GPU | 2.1 kg | 19.4 mm | 16.00" | 2560x1600 | |
| 82.1 % v7 (old) | 02/2023 | MSI Katana 17 B13VFK i7-13620H, GeForce RTX 4060 Laptop GPU | 2.8 kg | 25.2 mm | 17.30" | 1920x1080 | |
| 86.9 % v7 (old) | 06/2023 | Asus TUF Gaming A16 FA617XS R9 7940HS, Radeon RX 7600S | 2.2 kg | 22.1 mm | 16.00" | 1920x1200 | |
| 88.4 % v7 (old) | 04/2023 | Asus ROG Strix G17 G713PI R9 7945HX, GeForce RTX 4070 Laptop GPU | 2.8 kg | 30.7 mm | 17.30" | 2560x1440 | |
| 89 % v7 (old) | 04/2023 | Medion Erazer Major X20 i9-13900HX, GeForce RTX 4070 Laptop GPU | 2.4 kg | 29 mm | 16.00" | 2560x1600 |
Telaio: Peso massimo in plastica, completato da un ingombrante mattone di alimentazione
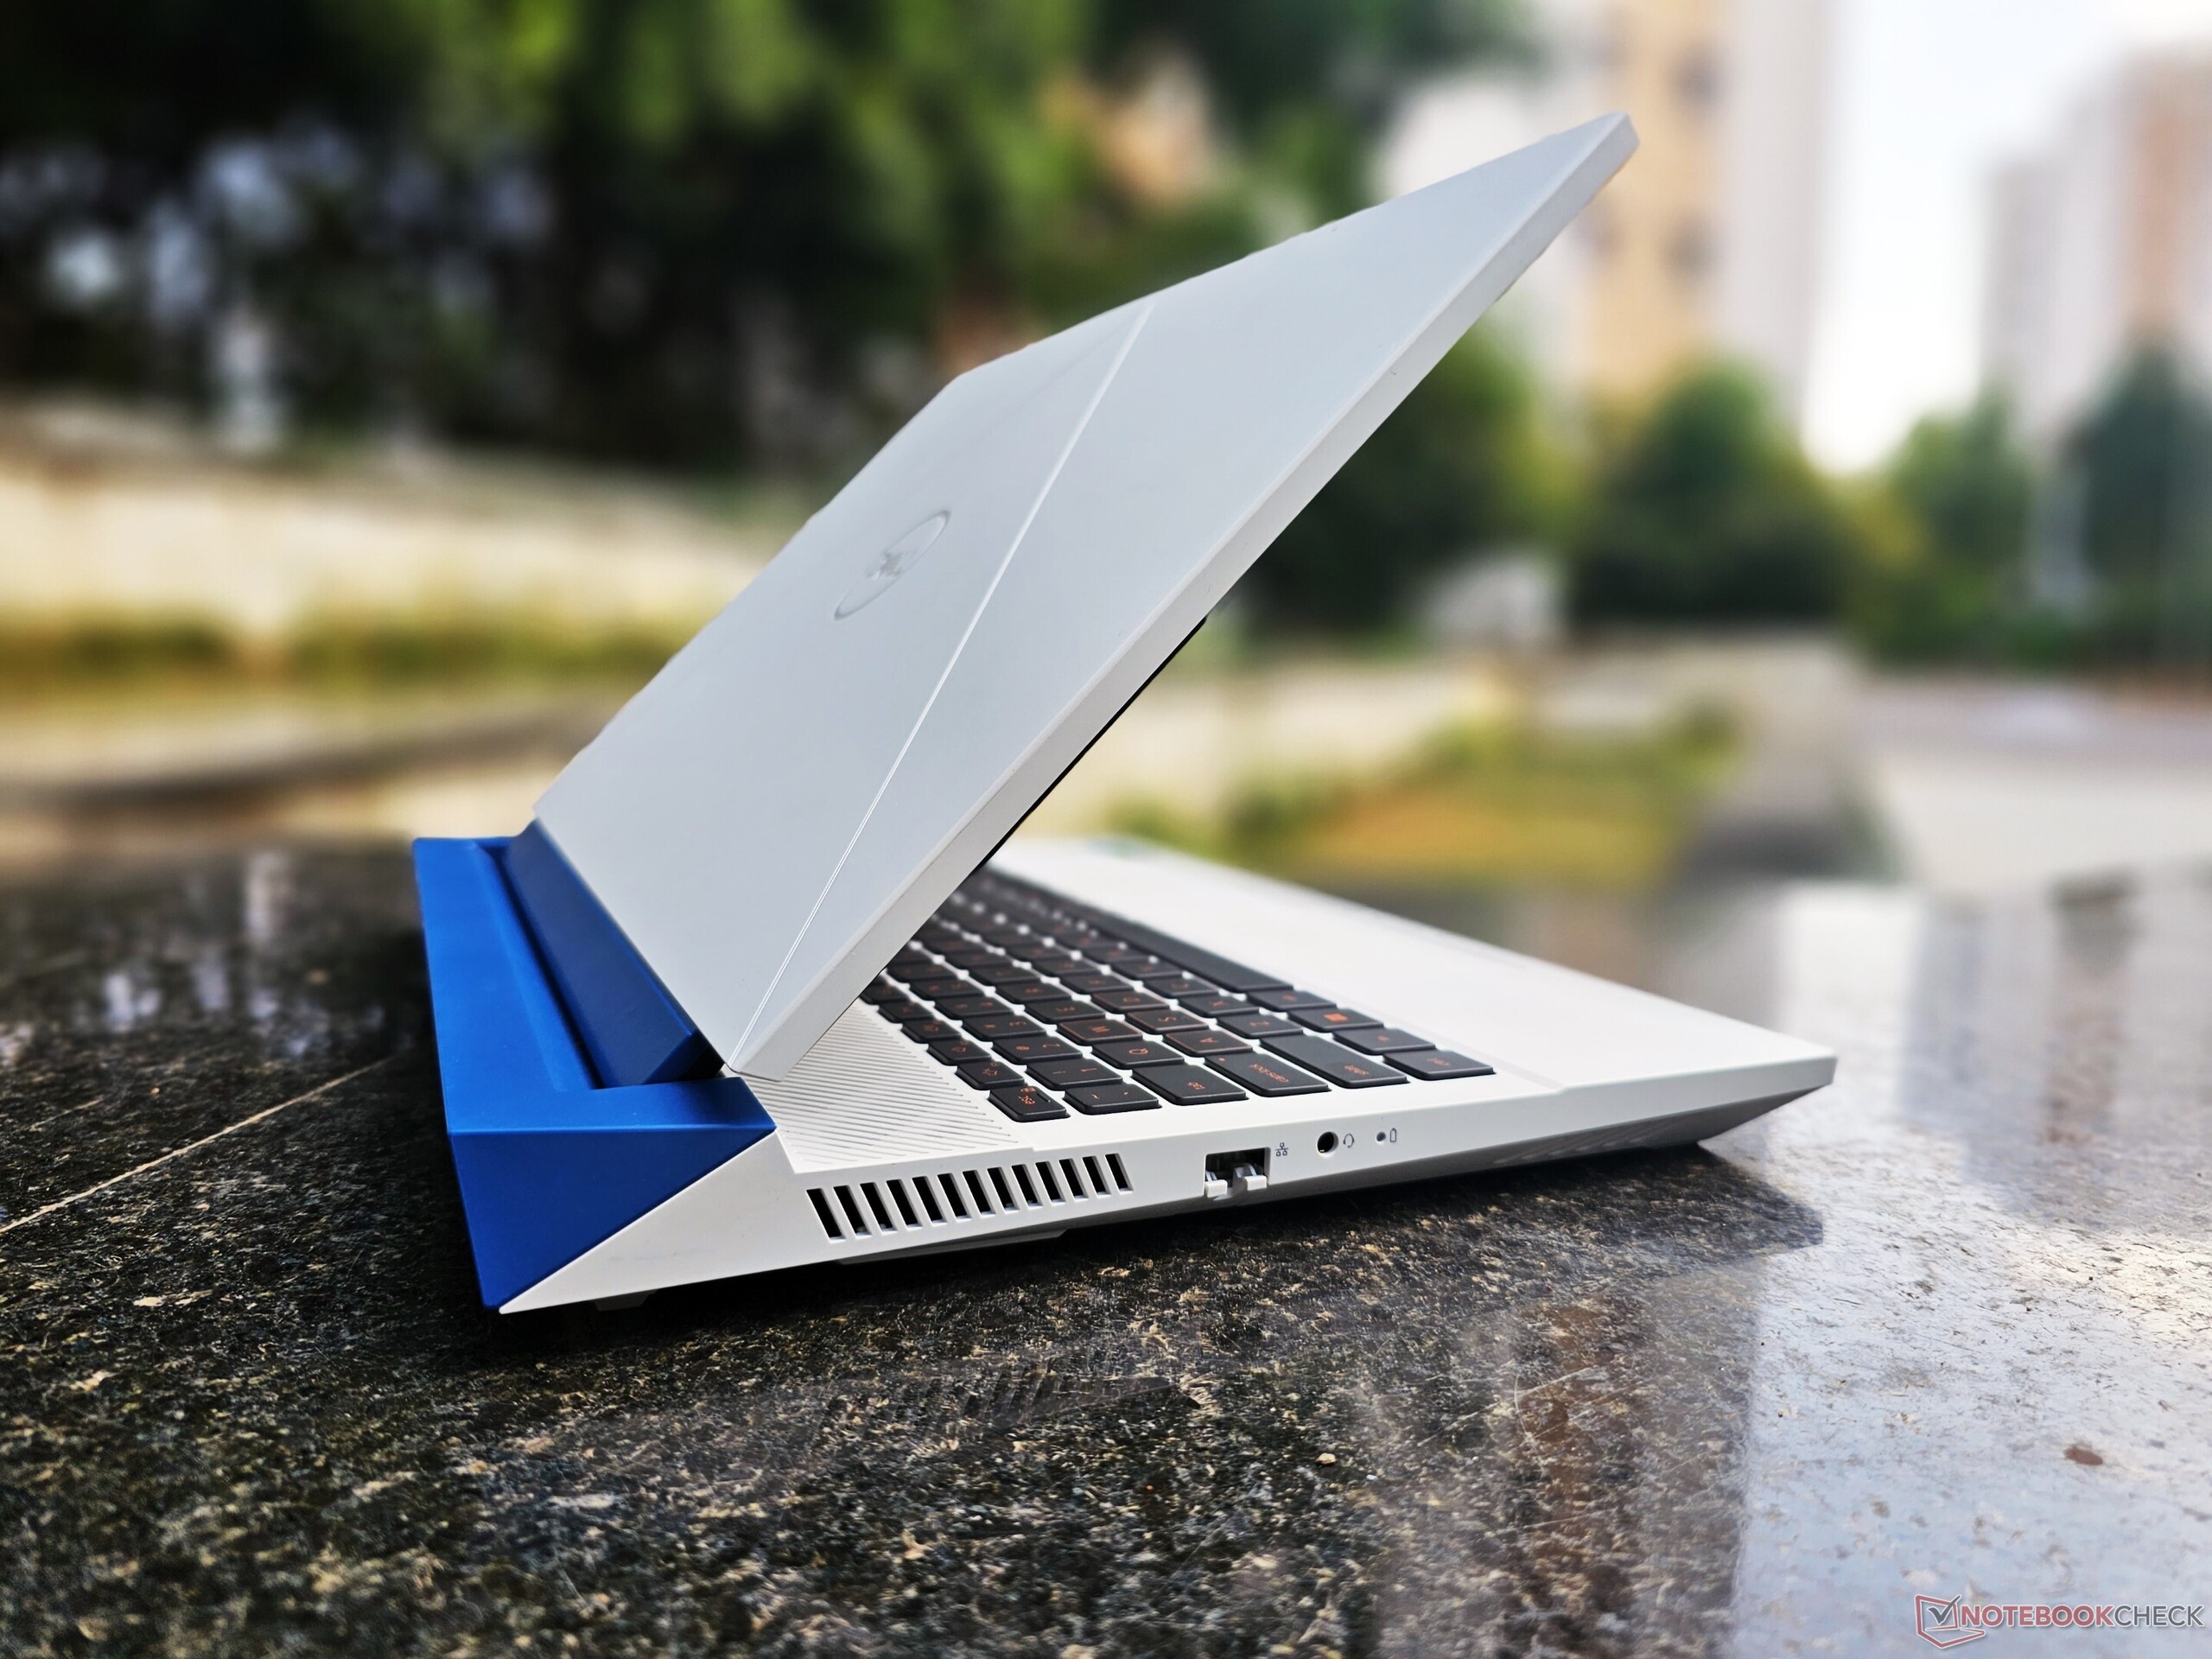
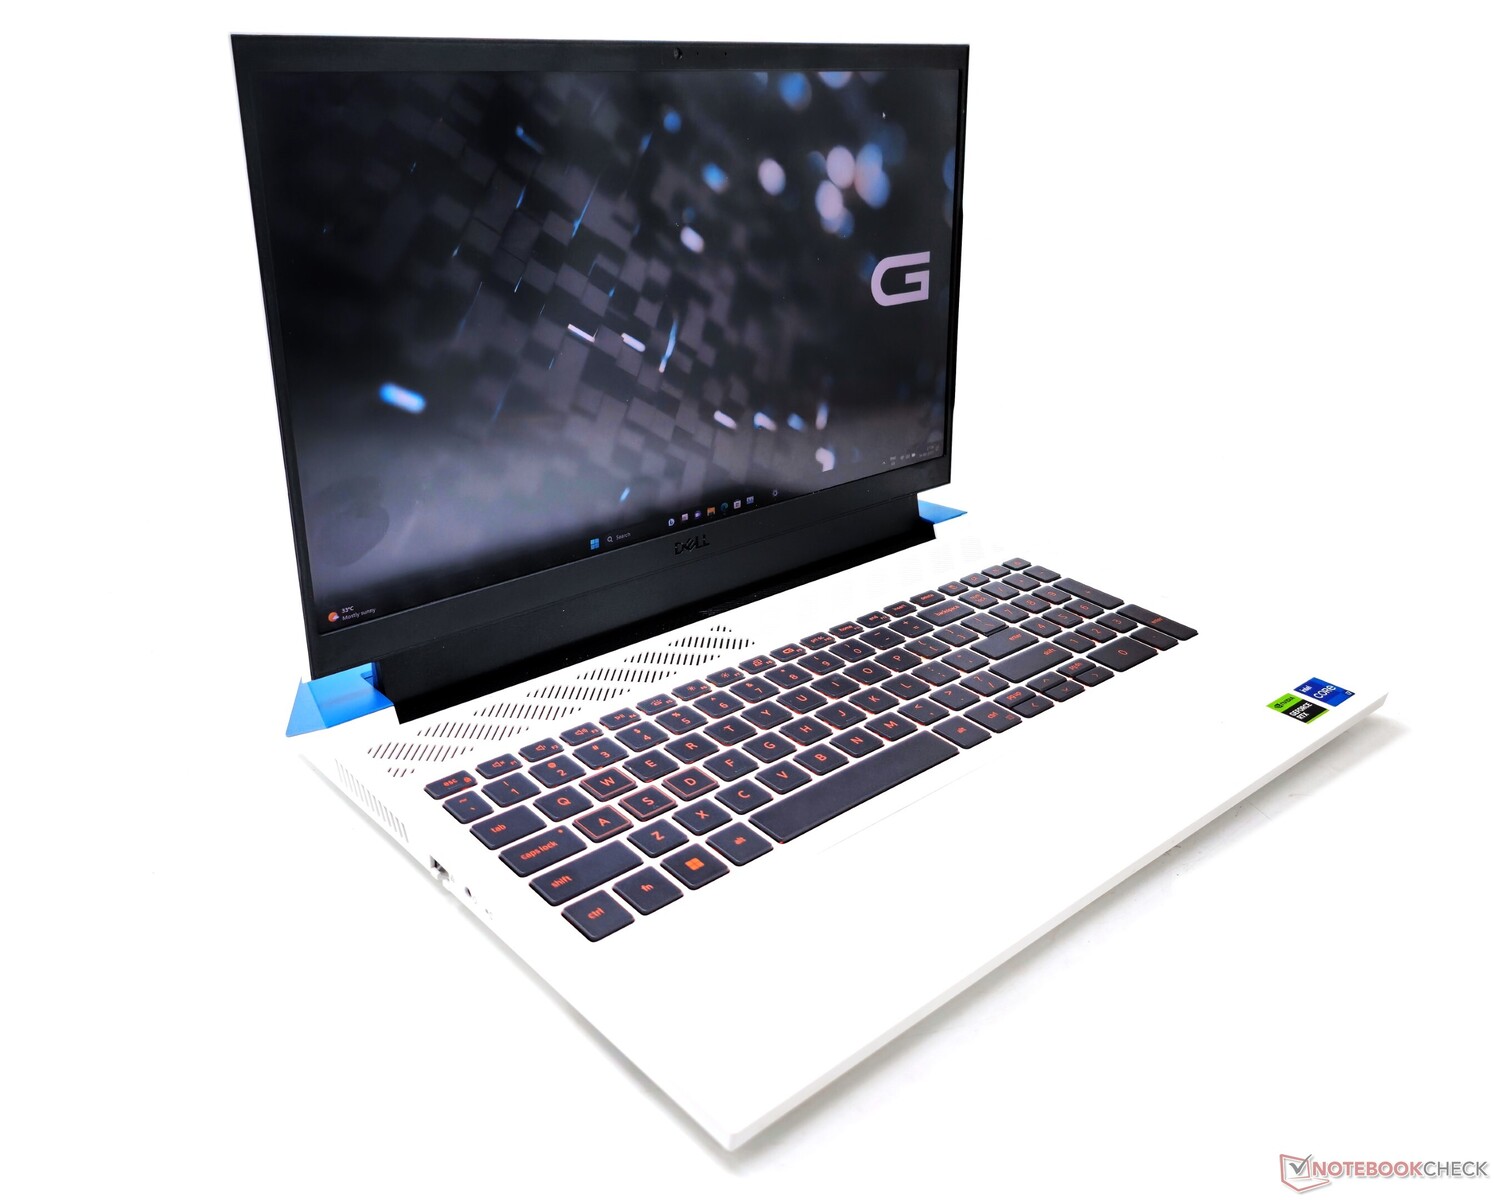
Questa volta Dell sembra aver ridotto l'intensità dell'RGB, a differenza di quanto abbiamo visto in precedenza con i modelliG15 5520e G15 5521 Special Edition. Lo chassis del 5530 è più o meno identico a quello del G15 5510.
La nostra unità G15 5530 è la variante Quantum White con un ripiano termico Deep Space Blue. Inoltre, Dell offre due alternative di colore per questo modello: Dark Shadow Gray con ripiano termico nero e Pop Purple con ripiano termico Neo Mint.
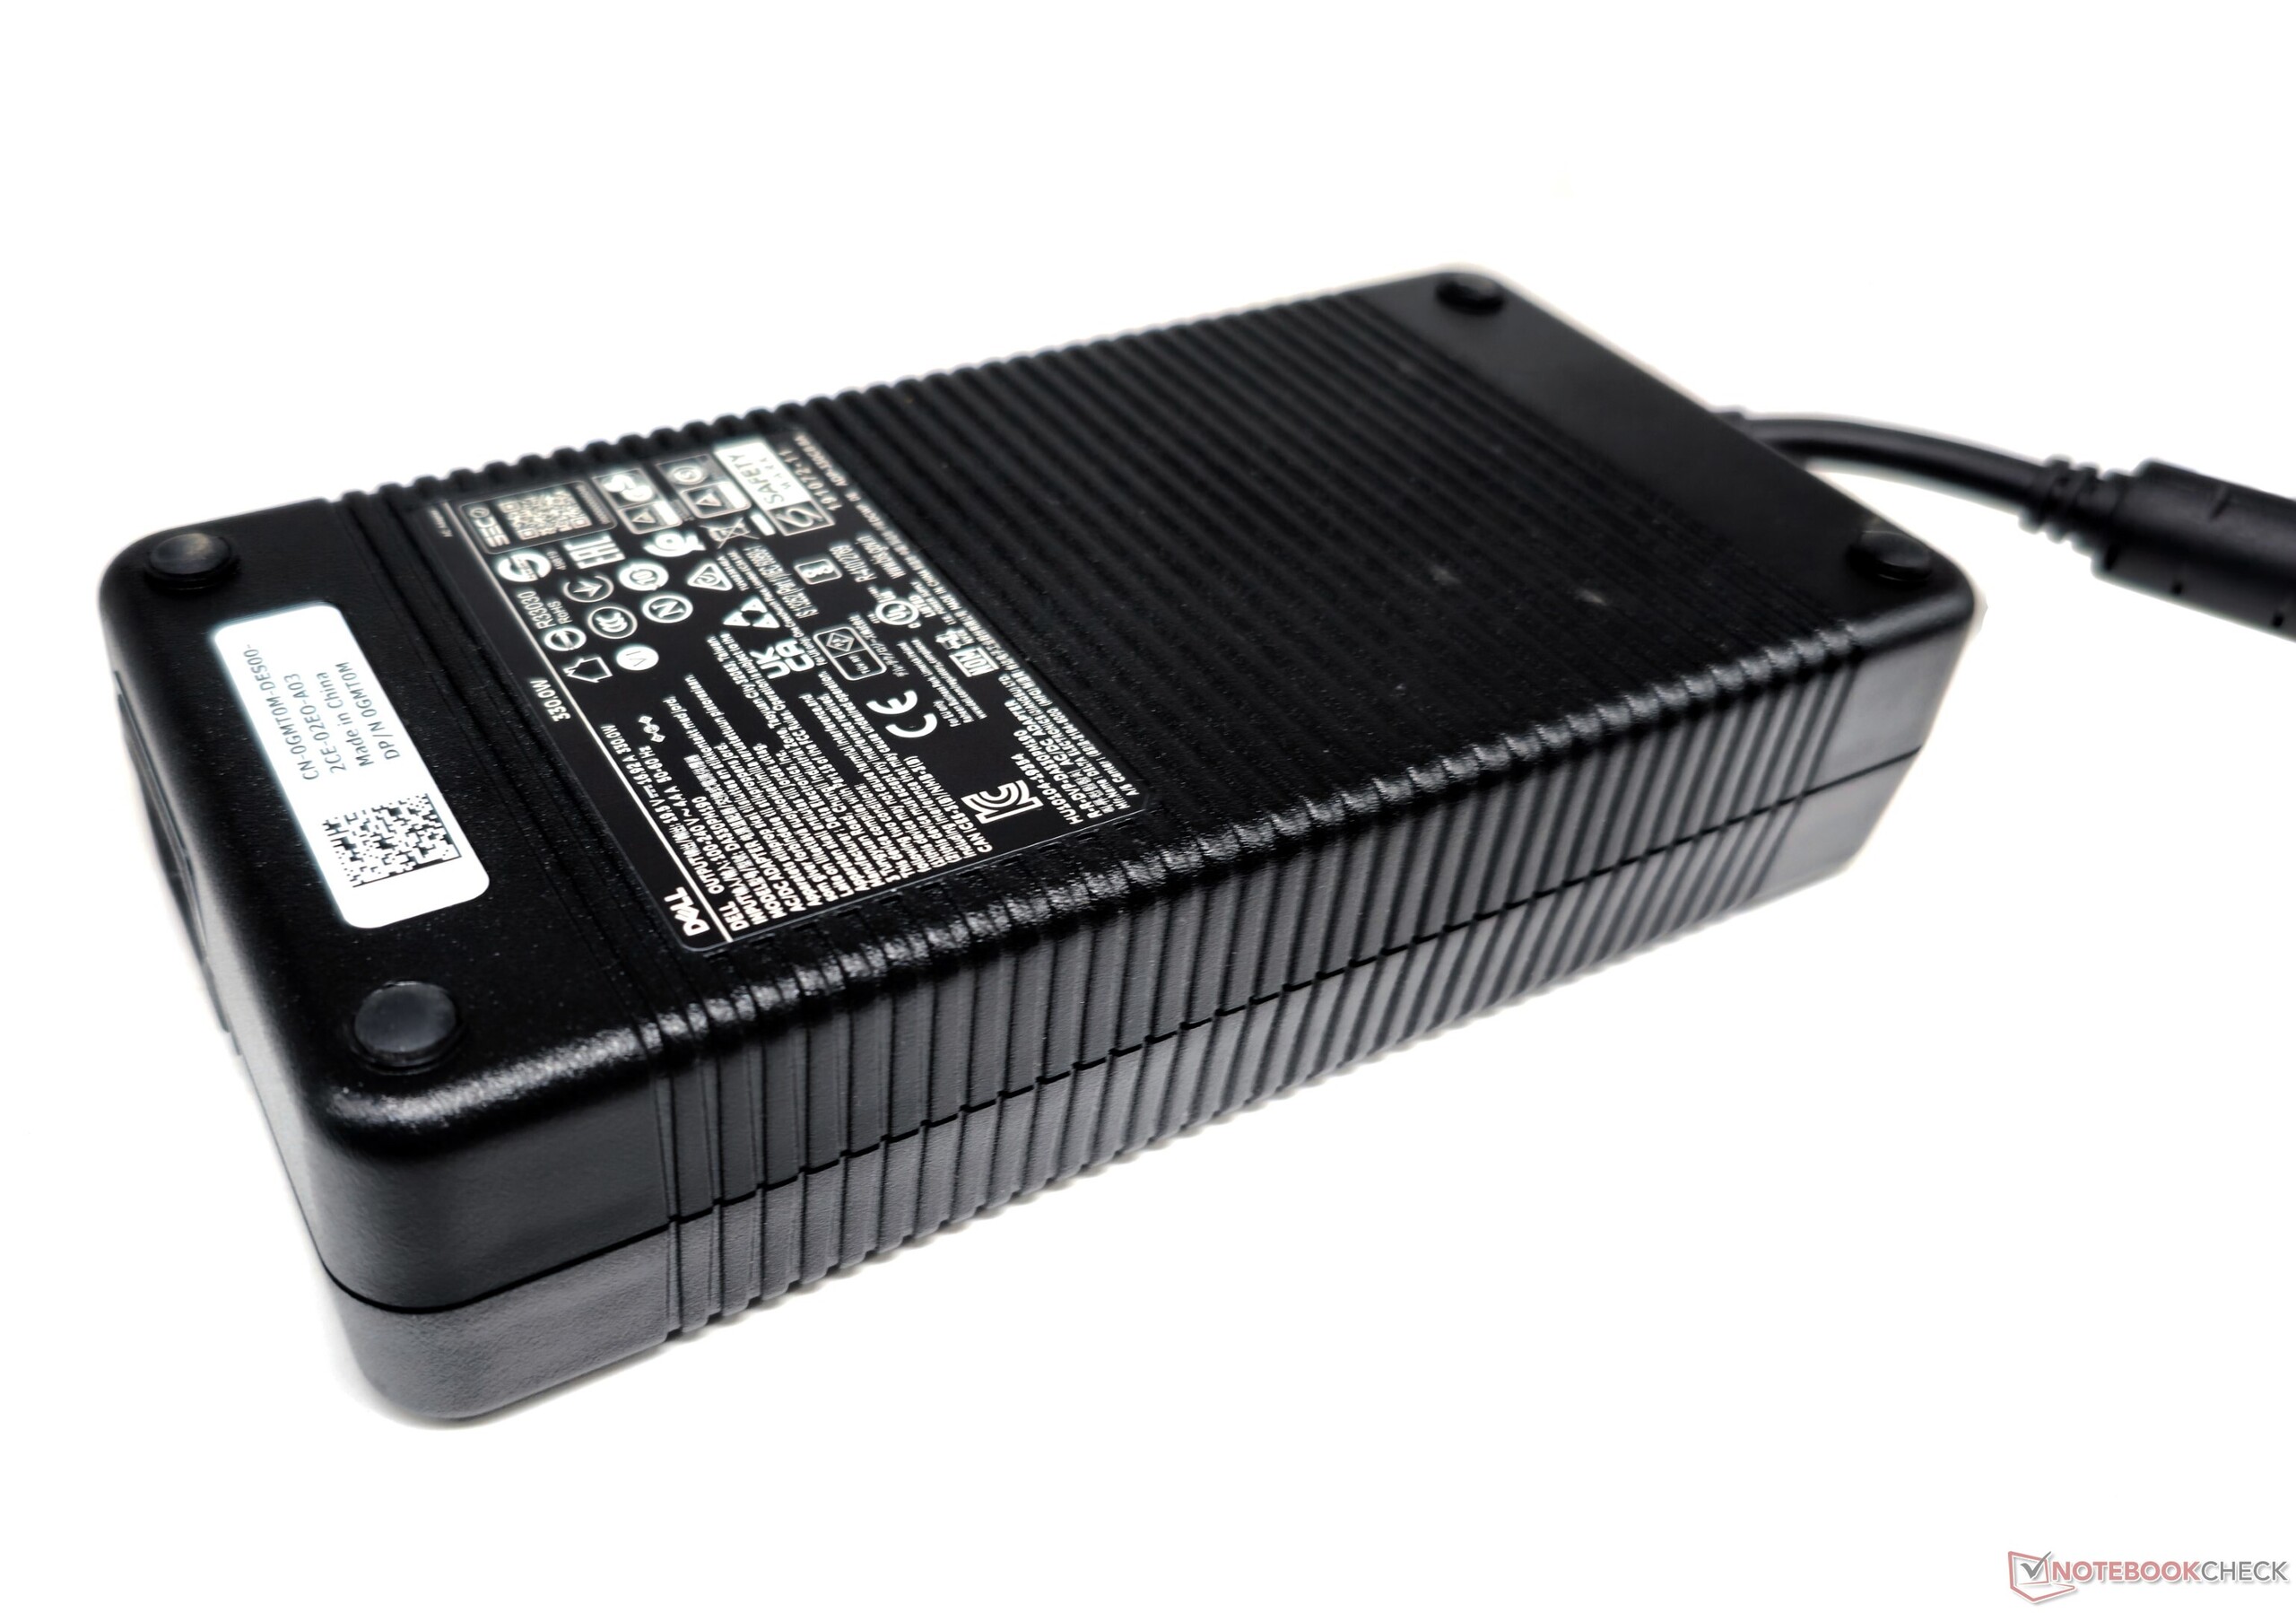
Il portatile G15 5530 è dotato di uno chassis in plastica che pesa quasi 3 kg, il che rappresenta il suo principale svantaggio. A questo peso si aggiunge anche un alimentatore da 330 W del peso di 1,34 kg, per cui i giocatori possono aspettarsi un bel po' di fatica quando si portano dietro questo portatile.
Le cerniere della nostra unità sono risultate un po' rigide, ma il coperchio può essere aperto con un solo dito con un certo sforzo. Sebbene il coperchio si fletta facilmente con una forza minima, rimane stabile senza oscillare durante l'uso normale.
Il design complessivo dello chassis non presenta sorprese, ma gli angoli vivi e il peso elevato potrebbero non piacere a tutti.

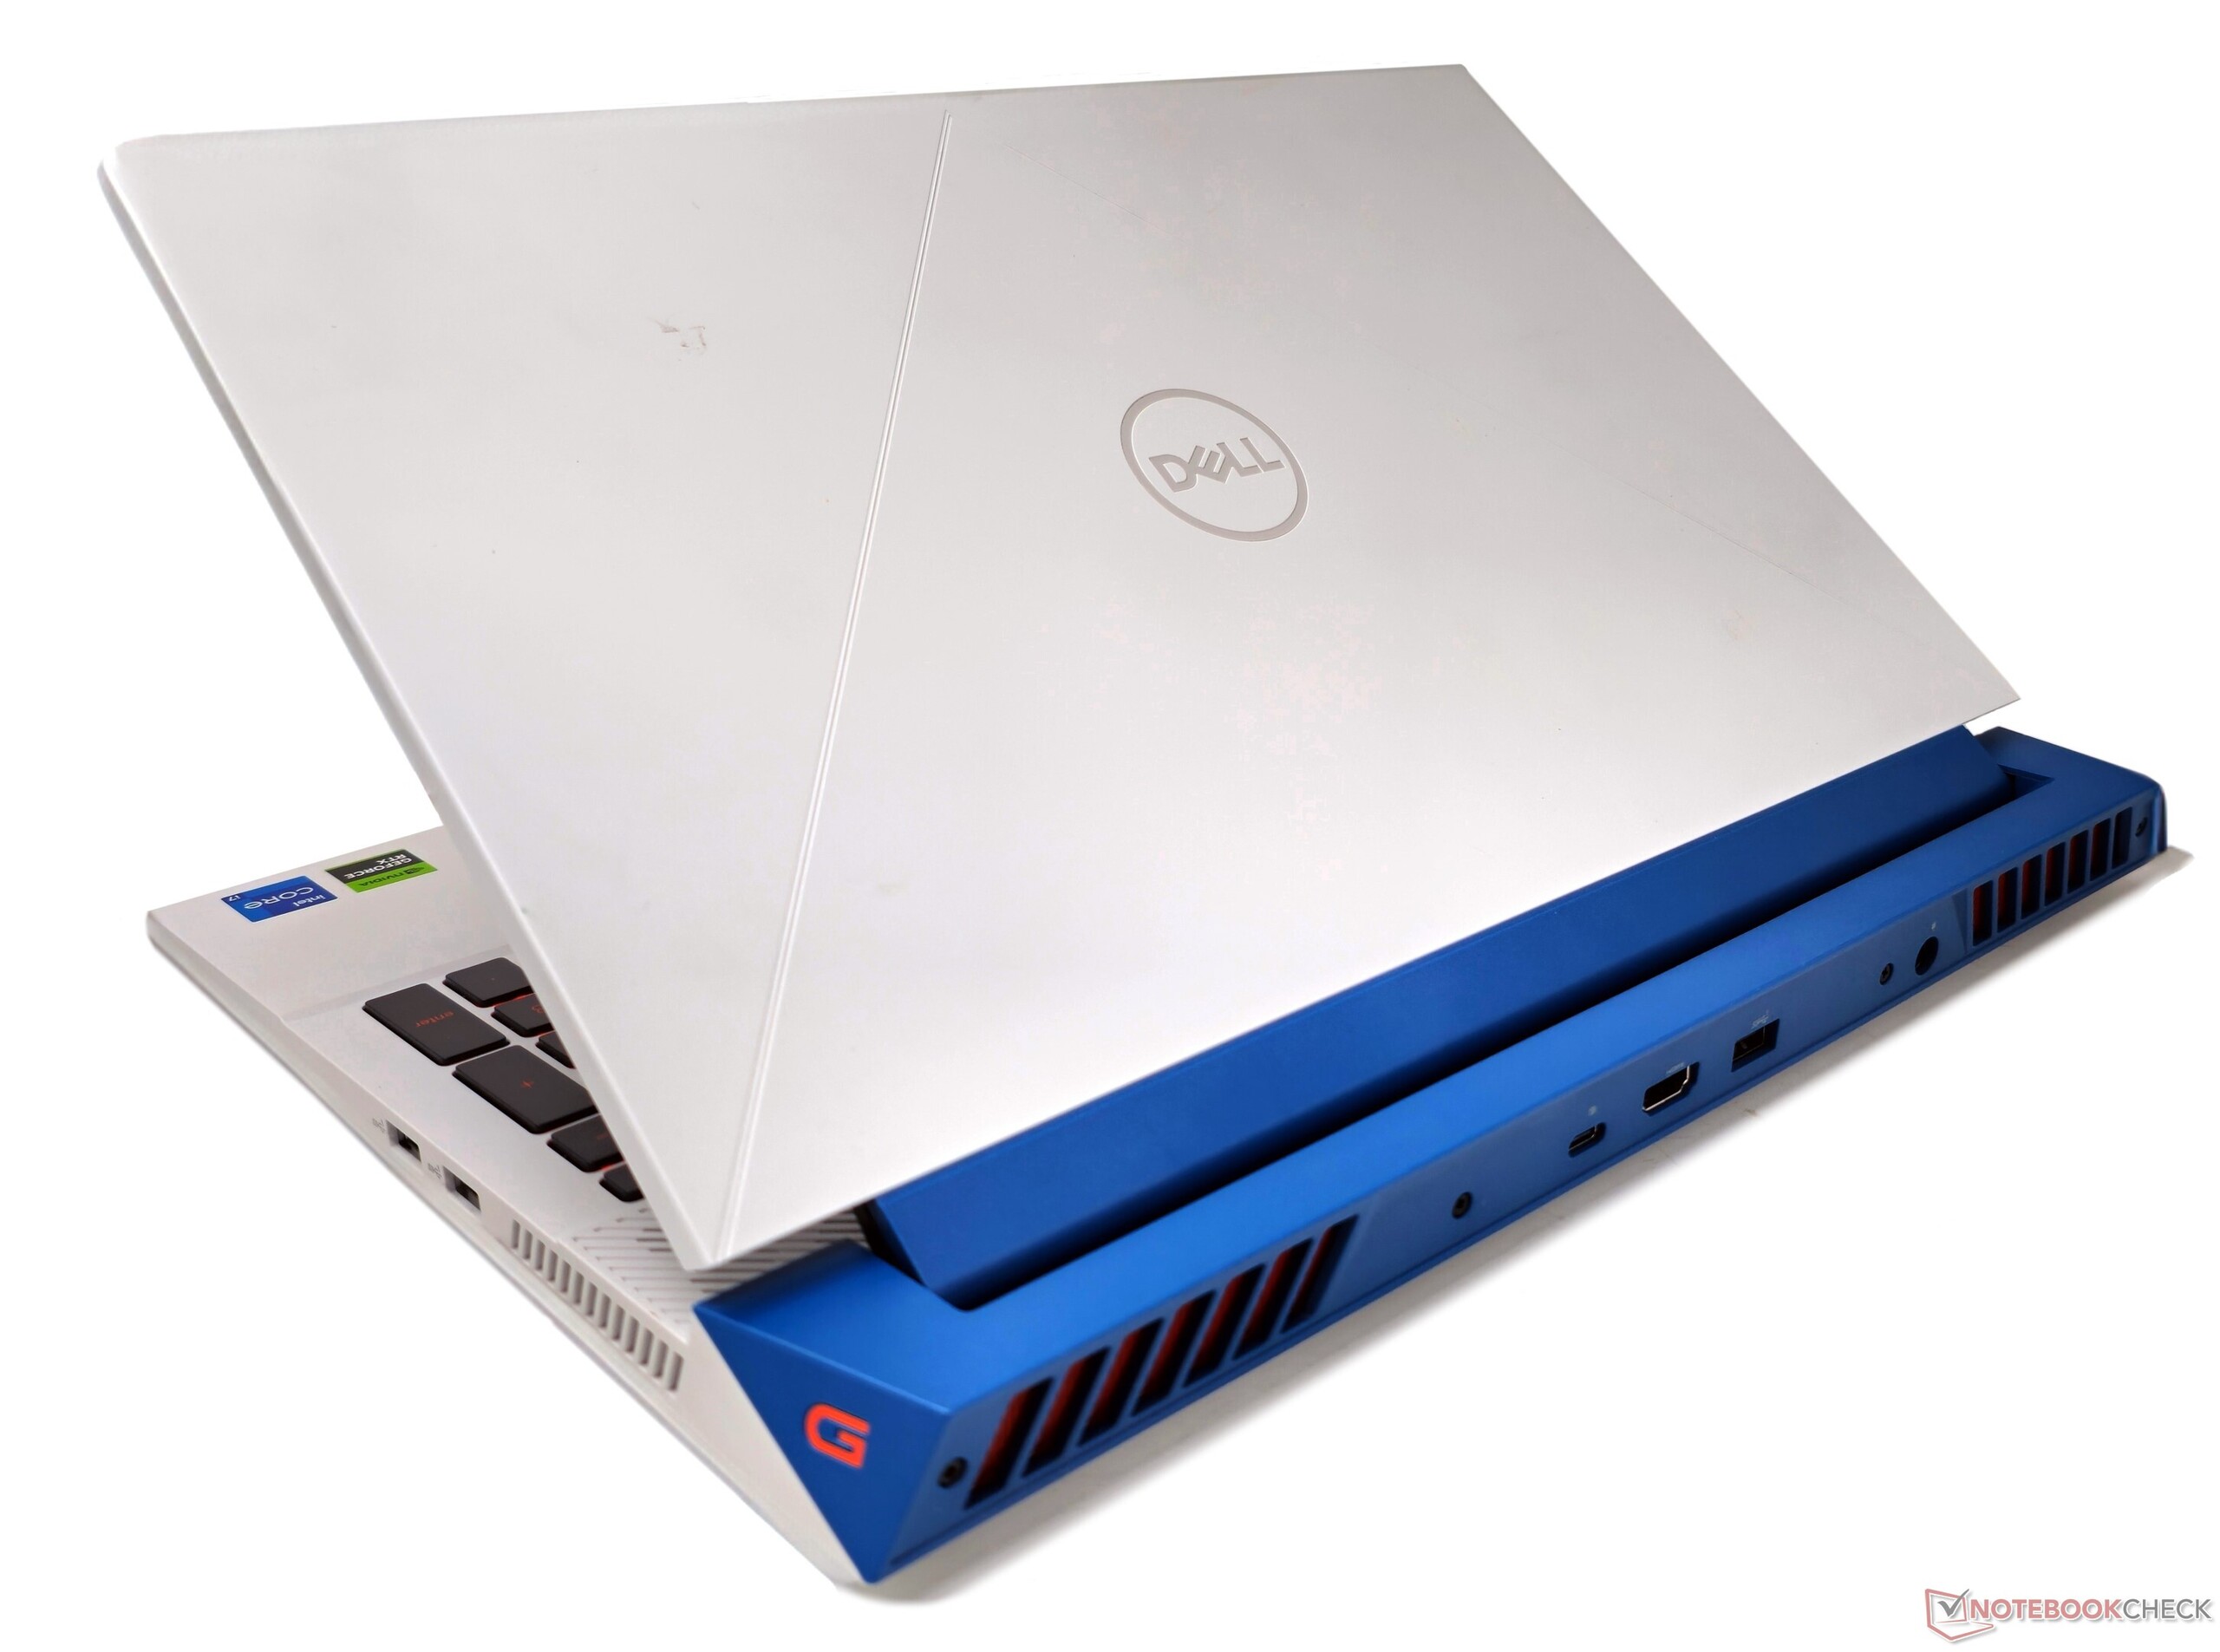
Connettività: Distribuzione delle porte non ideale per i giocatori
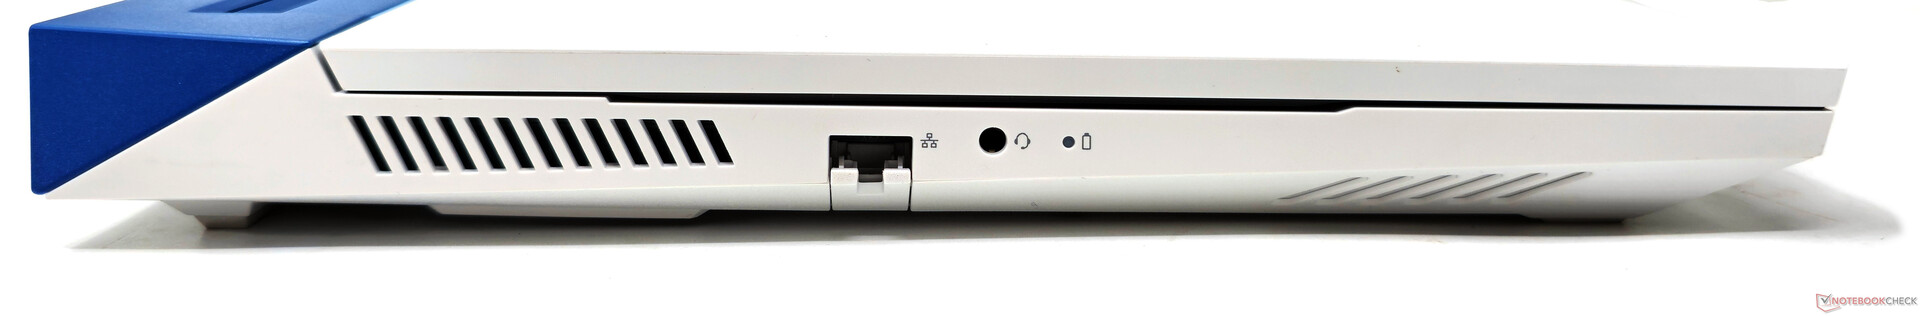
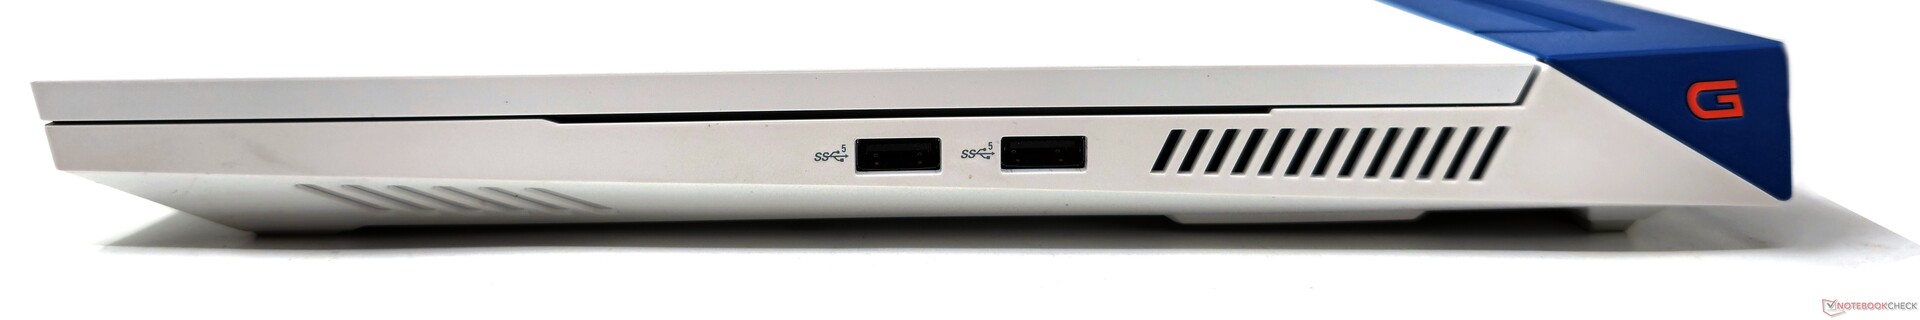
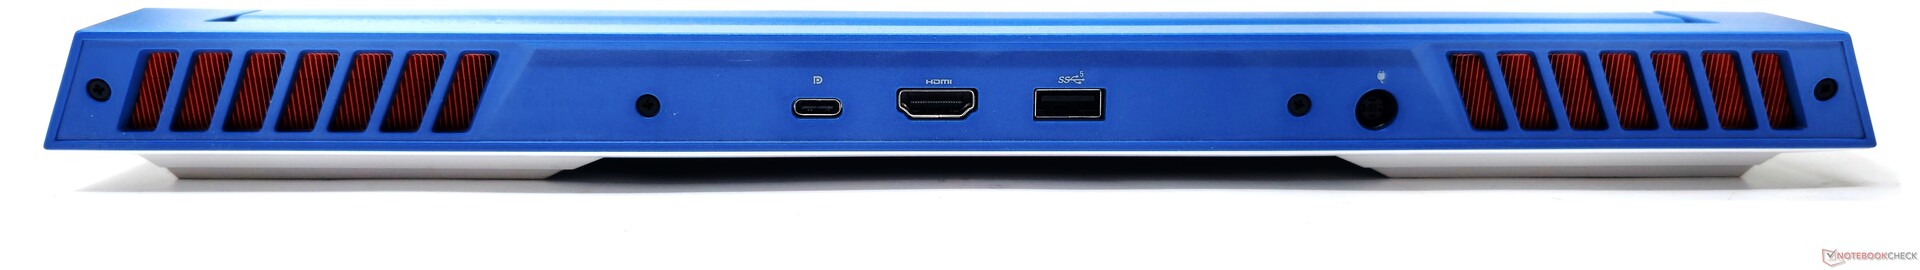
Il posizionamento delle porte sul G15 5530 non è ideale. A sinistra sono presenti solo la porta LAN e il jack per le cuffie, mentre sul lato destro sono presenti due porte USB 3.2 Gen1 Type-A. Le altre porte si trovano sul retro.
L'assenza di porte USB sul lato sinistro può essere fastidiosa per la connettività delle periferiche, soprattutto per i giocatori che utilizzano un mouse con cavo.
Inoltre, l'unica porta USB Type-C offre la funzionalità DisplayPort-out, ma manca di Power Delivery. Di conseguenza, il portatile non può essere ricaricato senza utilizzare l'ingombrante power brick.
Comunicazione
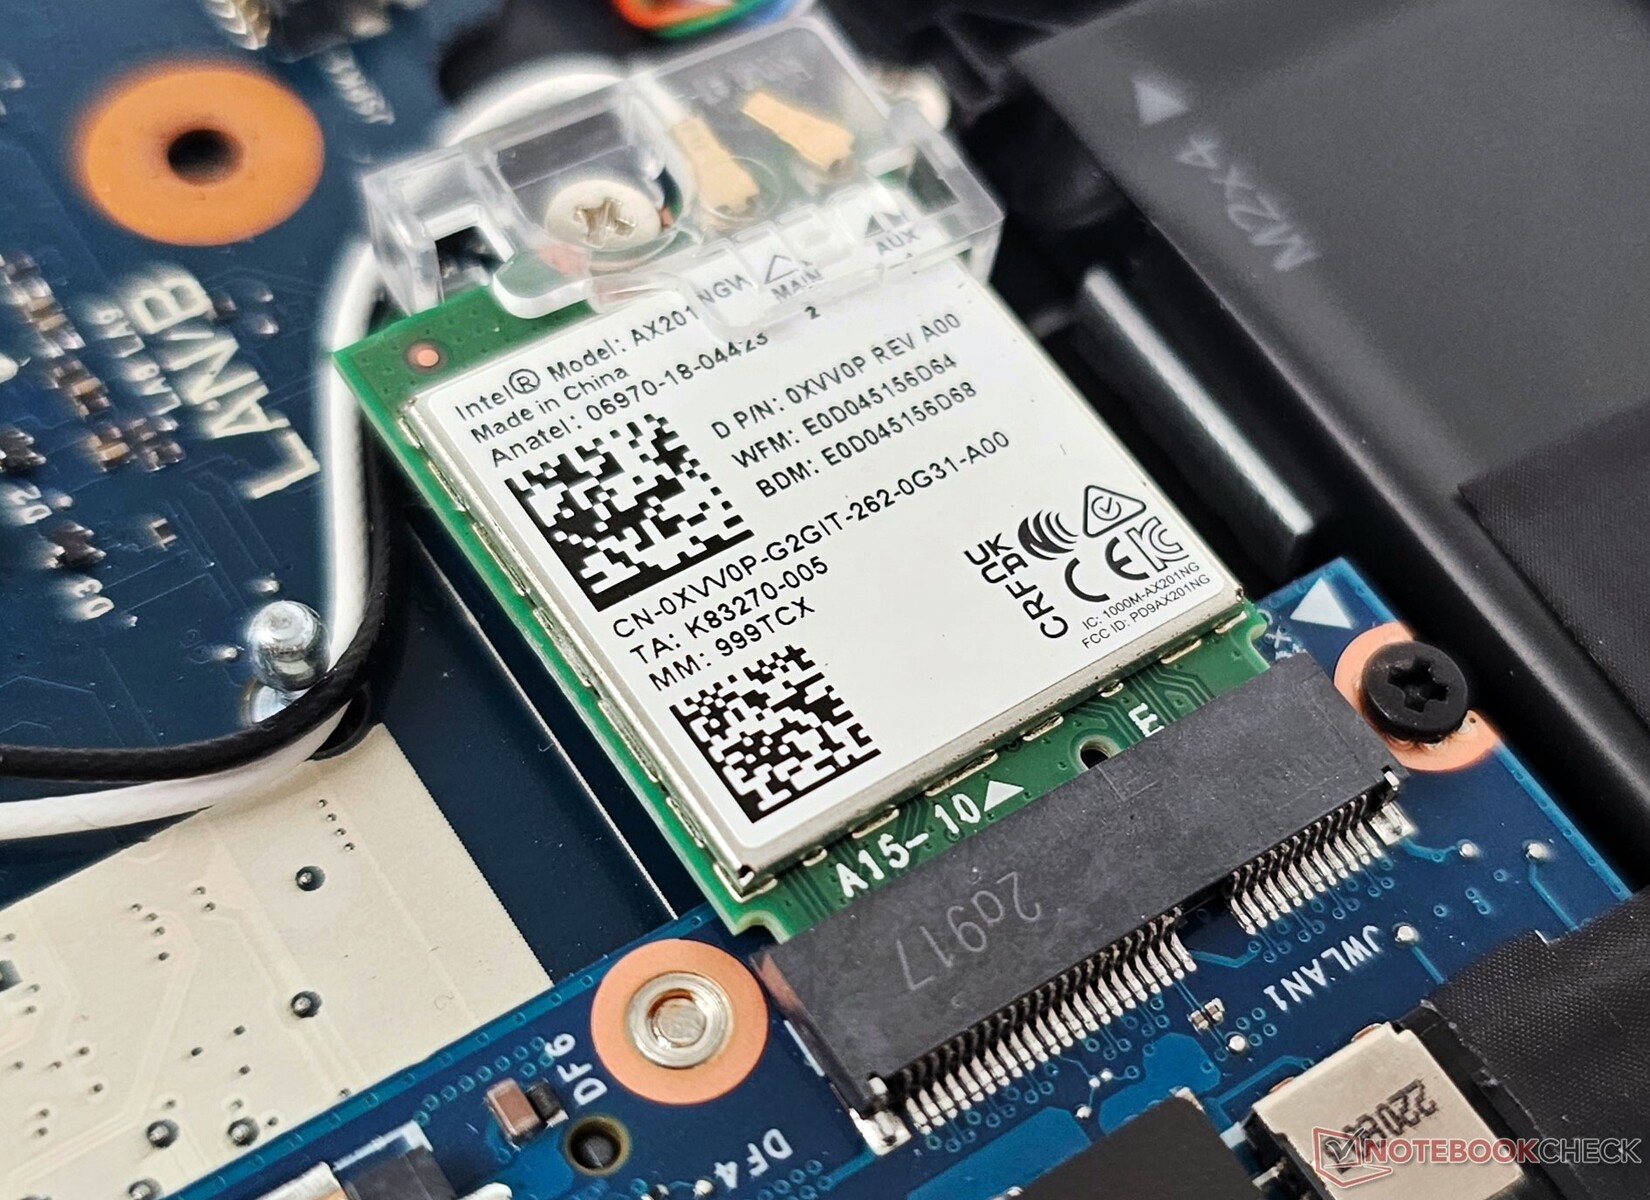
Sebbene la scheda WLAN Intel AX201 del G15 5530 non supporti il Wi-Fi 6E, abbiamo riscontrato che la sua implementazione nel G15 5530 offre comunque un throughput eccellente.
I nostri test, condotti con il router di riferimento Asus ROG Rapture GT-AXE11000, hanno mostrato prestazioni relativamente stabili quando il portatile era posizionato a 1 m di distanza dal router, con una linea visiva chiara e senza interferenze esterne.
Webcam
La qualità dell'immagine della webcam a 720p non è niente di eccezionale, con grandi deviazioni di colore (in particolare nelle tonalità del blu) e una mancanza di nitidezza e chiarezza generale.


Sicurezza
A parte il modulo TPM 2.0, il G15 5530 non offre ulteriori funzioni di sicurezza o login biometrici.
Accessori e garanzia
La confezione non contiene altri accessori se non l'alimentatore da 330 W e la solita documentazione.
In India, Dell fornisce di serie un anno di assistenza hardware e software onsite.
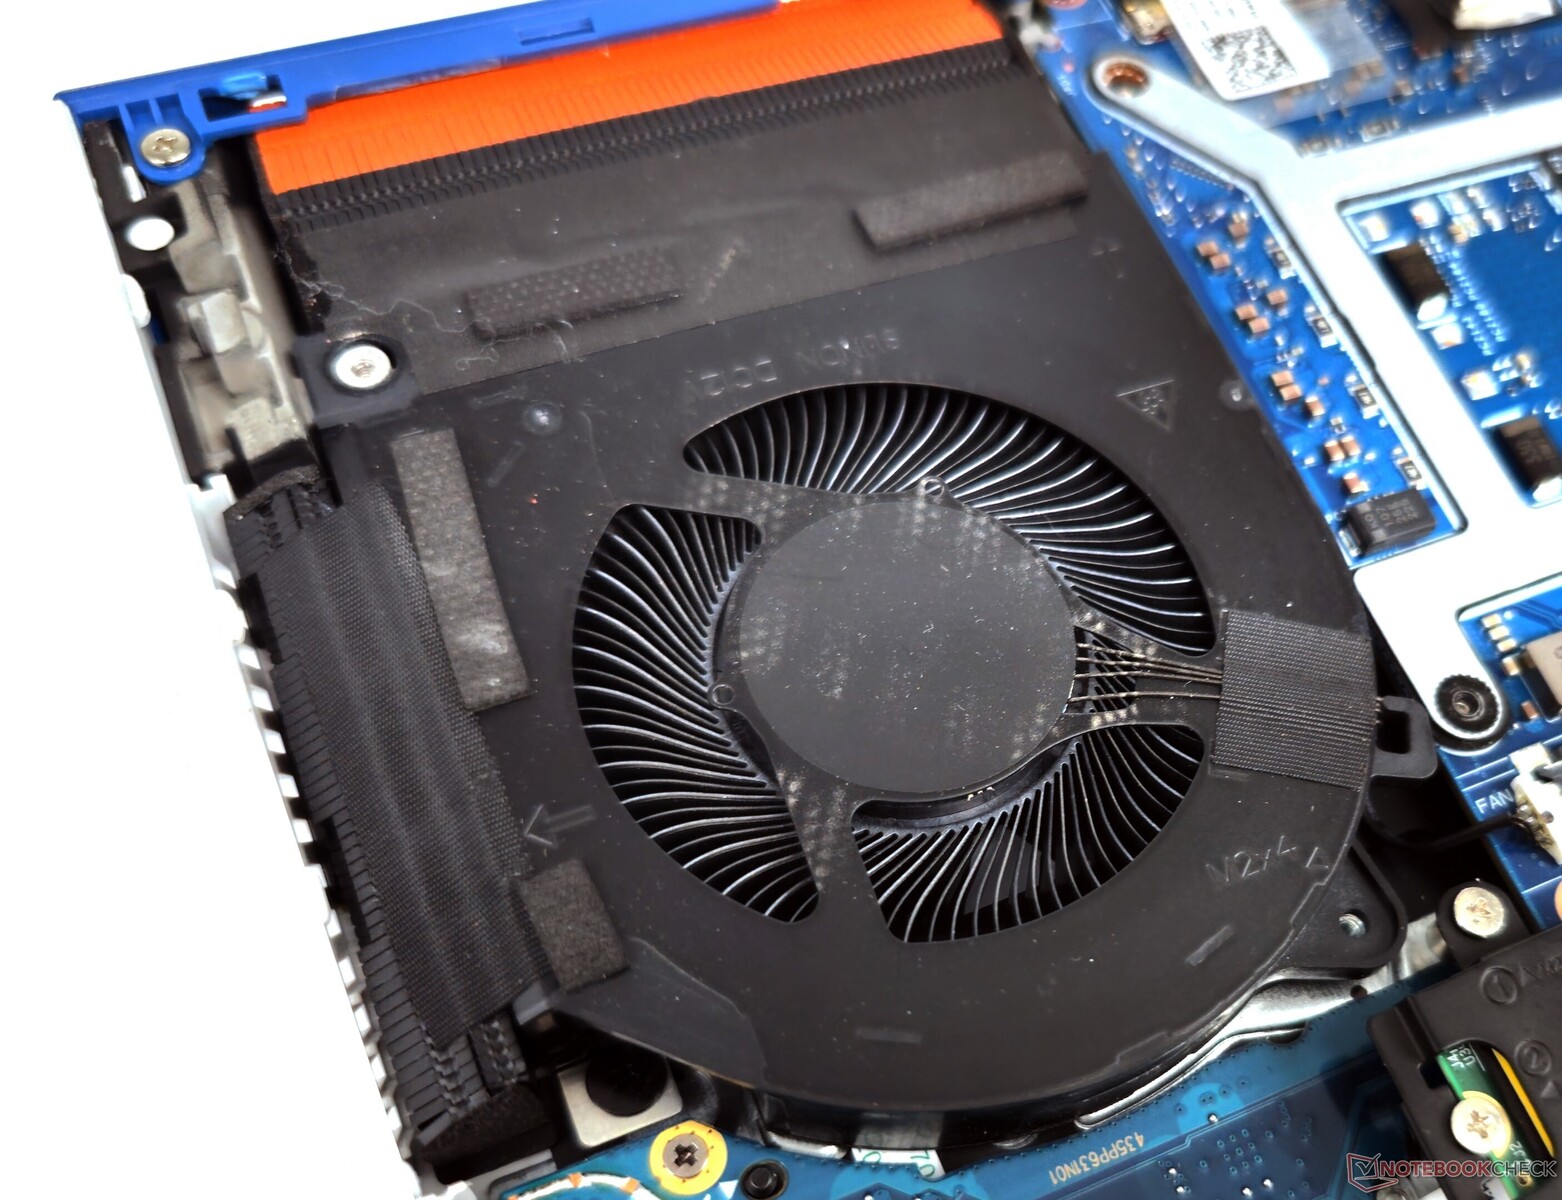
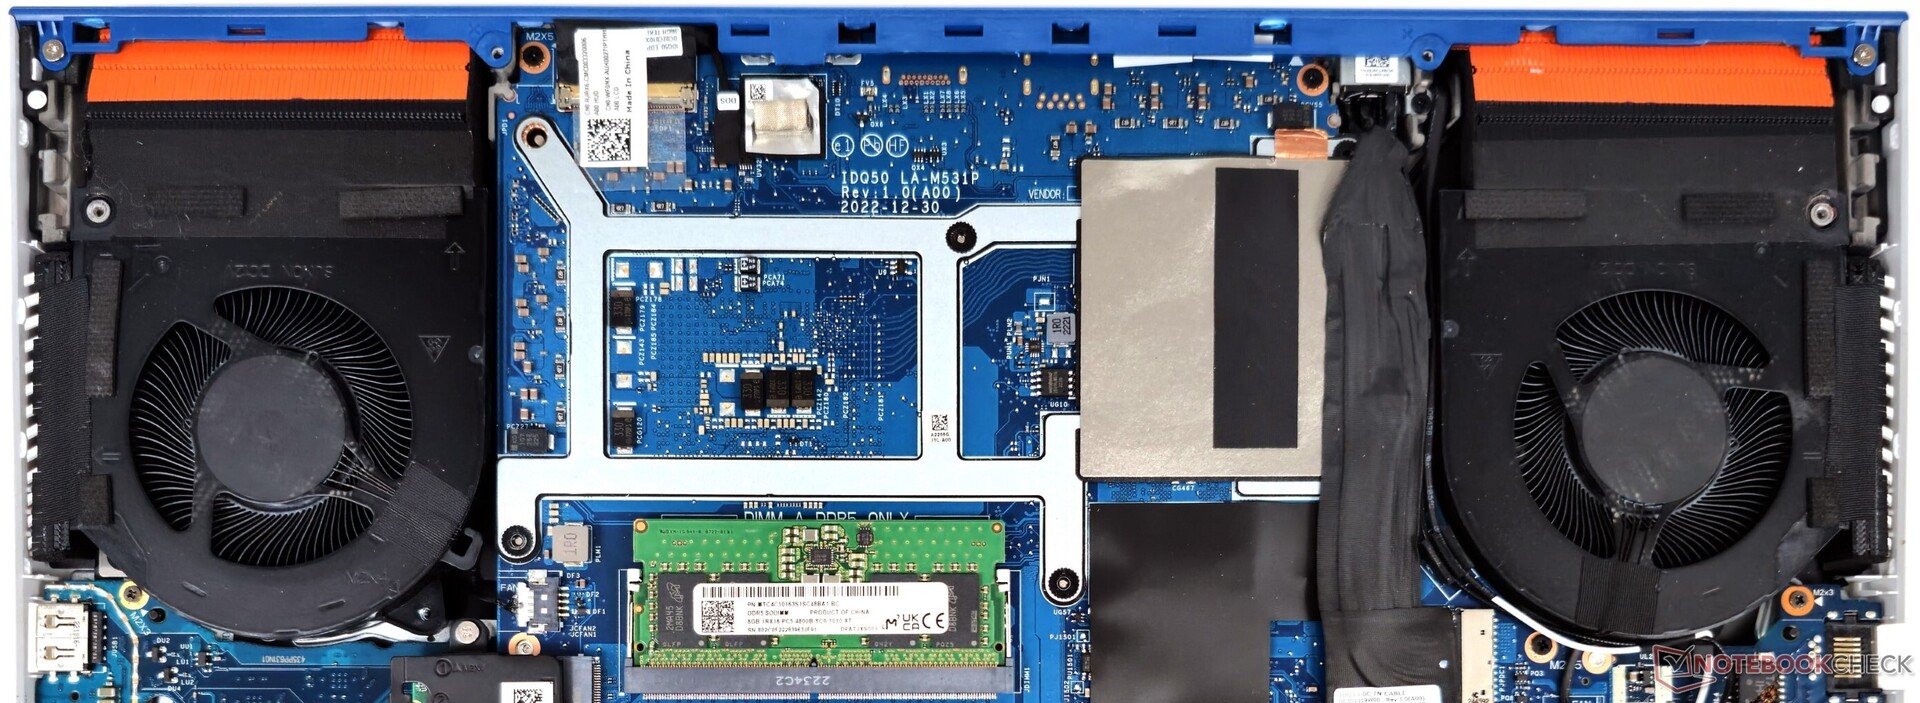
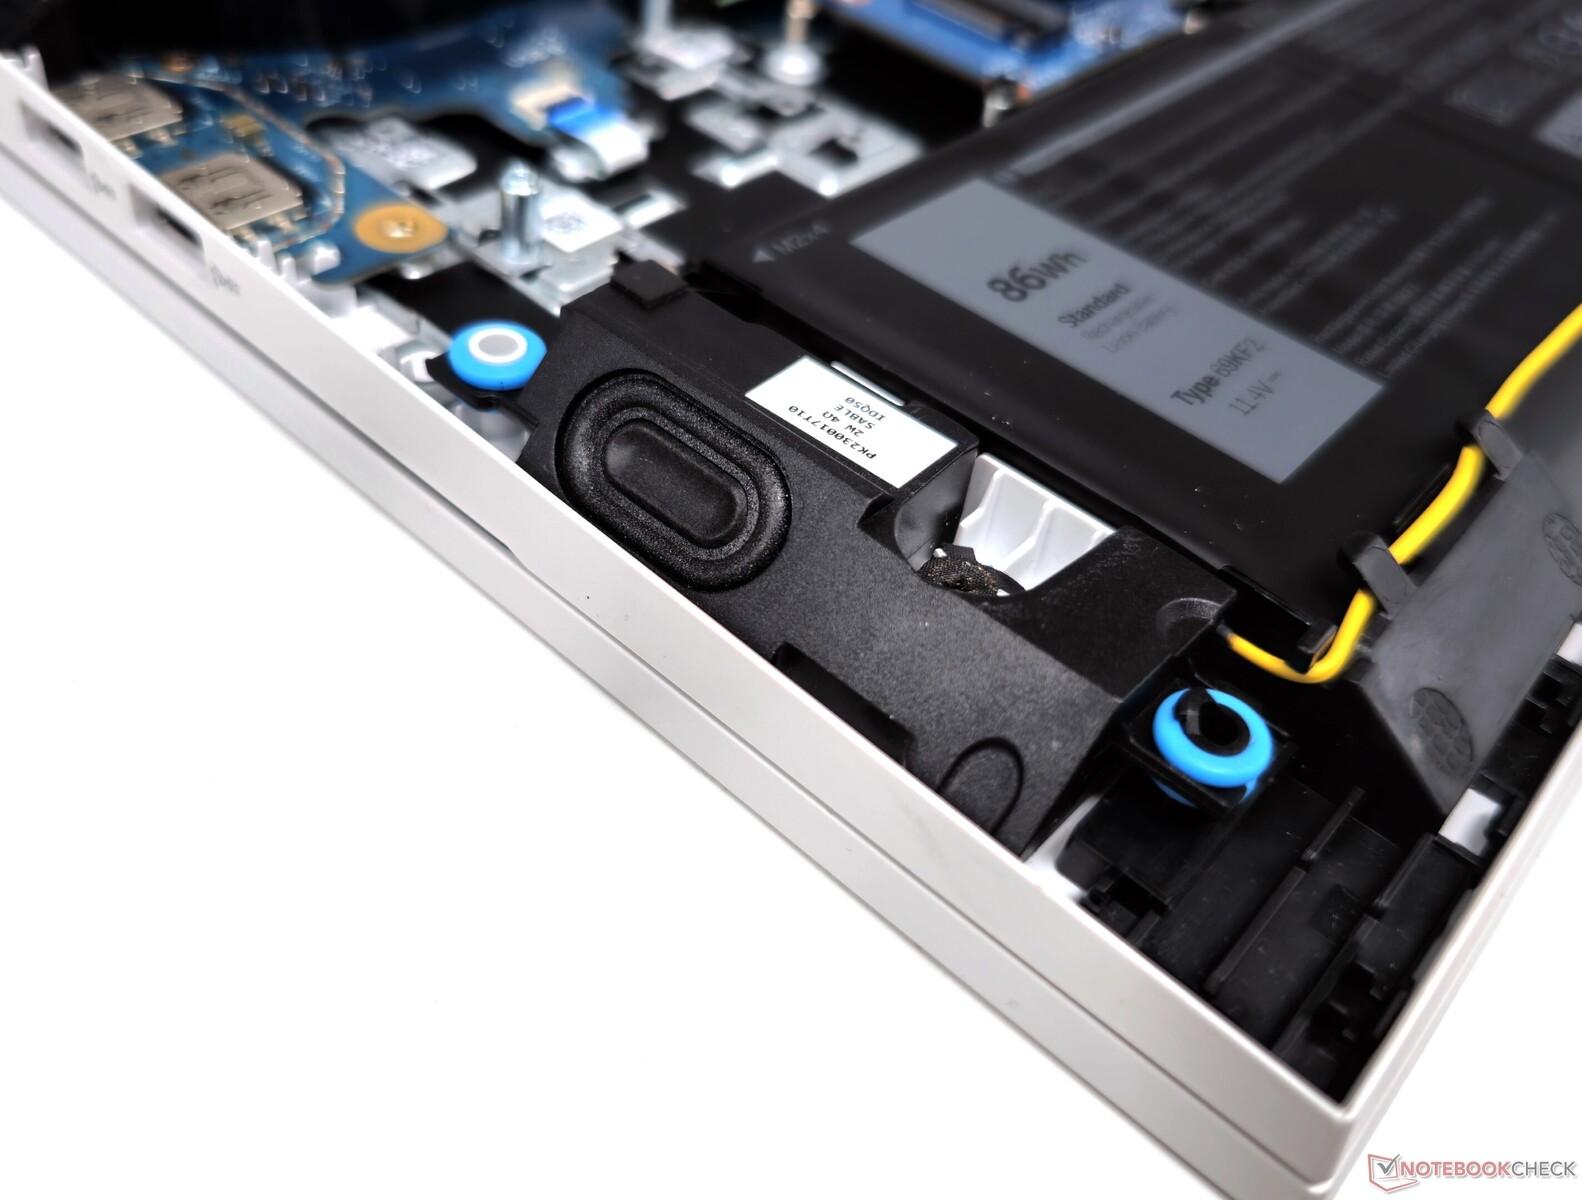
Manutenzione
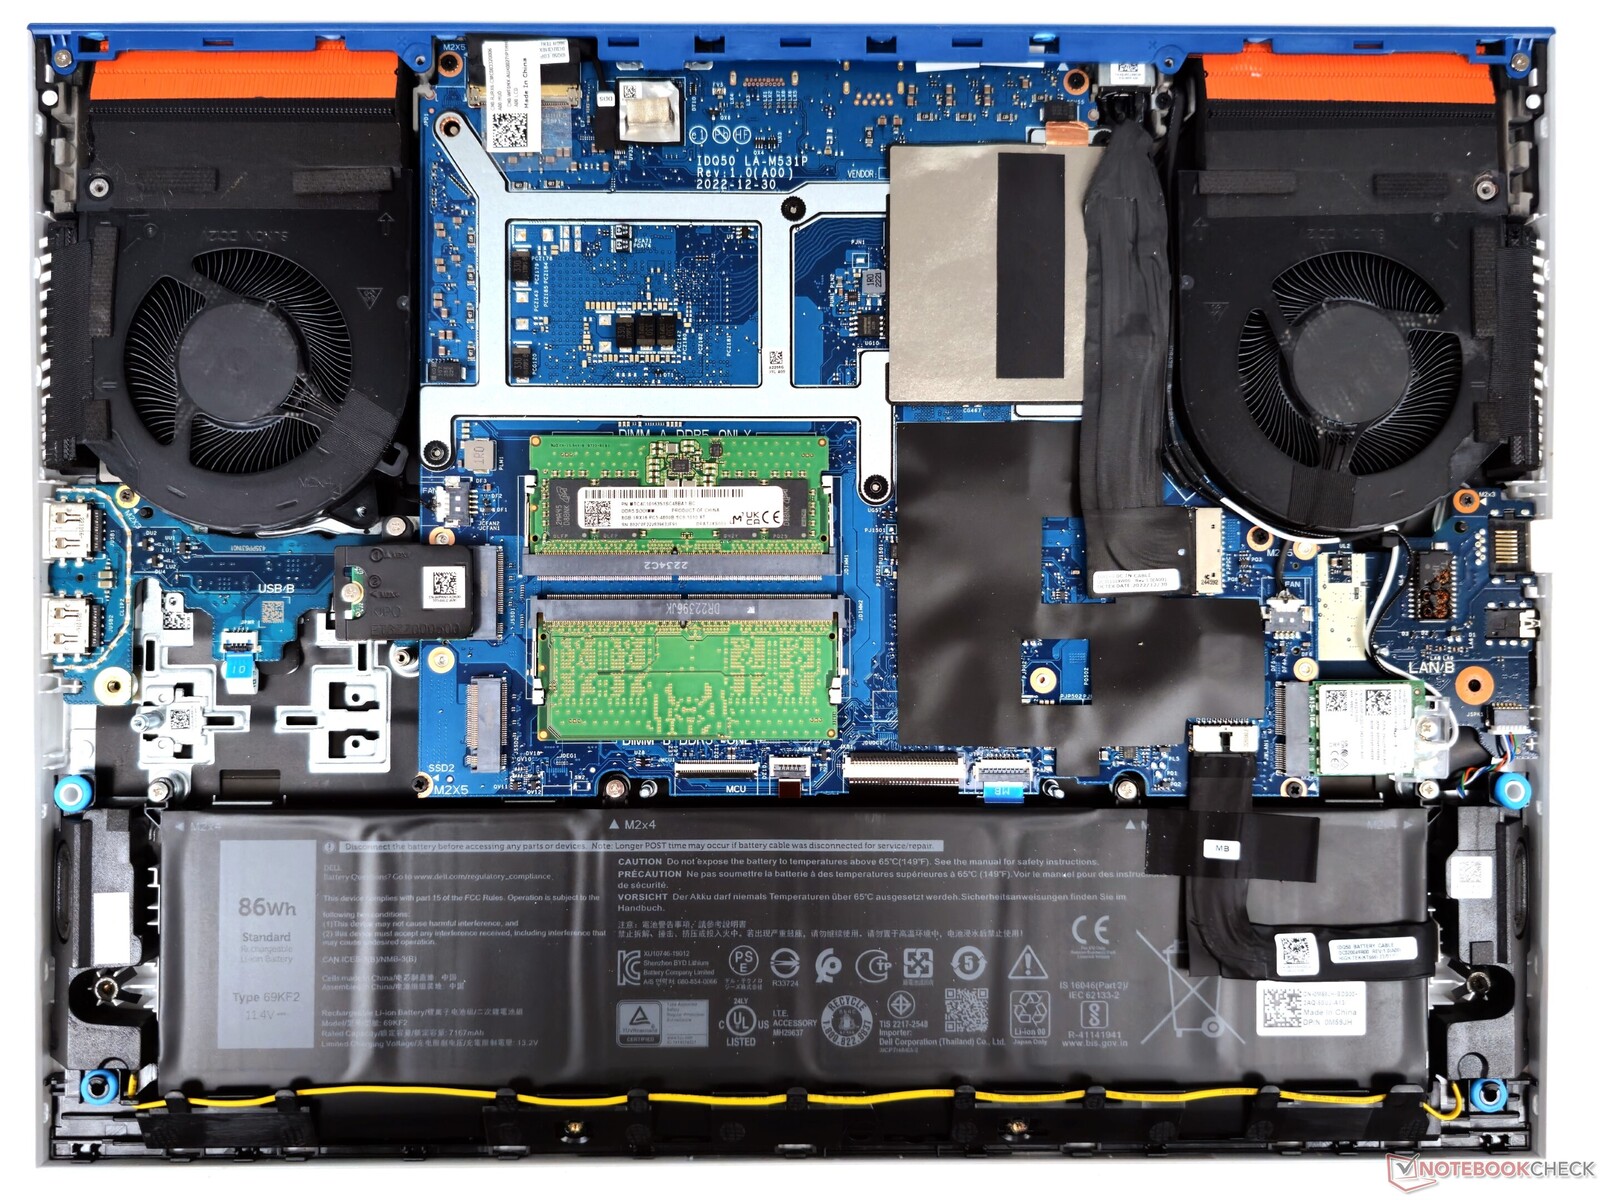
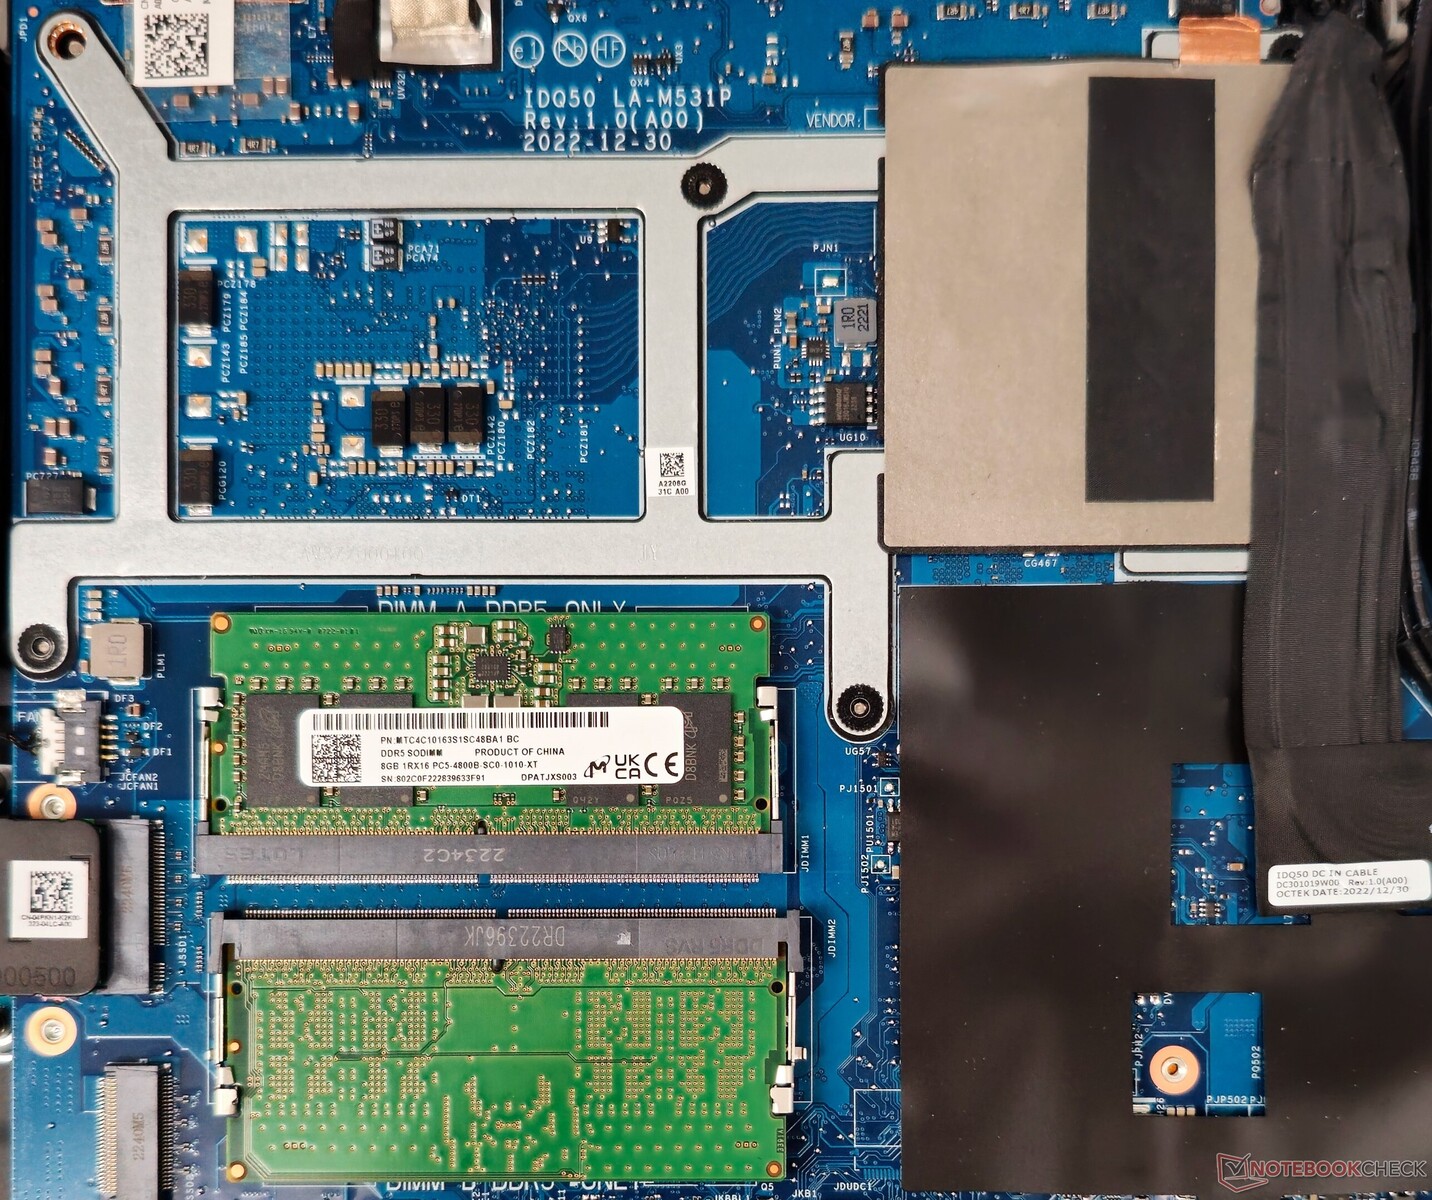
Il pannello posteriore del G15 5530 può essere facilmente aperto dopo aver rimosso le 10 viti PH00. Il sistema di raffreddamento si trova sul lato inferiore della scheda. WLAN, SSD e RAM DDR5 sono tutti aggiornabili.
Dell utilizza slot M.2 2242 non convenzionali (M-key) per lo storage. Gli utenti devono tenerne conto quando aggiungono o sostituiscono unità NVMe. La batteria può essere svitata e sostituita se necessario.
Dispositivi di input: Tasti piatti con una corsa ridotta e un touchpad angusto
Tastiera
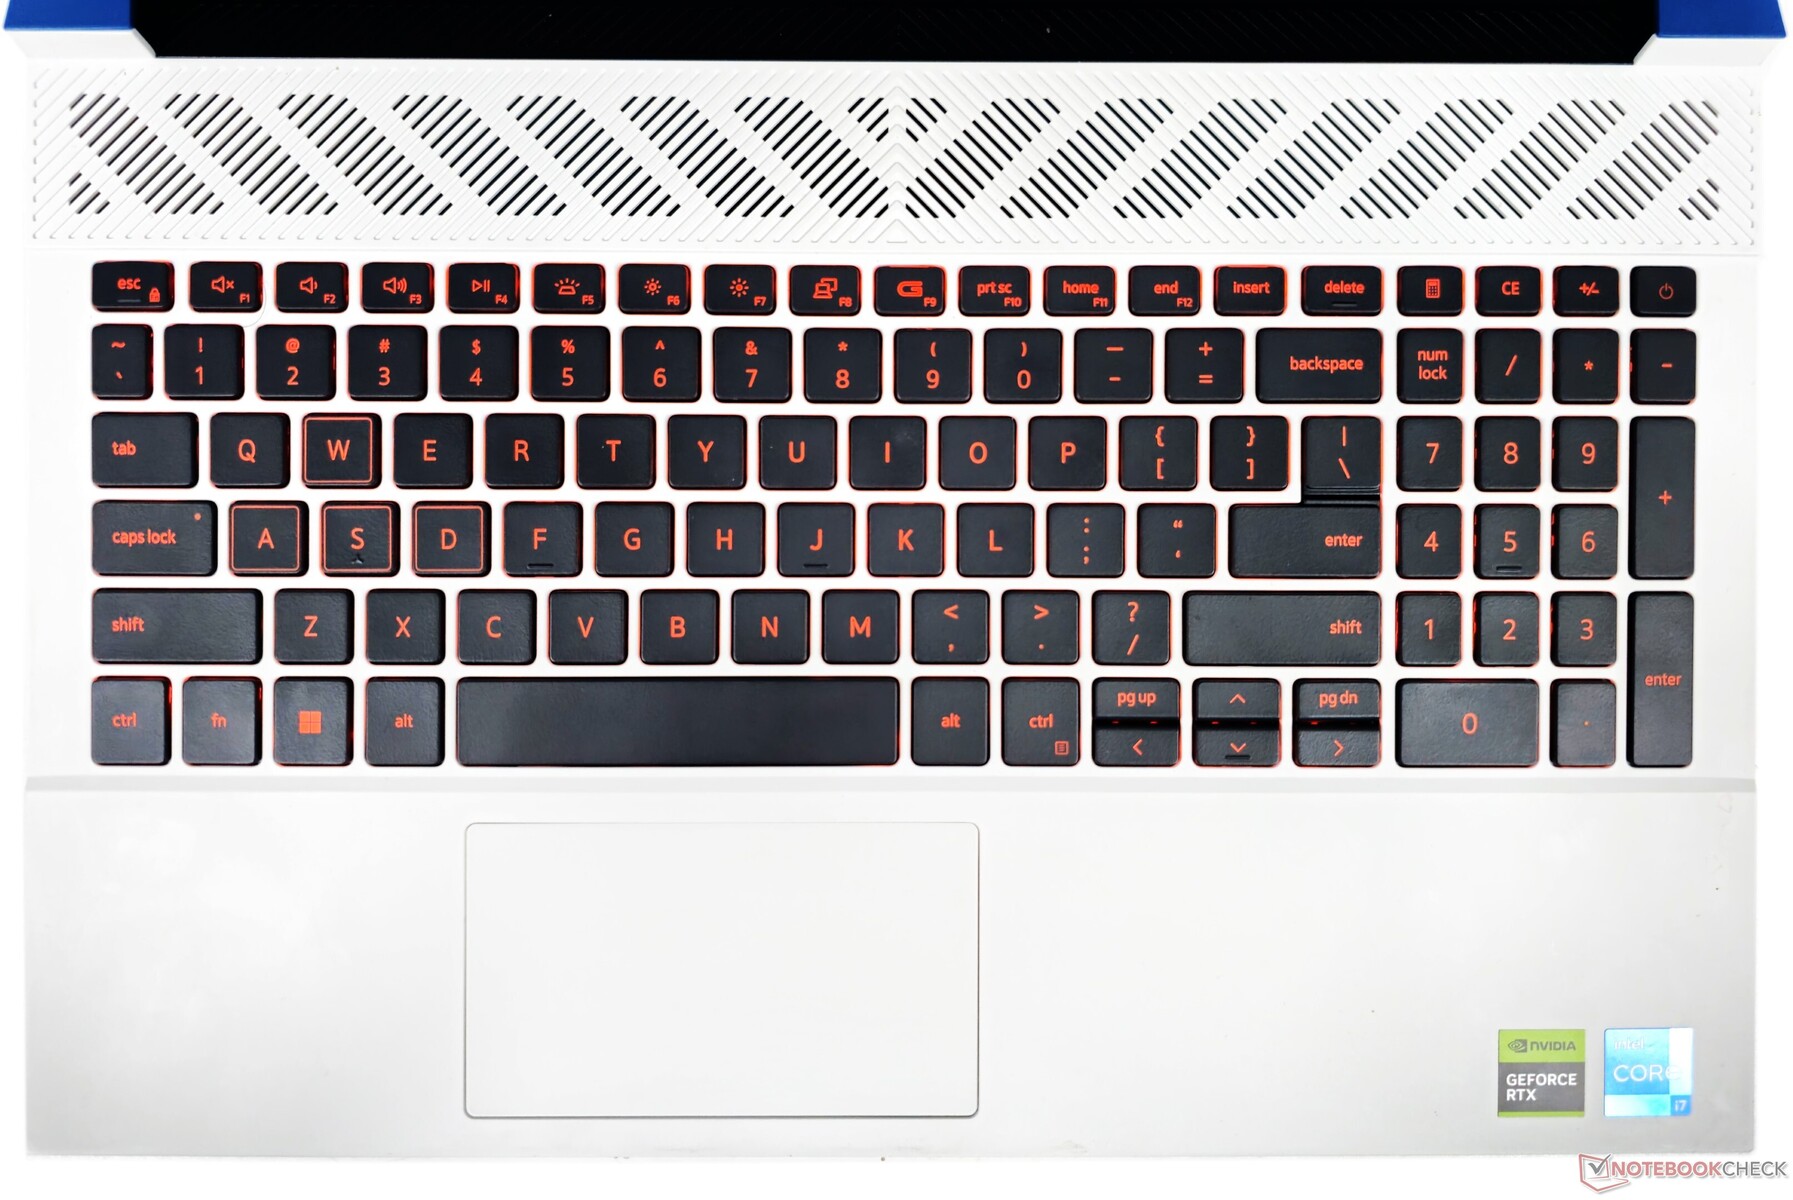
La tastiera del G15 5530 ha una flessione minima e presenta tasti piatti e uniformemente distanziati che offrono una corsa piuttosto ridotta. Include un tastierino numerico e scorciatoie per la calcolatrice. Tuttavia, questo layout fa sì che i tasti Pagina su e Pagina giù siano stipati insieme ai minuscoli tasti freccia.
Secondo Dell, la tastiera del G15 5530 è dotata di retroilluminazione RGB a 4 zone. Tuttavia, nella nostra unità erano presenti solo LED arancioni con una regolazione della luminosità a due livelli. Inoltre, la tastiera non è stata riconosciuta nell'Alienware Command Center, limitando le opzioni di personalizzazione.
Il tasto F9 include una scorciatoia Game Shift, che consente di passare immediatamente alle massime prestazioni e alla velocità della ventola quando necessario.
Touchpad
Il touchpad da 6 cm x 10,5 cm sembra angusto rispetto a quello di altri portatili 2023. Detto questo, offre uno scorrimento fluido, supporta i gesti di Windows Precision ed è reattivo anche agli angoli.
A volte i clic possono diventare rumorosi, il che potrebbe essere un piccolo fastidio per coloro che preferiscono un input più silenzioso.
I dispositivi di input del G15 non sono di per sé negativi, ma gli utenti possono sicuramente trarre vantaggio da una tastiera e un mouse esterni.
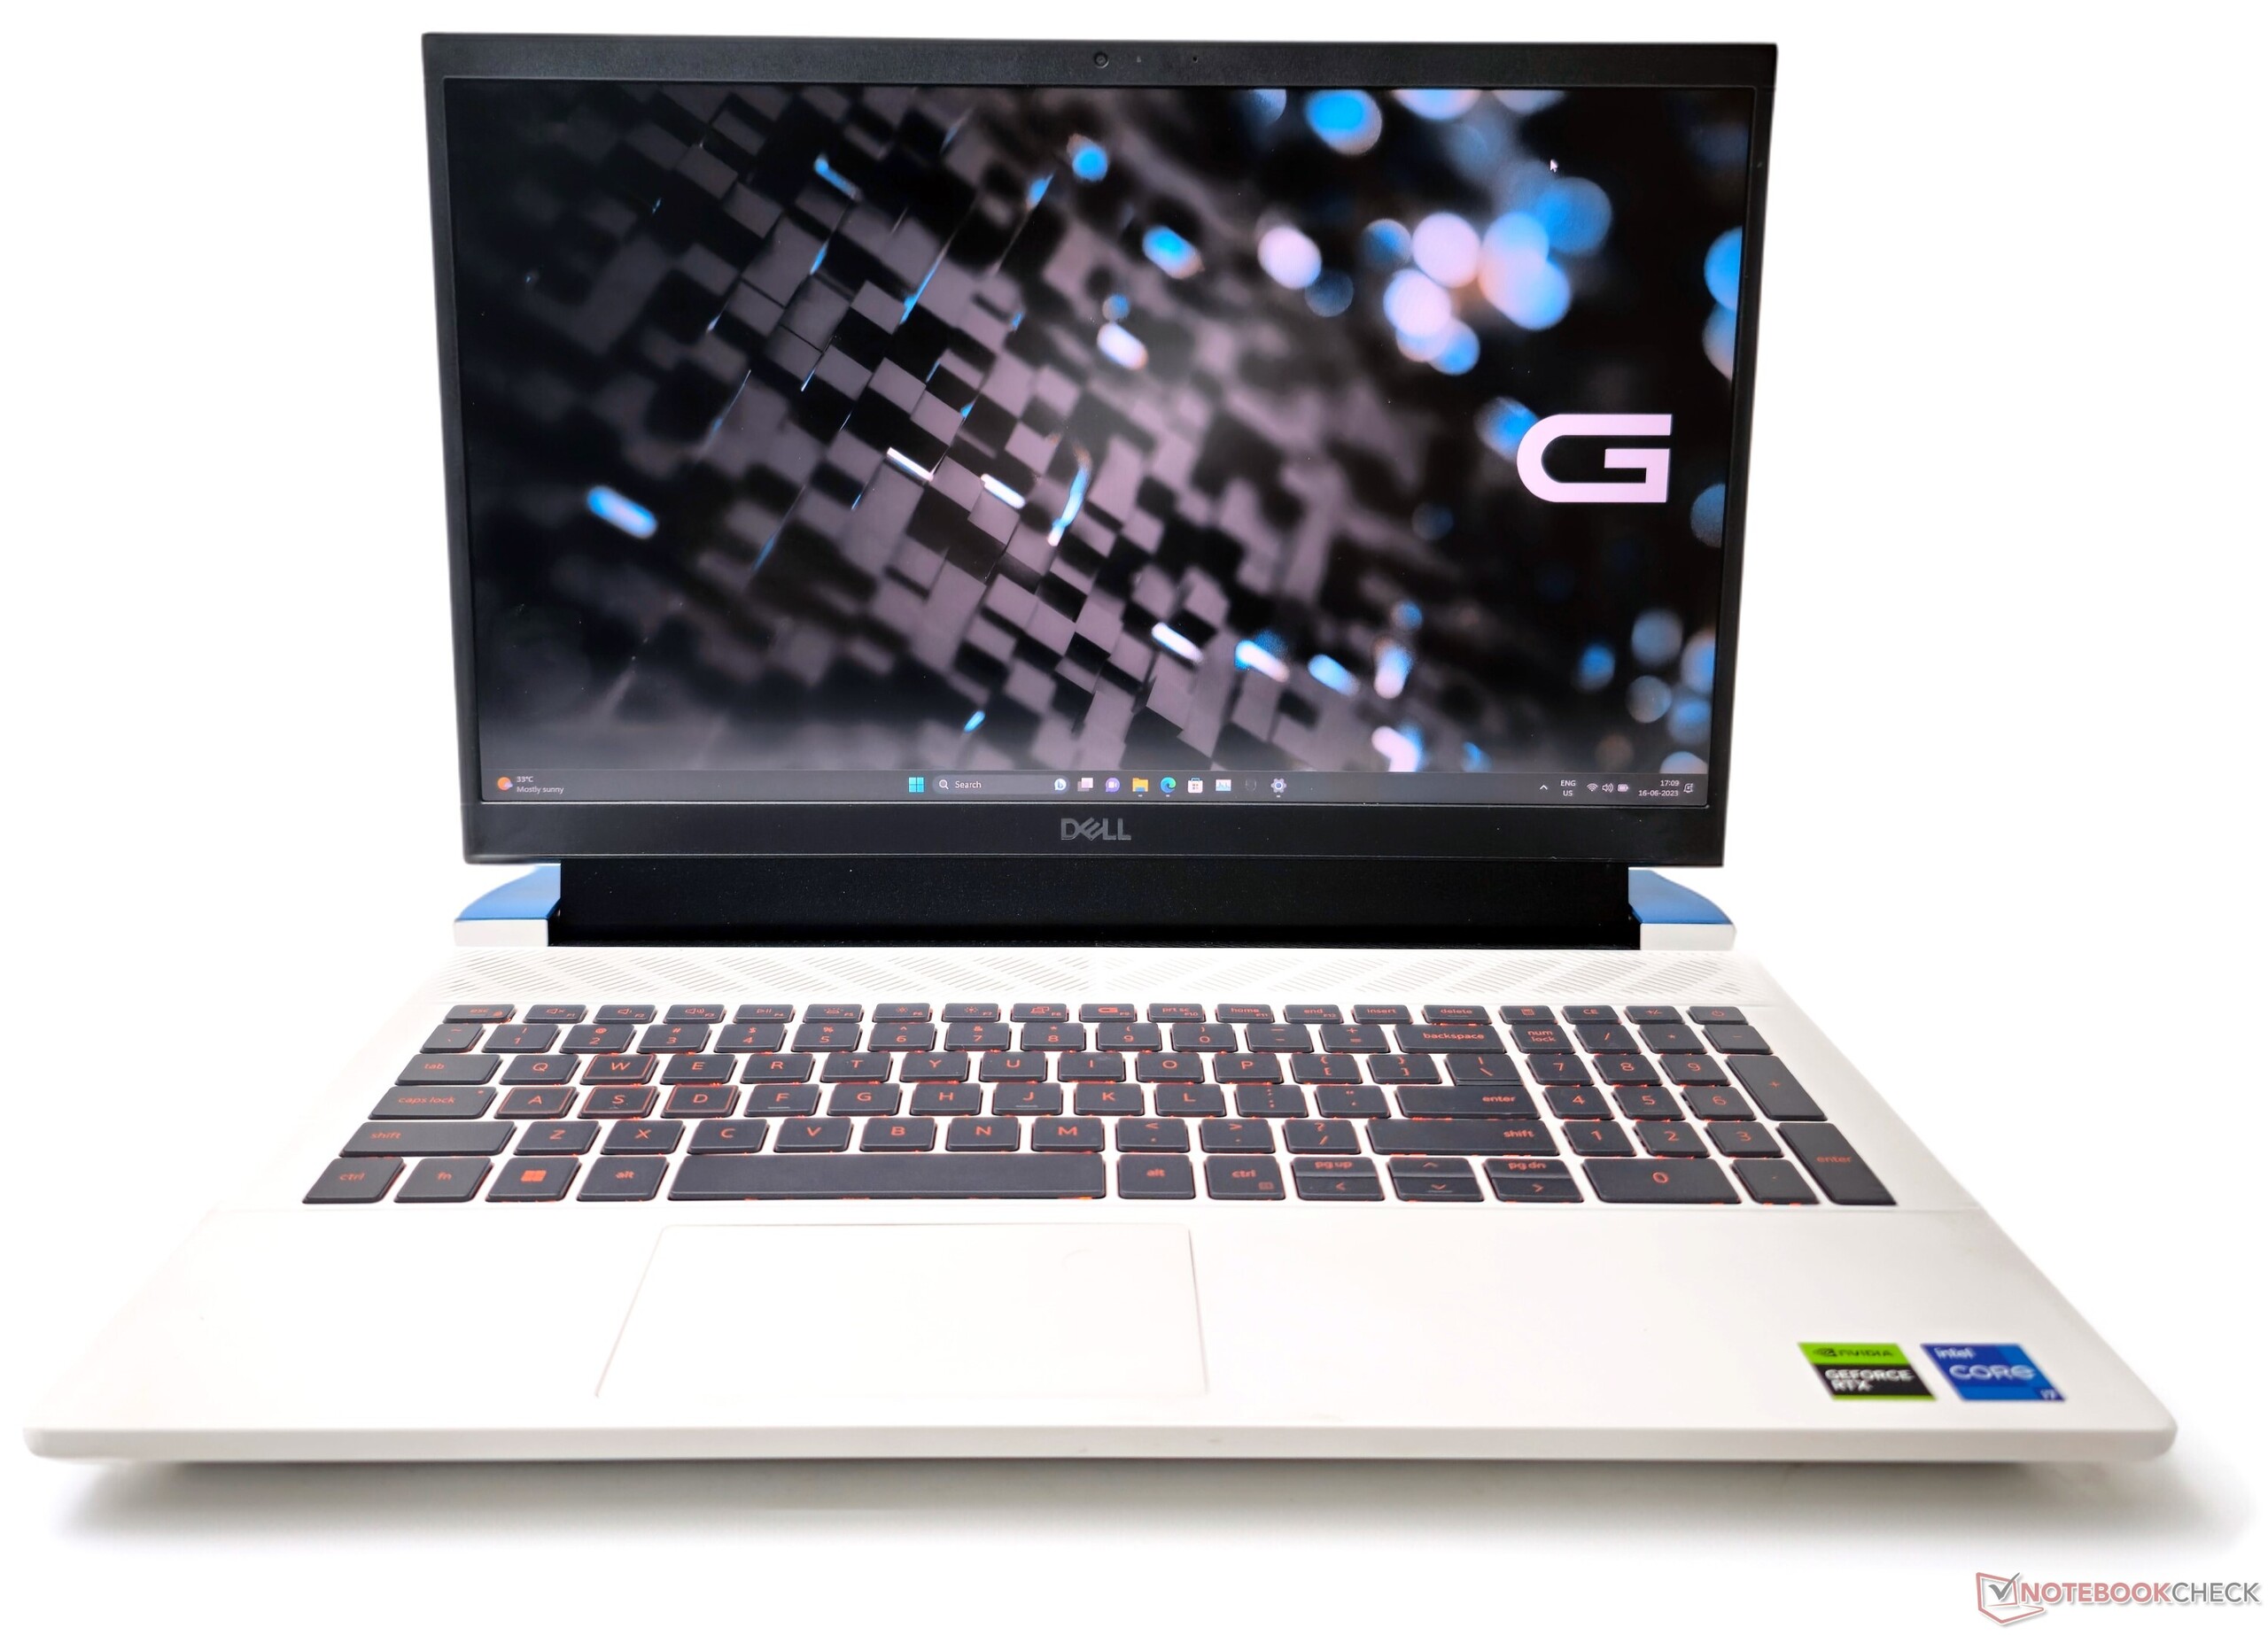
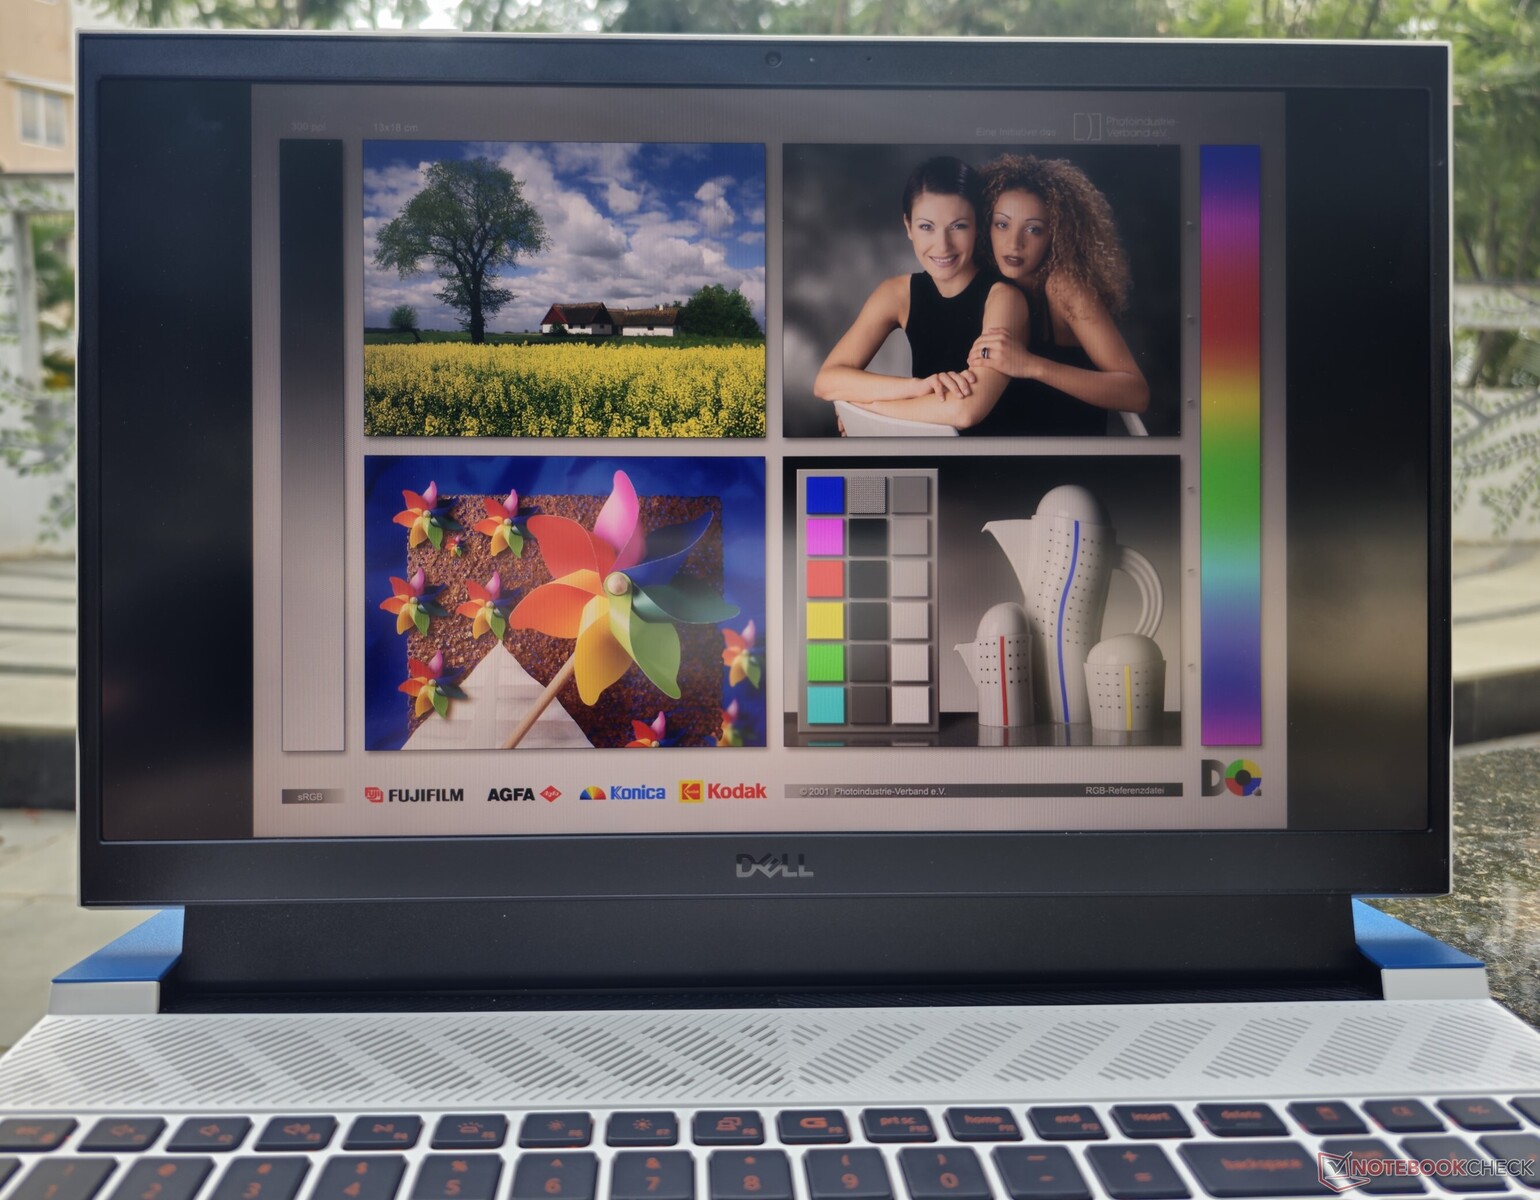
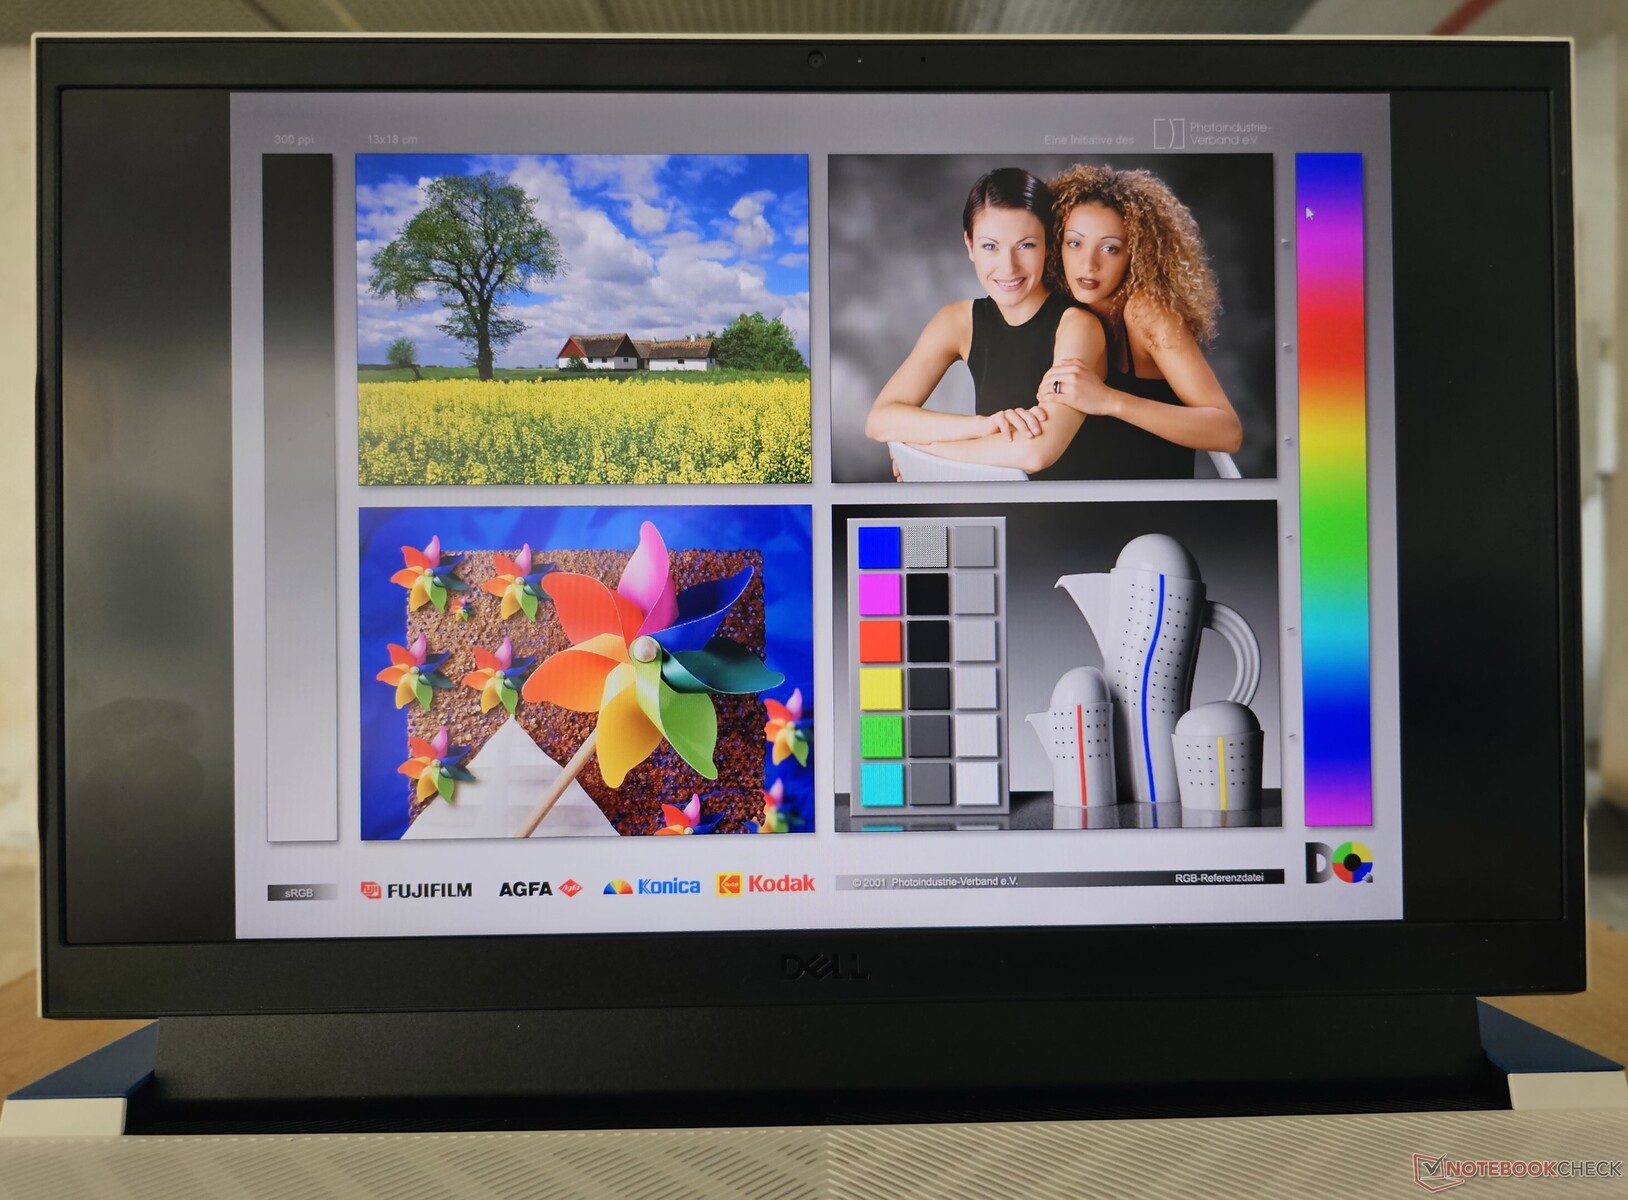
Display: pannello 1080p a 165 Hz con overdrive
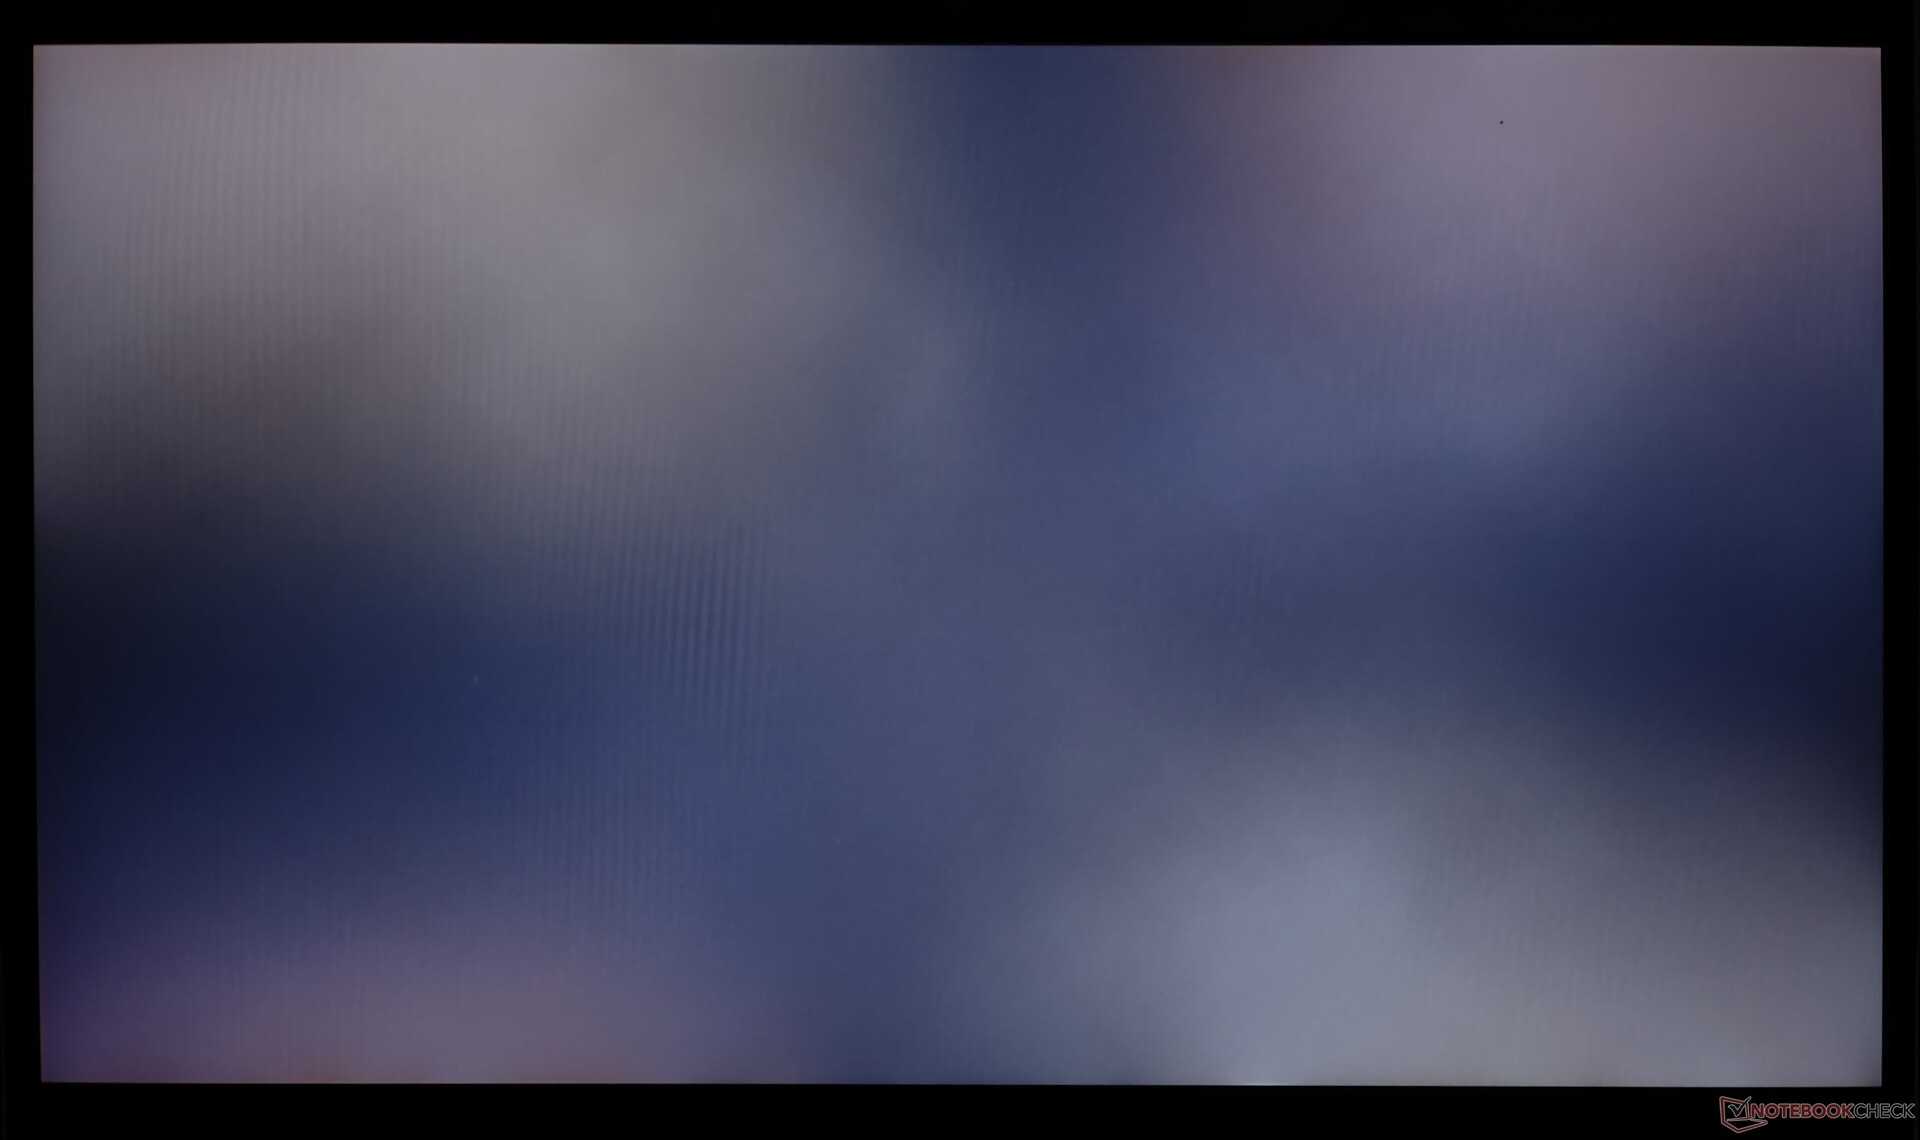
Dell equipaggia il G15 con un pannello IPS AUO da 1080p che offre una frequenza di aggiornamento di 165 Hz con G-Sync. Si nota un significativo blacklight bleeding agli angoli, come tipico degli schermi IPS.
La distribuzione della luminosità è abbastanza uniforme (94%) e il rapporto di contrasto è di 1524:1, che dovrebbe offrire una buona esperienza visiva per i giochi.

| |||||||||||||||||||||||||
Distribuzione della luminosità: 94 %
Al centro con la batteria: 321 cd/m²
Contrasto: 1524:1 (Nero: 0.21 cd/m²)
ΔE ColorChecker Calman: 4.55 | ∀{0.5-29.43 Ø4.71}
calibrated: 1.51
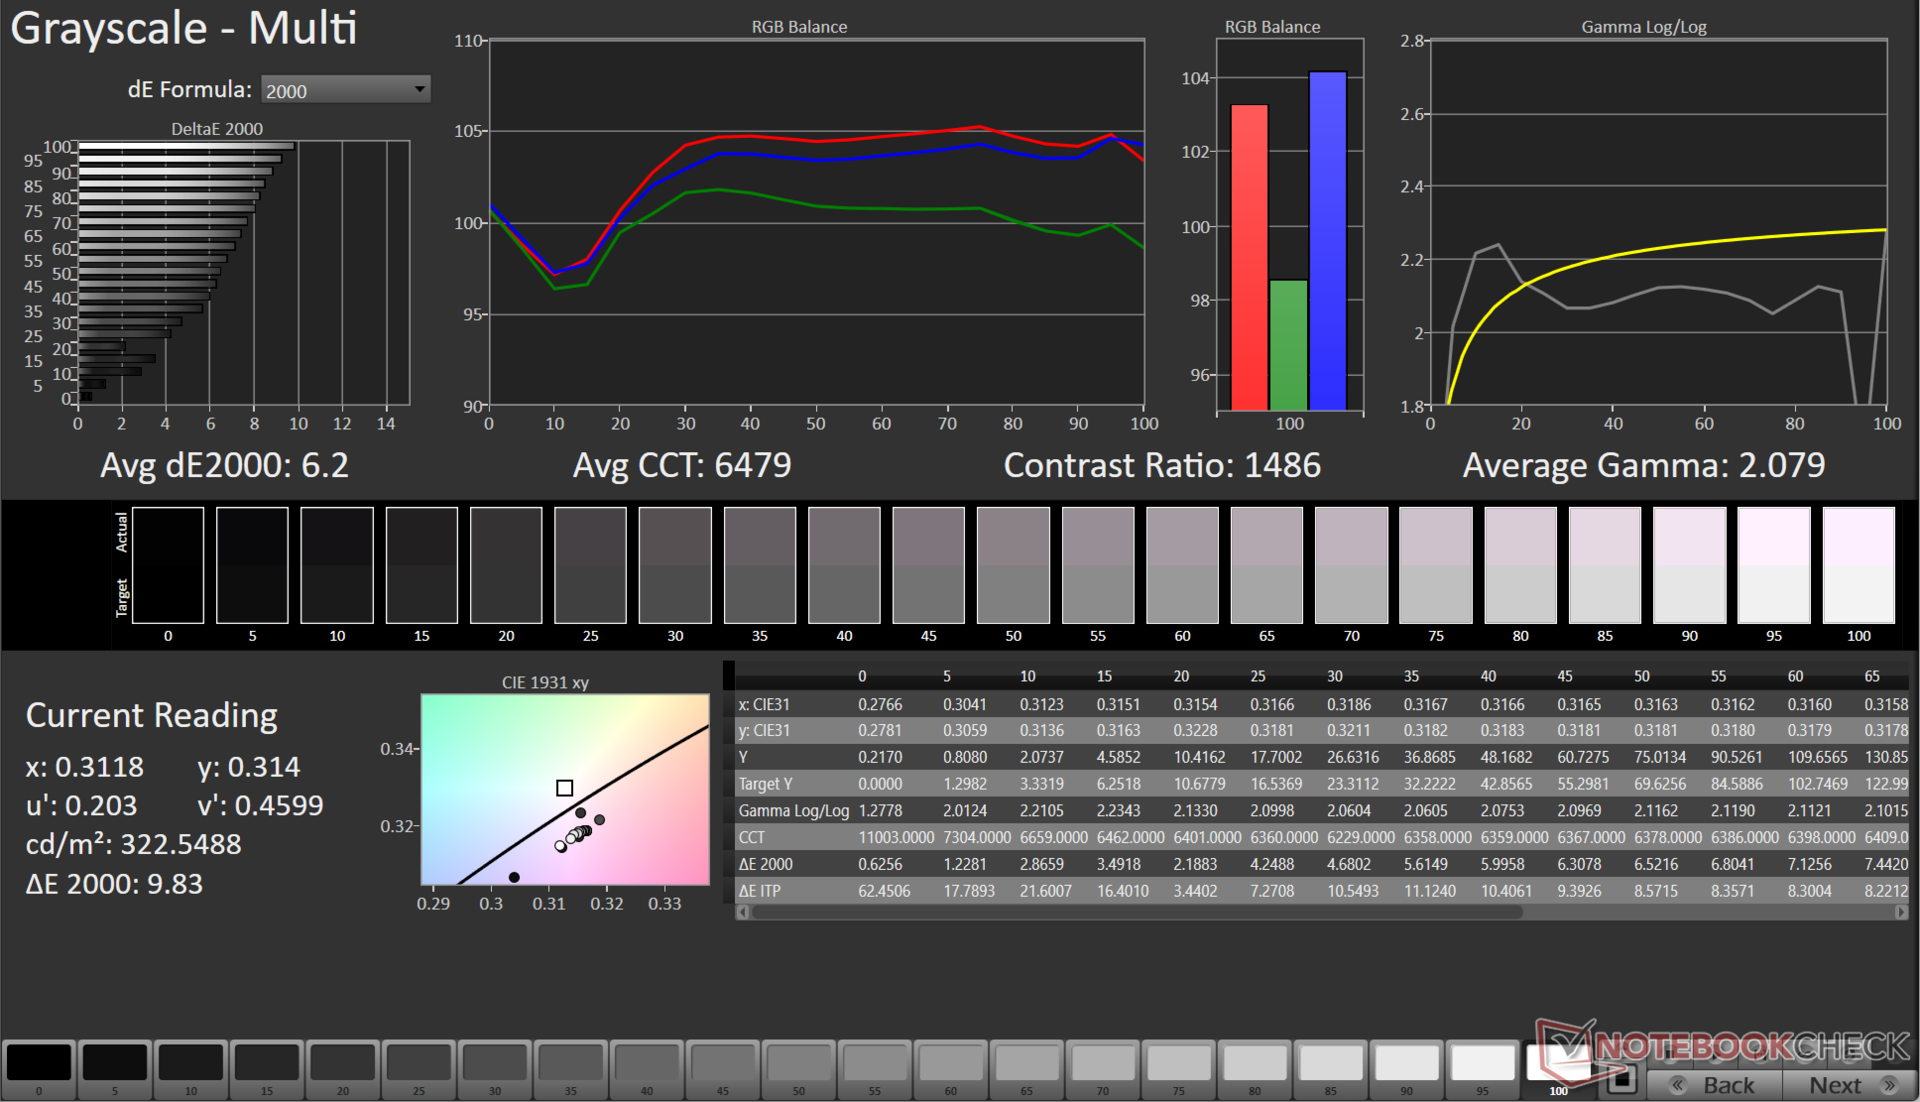
ΔE Greyscale Calman: 6.2 | ∀{0.09-98 Ø4.96}
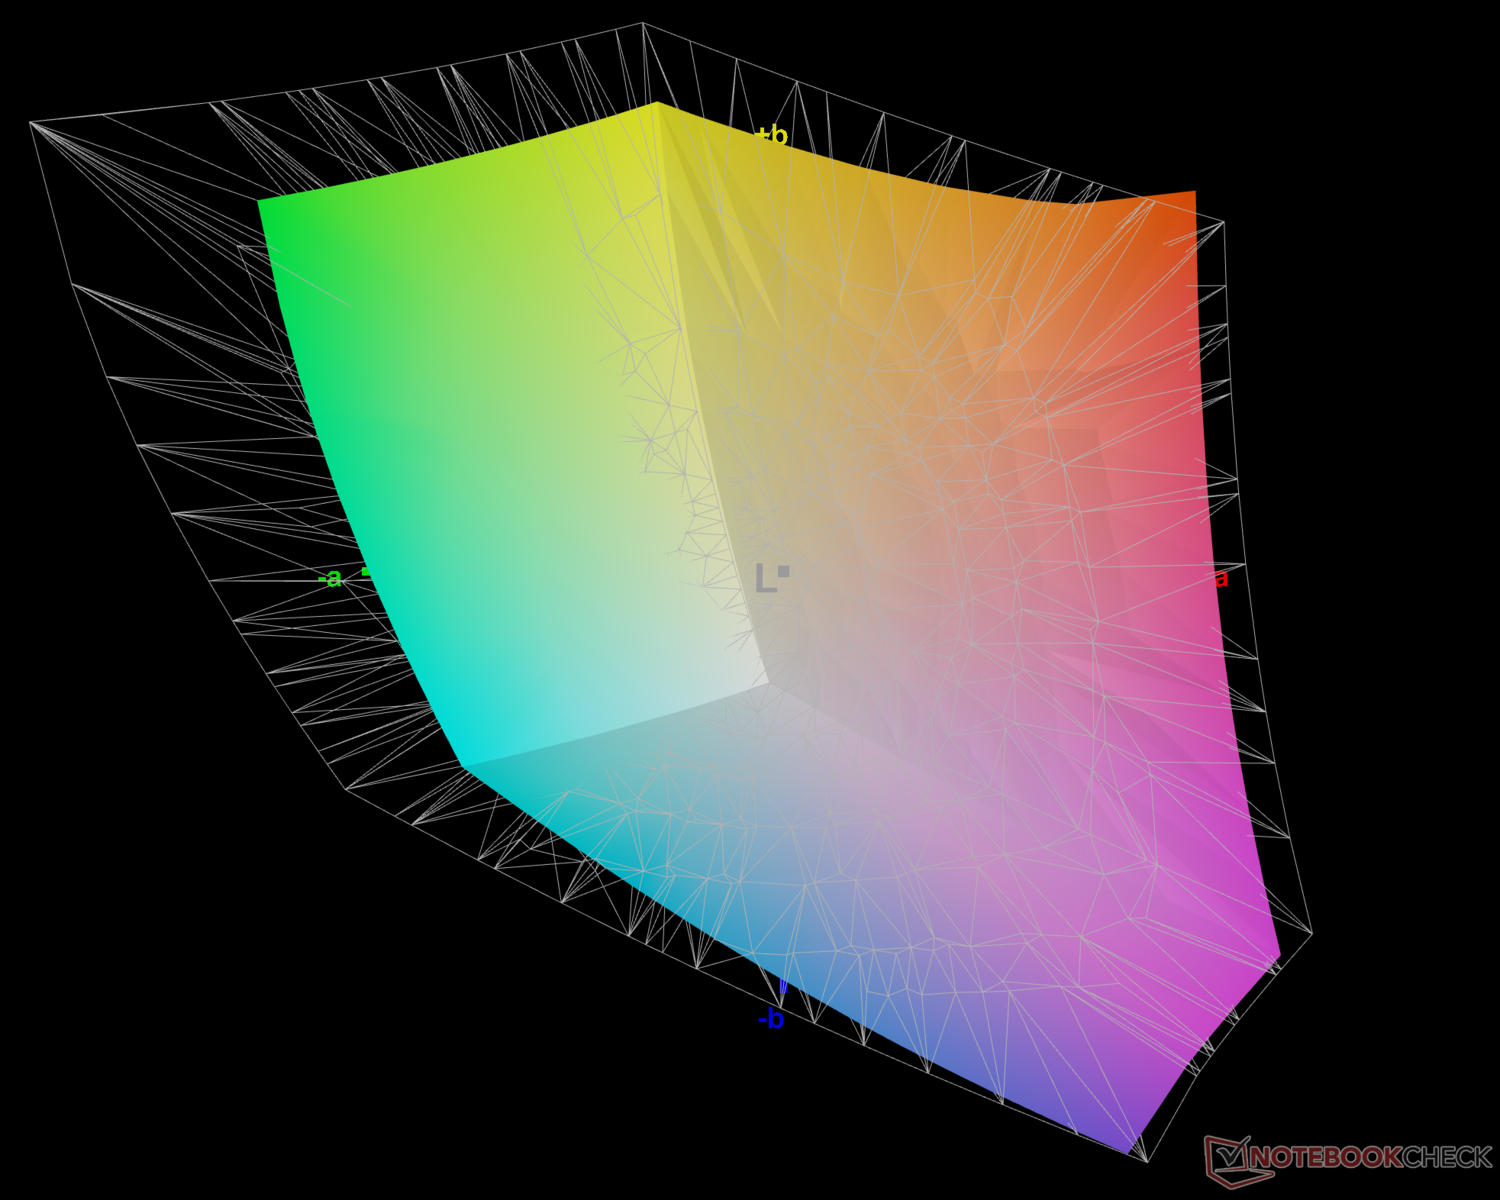
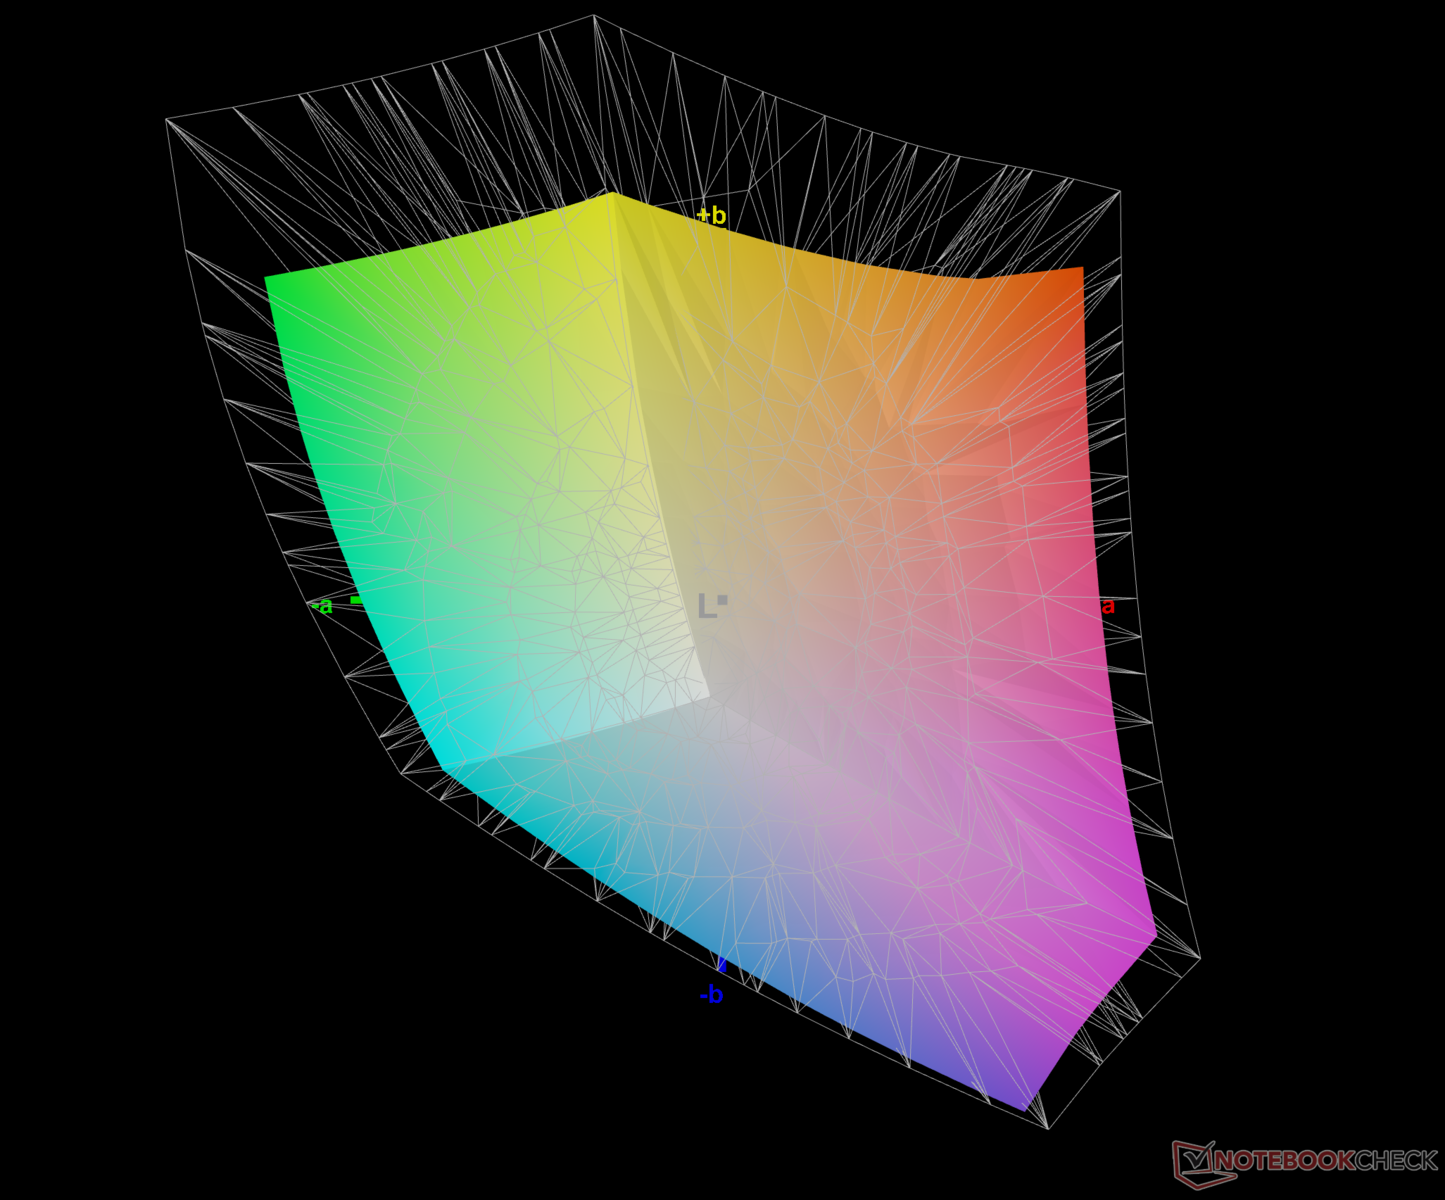
74.4% AdobeRGB 1998 (Argyll 3D)
98.4% sRGB (Argyll 3D)
73.1% Display P3 (Argyll 3D)
Gamma: 2.07
CCT: 6479 K
| Dell G15 5530 AUO B156HAN, IPS, 1920x1080, 15.6" | Asus ROG Strix G18 G814JI NE180QDM-NZ2 (BOE0B35), IPS, 2560x1600, 18" | Lenovo Legion Pro 5 16IRX8 AU Optronics B160QAN03.1, IPS, 2560x1600, 16" | Asus ROG Flow X16 GV601V TMX1603 (TL160ADMP03-0), IPS, 2560x1600, 16" | MSI Katana 17 B13VFK B173HAN04.9, IPS LED, 1920x1080, 17.3" | Asus TUF Gaming A16 FA617XS BOE NE160WUM-NX2, IPS, 1920x1200, 16" | Asus ROG Strix G17 G713PI BOE0B69, IPS, 2560x1440, 17.3" | Medion Erazer Major X20 BOE CQ NE160QDM-NZ1, IPS, 2560x1600, 16" | |
|---|---|---|---|---|---|---|---|---|
| Display | 17% | -1% | 16% | -42% | -4% | 17% | -3% | |
| Display P3 Coverage (%) | 73.1 | 98.1 34% | 71.2 -3% | 96.61 32% | 40.8 -44% | 69.3 -5% | 98.3 34% | 69.4 -5% |
| sRGB Coverage (%) | 98.4 | 99.9 2% | 98.8 0% | 99.92 2% | 61 -38% | 97.3 -1% | 100 2% | 98 0% |
| AdobeRGB 1998 Coverage (%) | 74.4 | 85.6 15% | 73.3 -1% | 84.63 14% | 42.2 -43% | 70.7 -5% | 85.9 15% | 70.9 -5% |
| Response Times | -67% | -211% | -27% | -630% | -224% | -59% | -161% | |
| Response Time Grey 50% / Grey 80% * (ms) | 3.39 ? | 5.6 ? -65% | 14.5 ? -328% | 3.8 ? -12% | 33 ? -873% | 15.6 ? -360% | 5.3 ? -56% | 13.1 ? -286% |
| Response Time Black / White * (ms) | 5.35 ? | 9 ? -68% | 10.4 ? -94% | 7.6 ? -42% | 26 ? -386% | 10 ? -87% | 8.6 ? -61% | 7.3 ? -36% |
| PWM Frequency (Hz) | 21620 ? | |||||||
| Screen | 14% | 21% | 21% | -32% | 21% | 17% | 12% | |
| Brightness middle (cd/m²) | 320 | 471 47% | 405.7 27% | 486 52% | 267 -17% | 301 -6% | 327 2% | 374 17% |
| Brightness (cd/m²) | 316 | 422 34% | 368 16% | 469 48% | 256 -19% | 294 -7% | 320 1% | 357 13% |
| Brightness Distribution (%) | 94 | 83 -12% | 87 -7% | 91 -3% | 93 -1% | 94 0% | 89 -5% | 92 -2% |
| Black Level * (cd/m²) | 0.21 | 0.47 -124% | 0.38 -81% | 0.39 -86% | 0.21 -0% | 0.21 -0% | 0.38 -81% | 0.33 -57% |
| Contrast (:1) | 1524 | 1002 -34% | 1068 -30% | 1246 -18% | 1271 -17% | 1433 -6% | 861 -44% | 1133 -26% |
| Colorchecker dE 2000 * | 4.55 | 2.05 55% | 1.65 64% | 2.27 50% | 4.7 -3% | 1.79 61% | 1.01 78% | 2.43 47% |
| Colorchecker dE 2000 max. * | 9.83 | 4.15 58% | 4.2 57% | 5.73 42% | 20.4 -108% | 3.48 65% | 4.01 59% | 3.97 60% |
| Colorchecker dE 2000 calibrated * | 1.51 | 0.8 47% | 0.53 65% | 0.6 60% | 4.5 -198% | 1.2 21% | 0.41 73% | 1.4 7% |
| Greyscale dE 2000 * | 6.2 | 2.8 55% | 1.2 81% | 3.36 46% | 1.5 76% | 2.5 60% | 1.6 74% | 3.1 50% |
| Gamma | 2.07 106% | 2.204 100% | 2.3 96% | 2.46 89% | 2.12 104% | 2.265 97% | 2.168 101% | 2.191 100% |
| CCT | 6479 100% | 7122 91% | 6453 101% | 6625 98% | 6552 99% | 6157 106% | 6659 98% | 6194 105% |
| Media totale (Programma / Settaggio) | -12% /
3% | -64% /
-17% | 3% /
13% | -235% /
-119% | -69% /
-19% | -8% /
7% | -51% /
-16% |
* ... Meglio usare valori piccoli
Il display copre quasi l'intera gamma di colori sRGB con prestazioni decenti anche negli spazi colore Adobe RGB e Display P3, che dovrebbero essere adatti per i giochi e per le modifiche di base.
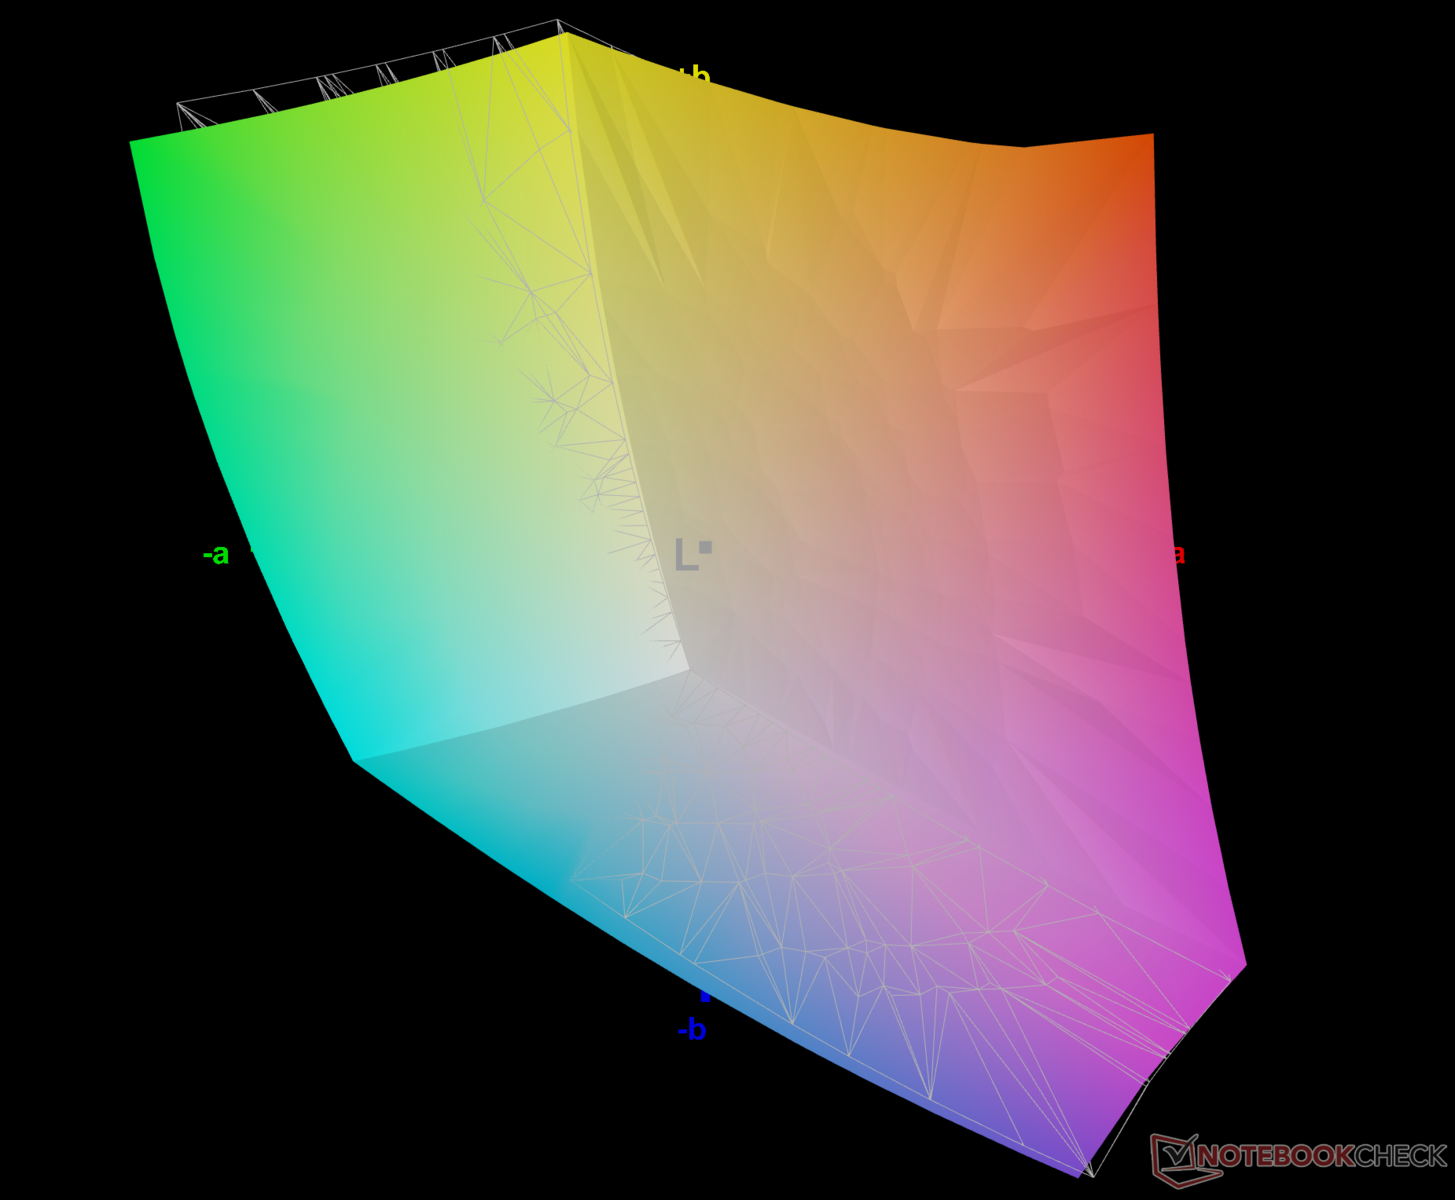
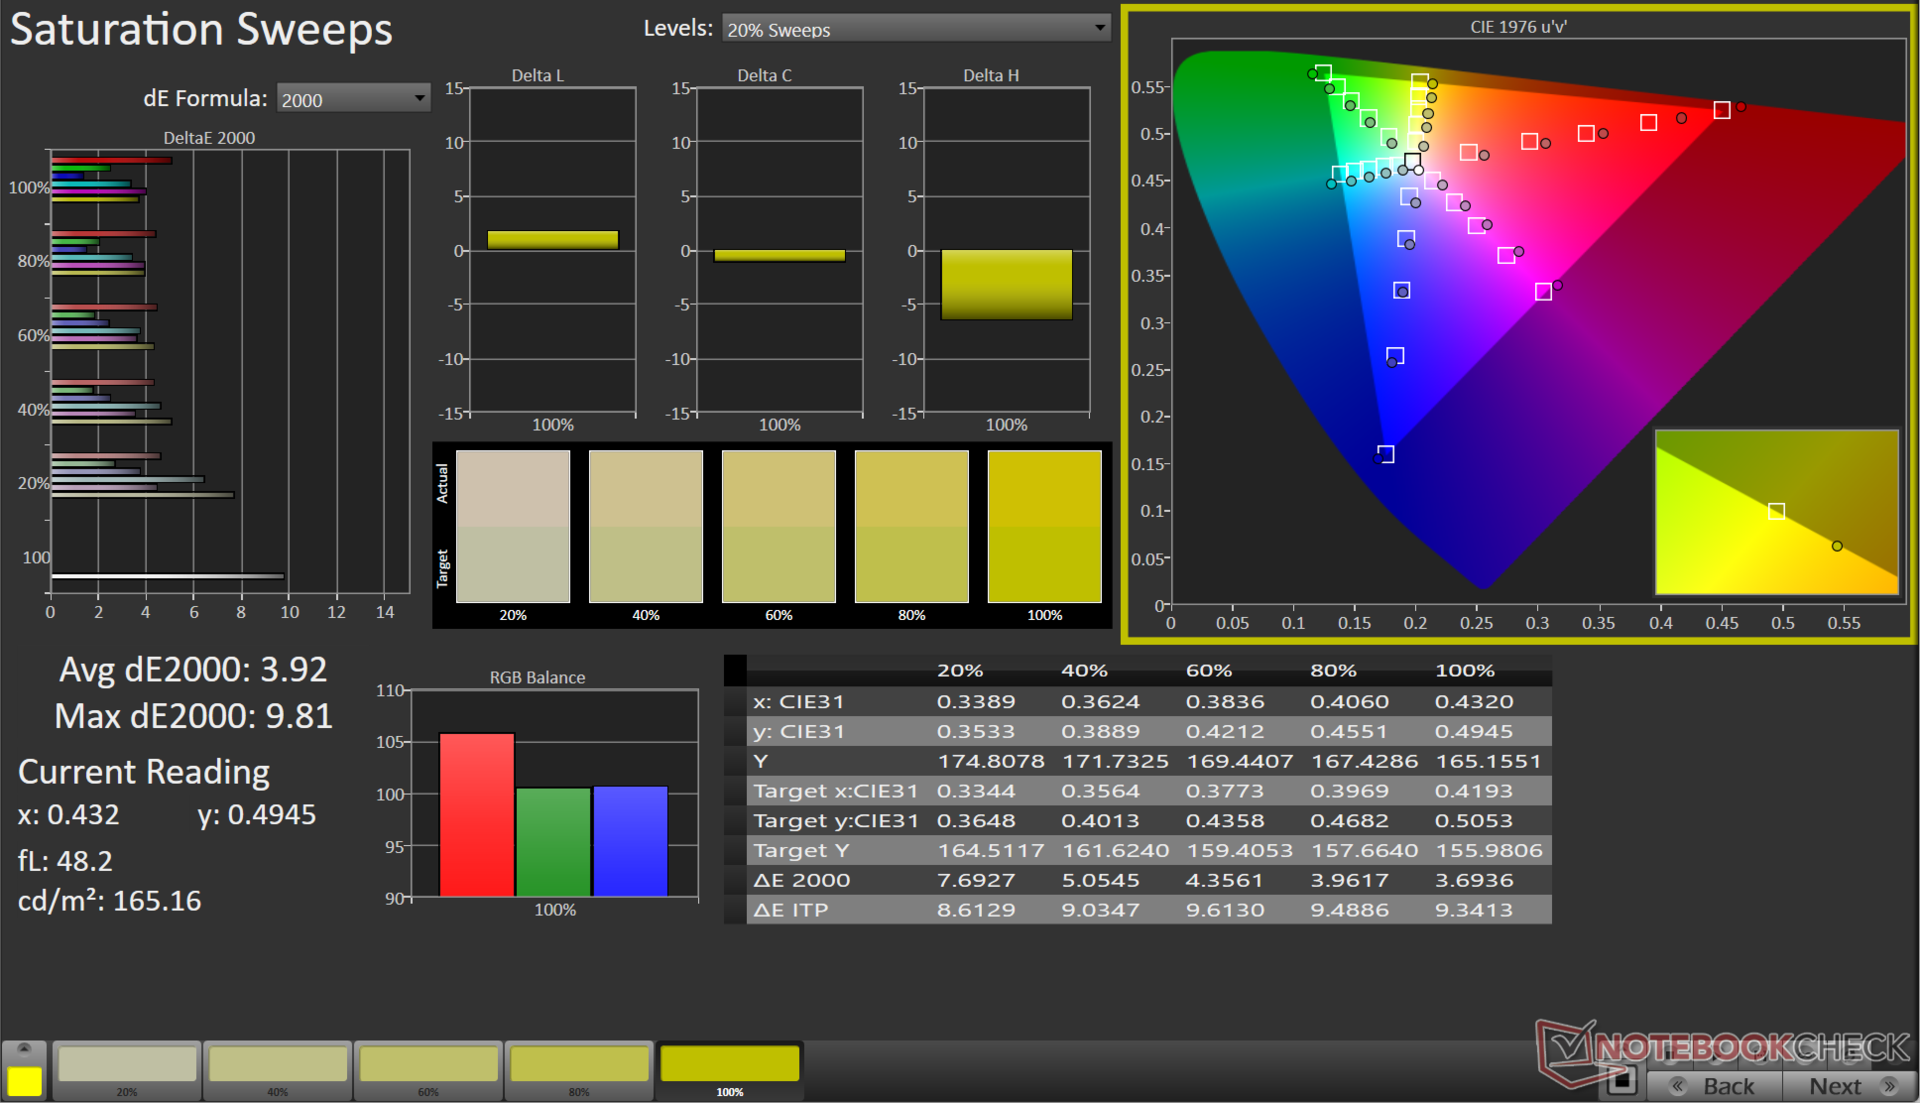
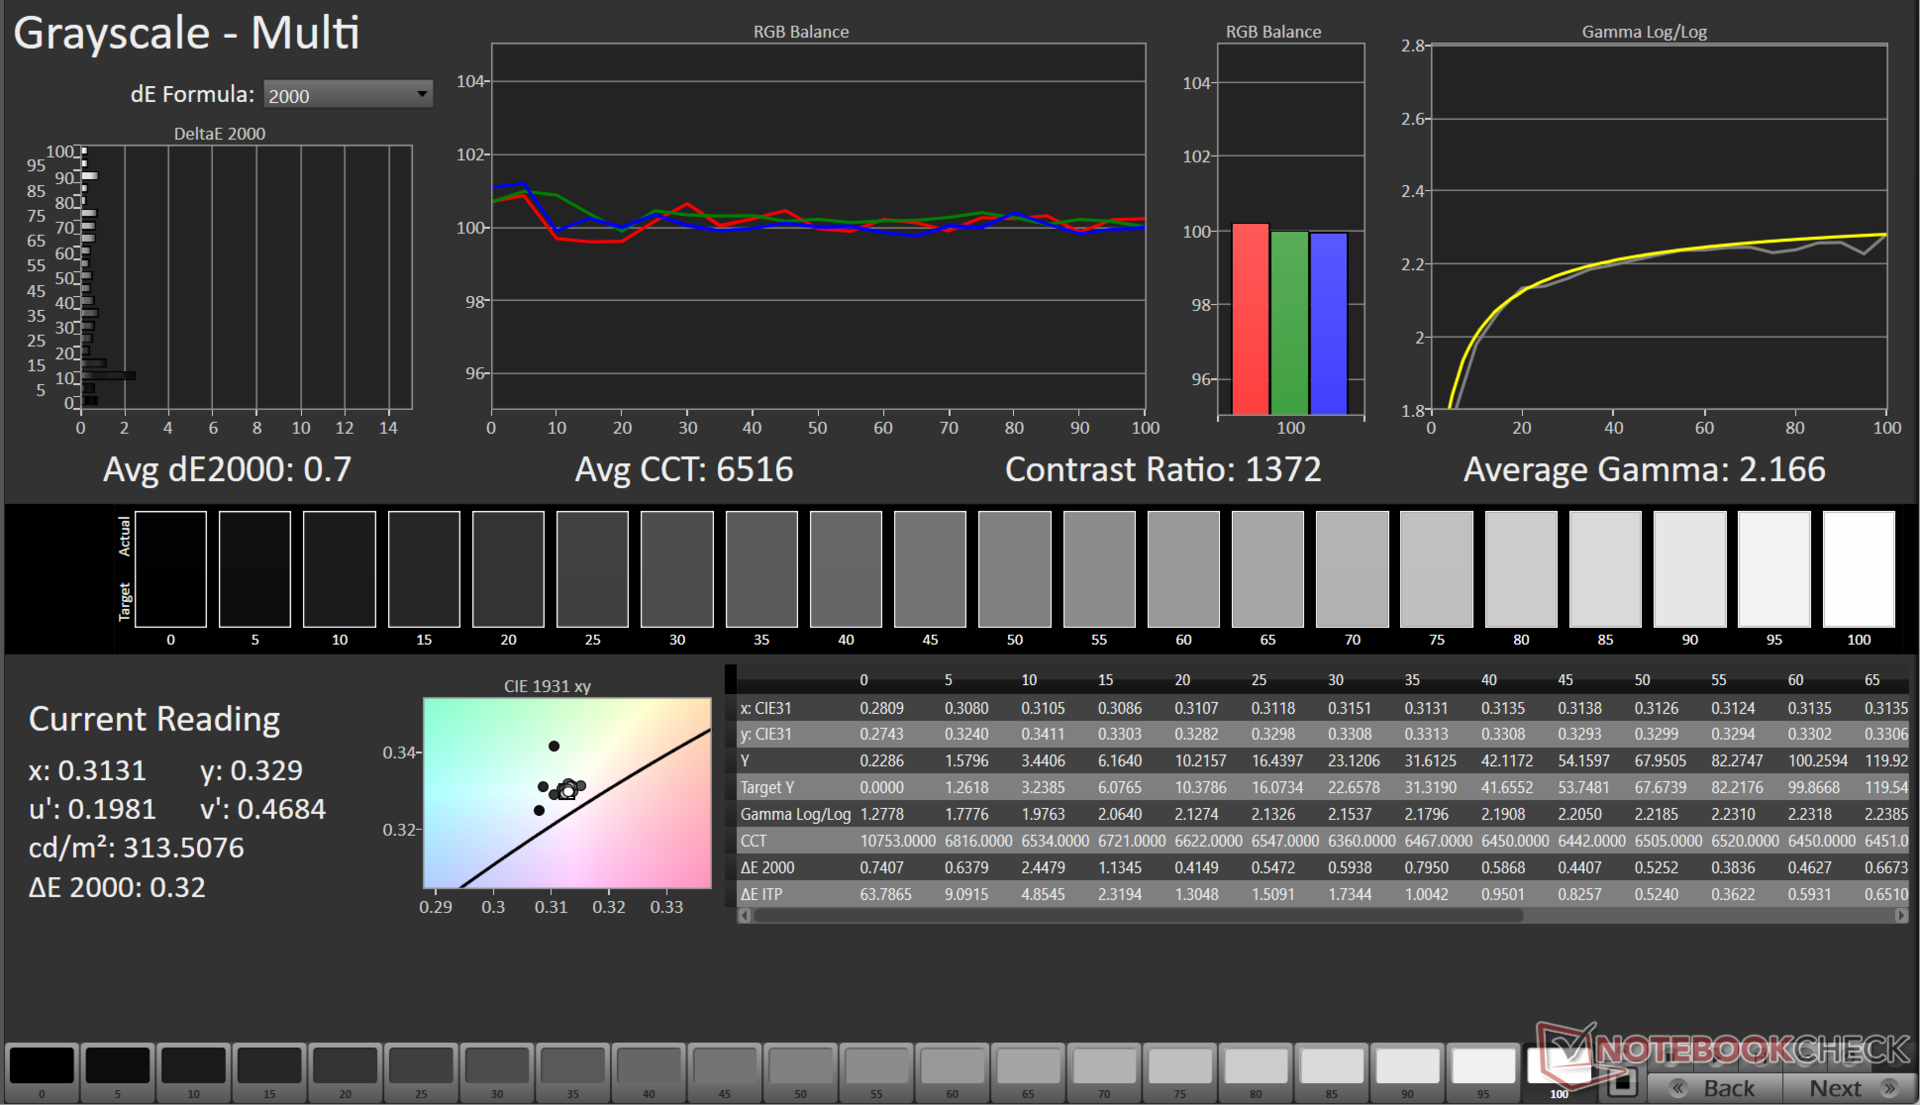
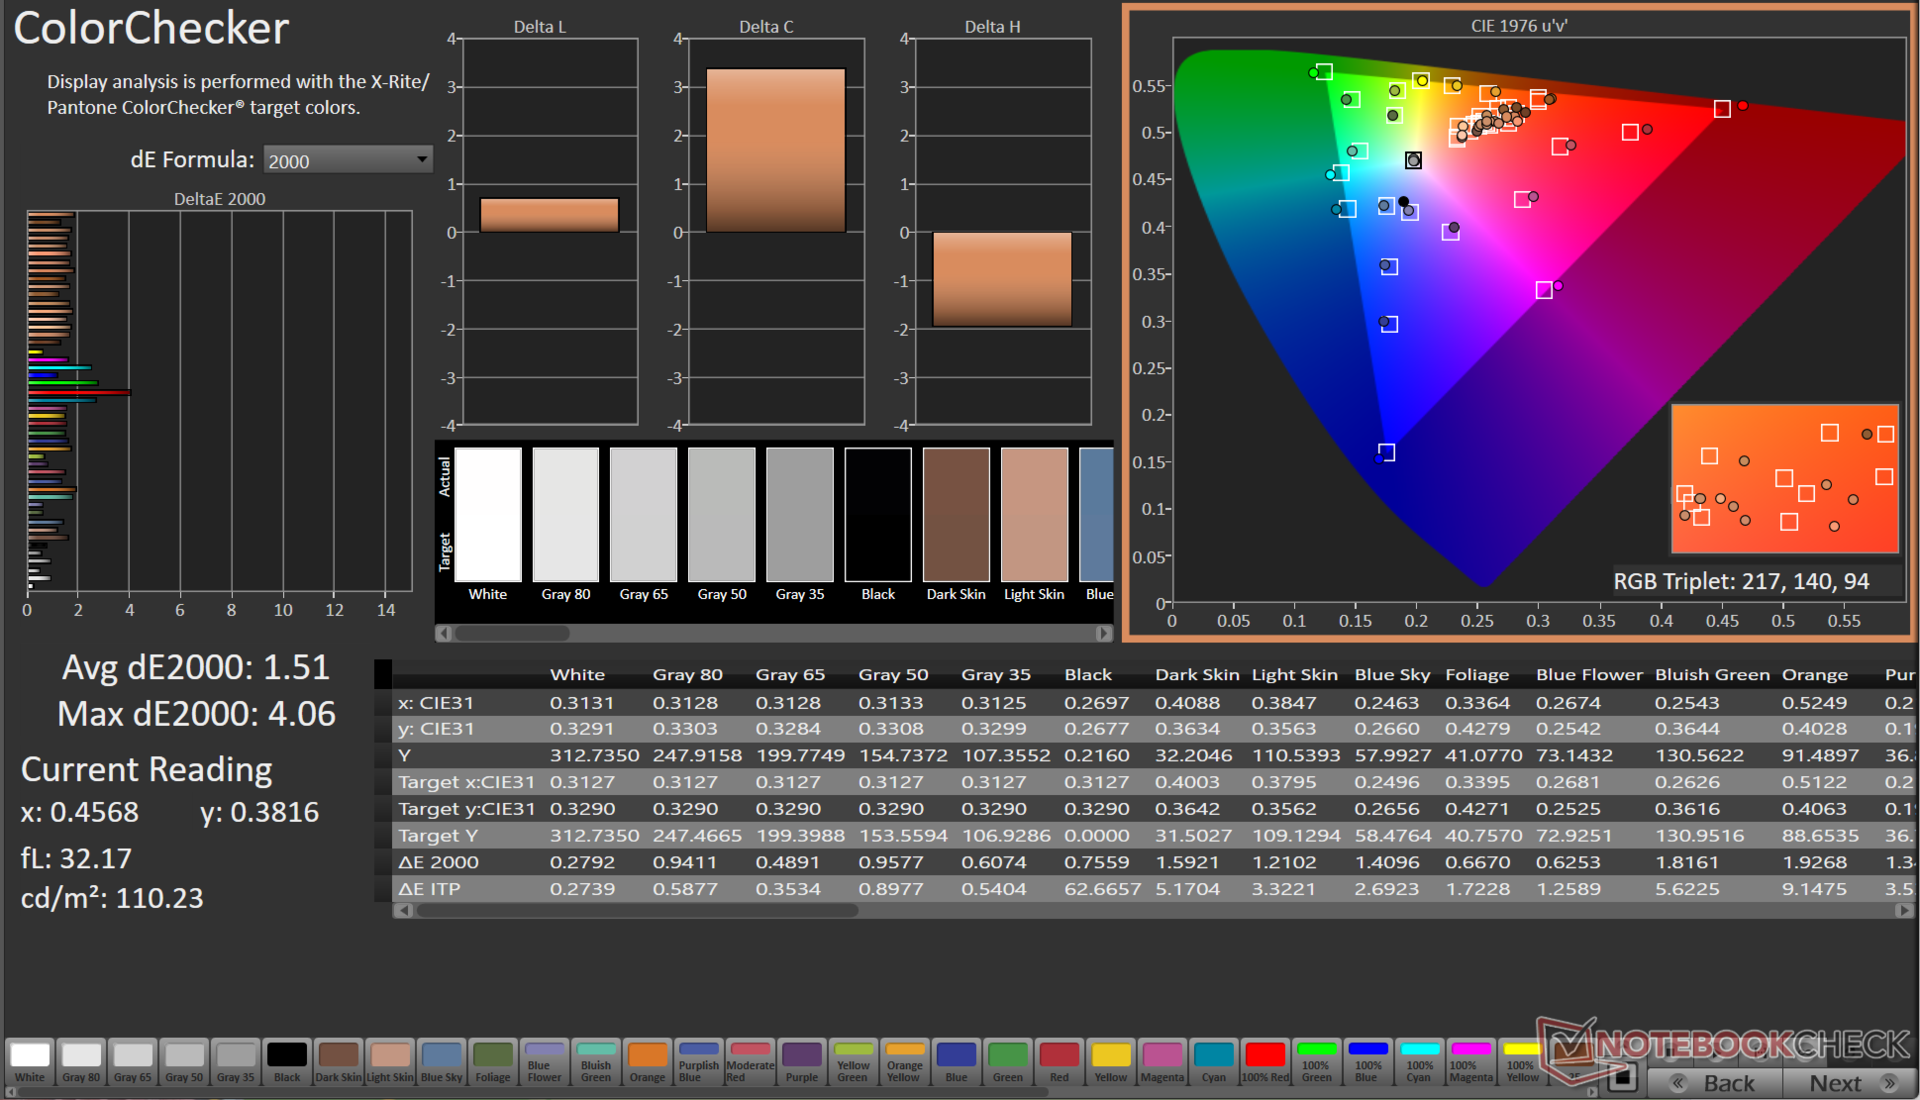
L'accuratezza del colore del G15 presenta deviazioni evidenti. Tuttavia, siamo riusciti a ottenere notevoli miglioramenti con la nostra routine di calibrazione utilizzando lo spettrofotometro X-Rite i1Basic Pro 3 e il software di calibrazione del colore Calman Ultimate di Portrait Display.
Il Delta E 2000 medio della scala di grigi è stato ridotto a 0,7, mentre il Delta E 2000 medio di ColorChecker è migliorato a 1,51.
Il file ICC calibrato può essere scaricato dal link qui sopra.


Tempi di risposta del Display
| ↔ Tempi di risposta dal Nero al Bianco | ||
|---|---|---|
| 5.35 ms ... aumenta ↗ e diminuisce ↘ combinato | ↗ 2.34 ms Incremento | 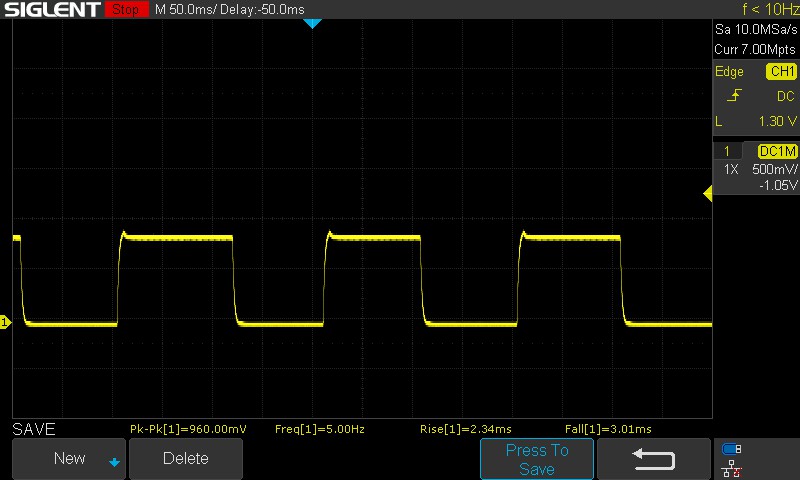 |
| ↘ 3.01 ms Calo | ||
| Lo schermo ha mostrato valori di risposta molto veloci nei nostri tests ed è molto adatto per i gaming veloce. In confronto, tutti i dispositivi di test variano da 0.1 (minimo) a 240 (massimo) ms. » 18 % di tutti i dispositivi è migliore. Questo significa che i tempi di risposta rilevati sono migliori rispettto alla media di tutti i dispositivi testati (19.8 ms). | ||
| ↔ Tempo di risposta dal 50% Grigio all'80% Grigio | ||
| 3.39 ms ... aumenta ↗ e diminuisce ↘ combinato | ↗ 1.4 ms Incremento | 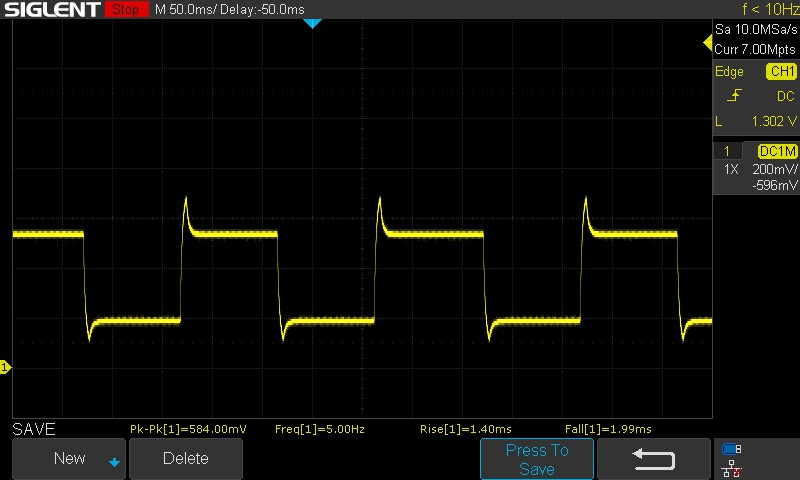 |
| ↘ 1.99 ms Calo | ||
| Lo schermo ha mostrato valori di risposta molto veloci nei nostri tests ed è molto adatto per i gaming veloce. In confronto, tutti i dispositivi di test variano da 0.165 (minimo) a 636 (massimo) ms. » 14 % di tutti i dispositivi è migliore. Questo significa che i tempi di risposta rilevati sono migliori rispettto alla media di tutti i dispositivi testati (31 ms). | ||
Sfarfallio dello schermo / PWM (Pulse-Width Modulation)
| flickering dello schermo / PWM rilevato | 21620 Hz | ≤ 100 % settaggio luminosita' | 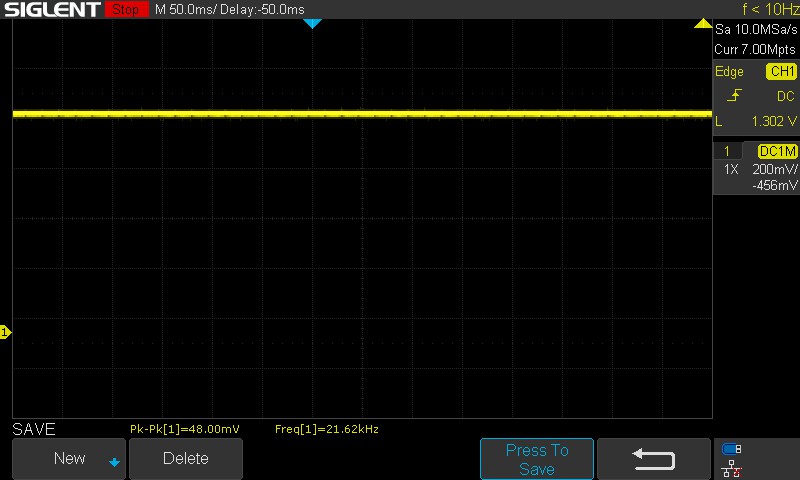 |
Il display sfarfalla a 21620 Hz (Probabilmente a causa dell'uso di PWM) Flickering rilevato ad una luminosita' di 100 % o inferiore. Non dovrebbe verificarsi flickering o PWM sopra questo valore di luminosita'. La frequenza di 21620 Hz è abbastanza alta, quindi la maggioranza degli utenti sensibili al PWM non dovrebbero notare alcun flickering. In confronto: 52 % di tutti i dispositivi testati non utilizza PWM per ridurre la luminosita' del display. Se è rilevato PWM, una media di 7757 (minimo: 5 - massimo: 343500) Hz è stata rilevata. | |||
Il pannello del G15 impiega l'overdrive per ottenere tempi di risposta inferiori. Vale la pena notare che non esiste un'opzione per disattivare l'overdrive del pannello attraverso l'Alienware Command Center.
Sebbene il pannello non utilizzi il PWM per la regolazione della luminosità, presenta comunque uno sfarfallio. Tuttavia, è improbabile che questo fenomeno provochi un significativo affaticamento degli occhi o un disagio per la maggior parte degli utenti a causa della sua elevata frequenza.
Per ulteriori informazioni, consultare il nostro articolo "Perché il PWM è un problema". Inoltre, la Tabella di classificazione PWM fornisce una panoramica delle frequenze PWM misurate su tutti i dispositivi recensiti finora.
La visione all'aperto non pone grossi problemi, a patto che non ci sia la luce diretta del sole sullo schermo. Gli angoli di visione sono ampi e relativamente stabili, a parte qualche perdita di luminosità percepibile agli estremi.

Prestazioni: Sulla falsariga di quanto previsto per una combinazione di Core i7-13650HX e RTX 4060
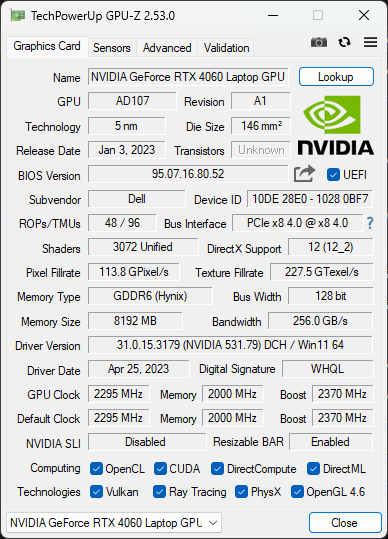
La nostra unità Dell G15 5530 è alimentata dal processore Intel Core i7-13650HX e dallaGPU per computer portatili Nvidia GeForce RTX 4060. A seconda della regione, gli acquirenti possono configurare questo laptop anche con un Core i5-13450HX e una RTX 3050 DA 6 GB o GPU RTX 4050.
Si noti che l'opzione RTX 3050 è disponibile solo in combinazione con il Core i5-13450HX.
Condizioni di test
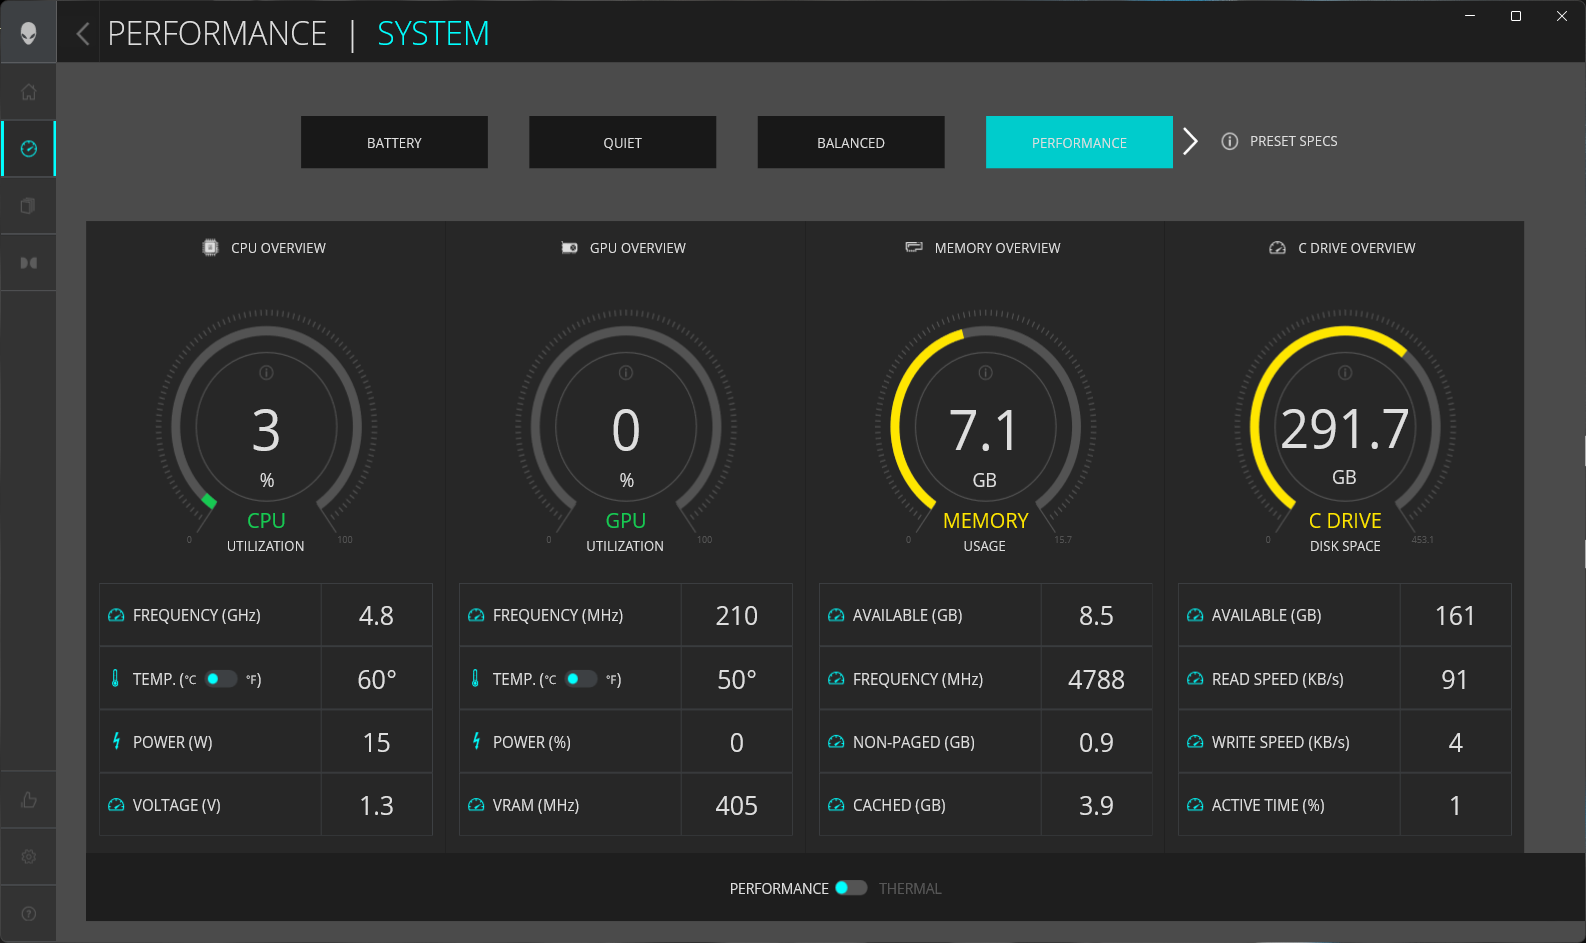
L'Alienware Command Center offre quattro preset di prestazioni predefiniti tra cui scegliere, ma consente anche agli utenti di creare e personalizzare i propri profili.
Abbiamo utilizzato la modalità Performance per tutti i benchmark e i test, ad eccezione della valutazione della durata della batteria per la quale abbiamo utilizzato il profilo Battery.
La tabella seguente illustra le variazioni della potenza di base del processore (PBP) e della potenza turbo massima (MTP) per ogni scenario:
| Modalità prestazioni | PL1 (PBP) / Tau | PL2 (MTP) / Tau | PL4 |
|---|---|---|---|
| Batteria | 55 W / 56 s | 157 W / 2,44 ms | 242 W |
| Silenzioso | 55 W / 56 s | 157 W / 2,44 ms | 242 W |
| Bilanciato | 157 W / 56 s | 157 W / 2,44 ms | 242 W |
| Performance | 191 W / 56 s | 191 W / 2,44 ms | 242 W |
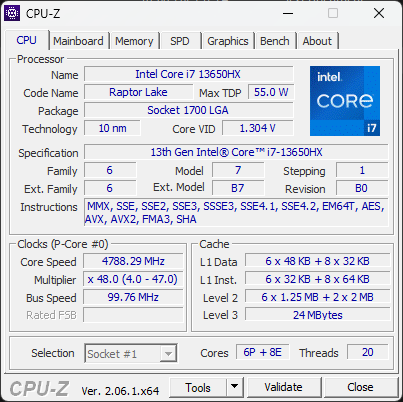
Processore
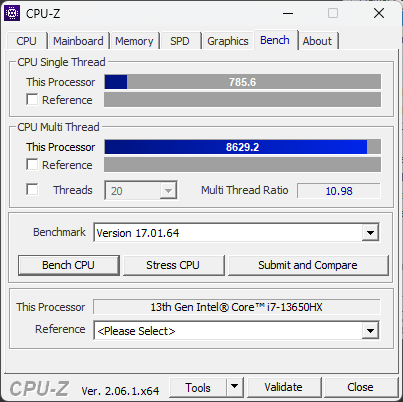
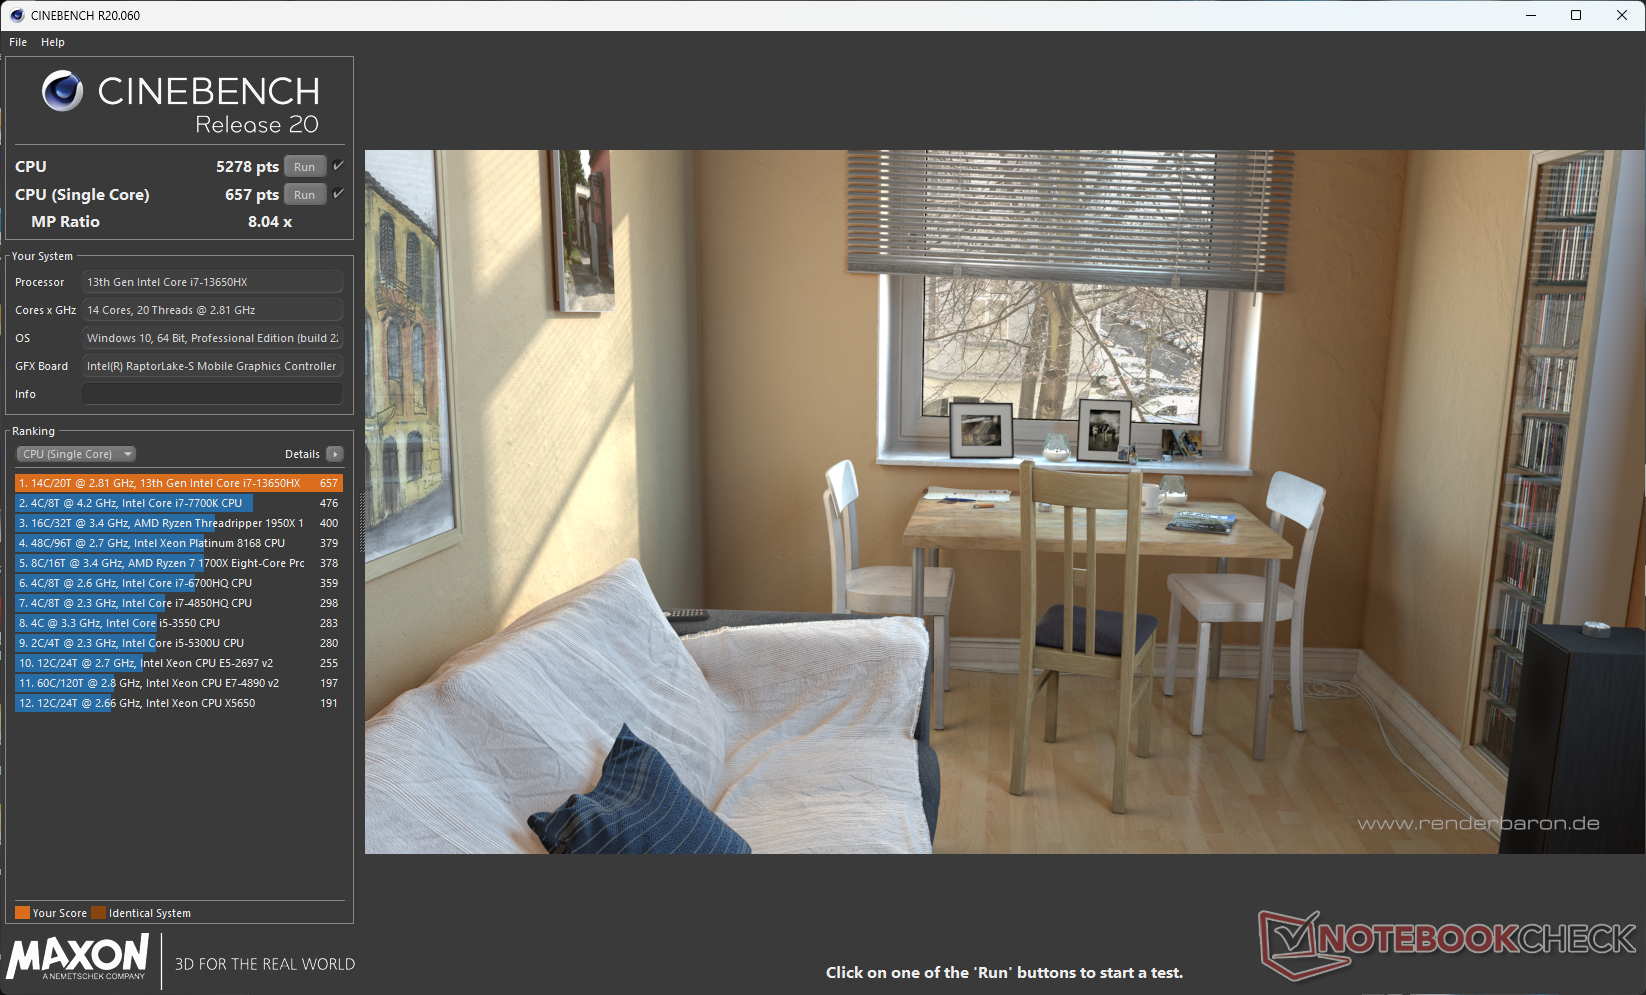
L'Intel Core i7-13650HX è un componente Raptor Lake-HX a 14 core e 20 thread che offre un boost single-core fino a 4,9 GHz sui suoi core P.
Nel test Cinebench R15 multi-core loop, il G15 5530 parte alla pari con l'Asus ROG Strix G18, che utilizza la stessa CPU. Tuttavia, si osserva un leggero throttling a metà del test. Per il resto, le prestazioni complessive della CPU sono quasi identiche in entrambi i modelli.
Il Core i7-13650HX del G15 5530 offre un buon vantaggio nei test multi-core rispetto al Ryzen 9 7940HS dell'Asus TUF Gaming A16 Recensione dell'Asus TUF Gaming A16 Advantage Edition FA617XS: Il portatile AMD con autonomia fino a 20 ore , ma quest'ultimo riesce a rimanere a distanza di sicurezza nelle prestazioni cumulative grazie agli elevati guadagni in single-core.
Cinebench R15 Multi Loop
Cinebench R23: Multi Core | Single Core
Cinebench R20: CPU (Multi Core) | CPU (Single Core)
Cinebench R15: CPU Multi 64Bit | CPU Single 64Bit
Blender: v2.79 BMW27 CPU
7-Zip 18.03: 7z b 4 | 7z b 4 -mmt1
Geekbench 5.5: Multi-Core | Single-Core
HWBOT x265 Benchmark v2.2: 4k Preset
LibreOffice : 20 Documents To PDF
R Benchmark 2.5: Overall mean
| CPU Performance rating | |
| Asus ROG Strix G17 G713PI | |
| Medion Erazer Major X20 | |
| Media della classe Gaming | |
| Asus ROG Flow X16 GV601V | |
| Dell G15 5530 | |
| Asus ROG Strix G18 G814JI | |
| Lenovo Legion Pro 5 16IRX8 | |
| Media Intel Core i7-13650HX | |
| Asus TUF Gaming A16 FA617XS | |
| MSI Katana 17 B13VFK | |
| Cinebench R23 / Multi Core | |
| Asus ROG Strix G17 G713PI | |
| Medion Erazer Major X20 | |
| Media della classe Gaming (10488 - 42661, n=107, ultimi 2 anni) | |
| Asus ROG Strix G18 G814JI | |
| Dell G15 5530 | |
| Media Intel Core i7-13650HX (18744 - 21006, n=6) | |
| Lenovo Legion Pro 5 16IRX8 | |
| Asus ROG Flow X16 GV601V | |
| Asus TUF Gaming A16 FA617XS | |
| MSI Katana 17 B13VFK | |
| Cinebench R23 / Single Core | |
| Medion Erazer Major X20 | |
| Asus ROG Flow X16 GV601V | |
| Media della classe Gaming (1166 - 2415, n=107, ultimi 2 anni) | |
| Asus ROG Strix G18 G814JI | |
| Asus ROG Strix G17 G713PI | |
| Dell G15 5530 | |
| Media Intel Core i7-13650HX (1693 - 1903, n=6) | |
| MSI Katana 17 B13VFK | |
| Asus TUF Gaming A16 FA617XS | |
| Lenovo Legion Pro 5 16IRX8 | |
| Cinebench R20 / CPU (Multi Core) | |
| Medion Erazer Major X20 | |
| Media della classe Gaming (4029 - 16433, n=106, ultimi 2 anni) | |
| Asus ROG Strix G17 G713PI | |
| Dell G15 5530 | |
| Asus ROG Strix G18 G814JI | |
| Media Intel Core i7-13650HX (7197 - 8021, n=5) | |
| Asus ROG Flow X16 GV601V | |
| Lenovo Legion Pro 5 16IRX8 | |
| Asus TUF Gaming A16 FA617XS | |
| MSI Katana 17 B13VFK | |
| Cinebench R20 / CPU (Single Core) | |
| Media della classe Gaming (442 - 913, n=106, ultimi 2 anni) | |
| Medion Erazer Major X20 | |
| Asus ROG Flow X16 GV601V | |
| Asus ROG Strix G18 G814JI | |
| Media Intel Core i7-13650HX (700 - 728, n=5) | |
| Asus ROG Strix G17 G713PI | |
| Dell G15 5530 | |
| Asus TUF Gaming A16 FA617XS | |
| MSI Katana 17 B13VFK | |
| Lenovo Legion Pro 5 16IRX8 | |
| Cinebench R15 / CPU Multi 64Bit | |
| Asus ROG Strix G17 G713PI | |
| Medion Erazer Major X20 | |
| Media della classe Gaming (1578 - 6330, n=105, ultimi 2 anni) | |
| Lenovo Legion Pro 5 16IRX8 | |
| Dell G15 5530 | |
| Asus ROG Strix G18 G814JI | |
| Asus ROG Flow X16 GV601V | |
| Media Intel Core i7-13650HX (2864 - 3147, n=5) | |
| Asus TUF Gaming A16 FA617XS | |
| MSI Katana 17 B13VFK | |
| Cinebench R15 / CPU Single 64Bit | |
| Medion Erazer Major X20 | |
| Media della classe Gaming (188.8 - 350, n=106, ultimi 2 anni) | |
| Asus ROG Strix G17 G713PI | |
| Asus ROG Flow X16 GV601V | |
| Asus TUF Gaming A16 FA617XS | |
| Asus ROG Strix G18 G814JI | |
| Dell G15 5530 | |
| Media Intel Core i7-13650HX (256 - 275, n=5) | |
| Lenovo Legion Pro 5 16IRX8 | |
| MSI Katana 17 B13VFK | |
| Blender / v2.79 BMW27 CPU | |
| MSI Katana 17 B13VFK | |
| Asus TUF Gaming A16 FA617XS | |
| Asus ROG Flow X16 GV601V | |
| Media Intel Core i7-13650HX (158 - 226, n=5) | |
| Dell G15 5530 | |
| Asus ROG Strix G18 G814JI | |
| Lenovo Legion Pro 5 16IRX8 | |
| Media della classe Gaming (79 - 330, n=104, ultimi 2 anni) | |
| Medion Erazer Major X20 | |
| Asus ROG Strix G17 G713PI | |
| 7-Zip 18.03 / 7z b 4 | |
| Asus ROG Strix G17 G713PI | |
| Medion Erazer Major X20 | |
| Media della classe Gaming (33491 - 148086, n=105, ultimi 2 anni) | |
| Asus ROG Strix G18 G814JI | |
| Lenovo Legion Pro 5 16IRX8 | |
| Dell G15 5530 | |
| Media Intel Core i7-13650HX (73927 - 80057, n=5) | |
| Asus ROG Flow X16 GV601V | |
| Asus TUF Gaming A16 FA617XS | |
| MSI Katana 17 B13VFK | |
| 7-Zip 18.03 / 7z b 4 -mmt1 | |
| Asus ROG Strix G17 G713PI | |
| Medion Erazer Major X20 | |
| Asus TUF Gaming A16 FA617XS | |
| Media della classe Gaming (4199 - 7436, n=105, ultimi 2 anni) | |
| Asus ROG Flow X16 GV601V | |
| Asus ROG Strix G18 G814JI | |
| Media Intel Core i7-13650HX (5828 - 6125, n=5) | |
| Dell G15 5530 | |
| MSI Katana 17 B13VFK | |
| Lenovo Legion Pro 5 16IRX8 | |
| Geekbench 5.5 / Multi-Core | |
| Medion Erazer Major X20 | |
| Asus ROG Strix G17 G713PI | |
| Media della classe Gaming (6460 - 28263, n=105, ultimi 2 anni) | |
| Asus ROG Strix G18 G814JI | |
| Lenovo Legion Pro 5 16IRX8 | |
| Dell G15 5530 | |
| Asus ROG Flow X16 GV601V | |
| Media Intel Core i7-13650HX (12509 - 14778, n=5) | |
| Asus TUF Gaming A16 FA617XS | |
| MSI Katana 17 B13VFK | |
| Geekbench 5.5 / Single-Core | |
| Media della classe Gaming (986 - 2474, n=105, ultimi 2 anni) | |
| Asus ROG Strix G17 G713PI | |
| Medion Erazer Major X20 | |
| Asus TUF Gaming A16 FA617XS | |
| Asus ROG Flow X16 GV601V | |
| Dell G15 5530 | |
| Media Intel Core i7-13650HX (1810 - 1866, n=5) | |
| Asus ROG Strix G18 G814JI | |
| MSI Katana 17 B13VFK | |
| Lenovo Legion Pro 5 16IRX8 | |
| HWBOT x265 Benchmark v2.2 / 4k Preset | |
| Asus ROG Strix G17 G713PI | |
| Medion Erazer Major X20 | |
| Media della classe Gaming (11.5 - 44.4, n=105, ultimi 2 anni) | |
| Lenovo Legion Pro 5 16IRX8 | |
| Asus ROG Strix G18 G814JI | |
| Dell G15 5530 | |
| Asus ROG Flow X16 GV601V | |
| Media Intel Core i7-13650HX (18.9 - 23.6, n=5) | |
| Asus TUF Gaming A16 FA617XS | |
| MSI Katana 17 B13VFK | |
| LibreOffice / 20 Documents To PDF | |
| Asus ROG Strix G18 G814JI | |
| MSI Katana 17 B13VFK | |
| Media della classe Gaming (33.2 - 88.8, n=105, ultimi 2 anni) | |
| Media Intel Core i7-13650HX (38.9 - 58.8, n=5) | |
| Dell G15 5530 | |
| Asus ROG Strix G17 G713PI | |
| Medion Erazer Major X20 | |
| Asus TUF Gaming A16 FA617XS | |
| Asus ROG Flow X16 GV601V | |
| Lenovo Legion Pro 5 16IRX8 | |
| R Benchmark 2.5 / Overall mean | |
| Lenovo Legion Pro 5 16IRX8 | |
| MSI Katana 17 B13VFK | |
| Asus ROG Strix G18 G814JI | |
| Media Intel Core i7-13650HX (0.4217 - 0.4461, n=6) | |
| Media della classe Gaming (0.3439 - 0.759, n=106, ultimi 2 anni) | |
| Dell G15 5530 | |
| Asus TUF Gaming A16 FA617XS | |
| Asus ROG Flow X16 GV601V | |
| Asus ROG Strix G17 G713PI | |
| Medion Erazer Major X20 | |
* ... Meglio usare valori piccoli
Il grafico seguente illustra come variano i parametri della CPU in ciascuna modalità di prestazioni durante un ciclo multi-core di Cinebench R15.
Le modalità Performance e Balanced mostrano clock di boost medi simili, intorno ai 3,6 GHz, mentre la modalità Quiet si accontenta di un boost medio di 2,6 GHz.
La modalità Balanced è più economica di circa 9 W rispetto a Performance in termini di assorbimento di picco del pacchetto CPU. Tuttavia, le temperature del core sono più o meno identiche in entrambe le preimpostazioni.
Vale la pena notare che la modalità Quiet consuma in media solo 50,5 W, ma comporta una perdita di prestazioni del 23%.
Con l'alimentazione a batteria, le prestazioni single-core di Cinebench R20 subiscono solo un calo del 7%. Tuttavia, il punteggio multi-core scende del 34%.
AIDA64: FP32 Ray-Trace | FPU Julia | CPU SHA3 | CPU Queen | FPU SinJulia | FPU Mandel | CPU AES | CPU ZLib | FP64 Ray-Trace | CPU PhotoWorxx
| Performance rating | |
| Asus ROG Strix G17 G713PI | |
| Media della classe Gaming | |
| Medion Erazer Major X20 | |
| Asus TUF Gaming A16 FA617XS | |
| Lenovo Legion Pro 5 16IRX8 | |
| Asus ROG Strix G18 G814JI | |
| Dell G15 5530 | |
| Media Intel Core i7-13650HX | |
| Asus ROG Flow X16 GV601V | |
| MSI Katana 17 B13VFK | |
| AIDA64 / FP32 Ray-Trace | |
| Asus ROG Strix G17 G713PI | |
| Media della classe Gaming (10227 - 85542, n=105, ultimi 2 anni) | |
| Asus TUF Gaming A16 FA617XS | |
| Medion Erazer Major X20 | |
| Lenovo Legion Pro 5 16IRX8 | |
| Asus ROG Strix G18 G814JI | |
| Dell G15 5530 | |
| Media Intel Core i7-13650HX (13404 - 20012, n=5) | |
| MSI Katana 17 B13VFK | |
| Asus ROG Flow X16 GV601V | |
| AIDA64 / FPU Julia | |
| Asus ROG Strix G17 G713PI | |
| Media della classe Gaming (51376 - 238426, n=105, ultimi 2 anni) | |
| Medion Erazer Major X20 | |
| Asus TUF Gaming A16 FA617XS | |
| Lenovo Legion Pro 5 16IRX8 | |
| Asus ROG Strix G18 G814JI | |
| Dell G15 5530 | |
| Media Intel Core i7-13650HX (68241 - 97317, n=5) | |
| Asus ROG Flow X16 GV601V | |
| MSI Katana 17 B13VFK | |
| AIDA64 / CPU SHA3 | |
| Asus ROG Strix G17 G713PI | |
| Media della classe Gaming (2180 - 10115, n=105, ultimi 2 anni) | |
| Medion Erazer Major X20 | |
| Lenovo Legion Pro 5 16IRX8 | |
| Asus TUF Gaming A16 FA617XS | |
| Asus ROG Strix G18 G814JI | |
| Dell G15 5530 | |
| Asus ROG Flow X16 GV601V | |
| Media Intel Core i7-13650HX (3127 - 4487, n=5) | |
| MSI Katana 17 B13VFK | |
| AIDA64 / CPU Queen | |
| Asus ROG Strix G17 G713PI | |
| Medion Erazer Major X20 | |
| Asus TUF Gaming A16 FA617XS | |
| Media della classe Gaming (49785 - 173351, n=90, ultimi 2 anni) | |
| Lenovo Legion Pro 5 16IRX8 | |
| Asus ROG Flow X16 GV601V | |
| Asus ROG Strix G18 G814JI | |
| Media Intel Core i7-13650HX (108627 - 110589, n=5) | |
| Dell G15 5530 | |
| MSI Katana 17 B13VFK | |
| AIDA64 / FPU SinJulia | |
| Asus ROG Strix G17 G713PI | |
| Asus TUF Gaming A16 FA617XS | |
| Medion Erazer Major X20 | |
| Media della classe Gaming (4424 - 33636, n=105, ultimi 2 anni) | |
| Lenovo Legion Pro 5 16IRX8 | |
| Asus ROG Flow X16 GV601V | |
| Dell G15 5530 | |
| Asus ROG Strix G18 G814JI | |
| Media Intel Core i7-13650HX (9134 - 10887, n=5) | |
| MSI Katana 17 B13VFK | |
| AIDA64 / FPU Mandel | |
| Asus ROG Strix G17 G713PI | |
| Media della classe Gaming (25115 - 128721, n=105, ultimi 2 anni) | |
| Asus TUF Gaming A16 FA617XS | |
| Medion Erazer Major X20 | |
| Lenovo Legion Pro 5 16IRX8 | |
| Asus ROG Strix G18 G814JI | |
| Dell G15 5530 | |
| Media Intel Core i7-13650HX (33391 - 48323, n=5) | |
| Asus ROG Flow X16 GV601V | |
| MSI Katana 17 B13VFK | |
| AIDA64 / CPU AES | |
| Asus ROG Strix G17 G713PI | |
| Medion Erazer Major X20 | |
| Media della classe Gaming (39258 - 247074, n=105, ultimi 2 anni) | |
| Lenovo Legion Pro 5 16IRX8 | |
| Asus TUF Gaming A16 FA617XS | |
| Dell G15 5530 | |
| Asus ROG Strix G18 G814JI | |
| Asus ROG Flow X16 GV601V | |
| Media Intel Core i7-13650HX (64436 - 85343, n=5) | |
| MSI Katana 17 B13VFK | |
| AIDA64 / CPU ZLib | |
| Asus ROG Strix G17 G713PI | |
| Medion Erazer Major X20 | |
| Media della classe Gaming (574 - 2531, n=105, ultimi 2 anni) | |
| Lenovo Legion Pro 5 16IRX8 | |
| Dell G15 5530 | |
| Asus ROG Strix G18 G814JI | |
| Media Intel Core i7-13650HX (1136 - 1285, n=5) | |
| Asus ROG Flow X16 GV601V | |
| Asus TUF Gaming A16 FA617XS | |
| MSI Katana 17 B13VFK | |
| AIDA64 / FP64 Ray-Trace | |
| Asus ROG Strix G17 G713PI | |
| Media della classe Gaming (5509 - 45446, n=105, ultimi 2 anni) | |
| Asus TUF Gaming A16 FA617XS | |
| Medion Erazer Major X20 | |
| Lenovo Legion Pro 5 16IRX8 | |
| Asus ROG Strix G18 G814JI | |
| Dell G15 5530 | |
| Media Intel Core i7-13650HX (7270 - 10900, n=5) | |
| Asus ROG Flow X16 GV601V | |
| MSI Katana 17 B13VFK | |
| AIDA64 / CPU PhotoWorxx | |
| Media della classe Gaming (12271 - 89891, n=105, ultimi 2 anni) | |
| Medion Erazer Major X20 | |
| Asus ROG Strix G18 G814JI | |
| Media Intel Core i7-13650HX (36170 - 43289, n=5) | |
| Asus ROG Flow X16 GV601V | |
| Dell G15 5530 | |
| Lenovo Legion Pro 5 16IRX8 | |
| MSI Katana 17 B13VFK | |
| Asus ROG Strix G17 G713PI | |
| Asus TUF Gaming A16 FA617XS | |
Il nostro Intel Core i7-13650HX offre ulteriori informazioni e confronti delle prestazioni.
Prestazioni del sistema
Il G15 5530 ottiene un punteggio complessivo PCMark 10 inferiore rispetto alla concorrenza, ma non abbiamo riscontrato alcun intoppo nel calcolo generale.
Il MSI Katana 17 con un Core i7-13620H riesce a superare leggermente il G15 5530 nei punteggi complessivi di PCMark 10 e CrossMark.
CrossMark: Overall | Productivity | Creativity | Responsiveness
AIDA64: Memory Copy | Memory Read | Memory Write | Memory Latency
| PCMark 10 / Score | |
| Media della classe Gaming (5828 - 12414, n=93, ultimi 2 anni) | |
| Asus TUF Gaming A16 FA617XS | |
| Asus ROG Flow X16 GV601V | |
| Lenovo Legion Pro 5 16IRX8 | |
| Medion Erazer Major X20 | |
| Asus ROG Strix G17 G713PI | |
| Media Intel Core i7-13650HX, NVIDIA GeForce RTX 4060 Laptop GPU (6984 - 7613, n=3) | |
| MSI Katana 17 B13VFK | |
| Dell G15 5530 | |
| Asus ROG Strix G18 G814JI | |
| PCMark 10 / Essentials | |
| Medion Erazer Major X20 | |
| Asus ROG Flow X16 GV601V | |
| Asus ROG Strix G17 G713PI | |
| Dell G15 5530 | |
| Lenovo Legion Pro 5 16IRX8 | |
| Asus TUF Gaming A16 FA617XS | |
| MSI Katana 17 B13VFK | |
| Media della classe Gaming (8810 - 11935, n=97, ultimi 2 anni) | |
| Media Intel Core i7-13650HX, NVIDIA GeForce RTX 4060 Laptop GPU (9532 - 11151, n=3) | |
| Asus ROG Strix G18 G814JI | |
| PCMark 10 / Productivity | |
| Media della classe Gaming (6845 - 25323, n=95, ultimi 2 anni) | |
| Asus ROG Strix G17 G713PI | |
| Asus TUF Gaming A16 FA617XS | |
| Asus ROG Flow X16 GV601V | |
| Media Intel Core i7-13650HX, NVIDIA GeForce RTX 4060 Laptop GPU (9961 - 10204, n=3) | |
| Dell G15 5530 | |
| Medion Erazer Major X20 | |
| MSI Katana 17 B13VFK | |
| Lenovo Legion Pro 5 16IRX8 | |
| Asus ROG Strix G18 G814JI | |
| PCMark 10 / Digital Content Creation | |
| Media della classe Gaming (7602 - 19954, n=95, ultimi 2 anni) | |
| Lenovo Legion Pro 5 16IRX8 | |
| Asus TUF Gaming A16 FA617XS | |
| Asus ROG Flow X16 GV601V | |
| Media Intel Core i7-13650HX, NVIDIA GeForce RTX 4060 Laptop GPU (8323 - 11686, n=3) | |
| Medion Erazer Major X20 | |
| MSI Katana 17 B13VFK | |
| Asus ROG Strix G17 G713PI | |
| Dell G15 5530 | |
| Asus ROG Strix G18 G814JI | |
| CrossMark / Overall | |
| Asus ROG Strix G17 G713PI | |
| Media della classe Gaming (1366 - 2409, n=94, ultimi 2 anni) | |
| Asus ROG Flow X16 GV601V | |
| Media Intel Core i7-13650HX, NVIDIA GeForce RTX 4060 Laptop GPU (1839 - 1951, n=3) | |
| MSI Katana 17 B13VFK | |
| Medion Erazer Major X20 | |
| Dell G15 5530 | |
| Asus TUF Gaming A16 FA617XS | |
| Lenovo Legion Pro 5 16IRX8 | |
| CrossMark / Productivity | |
| Asus ROG Strix G17 G713PI | |
| Asus ROG Flow X16 GV601V | |
| Media della classe Gaming (1386 - 2254, n=94, ultimi 2 anni) | |
| Media Intel Core i7-13650HX, NVIDIA GeForce RTX 4060 Laptop GPU (1730 - 1864, n=3) | |
| MSI Katana 17 B13VFK | |
| Dell G15 5530 | |
| Asus TUF Gaming A16 FA617XS | |
| Medion Erazer Major X20 | |
| Lenovo Legion Pro 5 16IRX8 | |
| CrossMark / Creativity | |
| Asus ROG Strix G17 G713PI | |
| Media della classe Gaming (1343 - 2786, n=94, ultimi 2 anni) | |
| Asus ROG Flow X16 GV601V | |
| Medion Erazer Major X20 | |
| Dell G15 5530 | |
| Media Intel Core i7-13650HX, NVIDIA GeForce RTX 4060 Laptop GPU (2020 - 2063, n=3) | |
| MSI Katana 17 B13VFK | |
| Asus TUF Gaming A16 FA617XS | |
| Lenovo Legion Pro 5 16IRX8 | |
| CrossMark / Responsiveness | |
| MSI Katana 17 B13VFK | |
| Media Intel Core i7-13650HX, NVIDIA GeForce RTX 4060 Laptop GPU (1544 - 1907, n=3) | |
| Media della classe Gaming (1226 - 2334, n=94, ultimi 2 anni) | |
| Asus ROG Flow X16 GV601V | |
| Asus ROG Strix G17 G713PI | |
| Lenovo Legion Pro 5 16IRX8 | |
| Medion Erazer Major X20 | |
| Dell G15 5530 | |
| Asus TUF Gaming A16 FA617XS | |
| AIDA64 / Memory Copy | |
| Media della classe Gaming (21750 - 129946, n=105, ultimi 2 anni) | |
| Medion Erazer Major X20 | |
| Asus ROG Strix G18 G814JI | |
| Asus ROG Flow X16 GV601V | |
| Asus TUF Gaming A16 FA617XS | |
| Media Intel Core i7-13650HX, NVIDIA GeForce RTX 4060 Laptop GPU (59266 - 59896, n=3) | |
| Dell G15 5530 | |
| Lenovo Legion Pro 5 16IRX8 | |
| MSI Katana 17 B13VFK | |
| Asus ROG Strix G17 G713PI | |
| AIDA64 / Memory Read | |
| Media della classe Gaming (22956 - 118858, n=105, ultimi 2 anni) | |
| Medion Erazer Major X20 | |
| Asus ROG Strix G18 G814JI | |
| Asus ROG Flow X16 GV601V | |
| Media Intel Core i7-13650HX, NVIDIA GeForce RTX 4060 Laptop GPU (67305 - 68612, n=3) | |
| Dell G15 5530 | |
| Lenovo Legion Pro 5 16IRX8 | |
| MSI Katana 17 B13VFK | |
| Asus TUF Gaming A16 FA617XS | |
| Asus ROG Strix G17 G713PI | |
| AIDA64 / Memory Write | |
| Media della classe Gaming (22297 - 135096, n=105, ultimi 2 anni) | |
| Asus TUF Gaming A16 FA617XS | |
| Lenovo Legion Pro 5 16IRX8 | |
| Medion Erazer Major X20 | |
| Asus ROG Flow X16 GV601V | |
| Asus ROG Strix G18 G814JI | |
| Dell G15 5530 | |
| Media Intel Core i7-13650HX, NVIDIA GeForce RTX 4060 Laptop GPU (58028 - 60298, n=3) | |
| Asus ROG Strix G17 G713PI | |
| MSI Katana 17 B13VFK | |
| AIDA64 / Memory Latency | |
| Media della classe Gaming (75.3 - 259, n=105, ultimi 2 anni) | |
| MSI Katana 17 B13VFK | |
| Asus ROG Flow X16 GV601V | |
| Dell G15 5530 | |
| Medion Erazer Major X20 | |
| Media Intel Core i7-13650HX, NVIDIA GeForce RTX 4060 Laptop GPU (90.4 - 90.8, n=3) | |
| Asus TUF Gaming A16 FA617XS | |
| Asus ROG Strix G17 G713PI | |
| Asus ROG Strix G18 G814JI | |
| Lenovo Legion Pro 5 16IRX8 | |
* ... Meglio usare valori piccoli
| PCMark 8 Home Score Accelerated v2 | 4748 punti | |
| PCMark 8 Work Score Accelerated v2 | 6712 punti | |
| PCMark 10 Score | 6984 punti | |
Aiuto | ||
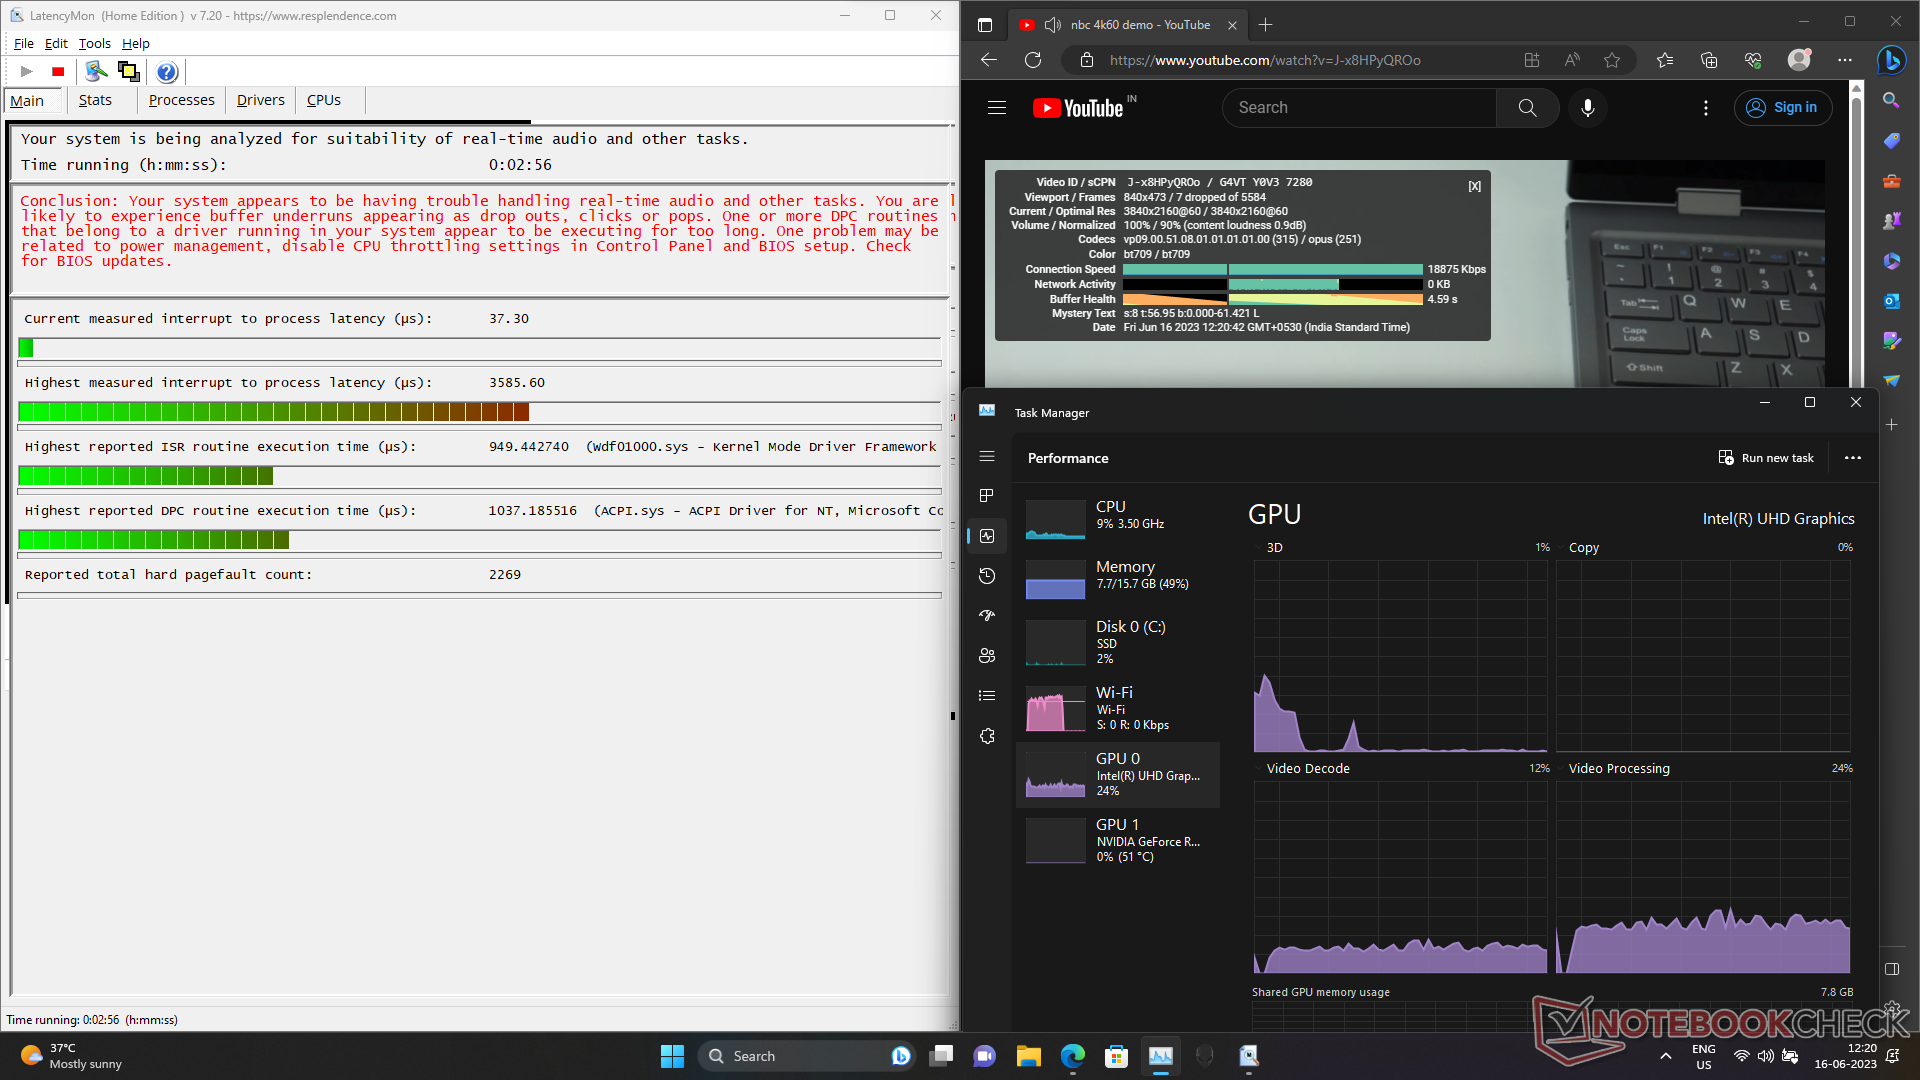
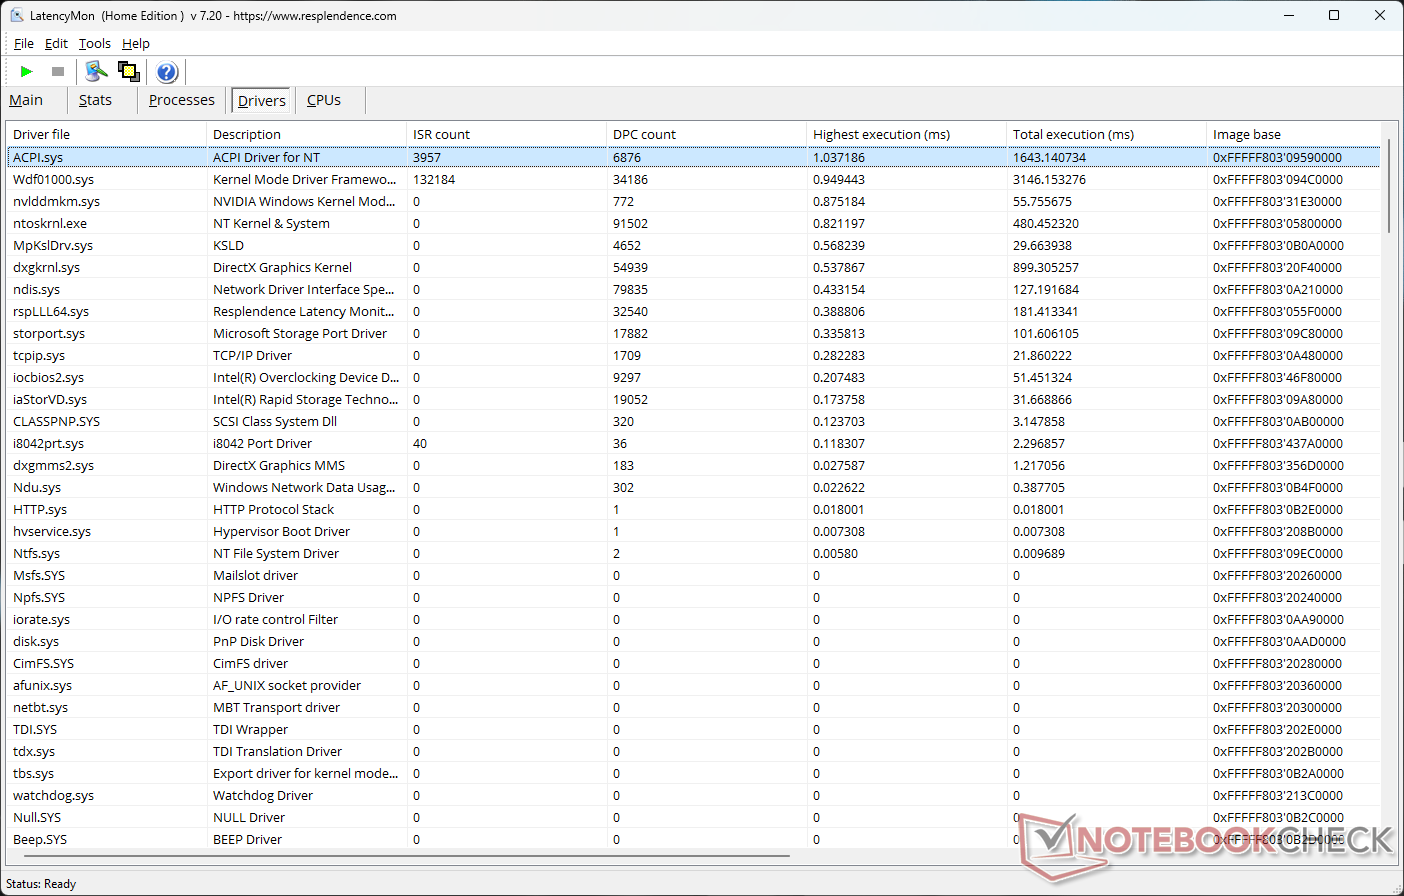
Latenza DPC
Il G15 5530 soffre di un'elevata latenza di interrupt-to-process, pari a 3585,6 µs, dovuta agli alti tempi di esecuzione del driver ACPI.sys.
| DPC Latencies / LatencyMon - interrupt to process latency (max), Web, Youtube, Prime95 | |
| Dell G15 5530 | |
| MSI Katana 17 B13VFK | |
| Medion Erazer Major X20 | |
| Asus ROG Strix G17 G713PI | |
| Asus ROG Flow X16 GV601V | |
| Asus TUF Gaming A16 FA617XS | |
| Asus ROG Strix G18 G814JI | |
| Lenovo Legion Pro 5 16IRX8 | |
* ... Meglio usare valori piccoli
Dispositivi di archiviazione
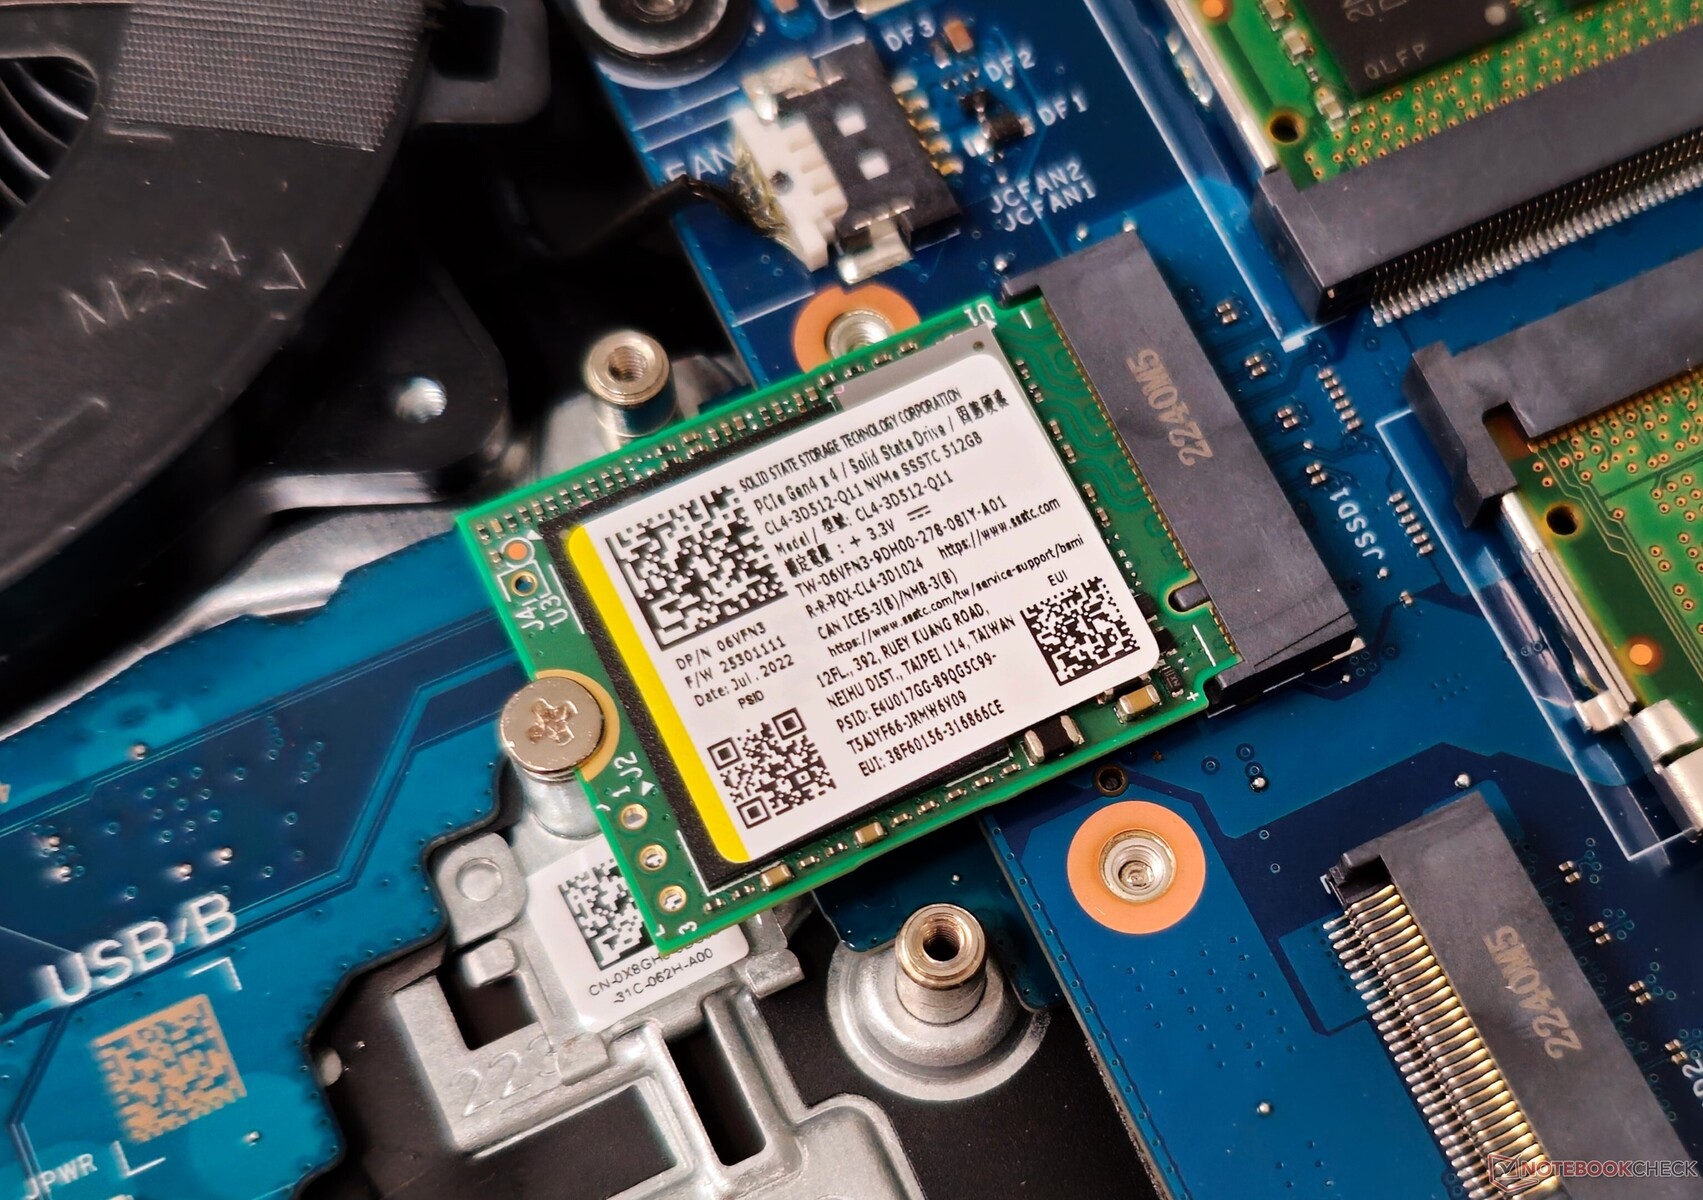
Dell offre due slot M.2 2242 per le unità di archiviazione, invece dei più comuni M.2 2280.
Gli utenti dovrebbero aggiornare l'unità se intendono installare un gran numero di giochi, poiché l'immagine di fabbrica offre solo 398 GB liberi su una capacità di 512 GB.
Con letture sequenziali inferiori a 3.000 MB/s e scritture sequenziali intorno ai 500 MB/s, le prestazioni dell'unità SSTC CL4 sono tutt'altro che impressionanti.
Non c'è spazio per l'espansione dello storage tramite unità SATA da 2,5 pollici.

* ... Meglio usare valori piccoli
L'unità SSD offre letture sostenute con una profondità di coda di 8, ma solo dopo che le prestazioni sono diminuite drasticamente nel decimo ciclo.
Disk Throttling: DiskSpd Read Loop, Queue Depth 8
Prestazioni della GPU
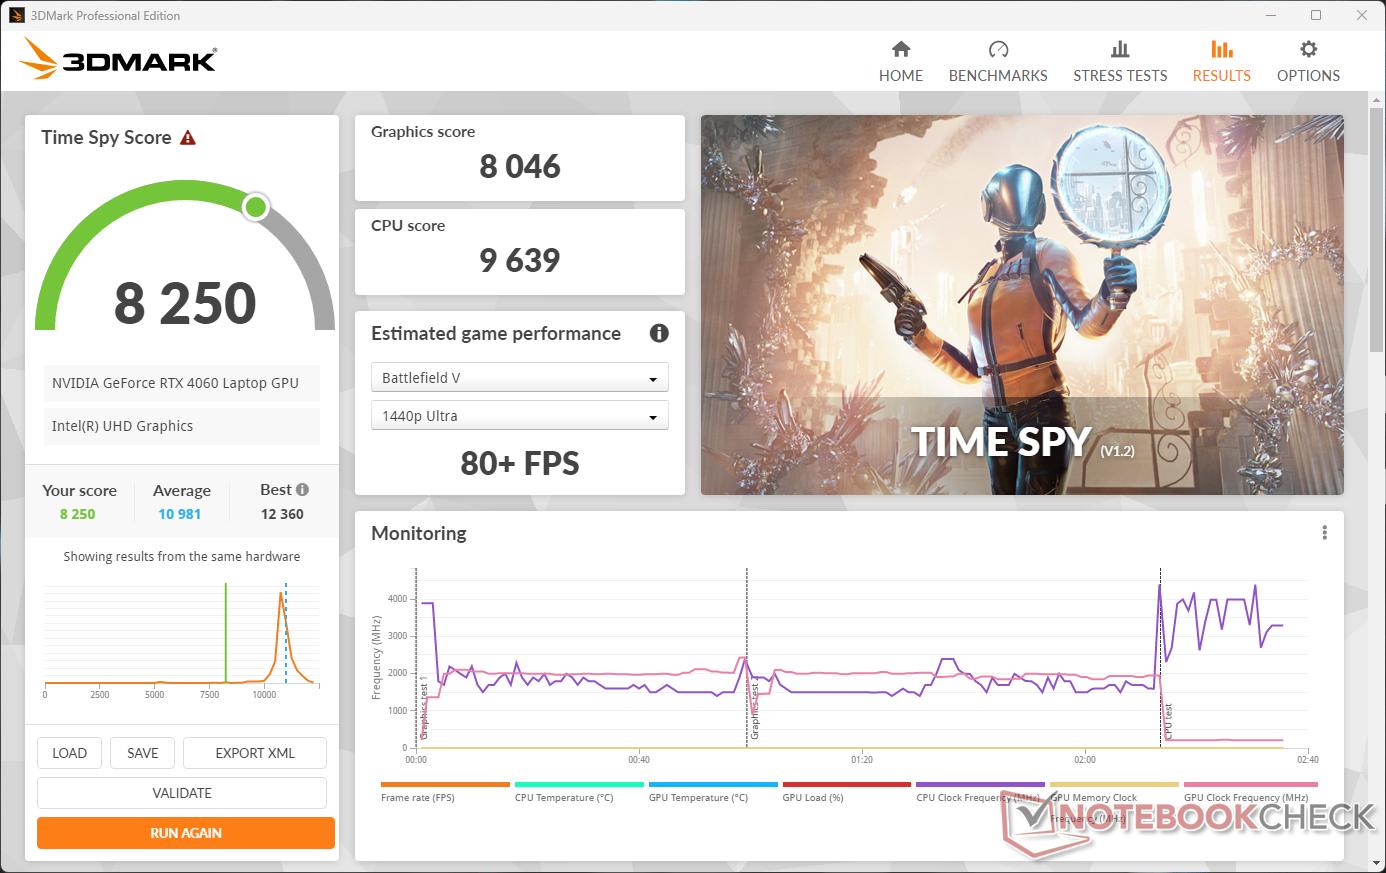
La GPU Nvidia GeForce RTX 4060 Laptop da 140 W si comporta come previsto nei test 3DMark cumulativi. È interessante notare che l'MSI Katana 17 con RTX 4060 da 105 W ha un leggero vantaggio sulle prestazioni rispetto agli altri laptop con RTX 4060 nel confronto.
D'altra parte, il G15 5530 compensa questa differenza di prestazioni nei test di Blender.
punteggio 3DMark Time Spy Il punteggio grafico cala del 24% con l'alimentazione a batteria.
| 3DMark 11 Performance | 32321 punti | |
| 3DMark Ice Storm Standard Score | 242288 punti | |
| 3DMark Cloud Gate Standard Score | 66116 punti | |
| 3DMark Fire Strike Score | 24323 punti | |
| 3DMark Fire Strike Extreme Score | 12237 punti | |
| 3DMark Time Spy Score | 11007 punti | |
Aiuto | ||
| Blender / v3.3 Classroom OPTIX/RTX | |
| MSI Katana 17 B13VFK | |
| Asus ROG Strix G18 G814JI | |
| Media NVIDIA GeForce RTX 4060 Laptop GPU (19 - 28, n=53) | |
| Asus ROG Flow X16 GV601V | |
| Lenovo Legion Pro 5 16IRX8 | |
| Dell G15 5530 | |
| Asus ROG Strix G17 G713PI | |
| Medion Erazer Major X20 | |
| Media della classe Gaming (9 - 32, n=106, ultimi 2 anni) | |
| Blender / v3.3 Classroom CUDA | |
| MSI Katana 17 B13VFK | |
| Media NVIDIA GeForce RTX 4060 Laptop GPU (39 - 53, n=53) | |
| Asus ROG Flow X16 GV601V | |
| Dell G15 5530 | |
| Lenovo Legion Pro 5 16IRX8 | |
| Asus ROG Strix G18 G814JI | |
| Asus ROG Strix G17 G713PI | |
| Medion Erazer Major X20 | |
| Media della classe Gaming (15 - 228, n=106, ultimi 2 anni) | |
| Blender / v3.3 Classroom CPU | |
| MSI Katana 17 B13VFK | |
| Asus ROG Flow X16 GV601V | |
| Media NVIDIA GeForce RTX 4060 Laptop GPU (189 - 452, n=53) | |
| Asus TUF Gaming A16 FA617XS | |
| Dell G15 5530 | |
| Asus ROG Strix G18 G814JI | |
| Lenovo Legion Pro 5 16IRX8 | |
| Media della classe Gaming (122 - 565, n=102, ultimi 2 anni) | |
| Medion Erazer Major X20 | |
| Asus ROG Strix G17 G713PI | |
* ... Meglio usare valori piccoli
Prestazioni di gioco
La GPU RTX 4060 Laptop è in grado di raggiungere fotogrammi al secondo (fps) a tre cifre in giochi relativamente vecchi con impostazioni 1080p Ultra. Anche nei giochi più recenti, è in grado di offrire costantemente frame rate ben superiori a 60 fps a 1080p Ultra.
Per gli utenti interessati a giocare a risoluzioni più elevate utilizzando un monitor esterno, l'attivazione di Nvidia DLSS (Deep Learning Super Sampling) o AMD FSR (FidelityFX Super Resolution) nei titoli supportati può fornire un buon incremento di fps.
| The Witcher 3 - 1920x1080 Ultra Graphics & Postprocessing (HBAO+) | |
| Media della classe Gaming (104.7 - 240, n=7, ultimi 2 anni) | |
| Medion Erazer Major X20 | |
| Asus ROG Strix G17 G713PI | |
| Asus ROG Strix G18 G814JI | |
| Lenovo Legion Pro 5 16IRX8 | |
| Asus ROG Flow X16 GV601V | |
| MSI Katana 17 B13VFK | |
| Dell G15 5530 | |
| Asus TUF Gaming A16 FA617XS | |
| Cyberpunk 2077 1.6 | |
| 1920x1080 High Preset | |
| Lenovo Legion Pro 5 16IRX8 | |
| Dell G15 5530 | |
| Asus ROG Strix G17 G713PI | |
| Asus ROG Flow X16 GV601V | |
| Media NVIDIA GeForce RTX 4060 Laptop GPU (63.5 - 114.9, n=16) | |
| 1920x1080 Ultra Preset | |
| Lenovo Legion Pro 5 16IRX8 | |
| Asus ROG Strix G17 G713PI | |
| Dell G15 5530 | |
| Asus ROG Flow X16 GV601V | |
| Media NVIDIA GeForce RTX 4060 Laptop GPU (57.9 - 93.2, n=18) | |
| MSI Katana 17 B13VFK | |
| 1920x1080 Ray Tracing Ultra Preset (DLSS off) | |
| Media NVIDIA GeForce RTX 4060 Laptop GPU (25.6 - 60, n=6) | |
| Dell G15 5530 | |
| Asus ROG Flow X16 GV601V | |
| MSI Katana 17 B13VFK | |
Il grafico FPS di Witcher 3
Il sistema di raffreddamento del G15 5530 sembra essere abbastanza efficace, come dimostrano i frame rate relativamente stabili visti di seguito in Il Witcher 3 stress test.
| basso | medio | alto | ultra | |
|---|---|---|---|---|
| GTA V (2015) | 182.6 | 175.3 | 172.8 | 111.8 |
| The Witcher 3 (2015) | 407 | 335 | 205 | 104.6 |
| Dota 2 Reborn (2015) | 179.9 | 163.8 | 154.9 | 144.8 |
| Final Fantasy XV Benchmark (2018) | 212 | 137.3 | 100.1 | |
| X-Plane 11.11 (2018) | 160.1 | 146.8 | 115.6 | |
| Far Cry 5 (2018) | 168 | 152 | 146 | 139 |
| Strange Brigade (2018) | 467 | 281 | 222 | 189.6 |
| Cyberpunk 2077 1.6 (2022) | 123.2 | 99.4 | 86.1 | 80 |
| F1 22 (2022) | 244 | 235 | 177.7 | 66.1 |
Date un'occhiata al nostro sito dedicato GPU per computer portatili Nvidia GeForce RTX 4060 per ulteriori confronti sulle prestazioni.
Emissioni: Diventa bollente quando è stressato
Rumore del sistema
Sotto carico, il G15 può generare emissioni acustiche appena al di sotto dei 50 dB(A). È interessante notare che la modalità Quiet produce un livello di pressione sonora (SPL) più elevato rispetto alle modalità Balanced e Performance, anche con un carico leggero di 3DMark 06. Detto questo, il rumore massimo della ventola rimane inferiore a 40 dB(A) in questo profilo.
Non sono stati osservati grossi regressi delle prestazioni tra i diversi profili quando è stato testato con The Witcher 3 a 1080p Ultra.
Rumorosità
| Idle |
| 26.85 / 26.85 / 26.85 dB(A) |
| Sotto carico |
| 27.65 / 47.86 dB(A) |
 | ||
30 dB silenzioso 40 dB(A) udibile 50 dB(A) rumoroso |
||
min: | ||
Come accennato in precedenza, la modalità Quiet può presentare alcune limitazioni nelle prestazioni della CPU, ma dovrebbe comunque consentire frame rate soddisfacenti mantenendo il rumore della ventola a un livello accettabile.
| Modalità di prestazioni | Inattivo dB(A) | Carico medio dB(A) | Carico massimo dB(A) | Il Witcher 3 1080p Ultra dB(A) |
|---|---|---|---|---|
| Batteria | 20,90 | 32,60 | 33,21 | 44,36 / 104 fps |
| Silenzioso | 20,74 | 32,95 | 37,68 | 37,63 / 99 fps |
| Bilanciato | 20,80 | 26,40 | 45,97 | 45,92 / 104 fps |
| Performance | 26,85 | 27,65 | 47,86 | 47,86 / 105 fps |
| Dell G15 5530 Intel Core i7-13650HX, GeForce RTX 4060 Laptop GPU | Asus ROG Strix G18 G814JI Intel Core i7-13650HX, GeForce RTX 4070 Laptop GPU | Lenovo Legion Pro 5 16IRX8 Intel Core i7-13700HX, GeForce RTX 4060 Laptop GPU | Asus ROG Flow X16 GV601V Intel Core i9-13900H, GeForce RTX 4060 Laptop GPU | MSI Katana 17 B13VFK Intel Core i7-13620H, GeForce RTX 4060 Laptop GPU | Asus TUF Gaming A16 FA617XS AMD Ryzen 9 7940HS, Radeon RX 7600S | Asus ROG Strix G17 G713PI AMD Ryzen 9 7945HX, GeForce RTX 4070 Laptop GPU | Medion Erazer Major X20 Intel Core i9-13900HX, GeForce RTX 4070 Laptop GPU | |
|---|---|---|---|---|---|---|---|---|
| Noise | -10% | -3% | -4% | -24% | -13% | -14% | -21% | |
| off /ambiente * (dB) | 20.41 | 25 -22% | 23 -13% | 24 -18% | 24.5 -20% | 25 -22% | 25 -22% | 24 -18% |
| Idle Minimum * (dB) | 26.85 | 26 3% | 23.1 14% | 24 11% | 24.5 9% | 25 7% | 26 3% | 25 7% |
| Idle Average * (dB) | 26.85 | 28 -4% | 23.1 14% | 24 11% | 24.5 9% | 26 3% | 29 -8% | 29 -8% |
| Idle Maximum * (dB) | 26.85 | 29 -8% | 26.6 1% | 24 11% | 40 -49% | 28 -4% | 30 -12% | 31 -15% |
| Load Average * (dB) | 27.65 | 41 -48% | 34.7 -25% | 36.71 -33% | 48.3 -75% | 43 -56% | 46 -66% | 50 -81% |
| Witcher 3 ultra * (dB) | 47.9 | 44 8% | 47.6 1% | 50.92 -6% | 56 -17% | 51 -6% | 46 4% | 53 -11% |
| Load Maximum * (dB) | 47.86 | 46 4% | 54.8 -15% | 50.92 -6% | 59.1 -23% | 53 -11% | 47 2% | 57 -19% |
* ... Meglio usare valori piccoli
Temperatura
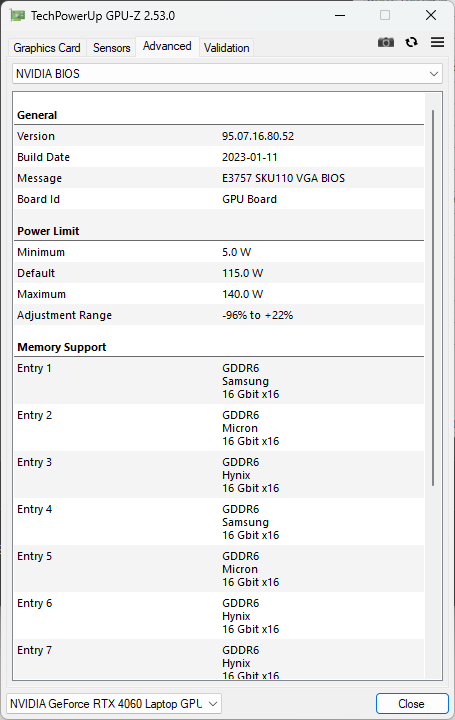
Secondo Dell, le SKU G15 5530 dotate di RTX 4050 e superiori utilizzano un sistema di raffreddamento a camera di vapore, insieme al materiale di interfaccia termica Element 31, simile ai loro cugini Alienware.
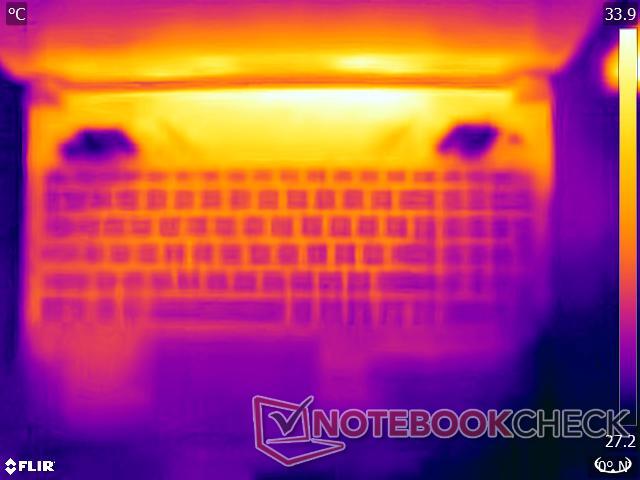
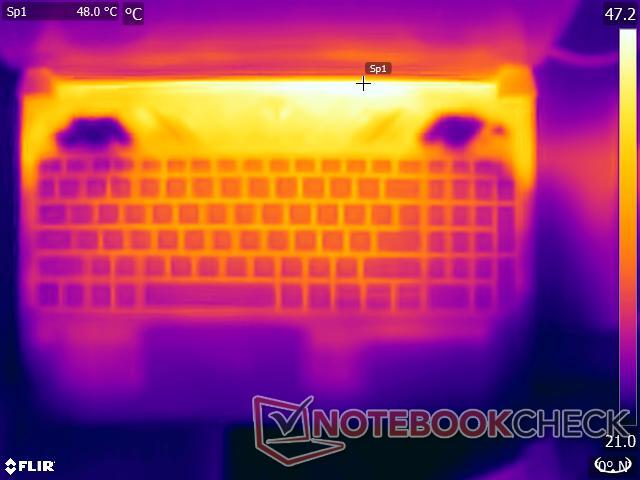
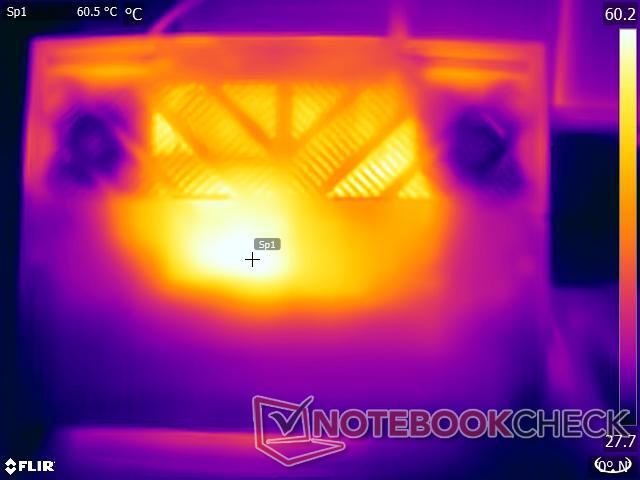
Nonostante la presenza di una camera di vapore, abbiamo osservato temperature superficiali elevate sotto carico. Tuttavia, le aree del palm rest e del touchpad rimangono relativamente fresche.
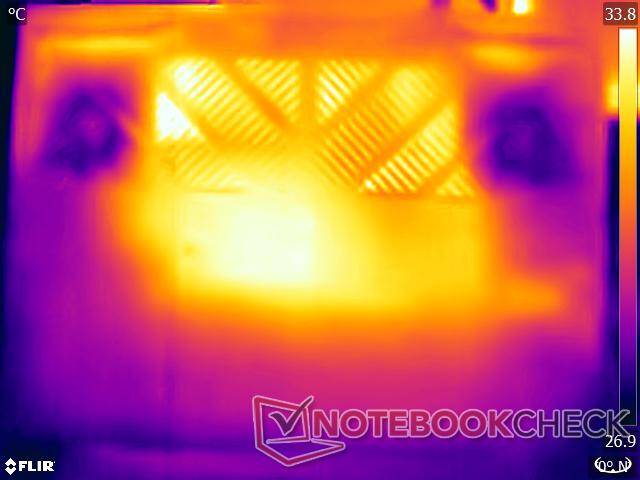
(-) La temperatura massima sul lato superiore è di 54 °C / 129 F, rispetto alla media di 40.4 °C / 105 F, che varia da 21.2 a 68.8 °C per questa classe Gaming.
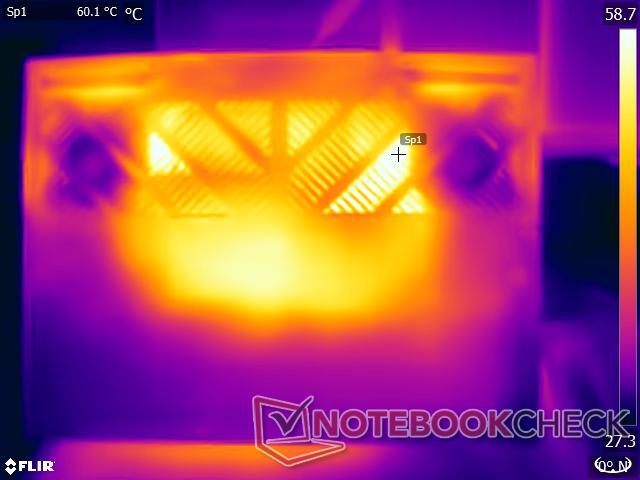
(-) Il lato inferiore si riscalda fino ad un massimo di 62.2 °C / 144 F, rispetto alla media di 43.2 °C / 110 F
(+) In idle, la temperatura media del lato superiore è di 31 °C / 88 F, rispetto alla media deld ispositivo di 33.9 °C / 93 F.
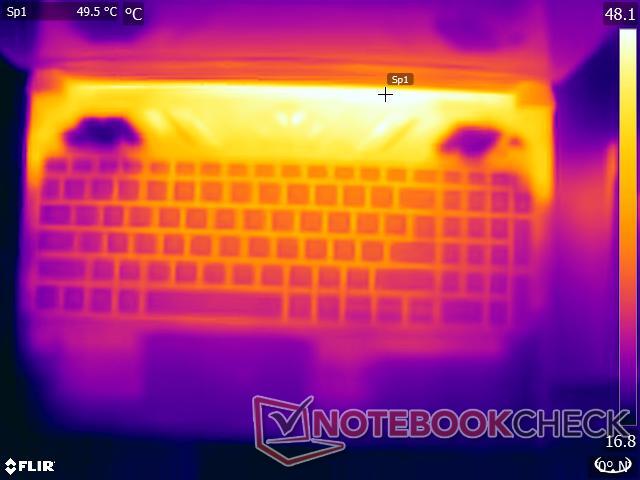
(-) Riproducendo The Witcher 3, la temperatura media per il lato superiore e' di 41.9 °C / 107 F, rispetto alla media del dispositivo di 33.9 °C / 93 F.
(+) I poggiapolsi e il touchpad raggiungono la temperatura massima della pelle (34.4 °C / 93.9 F) e quindi non sono caldi.
(-) La temperatura media della zona del palmo della mano di dispositivi simili e'stata di 28.8 °C / 83.8 F (-5.6 °C / -10.1 F).
| Dell G15 5530 Intel Core i7-13650HX, NVIDIA GeForce RTX 4060 Laptop GPU | Asus ROG Strix G18 G814JI Intel Core i7-13650HX, NVIDIA GeForce RTX 4070 Laptop GPU | Lenovo Legion Pro 5 16IRX8 Intel Core i7-13700HX, NVIDIA GeForce RTX 4060 Laptop GPU | Asus ROG Flow X16 GV601V Intel Core i9-13900H, NVIDIA GeForce RTX 4060 Laptop GPU | MSI Katana 17 B13VFK Intel Core i7-13620H, NVIDIA GeForce RTX 4060 Laptop GPU | Asus TUF Gaming A16 FA617XS AMD Ryzen 9 7940HS, AMD Radeon RX 7600S | Asus ROG Strix G17 G713PI AMD Ryzen 9 7945HX, NVIDIA GeForce RTX 4070 Laptop GPU | Medion Erazer Major X20 Intel Core i9-13900HX, NVIDIA GeForce RTX 4070 Laptop GPU | |
|---|---|---|---|---|---|---|---|---|
| Heat | 16% | 13% | 11% | 13% | 11% | 14% | 3% | |
| Maximum Upper Side * (°C) | 54 | 45 17% | 42.8 21% | 46 15% | 41.6 23% | 53 2% | 42 22% | 46 15% |
| Maximum Bottom * (°C) | 62.2 | 47 24% | 50 20% | 41 34% | 43.1 31% | 48 23% | 41 34% | 49 21% |
| Idle Upper Side * (°C) | 33.4 | 28 16% | 29.6 11% | 36 -8% | 32 4% | 30 10% | 33 1% | 37 -11% |
| Idle Bottom * (°C) | 33.4 | 31 7% | 34 -2% | 33 1% | 35.8 -7% | 30 10% | 34 -2% | 38 -14% |
* ... Meglio usare valori piccoli
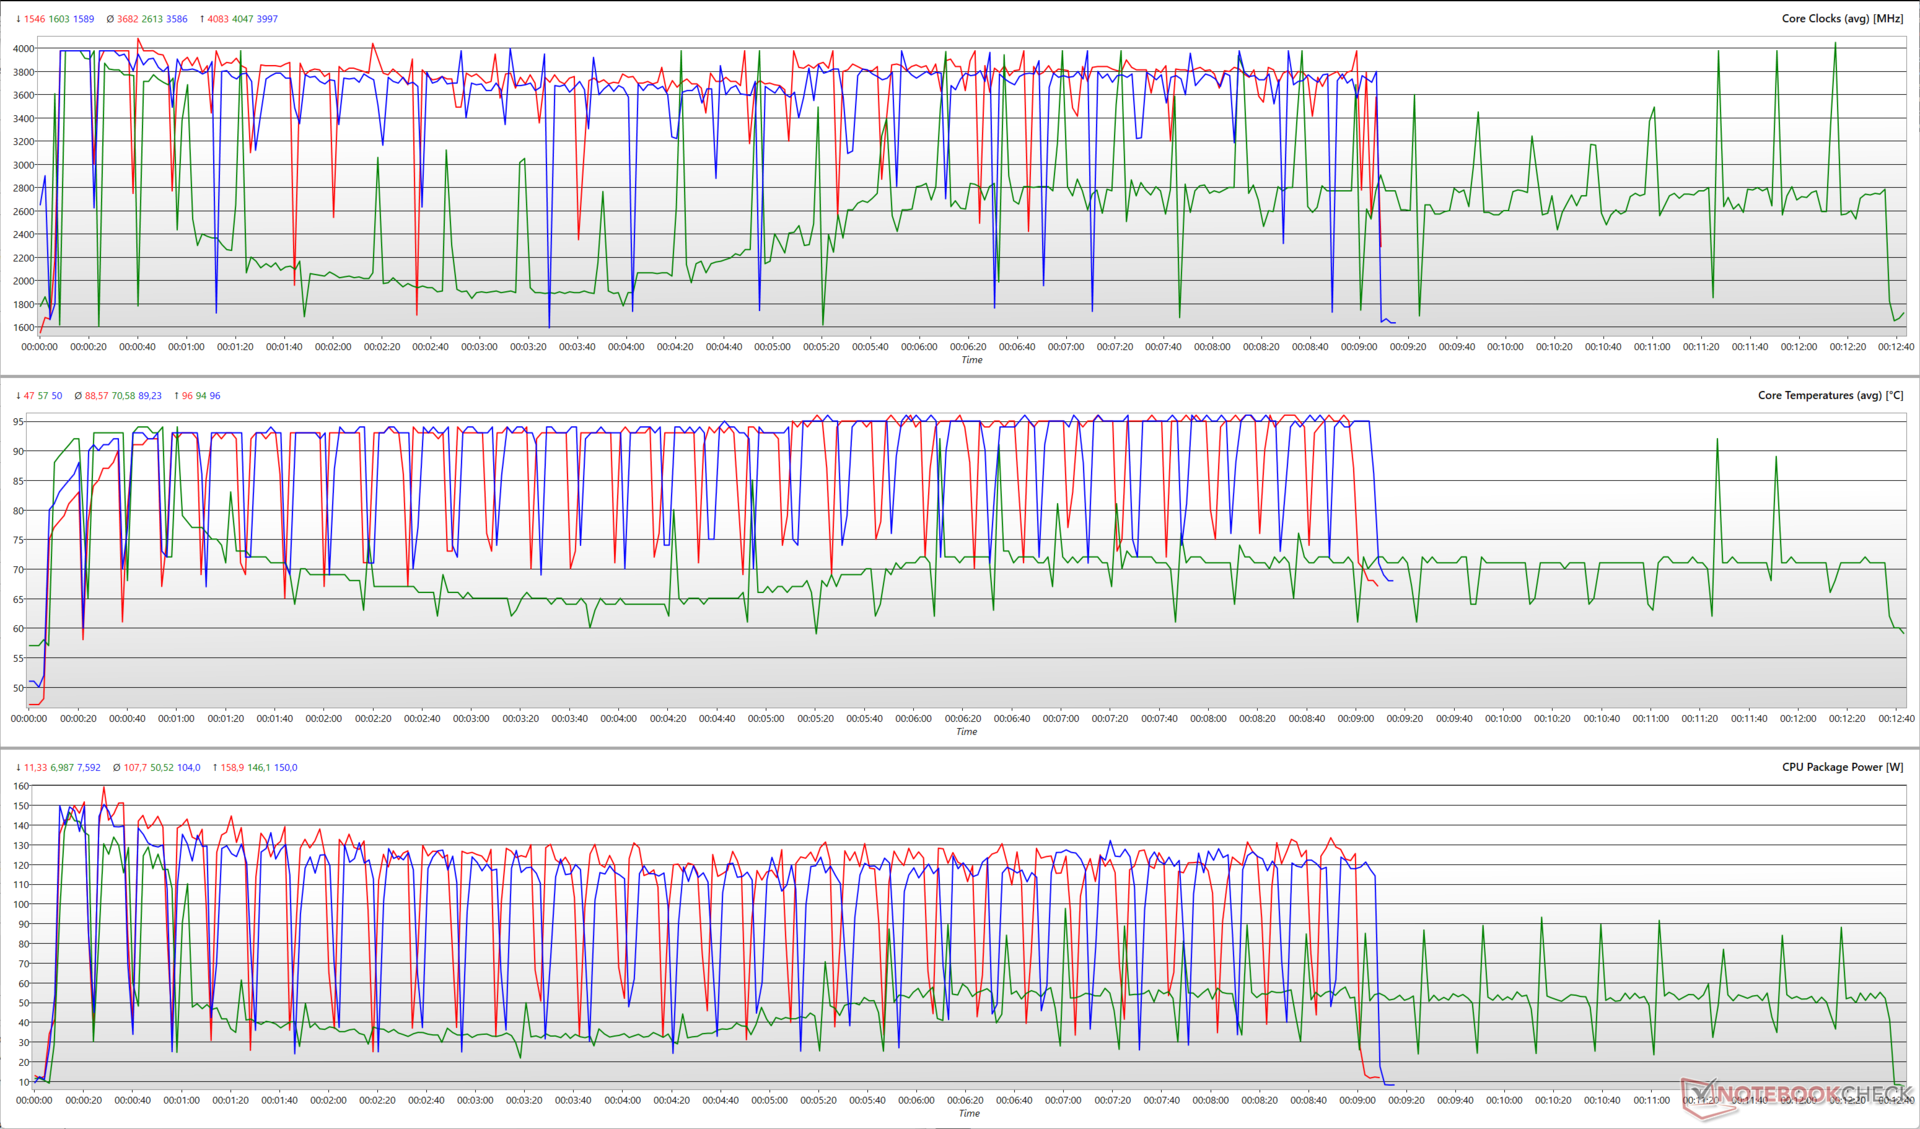
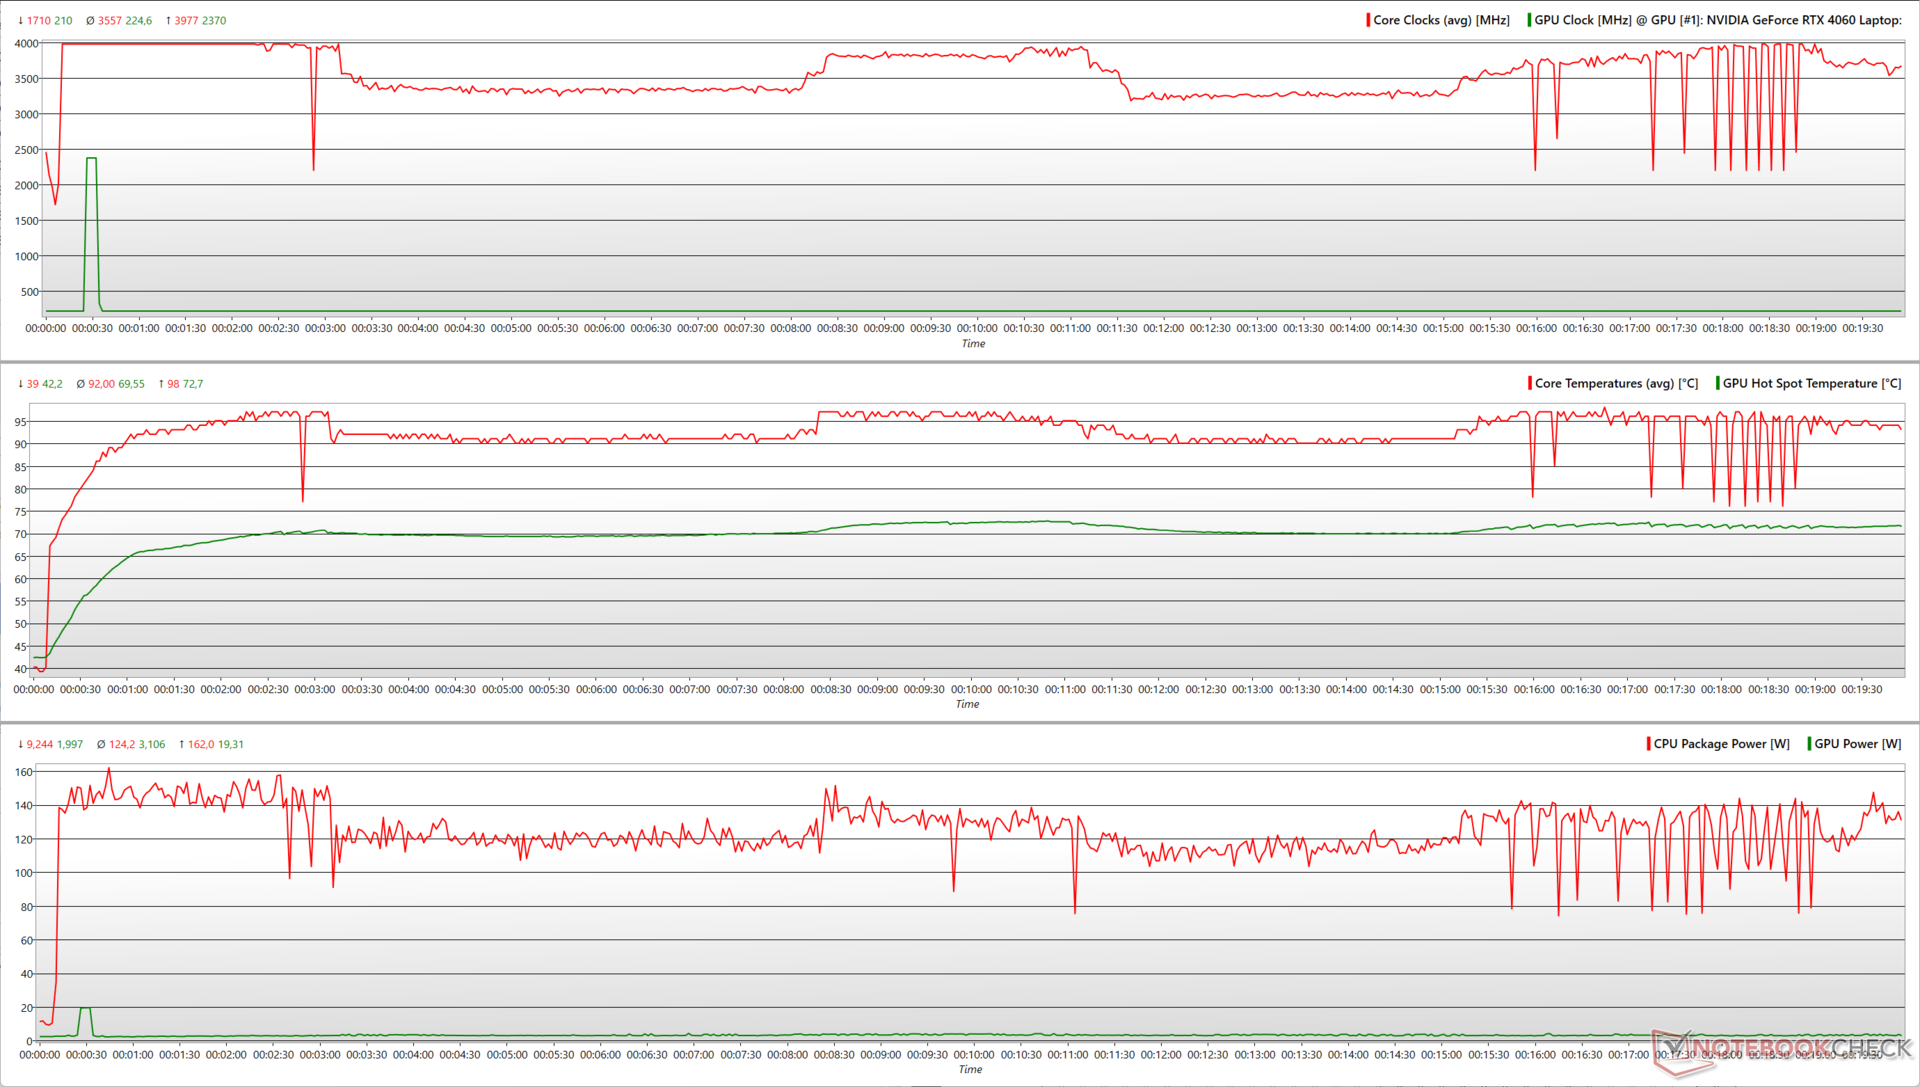
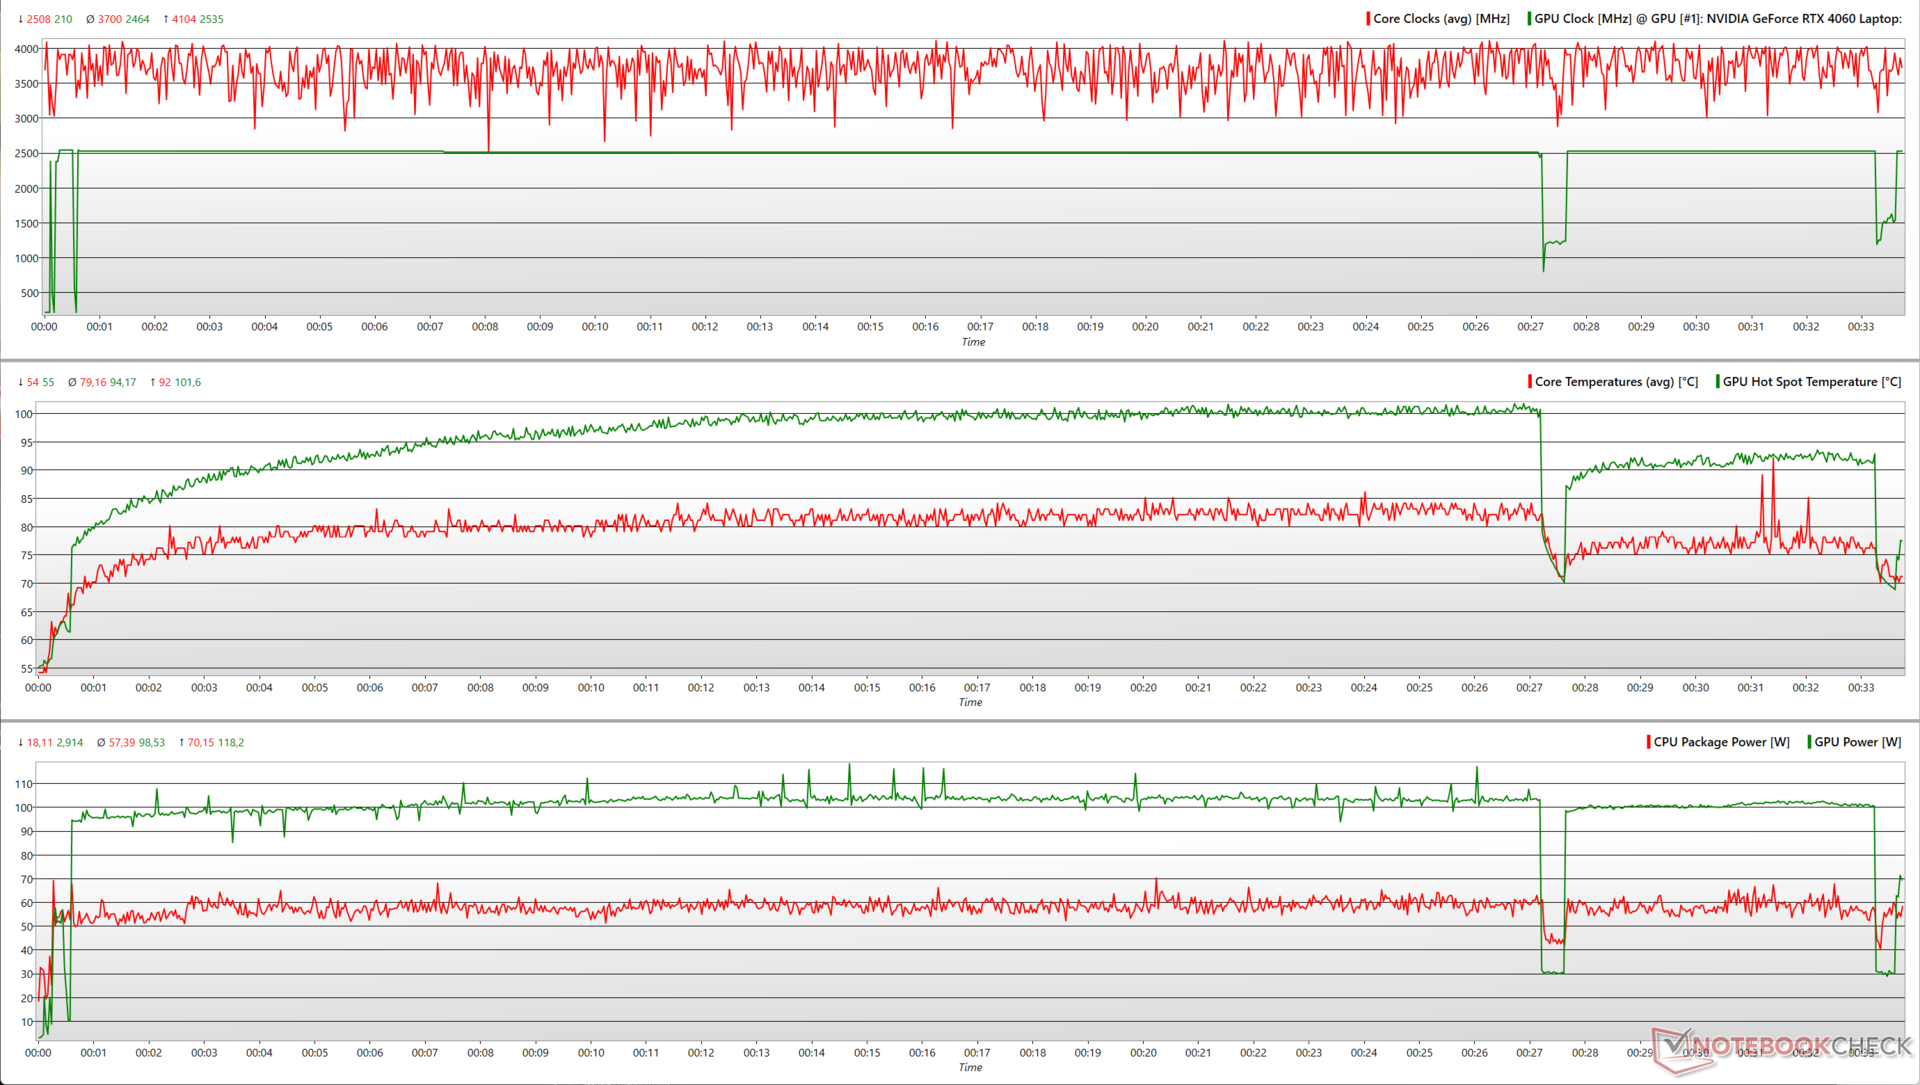
Stress test
Durante lo stress test con le FFT di grandi dimensioni in-place di Prime95, il Core i7-13650HX raggiunge un picco di potenza del package di 162 W e una frequenza massima di boost di quasi 4 GHz. Tuttavia, questo consumo energetico e questa frequenza elevati non vengono mantenuti e la CPU si assesta su una potenza media di 124 W per tutta la durata dello stress test.
Quando viene introdotto FurMark, la GPU RTX 4060 raggiunge un consumo massimo di 152,5 W con una velocità di clock di 2.535 MHz. Alla fine, sia la CPU che la GPU si assestano su un consumo medio di 71 W (con clock a 2,5 GHz) e 81 W (con clock a 2.399 MHz), rispettivamente.
| Stress Test | Clock della CPU (GHz) | Clock della GPU (MHz) | Temperatura media della CPU (°C) | Temperatura media della GPU (°C) |
| Sistema inattivo | 1,6 | 210 | 39 | 36,3 |
| Prime95 | 3,7 | 210 | 92 | 61,3 |
| Prime95 + FurMark | 3,05 | 2.505 | 84,5 | 89,3 |
| Il Witcher 3 1080p Ultra | 4 | 1.485 | 79 | 94 |
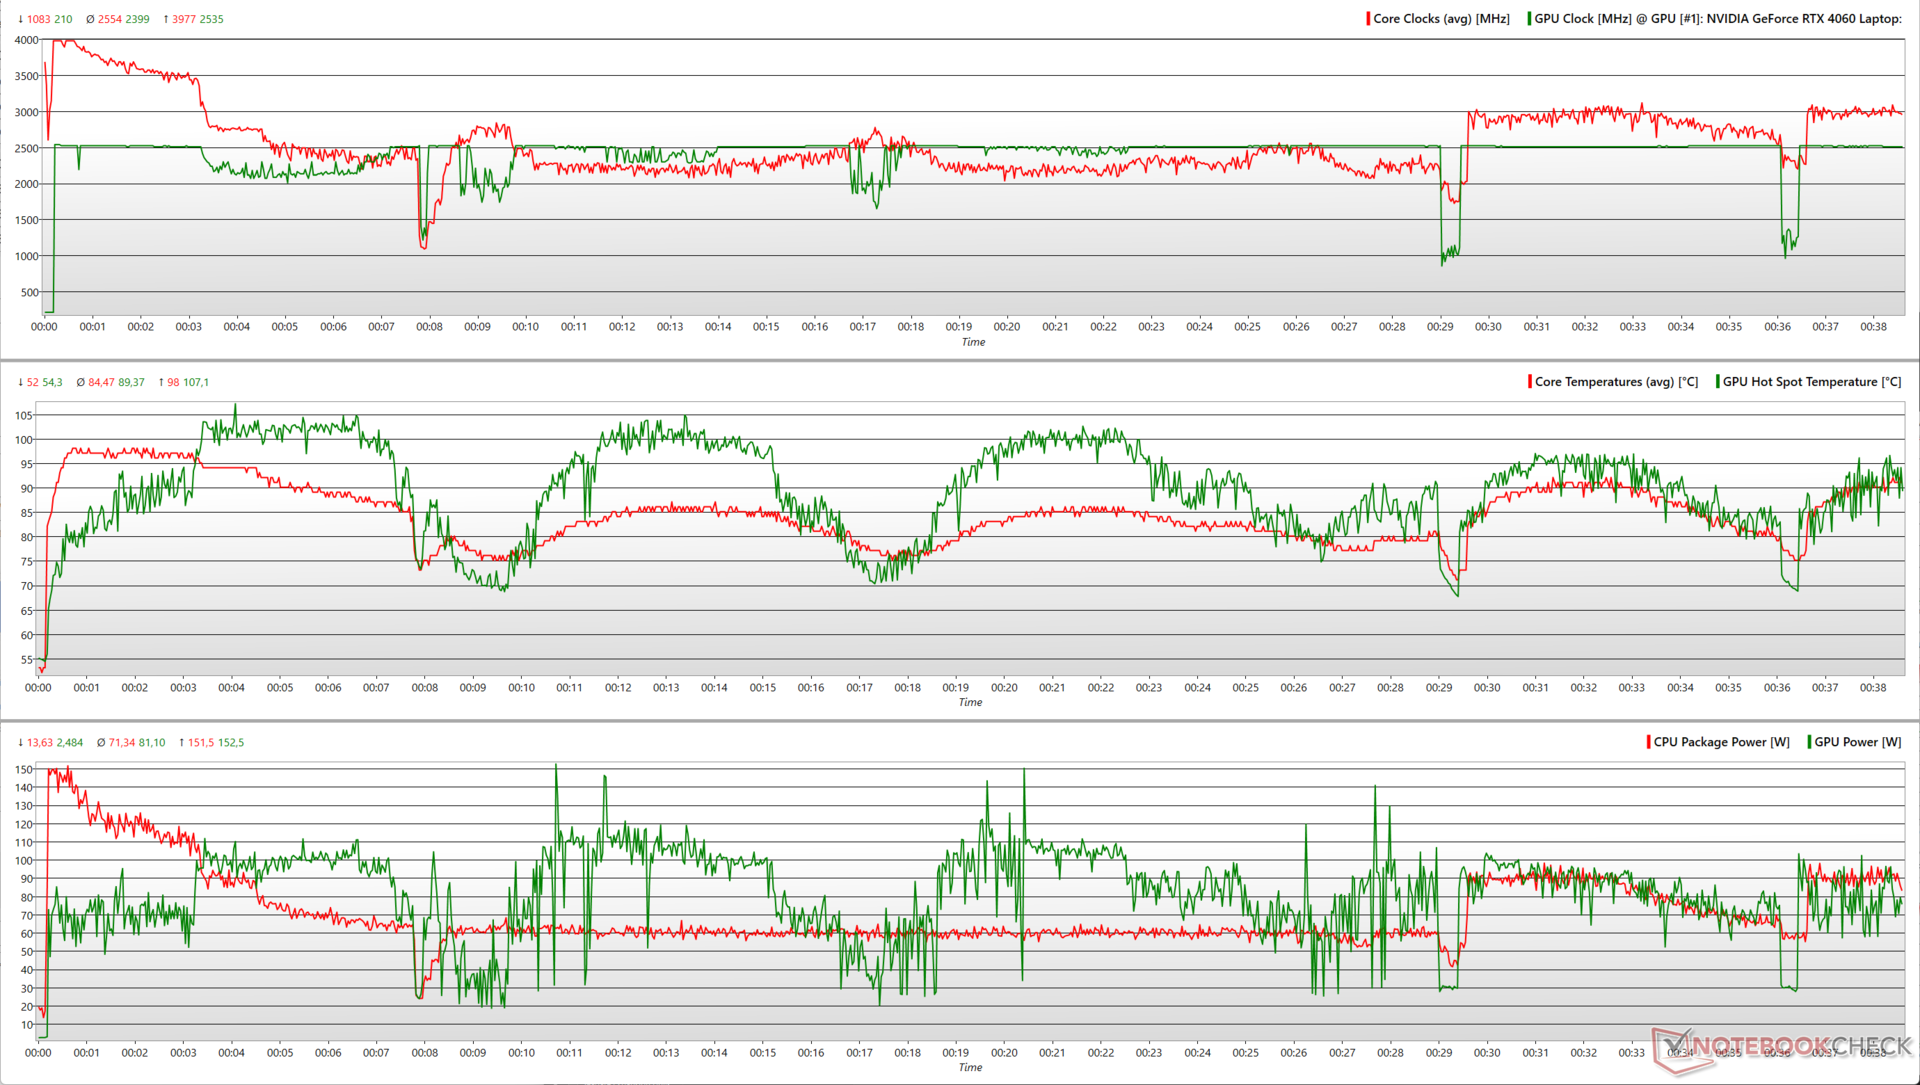
La CPU e la GPU dimostrano una risposta più prevedibile durante lo stress test con The Witcher 3 a 1080p Ultra. Raggiungono clock di picco rispettivamente di 4,1 GHz e 2.535 MHz, con un consumo massimo di 70 W per la CPU e di 118 W per la GPU. Le metriche di CPU e GPU subiscono un breve calo intorno ai 30 minuti del test, ma si ristabiliscono rapidamente alle velocità di clock originali.
Altoparlanti
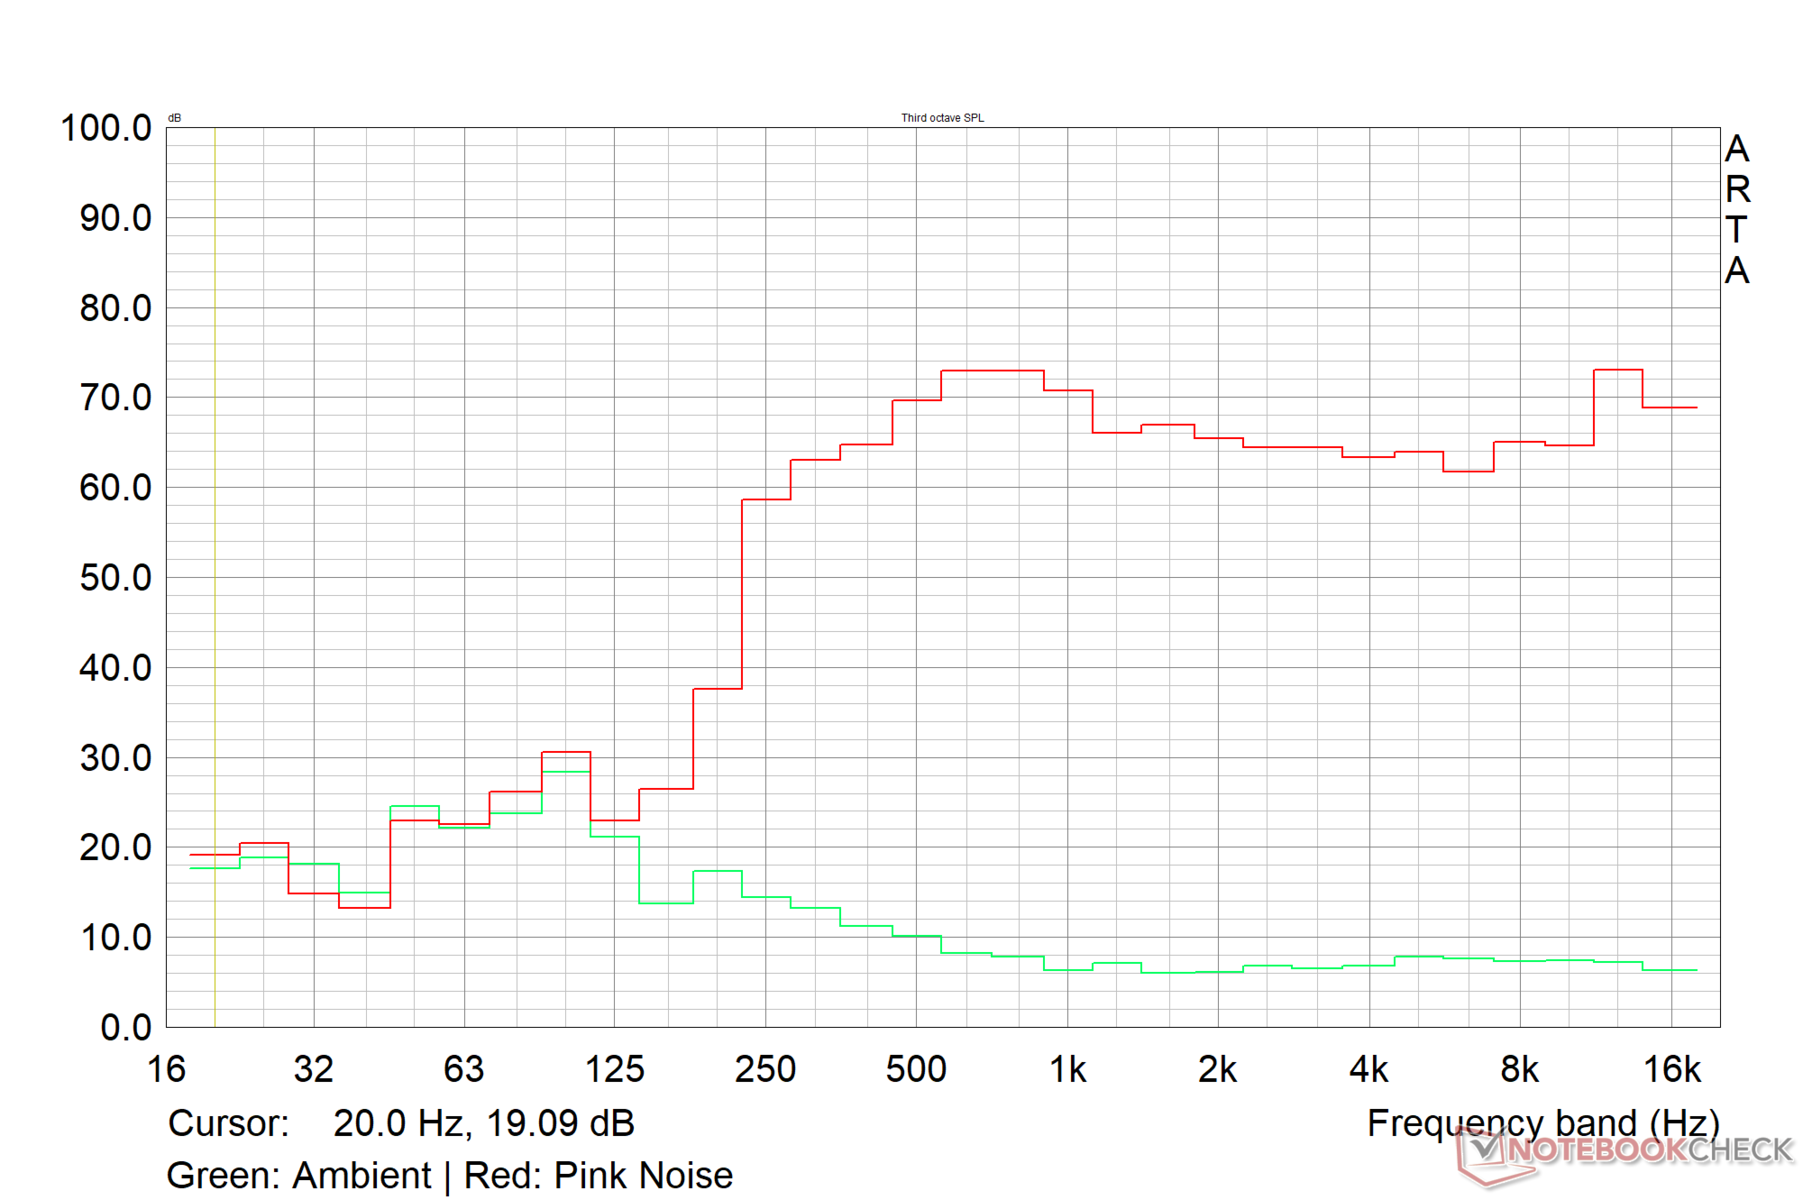
Gli altoparlanti del G15 hanno un volume ragionevole, pari a 79,6 dB(A). Tuttavia, sembra che Dell avrebbe potuto sfruttare meglio l'ampio chassis per fornire una risposta più forte ai bassi. Il lato positivo è che i medi e gli alti sono riprodotti bene.
La qualità dell'audio è soddisfacente, ma gli utenti possono ottenere un'esperienza audio migliore collegando dispositivi audio esterni attraverso il jack audio da 3,5 mm o via Bluetooth.
Dell G15 5530 analisi audio
(±) | potenza degli altiparlanti media ma buona (79.6 dB)
Bassi 100 - 315 Hz
(-) | quasi nessun basso - in media 24.7% inferiori alla media
(-) | bassi non lineari (15.2% delta rispetto alla precedente frequenza)
Medi 400 - 2000 Hz
(+) | medi bilanciati - solo only 4.1% rispetto alla media
(+) | medi lineari (4.2% delta rispetto alla precedente frequenza)
Alti 2 - 16 kHz
(+) | Alti bilanciati - appena 0.8% dalla media
(+) | alti lineari (2.2% delta rispetto alla precedente frequenza)
Nel complesso 100 - 16.000 Hz
(±) | la linearità complessiva del suono è media (16.3% di differenza rispetto alla media
Rispetto alla stessa classe
» 41% di tutti i dispositivi testati in questa classe è stato migliore, 6% simile, 53% peggiore
» Il migliore ha avuto un delta di 6%, medio di 18%, peggiore di 132%
Rispetto a tutti i dispositivi testati
» 27% di tutti i dispositivi testati in questa classe è stato migliore, 6% similare, 68% peggiore
» Il migliore ha avuto un delta di 4%, medio di 23%, peggiore di 134%
Apple MacBook Pro 16 2021 M1 Pro analisi audio
(+) | gli altoparlanti sono relativamente potenti (84.7 dB)
Bassi 100 - 315 Hz
(+) | bassi buoni - solo 3.8% dalla media
(+) | bassi in lineaa (5.2% delta rispetto alla precedente frequenza)
Medi 400 - 2000 Hz
(+) | medi bilanciati - solo only 1.3% rispetto alla media
(+) | medi lineari (2.1% delta rispetto alla precedente frequenza)
Alti 2 - 16 kHz
(+) | Alti bilanciati - appena 1.9% dalla media
(+) | alti lineari (2.7% delta rispetto alla precedente frequenza)
Nel complesso 100 - 16.000 Hz
(+) | suono nel complesso lineare (4.6% differenza dalla media)
Rispetto alla stessa classe
» 0% di tutti i dispositivi testati in questa classe è stato migliore, 0% simile, 100% peggiore
» Il migliore ha avuto un delta di 5%, medio di 17%, peggiore di 45%
Rispetto a tutti i dispositivi testati
» 0% di tutti i dispositivi testati in questa classe è stato migliore, 0% similare, 100% peggiore
» Il migliore ha avuto un delta di 4%, medio di 23%, peggiore di 134%
Gestione dell'energia: Non molto economica sotto carico
Consumo di energia

Sebbene il G15 5530 dimostri un consumo energetico ragionevolmente efficiente quando è inattivo, consuma più energia sotto carico rispetto alla ROG Strix G18 dotata di RTX 4070.
Il Lenovo Legion Pro 5 16con un Core i7-13700HX e RTX 4060, mostra un'inversione di ruoli con un consumo energetico leggermente inferiore sotto carico rispetto al G15 5530, ma con consumi più elevati quando è inattivo.
Il massiccio alimentatore da 330 W in dotazione è in grado di alimentare adeguatamente il G15 anche sotto stress.
| Off / Standby | |
| Idle | |
| Sotto carico |
|
Leggenda:
min: | |
| Dell G15 5530 i7-13650HX, GeForce RTX 4060 Laptop GPU, IPS, 1920x1080, 15.6" | Asus ROG Strix G18 G814JI i7-13650HX, GeForce RTX 4070 Laptop GPU, IPS, 2560x1600, 18" | Lenovo Legion Pro 5 16IRX8 i7-13700HX, GeForce RTX 4060 Laptop GPU, IPS, 2560x1600, 16" | Asus ROG Flow X16 GV601V i9-13900H, GeForce RTX 4060 Laptop GPU, IPS, 2560x1600, 16" | MSI Katana 17 B13VFK i7-13620H, GeForce RTX 4060 Laptop GPU, IPS LED, 1920x1080, 17.3" | Asus TUF Gaming A16 FA617XS R9 7940HS, Radeon RX 7600S, IPS, 1920x1200, 16" | Asus ROG Strix G17 G713PI R9 7945HX, GeForce RTX 4070 Laptop GPU, IPS, 2560x1440, 17.3" | Medion Erazer Major X20 i9-13900HX, GeForce RTX 4070 Laptop GPU, IPS, 2560x1600, 16" | Media NVIDIA GeForce RTX 4060 Laptop GPU | Media della classe Gaming | |
|---|---|---|---|---|---|---|---|---|---|---|
| Power Consumption | -10% | -66% | 1% | 1% | 19% | -35% | -26% | -9% | -29% | |
| Idle Minimum * (Watt) | 8.4 | 8 5% | 24.5 -192% | 9.6 -14% | 12.2 -45% | 7 17% | 15 -79% | 12 -43% | 11.5 ? -37% | 13 ? -55% |
| Idle Average * (Watt) | 14.98 | 15 -0% | 29.2 -95% | 16 -7% | 14.9 1% | 10 33% | 20 -34% | 16 -7% | 16 ? -7% | 18.7 ? -25% |
| Idle Maximum * (Watt) | 15.56 | 26 -67% | 34.3 -120% | 16.9 -9% | 15.8 -2% | 15 4% | 29 -86% | 26 -67% | 20.3 ? -30% | 24.3 ? -56% |
| Load Average * (Watt) | 96.8 | 102 -5% | 98.7 -2% | 104 -7% | 85.22 12% | 86 11% | 121 -25% | 115 -19% | 92.9 ? 4% | 110.2 ? -14% |
| Witcher 3 ultra * (Watt) | 186 | 178.6 4% | 178.6 4% | 142 24% | 151.1 19% | 160.6 14% | 179.8 3% | 191.6 -3% | ||
| Load Maximum * (Watt) | 271.42 | 267 2% | 249.6 8% | 214 21% | 212.8 22% | 172 37% | 246 9% | 319 -18% | 210 ? 23% | 258 ? 5% |
* ... Meglio usare valori piccoli
Power Consumption: The Witcher 3 / Stress test
Power Consumption: External monitor
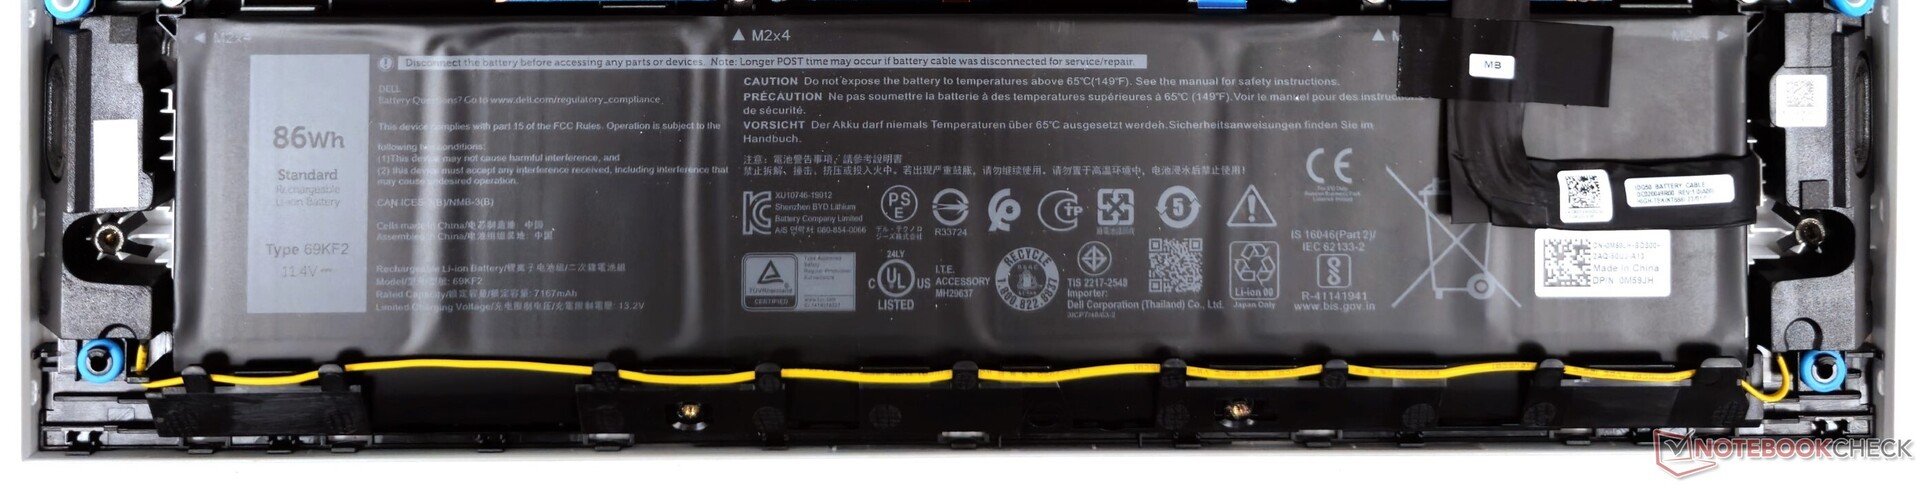
Durata della batteria
Il G15 passa al profilo di alimentazione a batteria quando viene scollegato. Tuttavia, la frequenza di aggiornamento non si riduce automaticamente a 60 Hz.
La batteria da 86 WHr garantisce una discreta autonomia se il portatile non è sottoposto a forti sollecitazioni. Ad esempio, durante la riproduzione di video a 1080p a 150 nits, la batteria può durare quasi 7 ore. Tuttavia, quando si gioca allo stesso livello di luminosità, la batteria dura a malapena un'ora.
| Dell G15 5530 Intel Core i7-13650HX, GeForce RTX 4060 Laptop GPU, 86 Wh | Asus ROG Strix G18 G814JI Intel Core i7-13650HX, GeForce RTX 4070 Laptop GPU, 90 Wh | Lenovo Legion Pro 5 16IRX8 Intel Core i7-13700HX, GeForce RTX 4060 Laptop GPU, 80 Wh | Asus ROG Flow X16 GV601V Intel Core i9-13900H, GeForce RTX 4060 Laptop GPU, 90 Wh | MSI Katana 17 B13VFK Intel Core i7-13620H, GeForce RTX 4060 Laptop GPU, 53.5 Wh | Asus TUF Gaming A16 FA617XS AMD Ryzen 9 7940HS, Radeon RX 7600S, 90 Wh | Asus ROG Strix G17 G713PI AMD Ryzen 9 7945HX, GeForce RTX 4070 Laptop GPU, 90 Wh | Medion Erazer Major X20 Intel Core i9-13900HX, GeForce RTX 4070 Laptop GPU, 62.3 Wh | Media della classe Gaming | |
|---|---|---|---|---|---|---|---|---|---|
| Autonomia della batteria | 38% | -31% | 47% | -15% | 62% | -8% | 7% | 40% | |
| H.264 (h) | 6.8 | 8.9 31% | 12.4 82% | 2.8 -59% | 4.2 -38% | 8.32 ? 22% | |||
| WiFi v1.3 (h) | 6.5 | 8.1 25% | 3.4 -48% | 7.9 22% | 2.9 -55% | 12.4 91% | 4.3 -34% | 3.9 -40% | 7.11 ? 9% |
| Witcher 3 ultra (h) | 0.8 | 1.1 38% | |||||||
| Load (h) | 0.8 | 1.2 50% | 0.7 -13% | 1.5 88% | 1 25% | 0.9 13% | 1 25% | 1.6 100% | 1.502 ? 88% |
| Reader / Idle (h) | 11.7 | 6.7 | 20.3 | 5.8 | 8.16 ? |
Pro
Contro
Verdetto: cerca di fare le cose per bene senza rompere la banca
Il rinnovato G15 5530 di Dell porta la potenza di Intel Raptor Lake-HX di classe desktop in uno chassis pesante ma di tendenza, completato da un ingombrante adattatore di alimentazione.
Il G15 5530 ha molti pregi. Il Wi-Fi ha un buon throughput e un veloce pannello IPS da 1080p con una discreta riproduzione dei colori. La manutenzione e gli aggiornamenti sono semplici, a patto che non ci si preoccupi dello slot SSD M.2 2242 non convenzionale.
Sul fronte delle prestazioni, la combinazione di Core i7-13650HX e GPU Nvidia GeForce RTX 4060 Laptop da 140 W offre ottime prestazioni per i giochi 1080p Ultra, con possibilità di risoluzioni più elevate utilizzando DLSS o FSR. Per la maggior parte, il G15 5530 ha prestazioni pari a quelle delLenovo Legion Pro 5 16 con un Core i7-13700HX.
Il Dell G15 5530 offre ottime prestazioni, facilità di aggiornamento e rappresenta un'alternativa economica ai suoi fratelli Alienware, a patto che si riesca a non badare al suo ingombro e a sopportare alcuni dei suoi compromessi"
Tuttavia, ci sono alcuni inevitabili compromessi da accettare. Il posizionamento delle porte non è ideale, lo storage è lento, non c'è alimentazione USB e la webcam è deludente per un dispositivo del 2023. Le temperature di superficie e il consumo energetico sotto carico sono anch'essi sul lato più alto per questa configurazione. Anche un Asus ROG Strix G17 con un AMD Ryzen 9 7945HX e RTX 4070 consuma meno sotto carico.
Nel complesso, il Dell G15 5530 fa del suo meglio per bilanciare potenza e prezzo e merita sicuramente di essere preso in considerazione se siete alla ricerca di un portatile da gioco intorno ai 1.50.000 dollari.
Prezzo e disponibilità
Il Dell G15 5530 può essere configurato e acquistato direttamente dai negozi online Dell India e dai negozi online Dell US. Il G15 5530 con RTX 4060 è presente anche su Amazon US.
SuAmazon India è disponibile una versione con RTX 4050, ma la disponibilità non è nota. Il Dell G15 5530 con Core i7-13650HX, RTX 4050 e un'unità SSD da 1 TB può essere acquistato da Best Buy per 1.150 dollari.
Dell G15 5530
- 06/25/2023 v7 (old)
Vaidyanathan Subramaniam
Transparency
La selezione dei dispositivi da recensire viene effettuata dalla nostra redazione. Il campione di prova è stato fornito all'autore come prestito dal produttore o dal rivenditore ai fini di questa recensione. L'istituto di credito non ha avuto alcuna influenza su questa recensione, né il produttore ne ha ricevuto una copia prima della pubblicazione. Non vi era alcun obbligo di pubblicare questa recensione. In quanto società mediatica indipendente, Notebookcheck non è soggetta all'autorità di produttori, rivenditori o editori.
Ecco come Notebookcheck esegue i test
Ogni anno, Notebookcheck esamina in modo indipendente centinaia di laptop e smartphone utilizzando procedure standardizzate per garantire che tutti i risultati siano comparabili. Da circa 20 anni sviluppiamo continuamente i nostri metodi di prova e nel frattempo stabiliamo gli standard di settore. Nei nostri laboratori di prova, tecnici ed editori esperti utilizzano apparecchiature di misurazione di alta qualità. Questi test comportano un processo di validazione in più fasi. Il nostro complesso sistema di valutazione si basa su centinaia di misurazioni e parametri di riferimento ben fondati, che mantengono l'obiettività.Price comparison

