Recensione del portatile MSI Katana 17 B13V: la Nvidia GeForce RTX 4060 fa il suo debutto

5499 dollari. Questa è la cifra che i potenziali acquirenti dovranno sborsare per la MSI Titan GT77. Da un lato, si ottiene il massimo della potenza, ma non molti sono disposti a spendere così tanto per un portatile. Con alcuni accorgimenti, l'MSI Katana 17 B13VFK dimostra che anche il prezzo più basso può funzionare: Con una CPU Raptor Lake e Nvidia GeForce RTX 4060questo portatile da gioco (attualmente non disponibile su Amazon e Best Buy) può essere acquistato in Germania per circa 1999 euro. Si tratta comunque di un prezzo elevato, ma di circa due terzi più economico. Nella nostra recensione approfondita, vi sveliamo se anche le prestazioni subiscono un calo simile.
Potenziali concorrenti a confronto
Punteggio | Data | Modello | Peso | Altezza | Dimensione | Risoluzione | Prezzo |
|---|---|---|---|---|---|---|---|
| 82.1 % v7 (old) | 02/2023 | MSI Katana 17 B13VFK i7-13620H, GeForce RTX 4060 Laptop GPU | 2.8 kg | 25.2 mm | 17.30" | 1920x1080 | |
| 89 % v7 (old) | 02/2023 | MSI Titan GT77 HX 13VI i9-13950HX, GeForce RTX 4090 Laptop GPU | 3.5 kg | 23 mm | 17.30" | 3840x2160 | |
| 83.2 % v7 (old) | 01/2023 | MSI Pulse GL76 12UGK i7-12700H, GeForce RTX 3070 Laptop GPU | 2.6 kg | 24.2 mm | 17.30" | 1920x1080 | |
| 83.3 % v7 (old) | 01/2023 | Gigabyte G7 KE i5-12500H, GeForce RTX 3060 Laptop GPU | 2.6 kg | 25 mm | 17.30" | 1920x1080 | |
| 86.9 % v7 (old) | 11/2022 | Asus ROG Strix Scar 17 SE G733CX-LL014W i9-12950HX, GeForce RTX 3080 Ti Laptop GPU | 2.9 kg | 28.3 mm | 17.30" | 2560x1440 | |
| 86.5 % v7 (old) | 11/2022 | Acer Predator Helios 300 (i7-12700H, RTX 3070 Ti) i7-12700H, GeForce RTX 3070 Ti Laptop GPU | 3 kg | 27.65 mm | 17.30" | 2560x1440 |
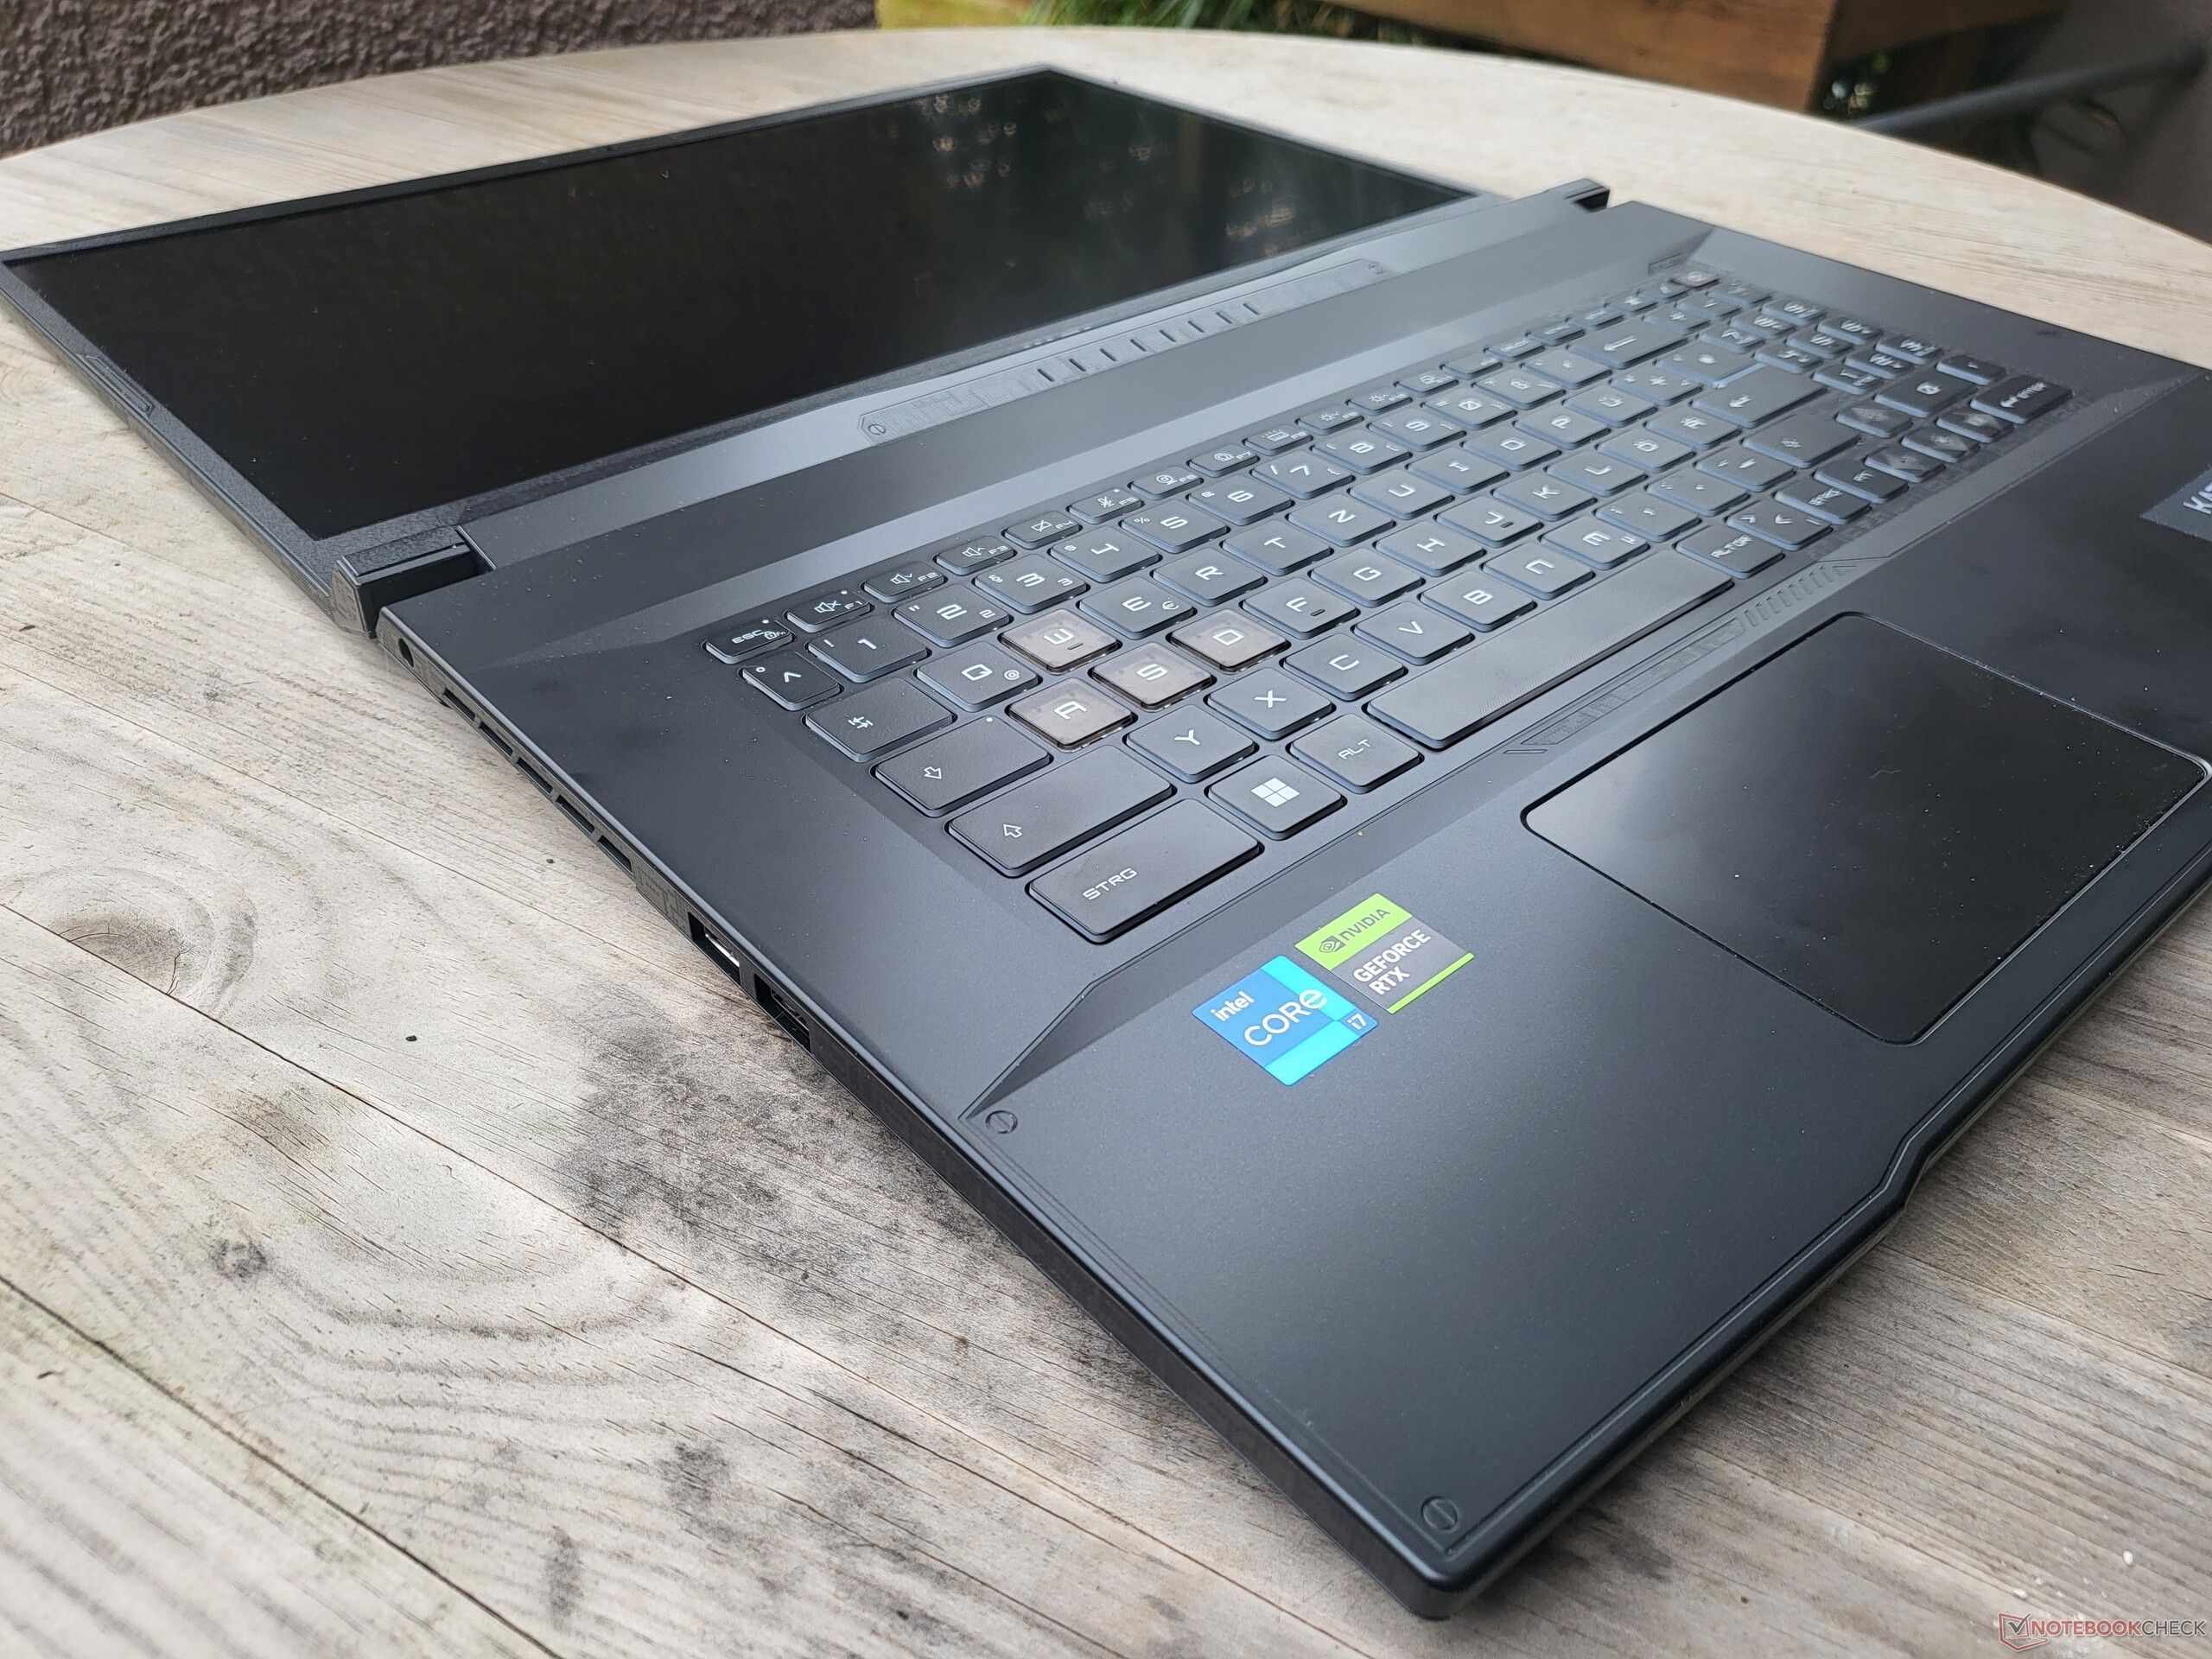
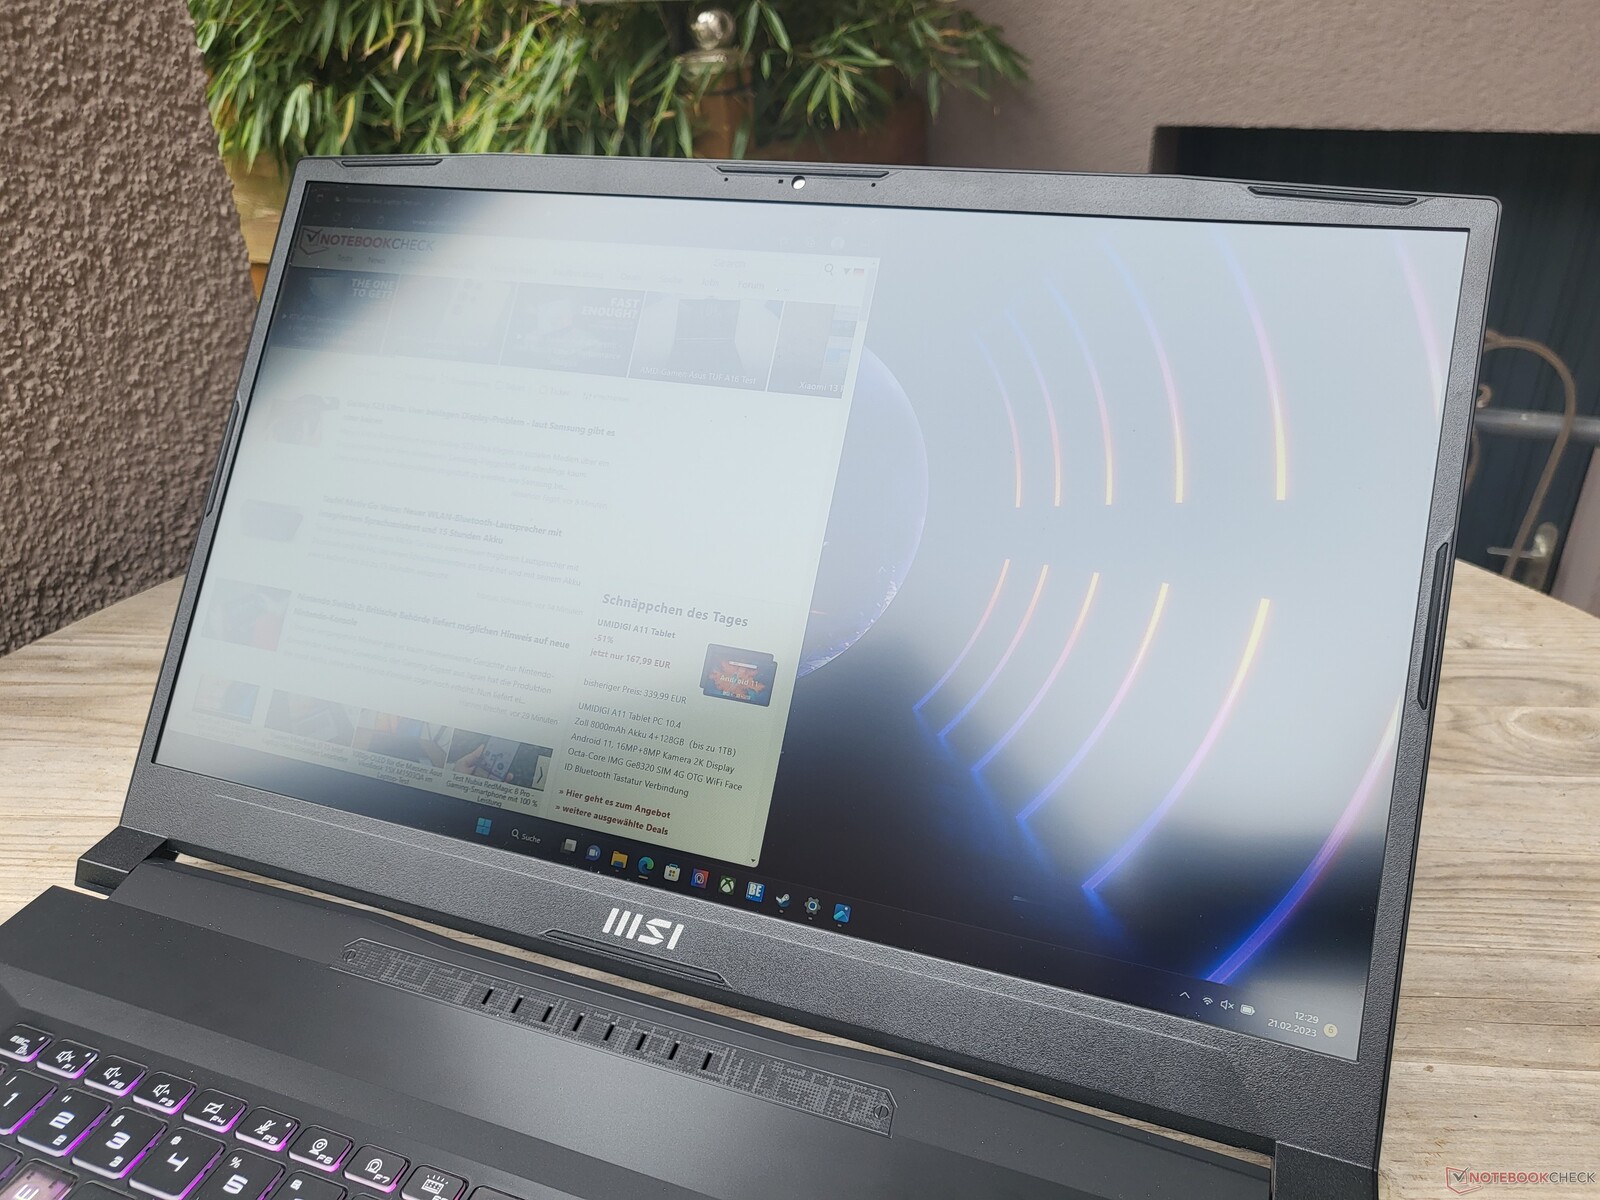
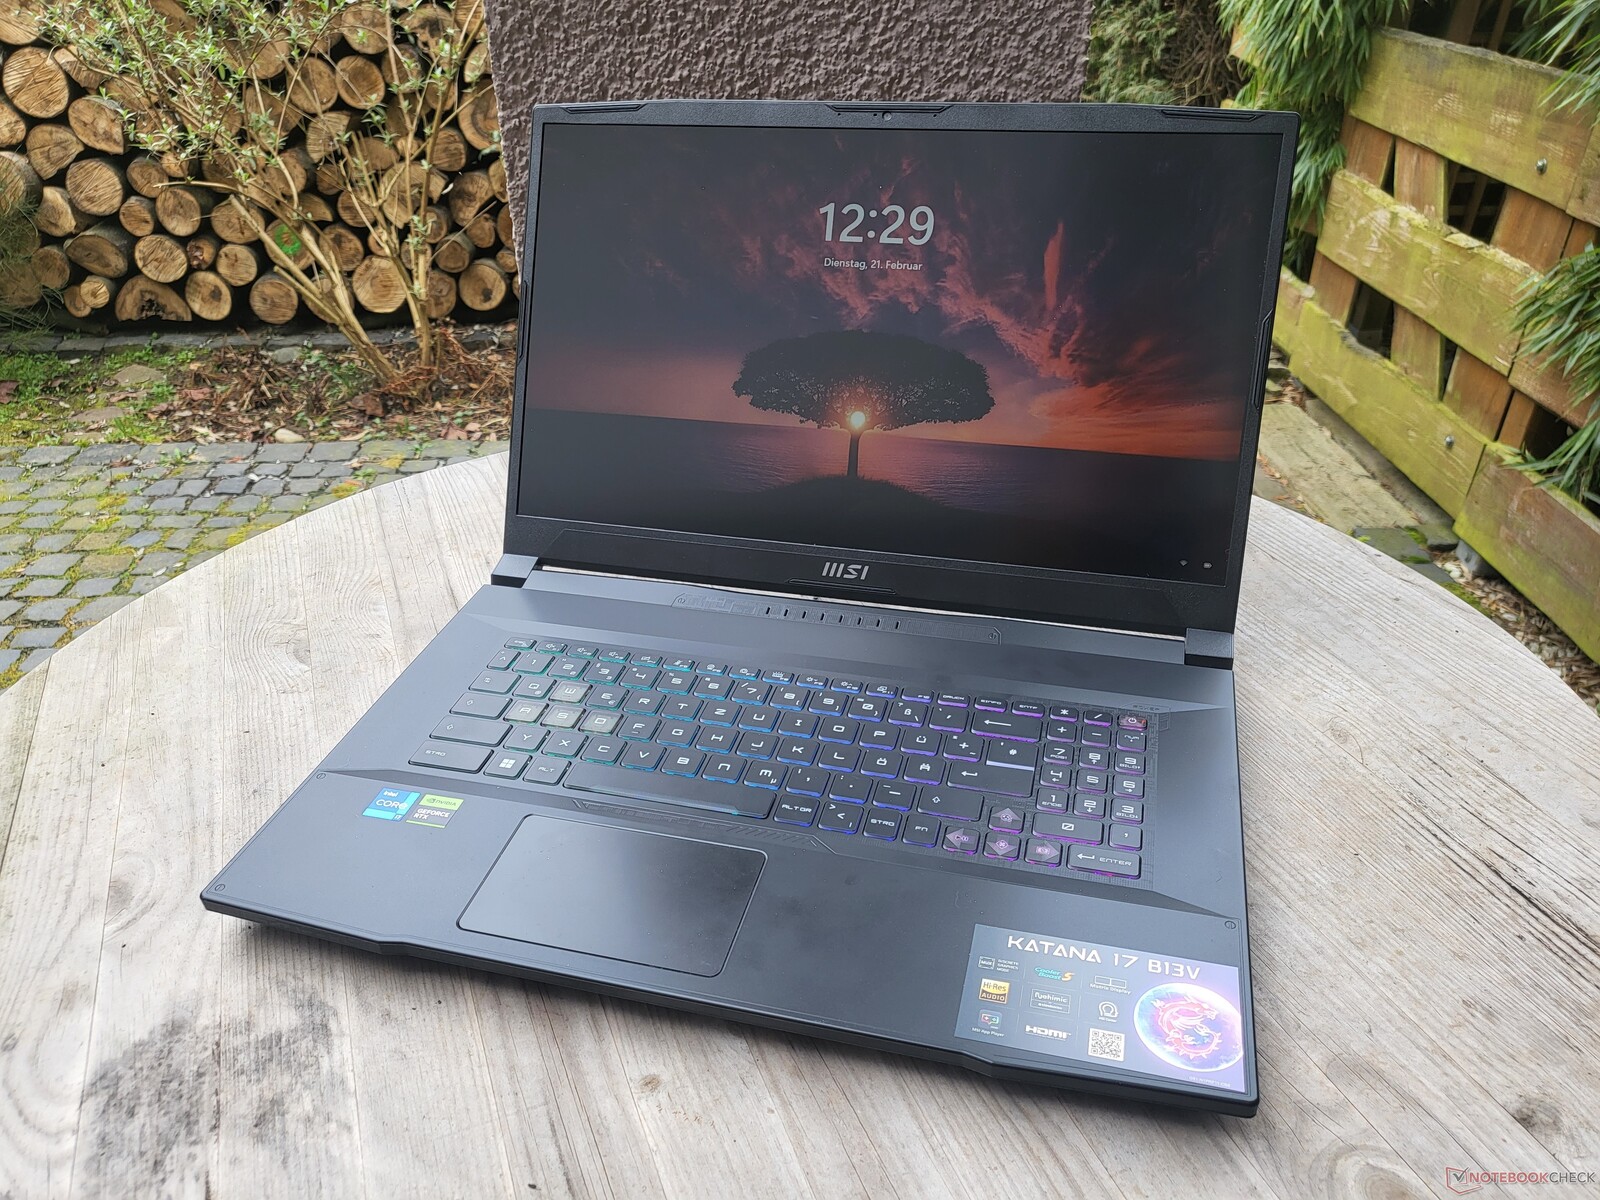
Case: Un MSI rocket grigio opaco
MSI ha conferito al Katana 17 un look tipicamente da gioco. Il linguaggio del design non può essere definito semplice, ma questo non vale per il colore del portatile: MSI è di colore grigio scuro. Tuttavia, questo è il caso solo quando il dispositivo è spento. Con la tastiera colorata e retroilluminata attivata, in termini di colore, l'MSI sembra anche un portatile da gioco.
Almeno esternamente, il portatile è realizzato in plastica. Il poggiapolsi e il coperchio sono lisci al tatto, mentre la base dell'unità è un po' più ruvida. Non è necessariamente la migliore qualità, ma serve comunque allo scopo. Quando si esercita una leggera pressione, il poggiapolsi è solido, ma con una maggiore pressione si flette leggermente al centro. Il coperchio del display può essere ruotato leggermente, a differenza della base che non può essere ruotata affatto. Per un portatile che dovrebbe passare la maggior parte del tempo su una scrivania, questo non dovrebbe essere un problema.
Le ampie cerniere consentono di aprire il dispositivo con un angolo di 180 gradi e il coperchio del display può essere aperto con una sola mano.
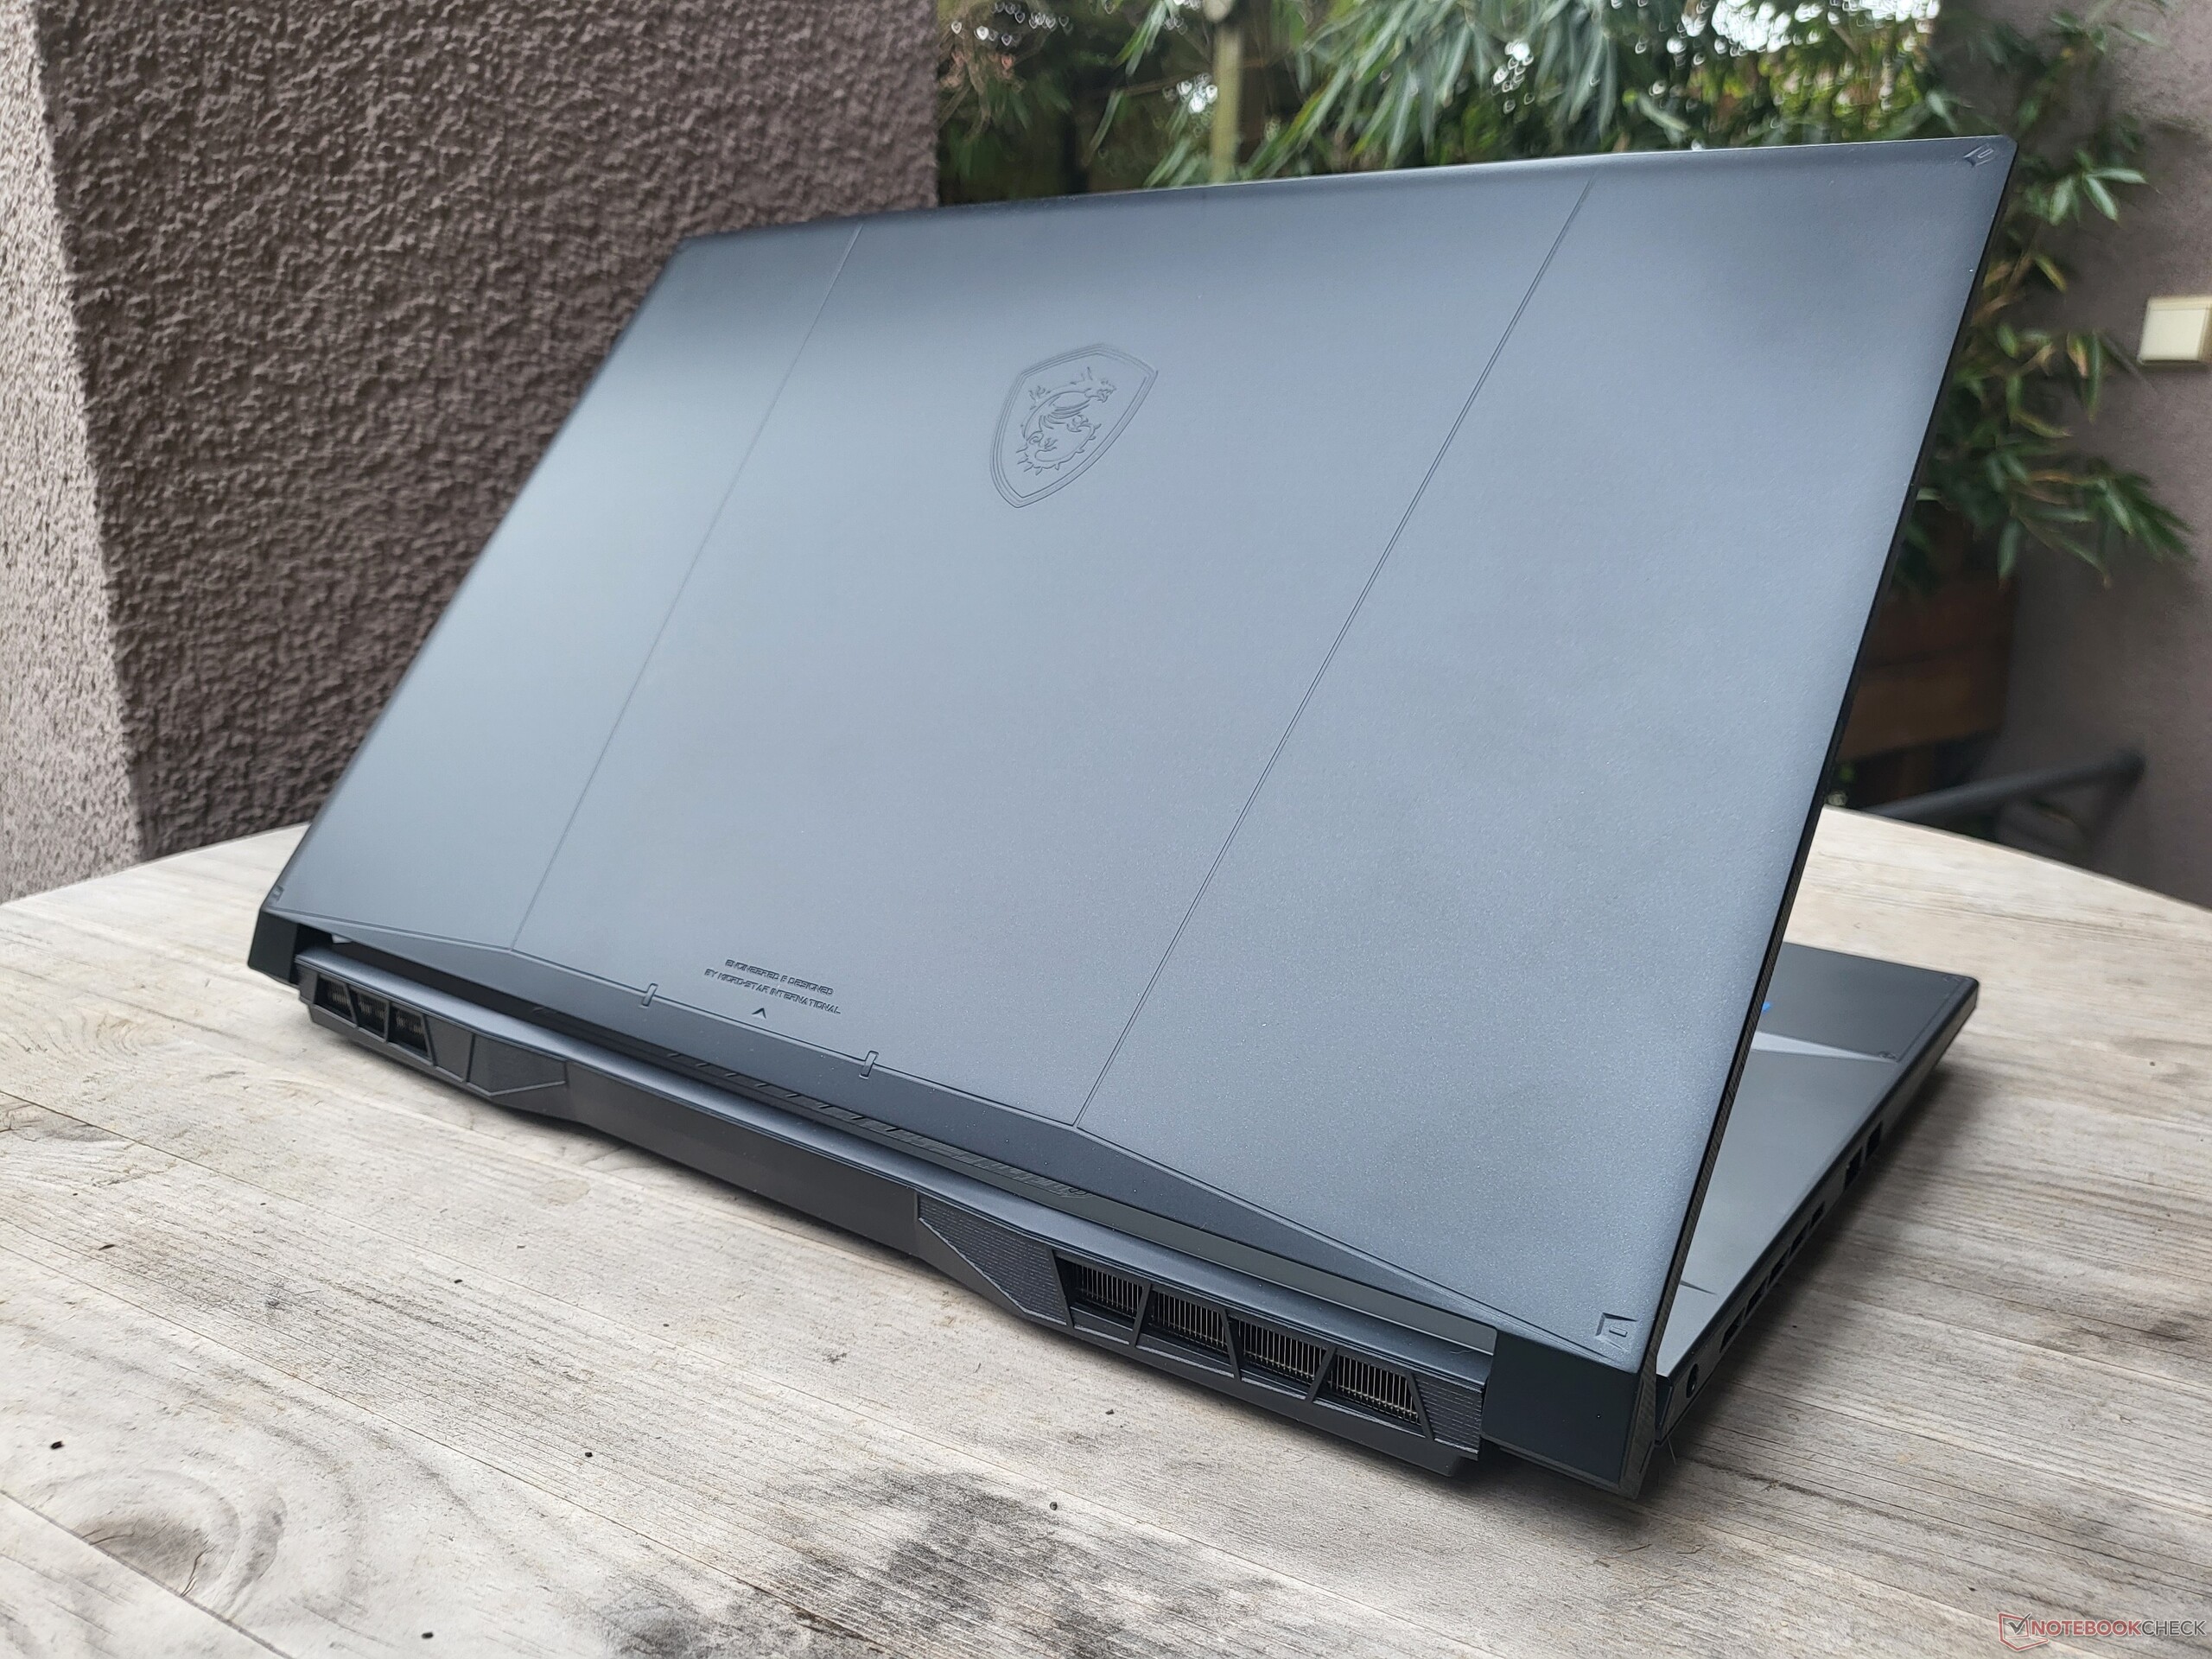
Dal punto di vista del peso, l'MSI Katana 17 si colloca a metà del gruppo rispetto ai suoi colleghi. In compenso, vanta dimensioni relativamente compatte.
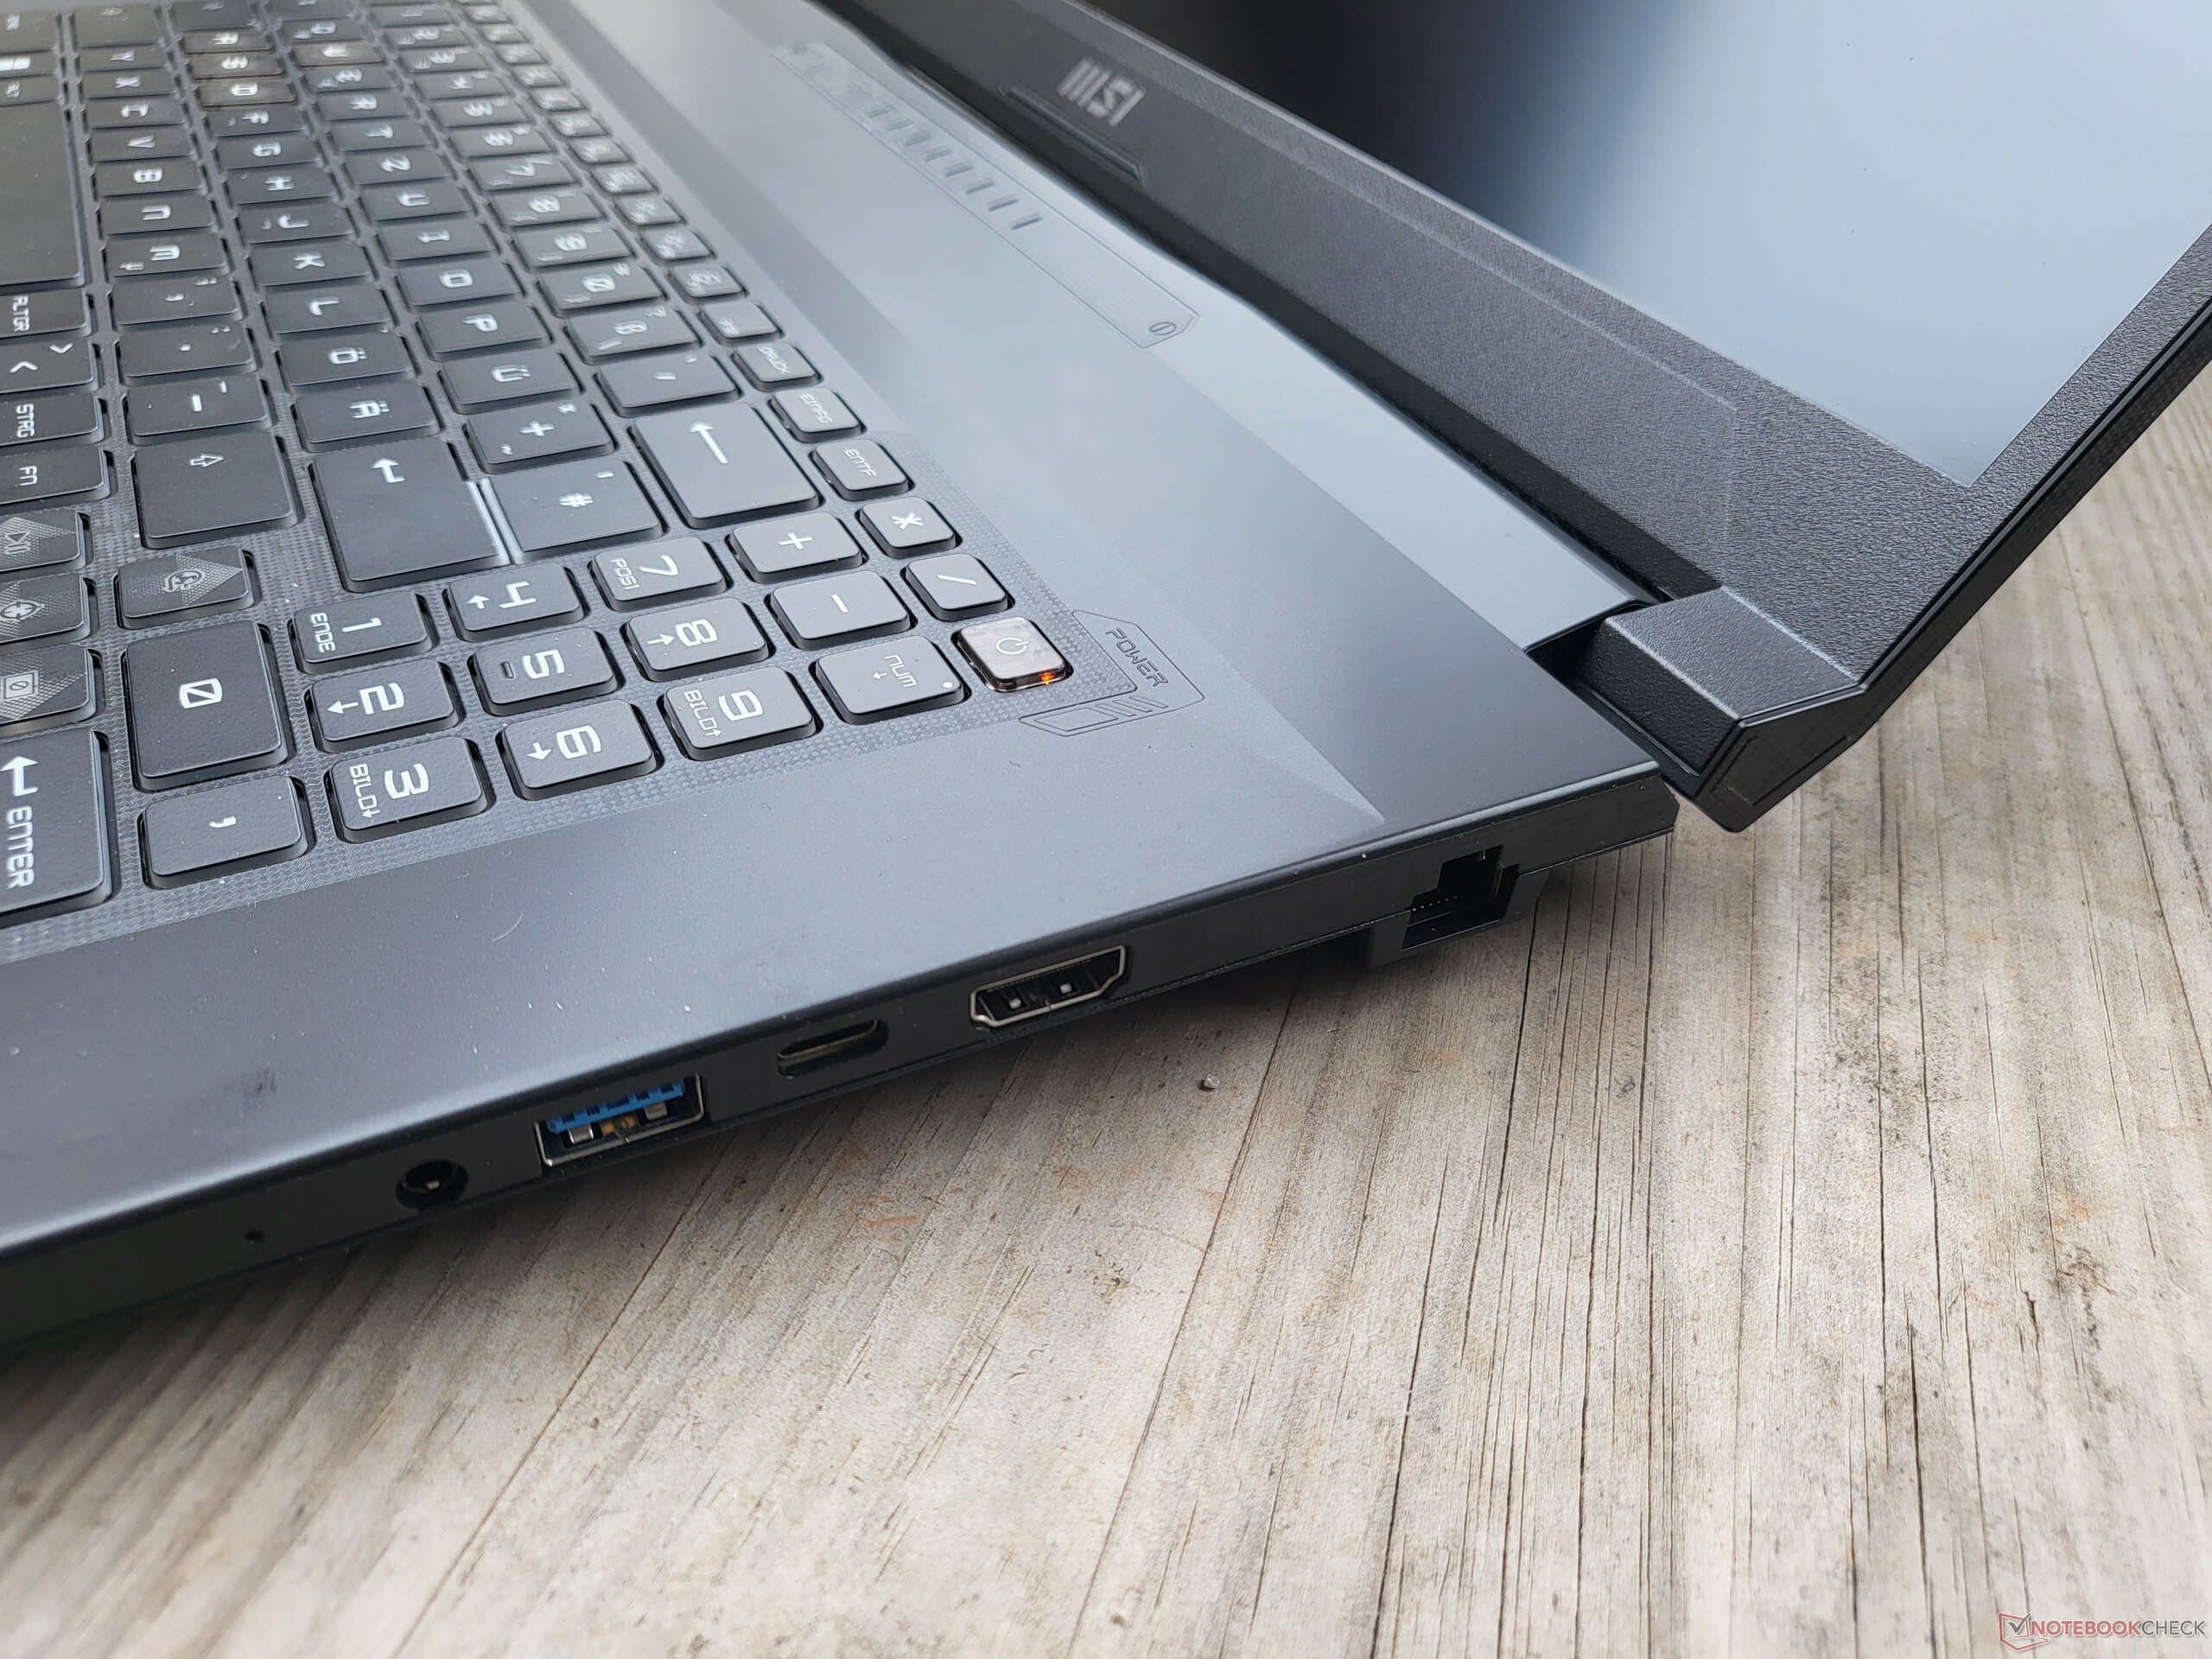
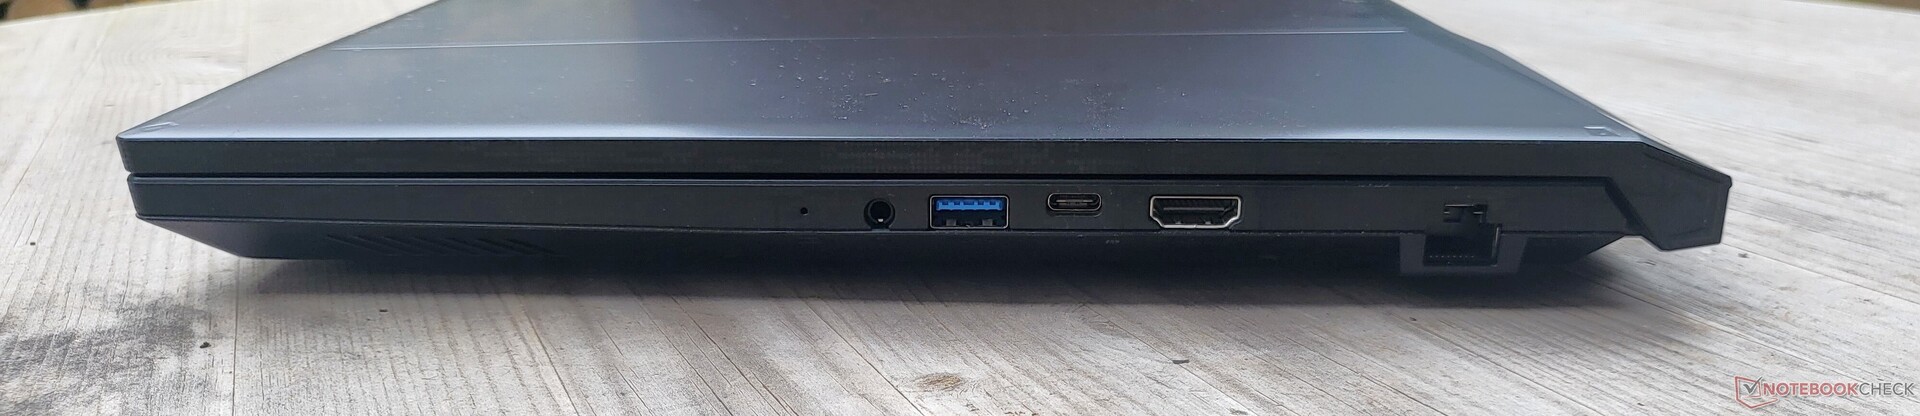
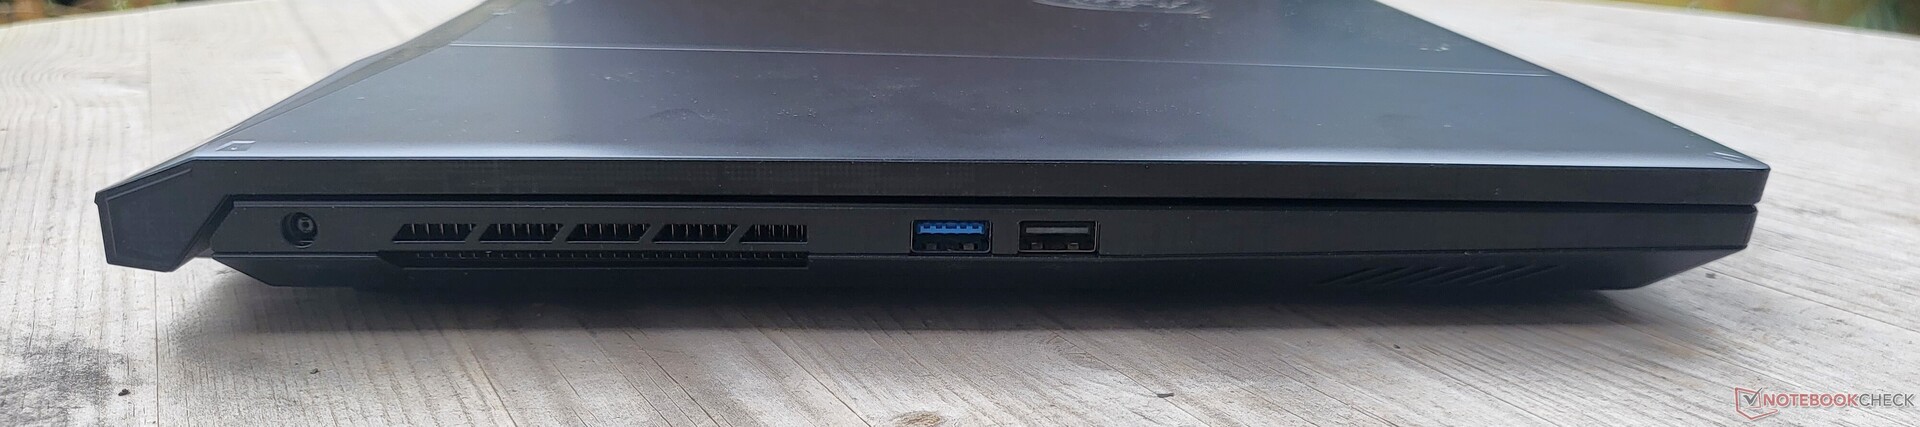
Caratteristiche: USB 2.0 invece di Thunderbolt
La gamma di porte lascia molto a desiderare: L'USB 2.0 non trova posto nel 2022 e anche la Thunderbolt è assente dal Katana 17 di MSI. Inoltre, ci manca il lettore di schede SD, ma almeno MSI non ha lesinato sulla porta RJ45.
Comunicazione
Con il Katana 17 B13V, MSI ha scelto una soluzione WiFi di Intel, anche se non con la tecnologia più aggiornata. L'Intel AX201 offre velocità di trasferimento elevate e stabili, anche se deve fare a meno del più recente standard WiFI 6E.
Webcam
La webcam a 720p offre un'immagine tipica dei computer portatili: rumorosa, slavata e poco nitida.


Accessori
MSI Katana 17 B13V viene fornito con un alimentatore da 240 watt di Chicony che utilizza un connettore proprietario.
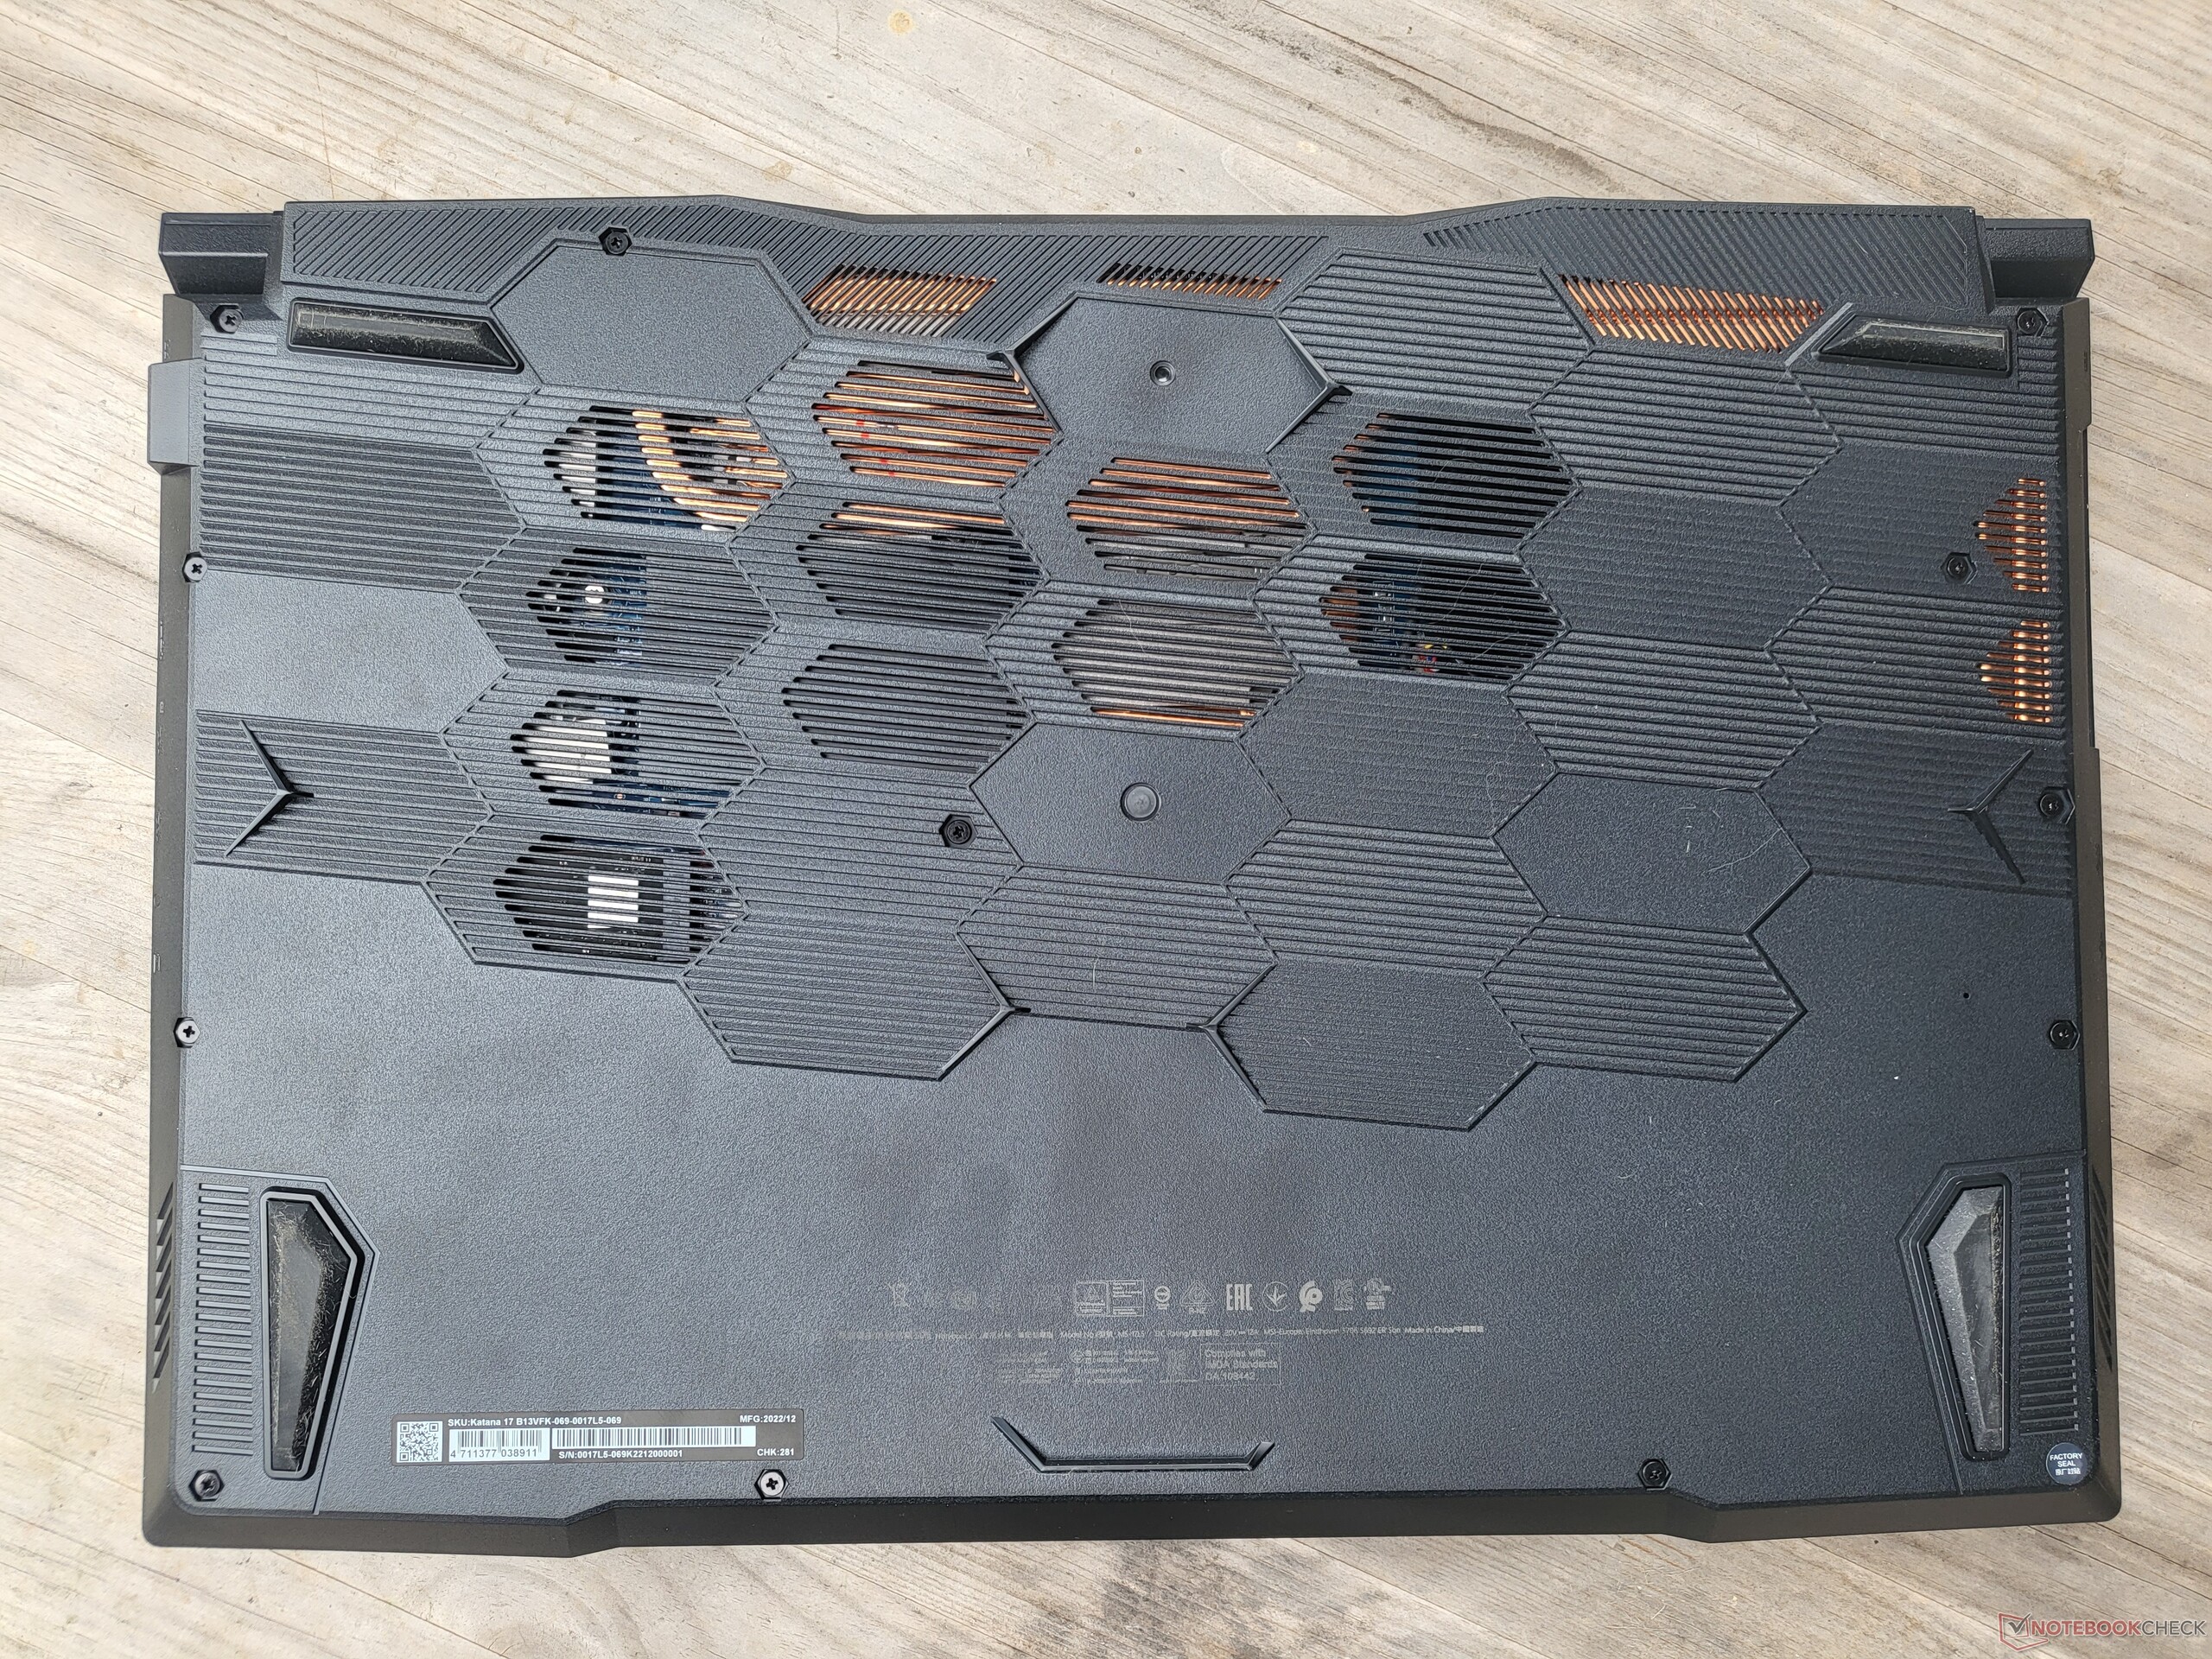
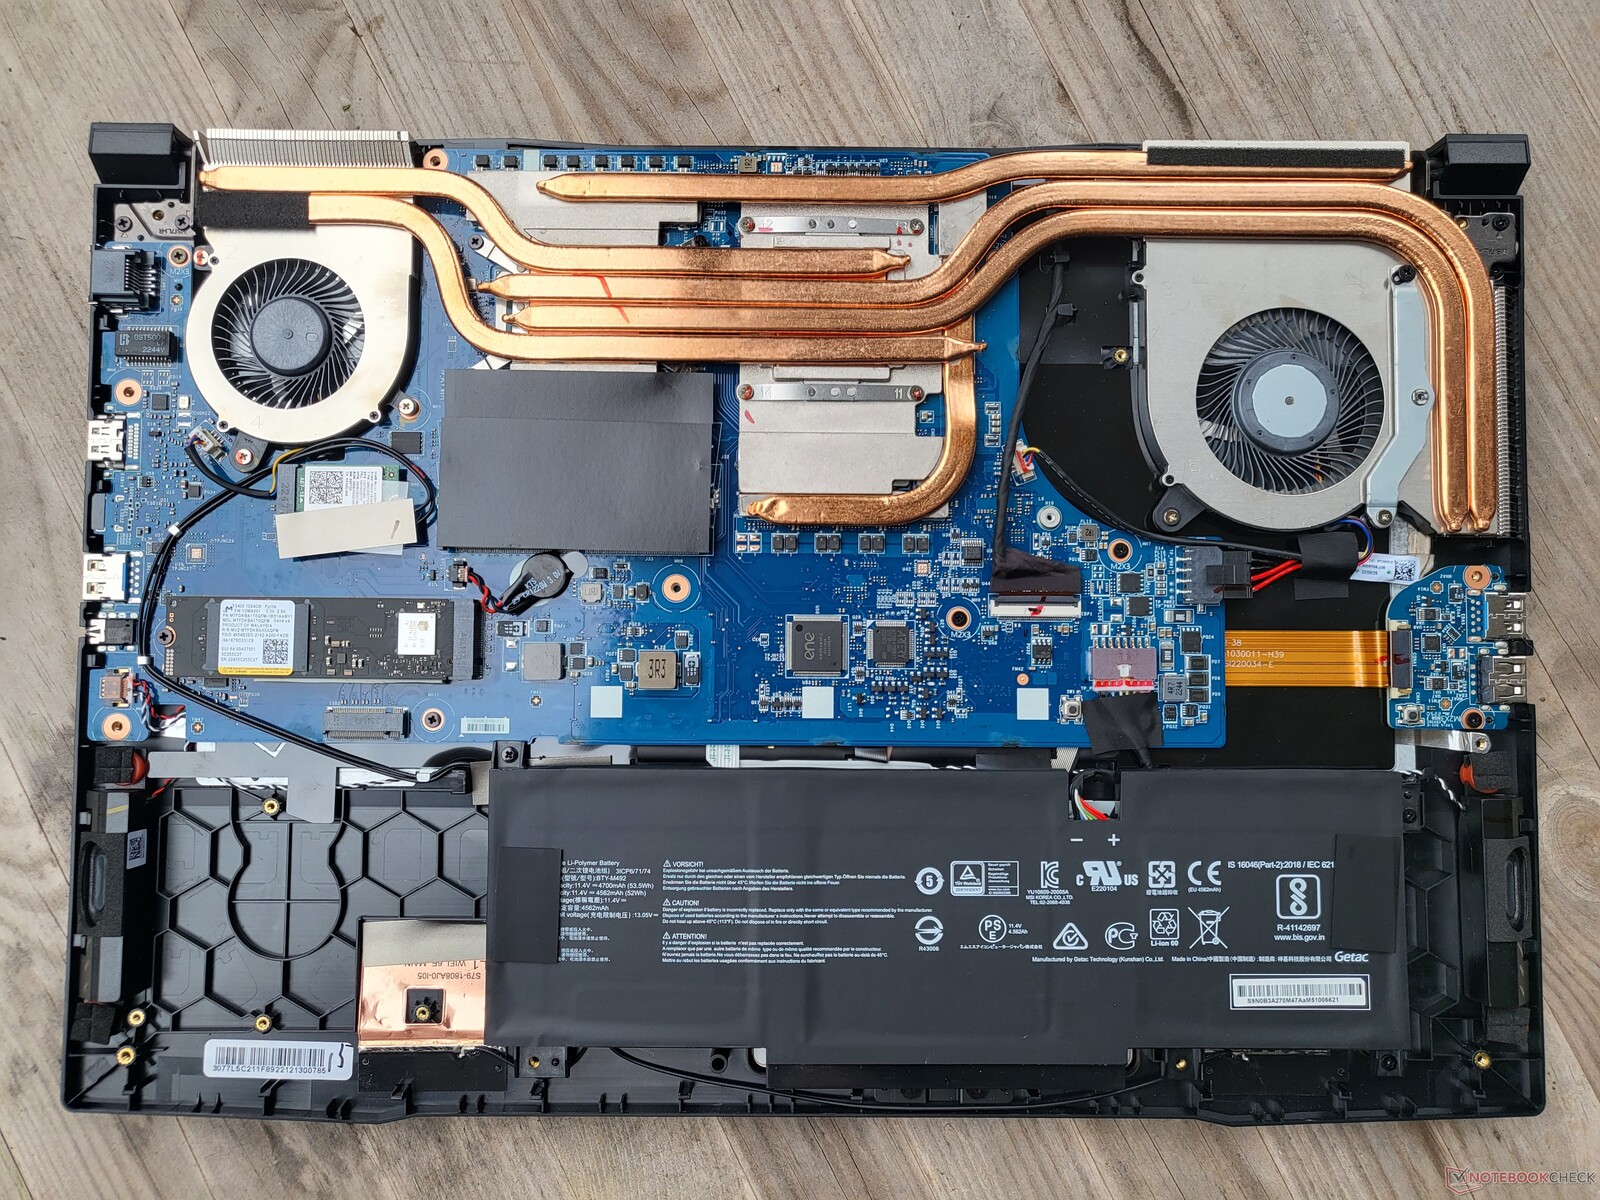
Manutenzione
Tredici viti e alcune clip impediscono l'accesso ai componenti interni del Katana. È possibile aggiornare il modulo WiFi, l'SSD M.2 2280 ed entrambi i moduli RAM. Inoltre, è possibile accedere all'ampio sistema di raffreddamento a due ventole e alla batteria, piuttosto piccola per un dispositivo di queste dimensioni. C'è molto spazio libero accanto alla batteria, il che dimostra che sarebbe stato possibile installarne una più grande. È interessante notare la presenza di un peso sulla piastra di base che fa sembrare il portatile MSI più pesante, forse a causa dell'ampio spazio libero.
Garanzia
Il portatile MSI viene fornito con una garanzia di 2 anni dalla data di acquisto che include un servizio di ritiro e restituzione. Tuttavia, la garanzia del produttore è valida solo per la Germania.
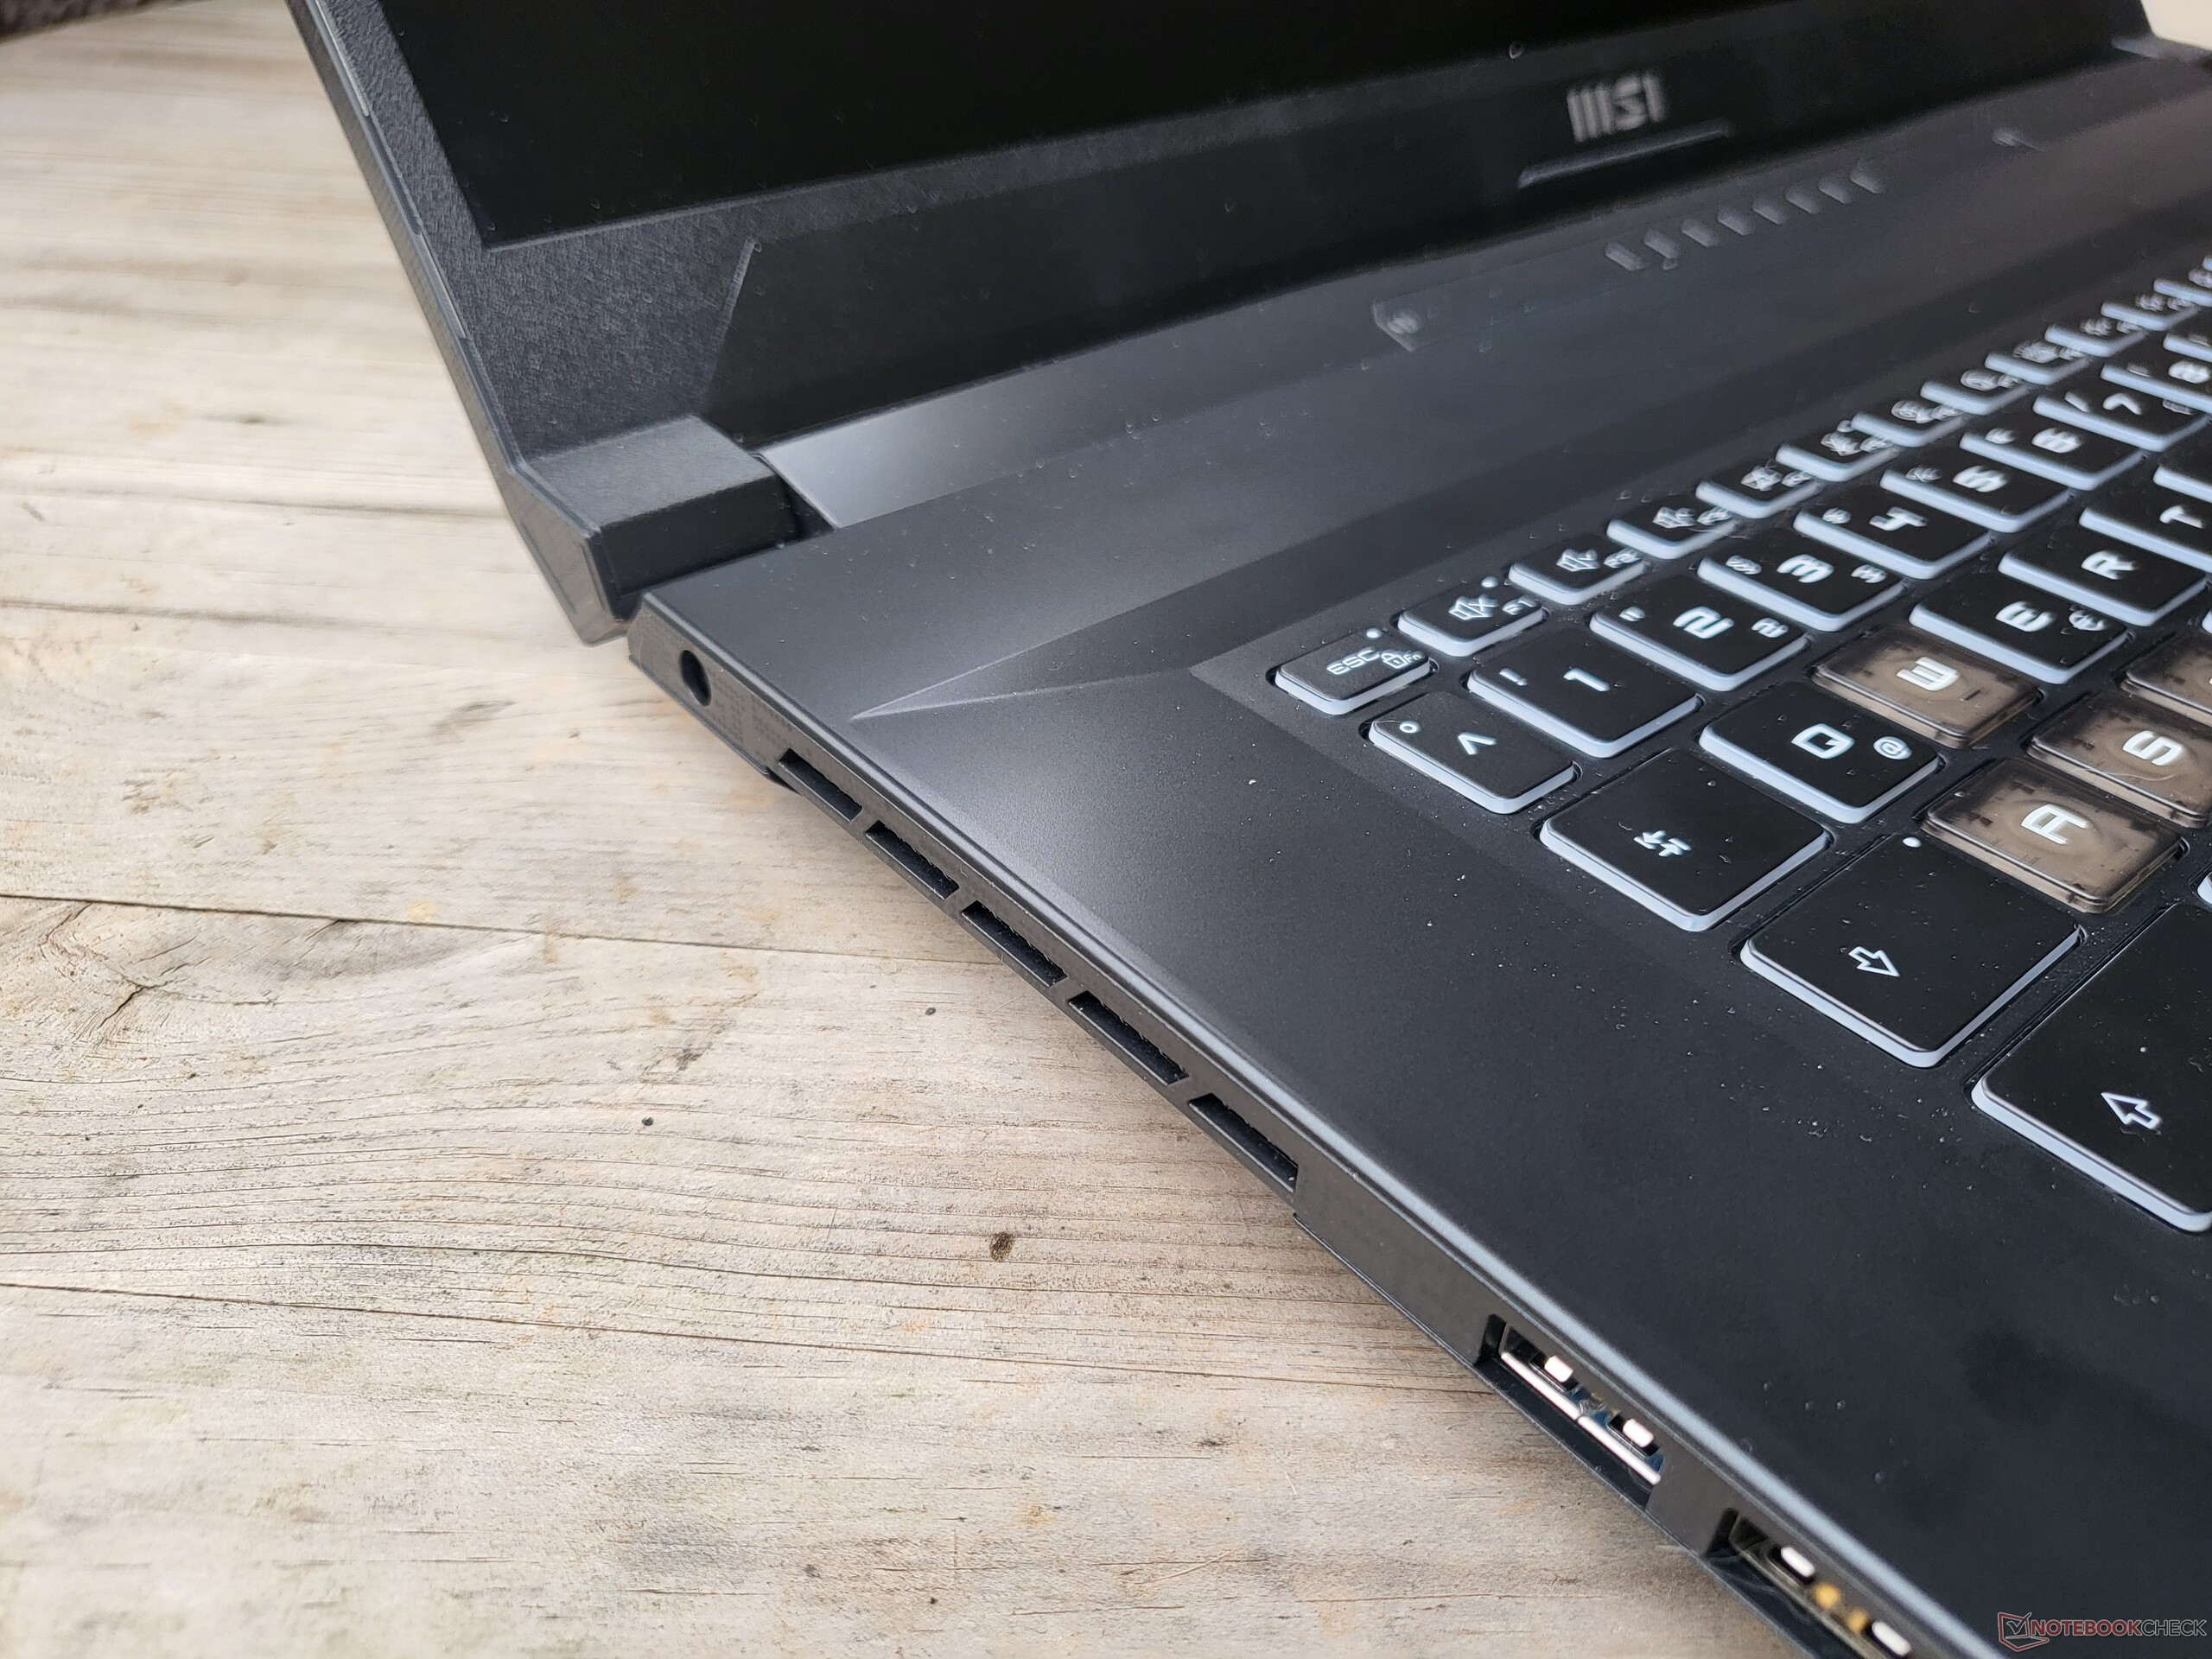
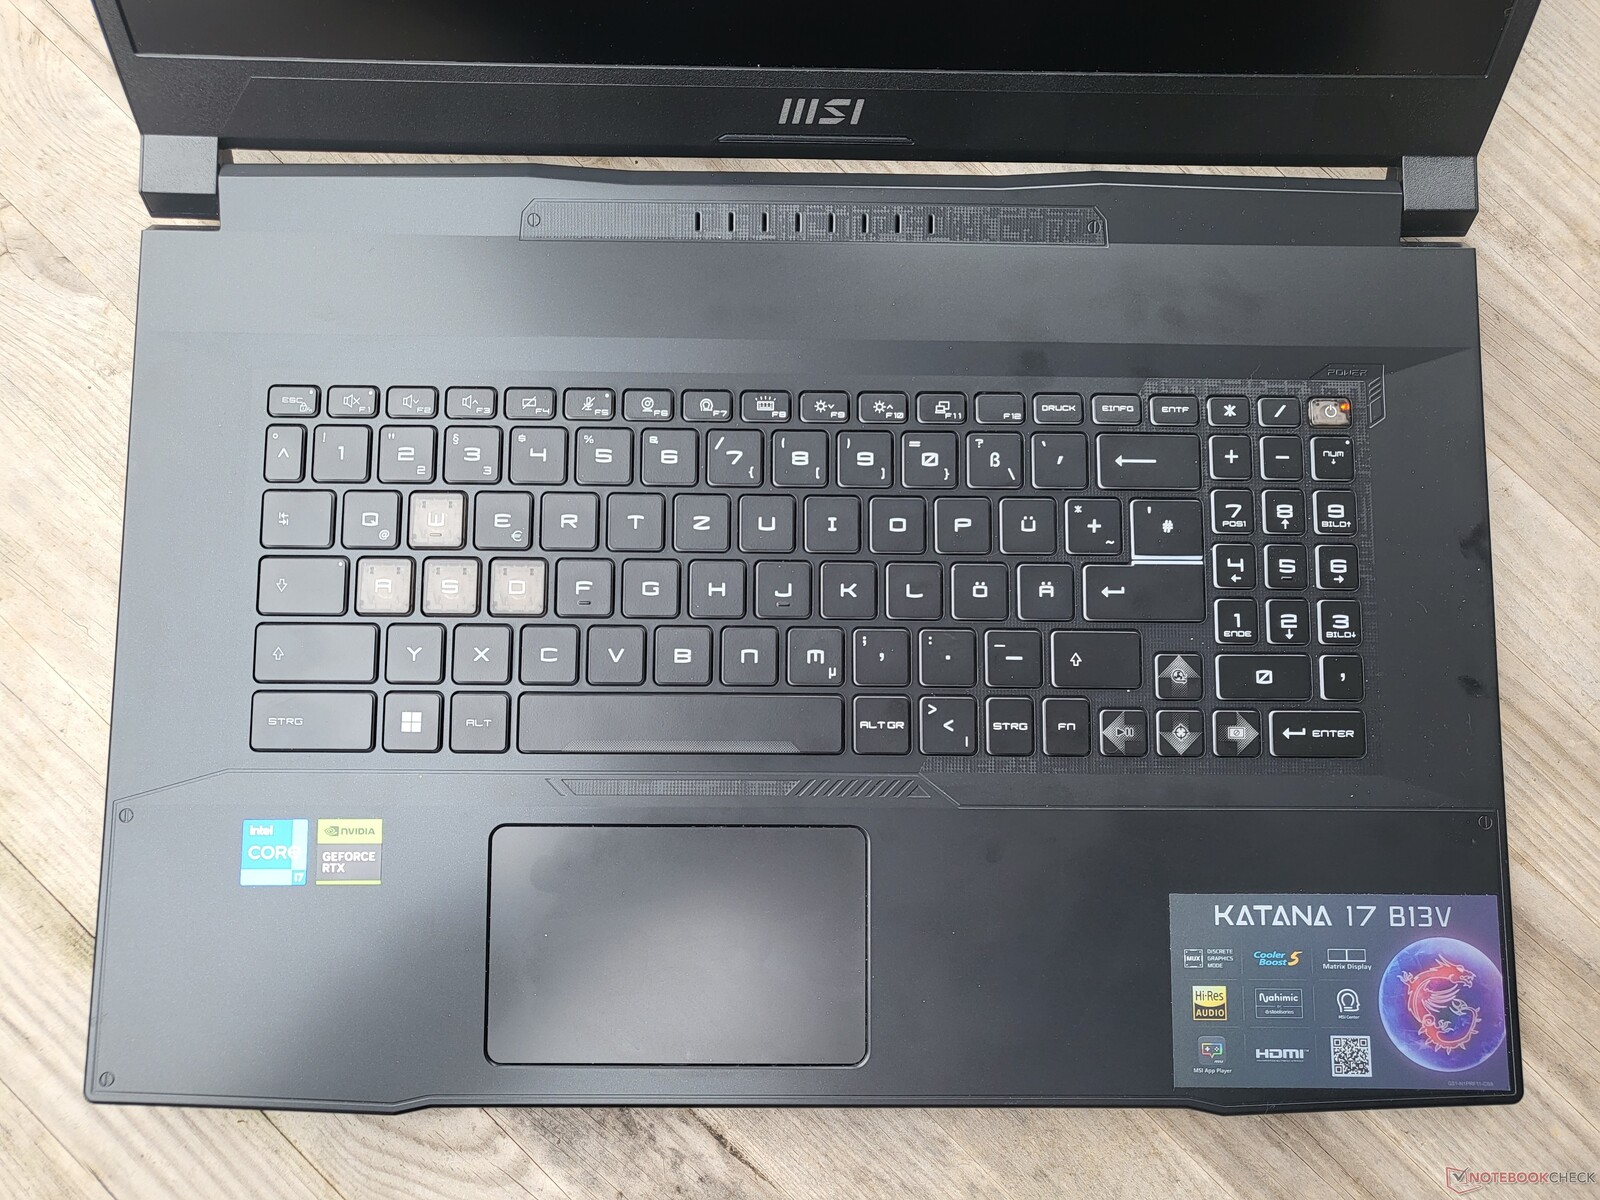
Dispositivi di input: Buona tastiera, layout strano
Tastiera
Innanzitutto gli aspetti positivi: La tastiera chiclet è dotata di retroilluminazione RGB multilivello (quattro zone, configurabili) e offre, per gli standard odierni, una corsa dei tasti molto generosa di 1,7 mm. MSI ha scelto un'ottima tastiera per il Katana 17 B13V. L'esperienza di digitazione è meravigliosa e l'evidenziazione dei tasti WASD si adatta bene al design del gioco, così come i tasti freccia relativamente grandi.
Tuttavia, è difficile capire perché MSI non abbia scelto una tastiera a tutta larghezza. Alcuni tasti sono più piccoli del normale e, in particolare, il tastierino numerico è minuscolo. In generale, ci troviamo di fronte a un layout di tastiera molto insolito e scomodo. Il tasto FN si trova in una posizione assurda, il tasto shift destro è notevolmente più piccolo e, come se non bastasse, si tratta di un layout ANSI con un tasto di invio stretto, il che significa che il tasto # è spostato. Non è un problema per il mercato mondiale, ma è molto insolito qui in Germania.
Touchpad
Il touchpad dell'MSI Katana 17 misura 10,5 x 6,5 cm - troppo piccolo per gli standard attuali e anche in relazione alle dimensioni del dispositivo. Per i nostri gusti, la superficie in plastica potrebbe essere un po' più liscia e non dà una sensazione di qualità superiore. Almeno questo non vale per il meccanismo di scatto: Il click pad offre un clic uniforme e una sensazione di alta qualità. C'è poco da lamentarsi in termini di implementazione del software e, da questo punto di vista, è il tipico touchpad che si trova nei moderni portatili Windows.
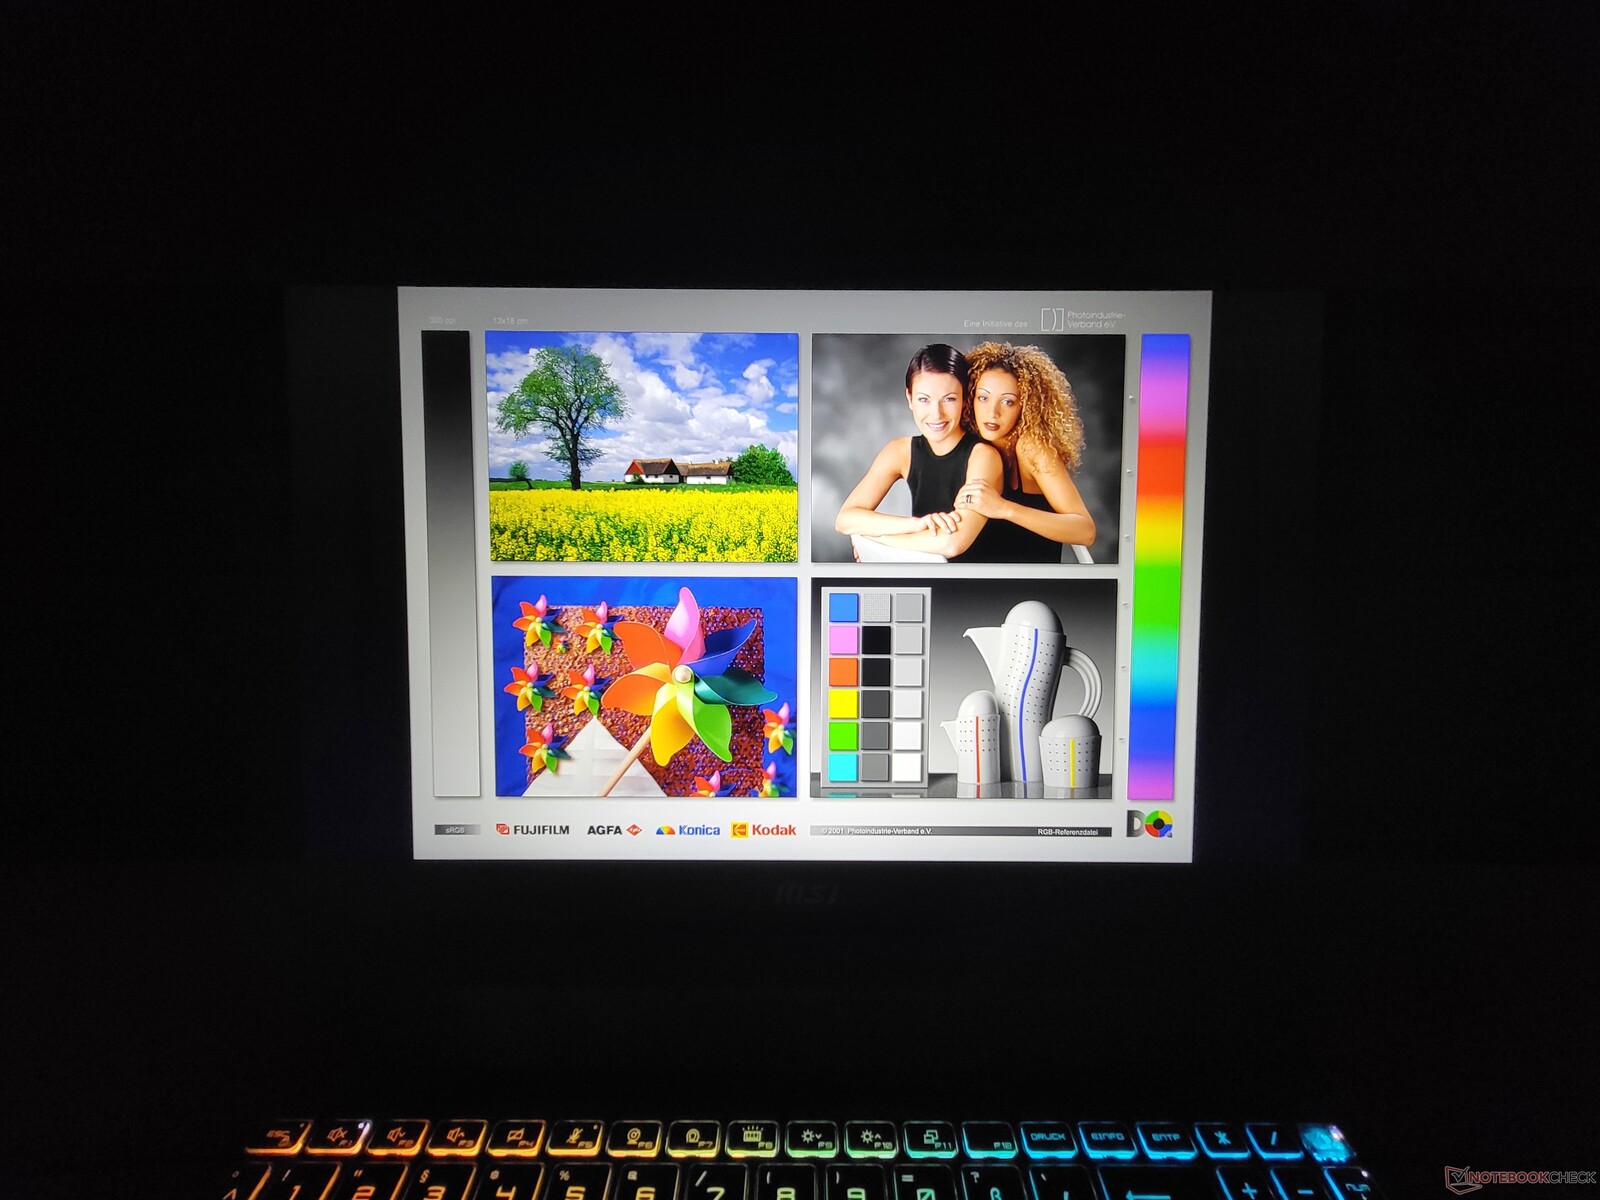
Il display dell'MSI Katana 17 è il suo anello debole
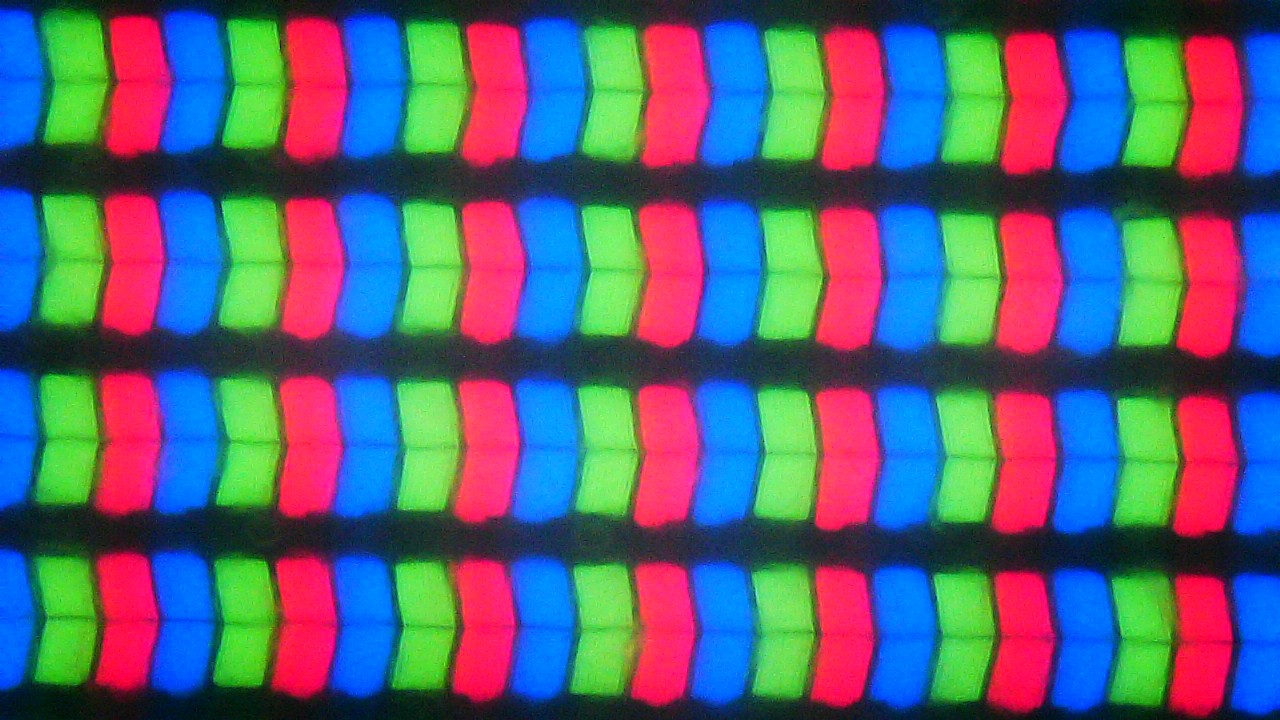
Per il Katana 17 B13V, MSI offre una sola opzione di display, un LCD IPS opaco da 17,3 pollici in formato 16:9. L'unica risoluzione disponibile è 1920 x 1080, ovvero FullHD. L'unica risoluzione disponibile è 1920 x 1080, in altre parole, FullHD. Si tratta di una risoluzione relativamente bassa per un monitor di queste dimensioni, anche se almeno si tratta di un display a 144 Hz.
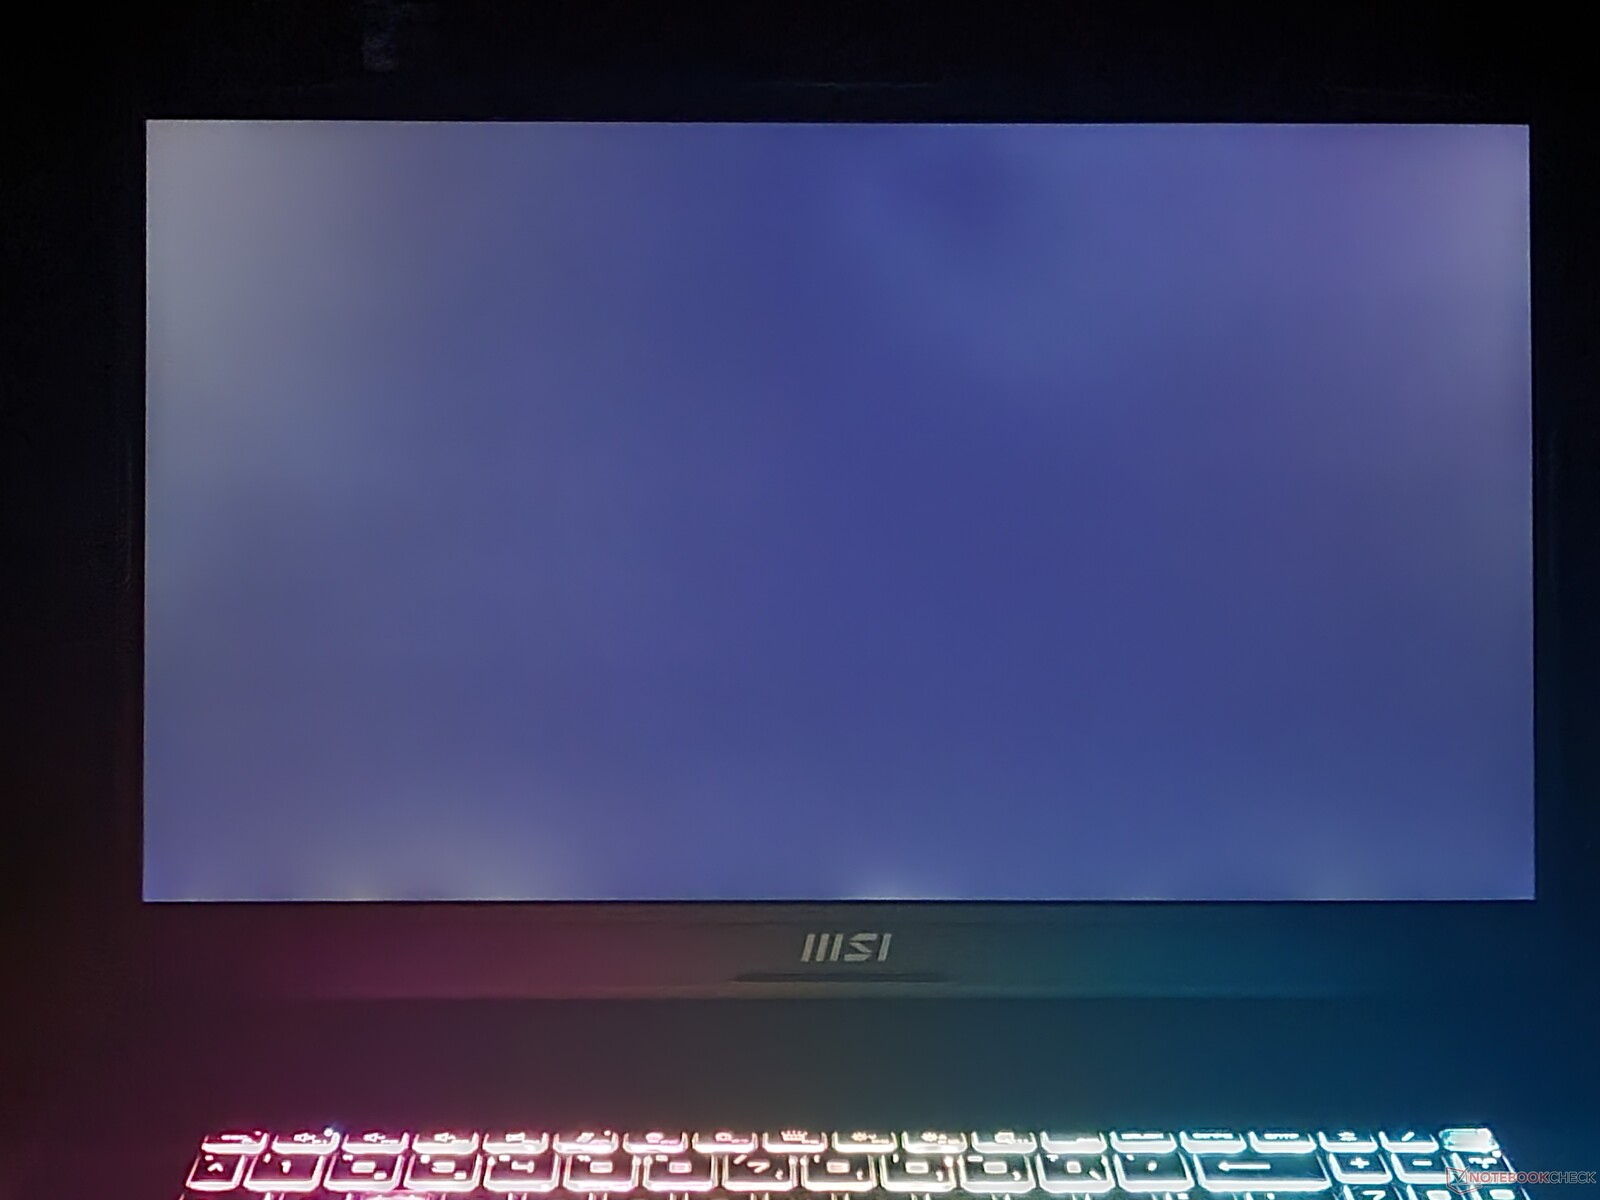
Purtroppo, la qualità del pannello di AUO lascia molto a desiderare. Con circa 256 cd/m², la luminosità del display è inferiore a quella della concorrenza. Anche i tempi di risposta sono scarsi per un portatile da gioco.
| |||||||||||||||||||||||||
Distribuzione della luminosità: 93 %
Al centro con la batteria: 267 cd/m²
Contrasto: 1271:1 (Nero: 0.21 cd/m²)
ΔE ColorChecker Calman: 4.7 | ∀{0.5-29.43 Ø4.73}
calibrated: 4.5
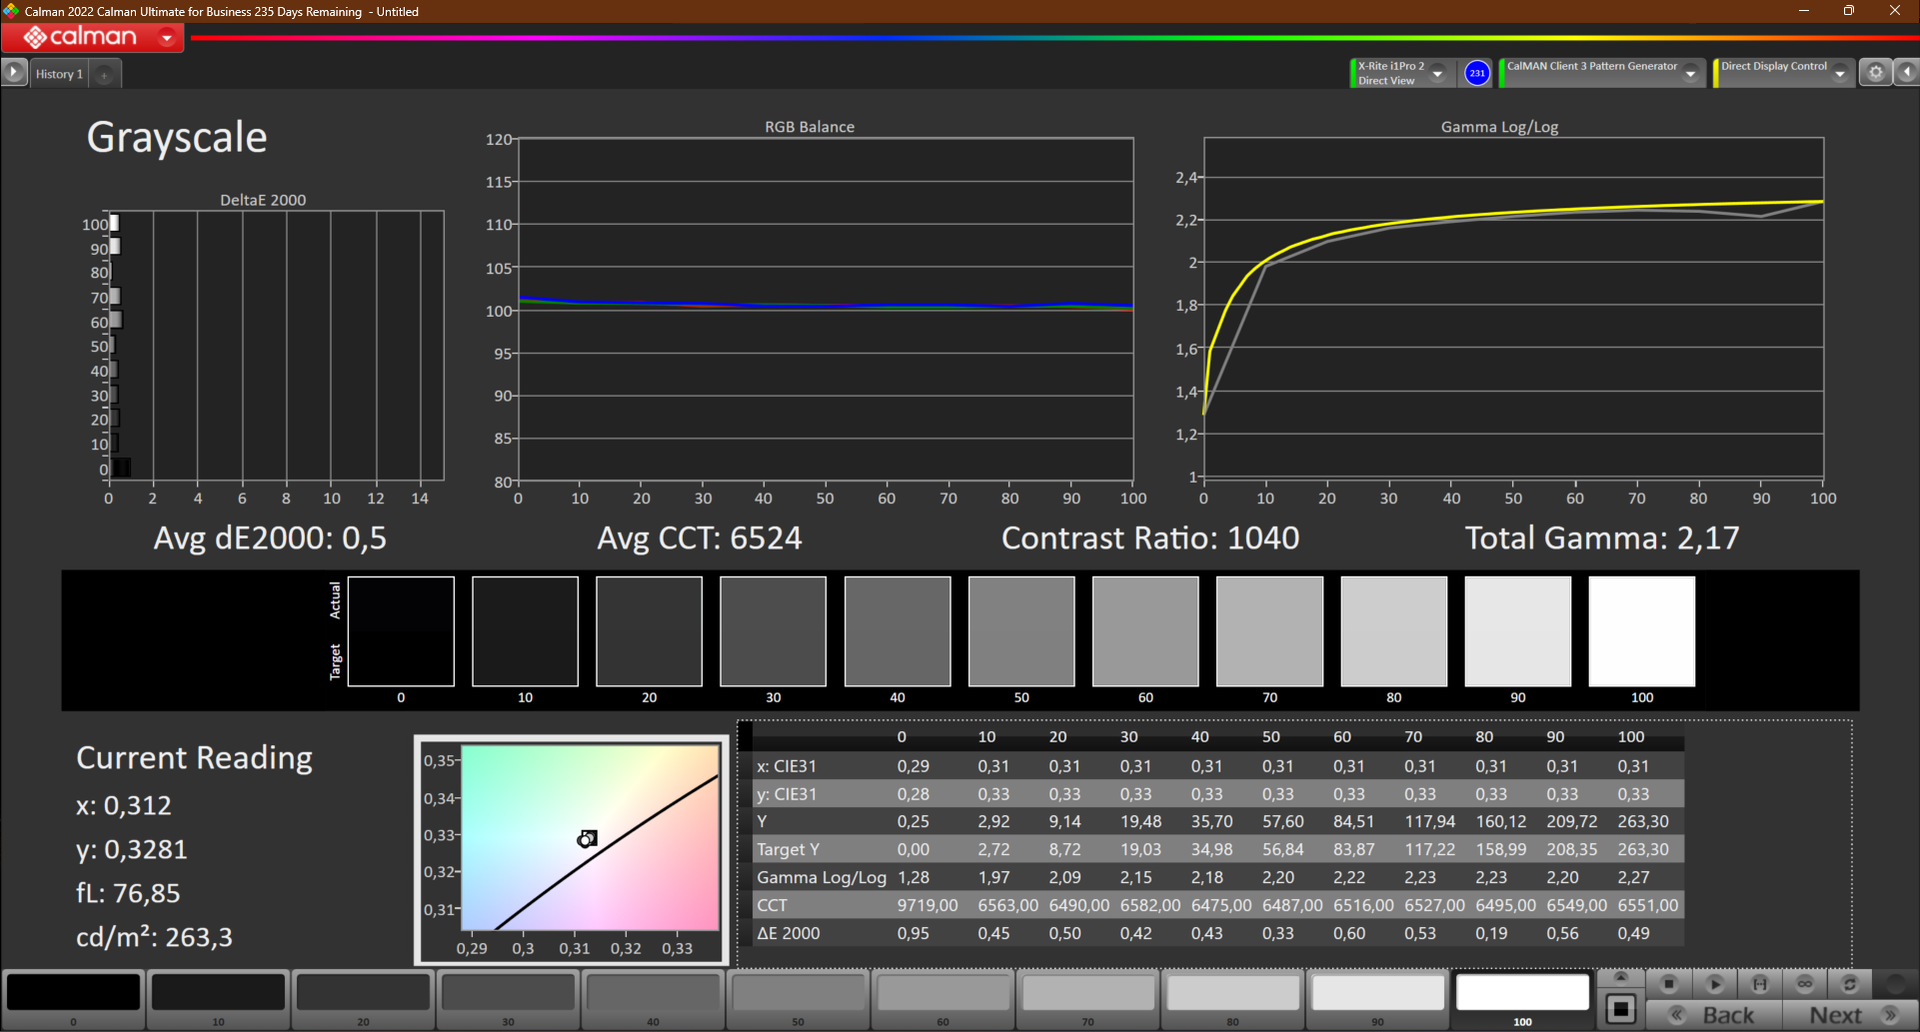
ΔE Greyscale Calman: 1.5 | ∀{0.09-98 Ø4.97}
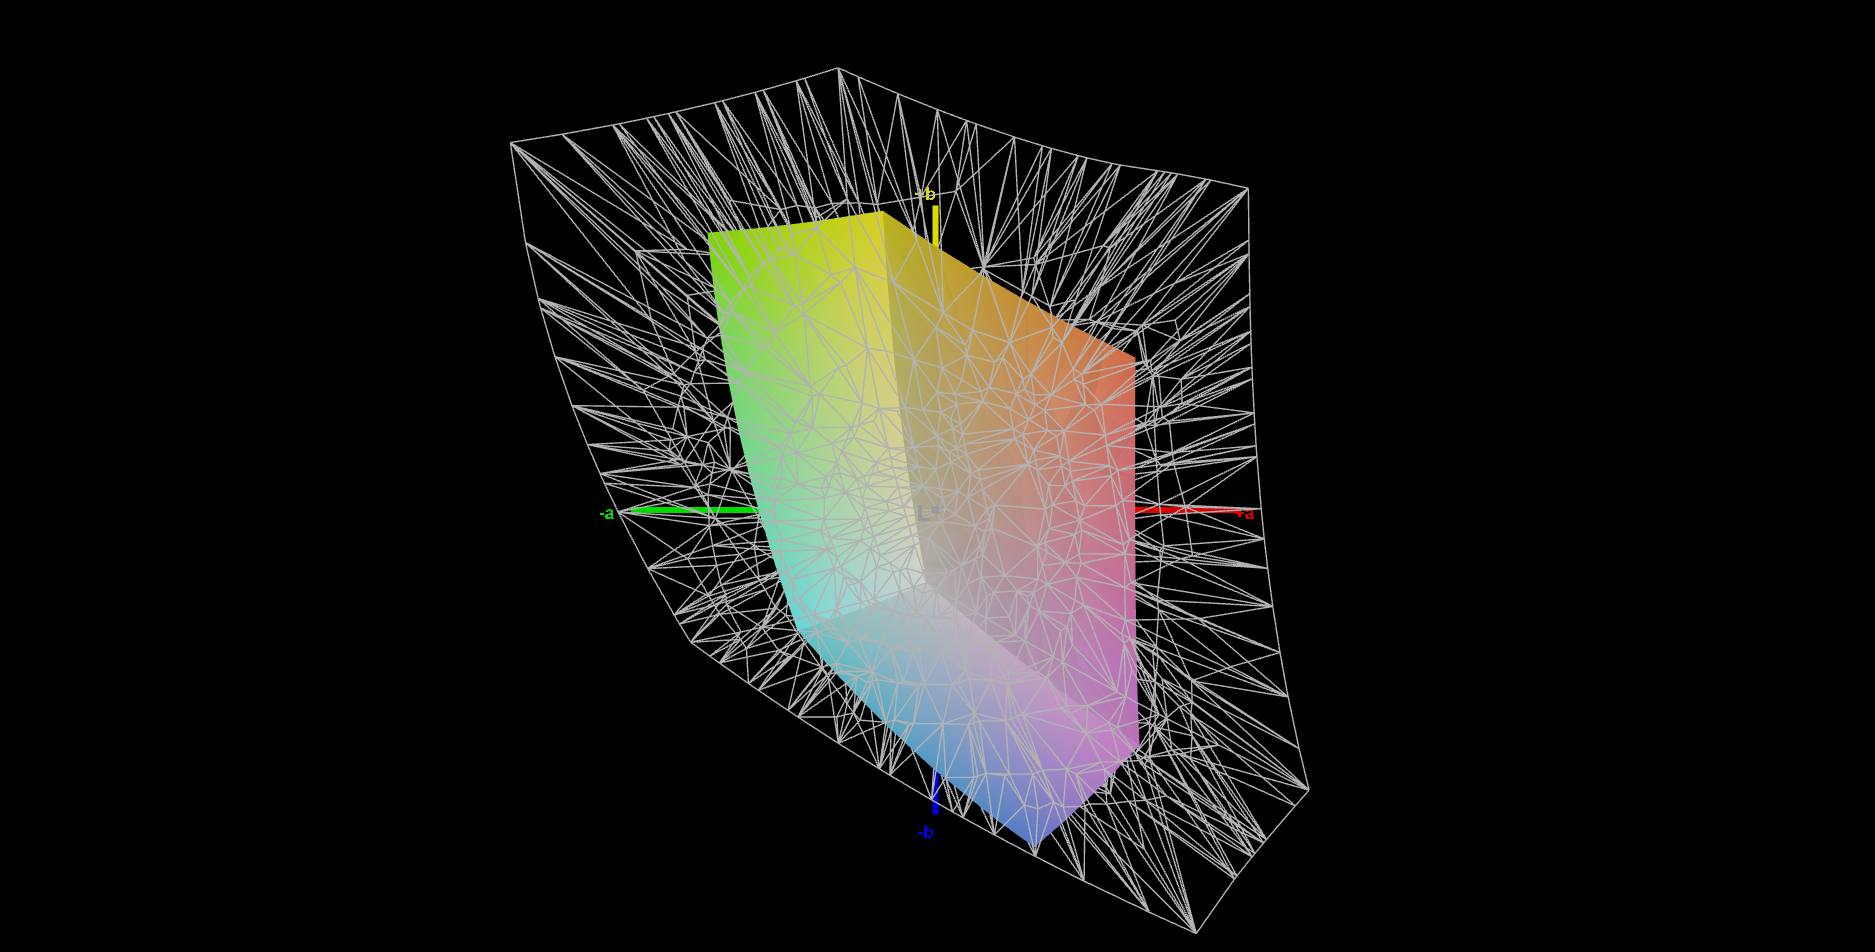
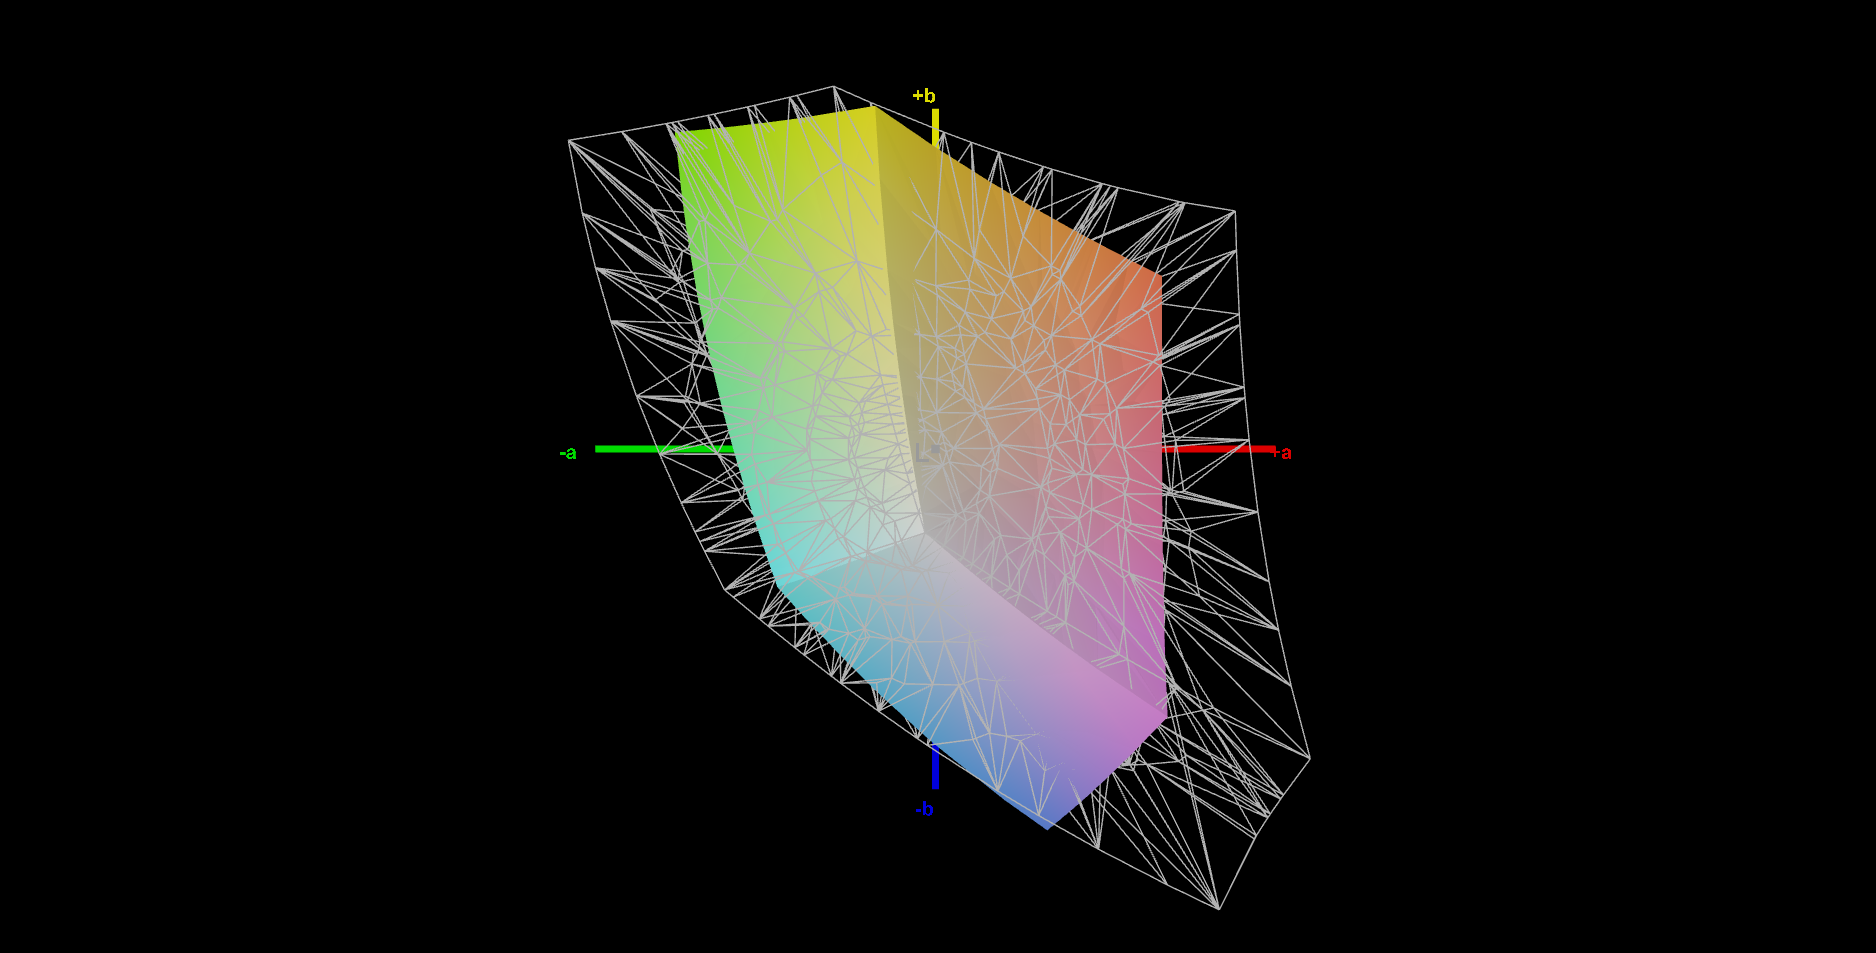
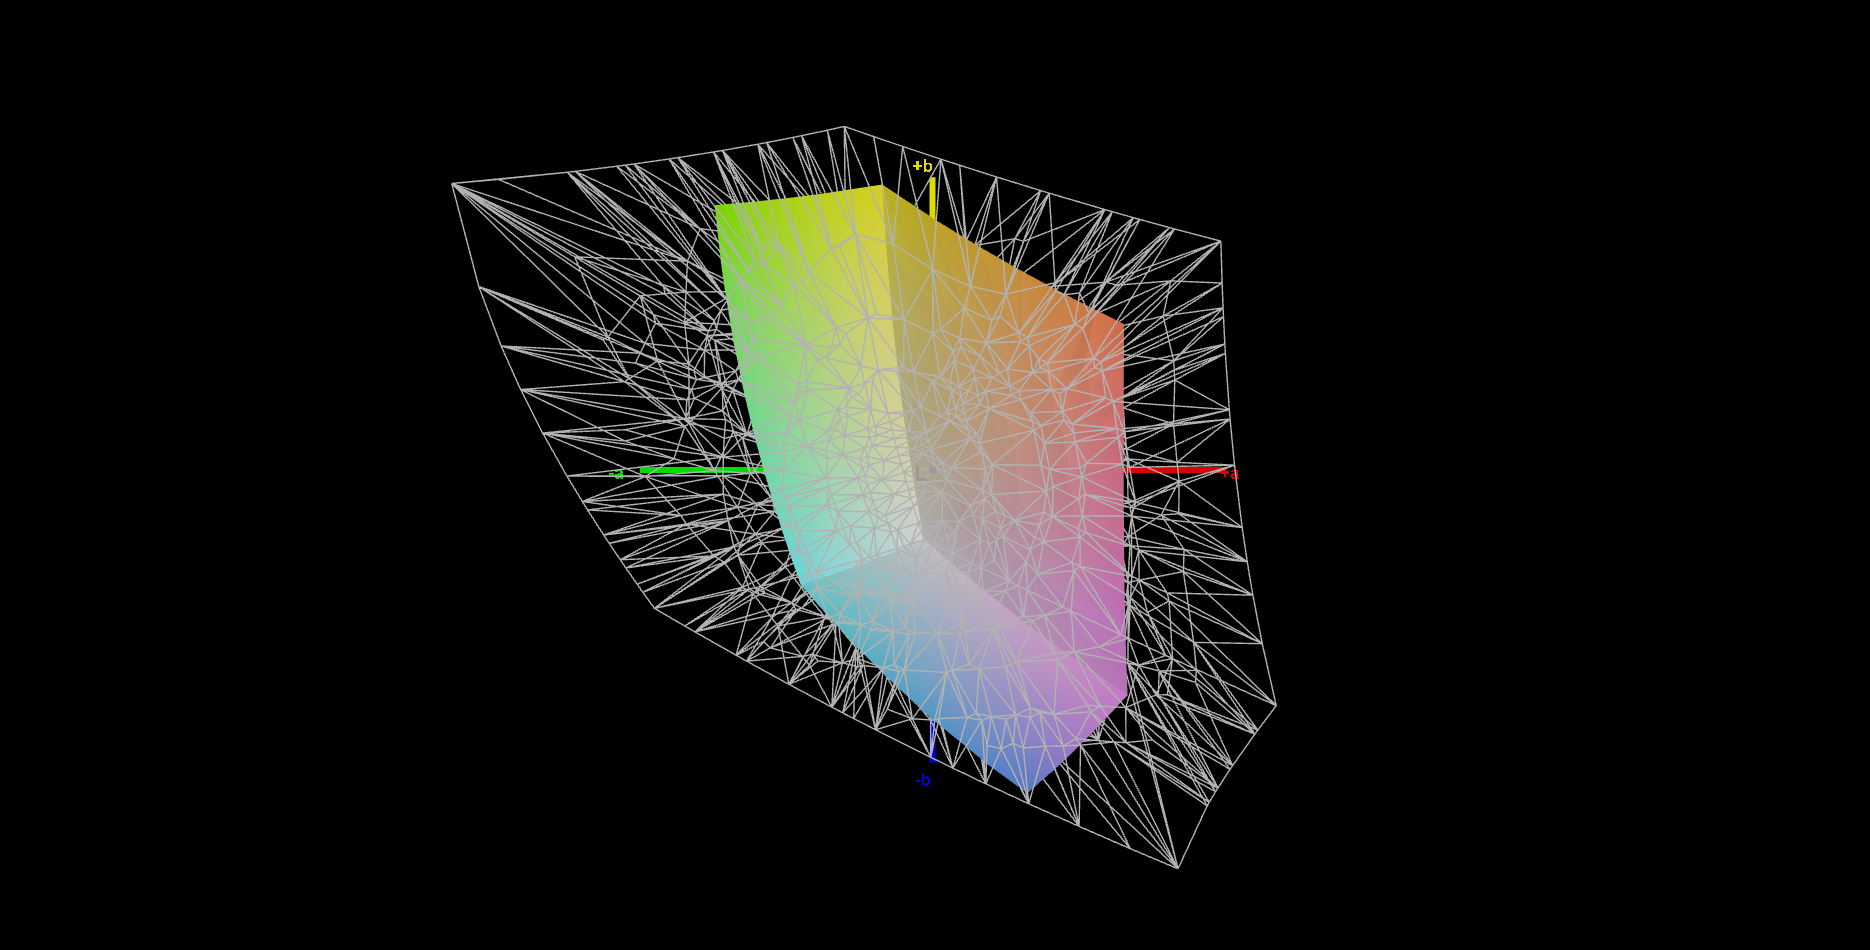
42.2% AdobeRGB 1998 (Argyll 3D)
61% sRGB (Argyll 3D)
40.8% Display P3 (Argyll 3D)
Gamma: 2.12
CCT: 6552 K
| MSI Katana 17 B13VFK B173HAN04.9, IPS LED, 1920x1080, 17.3" | MSI Titan GT77 HX 13VI B173ZAN06.C, Mini-LED, 3840x2160, 17.3" | MSI Pulse GL76 12UGK Sharp LQ173M1JW08, IPS, 1920x1080, 17.3" | Gigabyte G7 KE AU Optronics B173HAN05.1, IPS, 1920x1080, 17.3" | Asus ROG Strix Scar 17 SE G733CX-LL014W NE173QHM-NZ2, IPS, 2560x1440, 17.3" | Acer Predator Helios 300 (i7-12700H, RTX 3070 Ti) BOE0A1A, IPS, 2560x1440, 17.3" | |
|---|---|---|---|---|---|---|
| Display | 105% | 72% | 69% | 101% | 101% | |
| Display P3 Coverage (%) | 40.8 | 94.9 133% | 71.9 76% | 70.4 73% | 97.1 138% | 96.8 137% |
| sRGB Coverage (%) | 61 | 99.9 64% | 99.9 64% | 99.8 64% | 99.9 64% | 99.9 64% |
| AdobeRGB 1998 Coverage (%) | 42.2 | 92.4 119% | 73.7 75% | 71.7 70% | 84.8 101% | 84.8 101% |
| Response Times | -9% | 72% | 77% | 72% | 54% | |
| Response Time Grey 50% / Grey 80% * (ms) | 33 ? | 38.4 ? -16% | 4.6 ? 86% | 5 ? 85% | 5.7 ? 83% | 16.4 ? 50% |
| Response Time Black / White * (ms) | 26 ? | 26.6 ? -2% | 11.2 ? 57% | 8.3 ? 68% | 10.1 ? 61% | 11.2 ? 57% |
| PWM Frequency (Hz) | 2380 ? | |||||
| Screen | 52982% | -21% | 27% | 21% | 4% | |
| Brightness middle (cd/m²) | 267 | 606 127% | 337.7 26% | 307 15% | 320 20% | 366 37% |
| Brightness (cd/m²) | 256 | 602 135% | 331 29% | 301 18% | 303 18% | 340 33% |
| Brightness Distribution (%) | 93 | 93 0% | 82 -12% | 93 0% | 87 -6% | 85 -9% |
| Black Level * (cd/m²) | 0.21 | 0.0001 100% | 0.31 -48% | 0.2 5% | 0.3 -43% | 0.31 -48% |
| Contrast (:1) | 1271 | 6060000 476690% | 1089 -14% | 1535 21% | 1067 -16% | 1181 -7% |
| Colorchecker dE 2000 * | 4.7 | 4.8 -2% | 4.12 12% | 1.32 72% | 1.1 77% | 3.56 24% |
| Colorchecker dE 2000 max. * | 20.4 | 8.2 60% | 8.89 56% | 4.6 77% | 2.7 87% | 5.66 72% |
| Colorchecker dE 2000 calibrated * | 4.5 | 1.8 60% | 0.98 78% | 1.03 77% | 3.31 26% | |
| Greyscale dE 2000 * | 1.5 | 6.5 -333% | 6.3 -320% | 2.1 -40% | 1.1 27% | 2.84 -89% |
| Gamma | 2.12 104% | 2.63 84% | 2.48 89% | 2.247 98% | 2.13 103% | 2.29 96% |
| CCT | 6552 99% | 6596 99% | 6542 99% | 6815 95% | 6599 98% | 6835 95% |
| Media totale (Programma / Settaggio) | 17693% /
34081% | 41% /
12% | 58% /
43% | 65% /
47% | 53% /
32% |
* ... Meglio usare valori piccoli
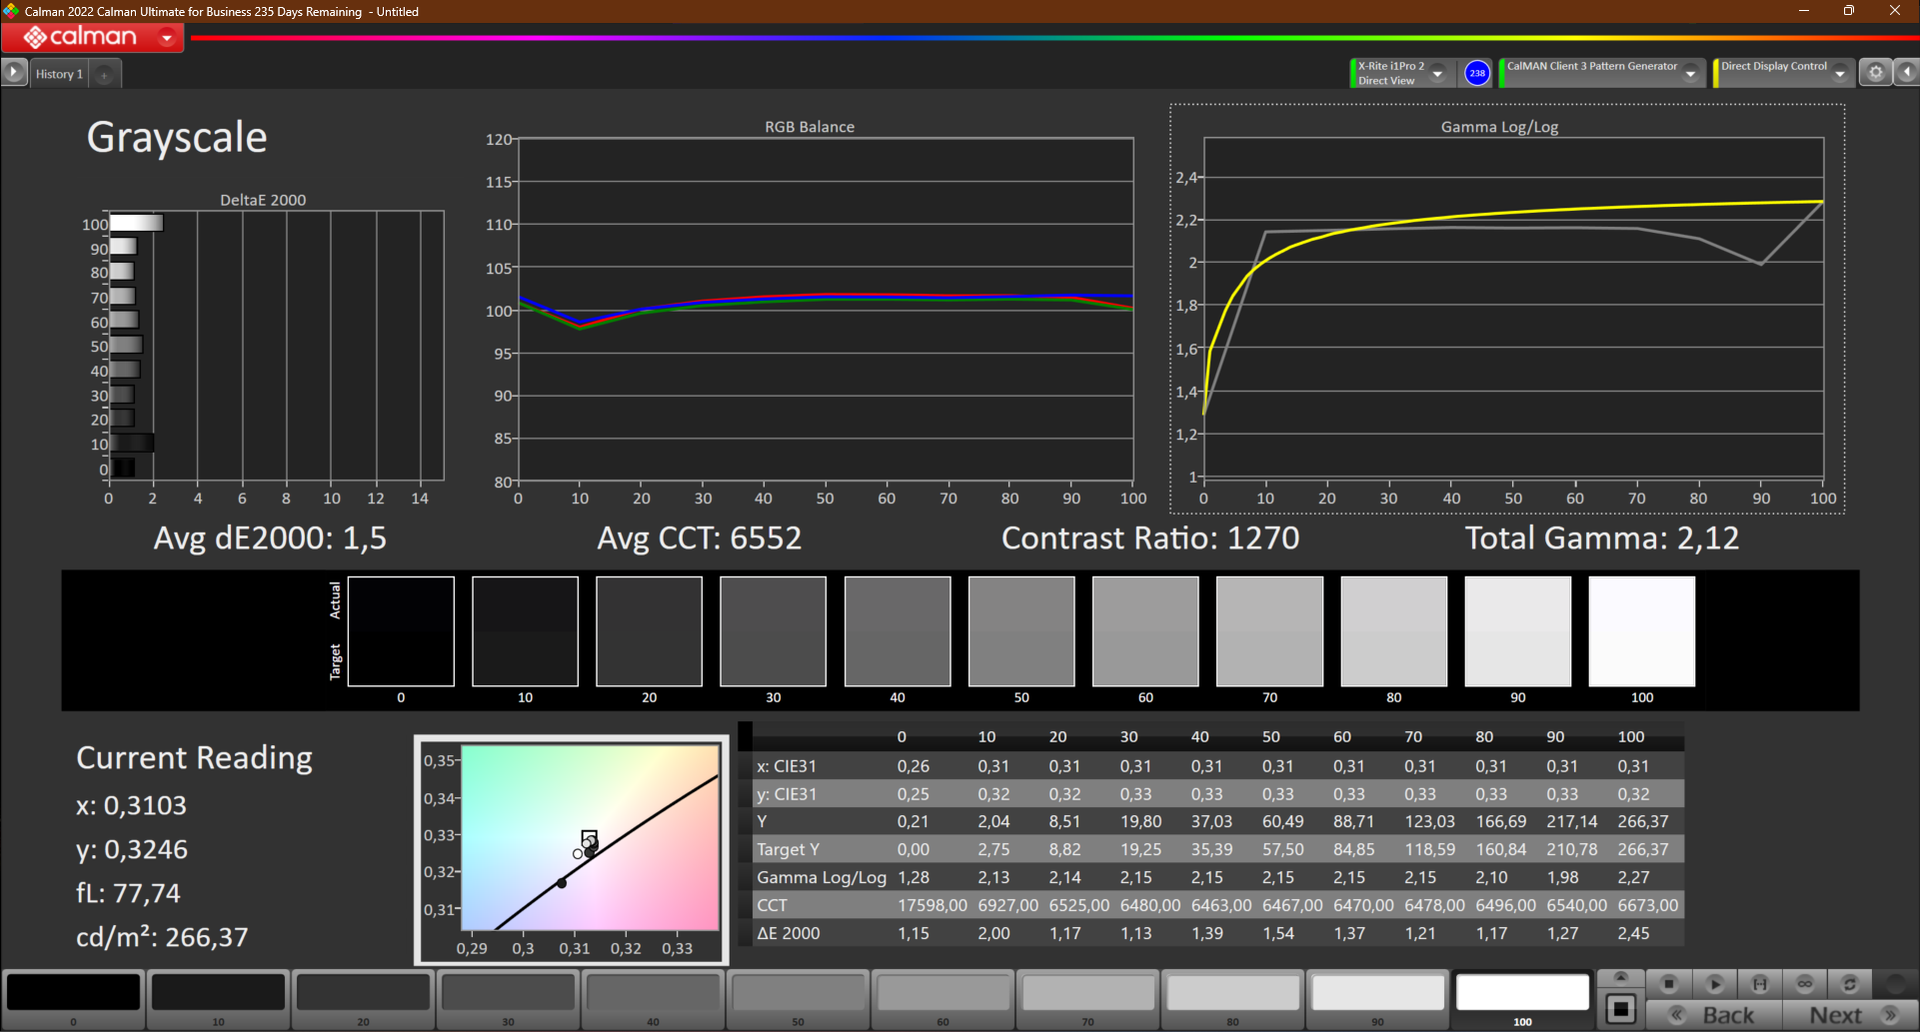
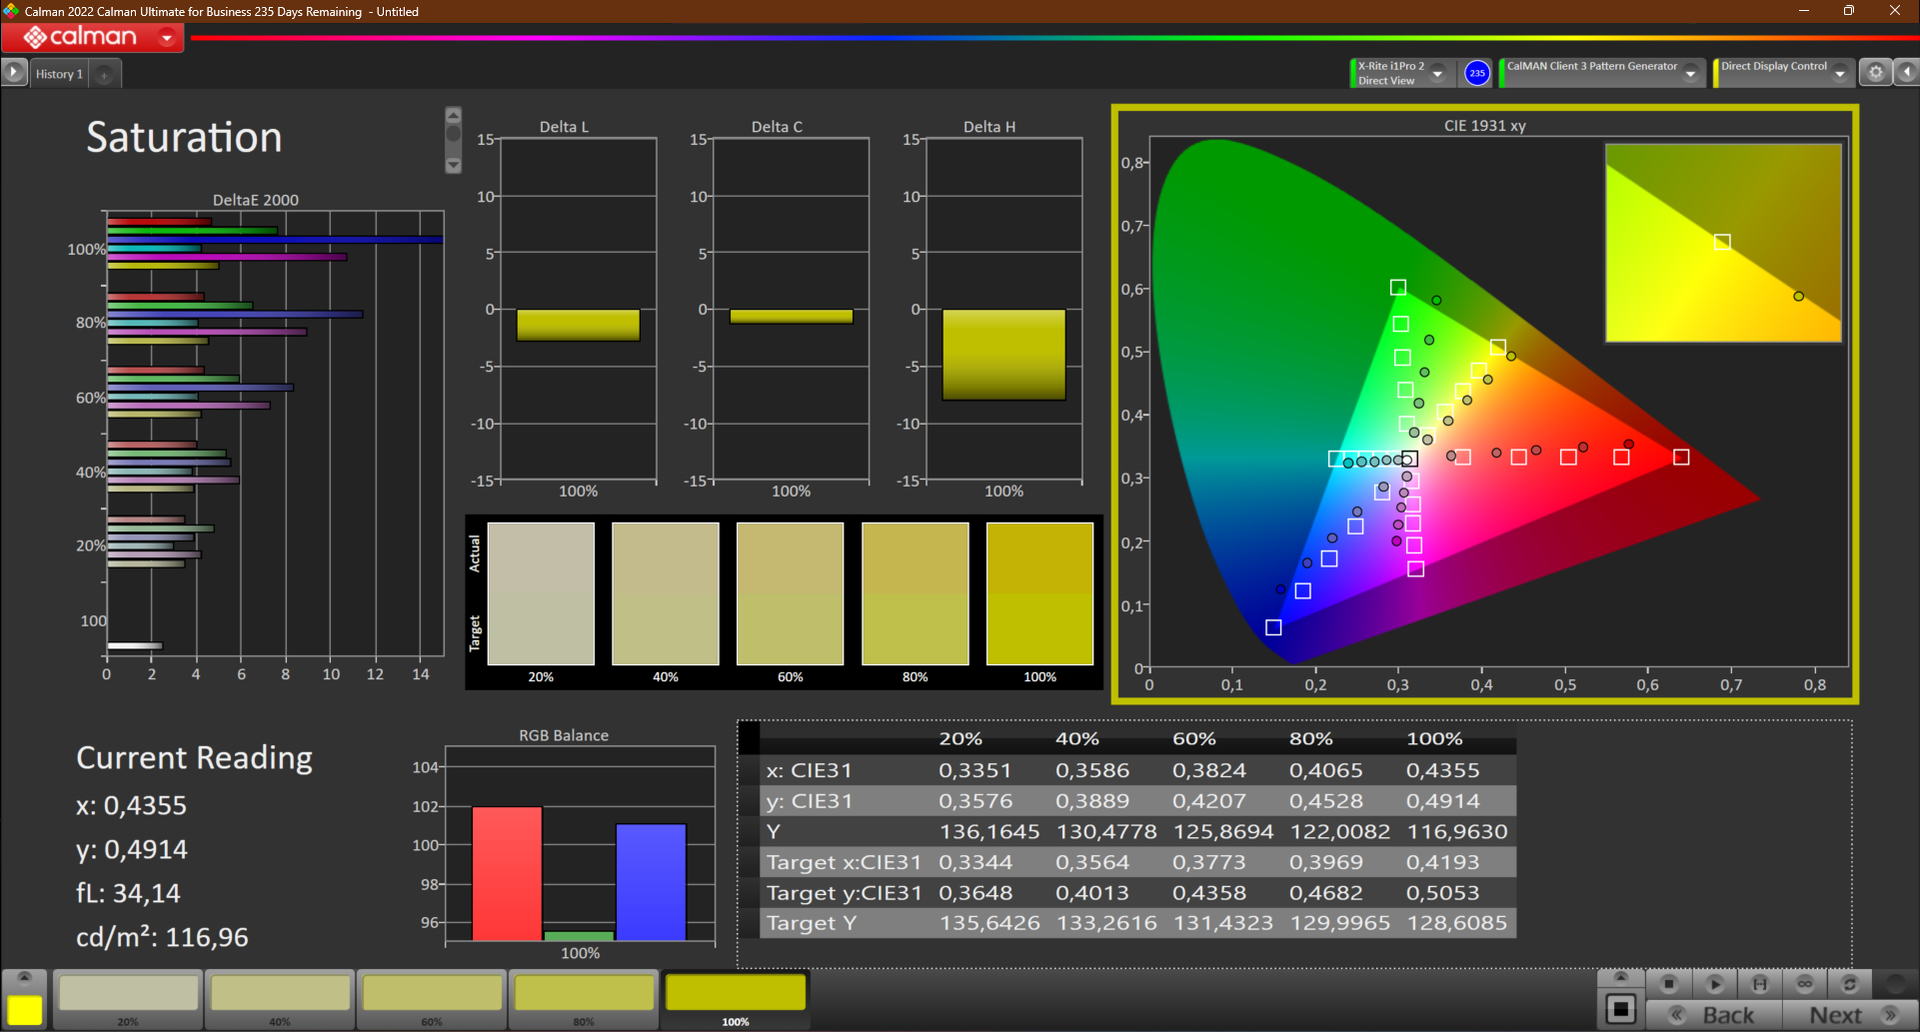
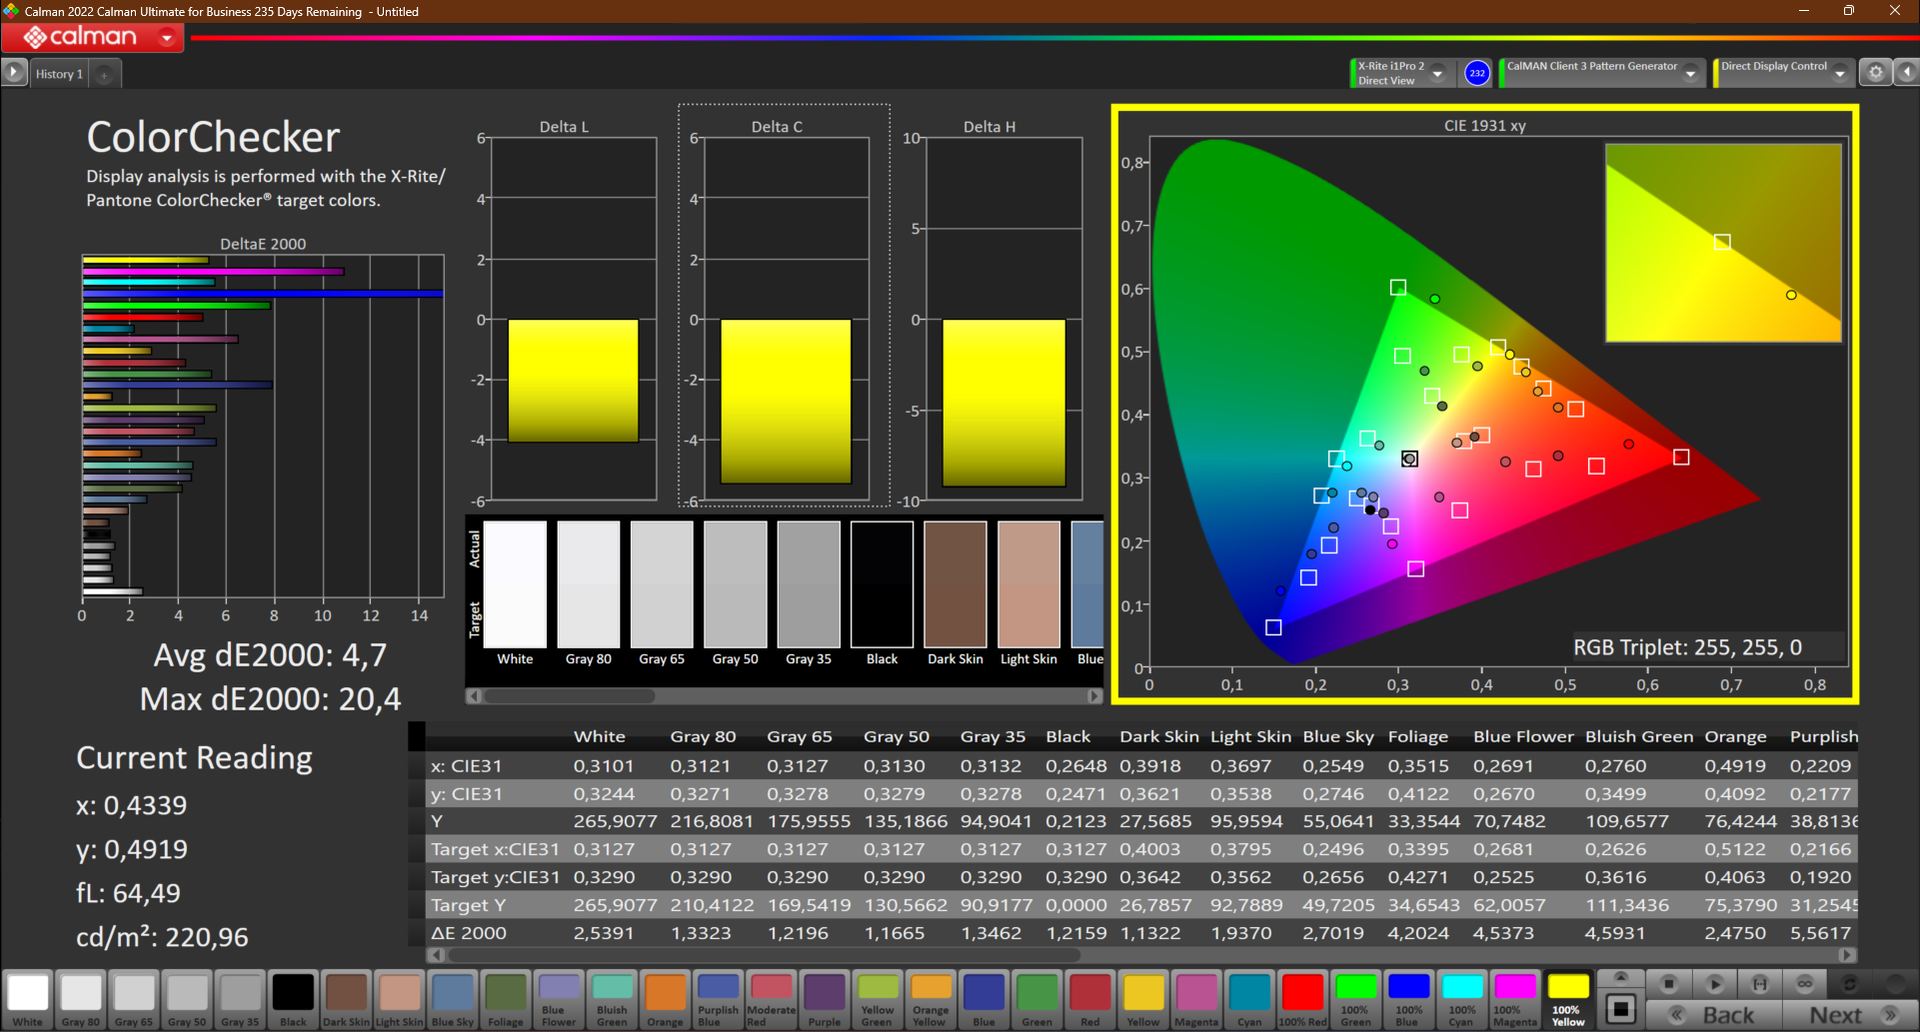
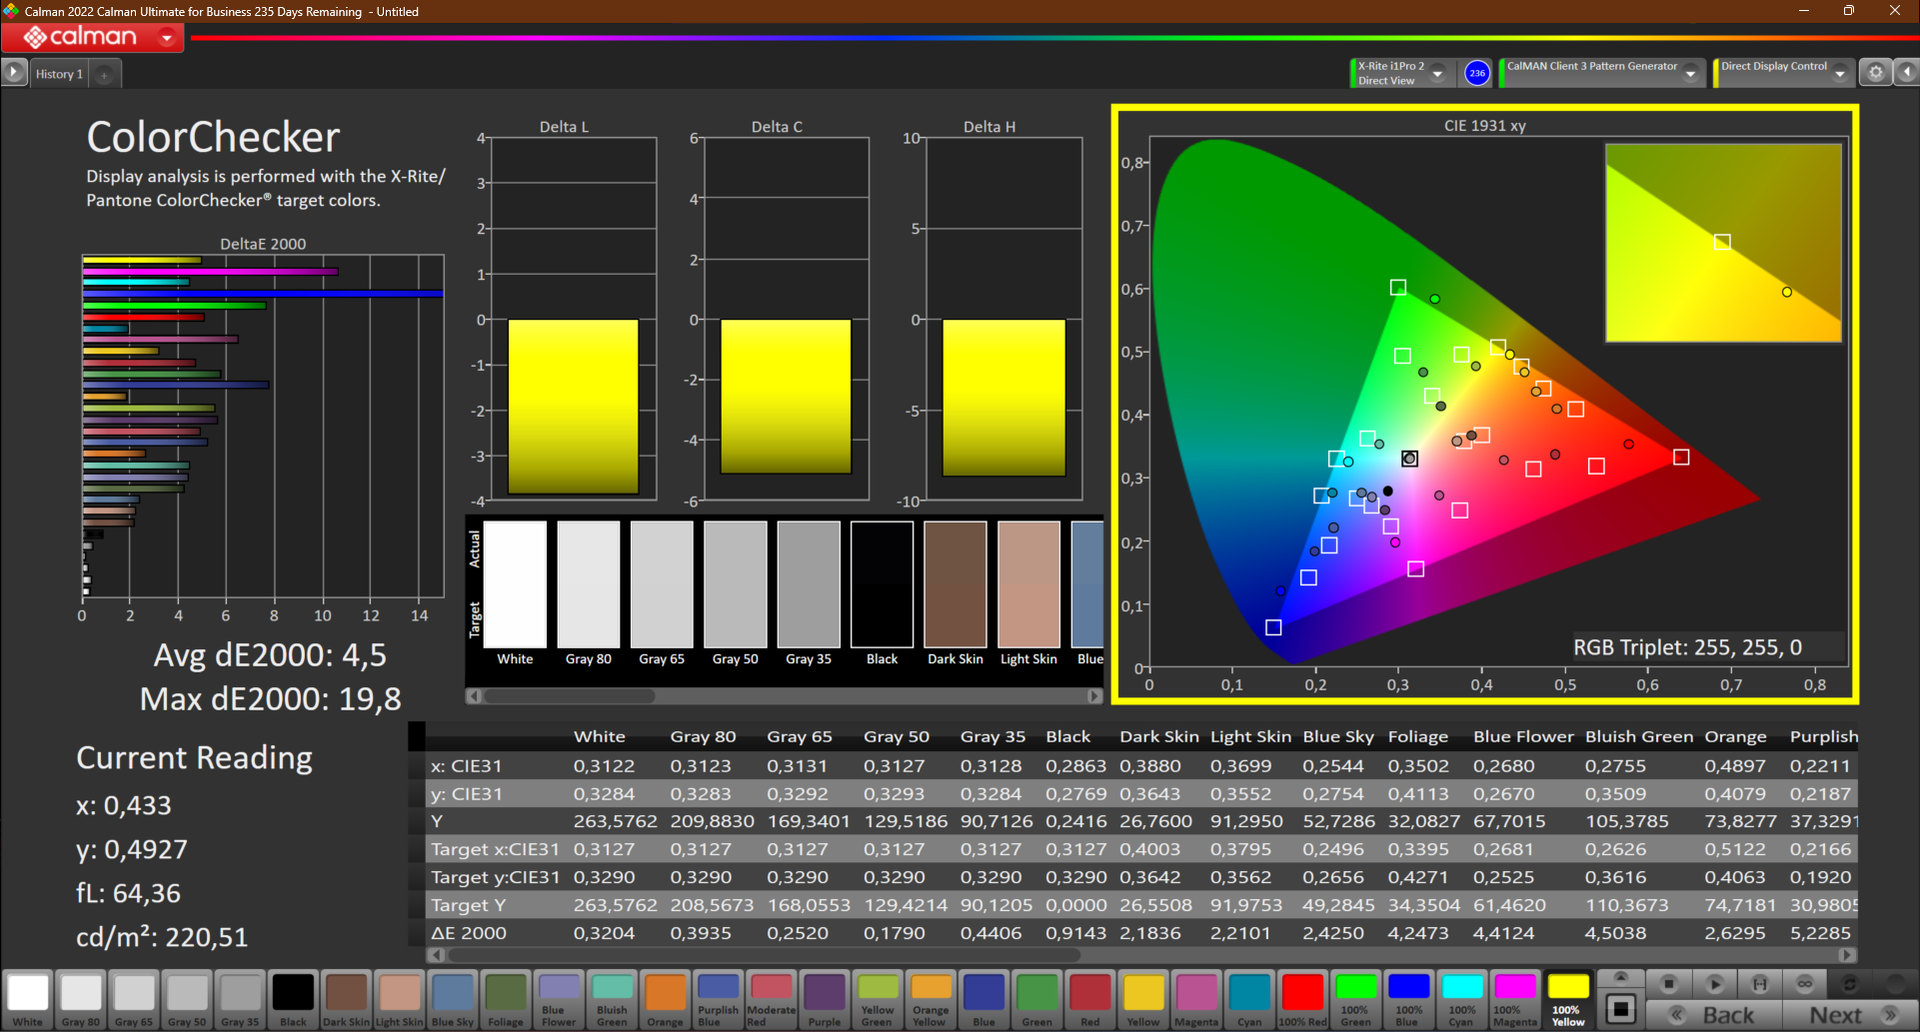
Per quanto riguarda la rappresentazione dei colori, l'impressione non proprio positiva del display continua. Anche dopo la calibrazione, il pannello è ben lontano dal visualizzare colori accurati. Dopo la calibrazione con i1Profiler e X-Rite i1Pro 2, il DeltaE-Wert è sceso solo minimamente da 4,7 a 4,5. La causa potrebbe essere la mancanza di copertura dello spazio colore.
La causa potrebbe essere la mancanza di copertura dello spazio colore. Al giorno d'oggi, solo il 61% dello spazio colore sRGB è un risultato insoddisfacente, soprattutto per un portatile orientato al consumo di media.
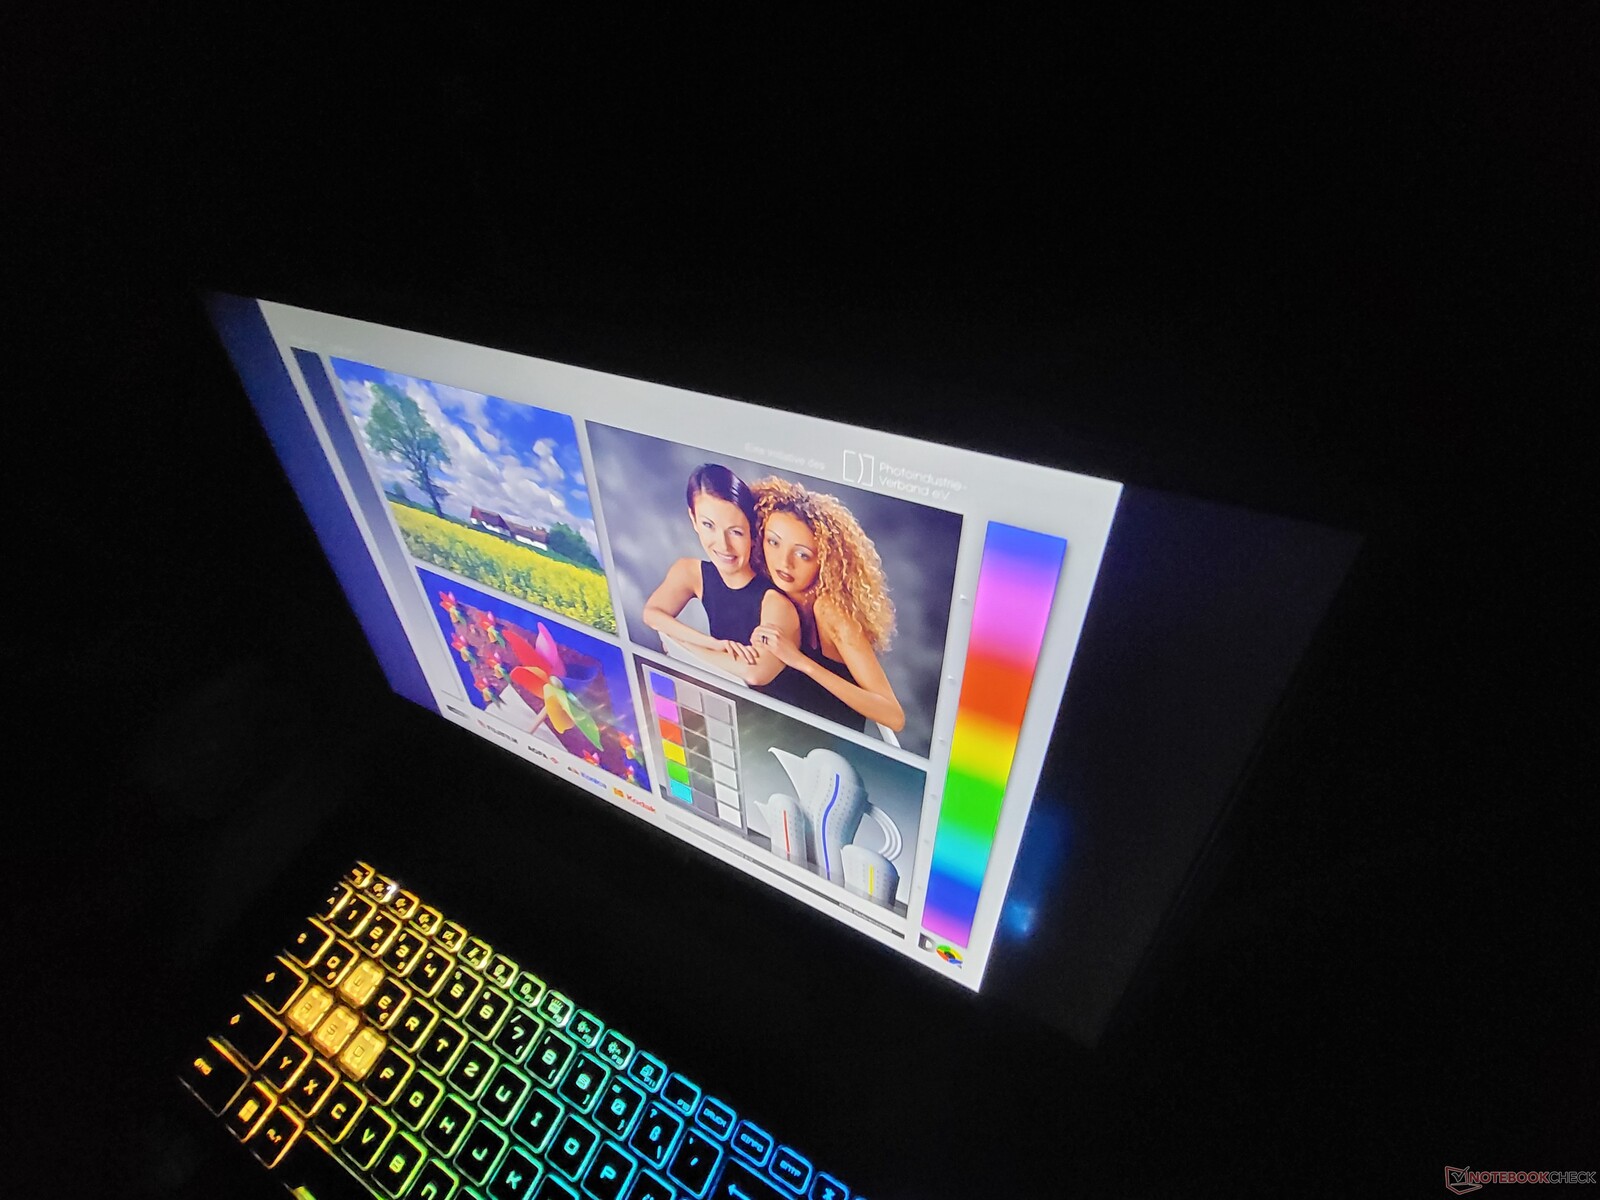
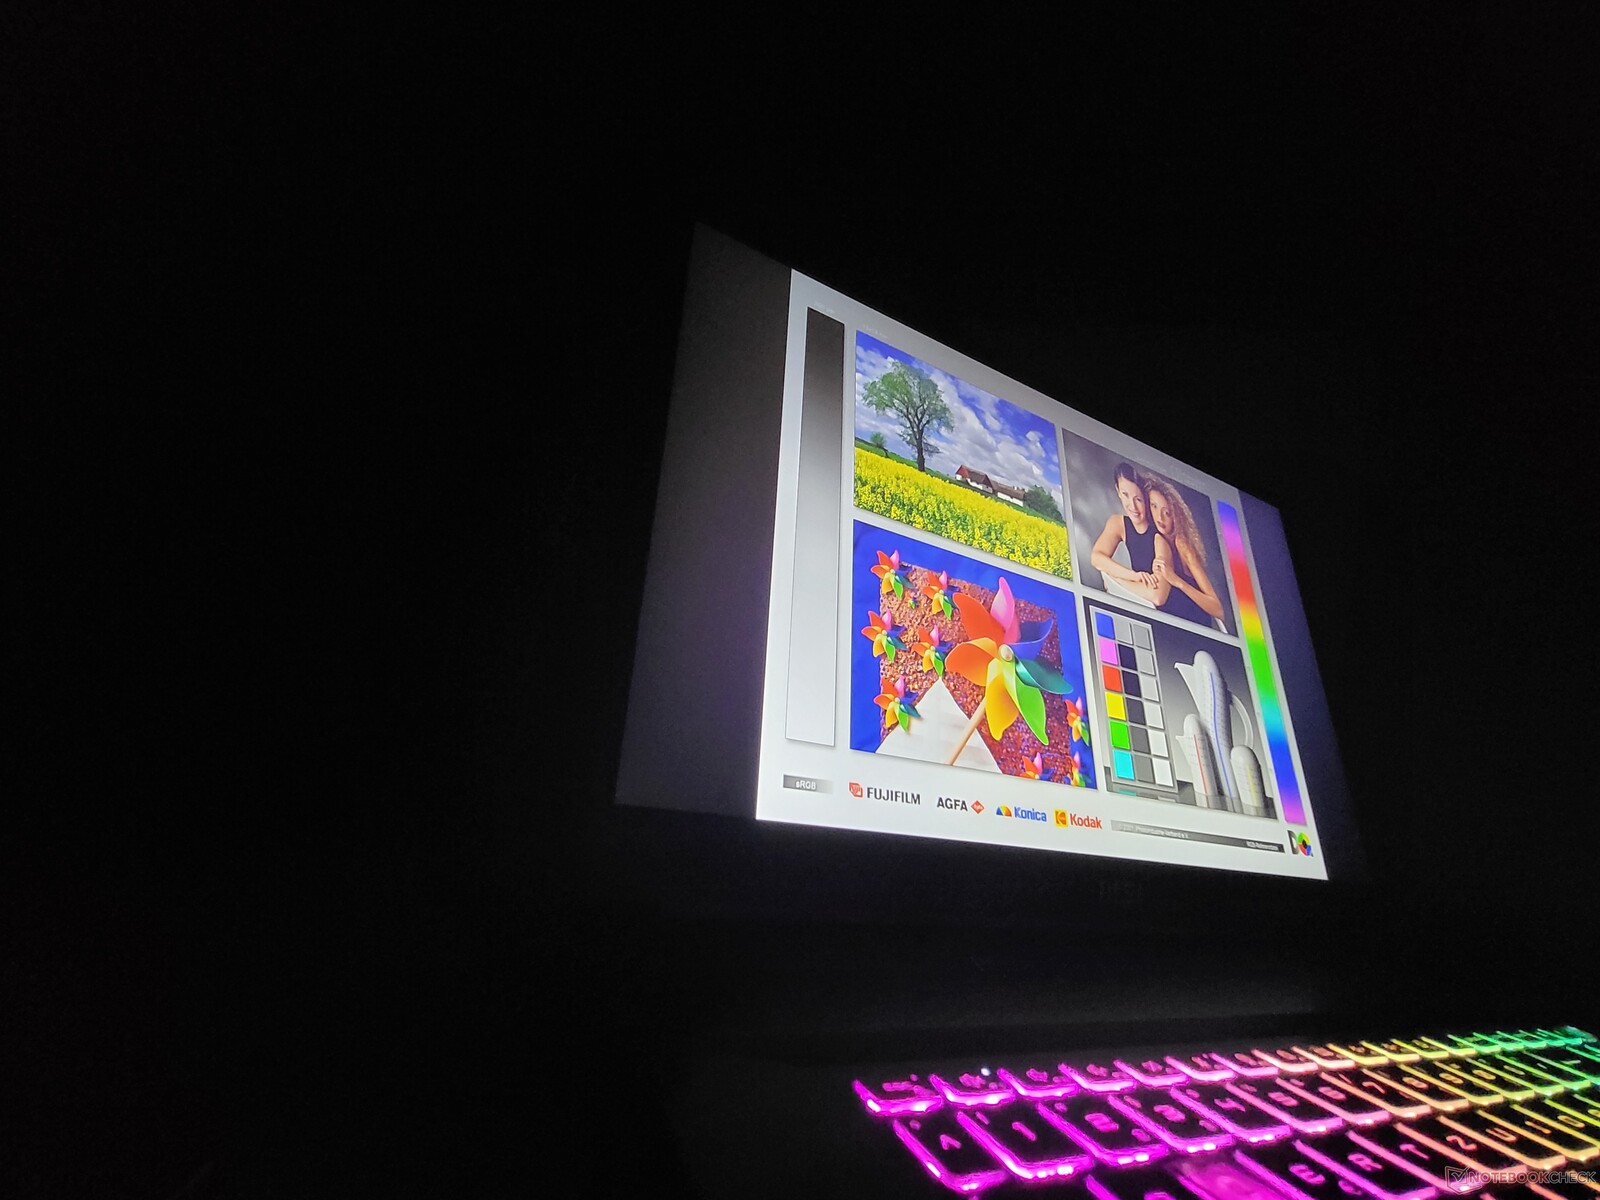
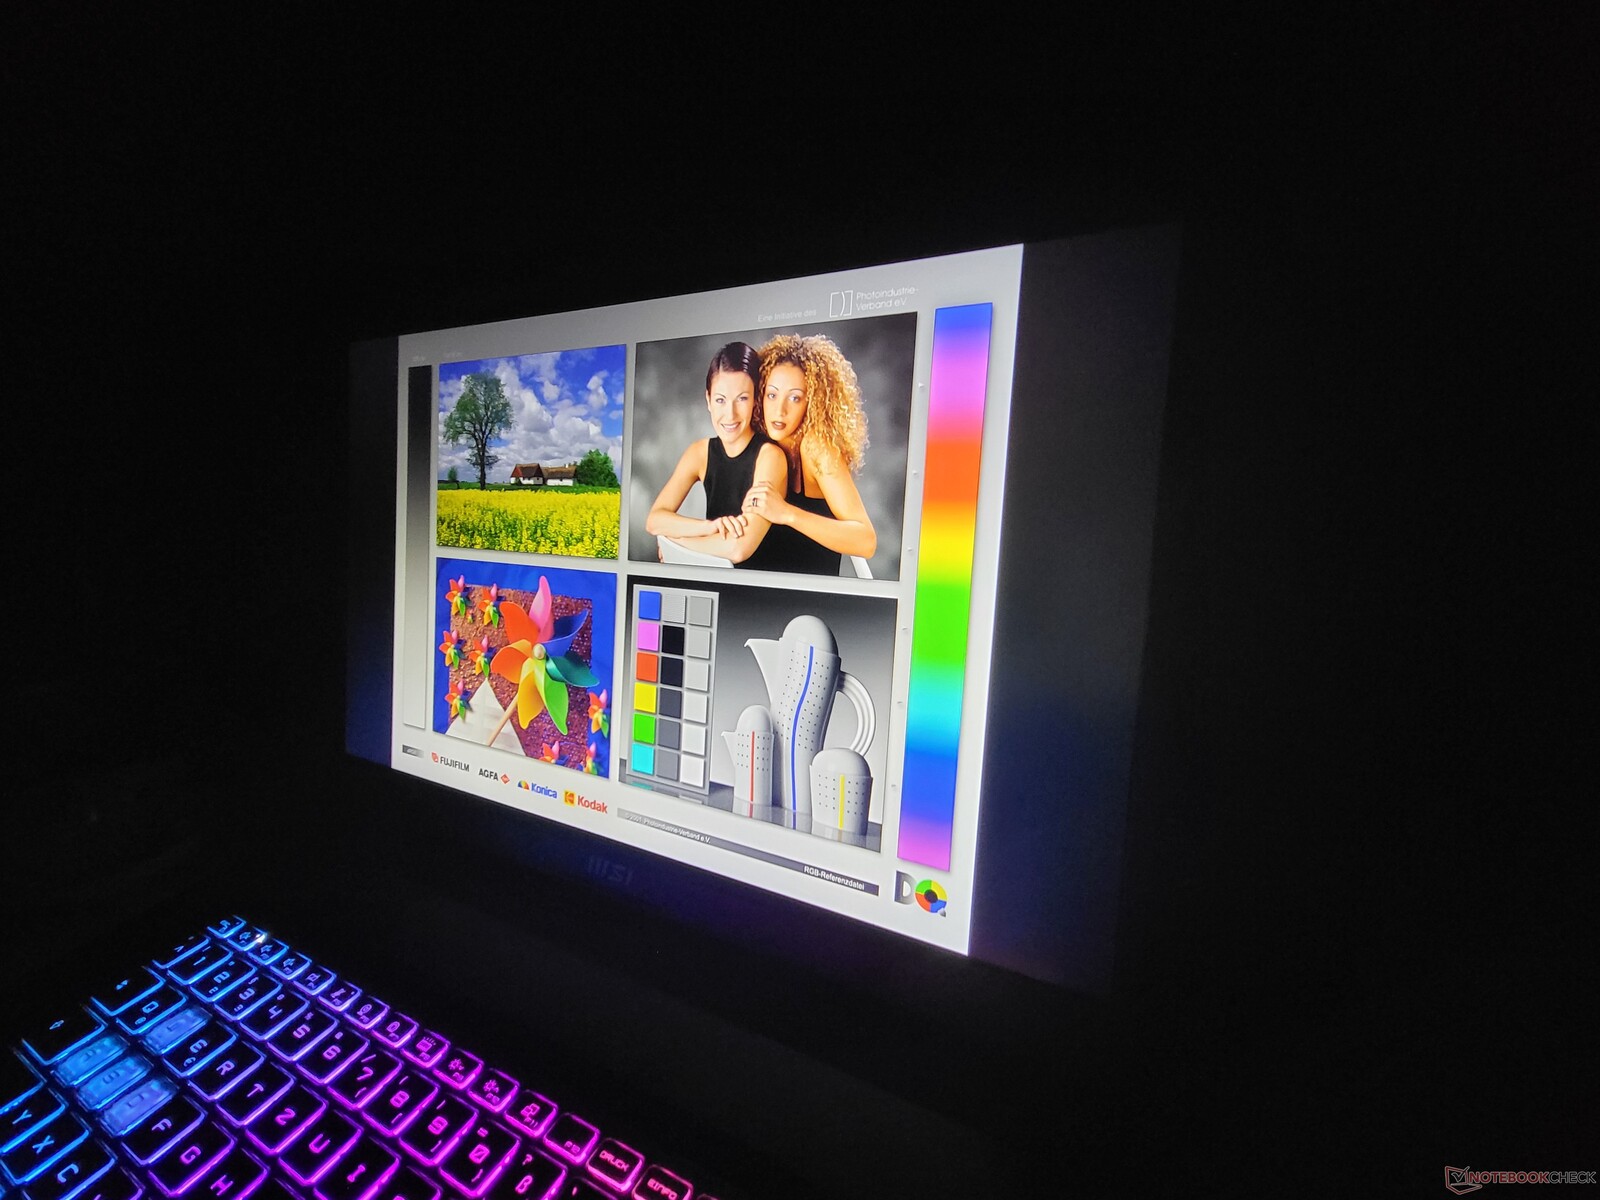
All'esterno, il display dell'MSI Katana 17 è praticamente utilizzabile, purché il dispositivo venga utilizzato all'ombra.
Tempi di risposta del Display
| ↔ Tempi di risposta dal Nero al Bianco | ||
|---|---|---|
| 26 ms ... aumenta ↗ e diminuisce ↘ combinato | ↗ 13 ms Incremento | 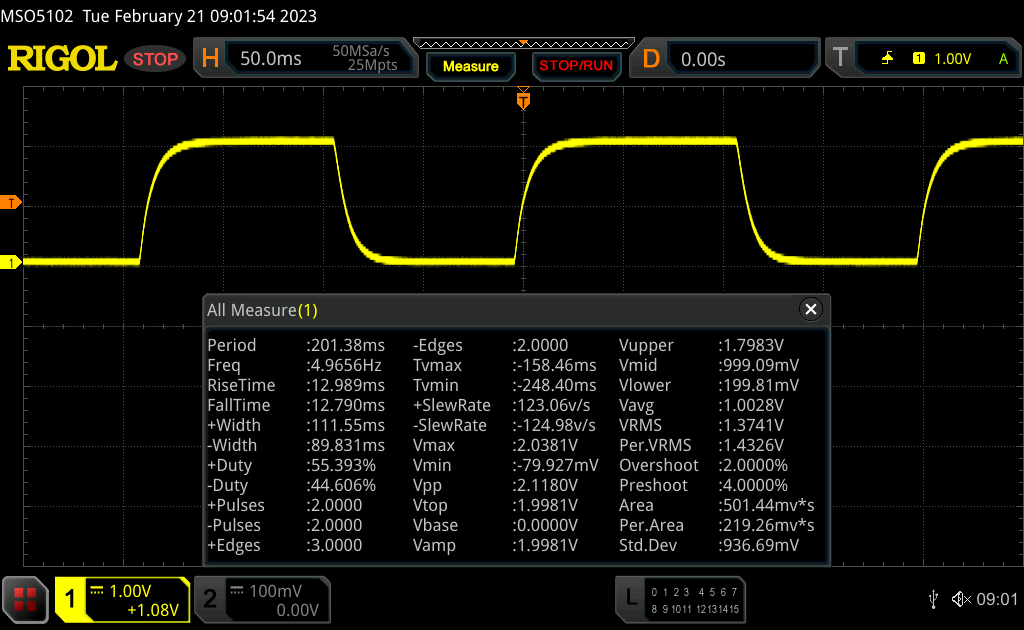 |
| ↘ 13 ms Calo | ||
| Lo schermo mostra tempi di risposta relativamente lenti nei nostri tests e potrebbe essere troppo lento per i gamers. In confronto, tutti i dispositivi di test variano da 0.1 (minimo) a 240 (massimo) ms. » 62 % di tutti i dispositivi è migliore. Questo significa che i tempi di risposta rilevati sono peggiori rispetto alla media di tutti i dispositivi testati (19.9 ms). | ||
| ↔ Tempo di risposta dal 50% Grigio all'80% Grigio | ||
| 33 ms ... aumenta ↗ e diminuisce ↘ combinato | ↗ 16 ms Incremento | 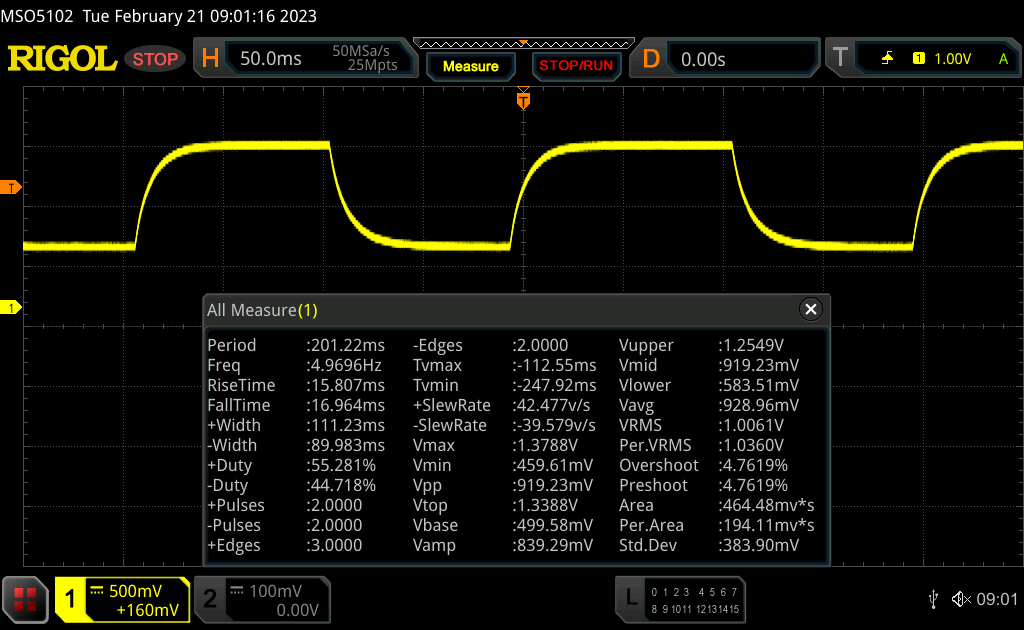 |
| ↘ 17 ms Calo | ||
| Lo schermo mostra tempi di risposta lenti nei nostri tests e sarà insoddisfacente per i gamers. In confronto, tutti i dispositivi di test variano da 0.165 (minimo) a 636 (massimo) ms. » 45 % di tutti i dispositivi è migliore. Questo significa che i tempi di risposta rilevati sono simili alla media di tutti i dispositivi testati (31.1 ms). | ||
Sfarfallio dello schermo / PWM (Pulse-Width Modulation)
| flickering dello schermo / PWM non rilevato | 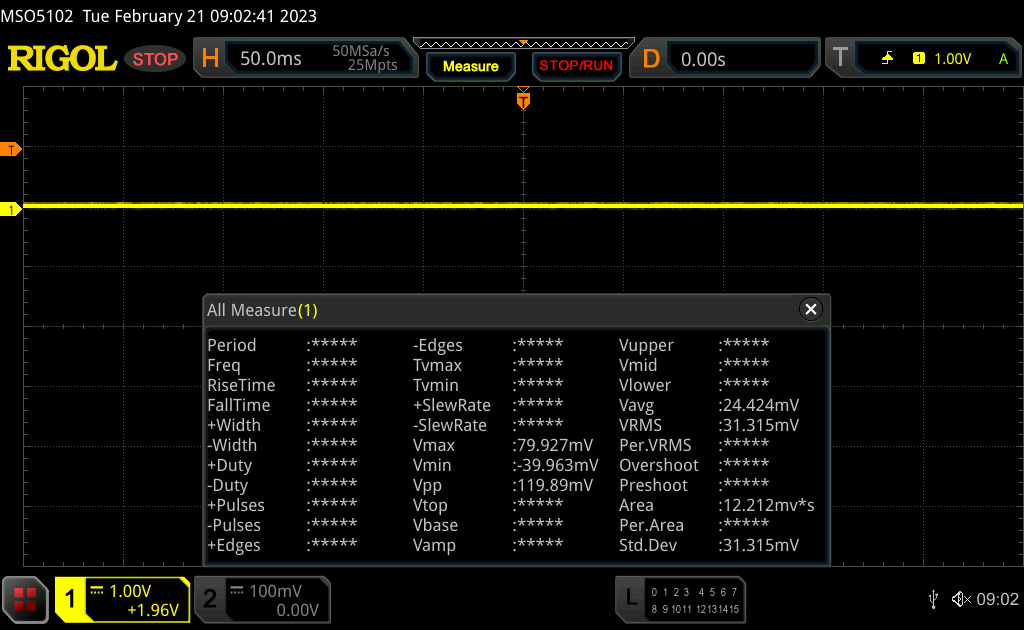 | ||
In confronto: 52 % di tutti i dispositivi testati non utilizza PWM per ridurre la luminosita' del display. Se è rilevato PWM, una media di 7798 (minimo: 5 - massimo: 343500) Hz è stata rilevata. | |||
Prestazioni: Il debutto della Nvidia GeForce RTX 4060
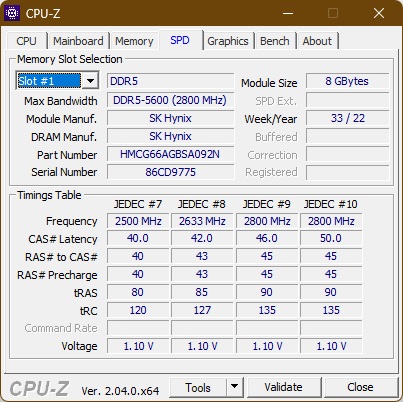
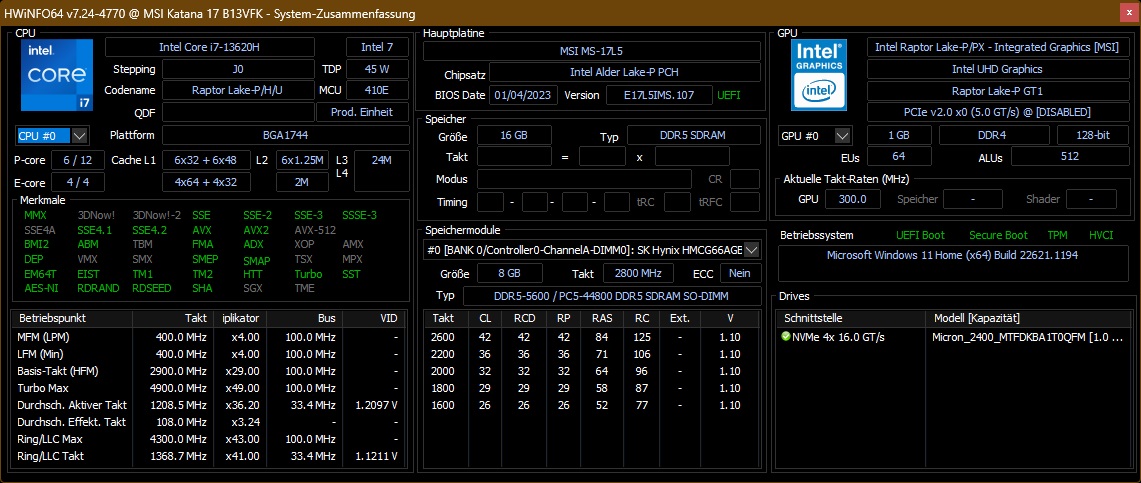
In Germania, MSI vende il Katana 17 B13V in due configurazioni. Entrambi i dispositivi hanno in comune l'Intel Core i7-13620H, la Nvidia GeForce RTX 4060 e 16 GB di RAM DDR5 5200. L'unica differenza è: Un modello ha un'unità SSD da 512 GB, mentre l'altro ha una capacità SSD di 1 TB.
Condizioni di prova
Nel software MSI "MSI Center" sono disponibili quattro modalità di prestazioni: Prestazioni massime, Bilanciato, Silenzioso e Super Batteria. Inoltre, è presente anche una modalità Auto. Abbiamo eseguito tutti i nostri test utilizzando la modalità Max Performance, in cui il consumo della CPU oscillava tra i 70 e gli 80 watt. Le riserve di prestazioni sono simili nella modalità Balanced, utilizzata per il test della batteria. Nelle modalità Silent e Super Battery la CPU è limitata rispettivamente a 30 e 15 watt.
Grazie a Optimus Advanced, è possibile passare il chip grafico al funzionamento puramente Nvidia e disattivare la GPU Intel. Abbiamo testato il dispositivo utilizzando la modalità Optimus normale.
Processore
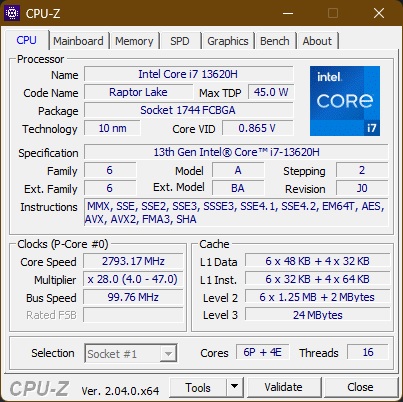
IlIntel Core i7-13620Hè il modello i7 di base della serie H di Raptor Lake. Dispone di tutti e sei i core ad alte prestazioni, ma solo di quattro dei core E più piccoli. Come CPU H, ha un TDP tipico di 45 watt, anche se può variare notevolmente a seconda del portatile. Tutti i dieci core (16 thread) hanno una frequenza di clock compresa tra 1,8 e 4,9 GHz. Potete trovare ulteriori confronti con altri processori nel nostro Elenco delle CPU.
MSI ha concesso al processore un massimo di 80 watt. Le prestazioni risultanti si collocano tra l'i7-12700H e l'i7-12700H i7-12700Hnel modelloMSI Pulse GL76e l'i5-12500Hi5-12500Hche si trova nel modelloGigabyte G7 KE. Date le specifiche e le piccole differenze tra Alder Lake e Raptor Lake, questi risultati erano comunque prevedibili. Con i suoi otto core P e 16 core E, il processore Intel Core i9-13950HXè chiaramente in vantaggio.
In modalità batteria, le prestazioni della CPU sono fortemente limitate. Con un totale di 1399 punti, il risultato di Cinebench R15 è stato inferiore di circa il 40%.
Cinebench R15 Multi Continuous Test
Cinebench R23: Multi Core | Single Core
Cinebench R20: CPU (Multi Core) | CPU (Single Core)
Cinebench R15: CPU Multi 64Bit | CPU Single 64Bit
Blender: v2.79 BMW27 CPU
7-Zip 18.03: 7z b 4 | 7z b 4 -mmt1
Geekbench 5.5: Multi-Core | Single-Core
HWBOT x265 Benchmark v2.2: 4k Preset
LibreOffice : 20 Documents To PDF
R Benchmark 2.5: Overall mean
| CPU Performance rating | |
| MSI Titan GT77 HX 13VI | |
| Media della classe Gaming | |
| Asus ROG Strix Scar 17 SE G733CX-LL014W | |
| MSI Pulse GL76 12UGK | |
| MSI Katana 17 B13VFK | |
| Acer Predator Helios 300 (i7-12700H, RTX 3070 Ti) | |
| Media Intel Core i7-13620H | |
| Gigabyte G7 KE | |
| Cinebench R23 / Multi Core | |
| MSI Titan GT77 HX 13VI | |
| Media della classe Gaming (10488 - 40970, n=112, ultimi 2 anni) | |
| Asus ROG Strix Scar 17 SE G733CX-LL014W | |
| Acer Predator Helios 300 (i7-12700H, RTX 3070 Ti) | |
| MSI Pulse GL76 12UGK | |
| MSI Katana 17 B13VFK | |
| Gigabyte G7 KE | |
| Media Intel Core i7-13620H (10819 - 15496, n=7) | |
| Cinebench R23 / Single Core | |
| MSI Titan GT77 HX 13VI | |
| Media della classe Gaming (1166 - 2356, n=112, ultimi 2 anni) | |
| Asus ROG Strix Scar 17 SE G733CX-LL014W | |
| Media Intel Core i7-13620H (1716 - 1871, n=7) | |
| MSI Katana 17 B13VFK | |
| Acer Predator Helios 300 (i7-12700H, RTX 3070 Ti) | |
| MSI Pulse GL76 12UGK | |
| Gigabyte G7 KE | |
| Cinebench R20 / CPU (Multi Core) | |
| MSI Titan GT77 HX 13VI | |
| Media della classe Gaming (4029 - 16108, n=111, ultimi 2 anni) | |
| Asus ROG Strix Scar 17 SE G733CX-LL014W | |
| MSI Pulse GL76 12UGK | |
| MSI Katana 17 B13VFK | |
| Acer Predator Helios 300 (i7-12700H, RTX 3070 Ti) | |
| Media Intel Core i7-13620H (4214 - 5905, n=7) | |
| Gigabyte G7 KE | |
| Cinebench R20 / CPU (Single Core) | |
| MSI Titan GT77 HX 13VI | |
| Media della classe Gaming (442 - 895, n=111, ultimi 2 anni) | |
| Asus ROG Strix Scar 17 SE G733CX-LL014W | |
| Acer Predator Helios 300 (i7-12700H, RTX 3070 Ti) | |
| Media Intel Core i7-13620H (657 - 719, n=7) | |
| MSI Katana 17 B13VFK | |
| MSI Pulse GL76 12UGK | |
| Gigabyte G7 KE | |
| Cinebench R15 / CPU Multi 64Bit | |
| MSI Titan GT77 HX 13VI | |
| Media della classe Gaming (1578 - 6271, n=111, ultimi 2 anni) | |
| Asus ROG Strix Scar 17 SE G733CX-LL014W | |
| Acer Predator Helios 300 (i7-12700H, RTX 3070 Ti) | |
| MSI Pulse GL76 12UGK | |
| MSI Katana 17 B13VFK | |
| Gigabyte G7 KE | |
| Media Intel Core i7-13620H (1681 - 2492, n=7) | |
| Cinebench R15 / CPU Single 64Bit | |
| MSI Titan GT77 HX 13VI | |
| Media della classe Gaming (188.8 - 343, n=111, ultimi 2 anni) | |
| Asus ROG Strix Scar 17 SE G733CX-LL014W | |
| Media Intel Core i7-13620H (250 - 269, n=7) | |
| MSI Katana 17 B13VFK | |
| MSI Pulse GL76 12UGK | |
| Acer Predator Helios 300 (i7-12700H, RTX 3070 Ti) | |
| Gigabyte G7 KE | |
| Blender / v2.79 BMW27 CPU | |
| Media Intel Core i7-13620H (215 - 297, n=7) | |
| Gigabyte G7 KE | |
| MSI Katana 17 B13VFK | |
| Acer Predator Helios 300 (i7-12700H, RTX 3070 Ti) | |
| MSI Pulse GL76 12UGK | |
| Asus ROG Strix Scar 17 SE G733CX-LL014W | |
| Media della classe Gaming (80 - 330, n=109, ultimi 2 anni) | |
| MSI Titan GT77 HX 13VI | |
| 7-Zip 18.03 / 7z b 4 | |
| MSI Titan GT77 HX 13VI | |
| Media della classe Gaming (33491 - 148086, n=110, ultimi 2 anni) | |
| Asus ROG Strix Scar 17 SE G733CX-LL014W | |
| Acer Predator Helios 300 (i7-12700H, RTX 3070 Ti) | |
| MSI Pulse GL76 12UGK | |
| MSI Katana 17 B13VFK | |
| Media Intel Core i7-13620H (45092 - 62324, n=7) | |
| Gigabyte G7 KE | |
| 7-Zip 18.03 / 7z b 4 -mmt1 | |
| MSI Titan GT77 HX 13VI | |
| Media della classe Gaming (4199 - 7436, n=110, ultimi 2 anni) | |
| Asus ROG Strix Scar 17 SE G733CX-LL014W | |
| Media Intel Core i7-13620H (5648 - 6326, n=7) | |
| Acer Predator Helios 300 (i7-12700H, RTX 3070 Ti) | |
| MSI Katana 17 B13VFK | |
| MSI Pulse GL76 12UGK | |
| Gigabyte G7 KE | |
| Geekbench 5.5 / Multi-Core | |
| MSI Titan GT77 HX 13VI | |
| Media della classe Gaming (6460 - 27010, n=110, ultimi 2 anni) | |
| Asus ROG Strix Scar 17 SE G733CX-LL014W | |
| Acer Predator Helios 300 (i7-12700H, RTX 3070 Ti) | |
| MSI Pulse GL76 12UGK | |
| MSI Katana 17 B13VFK | |
| Media Intel Core i7-13620H (8112 - 12223, n=7) | |
| Gigabyte G7 KE | |
| Geekbench 5.5 / Single-Core | |
| Media della classe Gaming (986 - 2474, n=110, ultimi 2 anni) | |
| MSI Titan GT77 HX 13VI | |
| Asus ROG Strix Scar 17 SE G733CX-LL014W | |
| Media Intel Core i7-13620H (1703 - 1865, n=7) | |
| MSI Katana 17 B13VFK | |
| Acer Predator Helios 300 (i7-12700H, RTX 3070 Ti) | |
| Gigabyte G7 KE | |
| MSI Pulse GL76 12UGK | |
| HWBOT x265 Benchmark v2.2 / 4k Preset | |
| MSI Titan GT77 HX 13VI | |
| Media della classe Gaming (11.5 - 44.3, n=110, ultimi 2 anni) | |
| Asus ROG Strix Scar 17 SE G733CX-LL014W | |
| MSI Pulse GL76 12UGK | |
| MSI Katana 17 B13VFK | |
| Gigabyte G7 KE | |
| Acer Predator Helios 300 (i7-12700H, RTX 3070 Ti) | |
| Media Intel Core i7-13620H (12.2 - 17.7, n=7) | |
| LibreOffice / 20 Documents To PDF | |
| Acer Predator Helios 300 (i7-12700H, RTX 3070 Ti) | |
| MSI Katana 17 B13VFK | |
| Media Intel Core i7-13620H (41.5 - 78.9, n=7) | |
| Media della classe Gaming (19 - 88.8, n=110, ultimi 2 anni) | |
| MSI Titan GT77 HX 13VI | |
| MSI Pulse GL76 12UGK | |
| Gigabyte G7 KE | |
| Asus ROG Strix Scar 17 SE G733CX-LL014W | |
| R Benchmark 2.5 / Overall mean | |
| Gigabyte G7 KE | |
| MSI Pulse GL76 12UGK | |
| Acer Predator Helios 300 (i7-12700H, RTX 3070 Ti) | |
| Media Intel Core i7-13620H (0.4438 - 0.4762, n=7) | |
| MSI Katana 17 B13VFK | |
| Media della classe Gaming (0.3439 - 0.759, n=111, ultimi 2 anni) | |
| Asus ROG Strix Scar 17 SE G733CX-LL014W | |
| MSI Titan GT77 HX 13VI | |
* ... Meglio usare valori piccoli
AIDA64: FP32 Ray-Trace | FPU Julia | CPU SHA3 | CPU Queen | FPU SinJulia | FPU Mandel | CPU AES | CPU ZLib | FP64 Ray-Trace | CPU PhotoWorxx
| Performance rating | |
| MSI Titan GT77 HX 13VI | |
| Media della classe Gaming | |
| Asus ROG Strix Scar 17 SE G733CX-LL014W | |
| Acer Predator Helios 300 (i7-12700H, RTX 3070 Ti) | |
| MSI Pulse GL76 12UGK | |
| Gigabyte G7 KE | |
| MSI Katana 17 B13VFK | |
| Media Intel Core i7-13620H | |
| AIDA64 / FP32 Ray-Trace | |
| Media della classe Gaming (10227 - 85542, n=109, ultimi 2 anni) | |
| MSI Titan GT77 HX 13VI | |
| Asus ROG Strix Scar 17 SE G733CX-LL014W | |
| Acer Predator Helios 300 (i7-12700H, RTX 3070 Ti) | |
| MSI Pulse GL76 12UGK | |
| MSI Katana 17 B13VFK | |
| Gigabyte G7 KE | |
| Media Intel Core i7-13620H (10779 - 13601, n=7) | |
| AIDA64 / FPU Julia | |
| MSI Titan GT77 HX 13VI | |
| Media della classe Gaming (51376 - 238426, n=109, ultimi 2 anni) | |
| Acer Predator Helios 300 (i7-12700H, RTX 3070 Ti) | |
| Asus ROG Strix Scar 17 SE G733CX-LL014W | |
| MSI Pulse GL76 12UGK | |
| MSI Katana 17 B13VFK | |
| Gigabyte G7 KE | |
| Media Intel Core i7-13620H (54287 - 67187, n=7) | |
| AIDA64 / CPU SHA3 | |
| MSI Titan GT77 HX 13VI | |
| Media della classe Gaming (2180 - 9817, n=109, ultimi 2 anni) | |
| Asus ROG Strix Scar 17 SE G733CX-LL014W | |
| Acer Predator Helios 300 (i7-12700H, RTX 3070 Ti) | |
| MSI Pulse GL76 12UGK | |
| Gigabyte G7 KE | |
| MSI Katana 17 B13VFK | |
| Media Intel Core i7-13620H (2327 - 2773, n=7) | |
| AIDA64 / CPU Queen | |
| MSI Titan GT77 HX 13VI | |
| Media della classe Gaming (49785 - 173351, n=100, ultimi 2 anni) | |
| Asus ROG Strix Scar 17 SE G733CX-LL014W | |
| MSI Pulse GL76 12UGK | |
| Acer Predator Helios 300 (i7-12700H, RTX 3070 Ti) | |
| Gigabyte G7 KE | |
| MSI Katana 17 B13VFK | |
| Media Intel Core i7-13620H (66885 - 78867, n=7) | |
| AIDA64 / FPU SinJulia | |
| MSI Titan GT77 HX 13VI | |
| Media della classe Gaming (4424 - 33636, n=109, ultimi 2 anni) | |
| Asus ROG Strix Scar 17 SE G733CX-LL014W | |
| Acer Predator Helios 300 (i7-12700H, RTX 3070 Ti) | |
| MSI Pulse GL76 12UGK | |
| MSI Katana 17 B13VFK | |
| Media Intel Core i7-13620H (6737 - 8421, n=7) | |
| Gigabyte G7 KE | |
| AIDA64 / FPU Mandel | |
| MSI Titan GT77 HX 13VI | |
| Media della classe Gaming (25115 - 128721, n=109, ultimi 2 anni) | |
| Acer Predator Helios 300 (i7-12700H, RTX 3070 Ti) | |
| Asus ROG Strix Scar 17 SE G733CX-LL014W | |
| MSI Pulse GL76 12UGK | |
| MSI Katana 17 B13VFK | |
| Gigabyte G7 KE | |
| Media Intel Core i7-13620H (27242 - 32787, n=7) | |
| AIDA64 / CPU AES | |
| Asus ROG Strix Scar 17 SE G733CX-LL014W | |
| MSI Pulse GL76 12UGK | |
| MSI Titan GT77 HX 13VI | |
| Gigabyte G7 KE | |
| Media della classe Gaming (39258 - 247074, n=109, ultimi 2 anni) | |
| Acer Predator Helios 300 (i7-12700H, RTX 3070 Ti) | |
| Media Intel Core i7-13620H (48646 - 85895, n=7) | |
| MSI Katana 17 B13VFK | |
| AIDA64 / CPU ZLib | |
| MSI Titan GT77 HX 13VI | |
| Media della classe Gaming (574 - 2531, n=109, ultimi 2 anni) | |
| Asus ROG Strix Scar 17 SE G733CX-LL014W | |
| Acer Predator Helios 300 (i7-12700H, RTX 3070 Ti) | |
| MSI Pulse GL76 12UGK | |
| Gigabyte G7 KE | |
| MSI Katana 17 B13VFK | |
| Media Intel Core i7-13620H (688 - 835, n=7) | |
| AIDA64 / FP64 Ray-Trace | |
| Media della classe Gaming (5509 - 45446, n=109, ultimi 2 anni) | |
| MSI Titan GT77 HX 13VI | |
| Acer Predator Helios 300 (i7-12700H, RTX 3070 Ti) | |
| Asus ROG Strix Scar 17 SE G733CX-LL014W | |
| MSI Pulse GL76 12UGK | |
| MSI Katana 17 B13VFK | |
| Gigabyte G7 KE | |
| Media Intel Core i7-13620H (5919 - 7364, n=7) | |
| AIDA64 / CPU PhotoWorxx | |
| Media della classe Gaming (12271 - 89891, n=109, ultimi 2 anni) | |
| Asus ROG Strix Scar 17 SE G733CX-LL014W | |
| MSI Titan GT77 HX 13VI | |
| Acer Predator Helios 300 (i7-12700H, RTX 3070 Ti) | |
| MSI Katana 17 B13VFK | |
| Gigabyte G7 KE | |
| Media Intel Core i7-13620H (19421 - 34544, n=7) | |
| MSI Pulse GL76 12UGK | |
Prestazioni del sistema
Un'unità SSD veloce, abbinata al potente chip grafico del Katana 17, garantisce ottime prestazioni del sistema che, ovviamente, nei benchmark sintetici è un po' indietro rispetto alla concorrenza meglio configurata.
CrossMark: Overall | Productivity | Creativity | Responsiveness
| PCMark 10 / Score | |
| MSI Titan GT77 HX 13VI | |
| Media della classe Gaming (5828 - 11574, n=95, ultimi 2 anni) | |
| Acer Predator Helios 300 (i7-12700H, RTX 3070 Ti) | |
| MSI Pulse GL76 12UGK | |
| Asus ROG Strix Scar 17 SE G733CX-LL014W | |
| MSI Katana 17 B13VFK | |
| Media Intel Core i7-13620H, NVIDIA GeForce RTX 4060 Laptop GPU (6678 - 7256, n=3) | |
| Gigabyte G7 KE | |
| PCMark 10 / Essentials | |
| MSI Titan GT77 HX 13VI | |
| MSI Pulse GL76 12UGK | |
| MSI Katana 17 B13VFK | |
| Acer Predator Helios 300 (i7-12700H, RTX 3070 Ti) | |
| Media della classe Gaming (8810 - 12600, n=99, ultimi 2 anni) | |
| Media Intel Core i7-13620H, NVIDIA GeForce RTX 4060 Laptop GPU (9909 - 10809, n=3) | |
| Asus ROG Strix Scar 17 SE G733CX-LL014W | |
| Gigabyte G7 KE | |
| PCMark 10 / Productivity | |
| Media della classe Gaming (6845 - 18766, n=97, ultimi 2 anni) | |
| Acer Predator Helios 300 (i7-12700H, RTX 3070 Ti) | |
| MSI Pulse GL76 12UGK | |
| Asus ROG Strix Scar 17 SE G733CX-LL014W | |
| MSI Titan GT77 HX 13VI | |
| MSI Katana 17 B13VFK | |
| Media Intel Core i7-13620H, NVIDIA GeForce RTX 4060 Laptop GPU (8642 - 9781, n=3) | |
| Gigabyte G7 KE | |
| PCMark 10 / Digital Content Creation | |
| MSI Titan GT77 HX 13VI | |
| Media della classe Gaming (7602 - 19657, n=97, ultimi 2 anni) | |
| Acer Predator Helios 300 (i7-12700H, RTX 3070 Ti) | |
| MSI Pulse GL76 12UGK | |
| Asus ROG Strix Scar 17 SE G733CX-LL014W | |
| MSI Katana 17 B13VFK | |
| Media Intel Core i7-13620H, NVIDIA GeForce RTX 4060 Laptop GPU (9437 - 10204, n=3) | |
| Gigabyte G7 KE | |
| CrossMark / Overall | |
| MSI Titan GT77 HX 13VI | |
| Asus ROG Strix Scar 17 SE G733CX-LL014W | |
| Media della classe Gaming (1366 - 2409, n=97, ultimi 2 anni) | |
| Media Intel Core i7-13620H, NVIDIA GeForce RTX 4060 Laptop GPU (1857 - 1986, n=3) | |
| Acer Predator Helios 300 (i7-12700H, RTX 3070 Ti) | |
| MSI Katana 17 B13VFK | |
| MSI Pulse GL76 12UGK | |
| Gigabyte G7 KE | |
| CrossMark / Productivity | |
| MSI Titan GT77 HX 13VI | |
| Asus ROG Strix Scar 17 SE G733CX-LL014W | |
| Media della classe Gaming (1386 - 2254, n=97, ultimi 2 anni) | |
| Media Intel Core i7-13620H, NVIDIA GeForce RTX 4060 Laptop GPU (1765 - 1908, n=3) | |
| Gigabyte G7 KE | |
| MSI Pulse GL76 12UGK | |
| Acer Predator Helios 300 (i7-12700H, RTX 3070 Ti) | |
| MSI Katana 17 B13VFK | |
| CrossMark / Creativity | |
| MSI Titan GT77 HX 13VI | |
| Asus ROG Strix Scar 17 SE G733CX-LL014W | |
| Media della classe Gaming (1343 - 2729, n=97, ultimi 2 anni) | |
| Acer Predator Helios 300 (i7-12700H, RTX 3070 Ti) | |
| Media Intel Core i7-13620H, NVIDIA GeForce RTX 4060 Laptop GPU (2013 - 2067, n=3) | |
| MSI Katana 17 B13VFK | |
| MSI Pulse GL76 12UGK | |
| Gigabyte G7 KE | |
| CrossMark / Responsiveness | |
| Gigabyte G7 KE | |
| Asus ROG Strix Scar 17 SE G733CX-LL014W | |
| Media Intel Core i7-13620H, NVIDIA GeForce RTX 4060 Laptop GPU (1734 - 1989, n=3) | |
| MSI Titan GT77 HX 13VI | |
| MSI Pulse GL76 12UGK | |
| MSI Katana 17 B13VFK | |
| Acer Predator Helios 300 (i7-12700H, RTX 3070 Ti) | |
| Media della classe Gaming (1226 - 2334, n=97, ultimi 2 anni) | |
| PCMark 10 Score | 7160 punti | |
Aiuto | ||
| AIDA64 / Memory Copy | |
| Media della classe Gaming (21750 - 129946, n=109, ultimi 2 anni) | |
| MSI Titan GT77 HX 13VI | |
| Asus ROG Strix Scar 17 SE G733CX-LL014W | |
| Acer Predator Helios 300 (i7-12700H, RTX 3070 Ti) | |
| MSI Katana 17 B13VFK | |
| MSI Pulse GL76 12UGK | |
| Media Intel Core i7-13620H (31629 - 53927, n=7) | |
| Gigabyte G7 KE | |
| AIDA64 / Memory Read | |
| Media della classe Gaming (22956 - 118858, n=109, ultimi 2 anni) | |
| Asus ROG Strix Scar 17 SE G733CX-LL014W | |
| MSI Titan GT77 HX 13VI | |
| MSI Katana 17 B13VFK | |
| Acer Predator Helios 300 (i7-12700H, RTX 3070 Ti) | |
| Media Intel Core i7-13620H (35115 - 61853, n=7) | |
| MSI Pulse GL76 12UGK | |
| Gigabyte G7 KE | |
| AIDA64 / Memory Write | |
| Media della classe Gaming (22297 - 135096, n=109, ultimi 2 anni) | |
| Asus ROG Strix Scar 17 SE G733CX-LL014W | |
| MSI Titan GT77 HX 13VI | |
| Acer Predator Helios 300 (i7-12700H, RTX 3070 Ti) | |
| MSI Katana 17 B13VFK | |
| Gigabyte G7 KE | |
| MSI Pulse GL76 12UGK | |
| Media Intel Core i7-13620H (30611 - 54111, n=7) | |
| AIDA64 / Memory Latency | |
| Media della classe Gaming (75.3 - 259, n=109, ultimi 2 anni) | |
| MSI Katana 17 B13VFK | |
| Media Intel Core i7-13620H (75.9 - 108.2, n=7) | |
| MSI Pulse GL76 12UGK | |
| MSI Titan GT77 HX 13VI | |
| Acer Predator Helios 300 (i7-12700H, RTX 3070 Ti) | |
| Gigabyte G7 KE | |
| Asus ROG Strix Scar 17 SE G733CX-LL014W | |
* ... Meglio usare valori piccoli
Latenze DPC
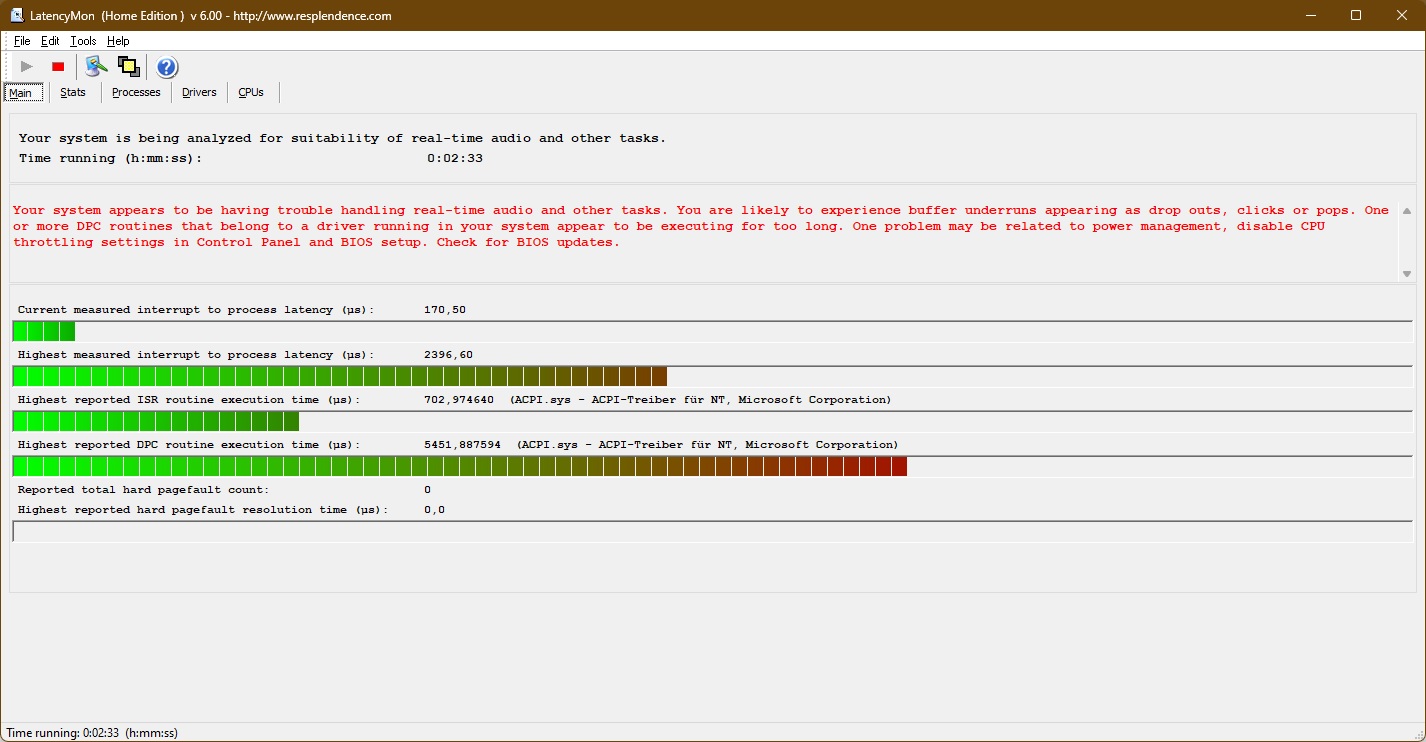
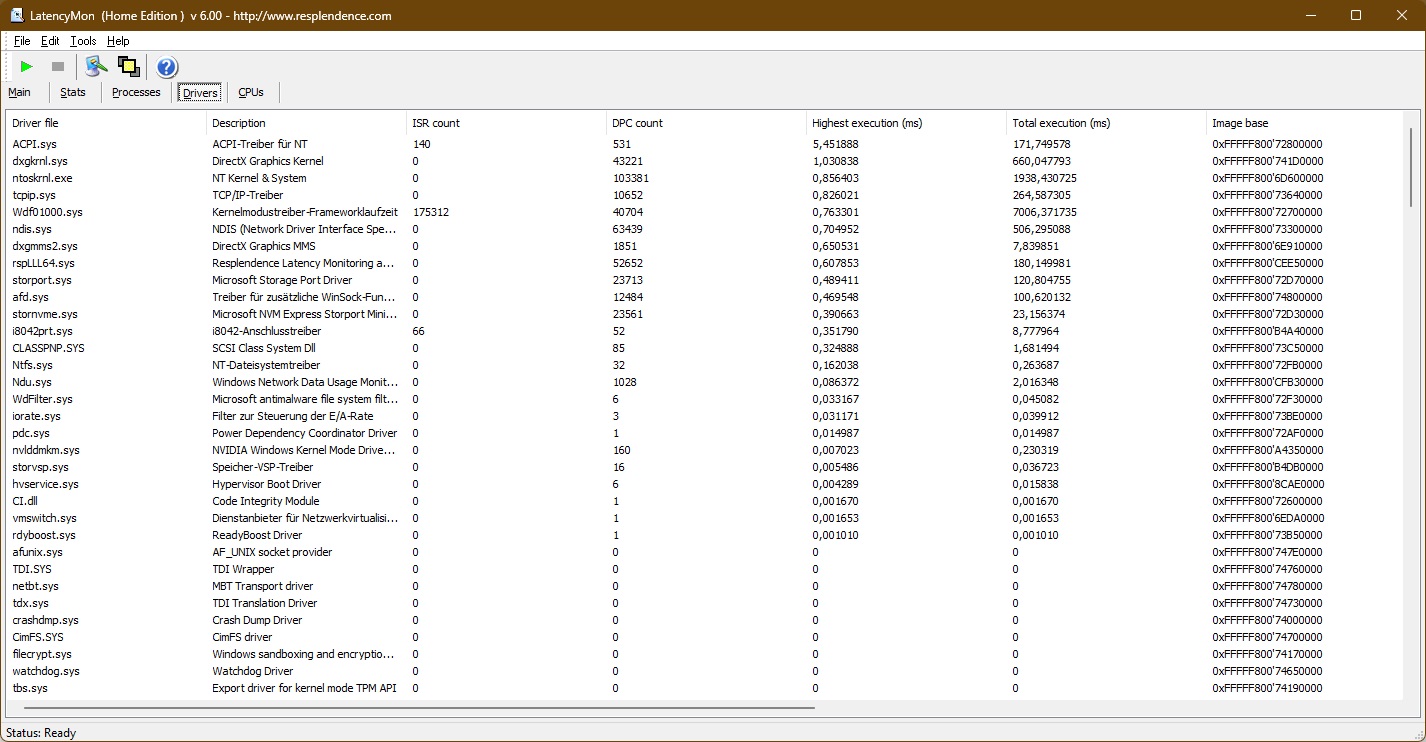
| DPC Latencies / LatencyMon - interrupt to process latency (max), Web, Youtube, Prime95 | |
| MSI Titan GT77 HX 13VI | |
| Asus ROG Strix Scar 17 SE G733CX-LL014W | |
| MSI Katana 17 B13VFK | |
| Gigabyte G7 KE | |
| Acer Predator Helios 300 (i7-12700H, RTX 3070 Ti) | |
| MSI Pulse GL76 12UGK | |
* ... Meglio usare valori piccoli
Memoria di massa
Con una capacità di un terabyte, l'unità Micron 2400 è di per sé un'unità SSD NVMe PCIe 4.0 veloce, ma dal punto di vista delle prestazioni non riesce a tenere il passo della concorrenza. Tuttavia, questo aspetto non dovrebbe essere particolarmente evidente nell'uso quotidiano.

* ... Meglio usare valori piccoli
Continuous Performance Read: DiskSpd Read Loop, Queue Depth 8
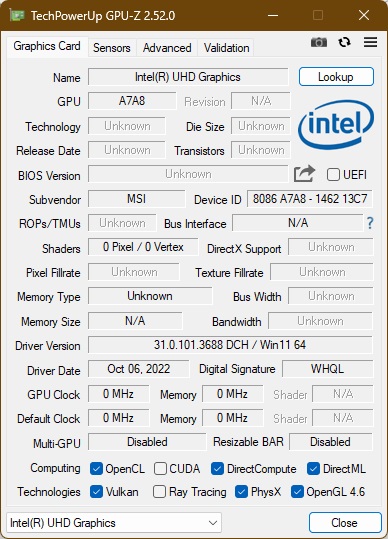
Scheda grafica
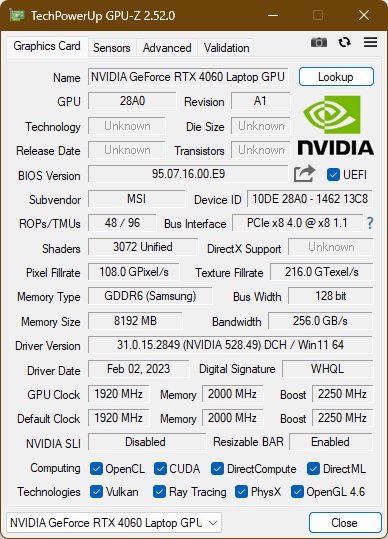
IlNvidia GeForce RTX 4060 è una GPU di fascia media della generazione "Ada Lovelace" di Nvidia. Le 3072 unità shader hanno un clock massimo di 2,25 GHz e la GPU qui installata ha a disposizione otto gigabyte di RAM GDDR6. Potete trovare ulteriori confronti con altri chip grafici nel nostro Elenco dei benchmark delle GPU.
Nei test 3DMark, la nuova GPU ha il naso davanti a quella della scorsa generazione Nvidia GeForce RTX 3070- ma solo di poco. Al contrario, laRTX 3070 Tiè marginalmente più veloce. Rispetto allaNvidia GeForce RTX 3060la RTX 4060, che può consumare al massimo 105 watt, è più veloce di circa il 23%. Con 115 watt, il Gigabyte G7 KE presente nella 3060 consuma un po' di più rispetto alla 4060. La RTX 4060 è chiaramente surclassata dallaGeForce RTX 4090e c'era da aspettarselo. Nei benchmark 3DMark, il chip di fascia alta è due volte più veloce. I risultati del benchmark Blender confermano i risultati del test 3DMark.
Come per il processore, la scheda grafica ha un limite di prestazioni in modalità batteria. Senza alimentatore, è disponibile solo il 50% delle prestazioni della GPU.
| 3DMark 06 Standard Score | 50607 punti | |
| 3DMark Vantage P Result | 90275 punti | |
| 3DMark 11 Performance | 30831 punti | |
| 3DMark Ice Storm Standard Score | 185655 punti | |
| 3DMark Cloud Gate Standard Score | 59494 punti | |
| 3DMark Fire Strike Score | 22497 punti | |
| 3DMark Time Spy Score | 10345 punti | |
Aiuto | ||
* ... Meglio usare valori piccoli
Prestazioni di gioco
Nei test di gioco, la Nvidia GeForce RTX 4060 fa meglio che nei benchmark sintetici. In questo senso, batte marginalmente la GeForce RTX 3070 Ti. Tuttavia, proprio come la RTX 4090, la RTX 3080 Ti rimane imbattibile. Tuttavia, quando si tratta di giocare, la differenza con l'ammiraglia non è poi così grande: la 4090 Ti è ancora più veloce di circa il 33%.
La RTX 4060 può facilmente riprodurre i titoli più vecchi in 4K UHD. Con i nuovi giochi, invece, è più difficile, almeno senza l'implementazione del DLSS. In ogni caso, è possibile giocare a 2,5K.
| The Witcher 3 - 1920x1080 Ultra Graphics & Postprocessing (HBAO+) | |
| MSI Titan GT77 HX 13VI | |
| Media della classe Gaming (95 - 240, n=8, ultimi 2 anni) | |
| Acer Predator Helios 300 (i7-12700H, RTX 3070 Ti) | |
| Asus ROG Strix Scar 17 SE G733CX-LL014W | |
| MSI Katana 17 B13VFK | |
| MSI Pulse GL76 12UGK | |
| Gigabyte G7 KE | |
| Final Fantasy XV Benchmark - 1920x1080 High Quality | |
| MSI Titan GT77 HX 13VI | |
| Media della classe Gaming (41 - 215, n=103, ultimi 2 anni) | |
| Asus ROG Strix Scar 17 SE G733CX-LL014W | |
| Acer Predator Helios 300 (i7-12700H, RTX 3070 Ti) | |
| MSI Katana 17 B13VFK | |
| MSI Pulse GL76 12UGK | |
| Gigabyte G7 KE | |
Witcher 3 frame rate diagram
| basso | medio | alto | ultra | QHD | 4K DLSS | 4K | |
|---|---|---|---|---|---|---|---|
| GTA V (2015) | 186.1 | 184.7 | 180.2 | 112.1 | 83 | 82.1 | |
| The Witcher 3 (2015) | 435 | 322 | 206 | 104.7 | 62.6 | ||
| Dota 2 Reborn (2015) | 184.6 | 171 | 164.1 | 156.3 | 126 | ||
| Final Fantasy XV Benchmark (2018) | 204 | 135.1 | 96.1 | 70.1 | 40.2 | ||
| X-Plane 11.11 (2018) | 178.6 | 154.9 | 118.9 | 98.9 | |||
| Far Cry 5 (2018) | 134 | 99 | 51 | ||||
| Strange Brigade (2018) | 508 | 270 | 216 | 185.1 | 126.4 | 67.2 | |
| Shadow of the Tomb Raider (2018) | 155.6 | 120.7 | 67.2 | ||||
| Metro Exodus (2019) | 74.3 | 59 | 36.8 | ||||
| Control (2019) | 238 | 119 | 89 | ||||
| Borderlands 3 (2019) | 171.3 | 144.6 | 106.5 | 83.9 | |||
| Death Stranding (2020) | 200 | 158.9 | 150.3 | 146.7 | |||
| Horizon Zero Dawn (2020) | 108.3 | 85.9 | 46.5 | ||||
| Flight Simulator 2020 (2020) | 96.9 | 69.4 | 52.5 | ||||
| Crysis Remastered (2020) | 312 | 224 | 85.9 | 72.5 | |||
| Watch Dogs Legion (2020) | 65 | 44 | 25 | ||||
| Dirt 5 (2020) | 218 | 147.2 | 116.1 | 89.5 | |||
| Assassin´s Creed Valhalla (2020) | 135 | 111 | 96 | ||||
| Yakuza Like a Dragon (2020) | 131.7 | 123.2 | 117.4 | 109.6 | |||
| Hitman 3 (2021) | 267.5 | 197.7 | 172.7 | 163.5 | |||
| Days Gone (2021) | 148 | 131.4 | 100.2 | ||||
| F1 2021 (2021) | 389 | 312 | 244 | 128.9 | 93 | 50.2 | |
| Alan Wake Remastered (2021) | 149.8 | 144.9 | |||||
| Far Cry 6 (2021) | 97.2 | 32.6 | 3.38 | ||||
| Back 4 Blood (2021) | 245 | 197.5 | 188.2 | ||||
| Guardians of the Galaxy (2021) | 134 | 135 | 133 | ||||
| Riders Republic (2021) | 177 | 145 | 122 | 112 | |||
| Forza Horizon 5 (2021) | 137 | 125 | 84 | ||||
| Battlefield 2042 (2021) | 145.6 | 123 | 106.1 | ||||
| Halo Infinite (2021) | 144.9 | 123.6 | 114.2 | ||||
| God of War (2022) | 67.5 | 55.6 | 34.7 | ||||
| Rainbow Six Extraction (2022) | 149.1 | 106 | 52.4 | ||||
| Dying Light 2 (2022) | 64.7 | 43.8 | 23 | ||||
| GRID Legends (2022) | 126.4 | 102.2 | 63.9 | ||||
| Elden Ring (2022) | 59.5 | ||||||
| Cyberpunk 2077 1.6 (2022) | 73.81 | 45.9 | 21.1 | ||||
| Elex 2 (2022) | 115.4 | 115.4 | 113.5 | 96 | |||
| Ghostwire Tokyo (2022) | 68.6 | 65.9 | 36.8 | 29.6 | |||
| Tiny Tina's Wonderlands (2022) | 198.6 | 164.9 | 110 | 85.2 | |||
| Vampire Bloodhunt (2022) | 220 | 201 | 185.7 | ||||
| F1 22 (2022) | 247 | 240 | 179.2 | 65.4 | 41 | 19.7 | |
| The Quarry (2022) | 154.8 | 121.3 | 100.5 | 77.9 | |||
| A Plague Tale Requiem (2022) | 100.7 | 84.9 | 73 | 63.3 | |||
| Uncharted Legacy of Thieves Collection (2022) | 87.9 | 85.1 | 79.1 | 76.9 | |||
| Call of Duty Modern Warfare 2 2022 (2022) | 87 | 59 | 55 | 34 | |||
| Spider-Man Miles Morales (2022) | 77.3 | 59.7 | 35.3 | ||||
| The Callisto Protocol (2022) | 68.9 | 48.6 | 27 | ||||
| Need for Speed Unbound (2022) | 127.4 | 117.2 | 98.9 | 98.6 | |||
| High On Life (2023) | 220 | 165.8 | 125.6 | 99.9 | |||
| The Witcher 3 v4 (2023) | 66.3 | 40.5 | 21.4 | ||||
| Dead Space Remake (2023) | 67 | 43.4 | 20.6 | ||||
| Hogwarts Legacy (2023) | 150 | 126.7 | 107.7 | 91.6 | |||
| Returnal (2023) | |||||||
| Atomic Heart (2023) | 167.3 | 129.2 | 81.6 | 66.8 | |||
| Company of Heroes 3 (2023) | 202.7 | 182.1 | 133.3 | 131.3 | |||
| Sons of the Forest (2023) | 82 | 79.1 | 73.3 | 71.8 |
Emissioni: Ventole rumorose, case freddo
Emissioni acustiche
Quando si eseguono attività non impegnative, l'MSI Laptop Katana 17 è per lo più silenzioso, ma non sempre. Quando il raffreddamento è in corso, con circa 40 dB(A), il dispositivo è relativamente rumoroso. Sotto carico, questo valore sale a un massimo di 59 dB(A), molto forte per le orecchie sensibili ma normale per i giochi.
Non abbiamo rilevato alcun rumore di bobina.
Rumorosità
| Idle |
| 24.5 / 24.5 / 40 dB(A) |
| Sotto carico |
| 48.3 / 59.1 dB(A) |
 | ||
30 dB silenzioso 40 dB(A) udibile 50 dB(A) rumoroso |
||
min: | ||
| MSI Katana 17 B13VFK GeForce RTX 4060 Laptop GPU, i7-13620H, Micron 2400 MTFDKBA1T0QFM | MSI Titan GT77 HX 13VI GeForce RTX 4090 Laptop GPU, i9-13950HX, Samsung PM9A1 MZVL22T0HBLB | MSI Pulse GL76 12UGK GeForce RTX 3070 Laptop GPU, i7-12700H, Micron 3400 1TB MTFDKBA1T0TFH | Gigabyte G7 KE GeForce RTX 3060 Laptop GPU, i5-12500H, Gigabyte AG470S1TB-SI B10 | Asus ROG Strix Scar 17 SE G733CX-LL014W GeForce RTX 3080 Ti Laptop GPU, i9-12950HX, Samsung PM9A1 MZVL22T0HBLB | Acer Predator Helios 300 (i7-12700H, RTX 3070 Ti) GeForce RTX 3070 Ti Laptop GPU, i7-12700H, Samsung PM9A1 MZVL21T0HCLR | |
|---|---|---|---|---|---|---|
| Noise | -2% | 6% | -9% | 16% | -0% | |
| off /ambiente * (dB) | 24.5 | 24.6 -0% | 24.1 2% | 27 -10% | 23.9 2% | 23 6% |
| Idle Minimum * (dB) | 24.5 | 29.2 -19% | 26.9 -10% | 27 -10% | 23.9 2% | 23 6% |
| Idle Average * (dB) | 24.5 | 29.2 -19% | 26.9 -10% | 35 -43% | 23.9 2% | 25.92 -6% |
| Idle Maximum * (dB) | 40 | 29.2 27% | 27 32% | 38 5% | 23.9 40% | 40.67 -2% |
| Load Average * (dB) | 48.3 | 50.7 -5% | 43.8 9% | 52 -8% | 34.3 29% | 42.7 12% |
| Witcher 3 ultra * (dB) | 56 | 53.3 5% | 44.7 20% | 56 -0% | 62.48 -12% | |
| Load Maximum * (dB) | 59.1 | 61 -3% | 58.3 1% | 59 -0% | 45.9 22% | 62.67 -6% |
* ... Meglio usare valori piccoli
Temperatura
Buone notizie: non c'è da preoccuparsi di avere le mani sudate quando si usa il Katana 17, perché l'area di appoggio dei palmi rimane fresca, anche nei test di stress. Anche la temperatura massima di 45,5 gradi Celsius nel testWitcher 3 non è motivo di preoccupazione.
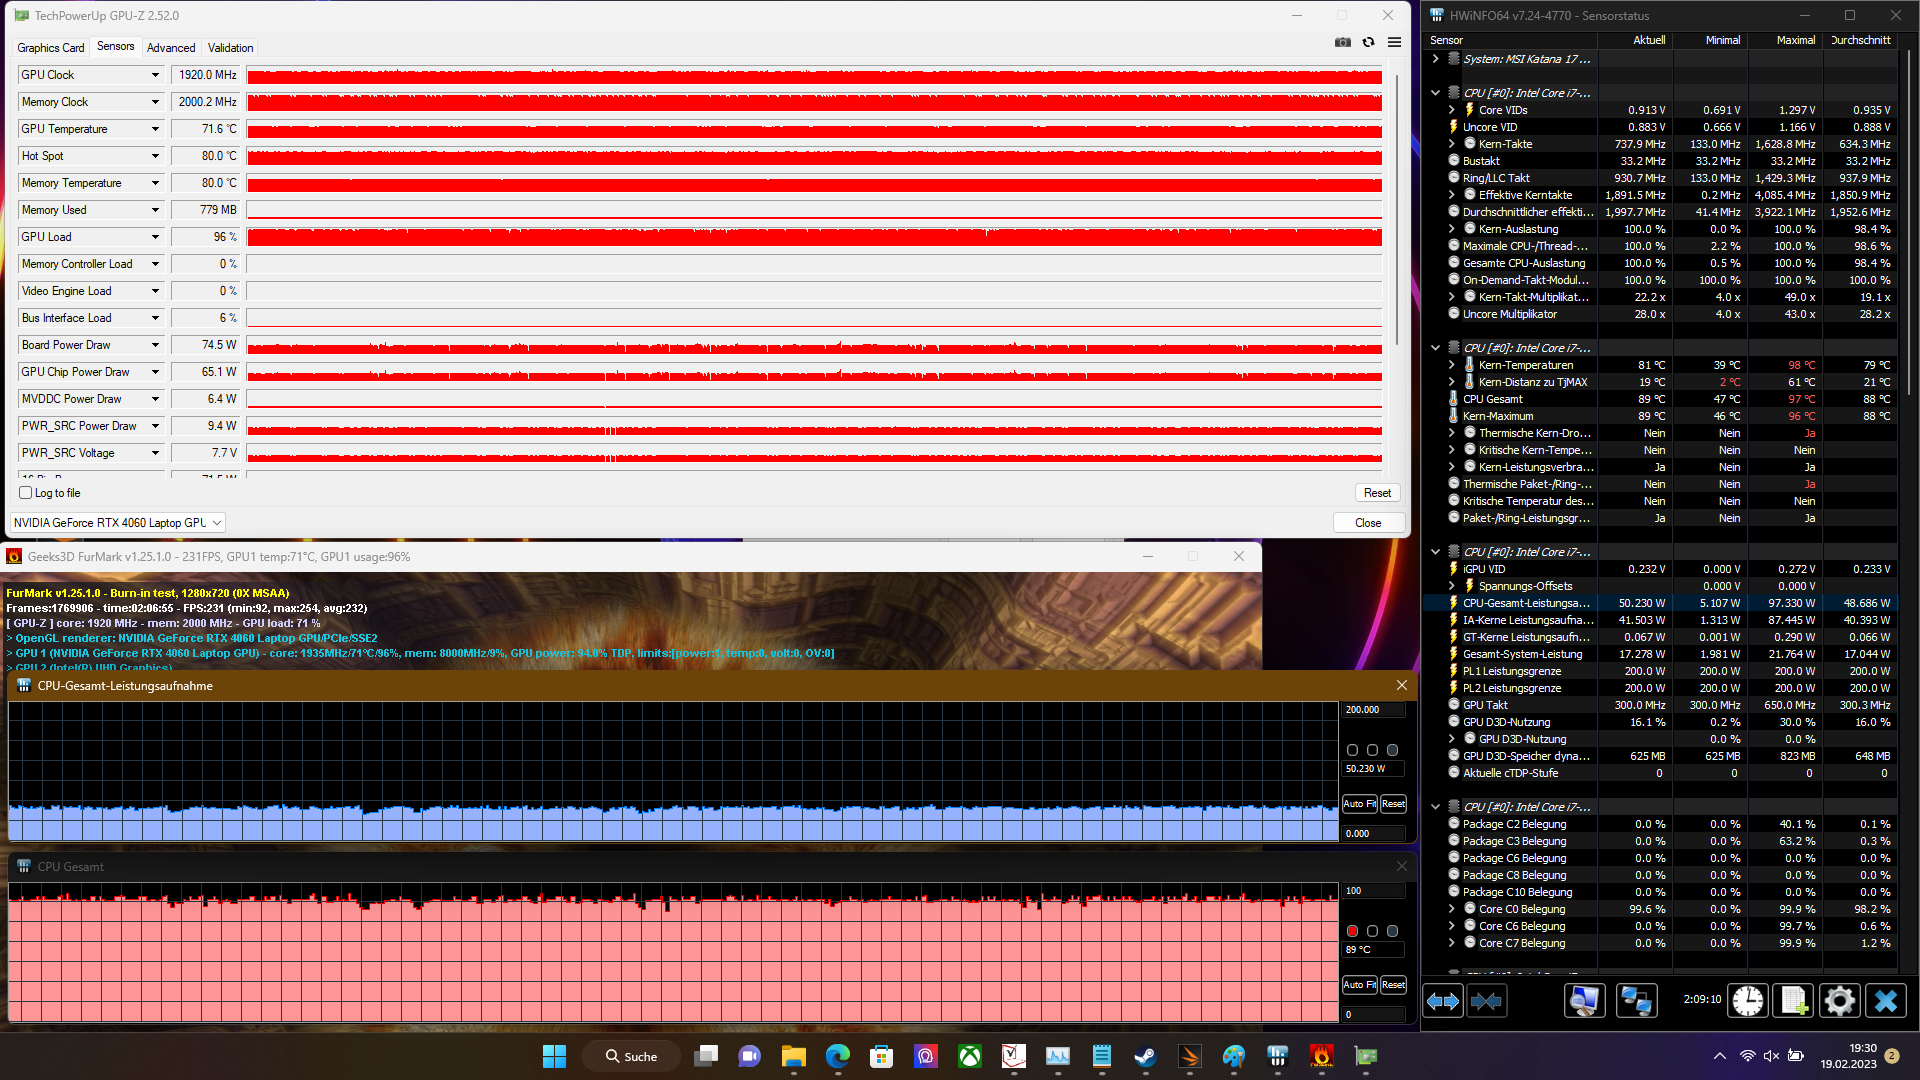
Nei test di stress dell'MSI Katana 17 B13V non abbiamo rilevato alcun throttling.
(±) La temperatura massima sul lato superiore è di 41.6 °C / 107 F, rispetto alla media di 40.4 °C / 105 F, che varia da 21.2 a 68.8 °C per questa classe Gaming.
(±) Il lato inferiore si riscalda fino ad un massimo di 43.1 °C / 110 F, rispetto alla media di 43.2 °C / 110 F
(+) In idle, la temperatura media del lato superiore è di 27.8 °C / 82 F, rispetto alla media deld ispositivo di 33.9 °C / 93 F.
(+) Riproducendo The Witcher 3, la temperatura media per il lato superiore e' di 31.8 °C / 89 F, rispetto alla media del dispositivo di 33.9 °C / 93 F.
(+) I poggiapolsi e il touchpad sono piu' freddi della temperatura della pelle con un massimo di 24.2 °C / 75.6 F e sono quindi freddi al tatto.
(+) La temperatura media della zona del palmo della mano di dispositivi simili e'stata di 28.8 °C / 83.8 F (+4.6 °C / 8.2 F).
| MSI Katana 17 B13VFK Intel Core i7-13620H, NVIDIA GeForce RTX 4060 Laptop GPU | MSI Titan GT77 HX 13VI Intel Core i9-13950HX, NVIDIA GeForce RTX 4090 Laptop GPU | MSI Pulse GL76 12UGK Intel Core i7-12700H, NVIDIA GeForce RTX 3070 Laptop GPU | Gigabyte G7 KE Intel Core i5-12500H, NVIDIA GeForce RTX 3060 Laptop GPU | Asus ROG Strix Scar 17 SE G733CX-LL014W Intel Core i9-12950HX, NVIDIA GeForce RTX 3080 Ti Laptop GPU | Acer Predator Helios 300 (i7-12700H, RTX 3070 Ti) Intel Core i7-12700H, NVIDIA GeForce RTX 3070 Ti Laptop GPU | |
|---|---|---|---|---|---|---|
| Heat | 10% | -5% | -7% | -7% | 2% | |
| Maximum Upper Side * (°C) | 41.6 | 40.6 2% | 44.2 -6% | 52 -25% | 48.8 -17% | 35 16% |
| Maximum Bottom * (°C) | 43.1 | 41.1 5% | 45.2 -5% | 54 -25% | 52.4 -22% | 53 -23% |
| Idle Upper Side * (°C) | 32 | 26.2 18% | 35.4 -11% | 28 12% | 30.4 5% | 29 9% |
| Idle Bottom * (°C) | 35.8 | 30.3 15% | 35 2% | 32 11% | 34.1 5% | 34 5% |
* ... Meglio usare valori piccoli
Altoparlanti
Gli altoparlanti dell'MSI Katana 17 sono relativamente forti ma mancano di bassi. I giocatori dovrebbero invece optare per un buon paio di cuffie, che rendono inudibile il rumore della ventola.
MSI Katana 17 B13VFK analisi audio
(±) | potenza degli altiparlanti media ma buona (78.5 dB)
Bassi 100 - 315 Hz
(-) | quasi nessun basso - in media 17.7% inferiori alla media
(±) | la linearità dei bassi è media (11.7% delta rispetto alla precedente frequenza)
Medi 400 - 2000 Hz
(±) | medi elevati - circa 6.8% superiore alla media
(+) | medi lineari (6.7% delta rispetto alla precedente frequenza)
Alti 2 - 16 kHz
(+) | Alti bilanciati - appena 3.2% dalla media
(±) | la linearità degli alti è media (7.2% delta rispetto alla precedente frequenza)
Nel complesso 100 - 16.000 Hz
(±) | la linearità complessiva del suono è media (19.4% di differenza rispetto alla media
Rispetto alla stessa classe
» 67% di tutti i dispositivi testati in questa classe è stato migliore, 7% simile, 26% peggiore
» Il migliore ha avuto un delta di 6%, medio di 18%, peggiore di 132%
Rispetto a tutti i dispositivi testati
» 48% di tutti i dispositivi testati in questa classe è stato migliore, 7% similare, 45% peggiore
» Il migliore ha avuto un delta di 4%, medio di 24%, peggiore di 134%
Acer Predator Helios 300 (i7-12700H, RTX 3070 Ti) analisi audio
(±) | potenza degli altiparlanti media ma buona (73.83 dB)
Bassi 100 - 315 Hz
(±) | bassi ridotti - in media 12.7% inferiori alla media
(±) | la linearità dei bassi è media (11.2% delta rispetto alla precedente frequenza)
Medi 400 - 2000 Hz
(±) | medi elevati - circa 5.5% superiore alla media
(±) | linearità dei medi adeguata (7.9% delta rispetto alla precedente frequenza)
Alti 2 - 16 kHz
(+) | Alti bilanciati - appena 2.1% dalla media
(+) | alti lineari (3.5% delta rispetto alla precedente frequenza)
Nel complesso 100 - 16.000 Hz
(±) | la linearità complessiva del suono è media (15.8% di differenza rispetto alla media
Rispetto alla stessa classe
» 37% di tutti i dispositivi testati in questa classe è stato migliore, 7% simile, 56% peggiore
» Il migliore ha avuto un delta di 6%, medio di 18%, peggiore di 132%
Rispetto a tutti i dispositivi testati
» 24% di tutti i dispositivi testati in questa classe è stato migliore, 5% similare, 71% peggiore
» Il migliore ha avuto un delta di 4%, medio di 24%, peggiore di 134%
Gestione dell'energia: La macchina da gioco affamata di energia di MSI
Consumo di energia
Il consumo minimo di circa 12,2 watt è relativamente alto ma tipico di un sistema di gioco. Tuttavia, rispetto alla concorrenza, il consumo è ancora relativamente basso.
L'alimentatore da 240 watt è sufficientemente dimensionato per far fronte a un consumo massimo di 212 watt.
| Off / Standby | |
| Idle | |
| Sotto carico |
|
Leggenda:
min: | |
| MSI Katana 17 B13VFK i7-13620H, GeForce RTX 4060 Laptop GPU, Micron 2400 MTFDKBA1T0QFM, IPS LED, 1920x1080, 17.3" | MSI Titan GT77 HX 13VI i9-13950HX, GeForce RTX 4090 Laptop GPU, Samsung PM9A1 MZVL22T0HBLB, Mini-LED, 3840x2160, 17.3" | MSI Pulse GL76 12UGK i7-12700H, GeForce RTX 3070 Laptop GPU, Micron 3400 1TB MTFDKBA1T0TFH, IPS, 1920x1080, 17.3" | Gigabyte G7 KE i5-12500H, GeForce RTX 3060 Laptop GPU, Gigabyte AG470S1TB-SI B10, IPS, 1920x1080, 17.3" | Asus ROG Strix Scar 17 SE G733CX-LL014W i9-12950HX, GeForce RTX 3080 Ti Laptop GPU, Samsung PM9A1 MZVL22T0HBLB, IPS, 2560x1440, 17.3" | Acer Predator Helios 300 (i7-12700H, RTX 3070 Ti) i7-12700H, GeForce RTX 3070 Ti Laptop GPU, Samsung PM9A1 MZVL21T0HCLR, IPS, 2560x1440, 17.3" | Media NVIDIA GeForce RTX 4060 Laptop GPU | Media della classe Gaming | |
|---|---|---|---|---|---|---|---|---|
| Power Consumption | -55% | -14% | -22% | -61% | -41% | -7% | -27% | |
| Idle Minimum * (Watt) | 12.2 | 14 -15% | 12.4 -2% | 15 -23% | 19.3 -58% | 15 -23% | 11.5 ? 6% | 13.2 ? -8% |
| Idle Average * (Watt) | 14.9 | 21.6 -45% | 13.1 12% | 17 -14% | 26.5 -78% | 20 -34% | 16 ? -7% | 18.9 ? -27% |
| Idle Maximum * (Watt) | 15.8 | 24.8 -57% | 25.3 -60% | 24 -52% | 27.1 -72% | 22.3 -41% | 20.3 ? -28% | 24.3 ? -54% |
| Load Average * (Watt) | 85.22 | 122.5 -44% | 105.4 -24% | 111 -30% | 141 -65% | 133 -56% | 92.9 ? -9% | 108 ? -27% |
| Witcher 3 ultra * (Watt) | 151.1 | 265 -75% | 150 1% | 174.1 -15% | 225 -49% | 231 -53% | ||
| Load Maximum * (Watt) | 212.8 | 418 -96% | 240.5 -13% | 208 2% | 307.9 -45% | 290 -36% | 210 ? 1% | 254 ? -19% |
* ... Meglio usare valori piccoli
Power consumption Witcher 3 / stress test
Power consumption with an external monitor
Durata della batteria
La piccola batteria di MSI Katana 17 ha una capacità di soli 53,5 wattora. Pertanto, non ci si deve aspettare una buona durata della batteria quando si tratta di un sistema così potente. La batteria è durata solo tre ore nei test WiFi, il che significa che il portatile MSI non è adatto all'uso in mobilità.
| MSI Katana 17 B13VFK i7-13620H, GeForce RTX 4060 Laptop GPU, 53.5 Wh | MSI Titan GT77 HX 13VI i9-13950HX, GeForce RTX 4090 Laptop GPU, 99.9 Wh | MSI Pulse GL76 12UGK i7-12700H, GeForce RTX 3070 Laptop GPU, 90 Wh | Gigabyte G7 KE i5-12500H, GeForce RTX 3060 Laptop GPU, 54 Wh | Asus ROG Strix Scar 17 SE G733CX-LL014W i9-12950HX, GeForce RTX 3080 Ti Laptop GPU, 90 Wh | Acer Predator Helios 300 (i7-12700H, RTX 3070 Ti) i7-12700H, GeForce RTX 3070 Ti Laptop GPU, 90 Wh | Media della classe Gaming | |
|---|---|---|---|---|---|---|---|
| Autonomia della batteria | 62% | 107% | 57% | 45% | 94% | 95% | |
| WiFi v1.3 (h) | 2.9 | 5.3 83% | 5.9 103% | 5.3 83% | 4.2 45% | 6 107% | 7.02 ? 142% |
| Load (h) | 1 | 1.4 40% | 2.1 110% | 1.3 30% | 1.8 80% | 1.47 ? 47% | |
| H.264 (h) | 6 | 2.2 | 5.9 | 8.26 ? | |||
| Reader / Idle (h) | 7.3 | 7.1 | 8.71 ? |
Pro
Contro
Verdetto: l'MSI Katana 17 B13V è un buon sistema di gioco
Il portatile MSI Katana 17 B13V ci ha impressionato nella sua principale area di competenza: il gaming. LaNvidia GeForce RTX 4060garantisce prestazioni elevate, in grado di competere con la RTX 3070 Ti della generazione precedente. Oltre alla veloce GPU, MSI è dotato di un display a 144 Hz e di una tastiera RGB che offre un'ottima esperienza di digitazione. Nonostante la potenza, il portatile rimane relativamente fresco.
Il principale punto critico è il display: Non è molto luminoso, ha una scarsa copertura dello spazio colore e tempi di risposta elevati. Inoltre, una porta USB-2.0 è qualcosa di cui il 2023 può davvero fare a meno. Inoltre, abbiamo trovato il layout della tastiera mal realizzato, in quanto i tasti come FN sono stati spostati in posizioni piuttosto insolite. La scarsa durata della batteria è prevedibile per un portatile da gioco, ma è comunque degna di critica.
GeForce RTX 4060: L'attrattiva dell'MSI 17 Katana B13V si basa sulla GPU.
Nel complesso, l'MSI Katana 17 si è guadagnato una buona valutazione e, con la RTX 4060, è sicuramente una scelta interessante per i giocatori. Tuttavia, in tempi di inflazione, questo vale anche per i dispositivi della generazione precedente come ilGigabyte G7 KEcon RTX 3060. I clienti attenti al prezzo possono risparmiare molto su uno dei modelli della scorsa generazione.
Prezzo e disponibilità
Al momento della pubblicazione di questa recensione, l'MSI Katana 17 B14V non è attualmente disponibile su Amazon e Best Buy. Tuttavia, il modello di generazione precedente (3070Ti) è attualmente disponibile su Amazon per circa 1499 dollari dollari.
MSI Katana 17 B13VFK
- 02/21/2023 v7 (old)
Benjamin Herzig
Transparency
La selezione dei dispositivi da recensire viene effettuata dalla nostra redazione. Il campione di prova è stato fornito all'autore come prestito dal produttore o dal rivenditore ai fini di questa recensione. L'istituto di credito non ha avuto alcuna influenza su questa recensione, né il produttore ne ha ricevuto una copia prima della pubblicazione. Non vi era alcun obbligo di pubblicare questa recensione. In quanto società mediatica indipendente, Notebookcheck non è soggetta all'autorità di produttori, rivenditori o editori.
Ecco come Notebookcheck esegue i test
Ogni anno, Notebookcheck esamina in modo indipendente centinaia di laptop e smartphone utilizzando procedure standardizzate per garantire che tutti i risultati siano comparabili. Da circa 20 anni sviluppiamo continuamente i nostri metodi di prova e nel frattempo stabiliamo gli standard di settore. Nei nostri laboratori di prova, tecnici ed editori esperti utilizzano apparecchiature di misurazione di alta qualità. Questi test comportano un processo di validazione in più fasi. Il nostro complesso sistema di valutazione si basa su centinaia di misurazioni e parametri di riferimento ben fondati, che mantengono l'obiettività.Price comparison

