Verdetto - La spada potrebbe essere più affilata
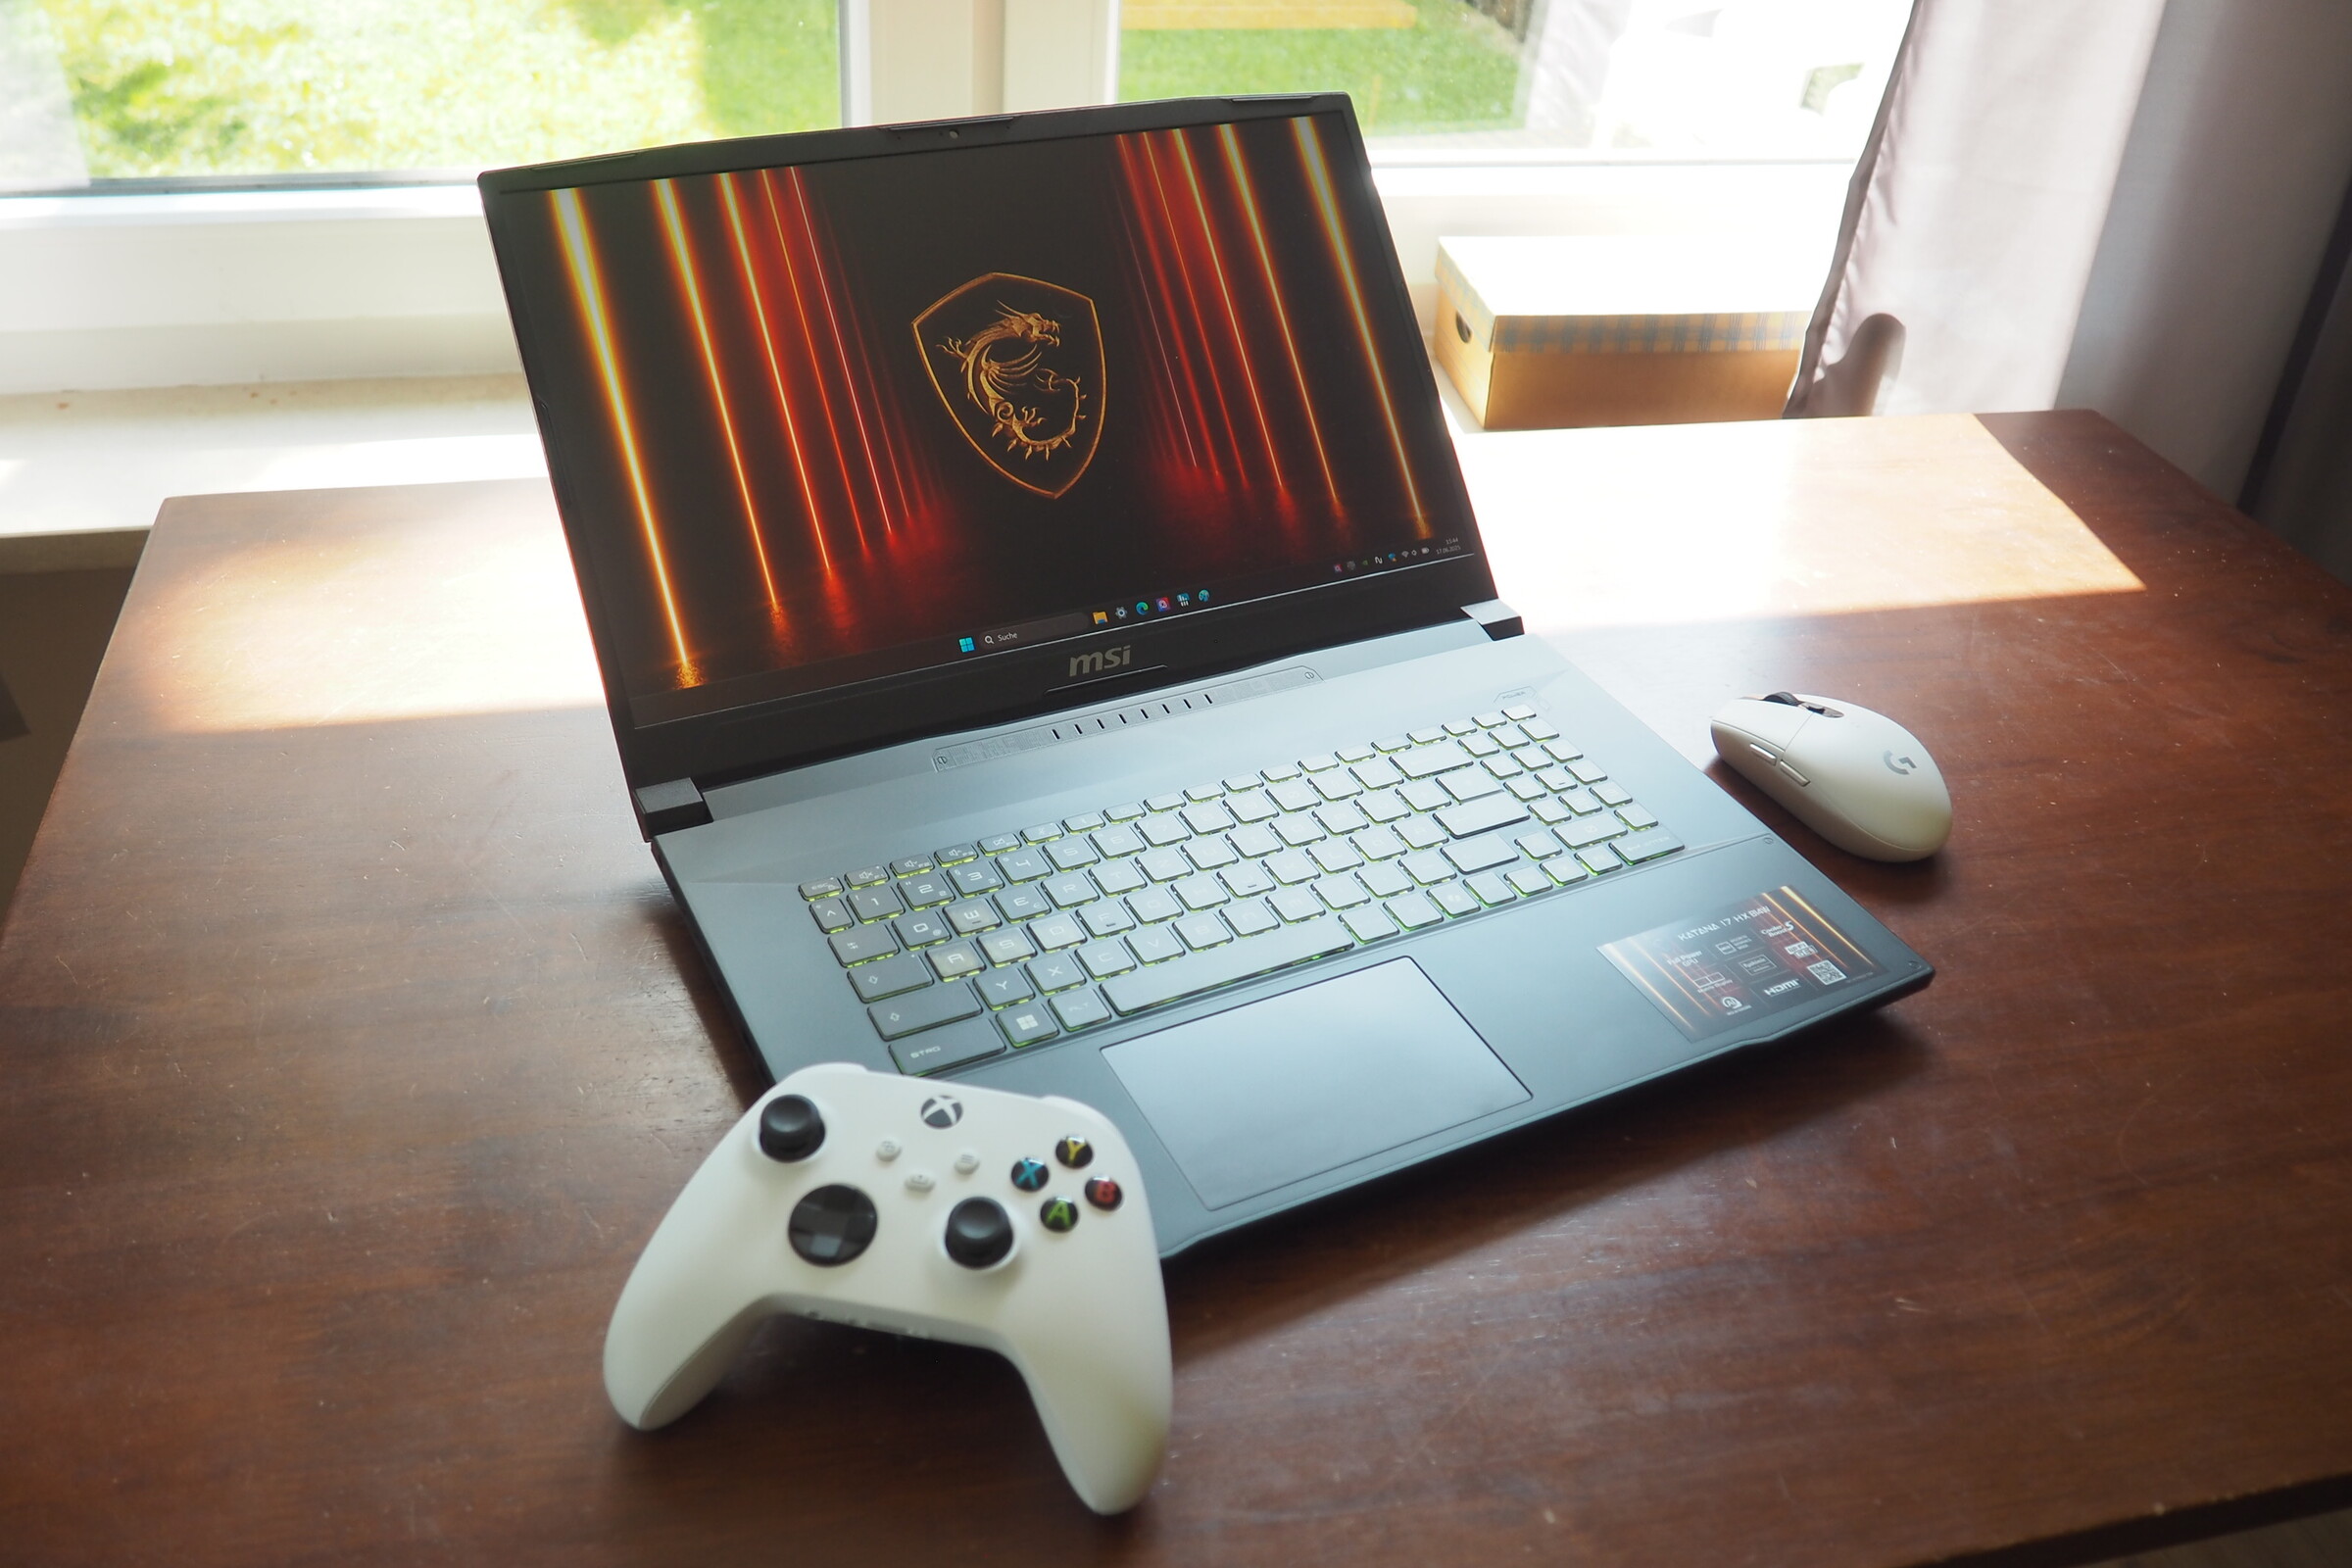
Il katana 17 HX B14WGK deve affrontare delle sfide non solo all'interno del portafoglio MSI, ma anche rispetto alle sue controparti. Sebbene il case sia ben fatto, tende a tintinnare e in generale non dà una sensazione di alta qualità. Le misure di riduzione dei costi si notano anche nelle interfacce. Mancano le porte Thunderbolt o le moderne porte USB (parola chiave USB 4), così come un lettore di schede. Inoltre, c'è un livello di rumore molto alto sotto carico, che praticamente costringe a usare le cuffie. MSI potrebbe anche migliorare la tastiera, a cui bisogna abituarsi, il suono dell'altoparlante, la qualità della webcam e la durata della batteria.
C'è poco da lamentarsi in termini di display: a parte la scarsa luminosità, lo schermo a 240 Hz raggiunge buoni valori quasi ovunque. Il fatto che la RTX 5070 di GeForce lasci sensazioni contrastanti è più che altro il risultato delle decisioni di prodotto di Nvidia. Inoltre, 8 GB di VRAM non sono più sufficienti nel 2025, soprattutto per le applicazioni ad alta intensità di risorse come Indiana Jonesanche se le GDDR7 mitigano un po' la situazione. A parte questo, il 17 pollici è piuttosto poco spettacolare, cioè non si distingue dalla massa né in positivo né in negativo, quindi alla fine è appena sufficiente per una valutazione "buona".
Pro
Contro
Prezzo e disponibilità
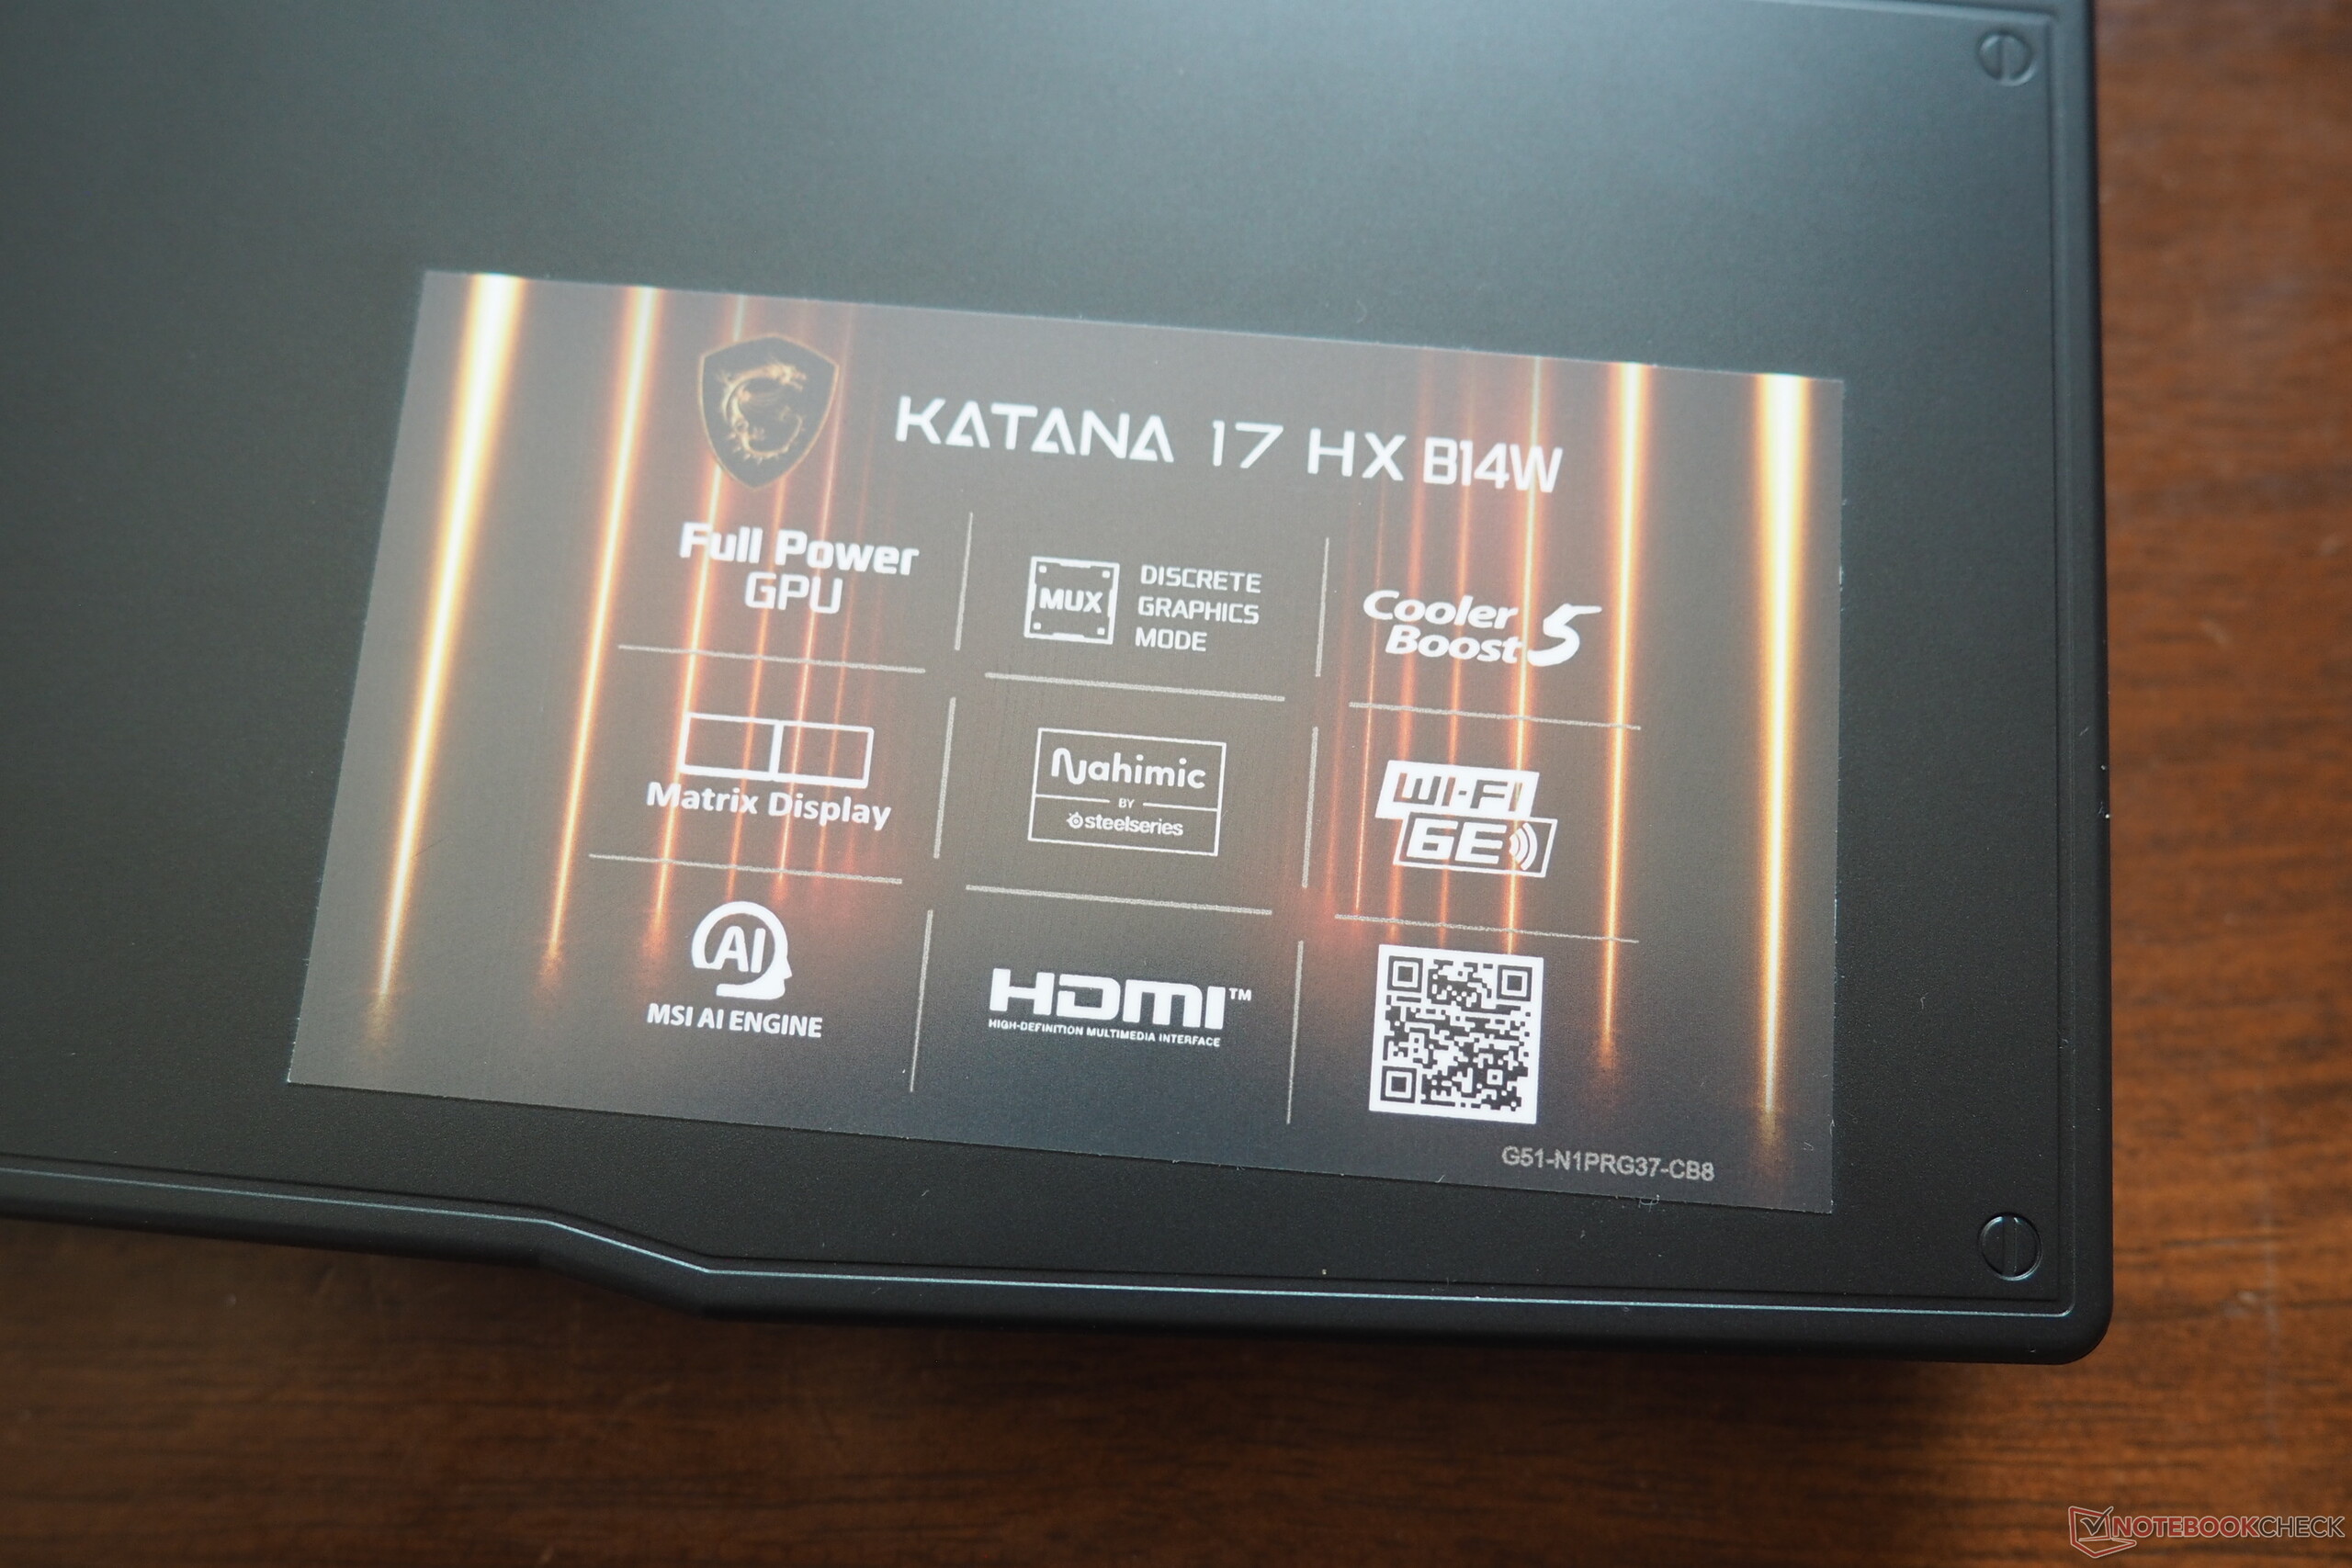
In Germania, MSI Katana 17 HX B14WGK con Core i7-14650HX e GeForce RTX 5070 è in listino a partire da circa 1.800 euro (circa 2.065 dollari) presso diversi negozi online (ad esempio, playox.de)
- $57.95240W 12A Adapter for MSI Katana 15 17 HX B13V B13VGK B13VFK B13VEK B12V B12VGK B12VEK B12VFK B14W B14WGK Pulse 15 17 B13V B13VGK Delta 15 A5EFK Chicony A20-240P2A Gaming Laptop Charger 4.5 * 3.0 mm
- $59.99240W 200W AC Charger for MSI Katana 15 17 HX Pulse 15 17 B13V B13VF B13VGK B13VEK B13VGK-484US B13VEK-277US B14W B14WGK B14WFK B12V B12VFK B12VGK B12VEK GF66 GF76 12UE 12UGS 12UG Laptop
- $1,469.00msi Katana 15 HX B14WGK 15.6" 165Hz WQHD (2560x1440) IPS Laptop 2025 New | Intel i7-14650HX 16-Core | NVIDIA GeForce RTX 5070 | Four-Zone RGB Backlit KB | Wi-Fi 6E | 16GB DDR5 1TB SSD | Win11 Home
I concorrenti del Katana 17 includono altri portatili da gioco con RTX 5070 (Ti) come il Gigabyte Aero X16e l' Asus ProArt P16, il Schenker XMG Pro 16o il prodotto interno Vector 16 HX AI.
Specifiche
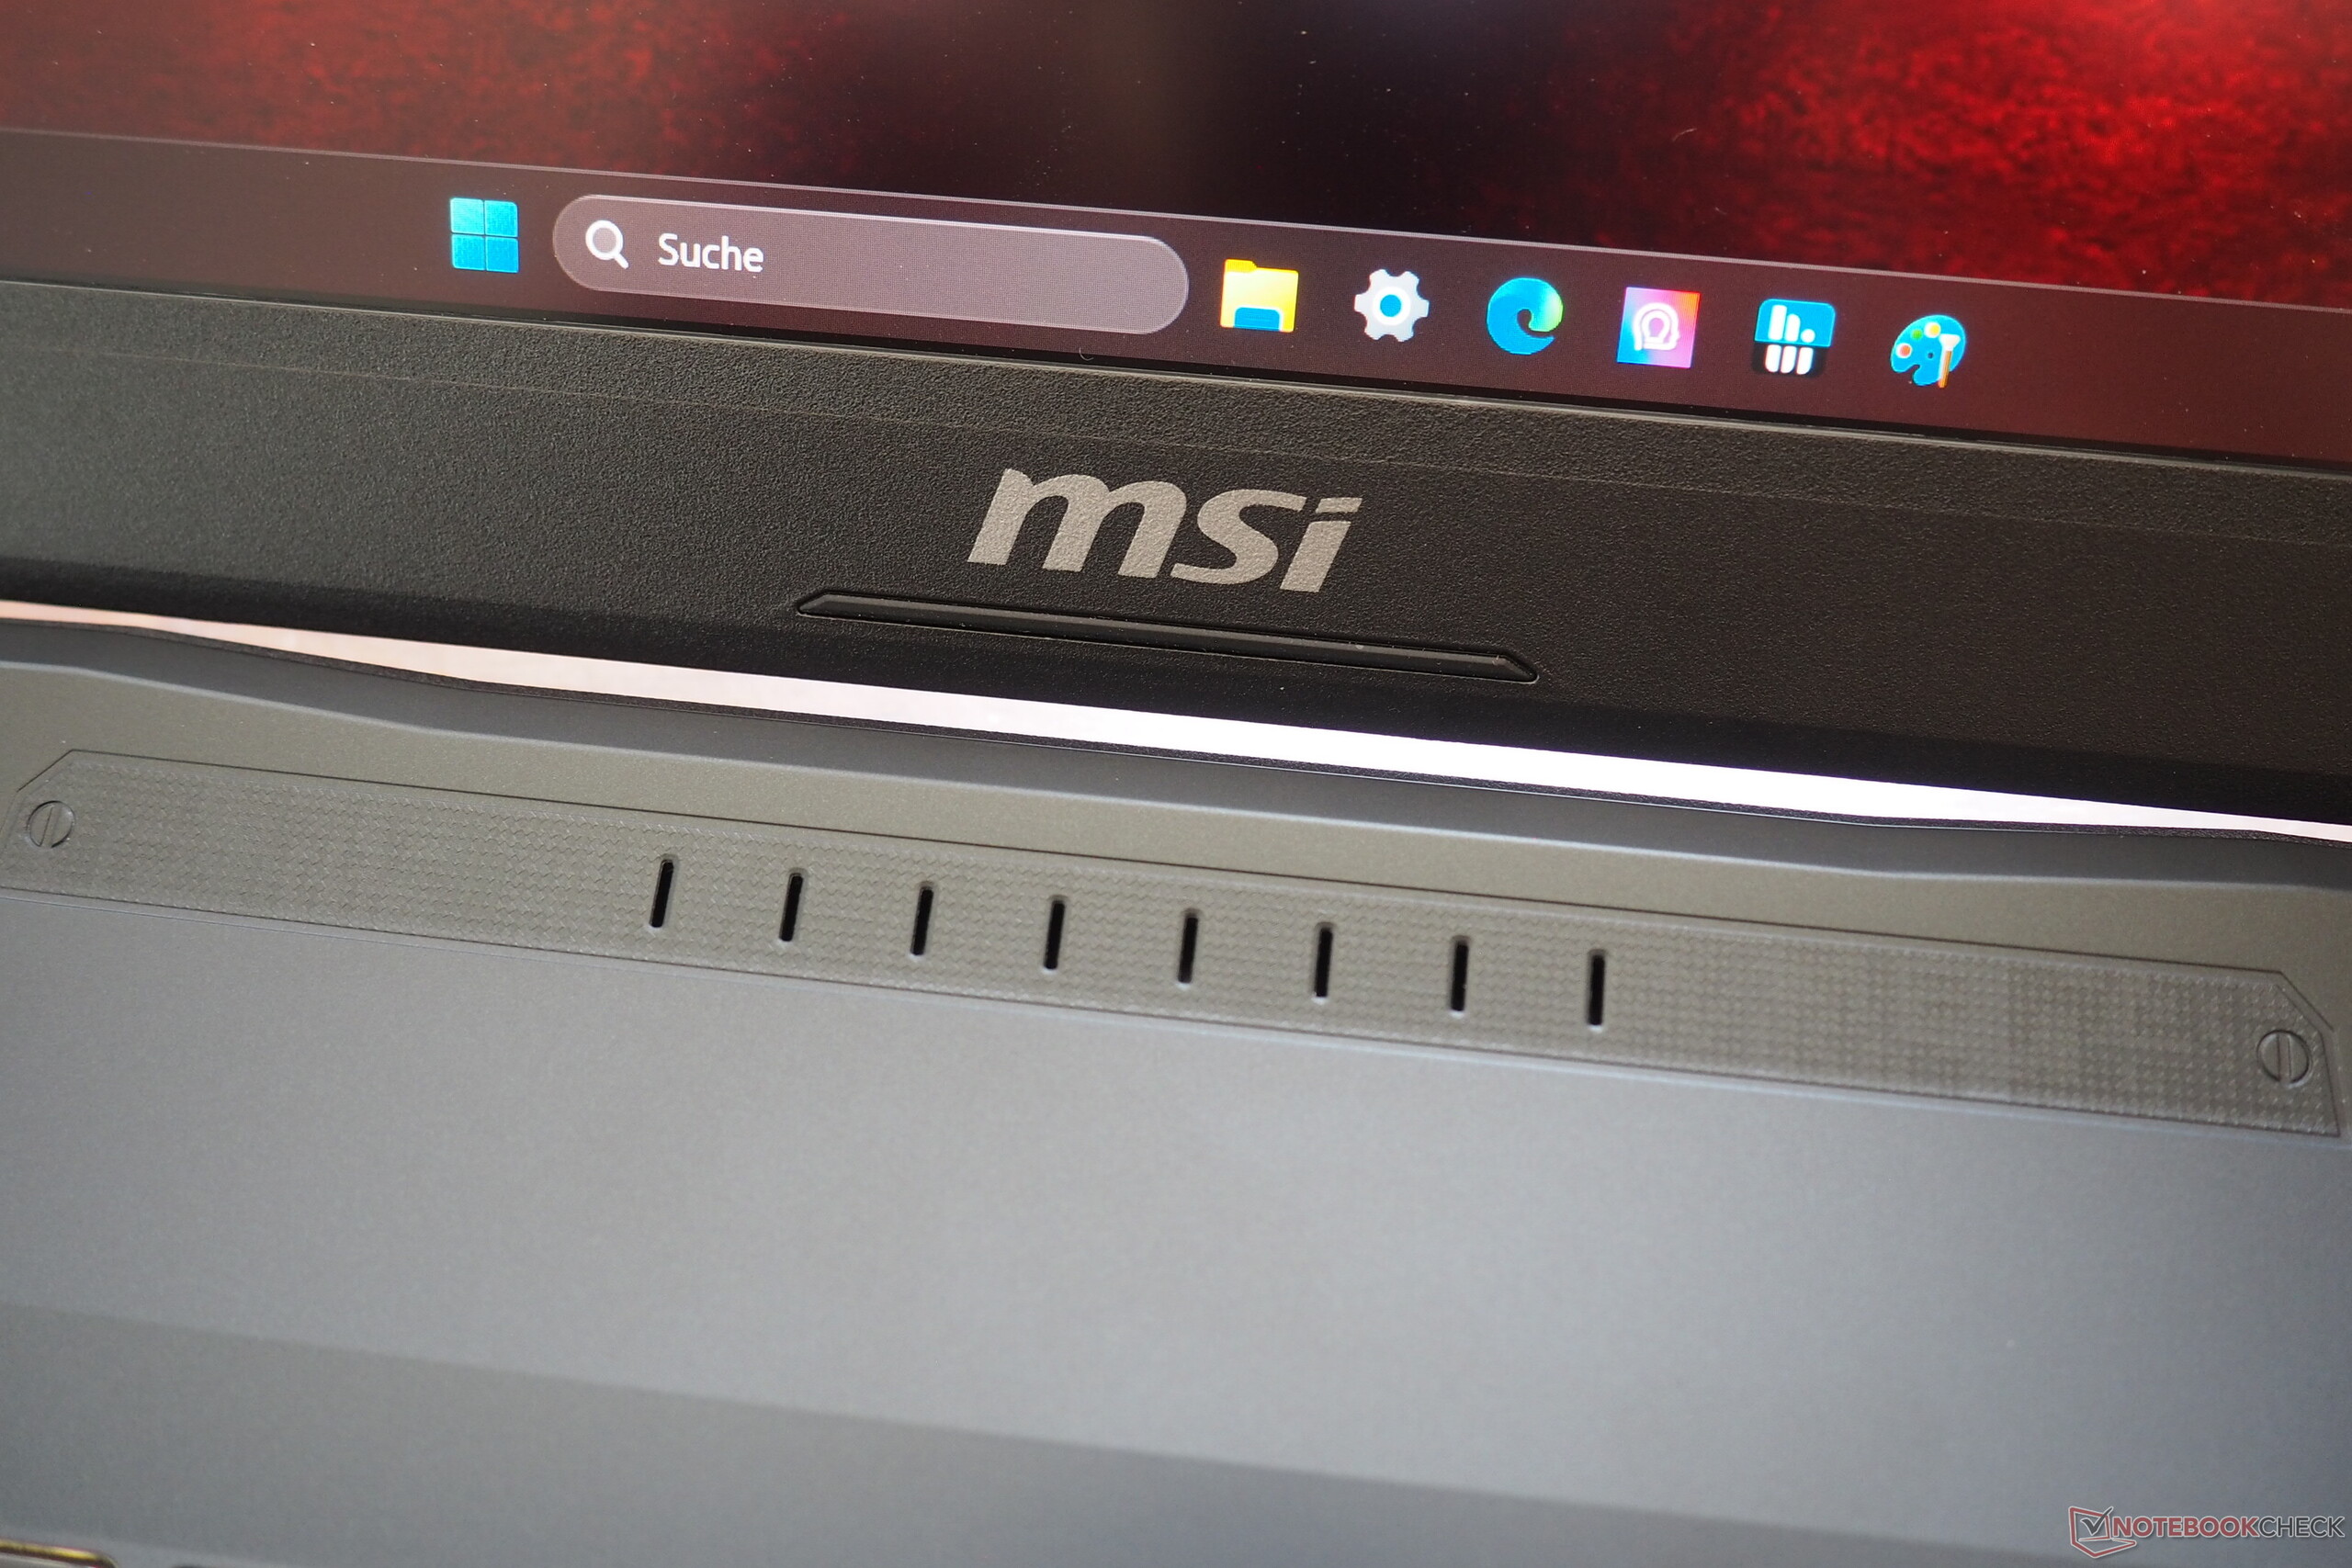
Caso
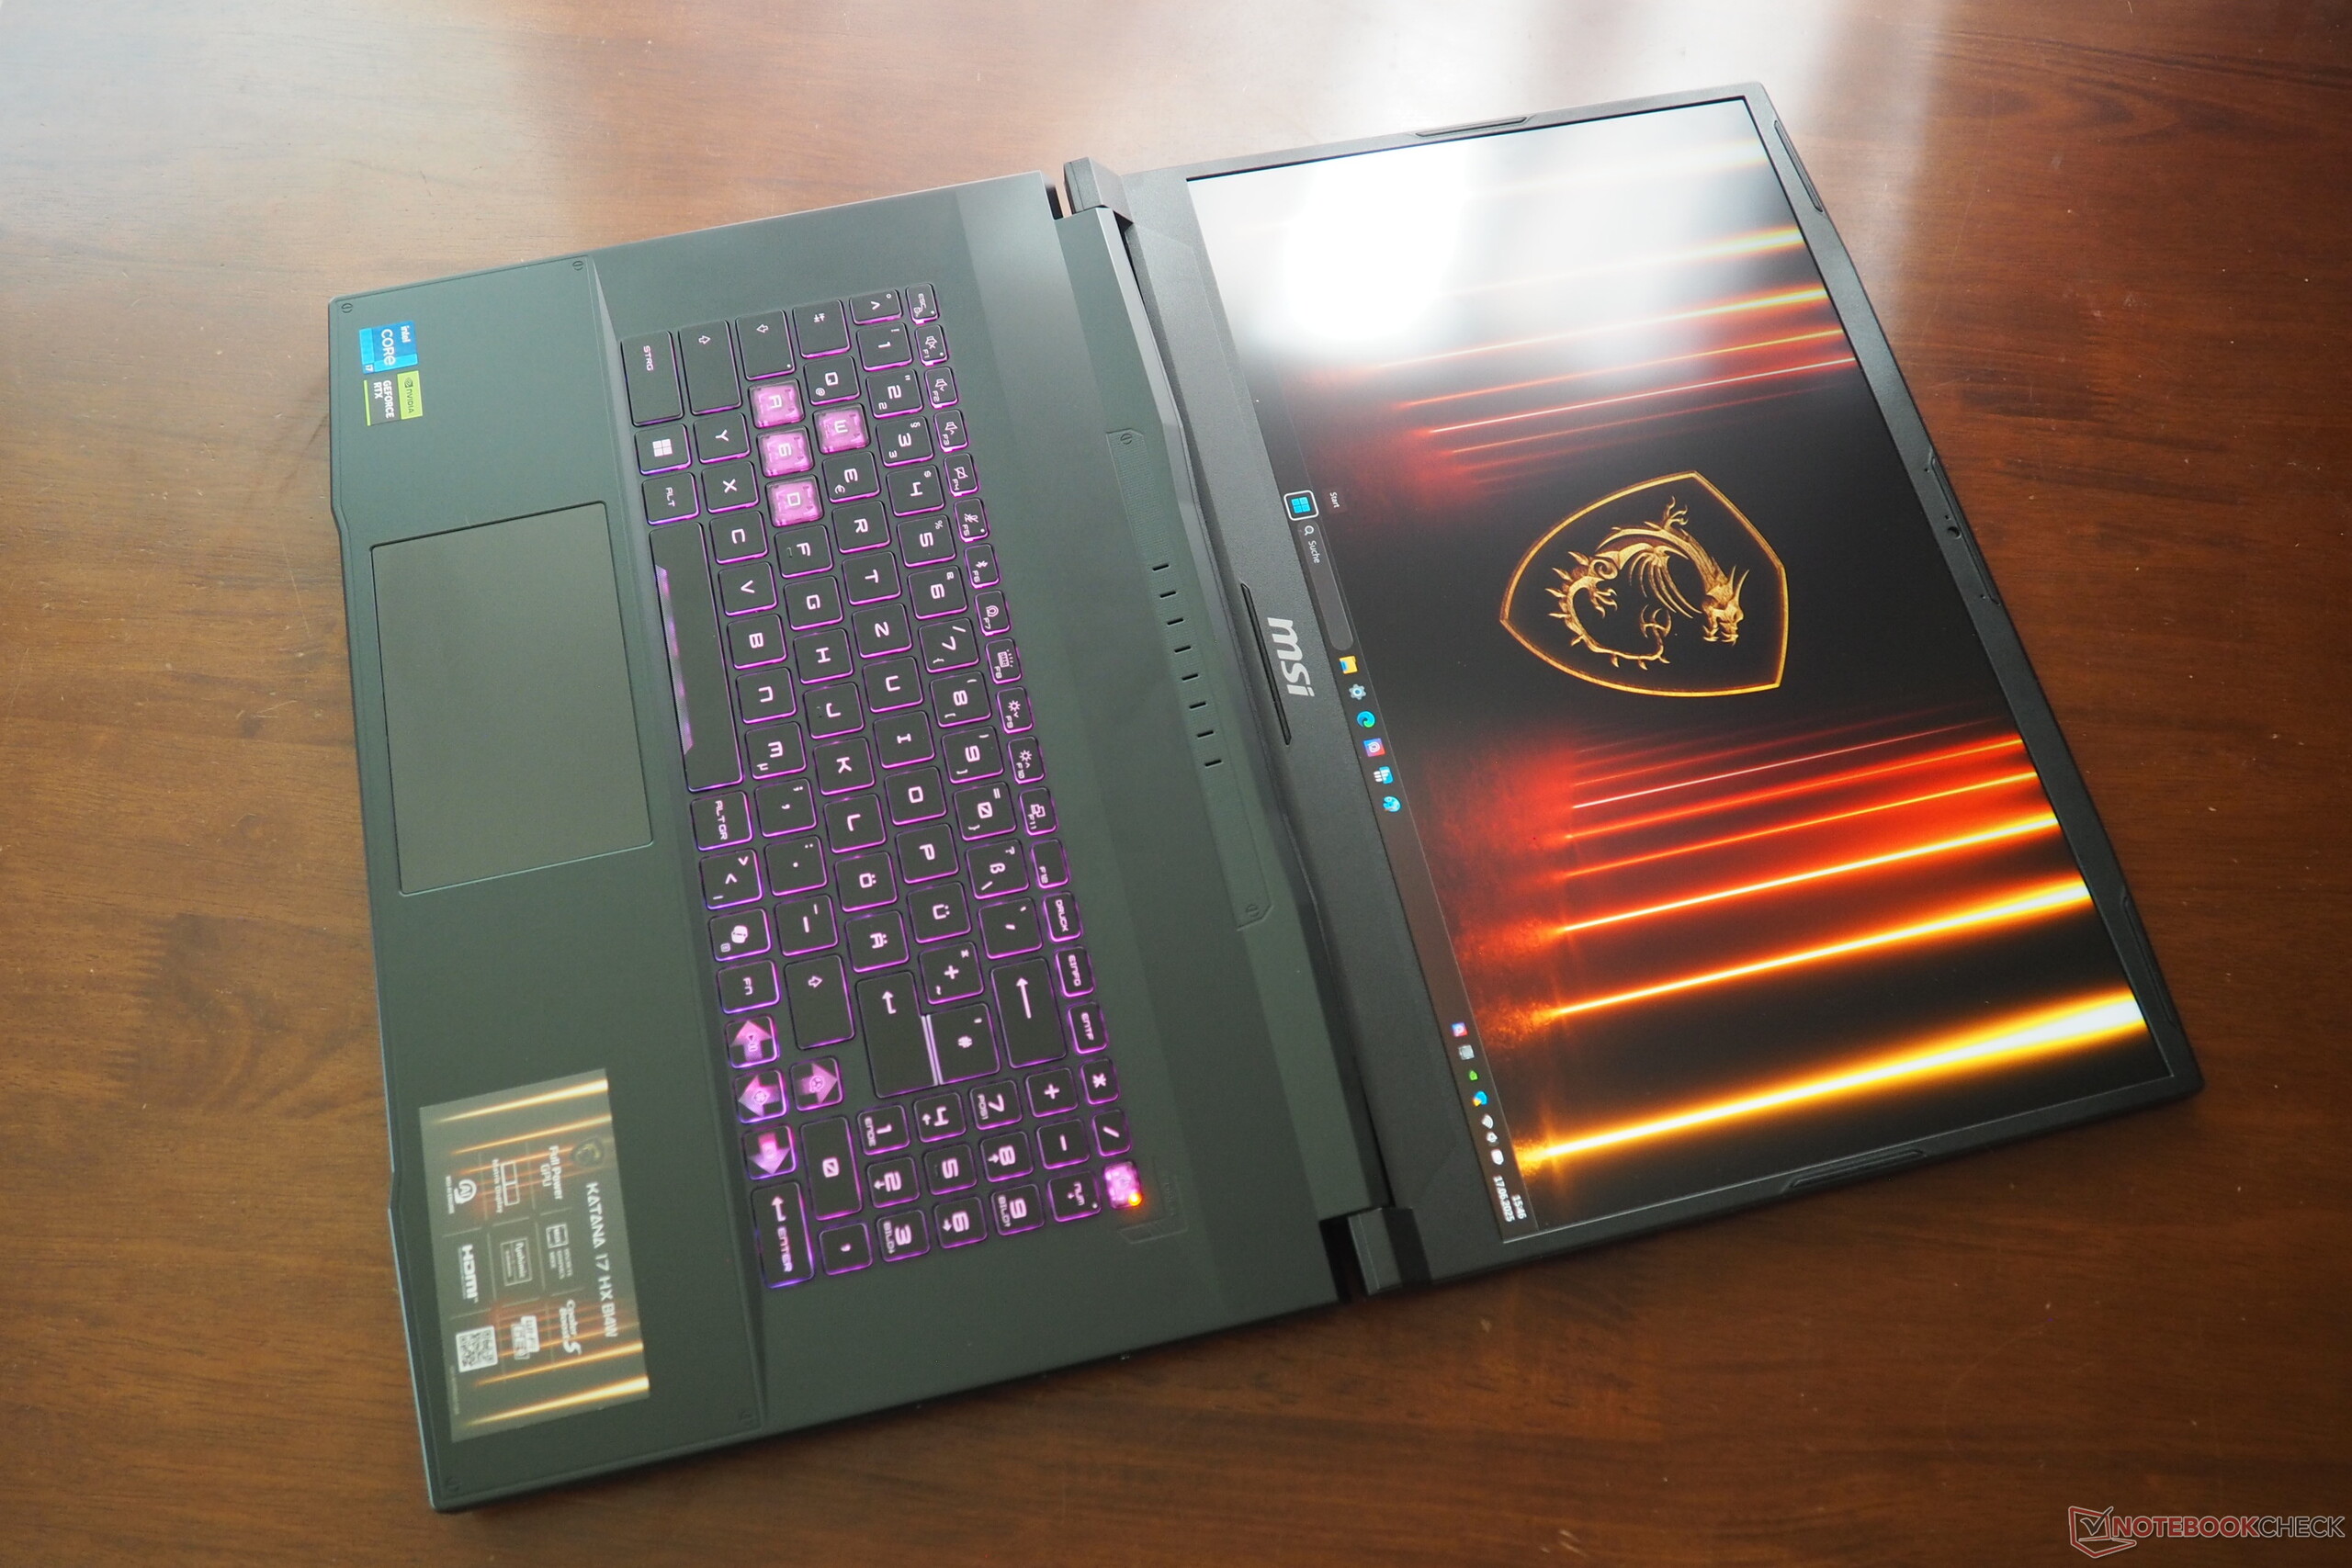
Come accennato all'inizio, la qualità del case è un po' deludente. MSI ha rinunciato al metallo all'esterno e ha optato per la plastica su un'ampia area, che tende a cedere in alcuni punti e sembra piuttosto economica al tatto. Nel frattempo, ci sono diversi vantaggi grazie al generoso angolo di apertura. Può essere aperto fino a 180°, il che non è una caratteristica tipica. Con un peso di 2,7 kg, il modello da 17 pollici è leggermente o significativamente più pesante dei suoi concorrenti da 16 pollici (da 1,8 a 2,6 kg). Fondamentalmente, il case è molto simile al suo predecessore (che abbiamo testato nel AMD e Versioni Intel), anche se ci sono alcune differenze nei dettagli.

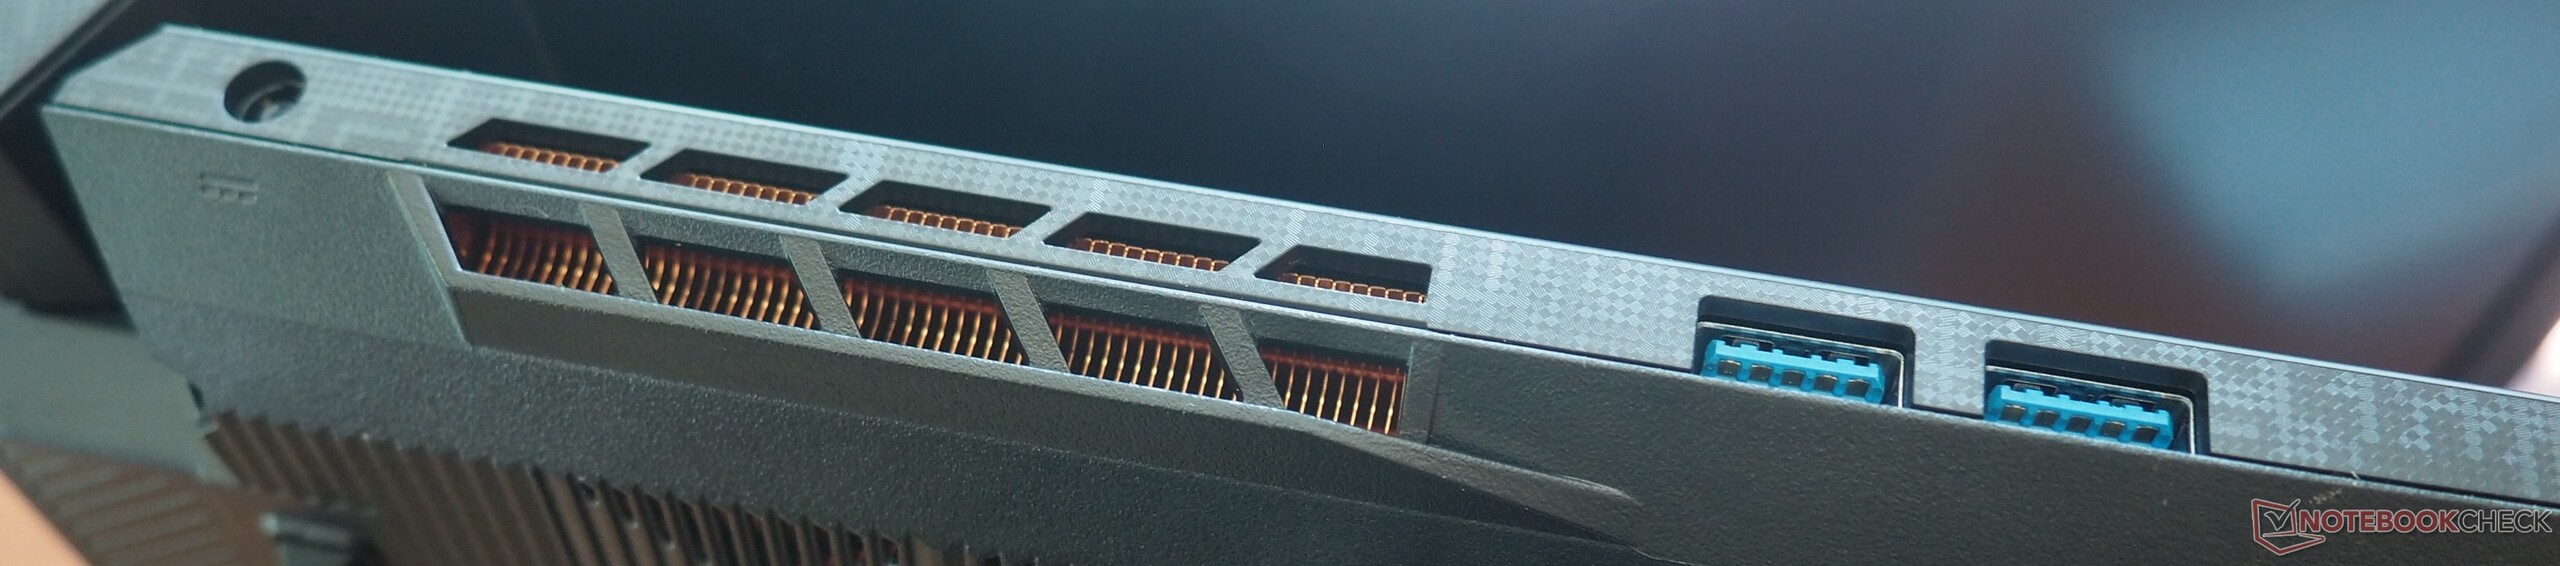
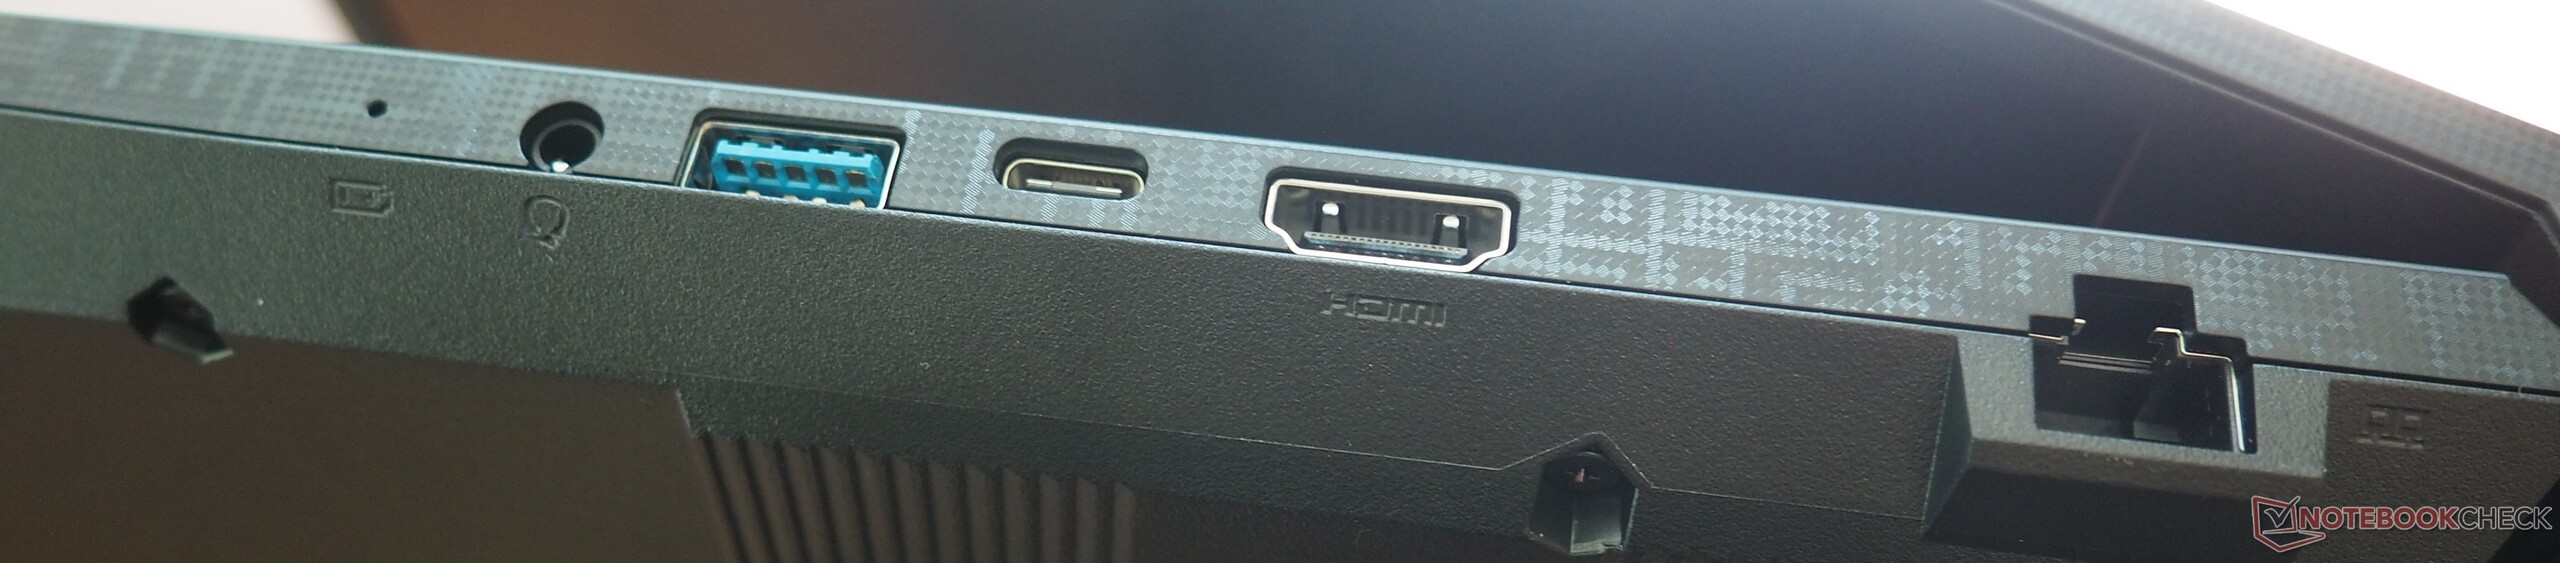
Porti e connettività
Katana 17 offre tre porte USB-A (3.0) e una porta USB-C (3.1 Gen 2, inclusa DisplayPort), oltre a un jack audio, una porta Gigabit Ethernet e un'uscita HDMI 2.1. La velocità del modulo Wi-Fi integrato (Intel Wi-Fi 6E AX211) è da discreta a molto buona, a seconda del test. Tuttavia, la webcam HD ha un'immagine molto sfocata.
Comunicazione
Webcam


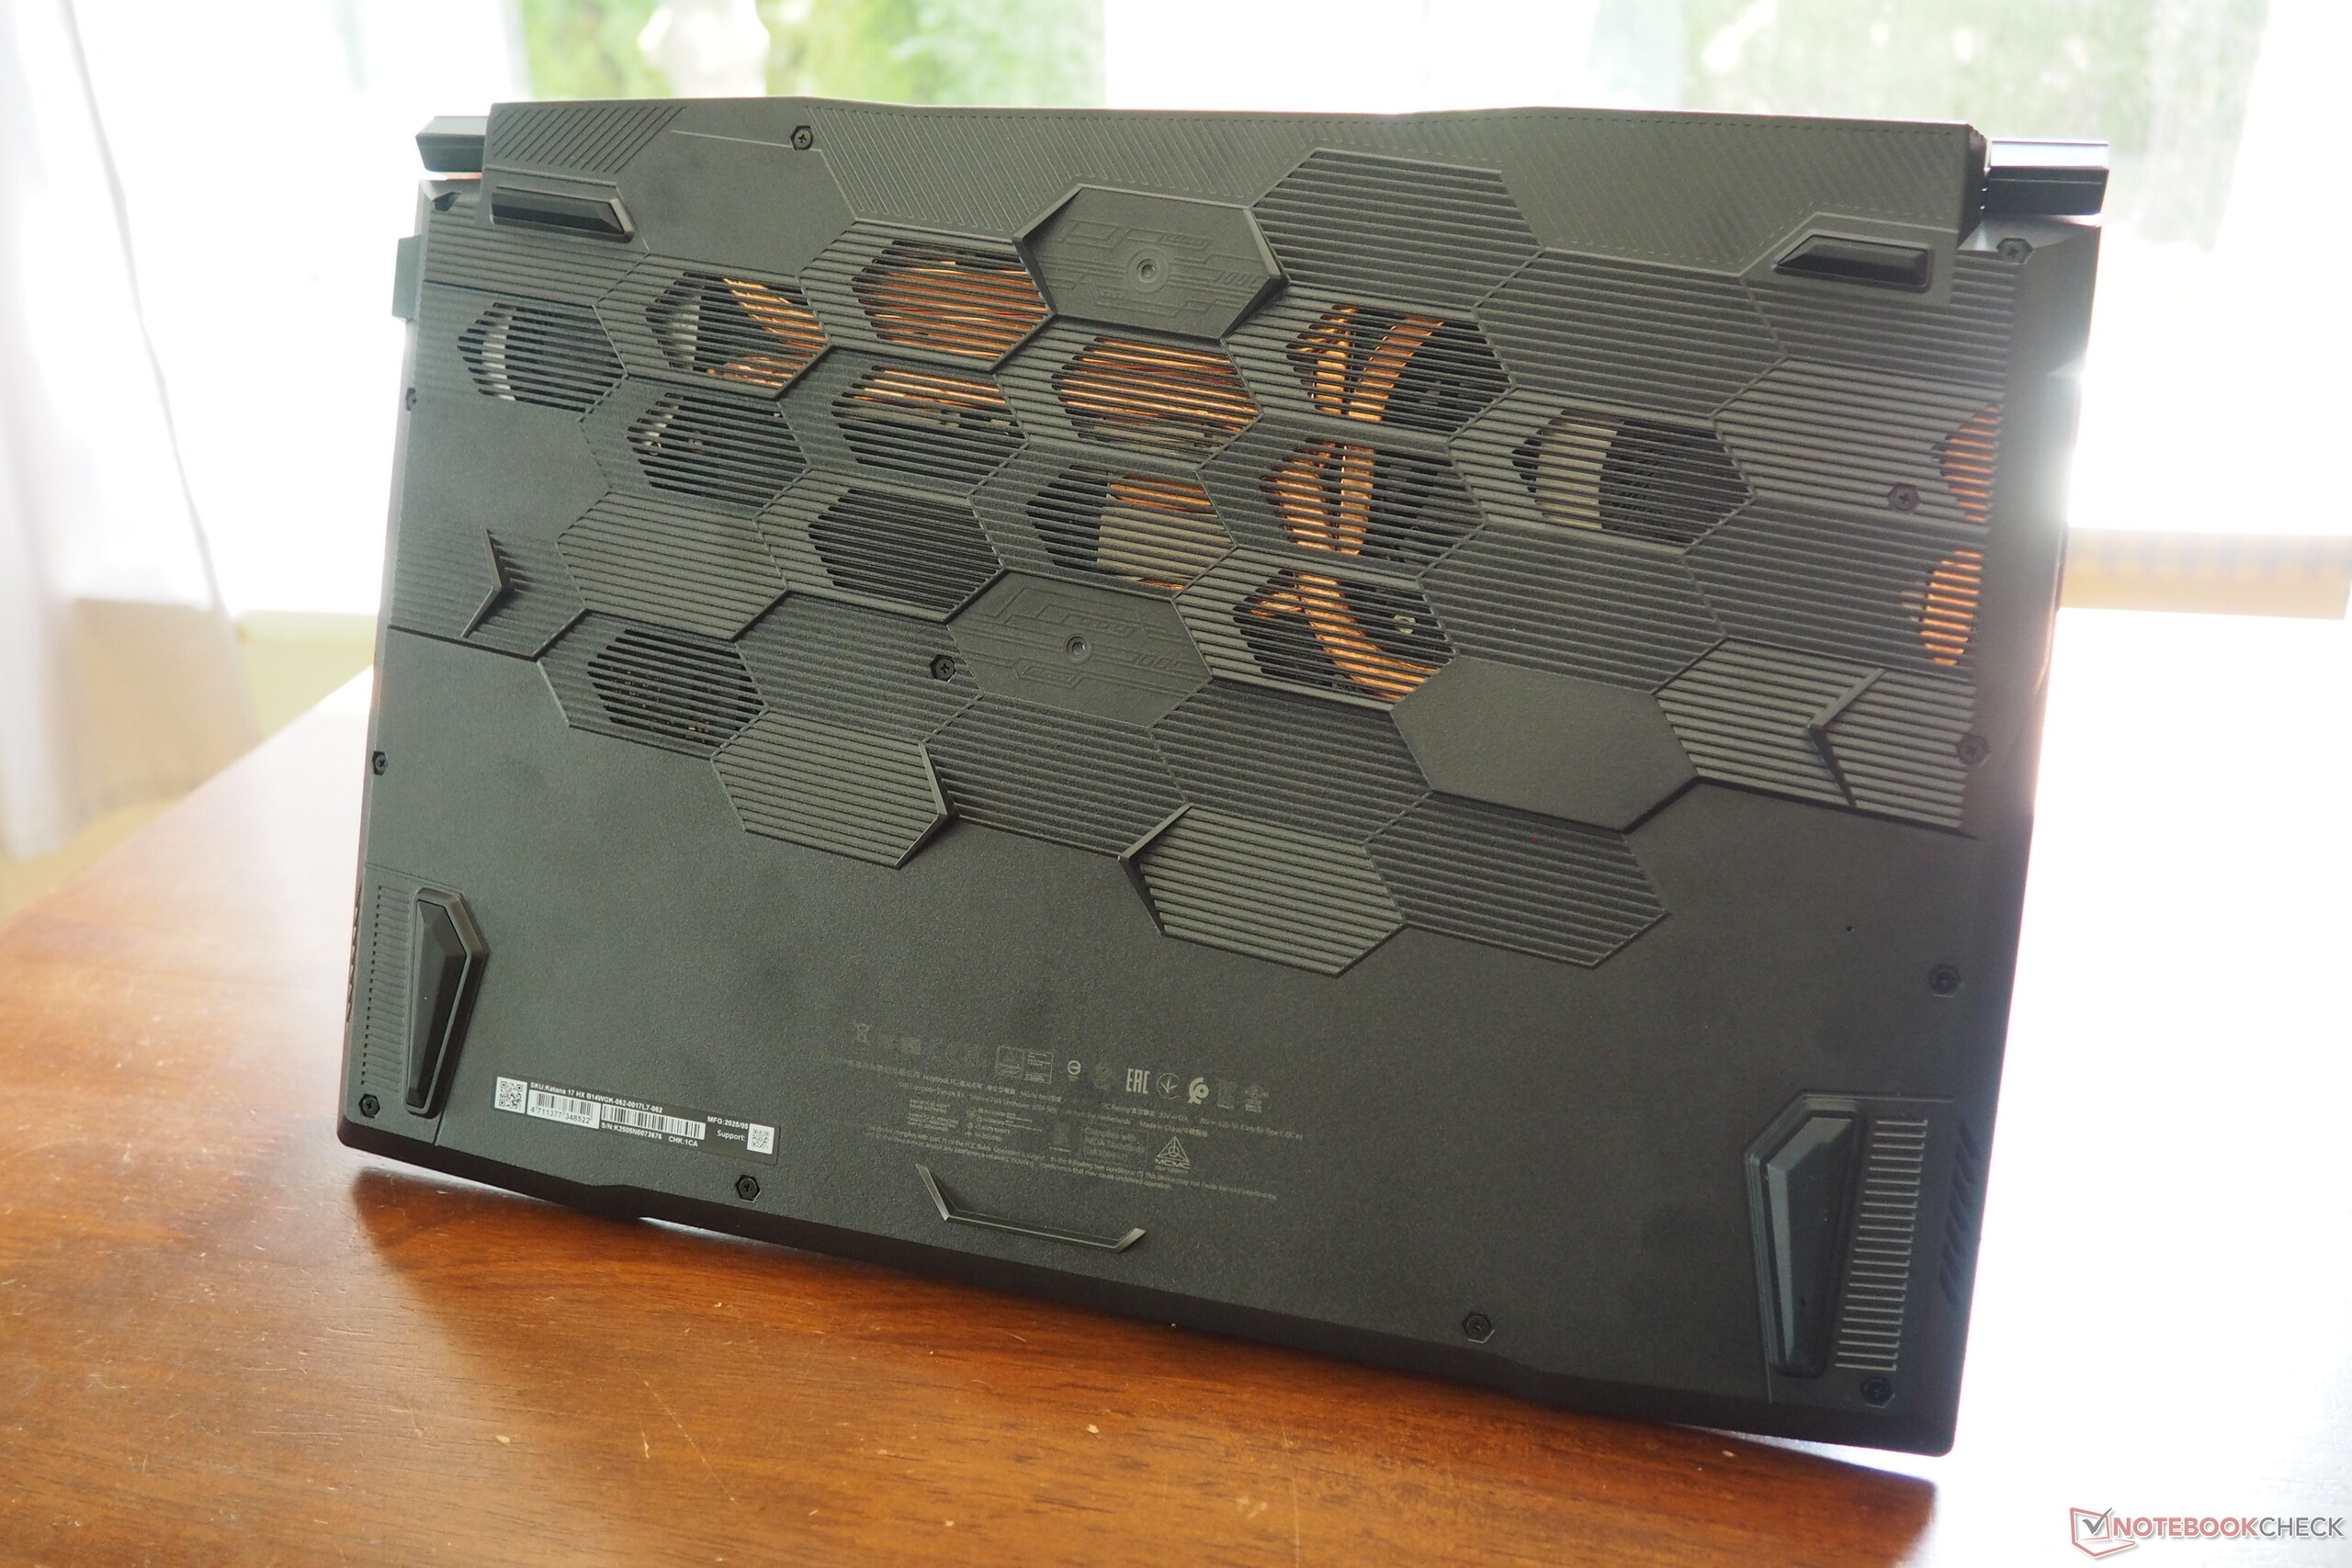
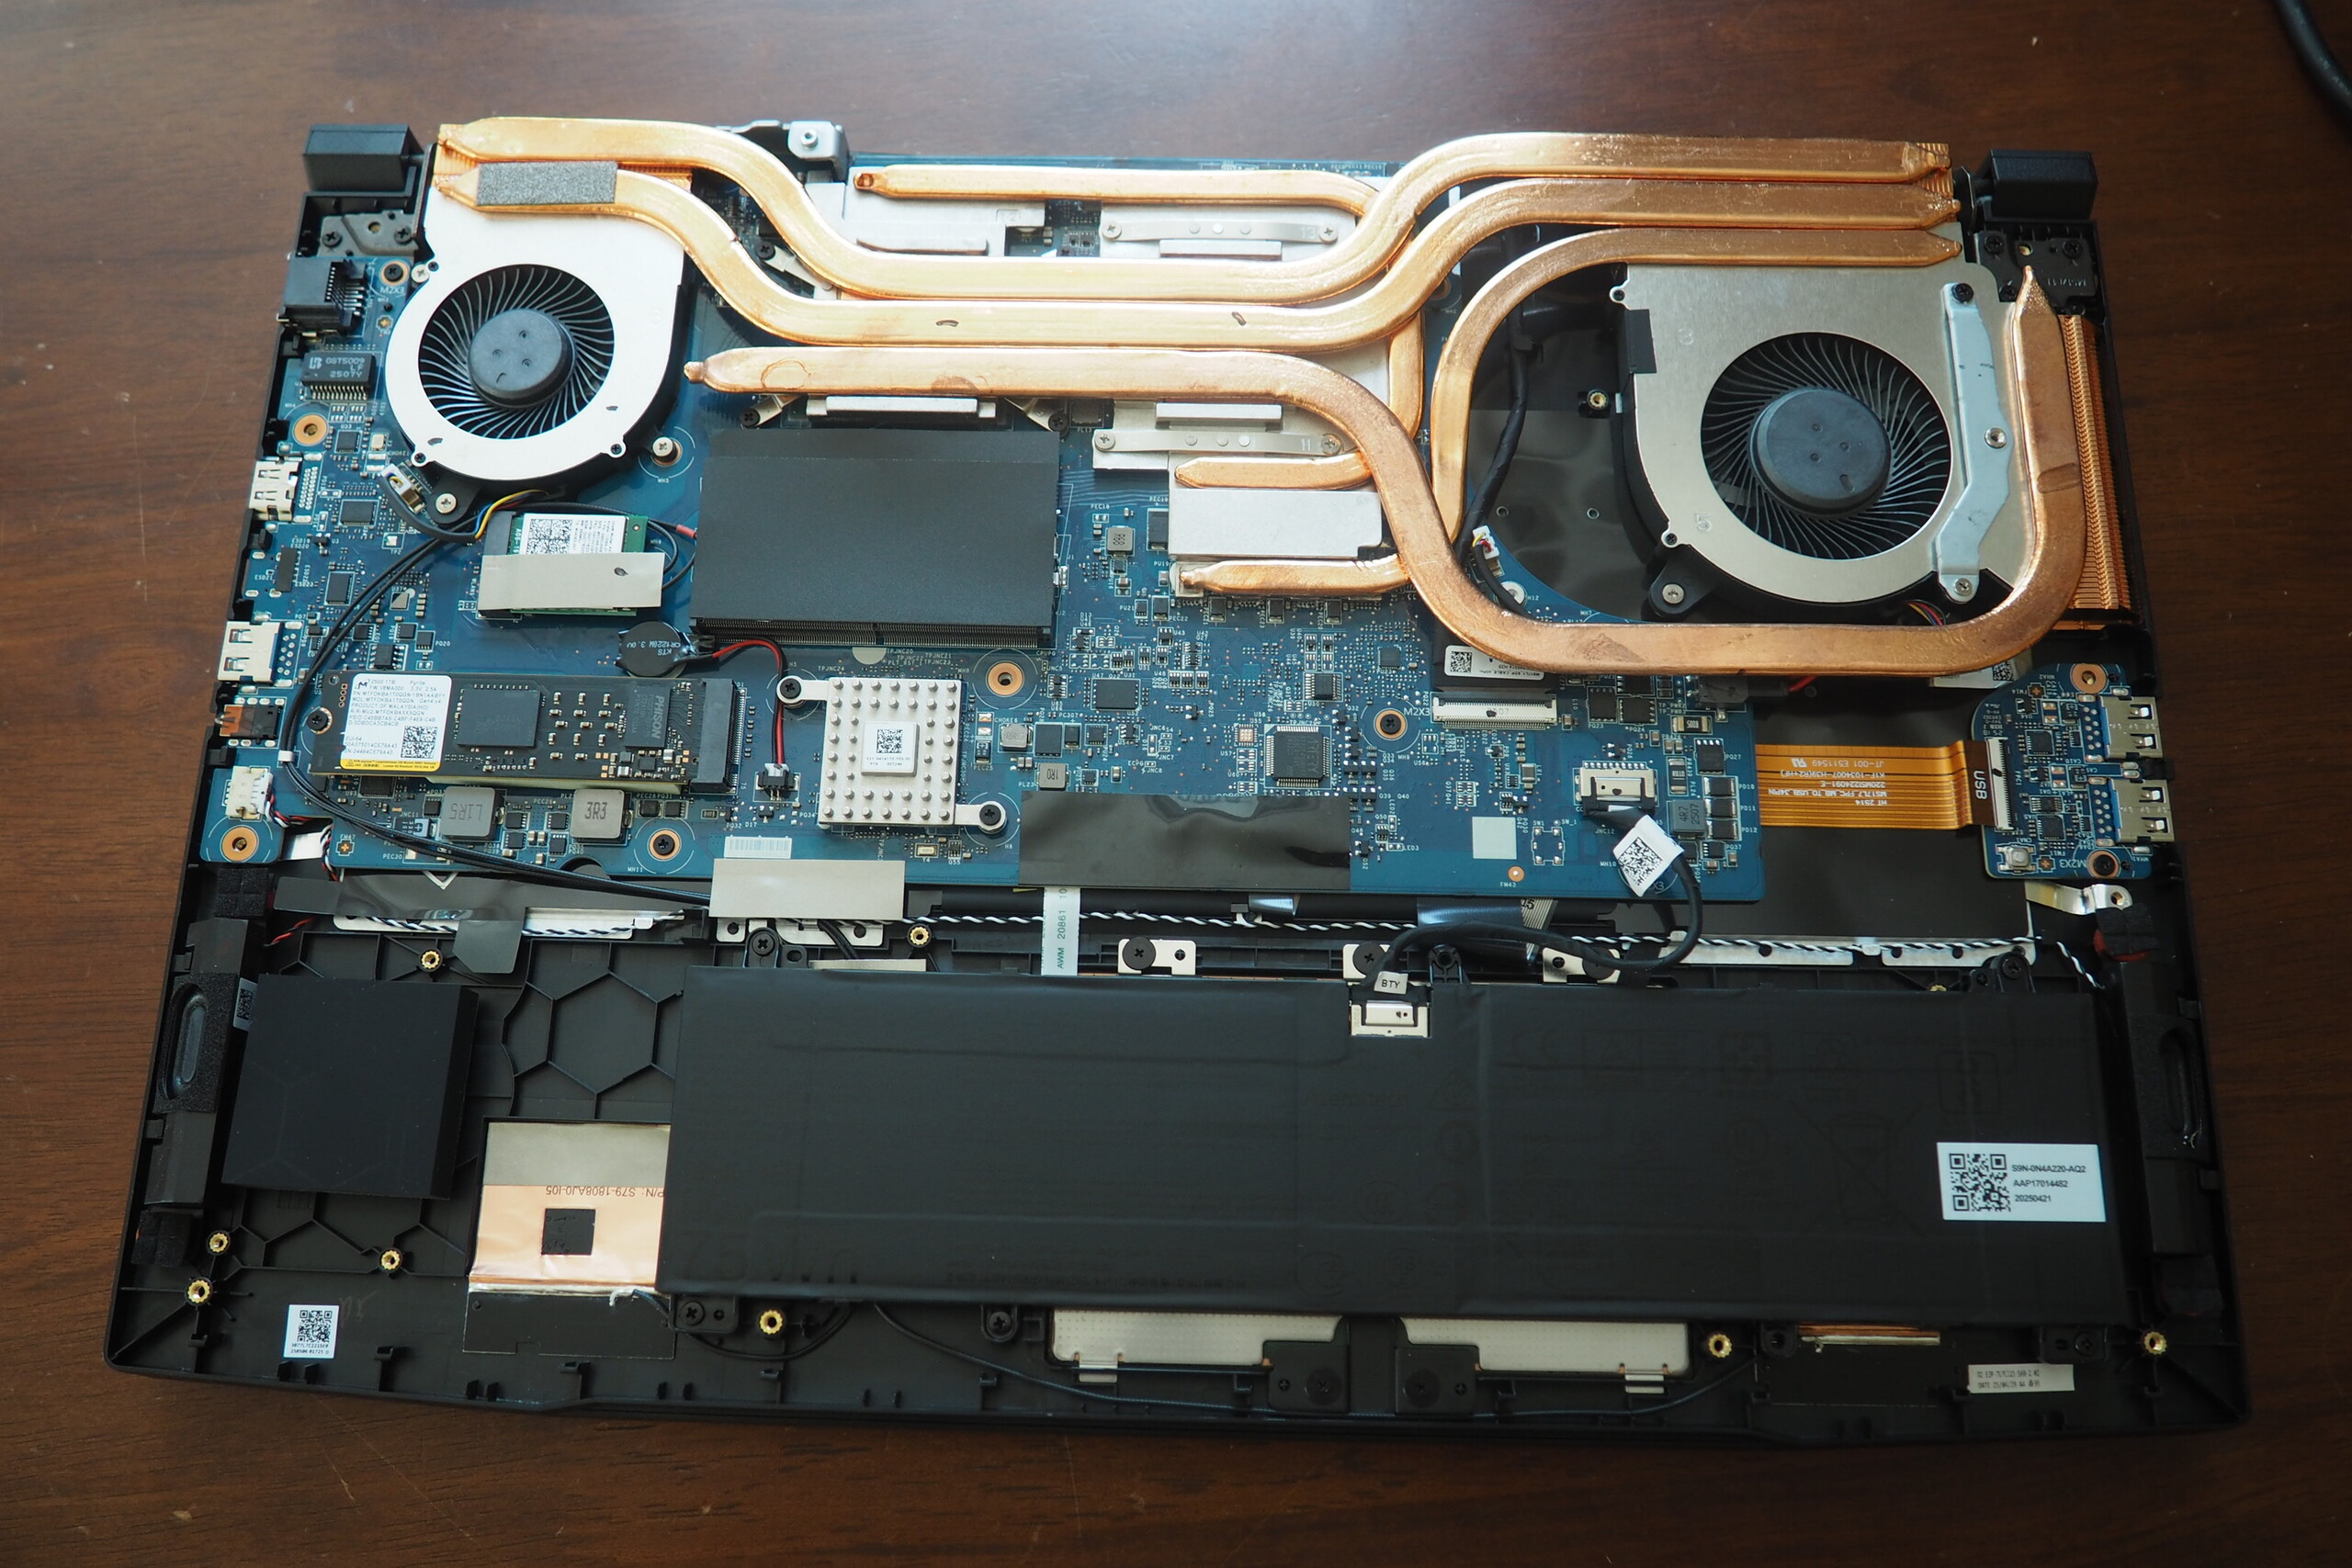
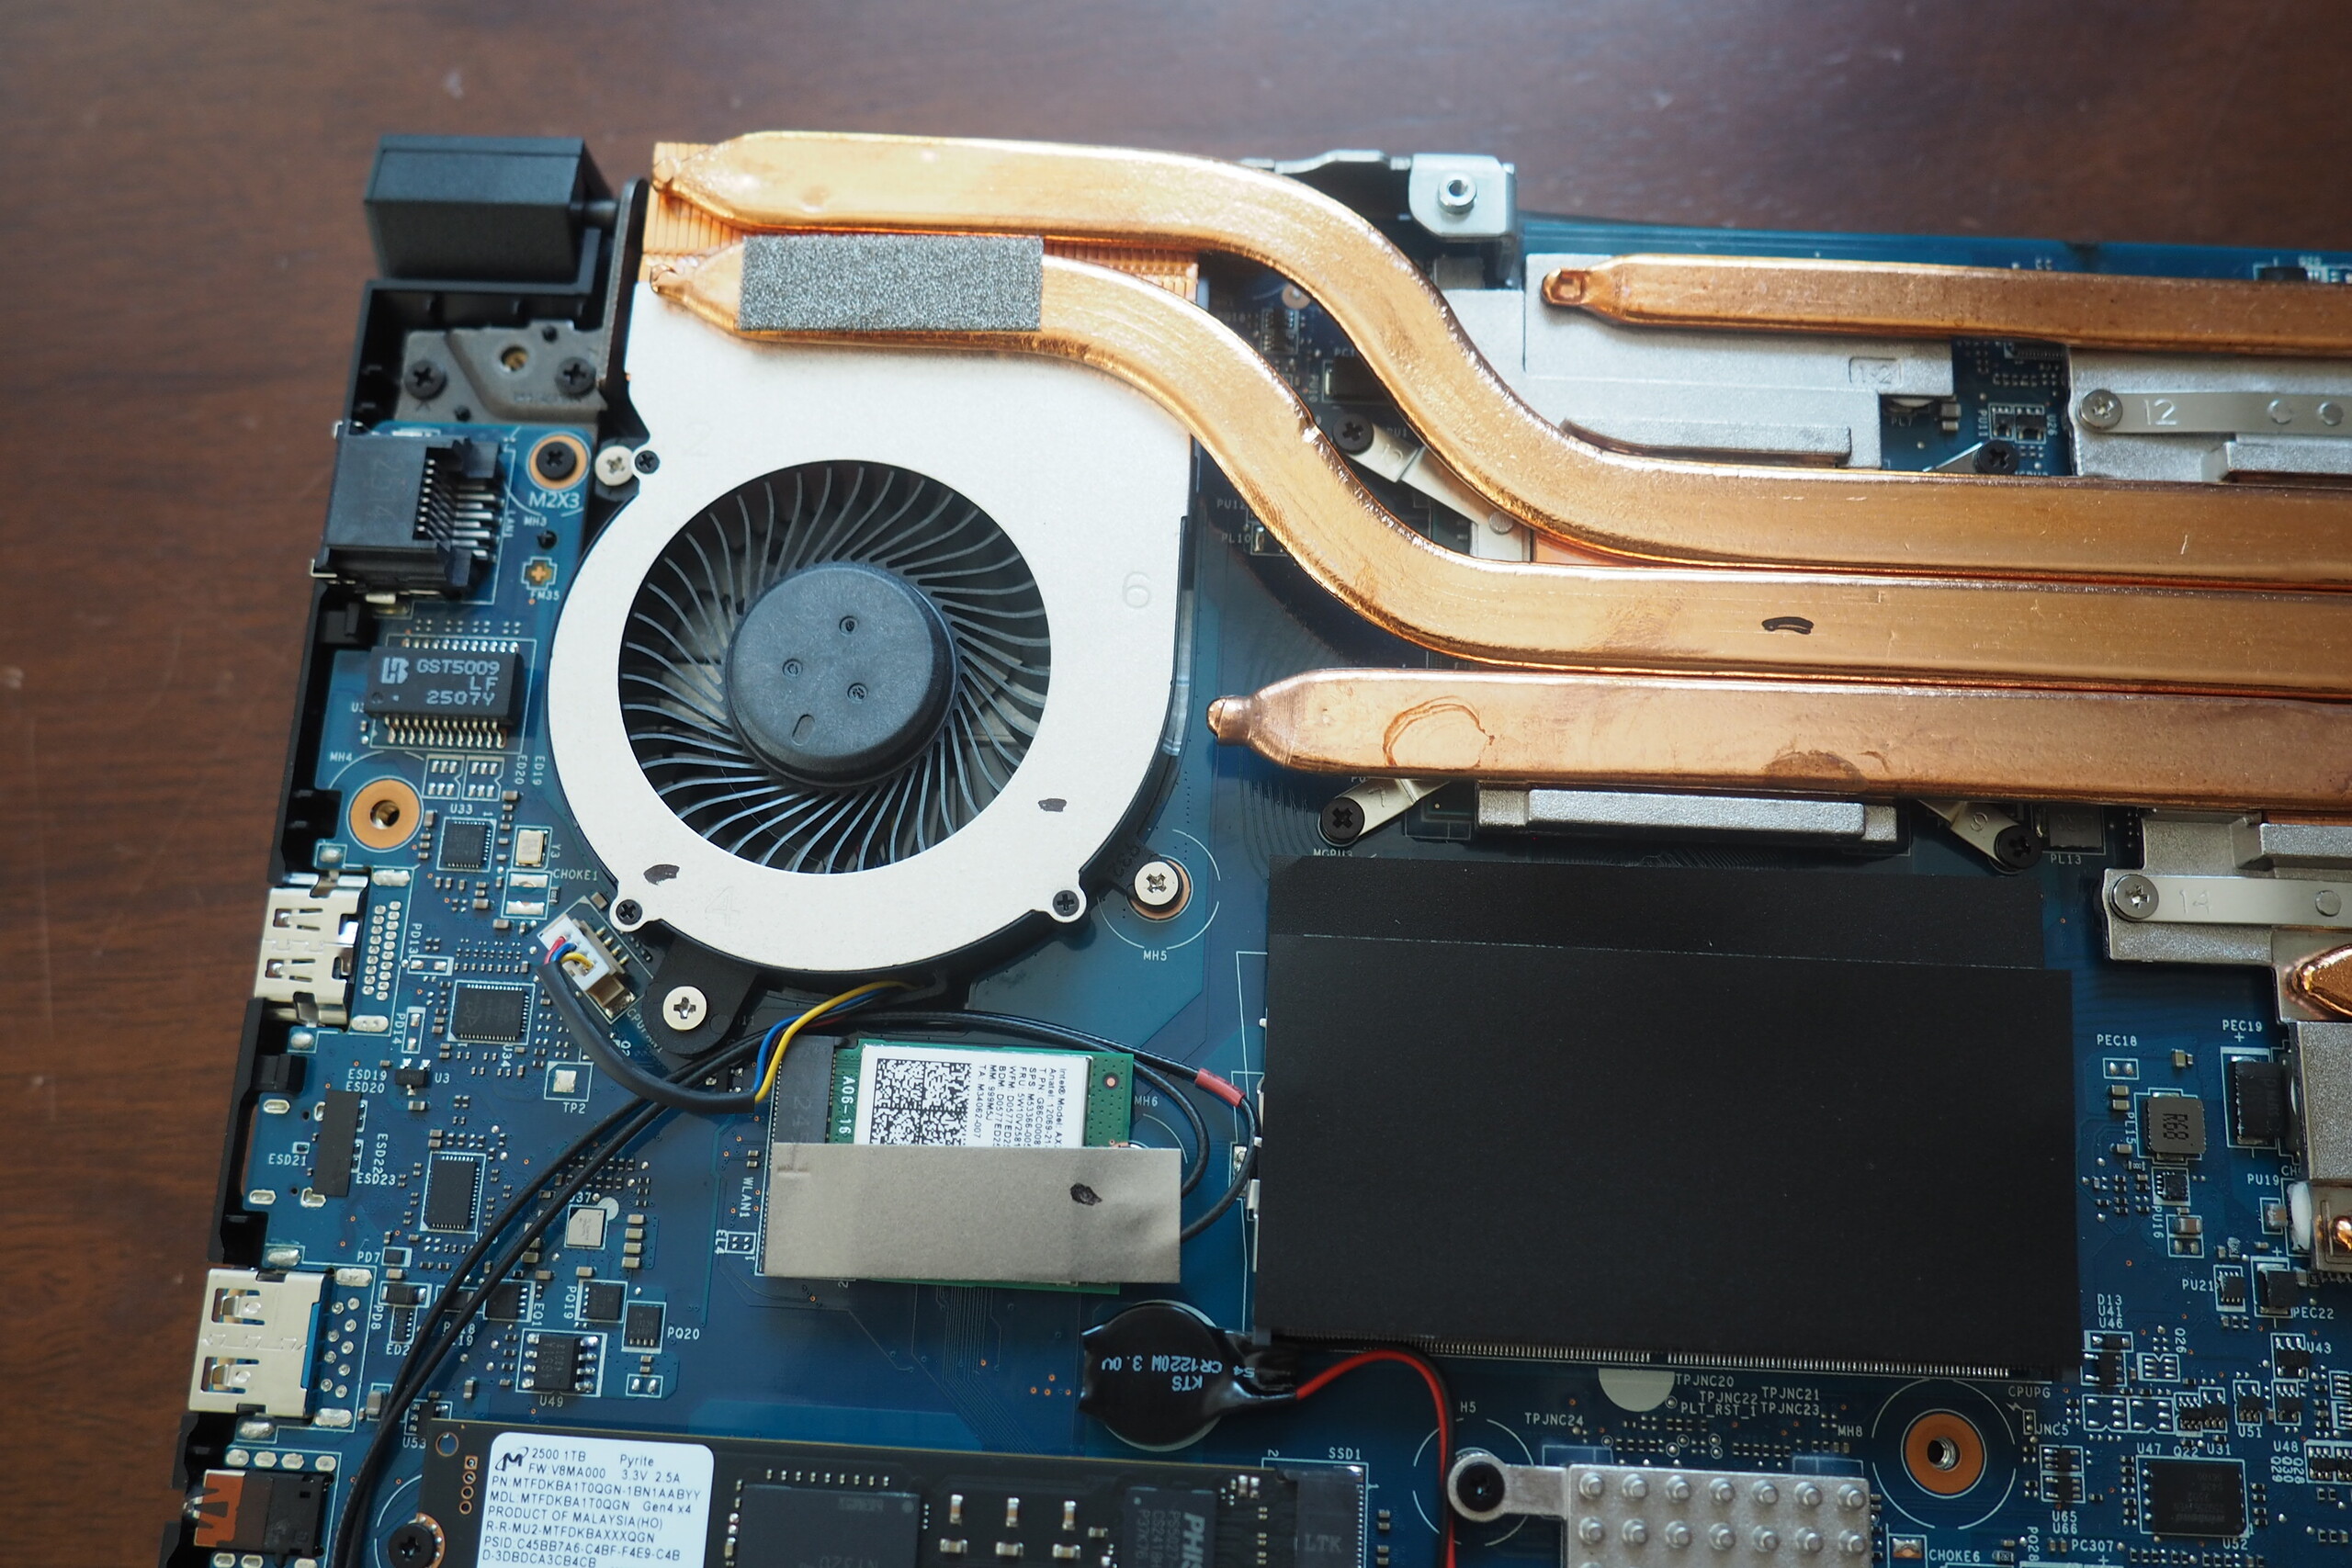
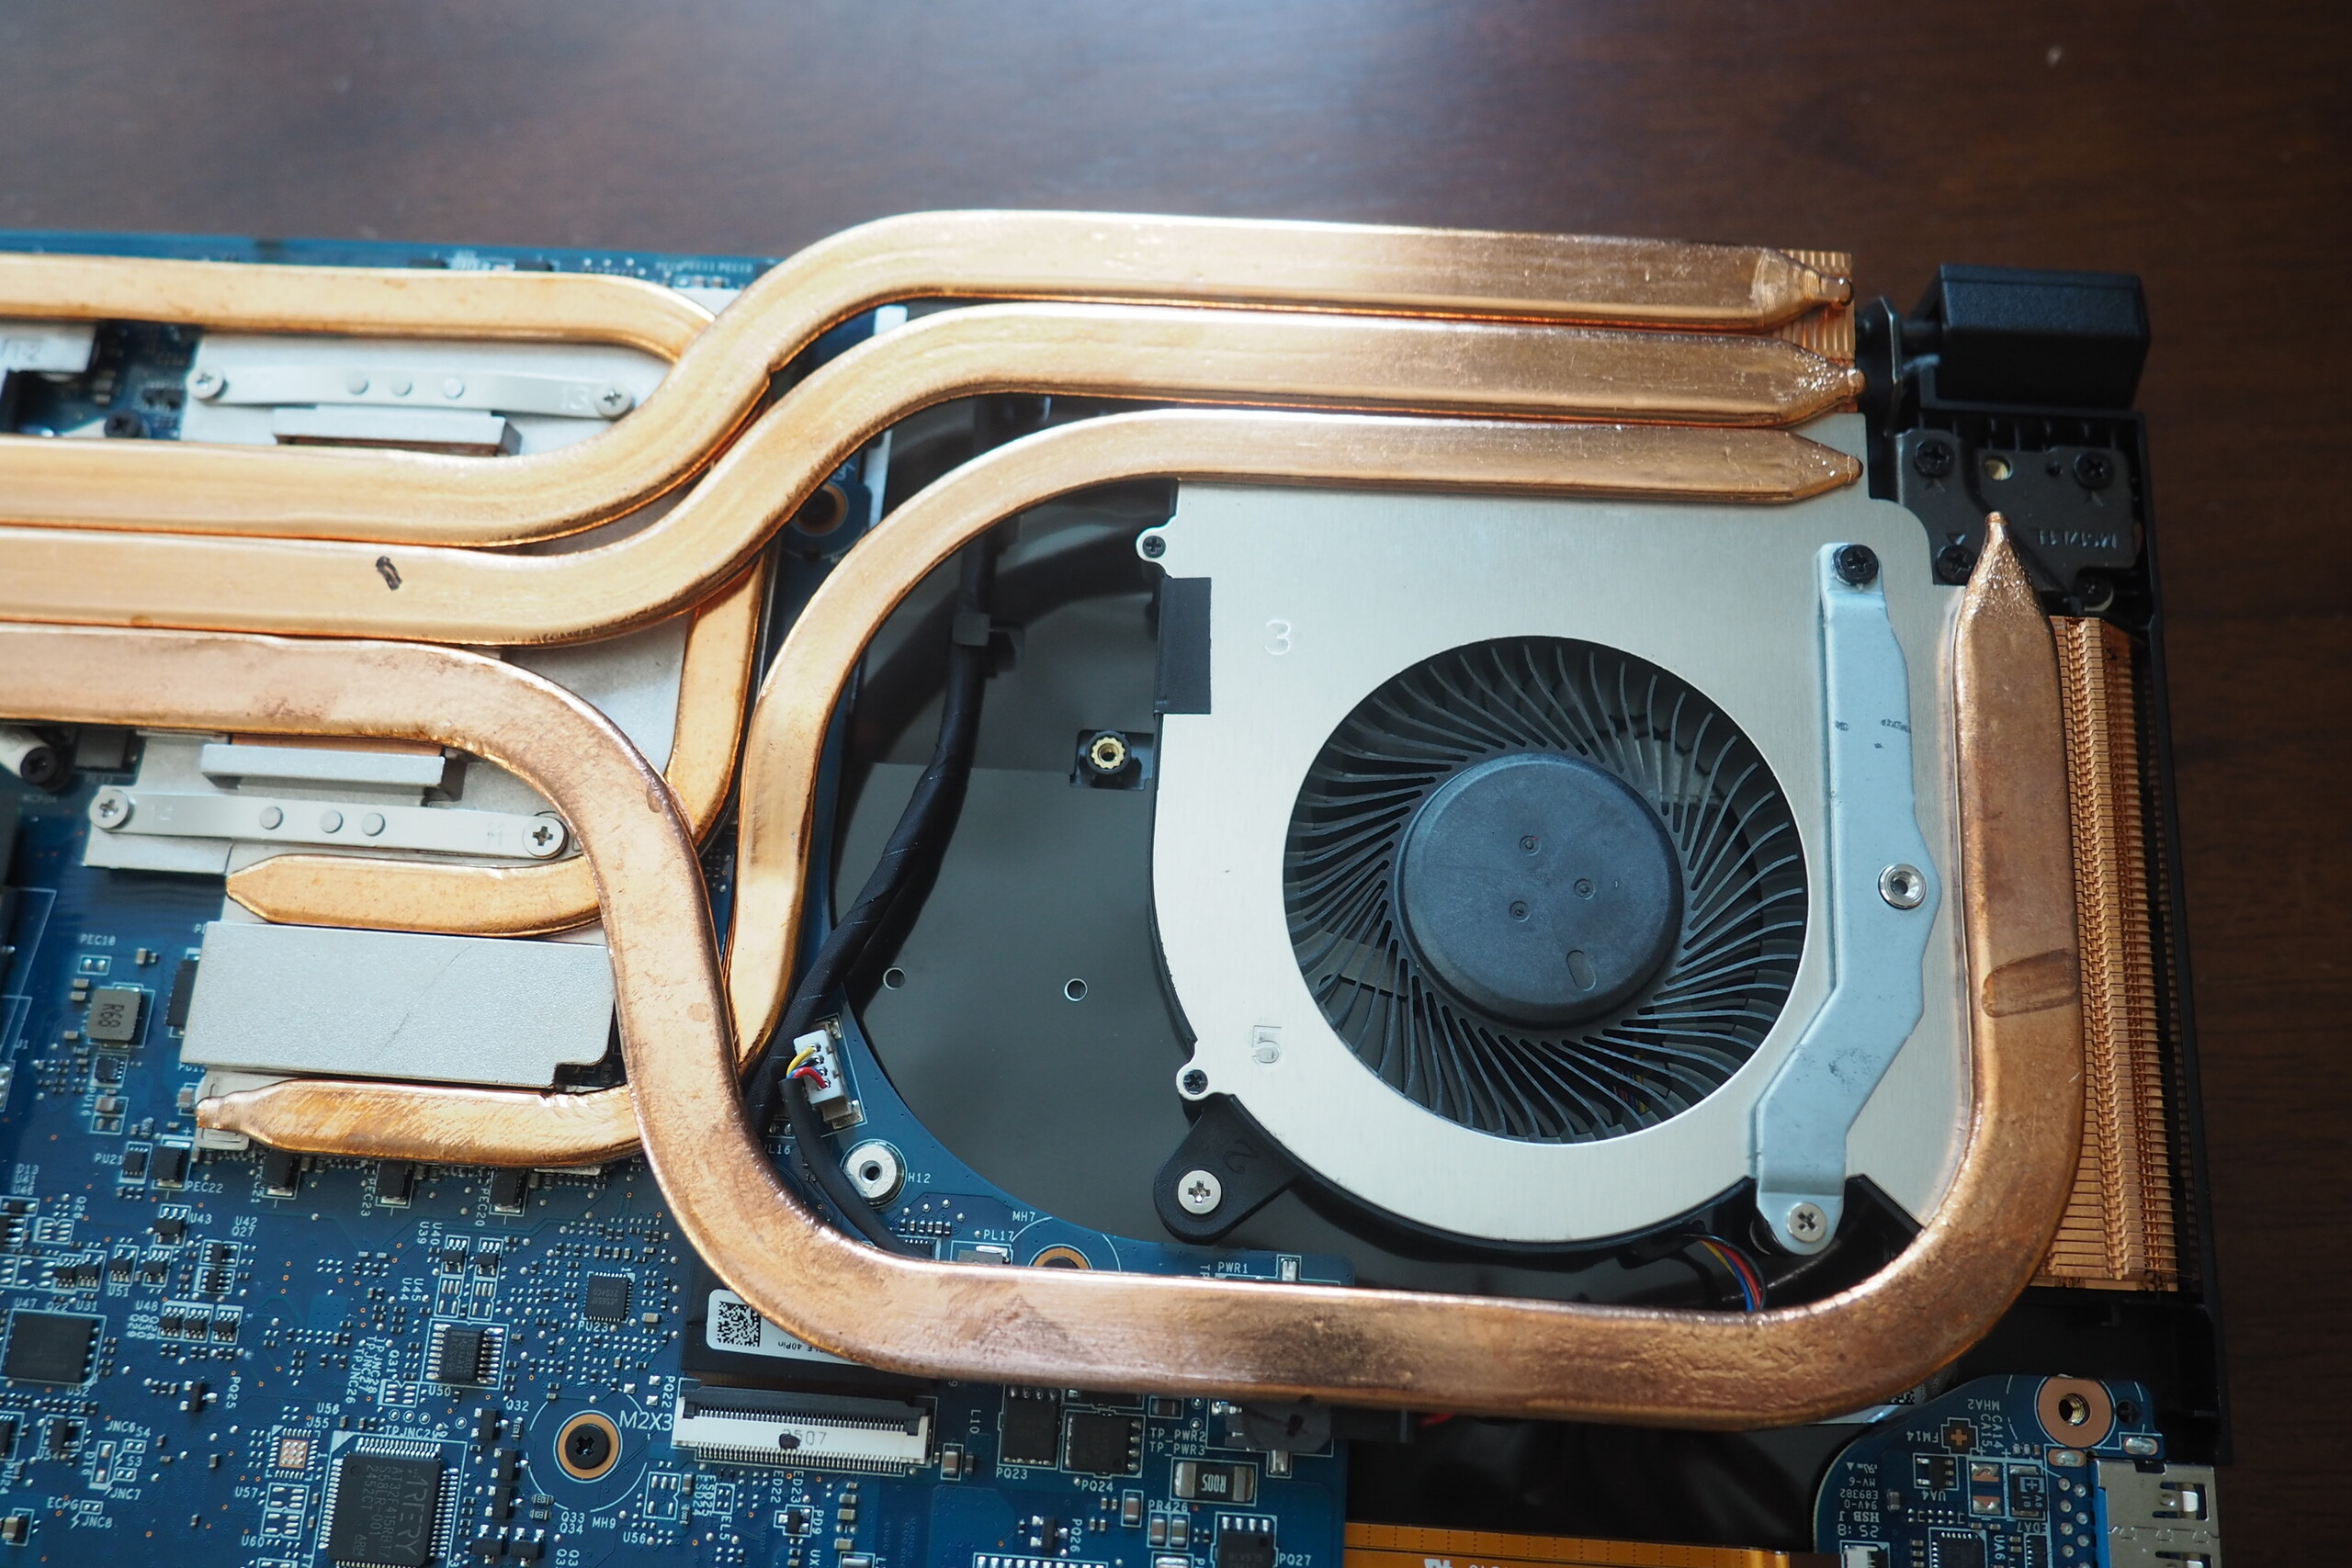
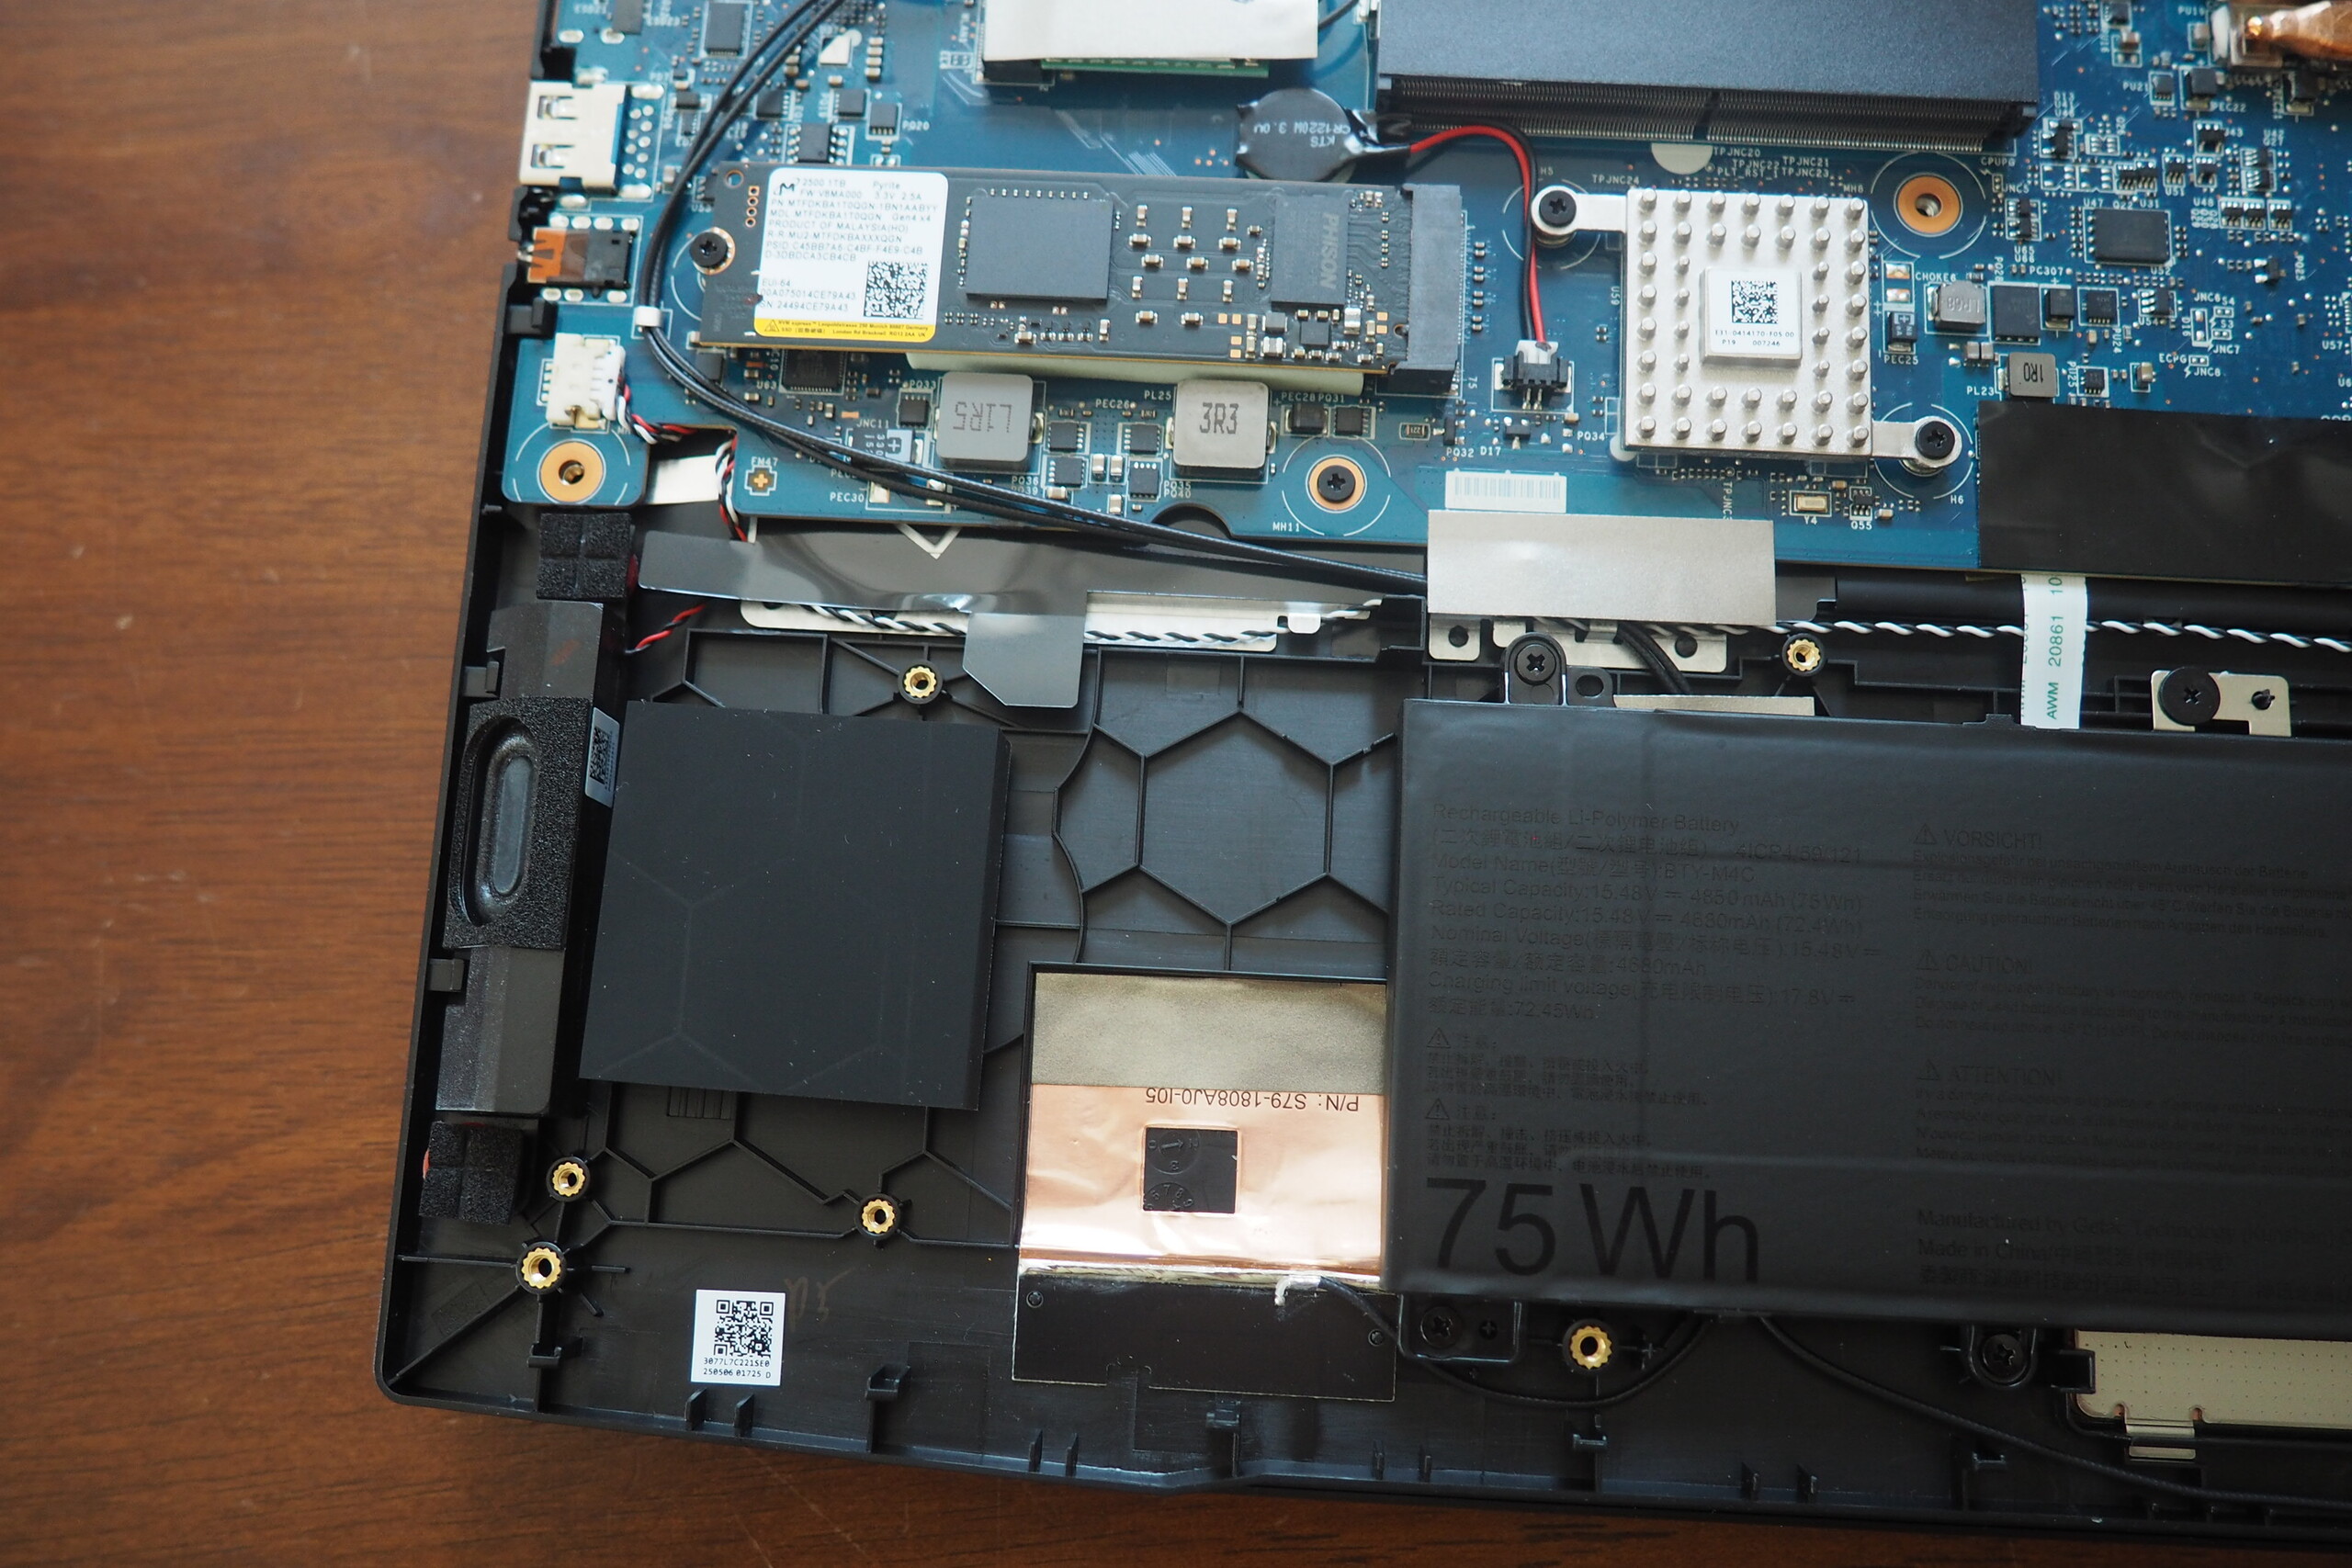
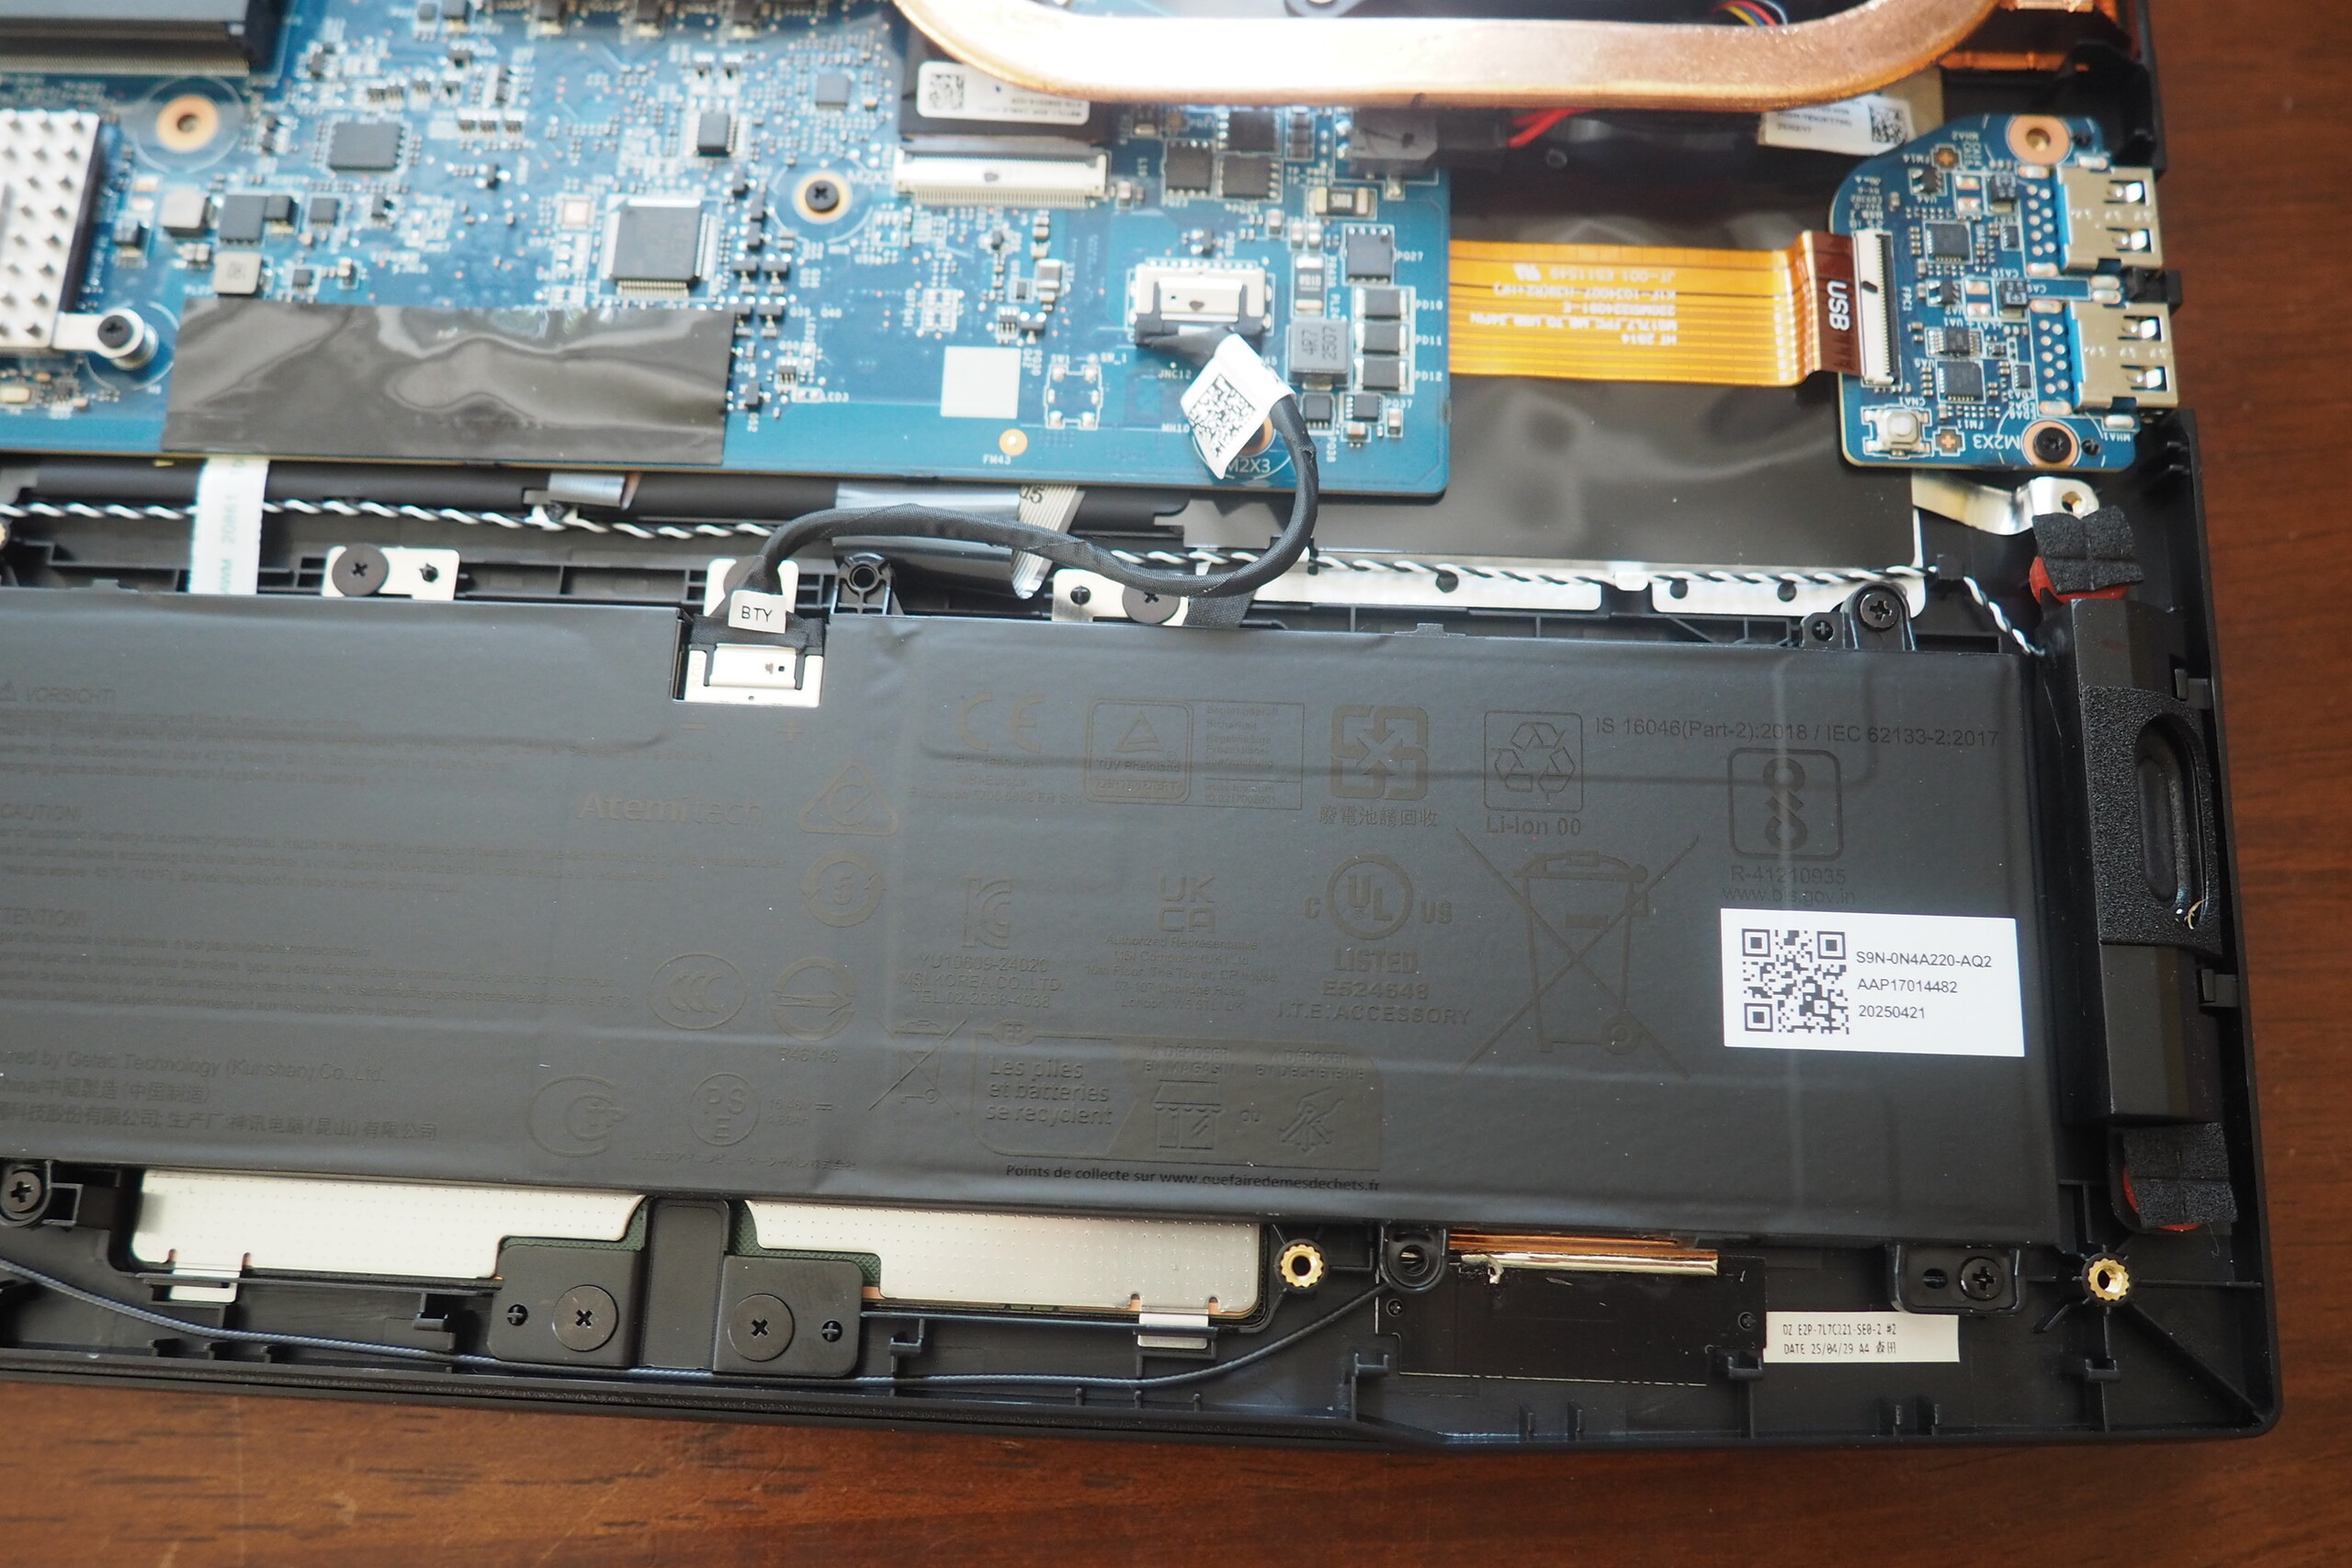
Manutenzione
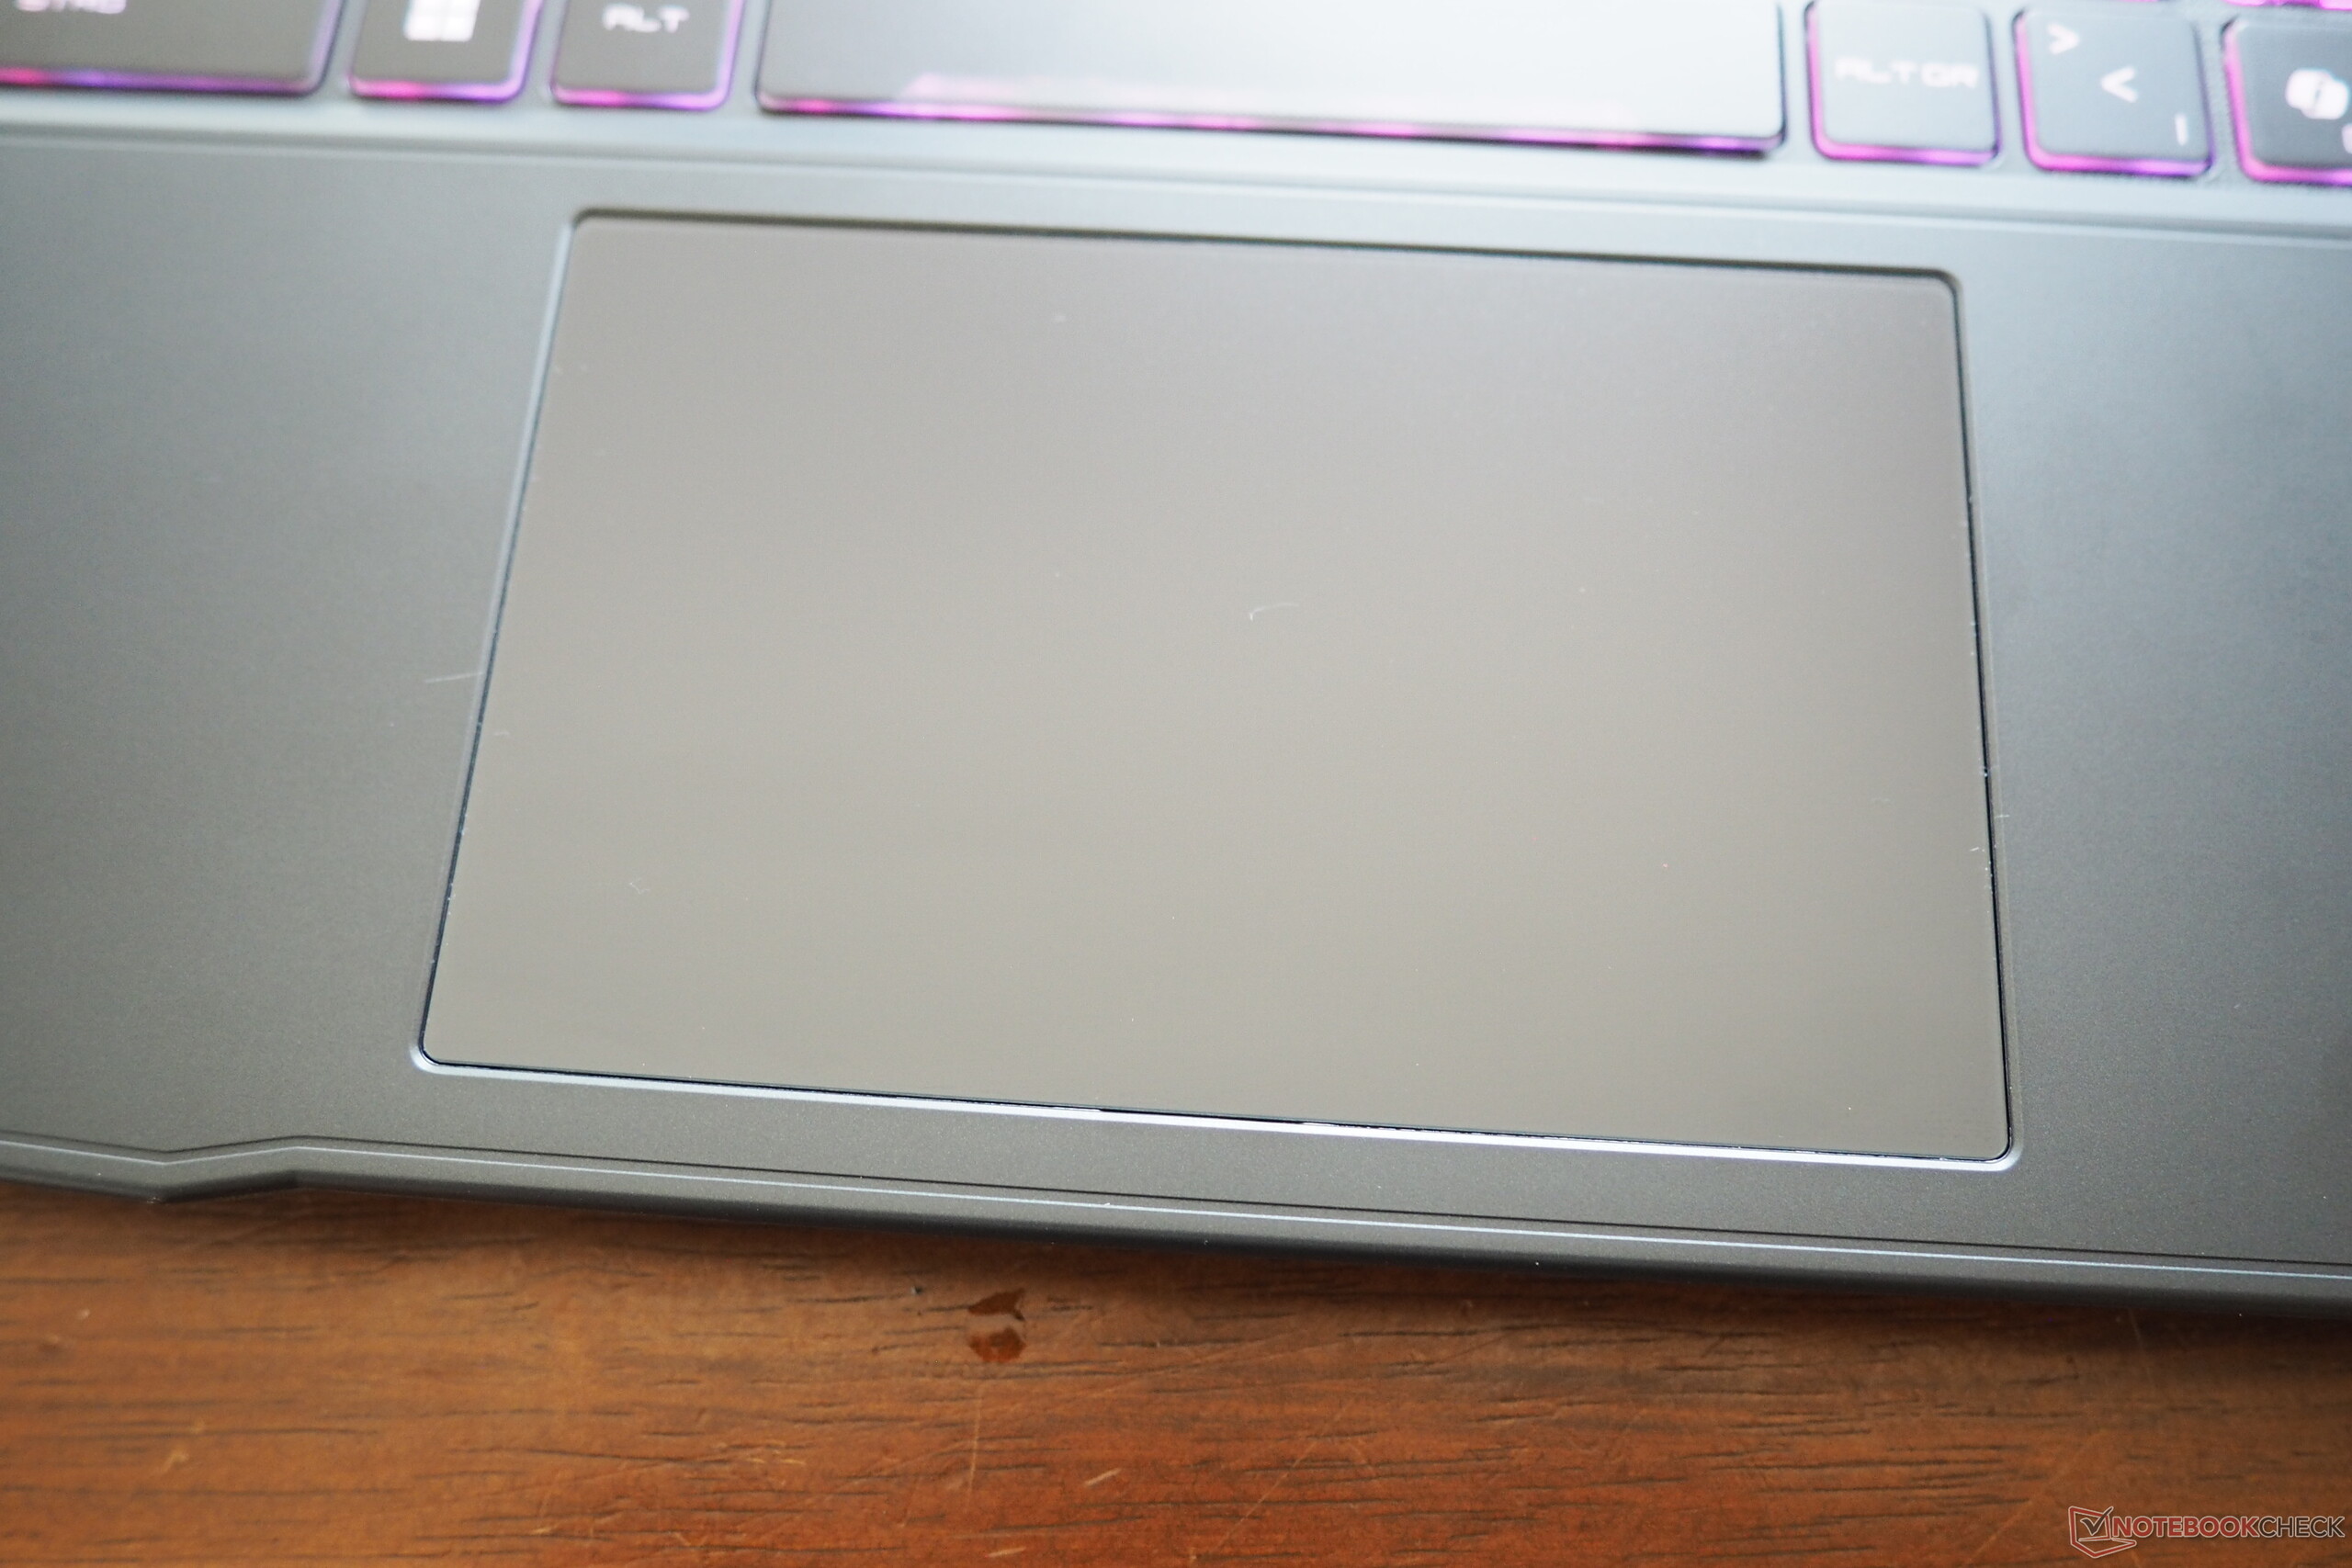
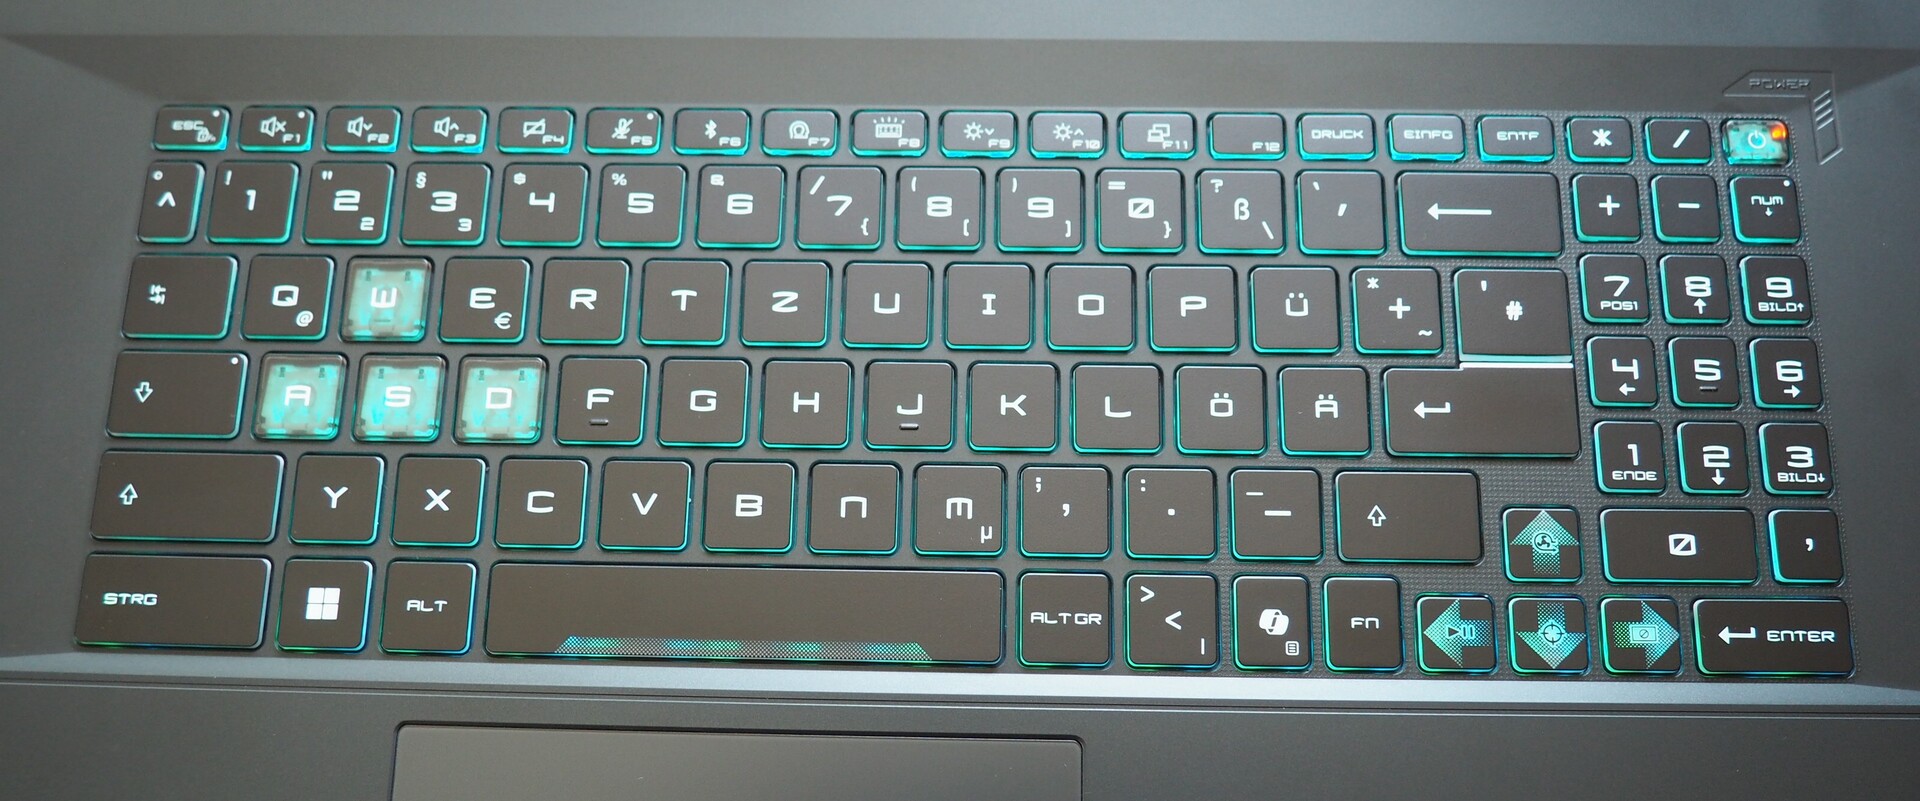
Dispositivi di ingresso
MSI continua a puntare sul suo layout di tastiera non convenzionale. Nonostante lo spazio disponibile, il tastierino numerico ha solo tre colonne invece di quattro. D'altra parte, i giocatori possono contare su un'illuminazione RGB regolabile. La sensazione di digitazione è decente, ma non genera entusiasmo. Il mouse sostitutivo misura ragionevolmente 12 x 7,5 cm e potrebbe essere ancora più stabile per i nostri gusti (soprattutto quando si fa clic). Le caratteristiche di scorrimento e la precisione sono accettabili.
Display
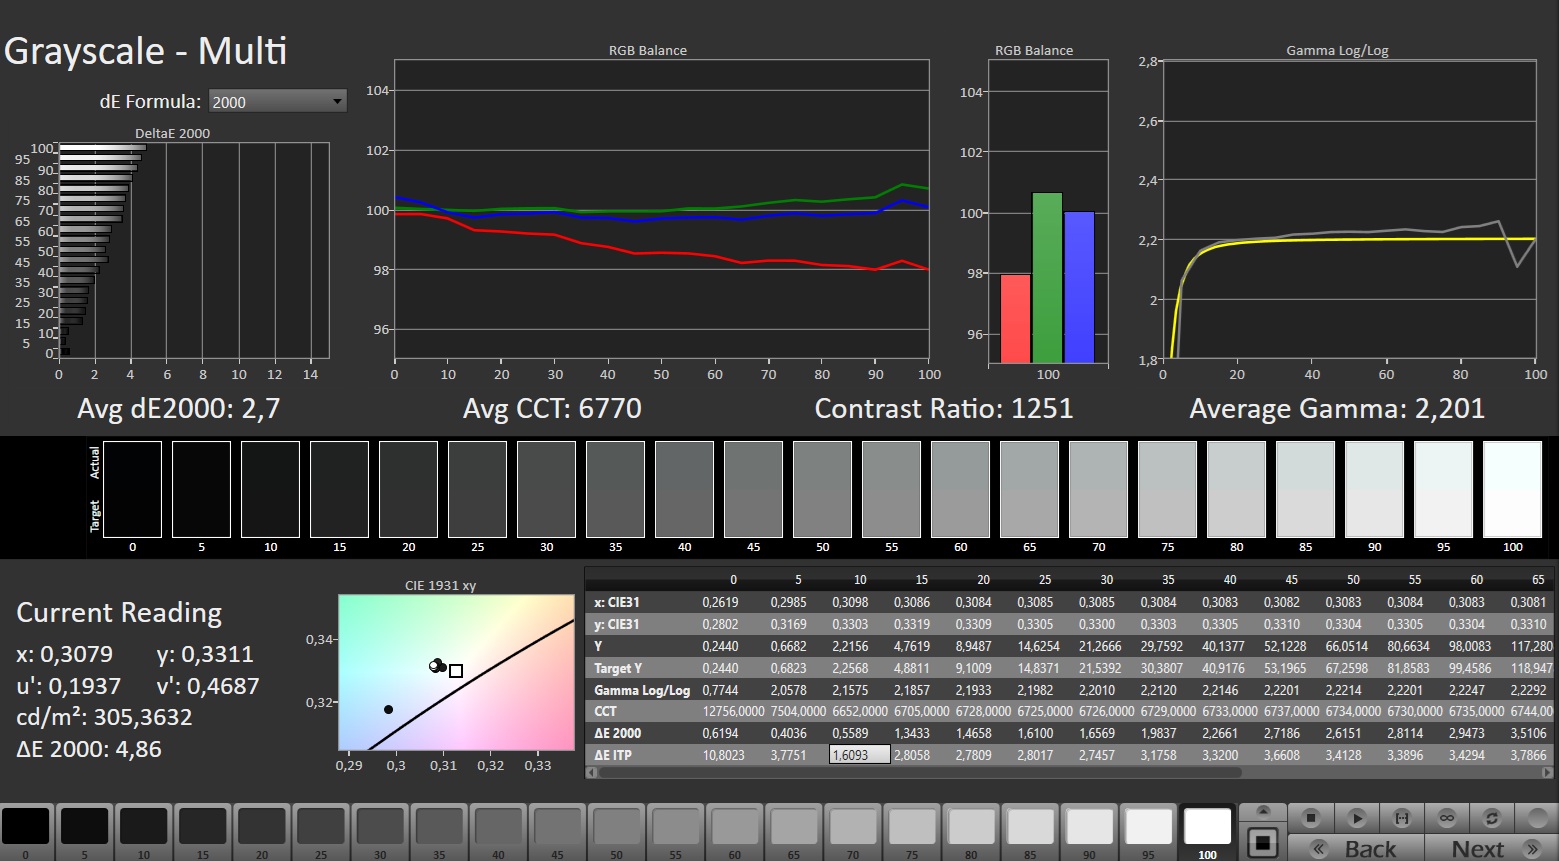
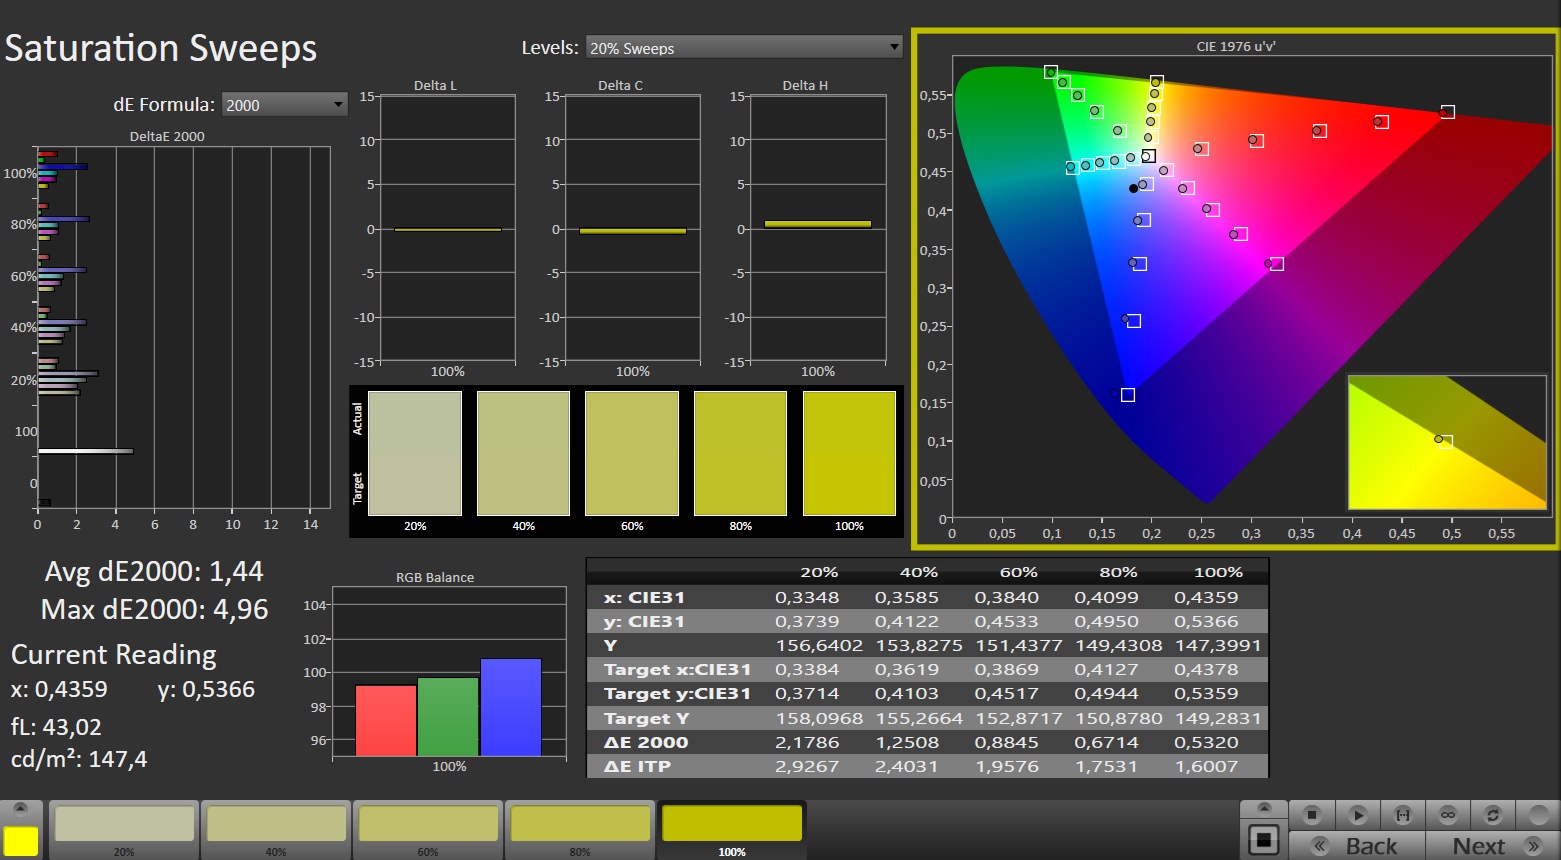
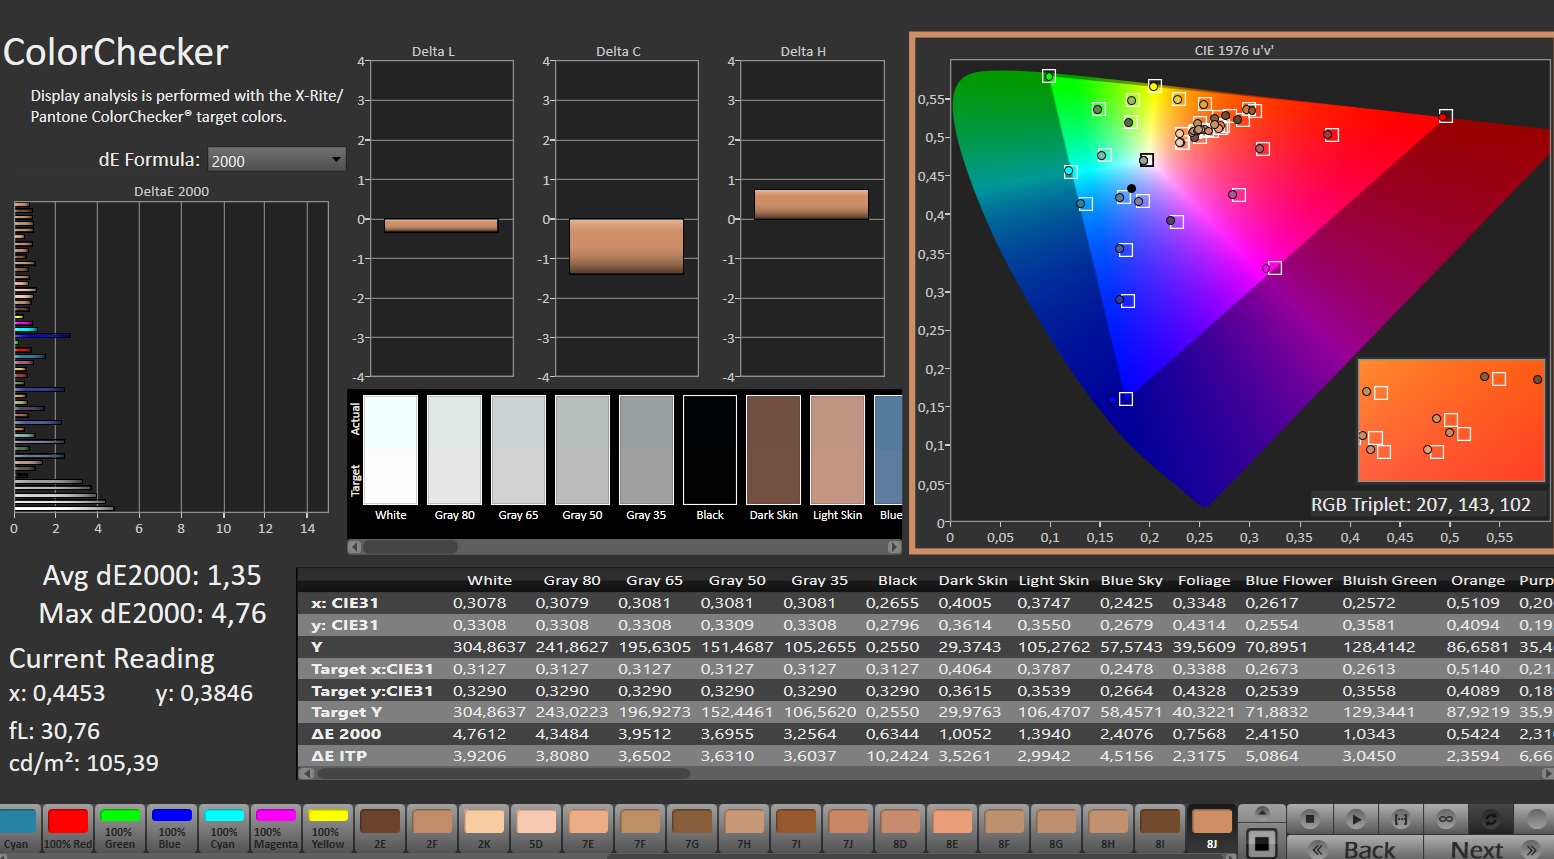
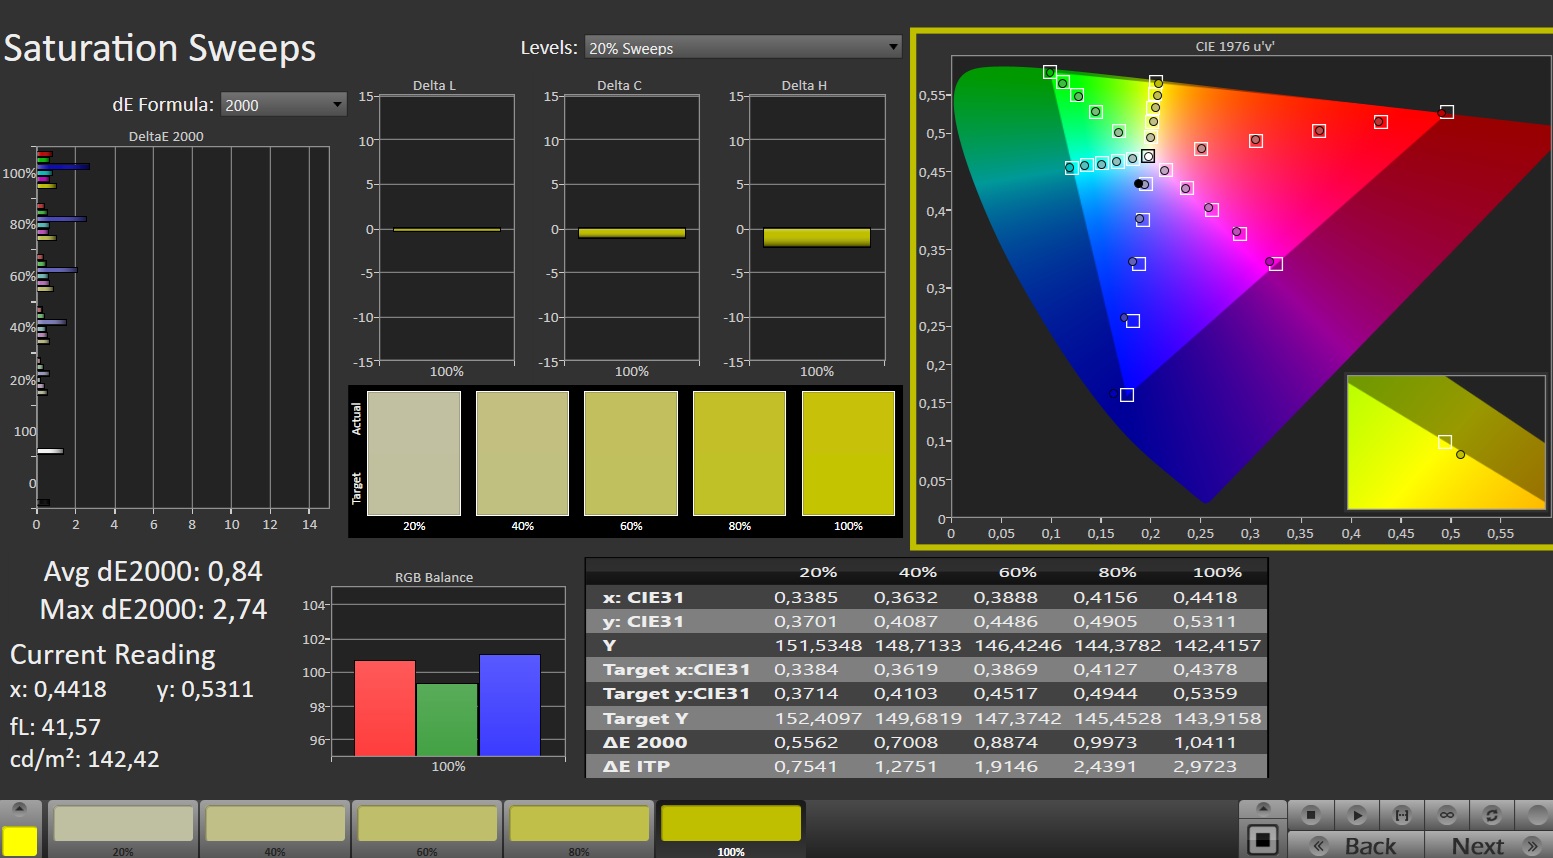
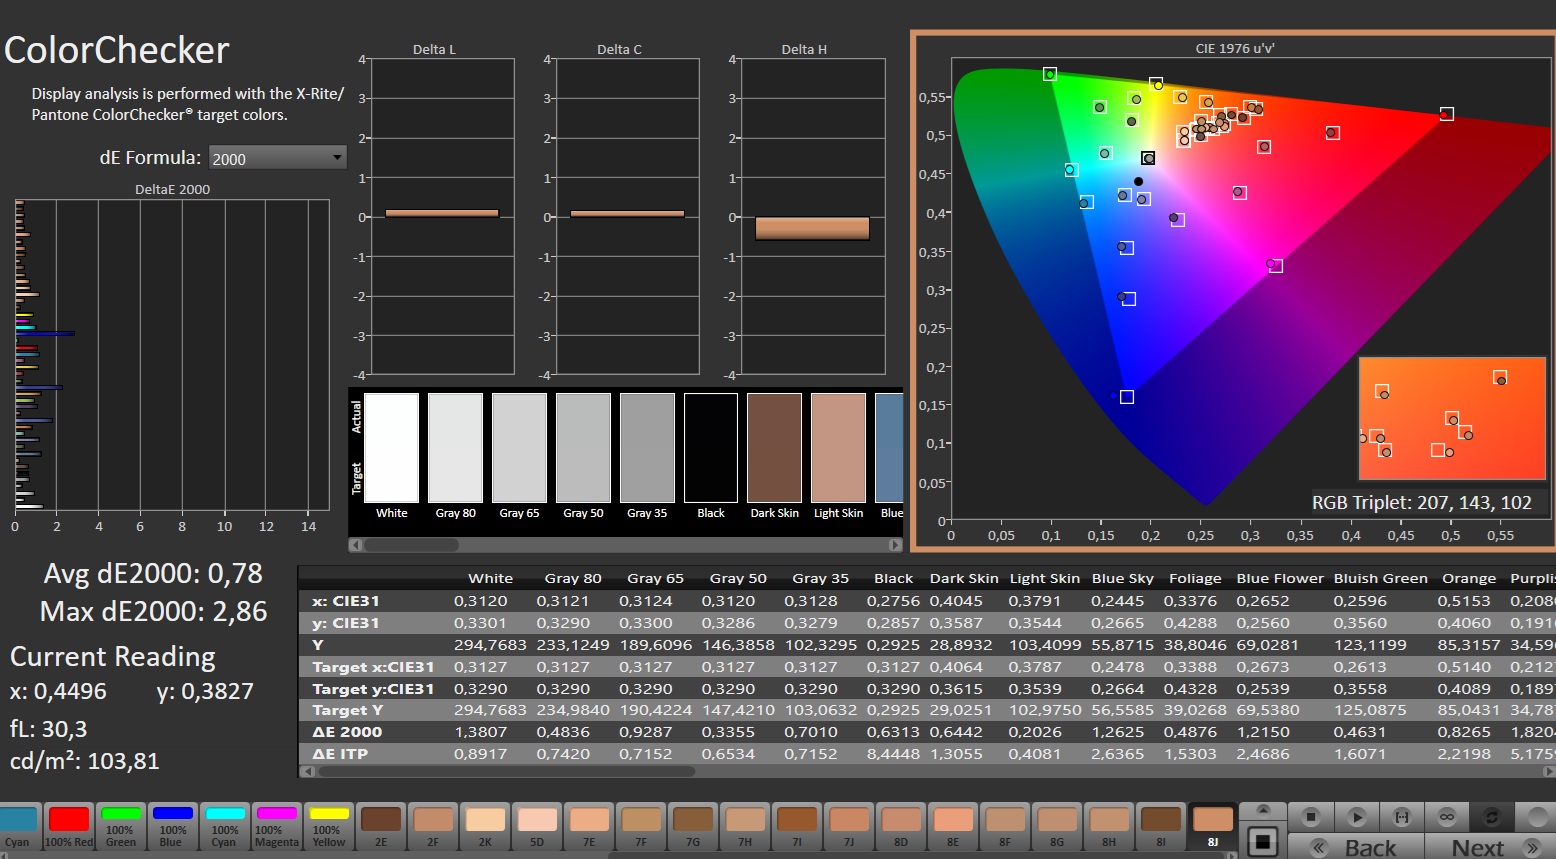
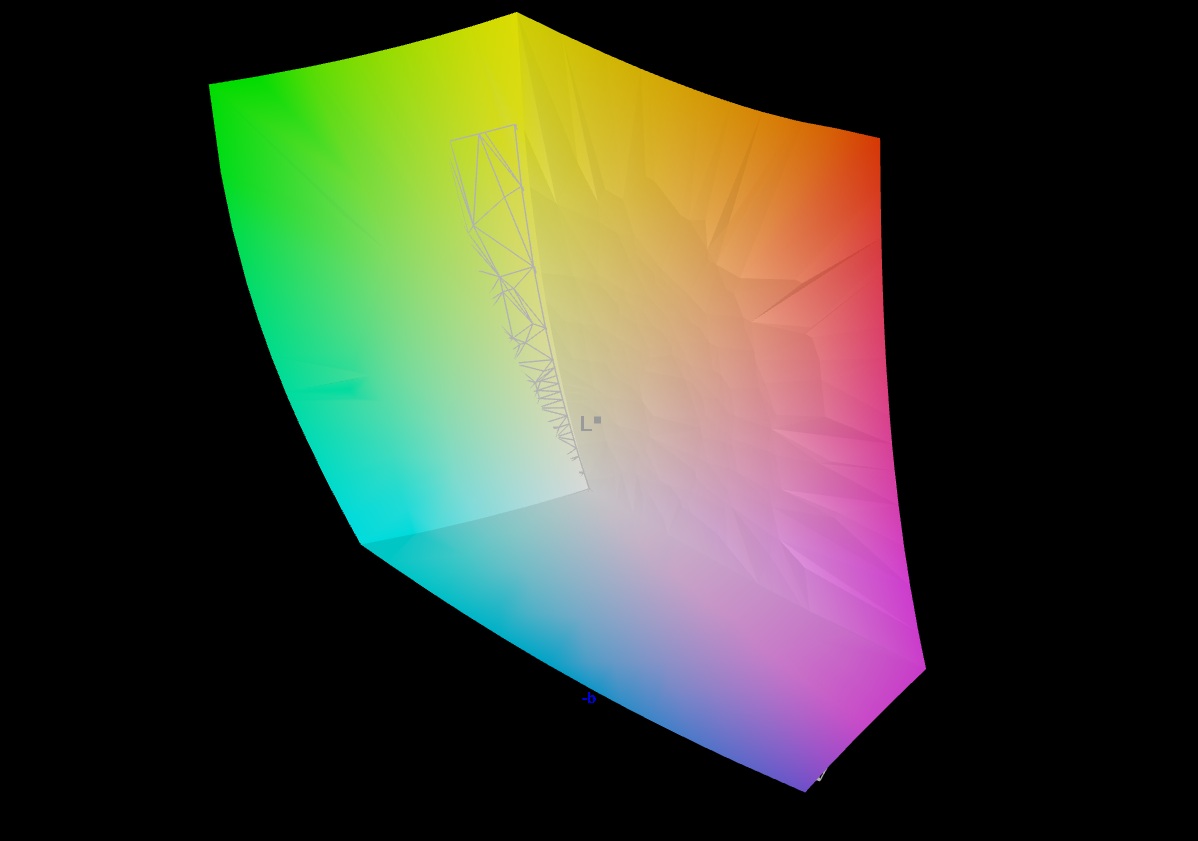
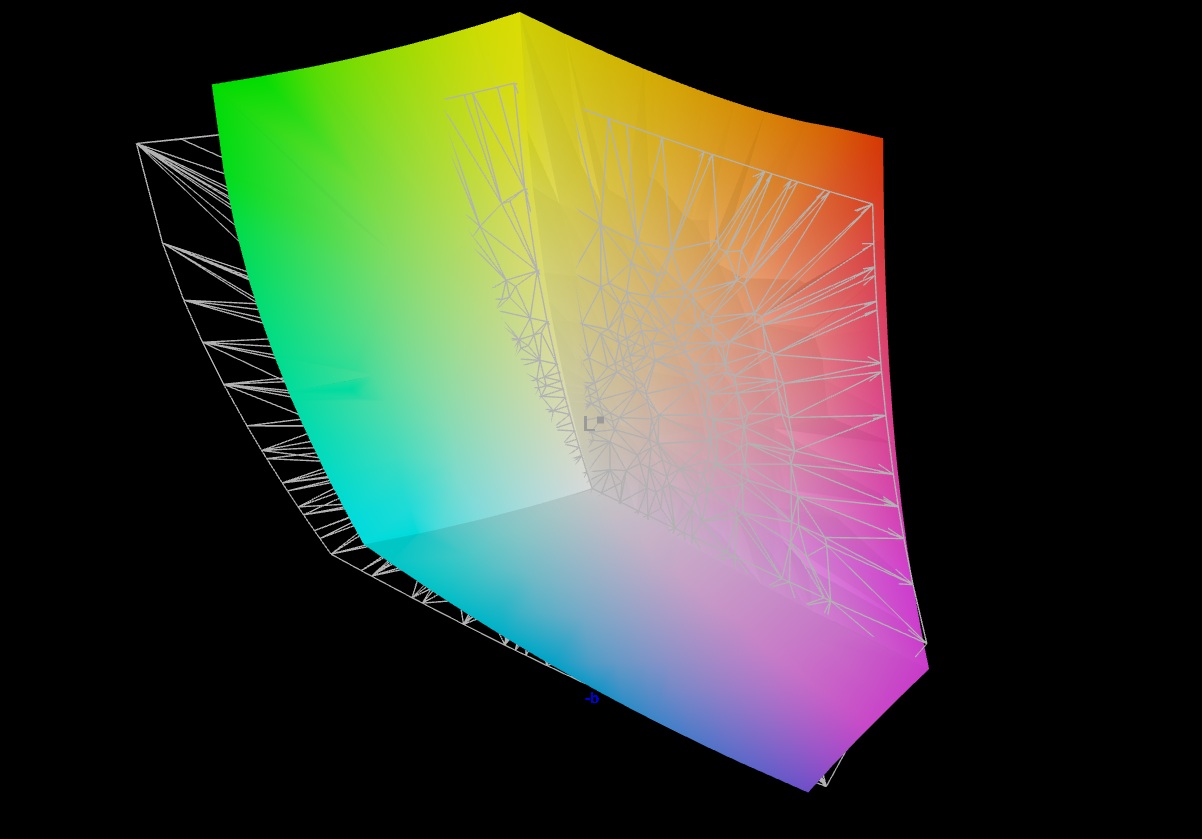
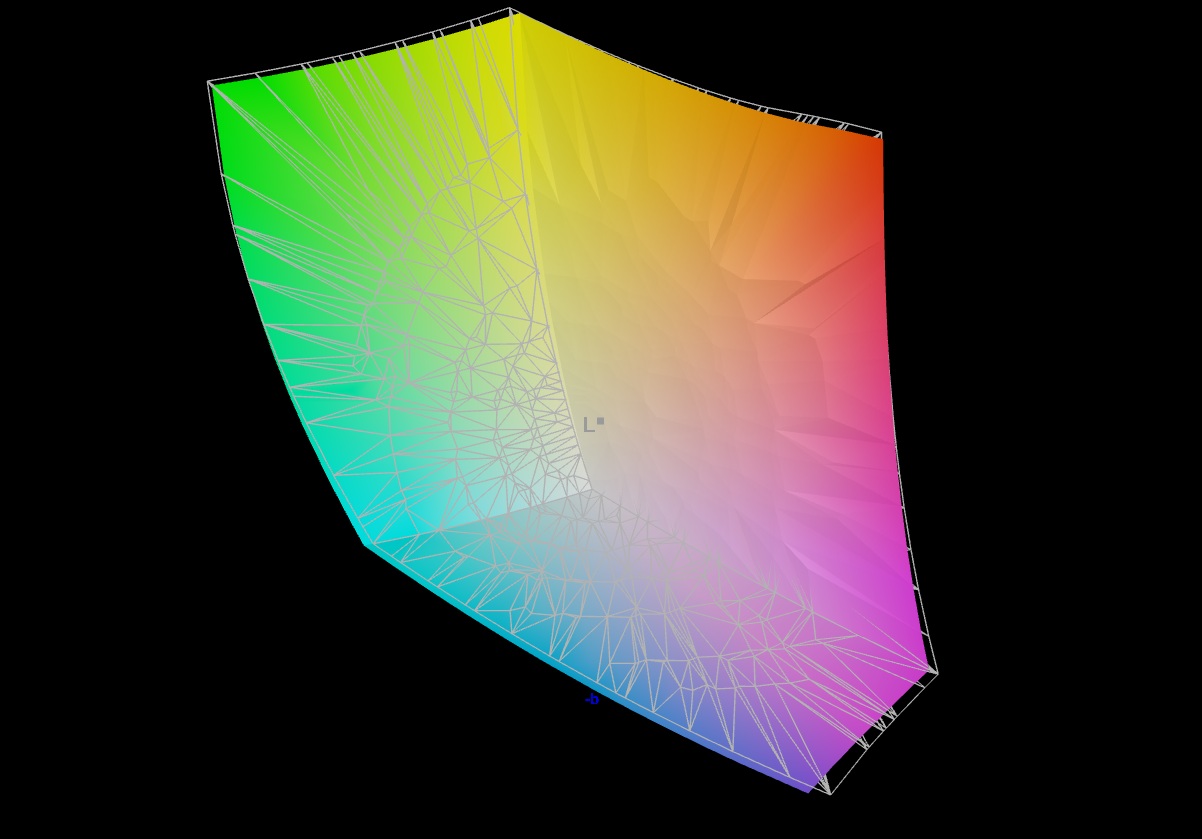
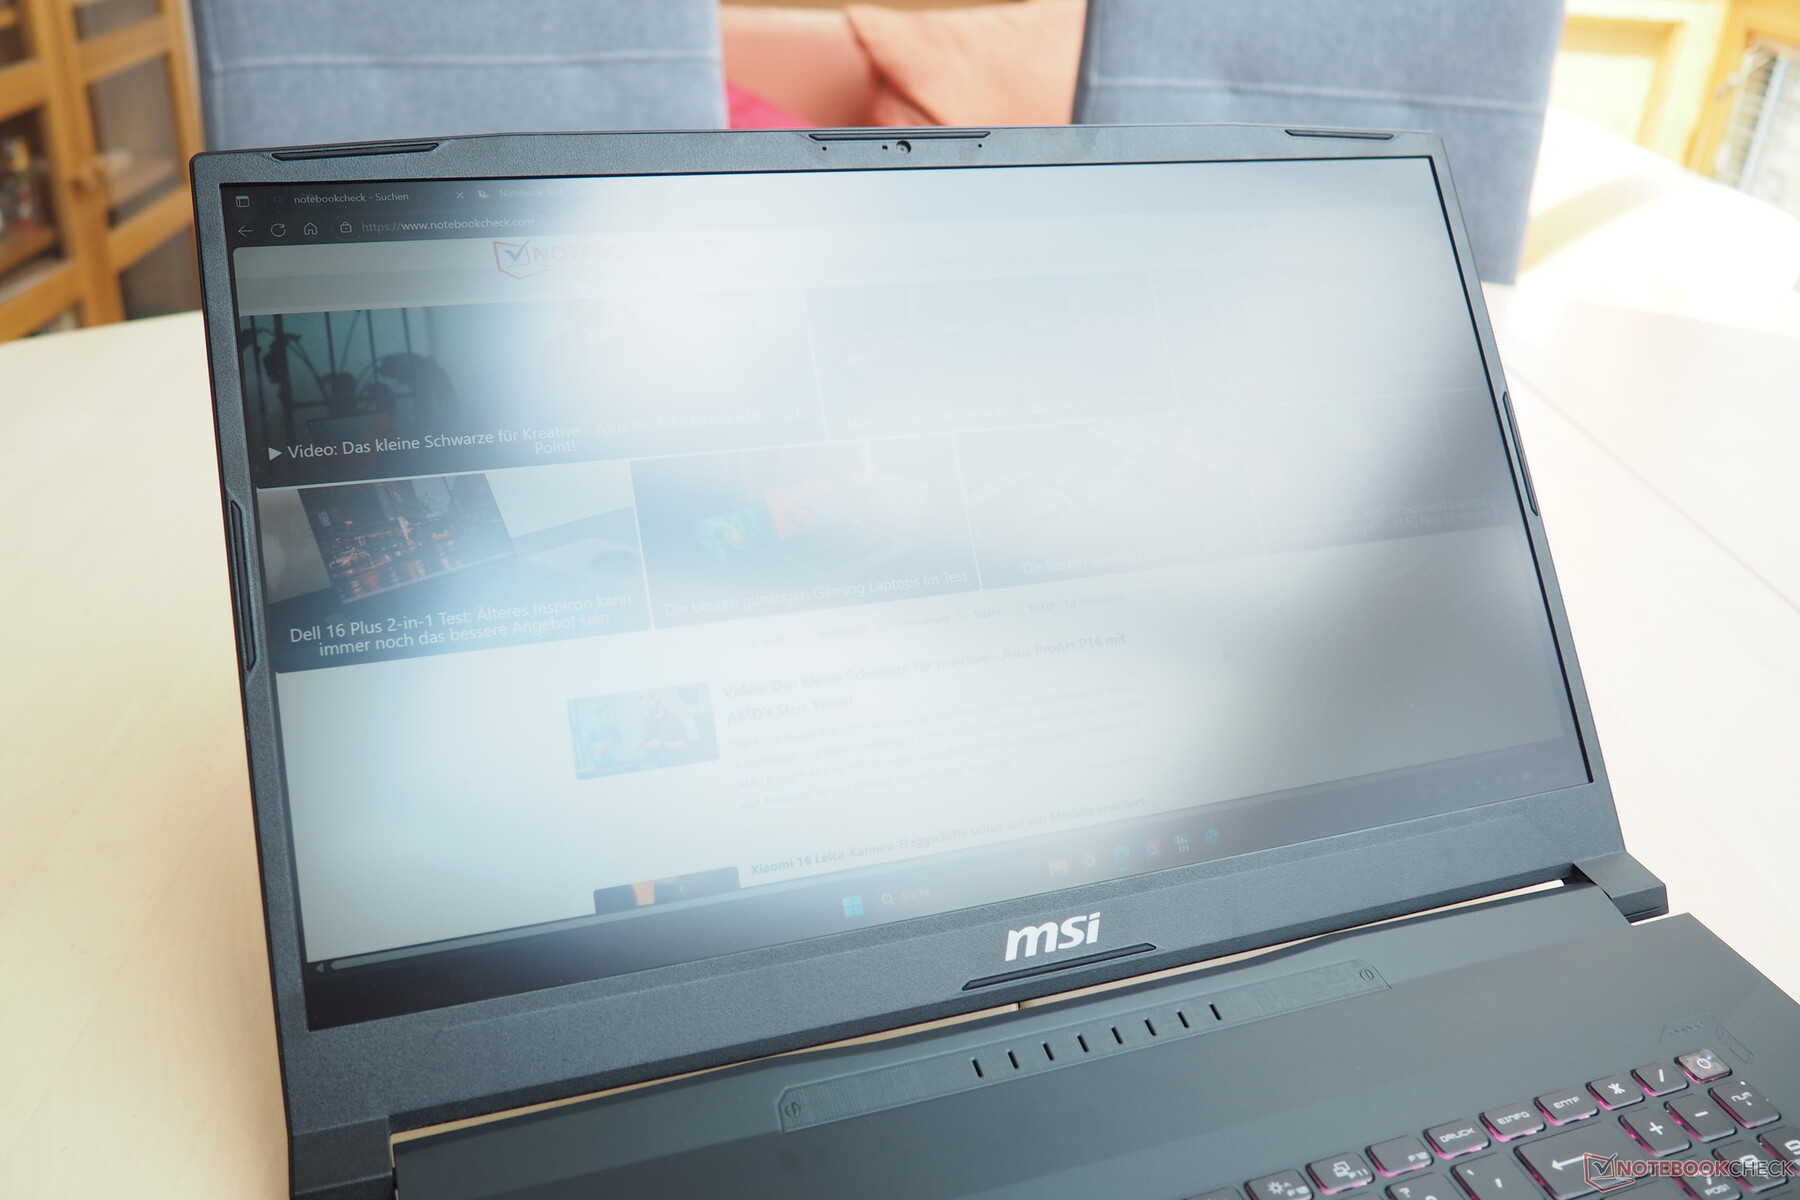
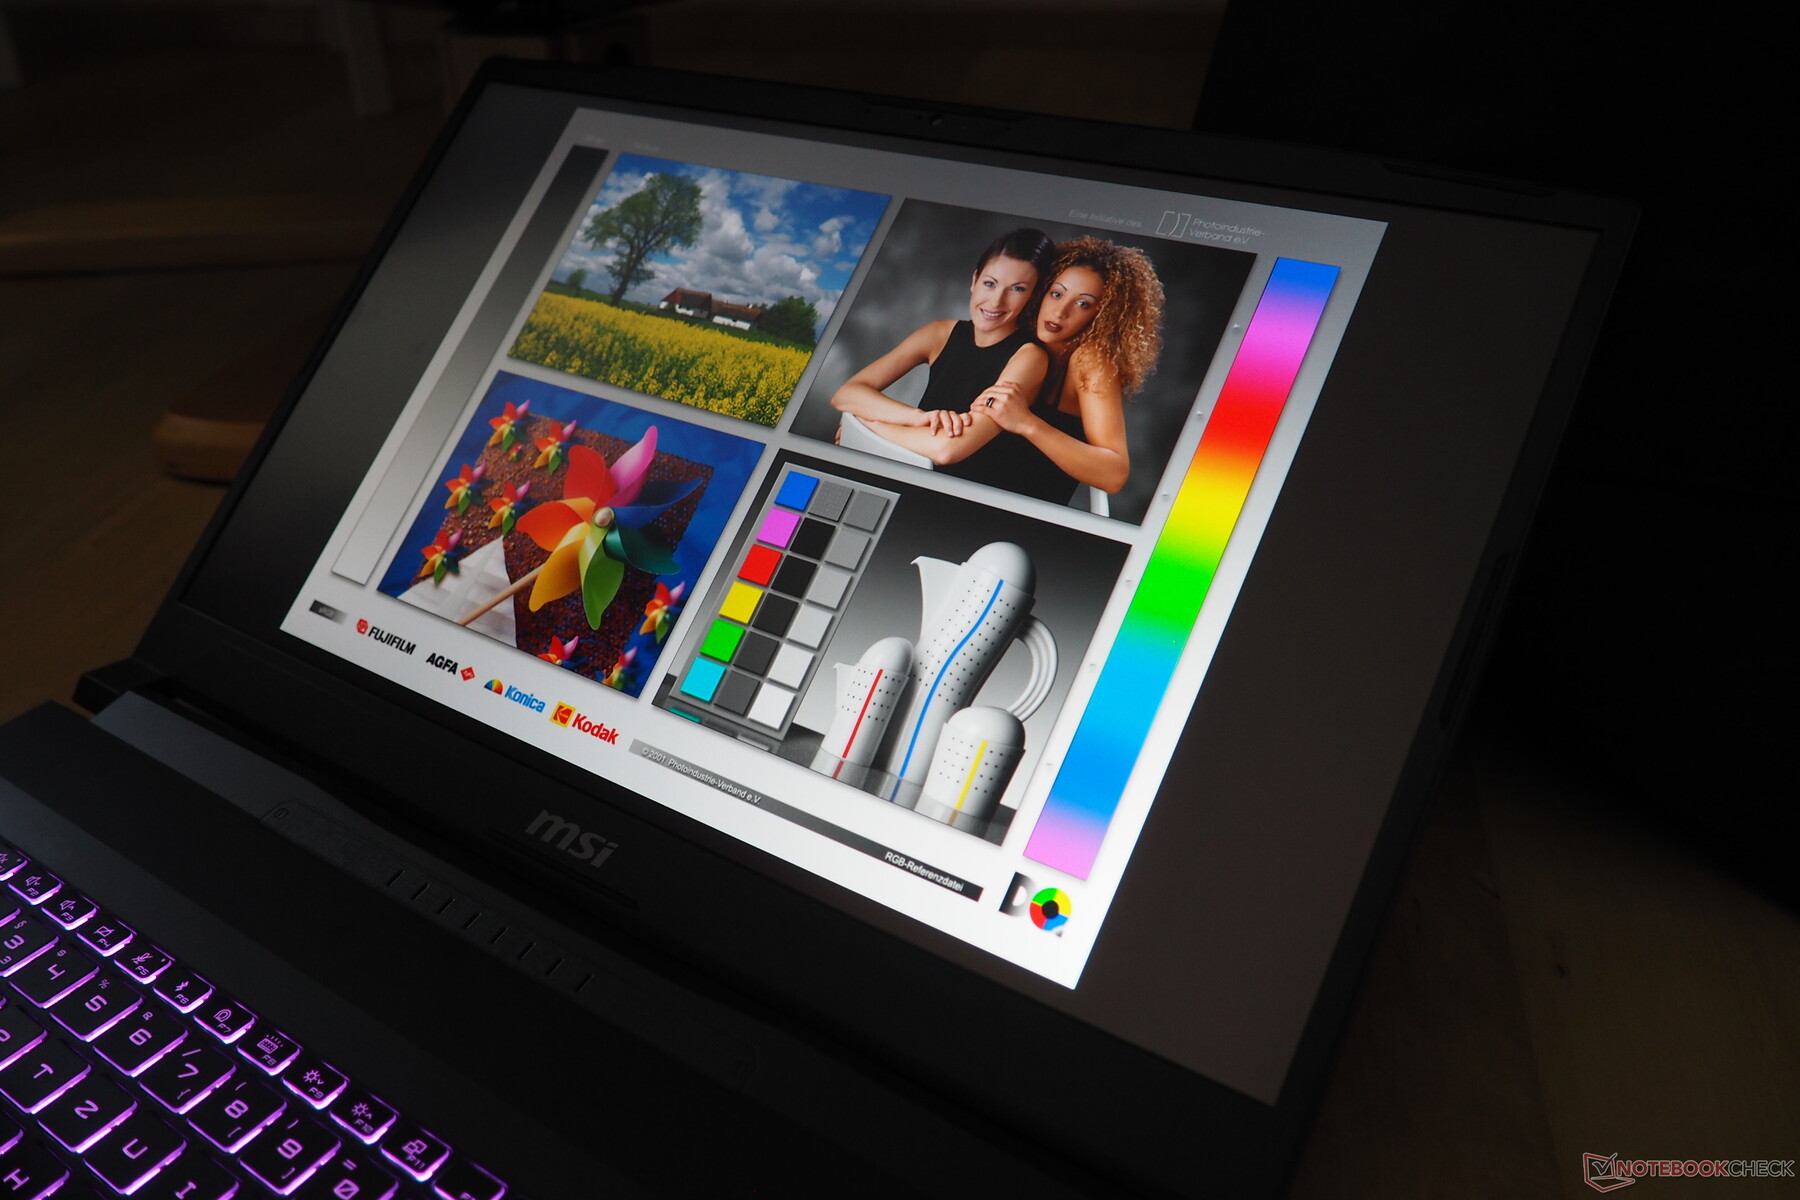
MSI ha optato per uno schermo IPS opaco in formato 16:9 con una risoluzione di 2.560 x 1.440 pixel, che offre un solido rapporto di contrasto di oltre 1.000:1 grazie al valore del nero relativamente basso (0,27 cd/m²). Tuttavia, questo ha un costo in termini di luminosità, con una media di 272 cd/m², che lo rende adatto solo all'uso in interni. La gamma di colori, invece, è sorprendentemente alta, appena inferiore al 100% di sRGB o DCI-P3. Anche i tempi di risposta e la fedeltà del colore non danno adito a lamentele.
| |||||||||||||||||||||||||
Distribuzione della luminosità: 87 %
Al centro con la batteria: 296 cd/m²
Contrasto: 1096:1 (Nero: 0.27 cd/m²)
ΔE ColorChecker Calman: 1.35 | ∀{0.5-29.43 Ø4.73}
calibrated: 0.78
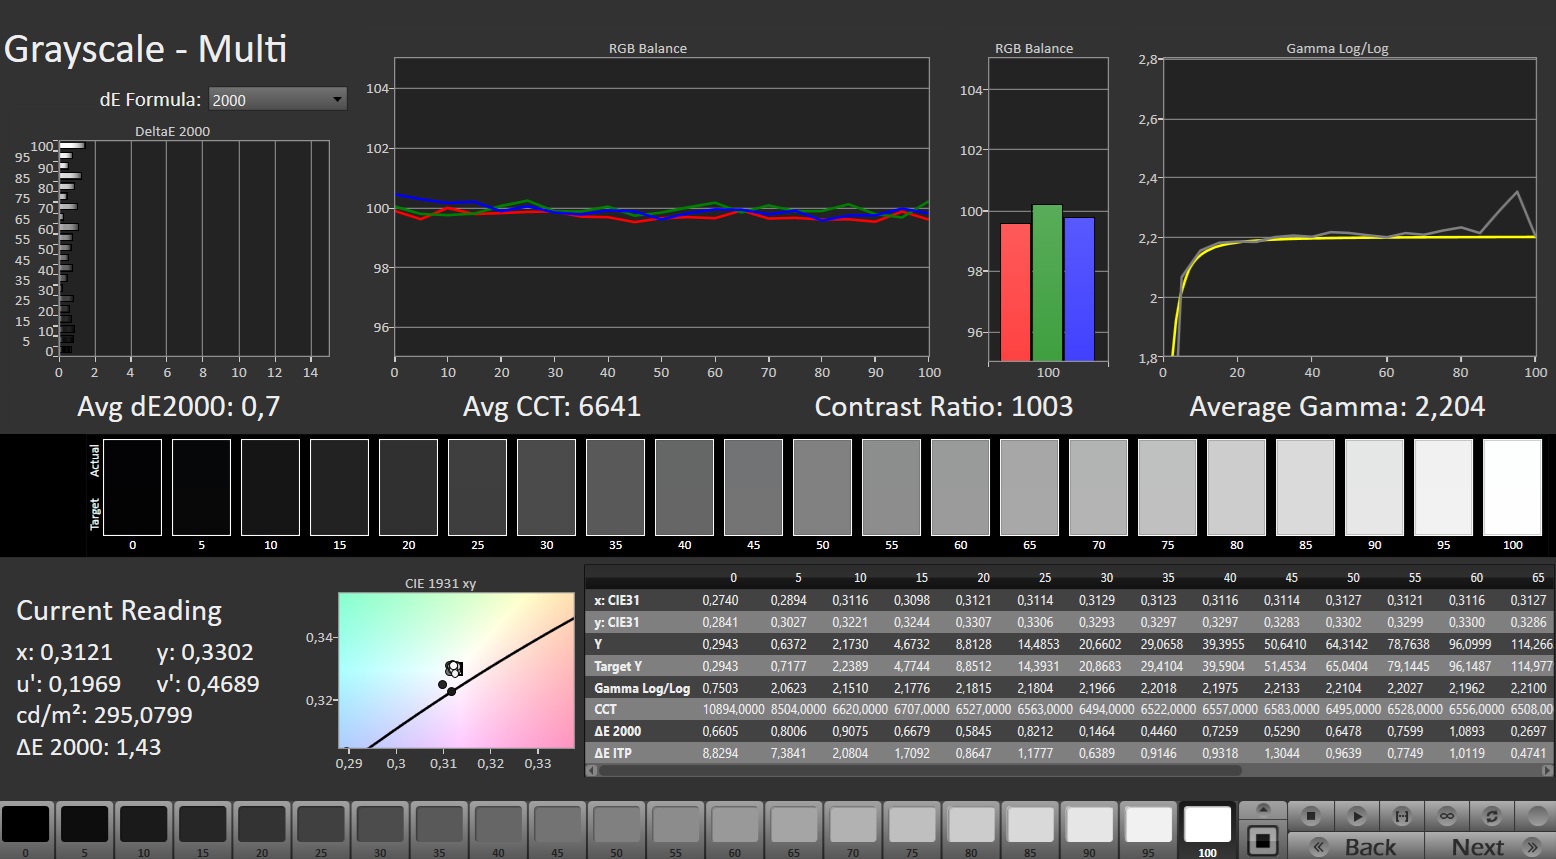
ΔE Greyscale Calman: 2.7 | ∀{0.09-98 Ø4.97}
89% AdobeRGB 1998 (Argyll 3D)
99.6% sRGB (Argyll 3D)
97.3% Display P3 (Argyll 3D)
Gamma: 2.201
CCT: 6770 K
| MSI Katana 17 HX B14WGK CSOT MNH301CA3-1, IPS, 2560x1440, 17.3", 240 Hz | Gigabyte Aero X16 1WH MNG007DA5-1, IPS, 2560x1600, 16", 165 Hz | Asus ProArt P16 H7606WP ATNA60CL10-0, OLED, 2880x1800, 16", 120 Hz | Schenker XMG Pro 16 (E25) NE160QDM-NZL, IPS, 2560x1600, 16", 300 Hz | MSI Vector 16 HX AI A2XWHG B160QAN02.3 (AUO7DB2), IPS, 2560x1600, 16", 240 Hz | |
|---|---|---|---|---|---|
| Display | -18% | 1% | -13% | -2% | |
| Display P3 Coverage (%) | 97.3 | 68.7 -29% | 99.5 2% | 74.7 -23% | 96.6 -1% |
| sRGB Coverage (%) | 99.6 | 96.1 -4% | 100 0% | 99.8 0% | 99.8 0% |
| AdobeRGB 1998 Coverage (%) | 89 | 71.2 -20% | 89.5 1% | 75.4 -15% | 84.4 -5% |
| Response Times | -46% | 91% | -31% | 26% | |
| Response Time Grey 50% / Grey 80% * (ms) | 5.2 ? | 12 ? -131% | 0.63 ? 88% | 10.5 ? -102% | 4.3 ? 17% |
| Response Time Black / White * (ms) | 9.2 ? | 5.6 ? 39% | 0.63 ? 93% | 5.4 ? 41% | 6 ? 35% |
| PWM Frequency (Hz) | 480 ? | ||||
| PWM Amplitude * (%) | 26 | ||||
| Screen | 9% | 37% | 9% | -26% | |
| Brightness middle (cd/m²) | 296 | 395 33% | 362 22% | 538 82% | 473 60% |
| Brightness (cd/m²) | 272 | 398 46% | 363 33% | 508 87% | 426 57% |
| Brightness Distribution (%) | 87 | 97 11% | 99 14% | 88 1% | 85 -2% |
| Black Level * (cd/m²) | 0.27 | 0.32 -19% | 0.47 -74% | 0.42 -56% | |
| Contrast (:1) | 1096 | 1234 13% | 1145 4% | 1126 3% | |
| Colorchecker dE 2000 * | 1.35 | 1.3 4% | 0.8 41% | 1.9 -41% | 3.47 -157% |
| Colorchecker dE 2000 max. * | 4.76 | 2.8 41% | 1.8 62% | 4 16% | 7.24 -52% |
| Colorchecker dE 2000 calibrated * | 0.78 | 1.4 -79% | 1.36 -74% | ||
| Greyscale dE 2000 * | 2.7 | 1.8 33% | 1.3 52% | 2.7 -0% | 3.1 -15% |
| Gamma | 2.201 100% | 2.2 100% | 2.2 100% | 2.24 98% | 2.486 88% |
| CCT | 6770 96% | 6842 95% | 6741 96% | 7027 93% | 6832 95% |
| Media totale (Programma / Settaggio) | -18% /
-4% | 43% /
37% | -12% /
-2% | -1% /
-14% |
* ... Meglio usare valori piccoli
Tempi di risposta del Display
| ↔ Tempi di risposta dal Nero al Bianco | ||
|---|---|---|
| 9.2 ms ... aumenta ↗ e diminuisce ↘ combinato | ↗ 5.2 ms Incremento | 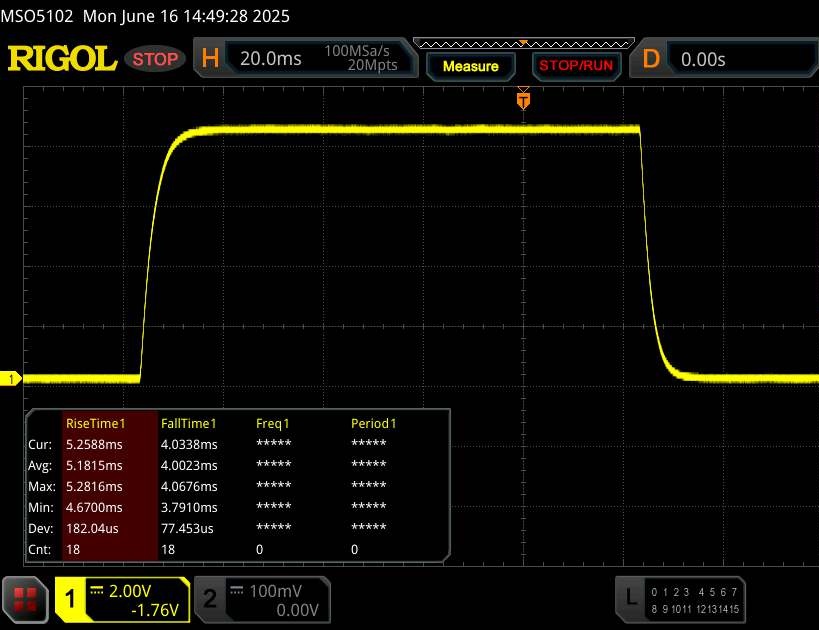 |
| ↘ 4 ms Calo | ||
| Lo schermo mostra veloci tempi di risposta durante i nostri tests e dovrebbe esere adatto al gaming In confronto, tutti i dispositivi di test variano da 0.1 (minimo) a 240 (massimo) ms. » 25 % di tutti i dispositivi è migliore. Questo significa che i tempi di risposta rilevati sono migliori rispettto alla media di tutti i dispositivi testati (19.9 ms). | ||
| ↔ Tempo di risposta dal 50% Grigio all'80% Grigio | ||
| 5.2 ms ... aumenta ↗ e diminuisce ↘ combinato | ↗ 2.4 ms Incremento | 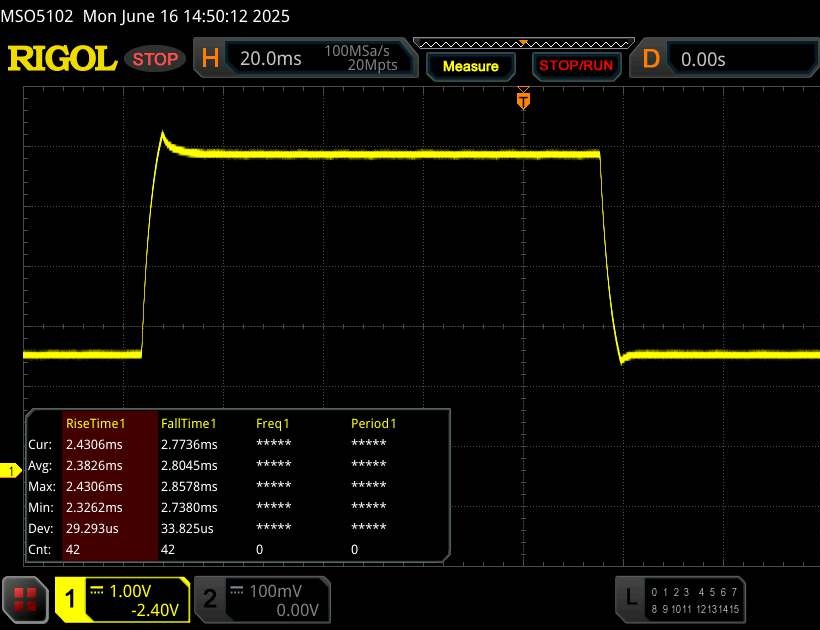 |
| ↘ 2.8 ms Calo | ||
| Lo schermo ha mostrato valori di risposta molto veloci nei nostri tests ed è molto adatto per i gaming veloce. In confronto, tutti i dispositivi di test variano da 0.165 (minimo) a 636 (massimo) ms. » 17 % di tutti i dispositivi è migliore. Questo significa che i tempi di risposta rilevati sono migliori rispettto alla media di tutti i dispositivi testati (31.1 ms). | ||
Sfarfallio dello schermo / PWM (Pulse-Width Modulation)
| flickering dello schermo / PWM non rilevato |  | ||
In confronto: 52 % di tutti i dispositivi testati non utilizza PWM per ridurre la luminosita' del display. Se è rilevato PWM, una media di 7798 (minimo: 5 - massimo: 343500) Hz è stata rilevata. | |||

Prestazioni
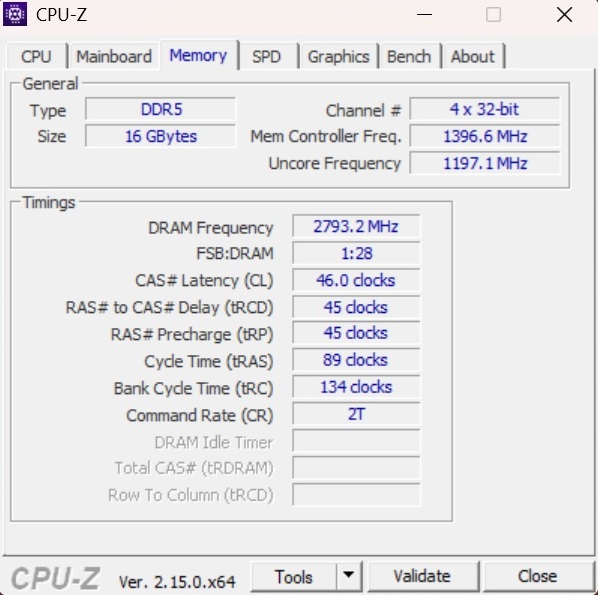
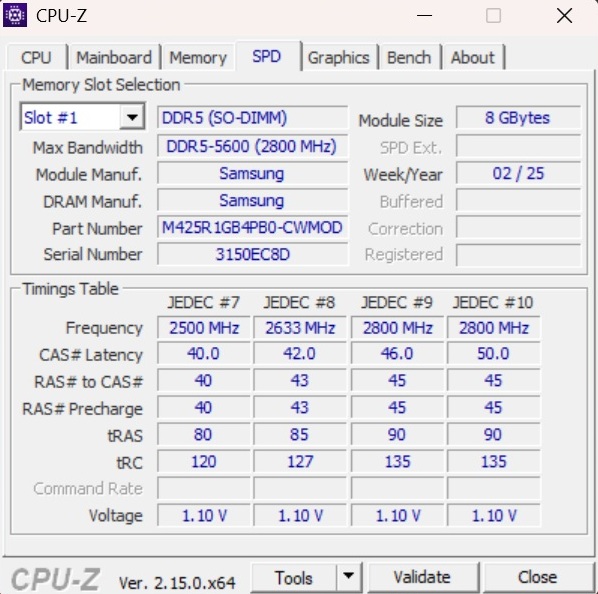
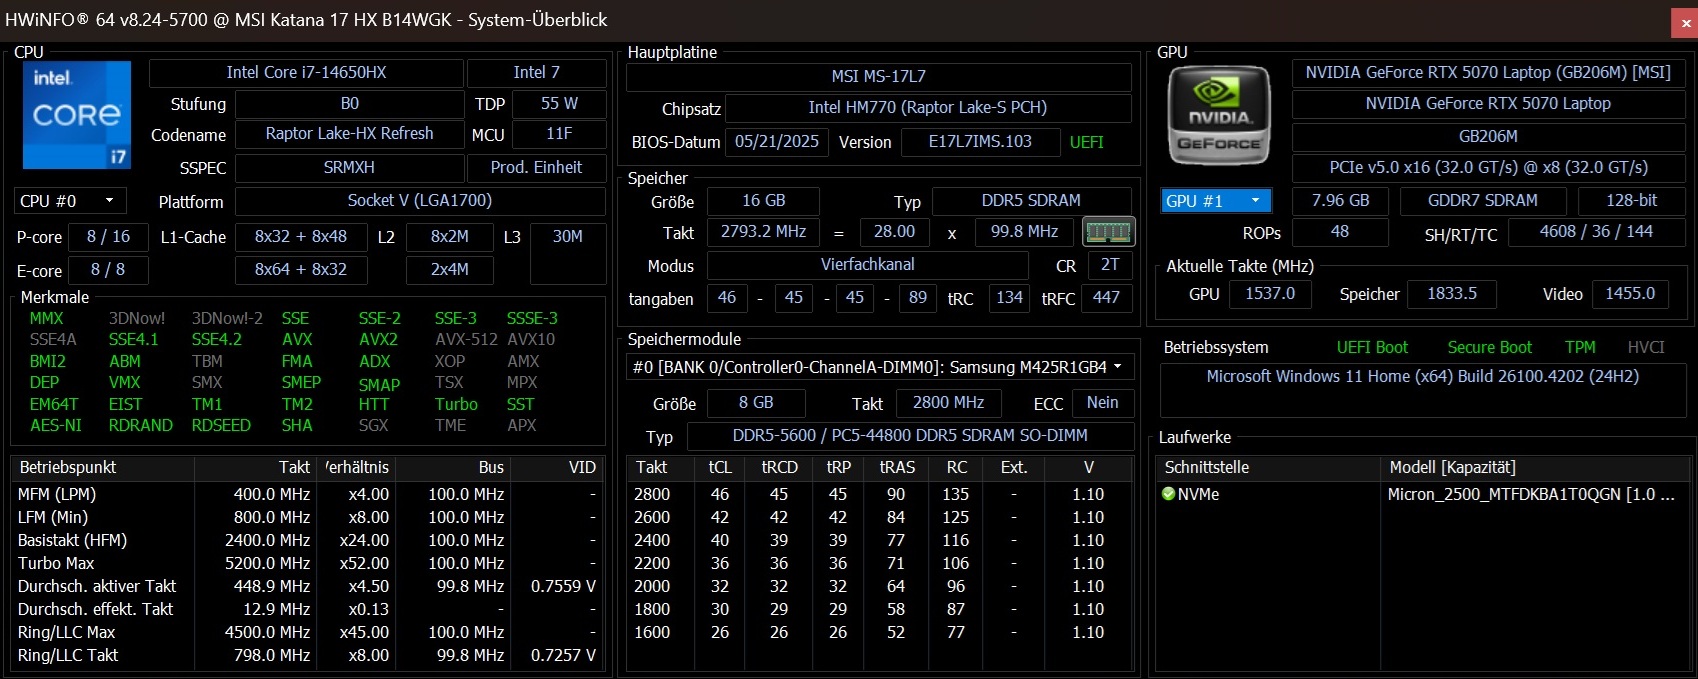
Il Katana 17 HX appartiene solo alla fascia (alta) media, soprattutto grazie agli 8 GB di VRAM. Top: Grazie a due banchi SO-DIMM, nulla ostacola l'aggiornamento della RAM da 16 GB (2x 8 GB DDR5-5600). Tuttavia, è un po' deludente che MSI abbia integrato solo uno slot M.2.
Condizioni del test
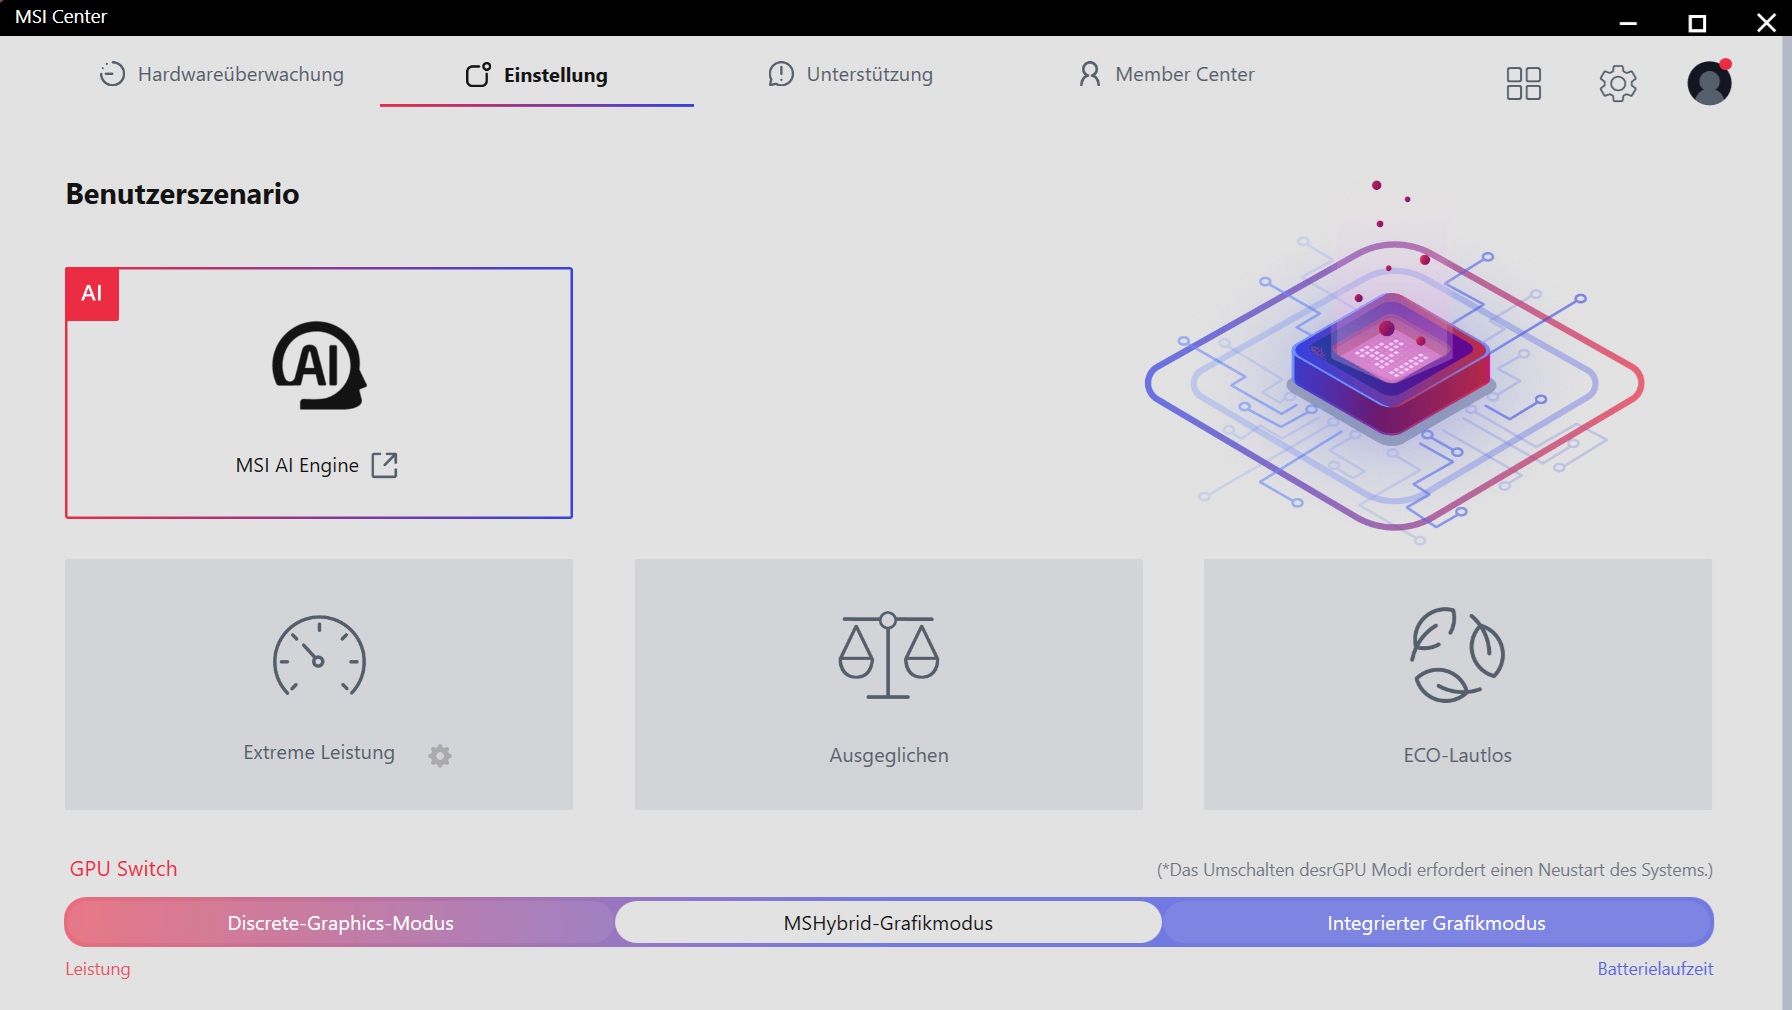
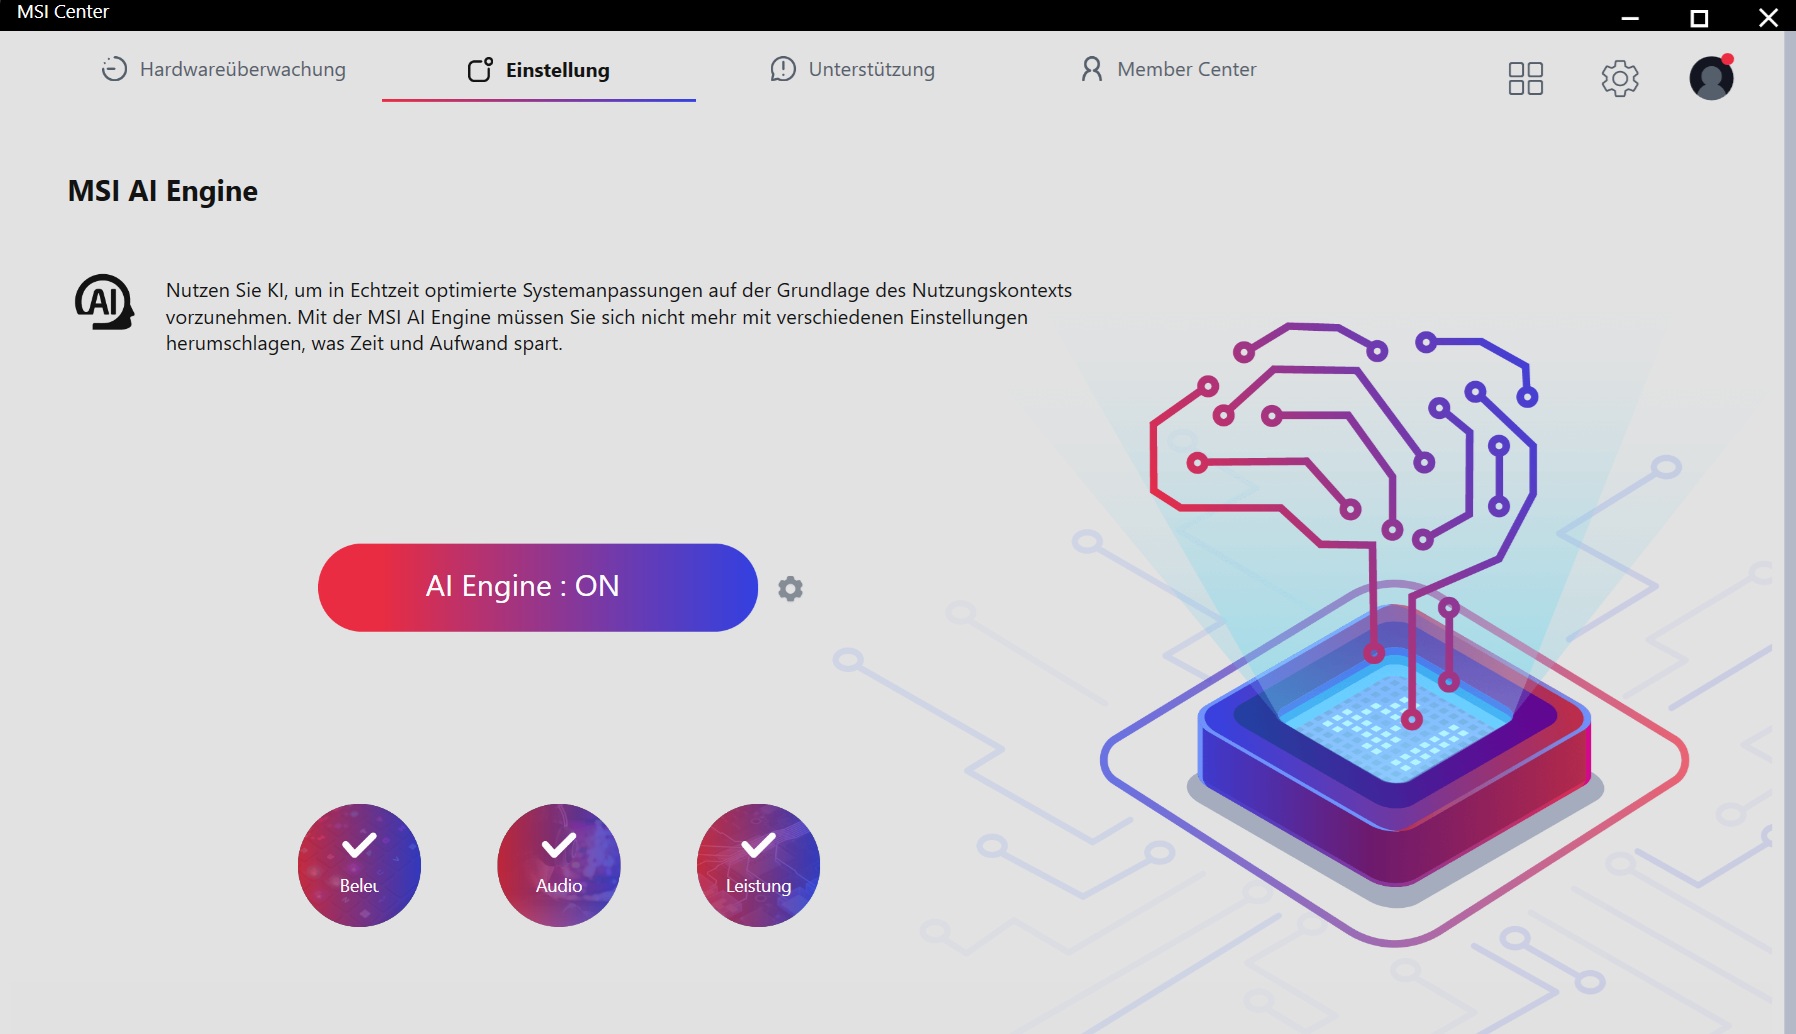
Le varie modalità operative si trovano nell'MSI Center preinstallato. Tutte le nostre misurazioni sono state effettuate con il profilo AI, che dovrebbe selezionare automaticamente le impostazioni appropriate per il rispettivo scenario.
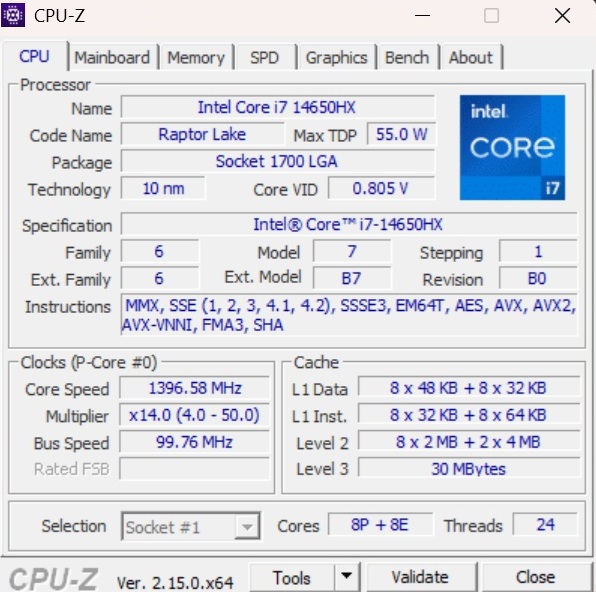
Processore
Dal momento che il Core i7-14650HX proviene dalla generazione Raptor Lake di Intel e contiene 8 core per le prestazioni con Hyper-Threading e 8 core per l'efficienza senza HT, non è più al passo con i tempi, i concorrenti a volte sono chiaramente in vantaggio nei benchmark delle CPU - sia che si tratti del Ryzen AI 9 HX 370 o il Core Ultra 7 255HX o Ultra 9 275HX. Come indicano le nostre tabelle, le prestazioni sono più vicine a quelle del Ryzen AI 7 350.
Cinebench R15 Multi loop
* ... Meglio usare valori piccoli
AIDA64: FP32 Ray-Trace | FPU Julia | CPU SHA3 | CPU Queen | FPU SinJulia | FPU Mandel | CPU AES | CPU ZLib | FP64 Ray-Trace | CPU PhotoWorxx
| Performance rating | |
| Schenker XMG Pro 16 (E25) | |
| Asus ProArt P16 H7606WP | |
| Media della classe Gaming | |
| MSI Vector 16 HX AI A2XWHG | |
| Gigabyte Aero X16 1WH | |
| Media Intel Core i7-14650HX | |
| MSI Katana 17 HX B14WGK | |
| AIDA64 / FP32 Ray-Trace | |
| Asus ProArt P16 H7606WP | |
| Schenker XMG Pro 16 (E25) | |
| Media della classe Gaming (10227 - 85542, n=110, ultimi 2 anni) | |
| MSI Vector 16 HX AI A2XWHG | |
| Gigabyte Aero X16 1WH | |
| Media Intel Core i7-14650HX (13096 - 19044, n=2) | |
| MSI Katana 17 HX B14WGK | |
| AIDA64 / FPU Julia | |
| Schenker XMG Pro 16 (E25) | |
| Asus ProArt P16 H7606WP | |
| MSI Vector 16 HX AI A2XWHG | |
| Media della classe Gaming (51376 - 238426, n=110, ultimi 2 anni) | |
| Gigabyte Aero X16 1WH | |
| Media Intel Core i7-14650HX (67335 - 95271, n=2) | |
| MSI Katana 17 HX B14WGK | |
| AIDA64 / CPU SHA3 | |
| Schenker XMG Pro 16 (E25) | |
| MSI Vector 16 HX AI A2XWHG | |
| Media della classe Gaming (2180 - 9817, n=110, ultimi 2 anni) | |
| Asus ProArt P16 H7606WP | |
| Gigabyte Aero X16 1WH | |
| Media Intel Core i7-14650HX (3109 - 4214, n=2) | |
| MSI Katana 17 HX B14WGK | |
| AIDA64 / CPU Queen | |
| Schenker XMG Pro 16 (E25) | |
| Media della classe Gaming (49785 - 173351, n=101, ultimi 2 anni) | |
| MSI Vector 16 HX AI A2XWHG | |
| Media Intel Core i7-14650HX (89907 - 101500, n=2) | |
| Asus ProArt P16 H7606WP | |
| MSI Katana 17 HX B14WGK | |
| Gigabyte Aero X16 1WH | |
| AIDA64 / FPU SinJulia | |
| Asus ProArt P16 H7606WP | |
| Media della classe Gaming (4424 - 33636, n=110, ultimi 2 anni) | |
| Schenker XMG Pro 16 (E25) | |
| Gigabyte Aero X16 1WH | |
| MSI Vector 16 HX AI A2XWHG | |
| Media Intel Core i7-14650HX (9159 - 11913, n=2) | |
| MSI Katana 17 HX B14WGK | |
| AIDA64 / FPU Mandel | |
| Schenker XMG Pro 16 (E25) | |
| Asus ProArt P16 H7606WP | |
| MSI Vector 16 HX AI A2XWHG | |
| Media della classe Gaming (25115 - 128721, n=110, ultimi 2 anni) | |
| Gigabyte Aero X16 1WH | |
| Media Intel Core i7-14650HX (32747 - 47097, n=2) | |
| MSI Katana 17 HX B14WGK | |
| AIDA64 / CPU AES | |
| Schenker XMG Pro 16 (E25) | |
| Asus ProArt P16 H7606WP | |
| Media della classe Gaming (39258 - 247074, n=110, ultimi 2 anni) | |
| MSI Vector 16 HX AI A2XWHG | |
| Gigabyte Aero X16 1WH | |
| Media Intel Core i7-14650HX (63627 - 86485, n=2) | |
| MSI Katana 17 HX B14WGK | |
| AIDA64 / CPU ZLib | |
| Schenker XMG Pro 16 (E25) | |
| Media della classe Gaming (574 - 2531, n=110, ultimi 2 anni) | |
| MSI Vector 16 HX AI A2XWHG | |
| Asus ProArt P16 H7606WP | |
| Gigabyte Aero X16 1WH | |
| Media Intel Core i7-14650HX (924 - 1289, n=2) | |
| MSI Katana 17 HX B14WGK | |
| AIDA64 / FP64 Ray-Trace | |
| Asus ProArt P16 H7606WP | |
| Schenker XMG Pro 16 (E25) | |
| Media della classe Gaming (5509 - 45446, n=110, ultimi 2 anni) | |
| MSI Vector 16 HX AI A2XWHG | |
| Gigabyte Aero X16 1WH | |
| Media Intel Core i7-14650HX (7064 - 10316, n=2) | |
| MSI Katana 17 HX B14WGK | |
| AIDA64 / CPU PhotoWorxx | |
| Schenker XMG Pro 16 (E25) | |
| Asus ProArt P16 H7606WP | |
| Media della classe Gaming (12271 - 89891, n=110, ultimi 2 anni) | |
| Gigabyte Aero X16 1WH | |
| MSI Vector 16 HX AI A2XWHG | |
| MSI Katana 17 HX B14WGK | |
| Media Intel Core i7-14650HX (33763 - 34470, n=2) | |
Prestazioni del sistema
In termini di prestazioni del sistema, la Katana 17 si posiziona dietro nel campo di prova, anche se il divario rispetto alla concorrenza (ad eccezione di XMG Pro 16) è piuttosto ridotto.
PCMark 10: Score | Essentials | Productivity | Digital Content Creation
CrossMark: Overall | Productivity | Creativity | Responsiveness
WebXPRT 3: Overall
WebXPRT 4: Overall
Mozilla Kraken 1.1: Total
| Performance rating | |
| Schenker XMG Pro 16 (E25) | |
| Media della classe Gaming | |
| MSI Vector 16 HX AI A2XWHG | |
| Asus ProArt P16 H7606WP | |
| Gigabyte Aero X16 1WH | |
| MSI Katana 17 HX B14WGK | |
| Media Intel Core i7-14650HX, NVIDIA GeForce RTX 5070 Laptop | |
| PCMark 10 / Score | |
| Schenker XMG Pro 16 (E25) | |
| Media della classe Gaming (5828 - 11574, n=96, ultimi 2 anni) | |
| Asus ProArt P16 H7606WP | |
| Gigabyte Aero X16 1WH | |
| MSI Vector 16 HX AI A2XWHG | |
| MSI Katana 17 HX B14WGK | |
| Media Intel Core i7-14650HX, NVIDIA GeForce RTX 5070 Laptop (n=1) | |
| PCMark 10 / Essentials | |
| Schenker XMG Pro 16 (E25) | |
| MSI Vector 16 HX AI A2XWHG | |
| Media della classe Gaming (8810 - 12600, n=100, ultimi 2 anni) | |
| Asus ProArt P16 H7606WP | |
| Gigabyte Aero X16 1WH | |
| MSI Katana 17 HX B14WGK | |
| Media Intel Core i7-14650HX, NVIDIA GeForce RTX 5070 Laptop (n=1) | |
| PCMark 10 / Productivity | |
| Media della classe Gaming (6845 - 18766, n=98, ultimi 2 anni) | |
| Gigabyte Aero X16 1WH | |
| Schenker XMG Pro 16 (E25) | |
| MSI Vector 16 HX AI A2XWHG | |
| Asus ProArt P16 H7606WP | |
| MSI Katana 17 HX B14WGK | |
| Media Intel Core i7-14650HX, NVIDIA GeForce RTX 5070 Laptop (n=1) | |
| PCMark 10 / Digital Content Creation | |
| Schenker XMG Pro 16 (E25) | |
| Asus ProArt P16 H7606WP | |
| Media della classe Gaming (7602 - 19657, n=98, ultimi 2 anni) | |
| MSI Vector 16 HX AI A2XWHG | |
| Gigabyte Aero X16 1WH | |
| MSI Katana 17 HX B14WGK | |
| Media Intel Core i7-14650HX, NVIDIA GeForce RTX 5070 Laptop (n=1) | |
| CrossMark / Overall | |
| Schenker XMG Pro 16 (E25) | |
| Media della classe Gaming (1366 - 2409, n=98, ultimi 2 anni) | |
| MSI Katana 17 HX B14WGK | |
| Media Intel Core i7-14650HX, NVIDIA GeForce RTX 5070 Laptop (n=1) | |
| MSI Vector 16 HX AI A2XWHG | |
| Asus ProArt P16 H7606WP | |
| Gigabyte Aero X16 1WH | |
| CrossMark / Productivity | |
| Schenker XMG Pro 16 (E25) | |
| MSI Katana 17 HX B14WGK | |
| Media Intel Core i7-14650HX, NVIDIA GeForce RTX 5070 Laptop (n=1) | |
| Media della classe Gaming (1386 - 2254, n=98, ultimi 2 anni) | |
| MSI Vector 16 HX AI A2XWHG | |
| Asus ProArt P16 H7606WP | |
| Gigabyte Aero X16 1WH | |
| CrossMark / Creativity | |
| Schenker XMG Pro 16 (E25) | |
| Asus ProArt P16 H7606WP | |
| MSI Vector 16 HX AI A2XWHG | |
| Media della classe Gaming (1343 - 2729, n=98, ultimi 2 anni) | |
| MSI Katana 17 HX B14WGK | |
| Media Intel Core i7-14650HX, NVIDIA GeForce RTX 5070 Laptop (n=1) | |
| Gigabyte Aero X16 1WH | |
| CrossMark / Responsiveness | |
| MSI Katana 17 HX B14WGK | |
| Media Intel Core i7-14650HX, NVIDIA GeForce RTX 5070 Laptop (n=1) | |
| Schenker XMG Pro 16 (E25) | |
| Media della classe Gaming (1226 - 2334, n=98, ultimi 2 anni) | |
| Asus ProArt P16 H7606WP | |
| MSI Vector 16 HX AI A2XWHG | |
| Gigabyte Aero X16 1WH | |
| WebXPRT 3 / Overall | |
| Schenker XMG Pro 16 (E25) | |
| Gigabyte Aero X16 1WH | |
| Asus ProArt P16 H7606WP | |
| MSI Vector 16 HX AI A2XWHG | |
| Media della classe Gaming (242 - 532, n=101, ultimi 2 anni) | |
| MSI Katana 17 HX B14WGK | |
| Media Intel Core i7-14650HX, NVIDIA GeForce RTX 5070 Laptop (n=1) | |
| WebXPRT 4 / Overall | |
| Schenker XMG Pro 16 (E25) | |
| MSI Vector 16 HX AI A2XWHG | |
| Media della classe Gaming (176.4 - 354, n=101, ultimi 2 anni) | |
| Gigabyte Aero X16 1WH | |
| Asus ProArt P16 H7606WP | |
| MSI Katana 17 HX B14WGK | |
| Media Intel Core i7-14650HX, NVIDIA GeForce RTX 5070 Laptop (n=1) | |
| Mozilla Kraken 1.1 / Total | |
| MSI Katana 17 HX B14WGK | |
| Media Intel Core i7-14650HX, NVIDIA GeForce RTX 5070 Laptop (n=1) | |
| Media della classe Gaming (391 - 590, n=106, ultimi 2 anni) | |
| Asus ProArt P16 H7606WP | |
| Gigabyte Aero X16 1WH | |
| MSI Vector 16 HX AI A2XWHG | |
| Schenker XMG Pro 16 (E25) | |
* ... Meglio usare valori piccoli
| PCMark 10 Score | 6864 punti | |
Aiuto | ||
| AIDA64 / Memory Copy | |
| Asus ProArt P16 H7606WP | |
| Schenker XMG Pro 16 (E25) | |
| Gigabyte Aero X16 1WH | |
| Media della classe Gaming (21750 - 129946, n=110, ultimi 2 anni) | |
| MSI Vector 16 HX AI A2XWHG | |
| Media Intel Core i7-14650HX (58978 - 59727, n=2) | |
| MSI Katana 17 HX B14WGK | |
| AIDA64 / Memory Read | |
| Asus ProArt P16 H7606WP | |
| Schenker XMG Pro 16 (E25) | |
| MSI Vector 16 HX AI A2XWHG | |
| Media della classe Gaming (22956 - 118858, n=110, ultimi 2 anni) | |
| Media Intel Core i7-14650HX (70720 - 71455, n=2) | |
| MSI Katana 17 HX B14WGK | |
| Gigabyte Aero X16 1WH | |
| AIDA64 / Memory Write | |
| Asus ProArt P16 H7606WP | |
| Gigabyte Aero X16 1WH | |
| Schenker XMG Pro 16 (E25) | |
| Media della classe Gaming (22297 - 135096, n=110, ultimi 2 anni) | |
| MSI Vector 16 HX AI A2XWHG | |
| MSI Katana 17 HX B14WGK | |
| Media Intel Core i7-14650HX (51138 - 56811, n=2) | |
| AIDA64 / Memory Latency | |
| Asus ProArt P16 H7606WP | |
| MSI Vector 16 HX AI A2XWHG | |
| Media della classe Gaming (75.3 - 259, n=110, ultimi 2 anni) | |
| Schenker XMG Pro 16 (E25) | |
| Gigabyte Aero X16 1WH | |
| MSI Katana 17 HX B14WGK | |
| Media Intel Core i7-14650HX (89.8 - 95.2, n=2) | |
* ... Meglio usare valori piccoli
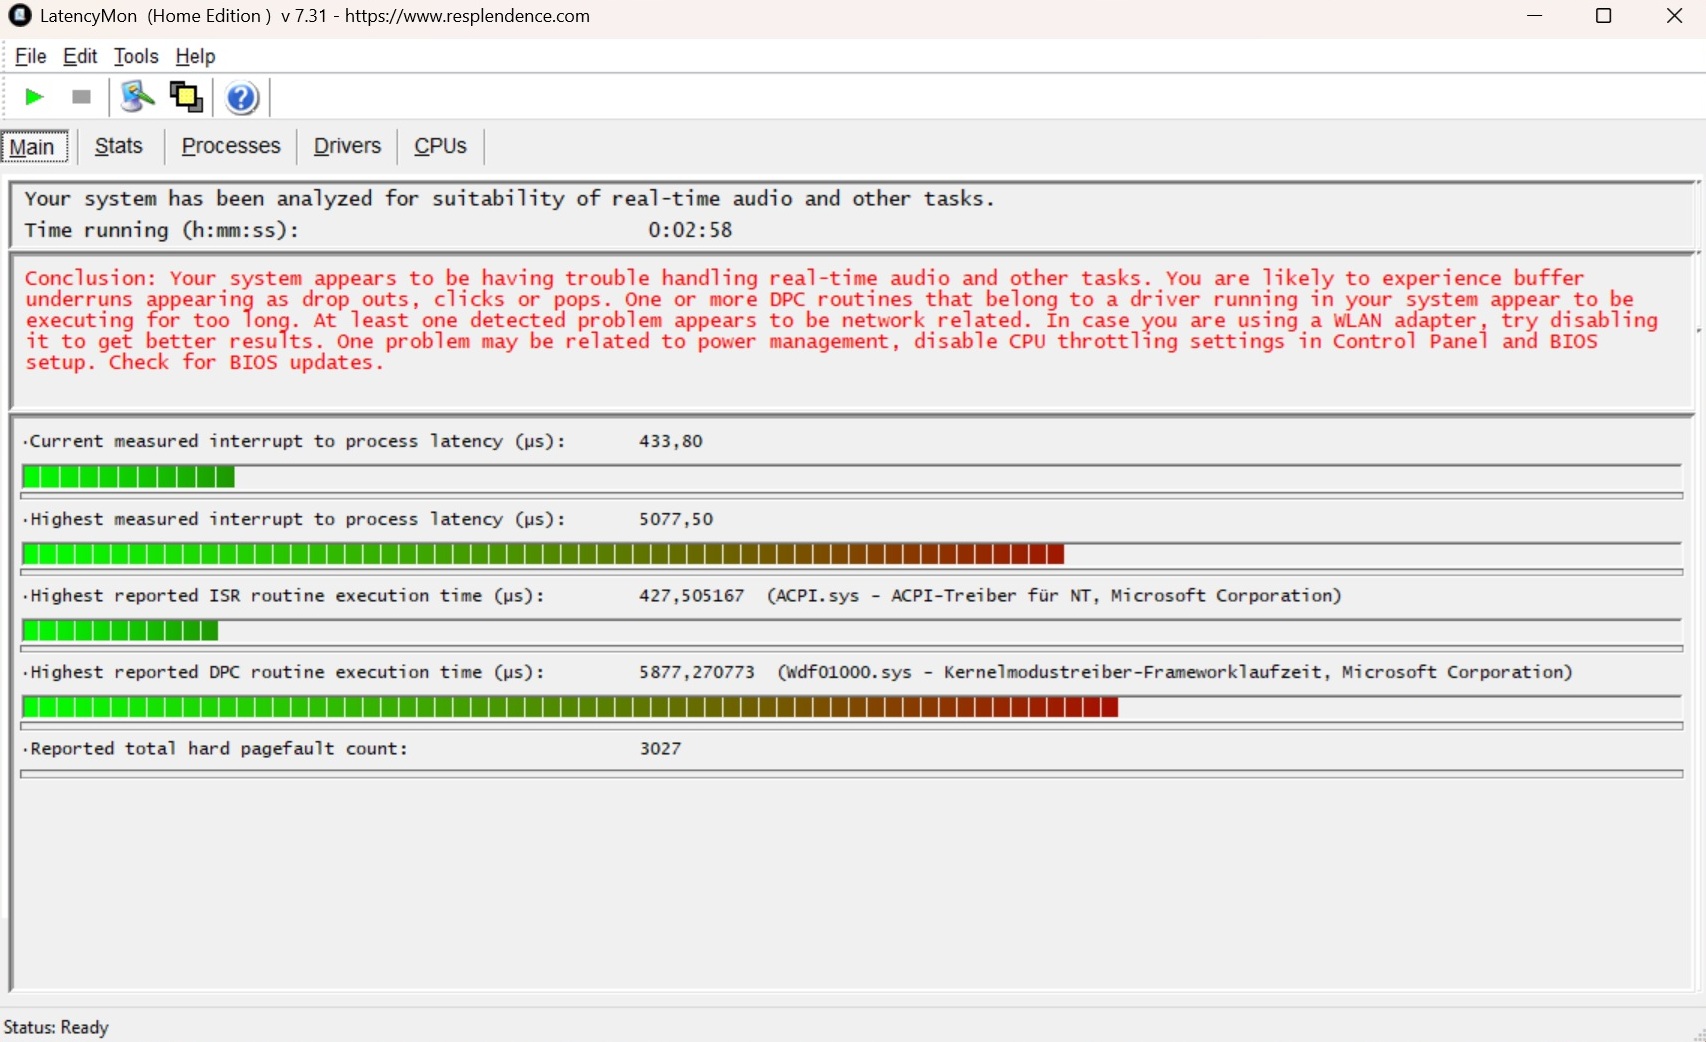
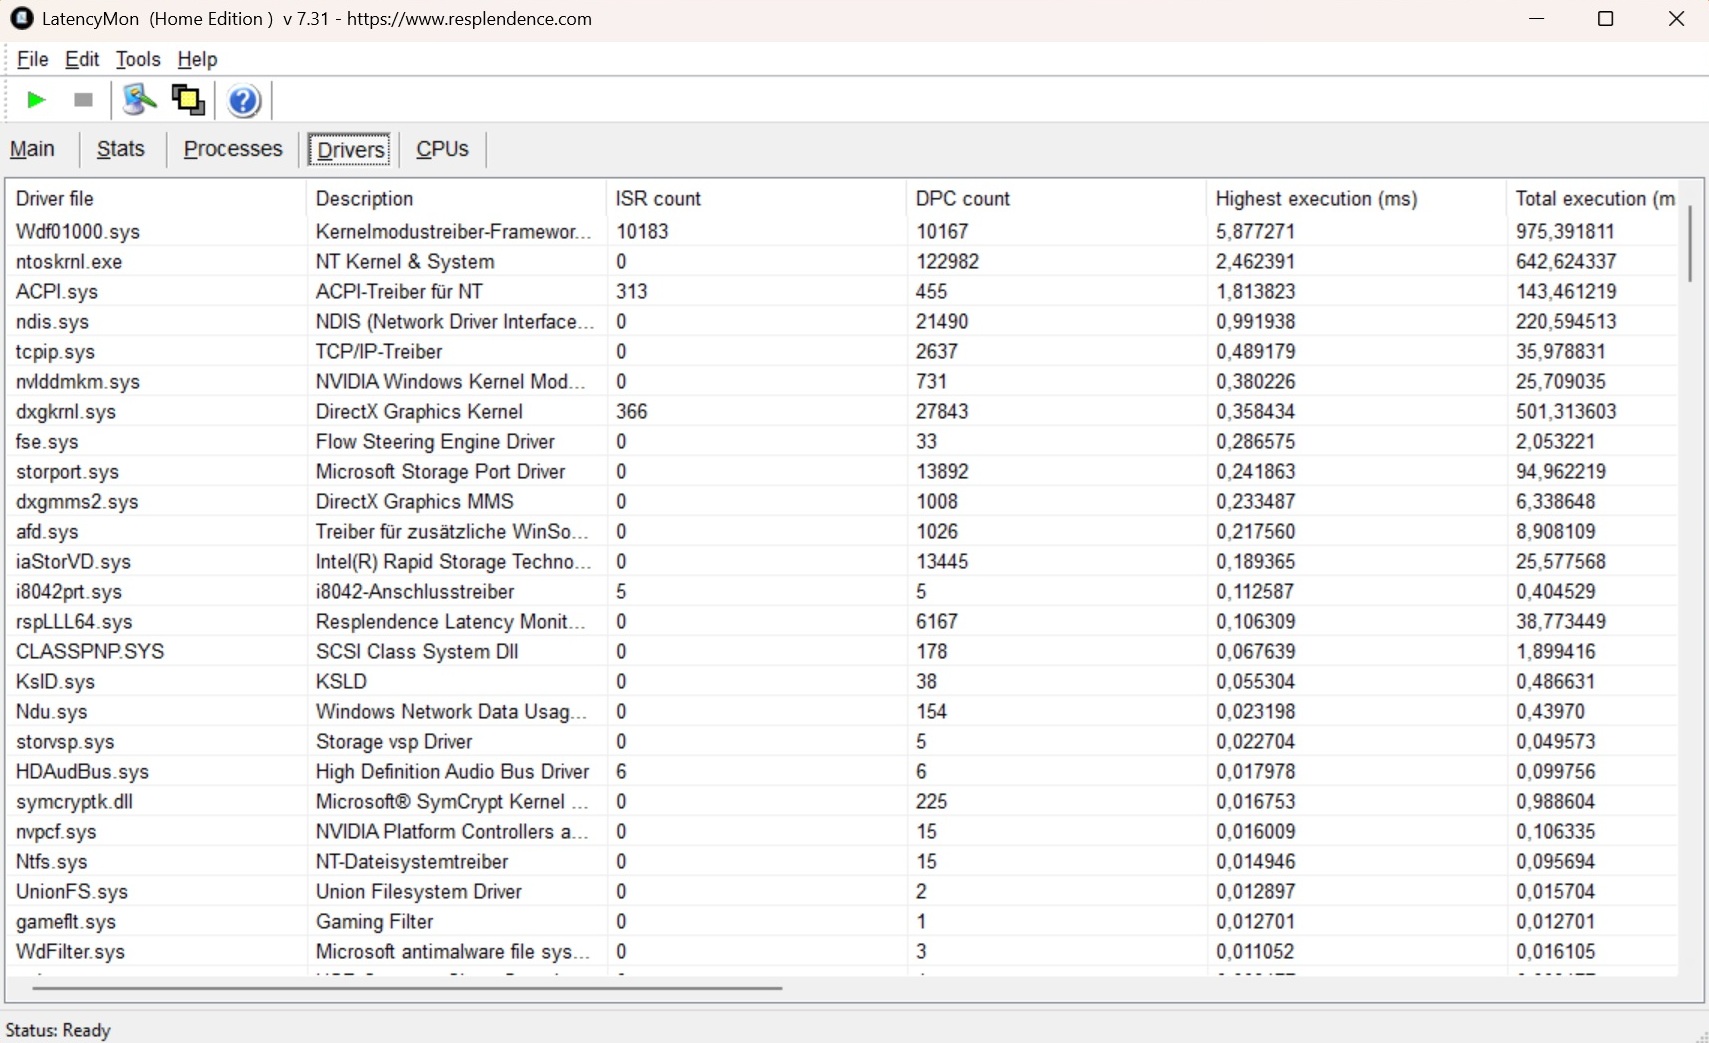
Latenze DPC
Un problema per alcuni utenti potrebbe essere la latenza molto elevata, che influisce anche sul Vector 16.
| DPC Latencies / LatencyMon - interrupt to process latency (max), Web, Youtube, Prime95 | |
| MSI Katana 17 HX B14WGK | |
| MSI Vector 16 HX AI A2XWHG | |
| Gigabyte Aero X16 1WH | |
| Schenker XMG Pro 16 (E25) | |
| Asus ProArt P16 H7606WP | |
* ... Meglio usare valori piccoli
Dispositivi di archiviazione
MSI merita un elogio per il veloce SSD. L'unità da 1 TB di Micron (modello 2500) offre valori eccellenti e stabili sia in lettura che in scrittura.

* ... Meglio usare valori piccoli
Continuous read: DiskSpd Read Loop, Queue Depth 8
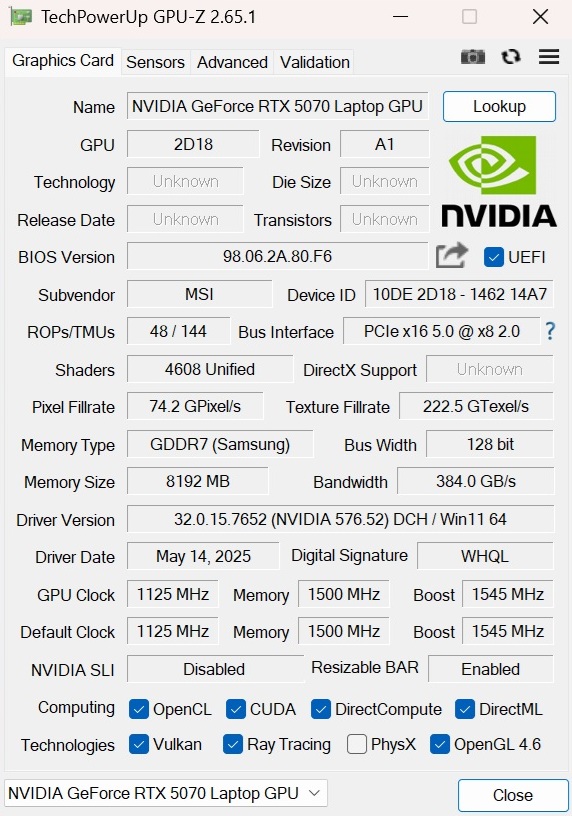
Prestazioni della GPU
Dal nostro punto di vista, il laptop GeForce RTX 5070 non dovrebbe esistere in questa forma. Il Laptop RTX 5070 Ticon i suoi 12 GB di VRAM GDDR7 invece di 8 GB, dovrebbe essere la vera "versione standard" (al prezzo del laptop RTX 5070, ovviamente). Tuttavia, questo si traduce in un portatile da gioco che è a prova di futuro solo in misura molto limitata a causa della sua memoria video limitata, e sta già raggiungendo i suoi limiti con alcuni titoli moderni - ne parleremo tra poco. Nei benchmark sintetici, Katana 17 con il suo TGP da 115 watt (incluso Dynamic Boost) è almeno in linea con la media determinata in precedenza per questa GPU. Un modello di laptop RTX 5070 Ti ha una media di prestazioni superiori di circa il 30%.
| 3DMark 11 Performance | 33622 punti | |
| 3DMark Cloud Gate Standard Score | 56625 punti | |
| 3DMark Fire Strike Score | 29564 punti | |
| 3DMark Time Spy Score | 12583 punti | |
Aiuto | ||
* ... Meglio usare valori piccoli
Prestazioni di gioco
Questo divario continua nel corso dei giochi. Anche in questo caso, un computer portatile RTX 5070 Ti si comporta in media il 30% più velocemente. Nel frattempo, un laptop RTX 5080 è circa il 60% più veloce in QHD. La differenza può essere netta nei giochi che richiedono molta VRAM. Con il preset Very Ultra, un laptop RTX 5070 Ti raggiunge circa il 150% in più di fotogrammi al secondo in Indiana Jones (32,4 contro 82,5 FPS @ MSI Vector A18 HX), un computer portatile RTX 5080 è addirittura in vantaggio di quasi il 200% (99,5 FPS @ MSI Raider A18 HX).
Tuttavia, il laptop RTX 5070 attualmente ha ancora abbastanza potenza per eseguire quasi tutti i titoli con dettagli elevati o massimi nella risoluzione nativa di 2.560 x 1.440 pixel. Le cose si fanno difficili con titoli molto esigenti o poco ottimizzati come Hellblade 2, Star Wars Outlaws, Until Dawne Oblivion Remastered - qui, la soglia dei 40 FPS non viene superata. Come al solito, l'upscaling sotto forma di DLSS (4) e di Generazione di fotogrammi (Multi) opzionale fornisce un rimedio. Le capacità di quest'ultima in termini di frequenza dei fotogrammi si possono vedere, ad esempio, in Stalker 2 (vedere tabella).
| Performance rating - Percent | |
| Medion Erazer Beast 18 X1 MD62731 -1! | |
| MSI Vector 16 HX AI A2XWHG -1! | |
| Media della classe Gaming | |
| Media NVIDIA GeForce RTX 5070 Laptop | |
| MSI Katana 17 HX B14WGK | |
| Doom: The Dark Ages | |
| 2560x1440 Ultra Nightmare AA:T | |
| Medion Erazer Beast 18 X1 MD62731 | |
| MSI Vector 16 HX AI A2XWHG | |
| Media della classe Gaming (30.4 - 92.2, n=19, ultimi 2 anni) | |
| MSI Katana 17 HX B14WGK | |
| Media NVIDIA GeForce RTX 5070 Laptop (39.5 - 49.4, n=5) | |
| 2560x1440 Ultra Nightmare - DLSS Quality | |
| Medion Erazer Beast 18 X1 MD62731 | |
| MSI Vector 16 HX AI A2XWHG | |
| Media della classe Gaming (48 - 107.3, n=18, ultimi 2 anni) | |
| Media NVIDIA GeForce RTX 5070 Laptop (54.6 - 70, n=5) | |
| MSI Katana 17 HX B14WGK | |
| The Elder Scrolls IV Oblivion Remastered | |
| 2560x1440 Ultra Preset AA:T | |
| Medion Erazer Beast 18 X1 MD62731 | |
| MSI Vector 16 HX AI A2XWHG | |
| Media della classe Gaming (12.7 - 45.9, n=14, ultimi 2 anni) | |
| MSI Katana 17 HX B14WGK | |
| Media NVIDIA GeForce RTX 5070 Laptop (19.5 - 20.9, n=3) | |
| 2560x1440 Ultra Preset + Quality DLSS | |
| Medion Erazer Beast 18 X1 MD62731 | |
| MSI Vector 16 HX AI A2XWHG | |
| Media della classe Gaming (25.3 - 59.7, n=12, ultimi 2 anni) | |
| Media NVIDIA GeForce RTX 5070 Laptop (30.3 - 34, n=3) | |
| MSI Katana 17 HX B14WGK | |
| Kingdom Come Deliverance 2 | |
| 2560x1440 Ultra Preset | |
| Medion Erazer Beast 18 X1 MD62731 | |
| Media della classe Gaming (36.8 - 97.2, n=13, ultimi 2 anni) | |
| MSI Vector 16 HX AI A2XWHG | |
| Media NVIDIA GeForce RTX 5070 Laptop (42.6 - 52.1, n=3) | |
| MSI Katana 17 HX B14WGK | |
| 2560x1440 Ultra Preset + Quality DLSS | |
| Medion Erazer Beast 18 X1 MD62731 | |
| Media della classe Gaming (50.3 - 115.5, n=13, ultimi 2 anni) | |
| MSI Vector 16 HX AI A2XWHG | |
| Media NVIDIA GeForce RTX 5070 Laptop (58.5 - 71.5, n=3) | |
| MSI Katana 17 HX B14WGK | |
| Until Dawn | |
| 2560x1440 Ultra Preset | |
| Medion Erazer Beast 18 X1 MD62731 | |
| Media della classe Gaming (30.4 - 76.6, n=11, ultimi 2 anni) | |
| MSI Vector 16 HX AI A2XWHG | |
| Media NVIDIA GeForce RTX 5070 Laptop (35.4 - 44.4, n=2) | |
| MSI Katana 17 HX B14WGK | |
| 2560x1440 Ultra Preset + Quality DLSS + Ray Tracing | |
| Medion Erazer Beast 18 X1 MD62731 | |
| MSI Vector 16 HX AI A2XWHG | |
| Media della classe Gaming (39.5 - 86.3, n=10, ultimi 2 anni) | |
| Media NVIDIA GeForce RTX 5070 Laptop (46.7 - 57.8, n=2) | |
| MSI Katana 17 HX B14WGK | |
| Ghost of Tsushima | |
| 2560x1440 Very High Preset AA:T | |
| Medion Erazer Beast 18 X1 MD62731 | |
| MSI Vector 16 HX AI A2XWHG | |
| Media della classe Gaming (22.7 - 100.3, n=14, ultimi 2 anni) | |
| Media NVIDIA GeForce RTX 5070 Laptop (49.1 - 53.8, n=2) | |
| MSI Katana 17 HX B14WGK | |
| 2560x1440 Very High Preset + Quality DLSS | |
| Medion Erazer Beast 18 X1 MD62731 | |
| MSI Vector 16 HX AI A2XWHG | |
| Media della classe Gaming (55.2 - 105.2, n=11, ultimi 2 anni) | |
| Media NVIDIA GeForce RTX 5070 Laptop (66.5 - 74.6, n=2) | |
| MSI Katana 17 HX B14WGK | |
| Horizon Forbidden West | |
| 2560x1440 Very High Preset AA:T | |
| Medion Erazer Beast 18 X1 MD62731 | |
| MSI Vector 16 HX AI A2XWHG | |
| Media della classe Gaming (39.6 - 100.9, n=10, ultimi 2 anni) | |
| Media NVIDIA GeForce RTX 5070 Laptop (57.9 - 64, n=2) | |
| MSI Katana 17 HX B14WGK | |
| 2560x1440 Very High Preset + DLSS Quality | |
| Medion Erazer Beast 18 X1 MD62731 | |
| MSI Vector 16 HX AI A2XWHG | |
| Media della classe Gaming (58.4 - 116.6, n=8, ultimi 2 anni) | |
| Media NVIDIA GeForce RTX 5070 Laptop (70.3 - 81.3, n=2) | |
| MSI Katana 17 HX B14WGK | |
| Indiana Jones and the Great Circle - 2560x1440 Very Ultra Preset | |
| Media della classe Gaming (4.2 - 121.9, n=33, ultimi 2 anni) | |
| MSI Katana 17 HX B14WGK | |
| Media NVIDIA GeForce RTX 5070 Laptop (7.6 - 32.4, n=4) | |
| Final Fantasy XV Benchmark - 1920x1080 High Quality | |
| MSI Vector 16 HX AI A2XWHG | |
| Schenker XMG Pro 16 (E25) | |
| Media della classe Gaming (41 - 215, n=104, ultimi 2 anni) | |
| Media NVIDIA GeForce RTX 5070 Laptop (96 - 150.7, n=25) | |
| Asus ProArt P16 H7606WP | |
| Gigabyte Aero X16 1WH | |
| Strange Brigade - 1920x1080 ultra AA:ultra AF:16 | |
| Media della classe Gaming (76.3 - 456, n=94, ultimi 2 anni) | |
| Asus ProArt P16 H7606WP | |
| Media NVIDIA GeForce RTX 5070 Laptop (203 - 261, n=23) | |
| Gigabyte Aero X16 1WH | |
| Schenker XMG Pro 16 (E25) | |
| basso | medio | alto | ultra | QHD DLSS | QHD | |
|---|---|---|---|---|---|---|
| GTA V (2015) | 180.8 | 167.2 | 119 | 108.3 | ||
| Dota 2 Reborn (2015) | 199.1 | 170.8 | 161.7 | 149.3 | ||
| X-Plane 11.11 (2018) | 146.6 | 127.7 | 106.4 | |||
| Baldur's Gate 3 (2023) | 127.2 | 123.8 | 101.3 | 82.5 | ||
| Cyberpunk 2077 (2023) | 126.8 | 113.8 | 101.5 | 64.5 | ||
| Counter-Strike 2 (2023) | 222 | 170.4 | 156.5 | 115.4 | ||
| Prince of Persia The Lost Crown (2024) | 356 | 356 | 356 | 352 | ||
| Helldivers 2 (2024) | 102.1 | 101.2 | 97.4 | 81.3 | ||
| Dragon's Dogma 2 (2024) | 66 | 60.2 | ||||
| Horizon Forbidden West (2024) | 91.1 | 74.9 | 73.2 | 70.3 | 57.9 | |
| Ghost of Tsushima (2024) | 84.5 | 80.4 | 64.9 | 66.5 | 49.1 | |
| Senua's Saga Hellblade 2 (2024) | 64.1 | 46.3 | 49.4 | 31.7 | ||
| Star Wars Outlaws (2024) | 65.4 | 58.5 | 49.4 | 48.5 | 35.1 | |
| Space Marine 2 (2024) | 64.7 | 61.6 | 58.9 | 58.5 | 54.7 | |
| Until Dawn (2024) | 76.8 | 59.6 | 48.8 | 46.7 | 35.4 | |
| Stalker 2 (2024) | 64 | 54.1 | 47.1 | 74.1 | 36 | |
| Indiana Jones and the Great Circle (2024) | 60 | 42.3 | 32.4 | |||
| Kingdom Come Deliverance 2 (2025) | 111.5 | 91.4 | 67.6 | 61.5 | 45.5 | |
| Civilization 7 (2025) | 154.1 | 142.7 | 97.9 | |||
| The Elder Scrolls IV Oblivion Remastered (2025) | 72.8 | 62.3 | 30.7 | 32 | 20.9 | |
| Doom: The Dark Ages (2025) | 69.6 | 66 | 64.8 | 59.9 | 45.4 |
Abbiamo testato se le prestazioni della GPU rimangono costanti per un periodo più lungo con Cyberpunk 2077: Katana 17 è in grado di produrre FPS stabili senza cali.
Cyberpunk 2077 Ultra settings FPS chart
Emissioni
Emissioni di rumore
Mentre il dispositivo da 17 pollici rimane ragionevolmente silenzioso in modalità idle, da 31 a 34 dB(A), le ventole del case diventano piuttosto rumorose sotto carico, da 50 a 59 dB(A). Tutti i concorrenti erano più silenziosi in modalità 3D.
Rumorosità
| Idle |
| 31 / 32 / 34 dB(A) |
| Sotto carico |
| 50 / 59 dB(A) |
 | ||
30 dB silenzioso 40 dB(A) udibile 50 dB(A) rumoroso |
||
min: | ||
| MSI Katana 17 HX B14WGK i7-14650HX, GeForce RTX 5070 Laptop | Gigabyte Aero X16 1WH Ryzen AI 7 350, GeForce RTX 5070 Laptop | Asus ProArt P16 H7606WP Ryzen AI 9 HX 370, GeForce RTX 5070 Laptop | Schenker XMG Pro 16 (E25) Ultra 9 275HX, GeForce RTX 5070 Ti Laptop | MSI Vector 16 HX AI A2XWHG Ultra 7 255HX, GeForce RTX 5070 Ti Laptop | |
|---|---|---|---|---|---|
| Noise | 21% | 10% | 14% | 3% | |
| off /ambiente * (dB) | 25 | 23.9 4% | 23.5 6% | 23.3 7% | 25 -0% |
| Idle Minimum * (dB) | 31 | 23.9 23% | 26.7 14% | 25 19% | 33 -6% |
| Idle Average * (dB) | 32 | 23.9 25% | 26.7 17% | 25 22% | 34 -6% |
| Idle Maximum * (dB) | 34 | 23.9 30% | 31.1 9% | 25 26% | 38 -12% |
| Load Average * (dB) | 50 | 33.2 34% | 44.8 10% | 45.5 9% | 46 8% |
| Cyberpunk 2077 ultra * (dB) | 58 | 50.2 13% | 53.7 7% | 53.3 8% | 47 19% |
| Load Maximum * (dB) | 59 | 50.2 15% | 53.7 9% | 53.3 10% | 49 17% |
* ... Meglio usare valori piccoli
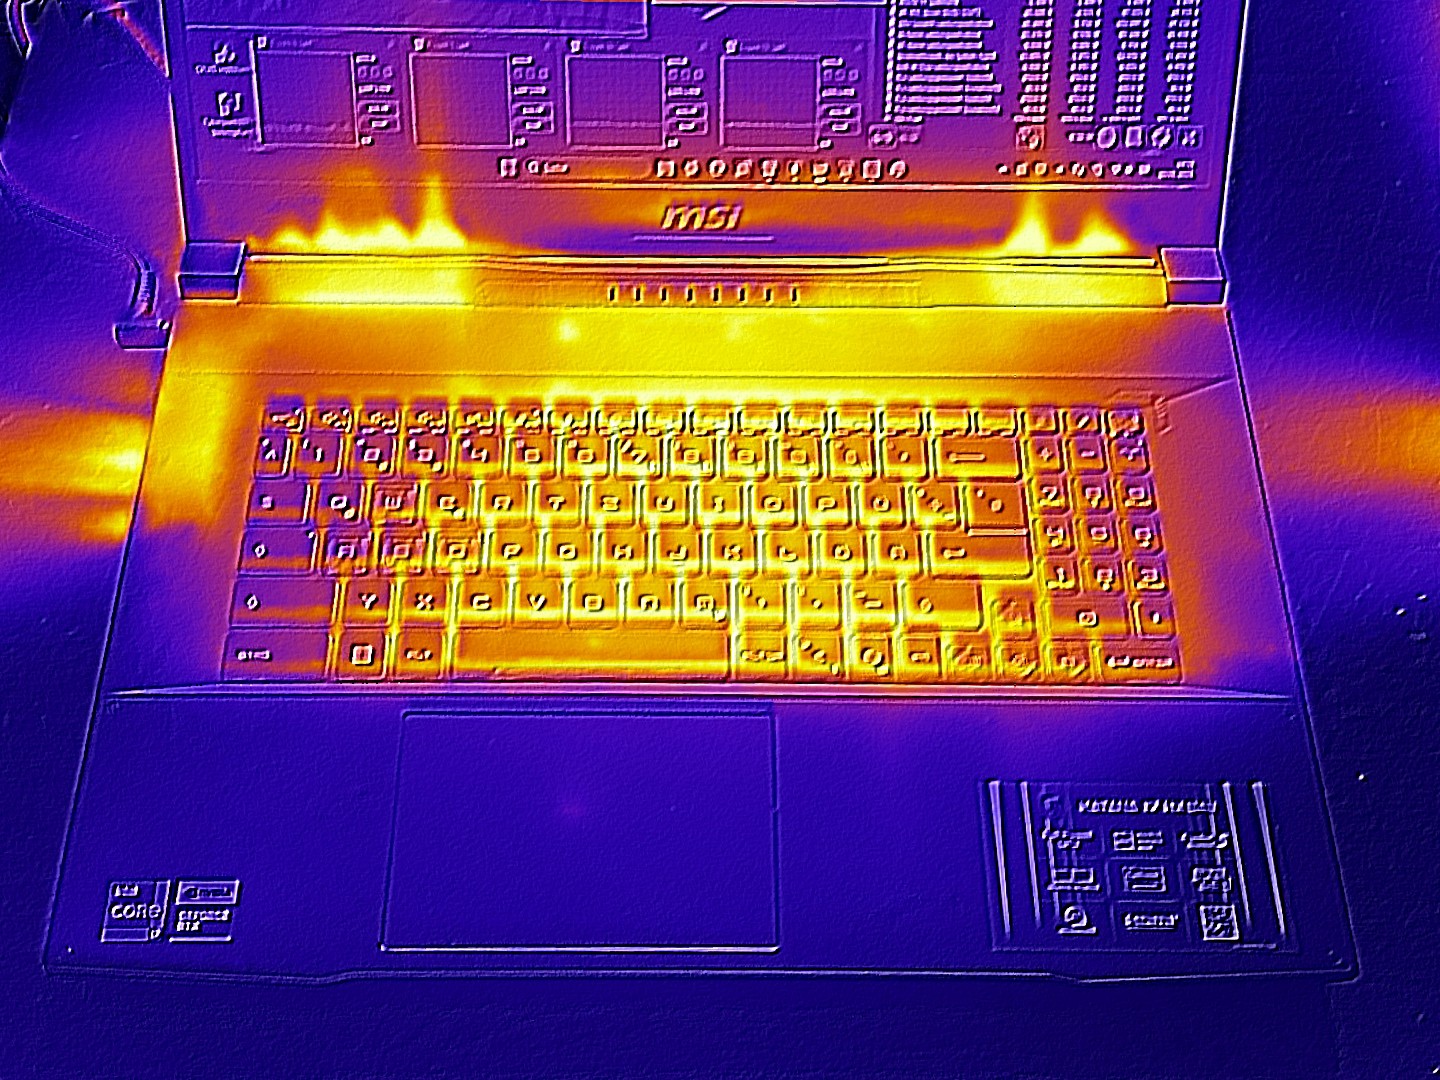
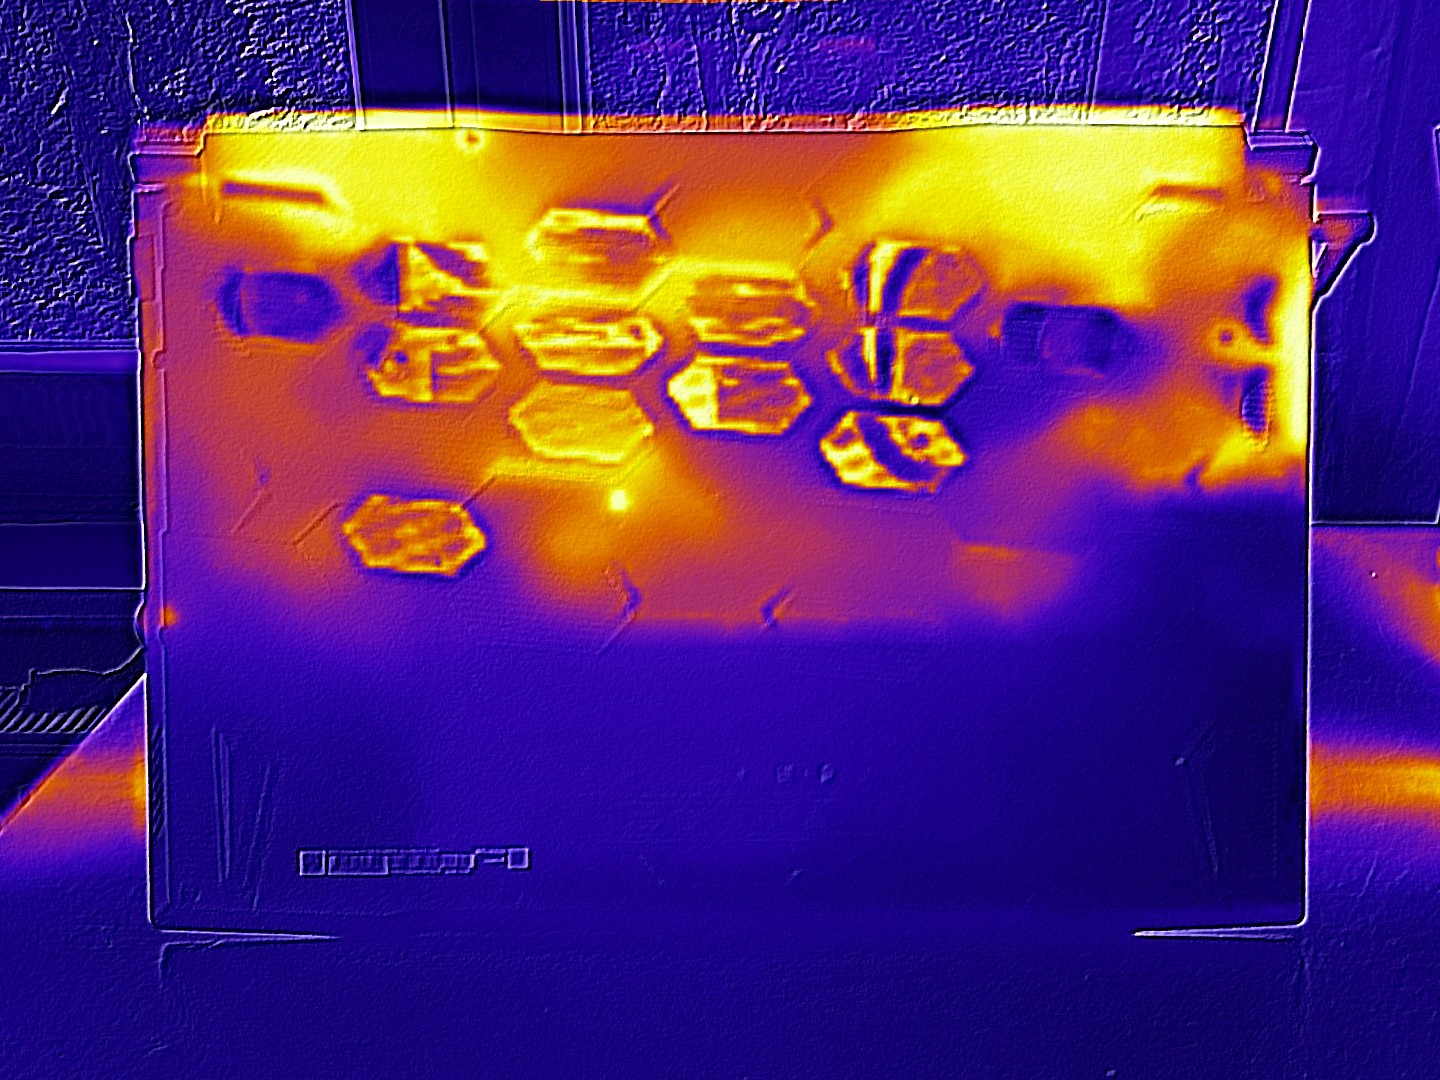
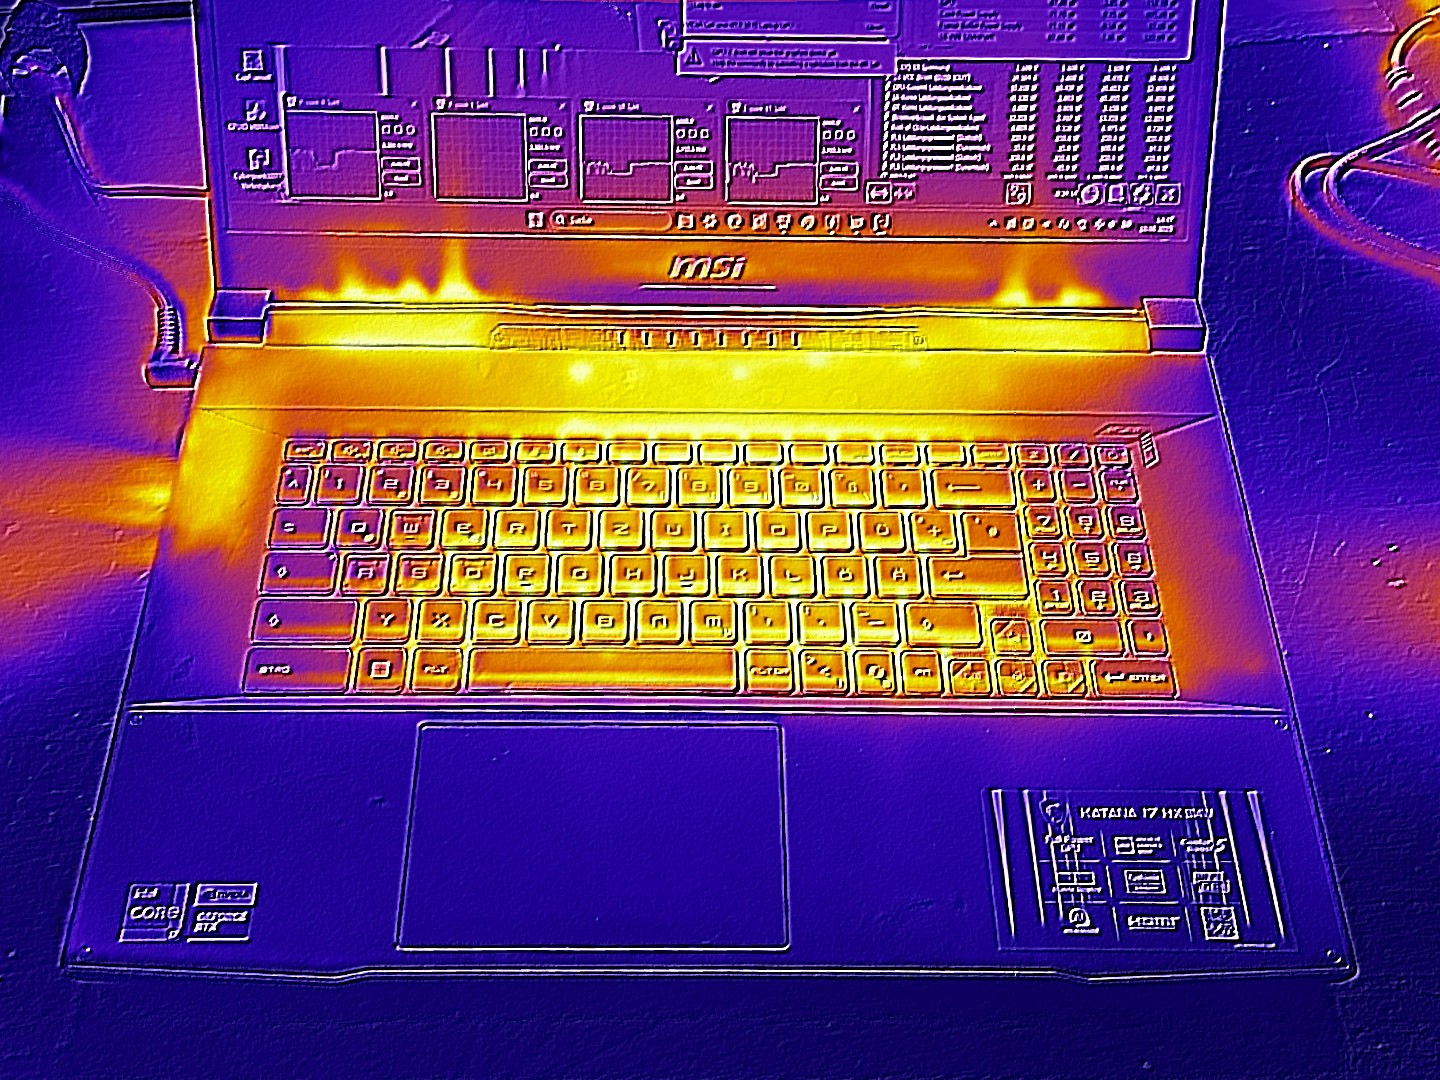
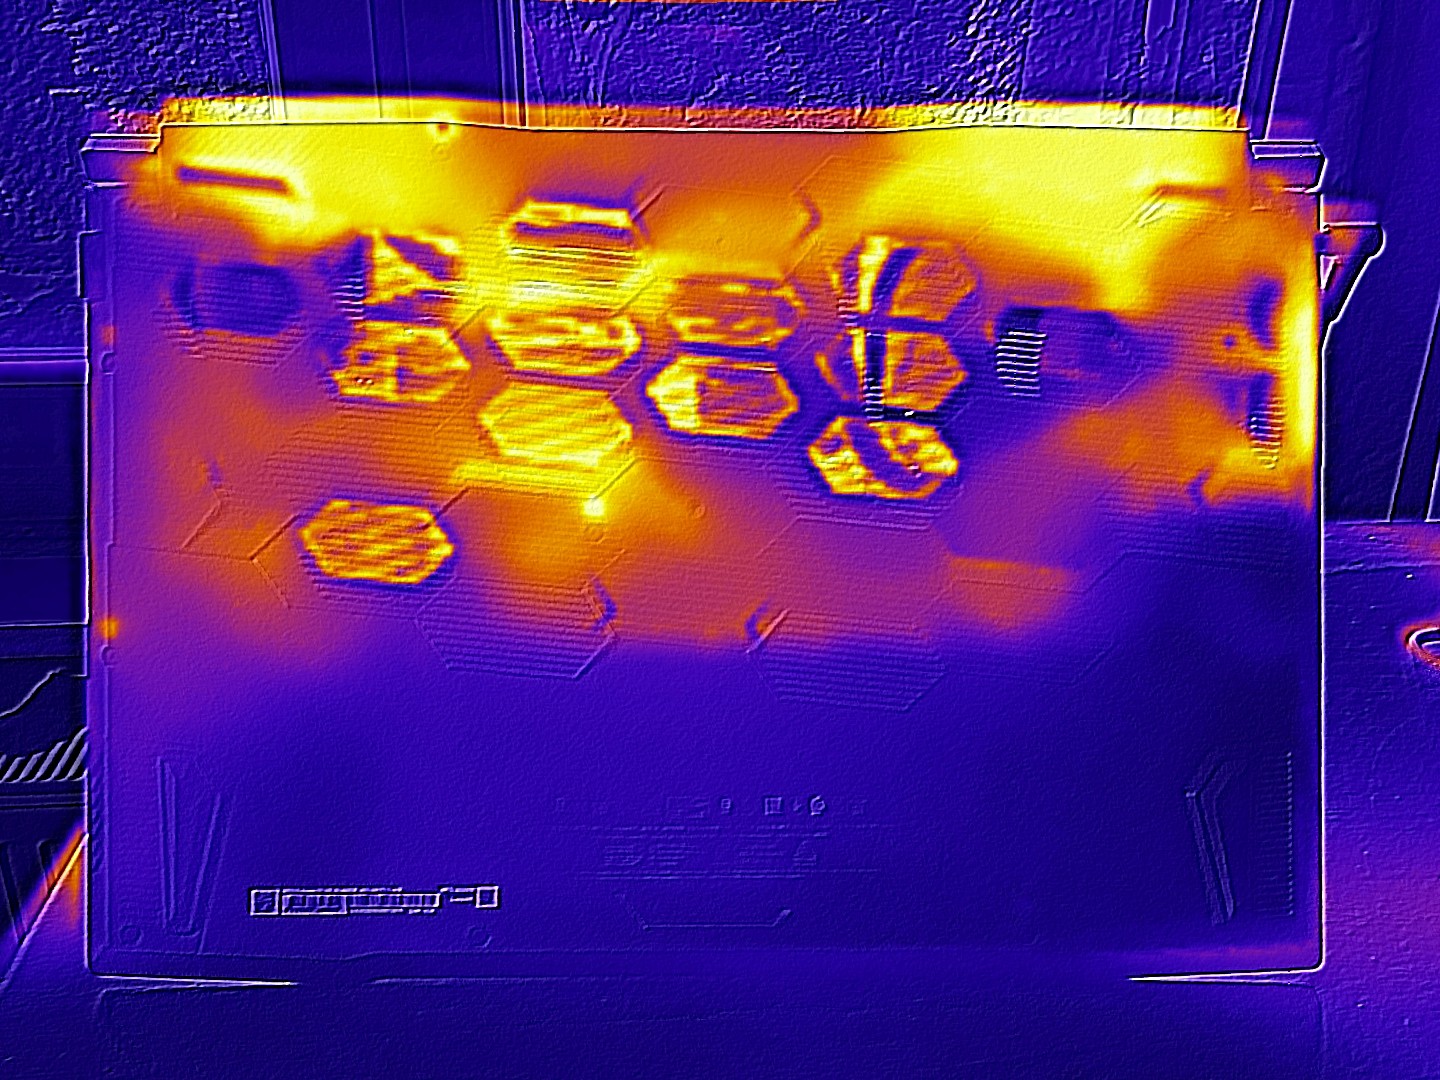
Temperatura
Con un massimo di 52 °C nella parte superiore e un massimo di 56 °C nella parte inferiore del case, il Katana 17 diventa più caldo dei suoi concorrenti in modalità 3D. La situazione è notevolmente più rilassata in modalità idle, con una media di 29 °C.
(-) La temperatura massima sul lato superiore è di 52 °C / 126 F, rispetto alla media di 40.4 °C / 105 F, che varia da 21.2 a 68.8 °C per questa classe Gaming.
(-) Il lato inferiore si riscalda fino ad un massimo di 56 °C / 133 F, rispetto alla media di 43.2 °C / 110 F
(+) In idle, la temperatura media del lato superiore è di 29.2 °C / 85 F, rispetto alla media deld ispositivo di 33.9 °C / 93 F.
(-) 3: The average temperature for the upper side is 42.7 °C / 109 F, compared to the average of 33.9 °C / 93 F for the class Gaming.
(±) I poggiapolsi e il touchpad possono diventare molto caldi al tatto con un massimo di 36 °C / 96.8 F.
(-) La temperatura media della zona del palmo della mano di dispositivi simili e'stata di 28.8 °C / 83.8 F (-7.2 °C / -13 F).
| MSI Katana 17 HX B14WGK Intel Core i7-14650HX, NVIDIA GeForce RTX 5070 Laptop | Gigabyte Aero X16 1WH AMD Ryzen AI 7 350, NVIDIA GeForce RTX 5070 Laptop | Asus ProArt P16 H7606WP AMD Ryzen AI 9 HX 370, NVIDIA GeForce RTX 5070 Laptop | Schenker XMG Pro 16 (E25) Intel Core Ultra 9 275HX, NVIDIA GeForce RTX 5070 Ti Laptop | MSI Vector 16 HX AI A2XWHG Intel Core Ultra 7 255HX, NVIDIA GeForce RTX 5070 Ti Laptop | |
|---|---|---|---|---|---|
| Heat | 14% | 16% | -169% | 4% | |
| Maximum Upper Side * (°C) | 52 | 43.3 17% | 47 10% | 43.2 17% | 53 -2% |
| Maximum Bottom * (°C) | 56 | 50.3 10% | 47.4 15% | 46 18% | 52 7% |
| Idle Upper Side * (°C) | 33 | 27 18% | 26.1 21% | 27.7 16% | 33 -0% |
| Idle Bottom * (°C) | 32 | 28.3 12% | 26.4 17% | 264 -725% | 29 9% |
* ... Meglio usare valori piccoli
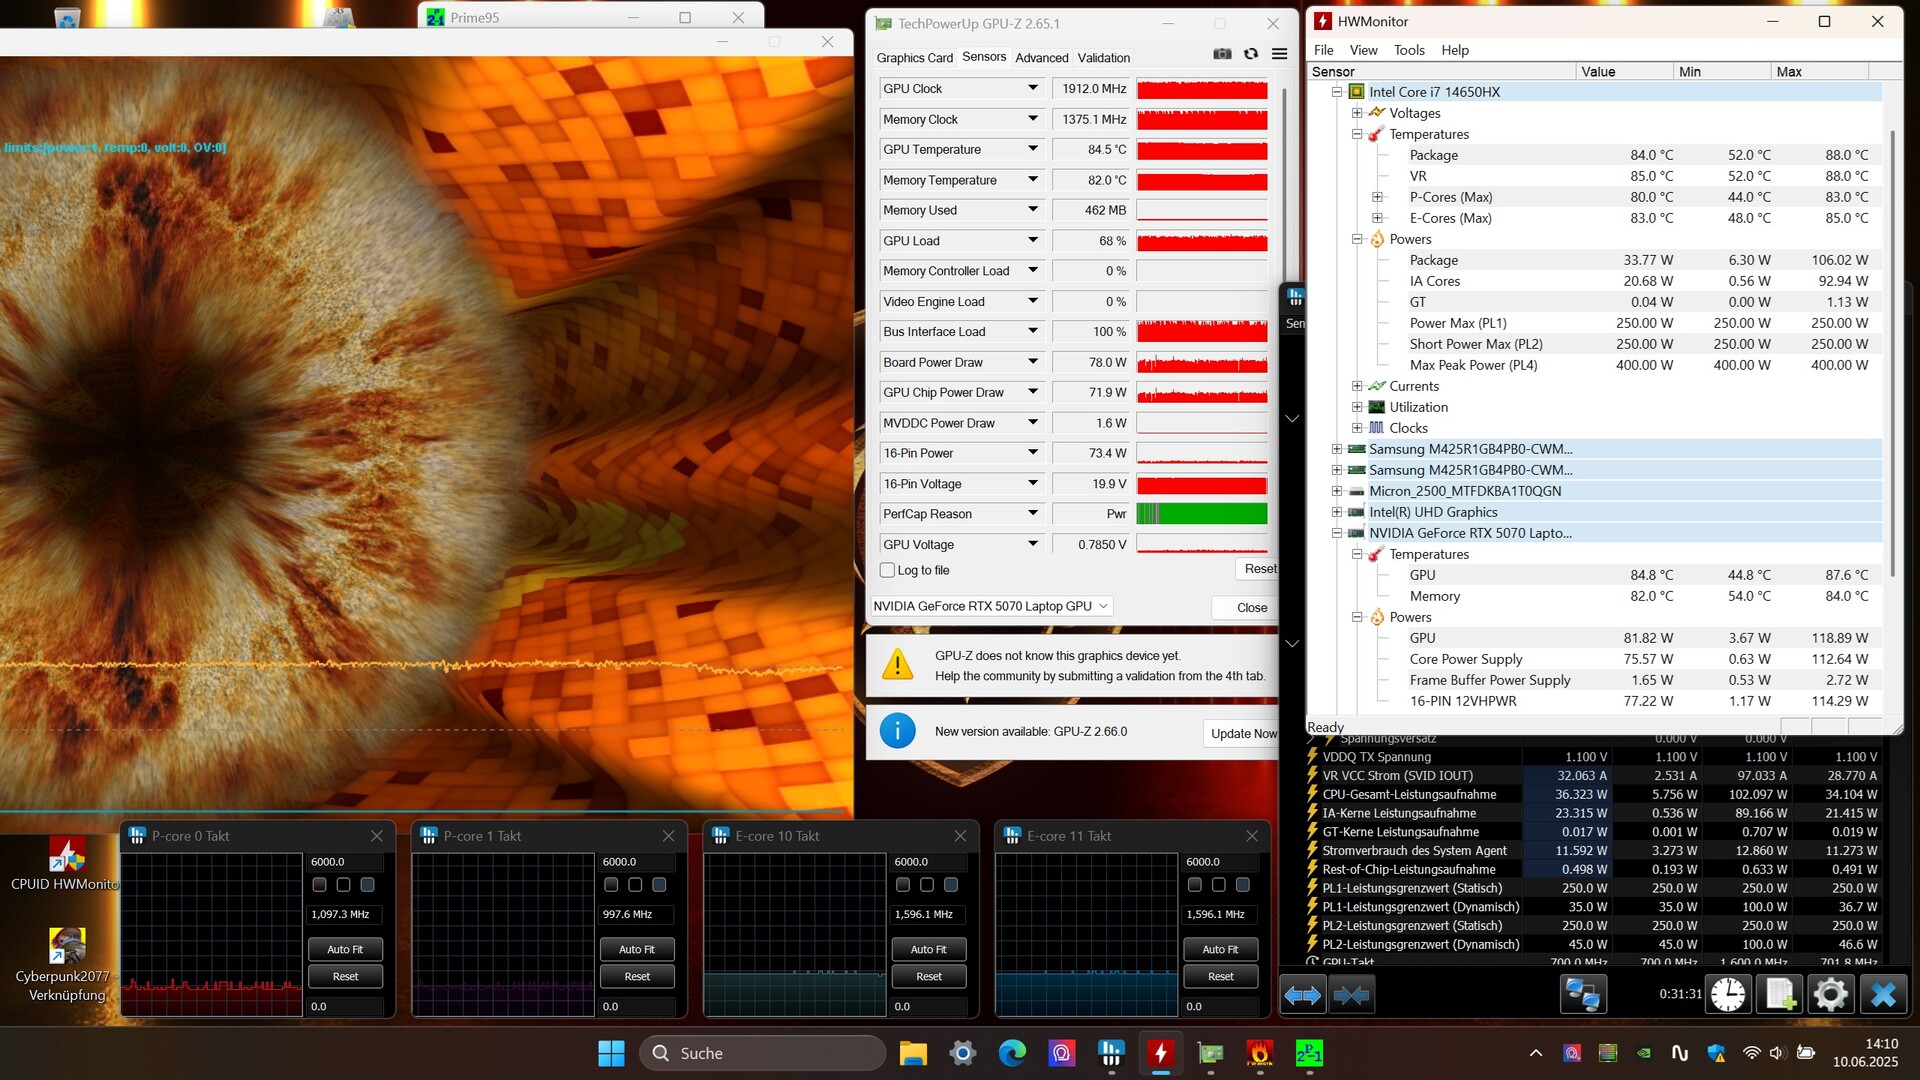
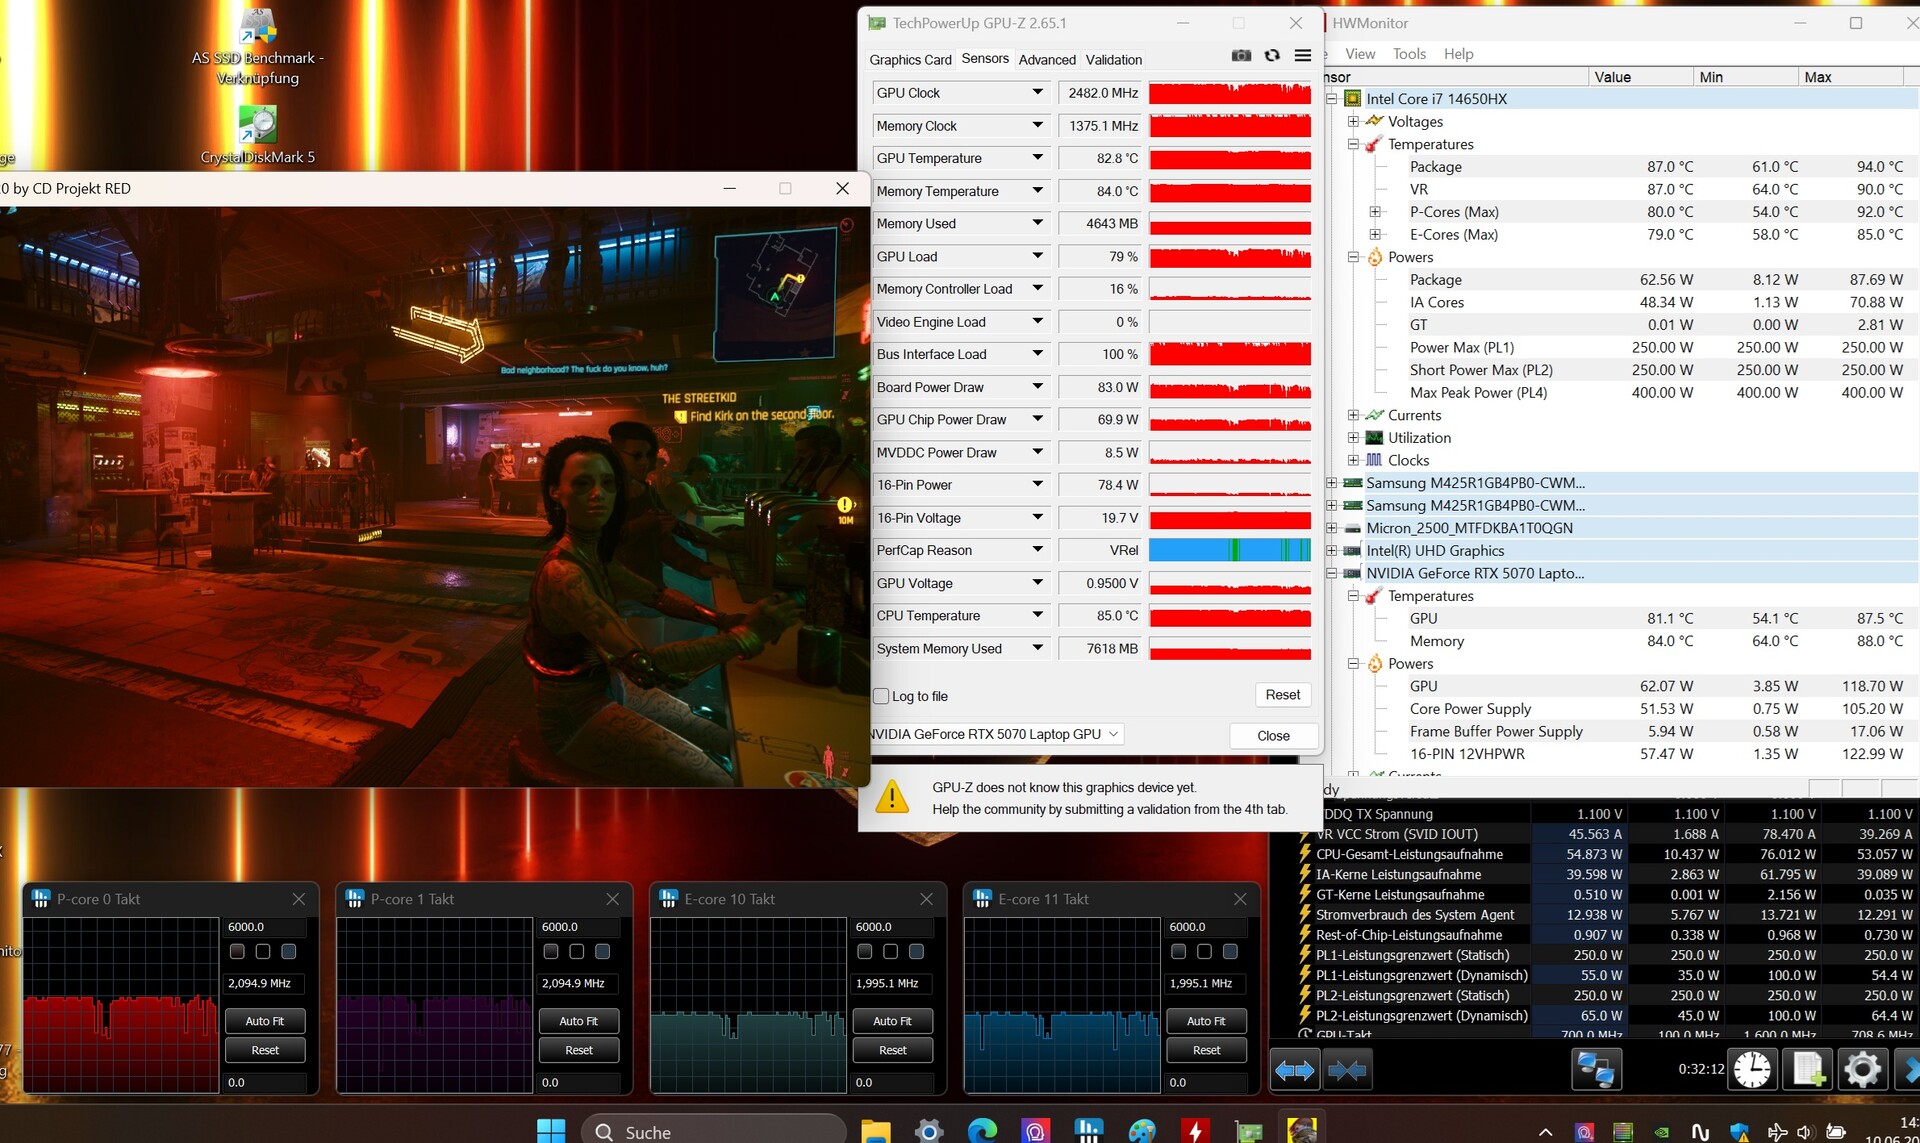
Test da sforzo
Nel nostro test di stress con gli strumenti Furmark e Prime95, la CPU e la GPU si sono stabilizzate a circa 84 °C dopo un po' - un valore ragionevole. Cyberpunk 2077 ha generato temperature simili.
Altoparlanti
Purtroppo, la qualità del suono lascia molto a desiderare. I bassi, in particolare, sono molto deboli. La maggior parte dei concorrenti ha prestazioni migliori in termini di suono.
MSI Katana 17 HX B14WGK analisi audio
(+) | gli altoparlanti sono relativamente potenti (84 dB)
Bassi 100 - 315 Hz
(-) | quasi nessun basso - in media 19% inferiori alla media
(±) | la linearità dei bassi è media (10.6% delta rispetto alla precedente frequenza)
Medi 400 - 2000 Hz
(±) | medi elevati - circa 8.7% superiore alla media
(±) | linearità dei medi adeguata (7.5% delta rispetto alla precedente frequenza)
Alti 2 - 16 kHz
(+) | Alti bilanciati - appena 4.6% dalla media
(±) | la linearità degli alti è media (9.7% delta rispetto alla precedente frequenza)
Nel complesso 100 - 16.000 Hz
(±) | la linearità complessiva del suono è media (20.6% di differenza rispetto alla media
Rispetto alla stessa classe
» 74% di tutti i dispositivi testati in questa classe è stato migliore, 5% simile, 21% peggiore
» Il migliore ha avuto un delta di 6%, medio di 18%, peggiore di 132%
Rispetto a tutti i dispositivi testati
» 55% di tutti i dispositivi testati in questa classe è stato migliore, 8% similare, 37% peggiore
» Il migliore ha avuto un delta di 4%, medio di 24%, peggiore di 134%
MSI Vector 16 HX AI A2XWHG analisi audio
(+) | gli altoparlanti sono relativamente potenti (86 dB)
Bassi 100 - 315 Hz
(±) | bassi ridotti - in media 12.3% inferiori alla media
(±) | la linearità dei bassi è media (8.5% delta rispetto alla precedente frequenza)
Medi 400 - 2000 Hz
(±) | medi elevati - circa 9.9% superiore alla media
(+) | medi lineari (6.8% delta rispetto alla precedente frequenza)
Alti 2 - 16 kHz
(+) | Alti bilanciati - appena 1.8% dalla media
(+) | alti lineari (2.9% delta rispetto alla precedente frequenza)
Nel complesso 100 - 16.000 Hz
(±) | la linearità complessiva del suono è media (15.8% di differenza rispetto alla media
Rispetto alla stessa classe
» 37% di tutti i dispositivi testati in questa classe è stato migliore, 7% simile, 56% peggiore
» Il migliore ha avuto un delta di 6%, medio di 18%, peggiore di 132%
Rispetto a tutti i dispositivi testati
» 24% di tutti i dispositivi testati in questa classe è stato migliore, 5% similare, 71% peggiore
» Il migliore ha avuto un delta di 4%, medio di 24%, peggiore di 134%
Gestione dell'energia
Consumo di energia
Con 10-24 watt in modalità idle e 126-227 watt sotto carico, il consumo energetico è tipico di un portatile da gioco di questa classe di prestazioni, anche se l'Aero 16X con il suo Ryzen AI 7 350 è ancora più economico.
| Off / Standby | |
| Idle | |
| Sotto carico |
|
Leggenda:
min: | |
| MSI Katana 17 HX B14WGK i7-14650HX, GeForce RTX 5070 Laptop | Gigabyte Aero X16 1WH Ryzen AI 7 350, GeForce RTX 5070 Laptop | Asus ProArt P16 H7606WP Ryzen AI 9 HX 370, GeForce RTX 5070 Laptop | Schenker XMG Pro 16 (E25) Ultra 9 275HX, GeForce RTX 5070 Ti Laptop | MSI Vector 16 HX AI A2XWHG Ultra 7 255HX, GeForce RTX 5070 Ti Laptop | Media della classe Gaming | |
|---|---|---|---|---|---|---|
| Power Consumption | 37% | 17% | -10% | -9% | -13% | |
| Idle Minimum * (Watt) | 9.7 | 5.8 40% | 9.9 -2% | 11.7 -21% | 7.1 27% | 13.3 ? -37% |
| Idle Average * (Watt) | 15 | 10.9 27% | 13.6 9% | 16.6 -11% | 15.9 -6% | 19 ? -27% |
| Idle Maximum * (Watt) | 23.7 | 11.2 53% | 14 41% | 17.1 28% | 29.5 -24% | 24.5 ? -3% |
| Load Average * (Watt) | 126 | 91.3 28% | 93.8 26% | 122.4 3% | 124 2% | 108.1 ? 14% |
| Cyberpunk 2077 ultra external monitor * (Watt) | 202 | 117.9 42% | 158.3 22% | 241 -19% | 217 -7% | |
| Cyberpunk 2077 ultra * (Watt) | 205 | 123.8 40% | 162.1 21% | 245 -20% | 222 -8% | |
| Load Maximum * (Watt) | 227 | 155.3 32% | 229 -1% | 291.5 -28% | 336 -48% | 254 ? -12% |
* ... Meglio usare valori piccoli
Power consumption Cyberpunk / Stress test
Power consumption with the external monitor
Durata della batteria
Non dovrebbe avere grandi pretese sulla durata della batteria. Nel nostro test WLAN (con luminosità ridotta a 150 cd/m²), la batteria da 75 Wh è durata solo circa 5 ore. In confronto, la concorrenza raggiunge le 7-9 ore.
| MSI Katana 17 HX B14WGK i7-14650HX, GeForce RTX 5070 Laptop, 75 Wh | Gigabyte Aero X16 1WH Ryzen AI 7 350, GeForce RTX 5070 Laptop, 76 Wh | Asus ProArt P16 H7606WP Ryzen AI 9 HX 370, GeForce RTX 5070 Laptop, 90 Wh | Schenker XMG Pro 16 (E25) Ultra 9 275HX, GeForce RTX 5070 Ti Laptop, 99.8 Wh | MSI Vector 16 HX AI A2XWHG Ultra 7 255HX, GeForce RTX 5070 Ti Laptop, 90 Wh | Media della classe Gaming | |
|---|---|---|---|---|---|---|
| Autonomia della batteria | ||||||
| WiFi v1.3 (h) | 5.1 | 8.6 69% | 9.2 80% | 9.1 78% | 7 37% | 7.01 ? 37% |
Valutazione complessiva di Notebookcheck
Con Katana 17 HX B14WGK, MSI ha esagerato sotto molti aspetti, rendendo difficile per il gamer da 17 pollici reggere il confronto con la concorrenza.
MSI Katana 17 HX B14WGK
- 06/23/2025 v8
Florian Glaser
 Total Sustainability Score:
 Possible competitors comparison
Immagine | Modello | Prezzo | Peso | Altezza | Schermo |
|---|---|---|---|---|---|
1. 77.3%  | MSI Katana 17 HX B14WGK Intel Core i7-14650HX ⎘ NVIDIA GeForce RTX 5070 Laptop ⎘ 16 GB Memoria, 1024 GB SSD | Amazon: Prezzo di listino: 1800 EUR | 2.7 kg | 28 mm | 17.30" 2560x1440 170 PPI IPS |
2. 83.7%  | Gigabyte Aero X16 1WH AMD Ryzen AI 7 350 ⎘ NVIDIA GeForce RTX 5070 Laptop ⎘ 32 GB Memoria, 1024 GB SSD | Amazon: Prezzo di listino: 1799€ | 2 kg | 19.9 mm | 16.00" 2560x1600 189 PPI IPS |
3. 89.1%  | Asus ProArt P16 H7606WP AMD Ryzen AI 9 HX 370 ⎘ NVIDIA GeForce RTX 5070 Laptop ⎘ 64 GB Memoria, 2048 GB SSD | Amazon: 1. $2,249.99 HIDevolution [2025] ASUS Pro... 2. $2,979.99 ASUS ProArt P16 Creator Lapt... 3. $2,999.99 ASUS ProArt P16 Creator Lapt... Prezzo di listino: 3399€ | 1.8 kg | 17.3 mm | 16.00" 2880x1800 212 PPI OLED |
4. 87.4%  | Schenker XMG Pro 16 (E25) Intel Core Ultra 9 275HX ⎘ NVIDIA GeForce RTX 5070 Ti Laptop ⎘ 32 GB Memoria, 1024 GB SSD | Amazon: 1. $22.79 Very Best of Michael Schenke... Prezzo di listino: 2480€ | 2.5 kg | 26.5 mm | 16.00" 2560x1600 189 PPI IPS |
5. 84%  | MSI Vector 16 HX AI A2XWHG Intel Core Ultra 7 255HX ⎘ NVIDIA GeForce RTX 5070 Ti Laptop ⎘ 16 GB Memoria, 512 GB SSD | Amazon: Prezzo di listino: 2000 EUR | 2.6 kg | 28.6 mm | 16.00" 2560x1600 189 PPI IPS |
Transparency
La selezione dei dispositivi da recensire viene effettuata dalla nostra redazione. Il campione di prova è stato fornito all'autore come prestito dal produttore o dal rivenditore ai fini di questa recensione. L'istituto di credito non ha avuto alcuna influenza su questa recensione, né il produttore ne ha ricevuto una copia prima della pubblicazione. Non vi era alcun obbligo di pubblicare questa recensione. In quanto società mediatica indipendente, Notebookcheck non è soggetta all'autorità di produttori, rivenditori o editori.
Ecco come Notebookcheck esegue i test
Ogni anno, Notebookcheck esamina in modo indipendente centinaia di laptop e smartphone utilizzando procedure standardizzate per garantire che tutti i risultati siano comparabili. Da circa 20 anni sviluppiamo continuamente i nostri metodi di prova e nel frattempo stabiliamo gli standard di settore. Nei nostri laboratori di prova, tecnici ed editori esperti utilizzano apparecchiature di misurazione di alta qualità. Questi test comportano un processo di validazione in più fasi. Il nostro complesso sistema di valutazione si basa su centinaia di misurazioni e parametri di riferimento ben fondati, che mantengono l'obiettività.