Verdetto - La Bestia 18 X1 è buona, ma con margini di miglioramento
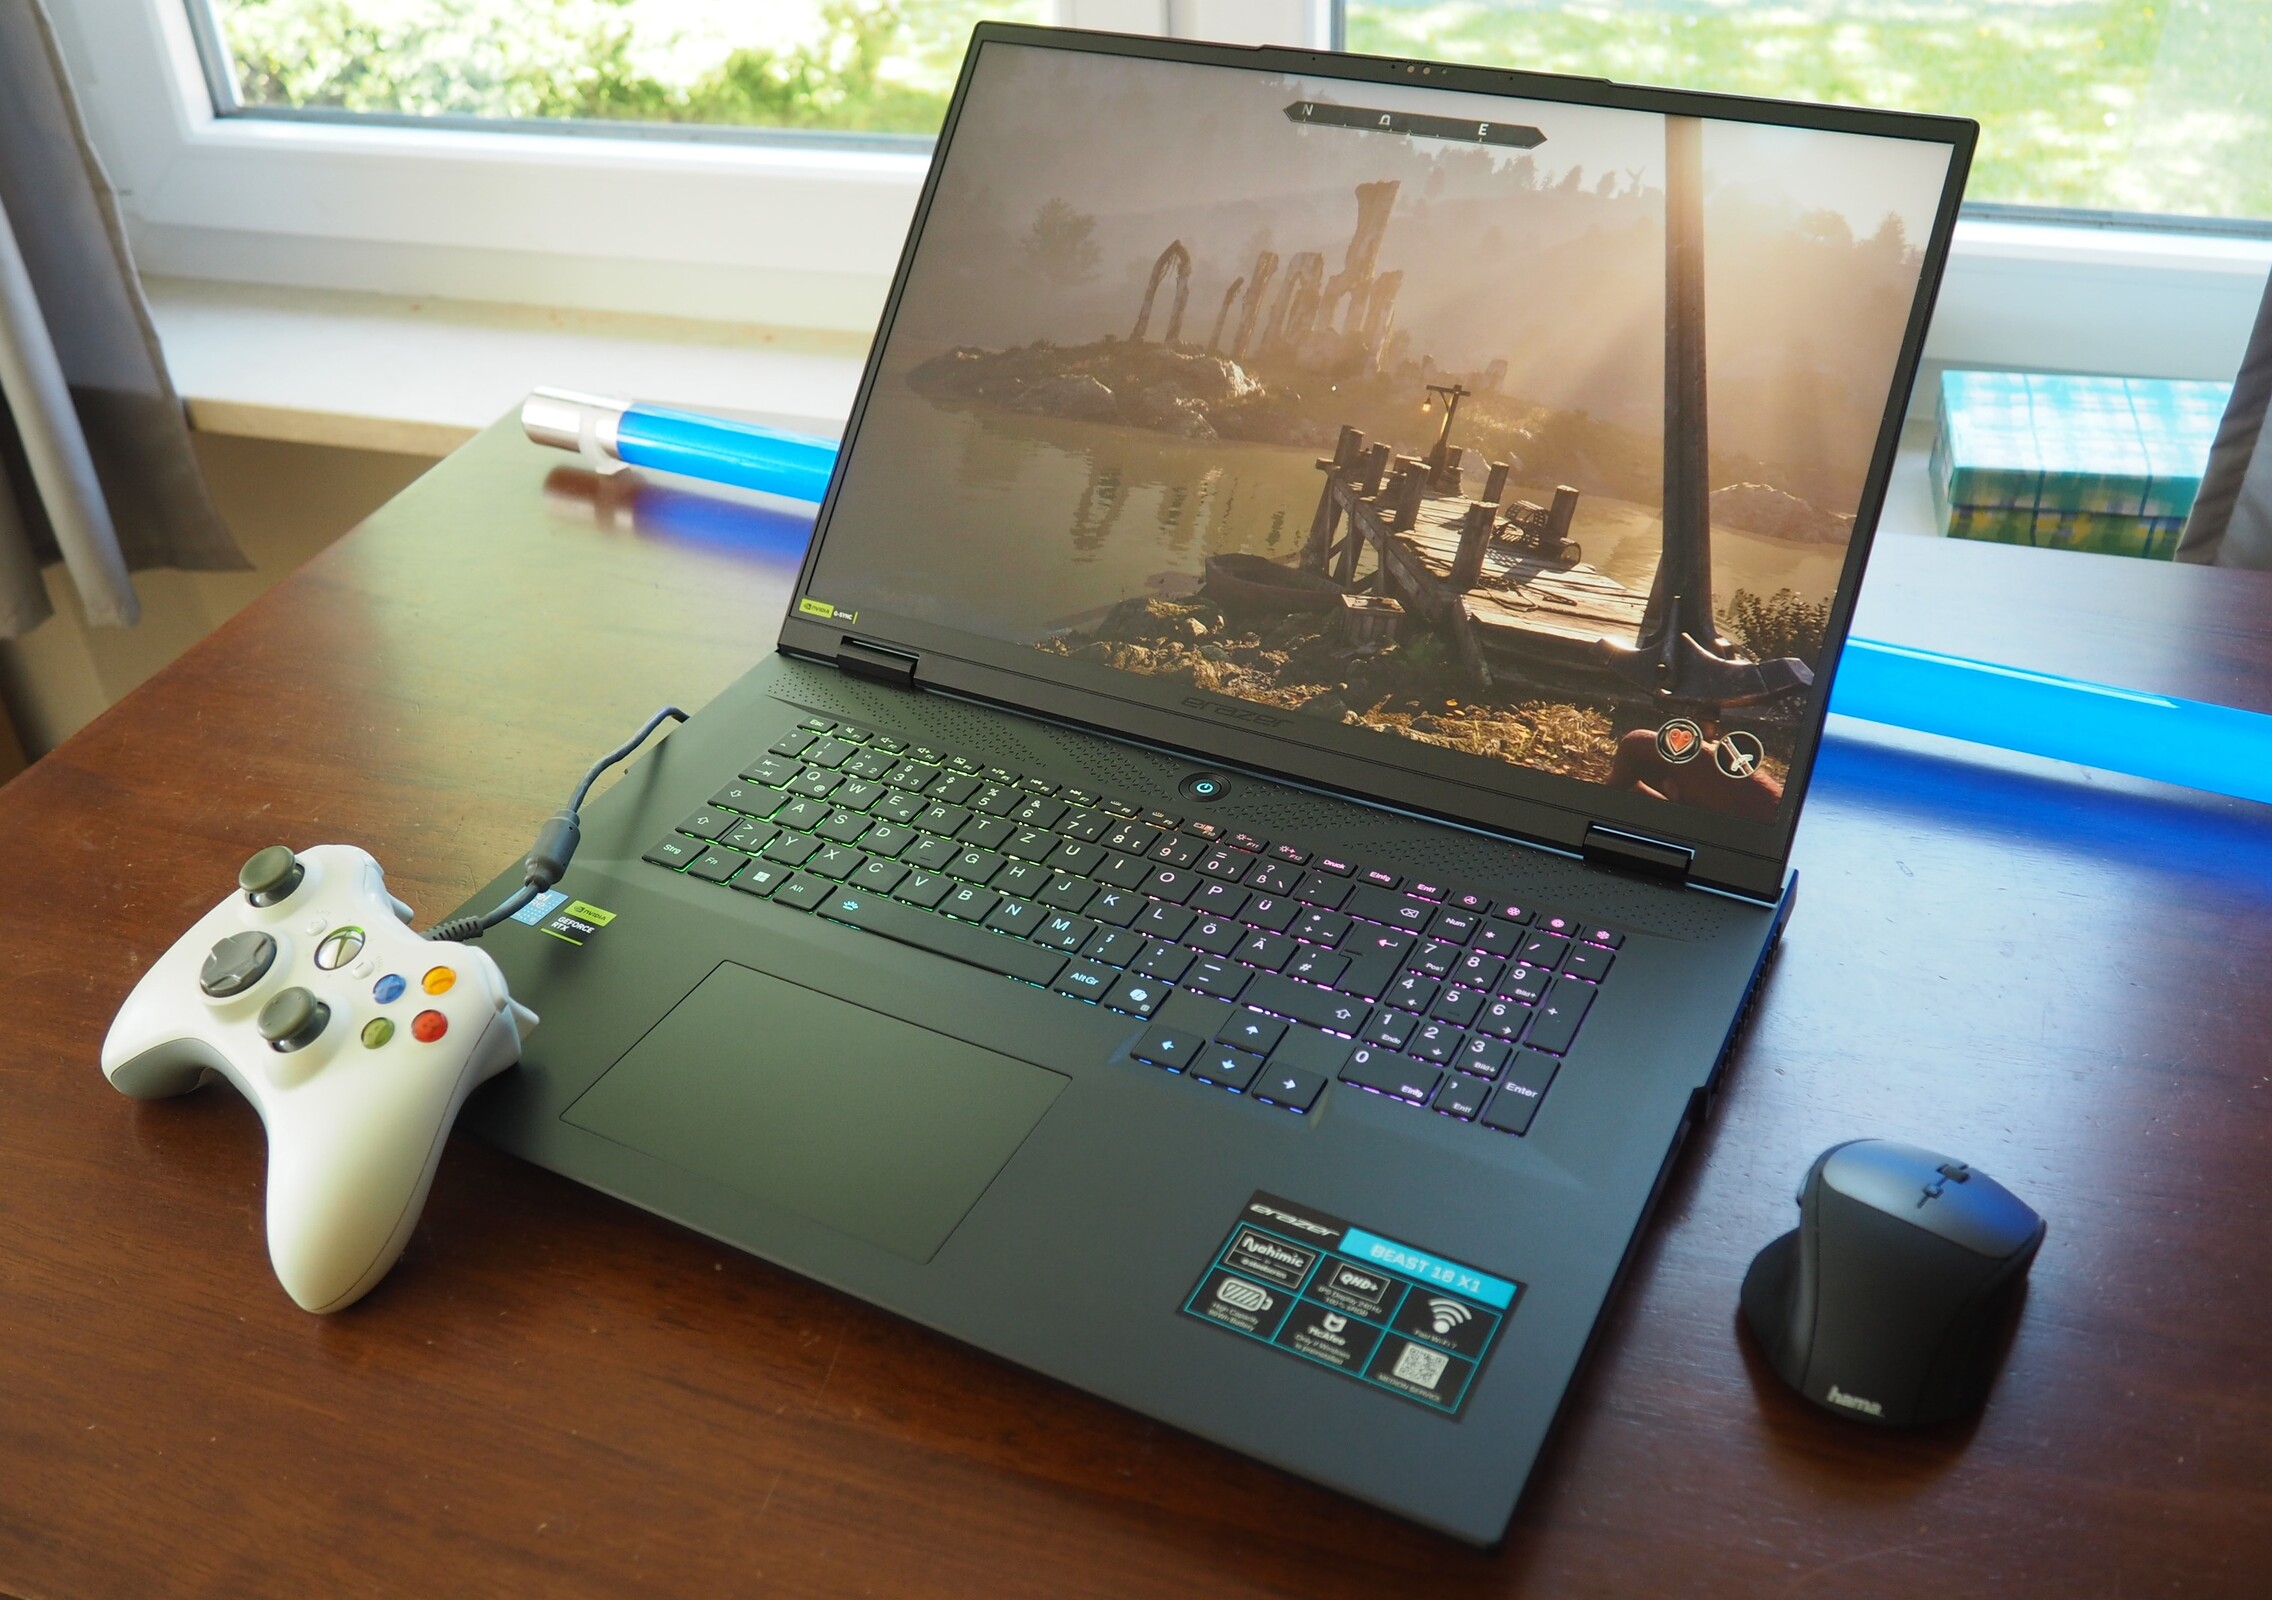
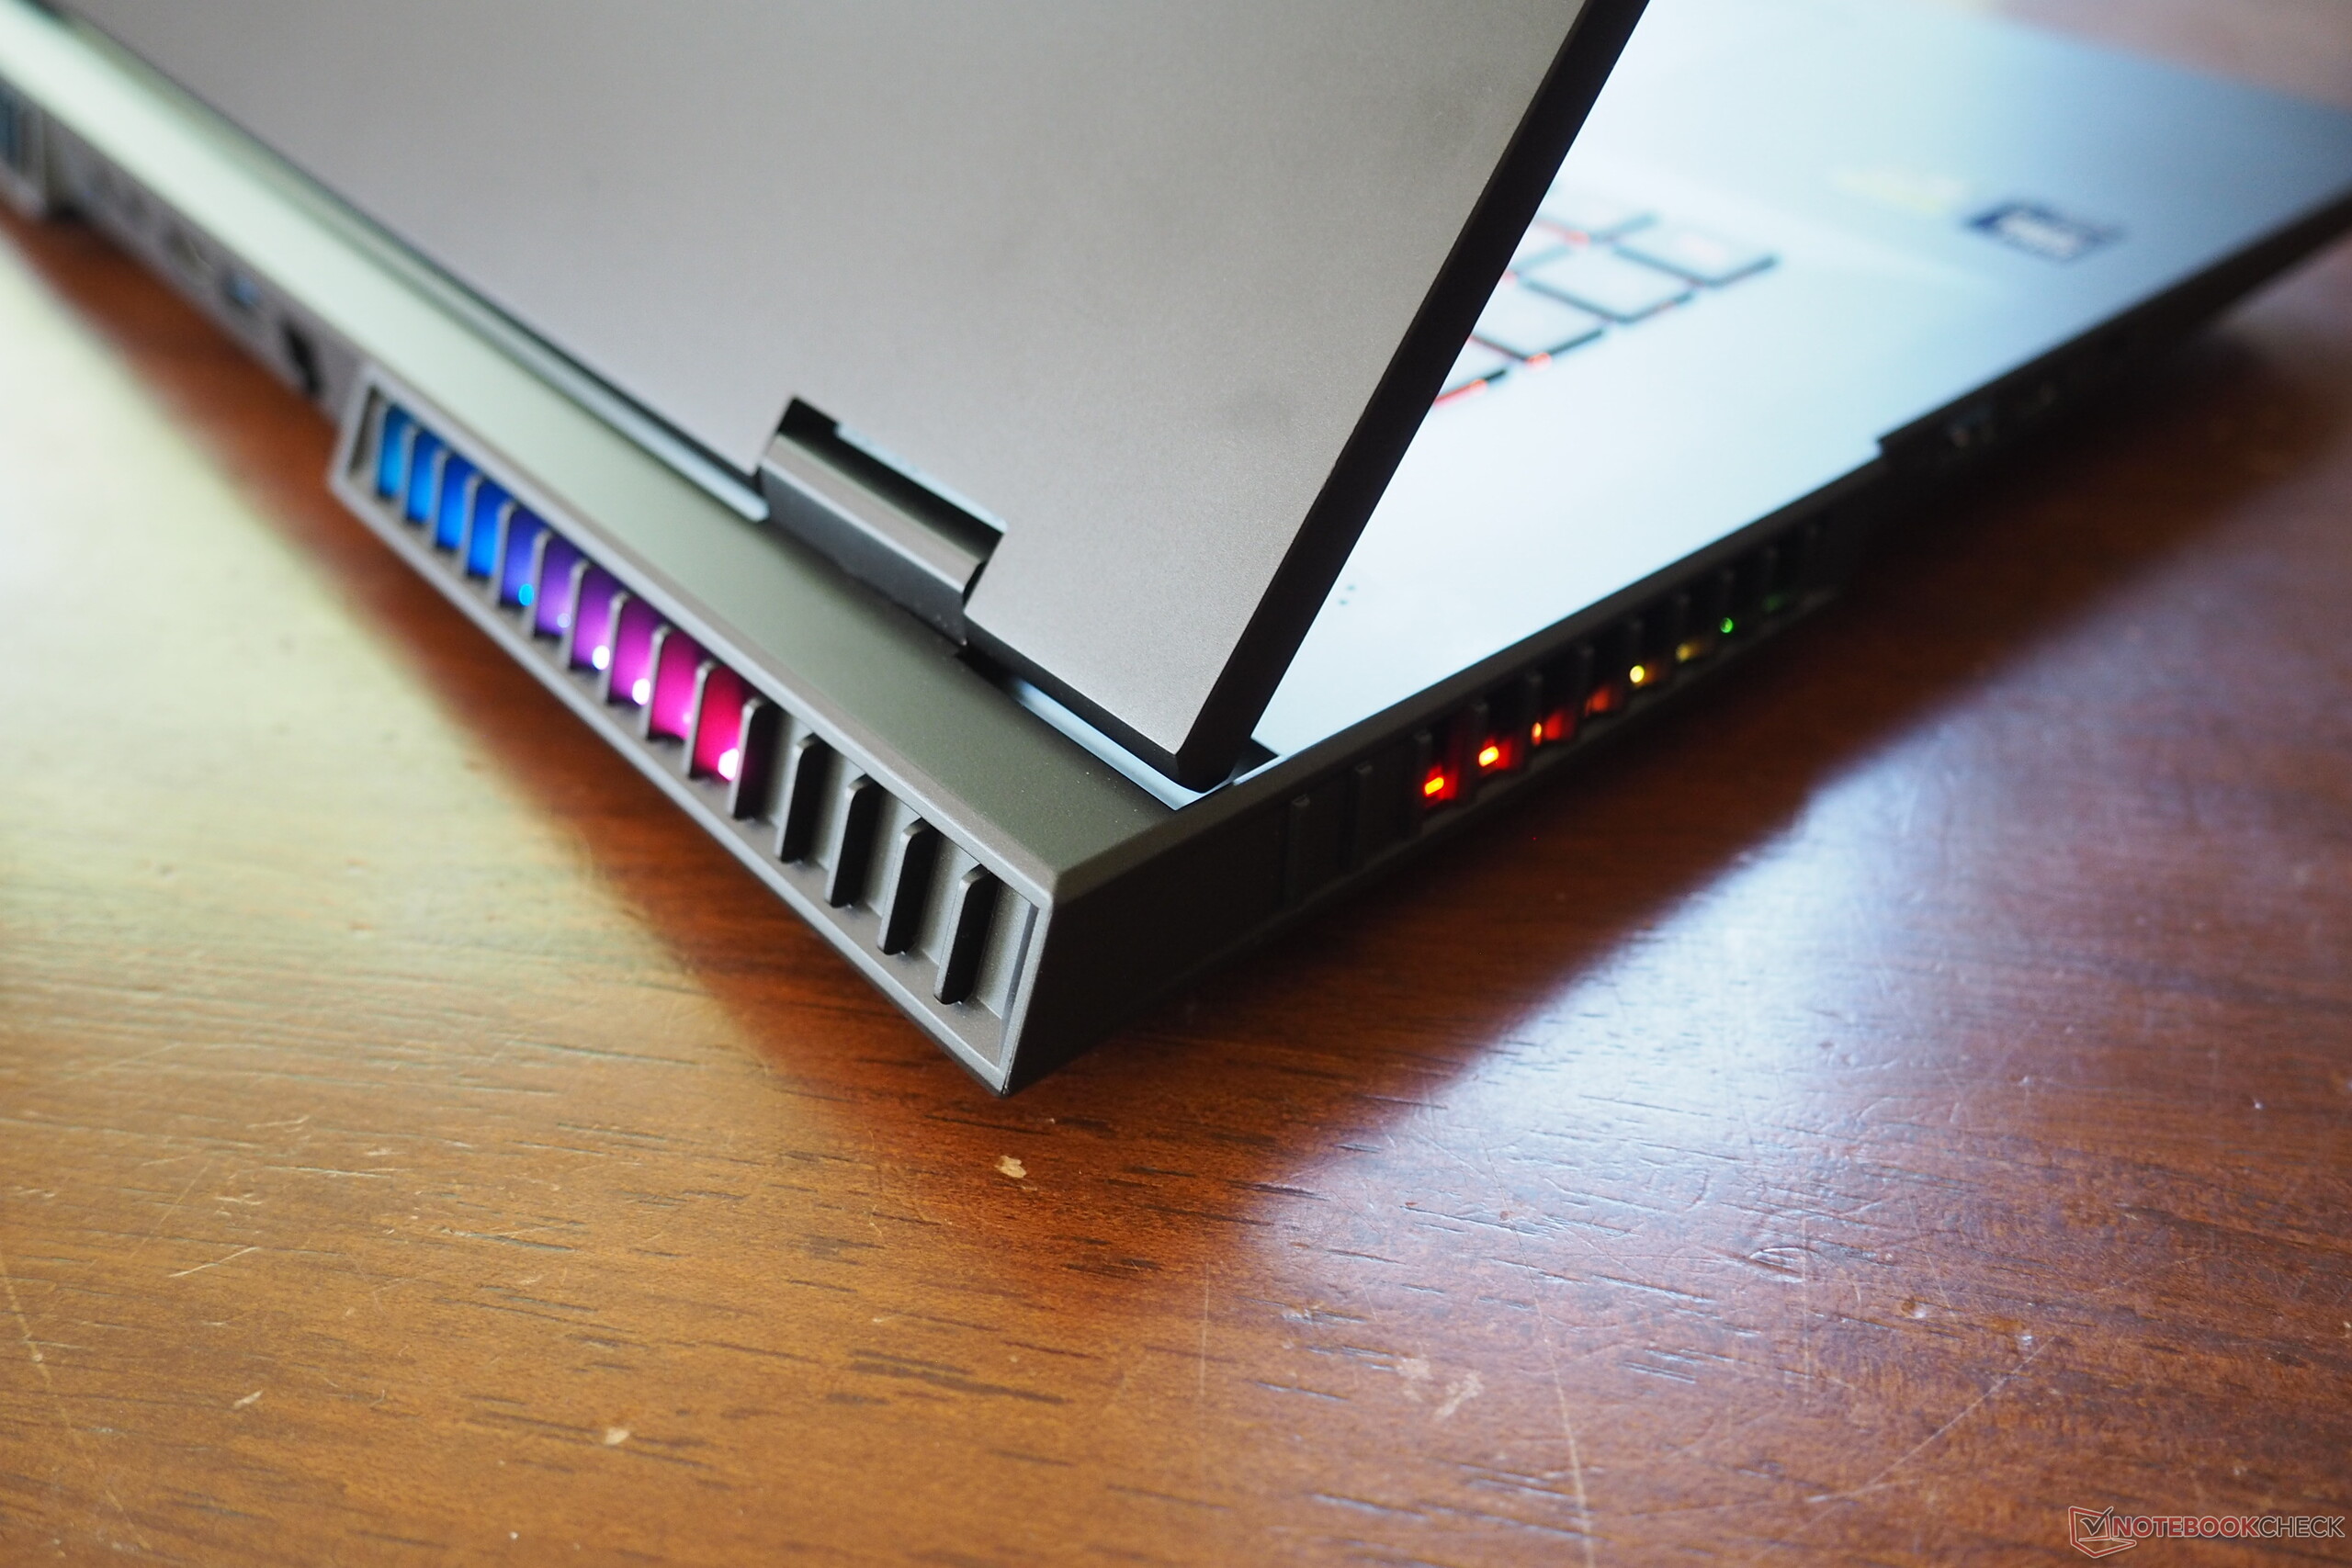
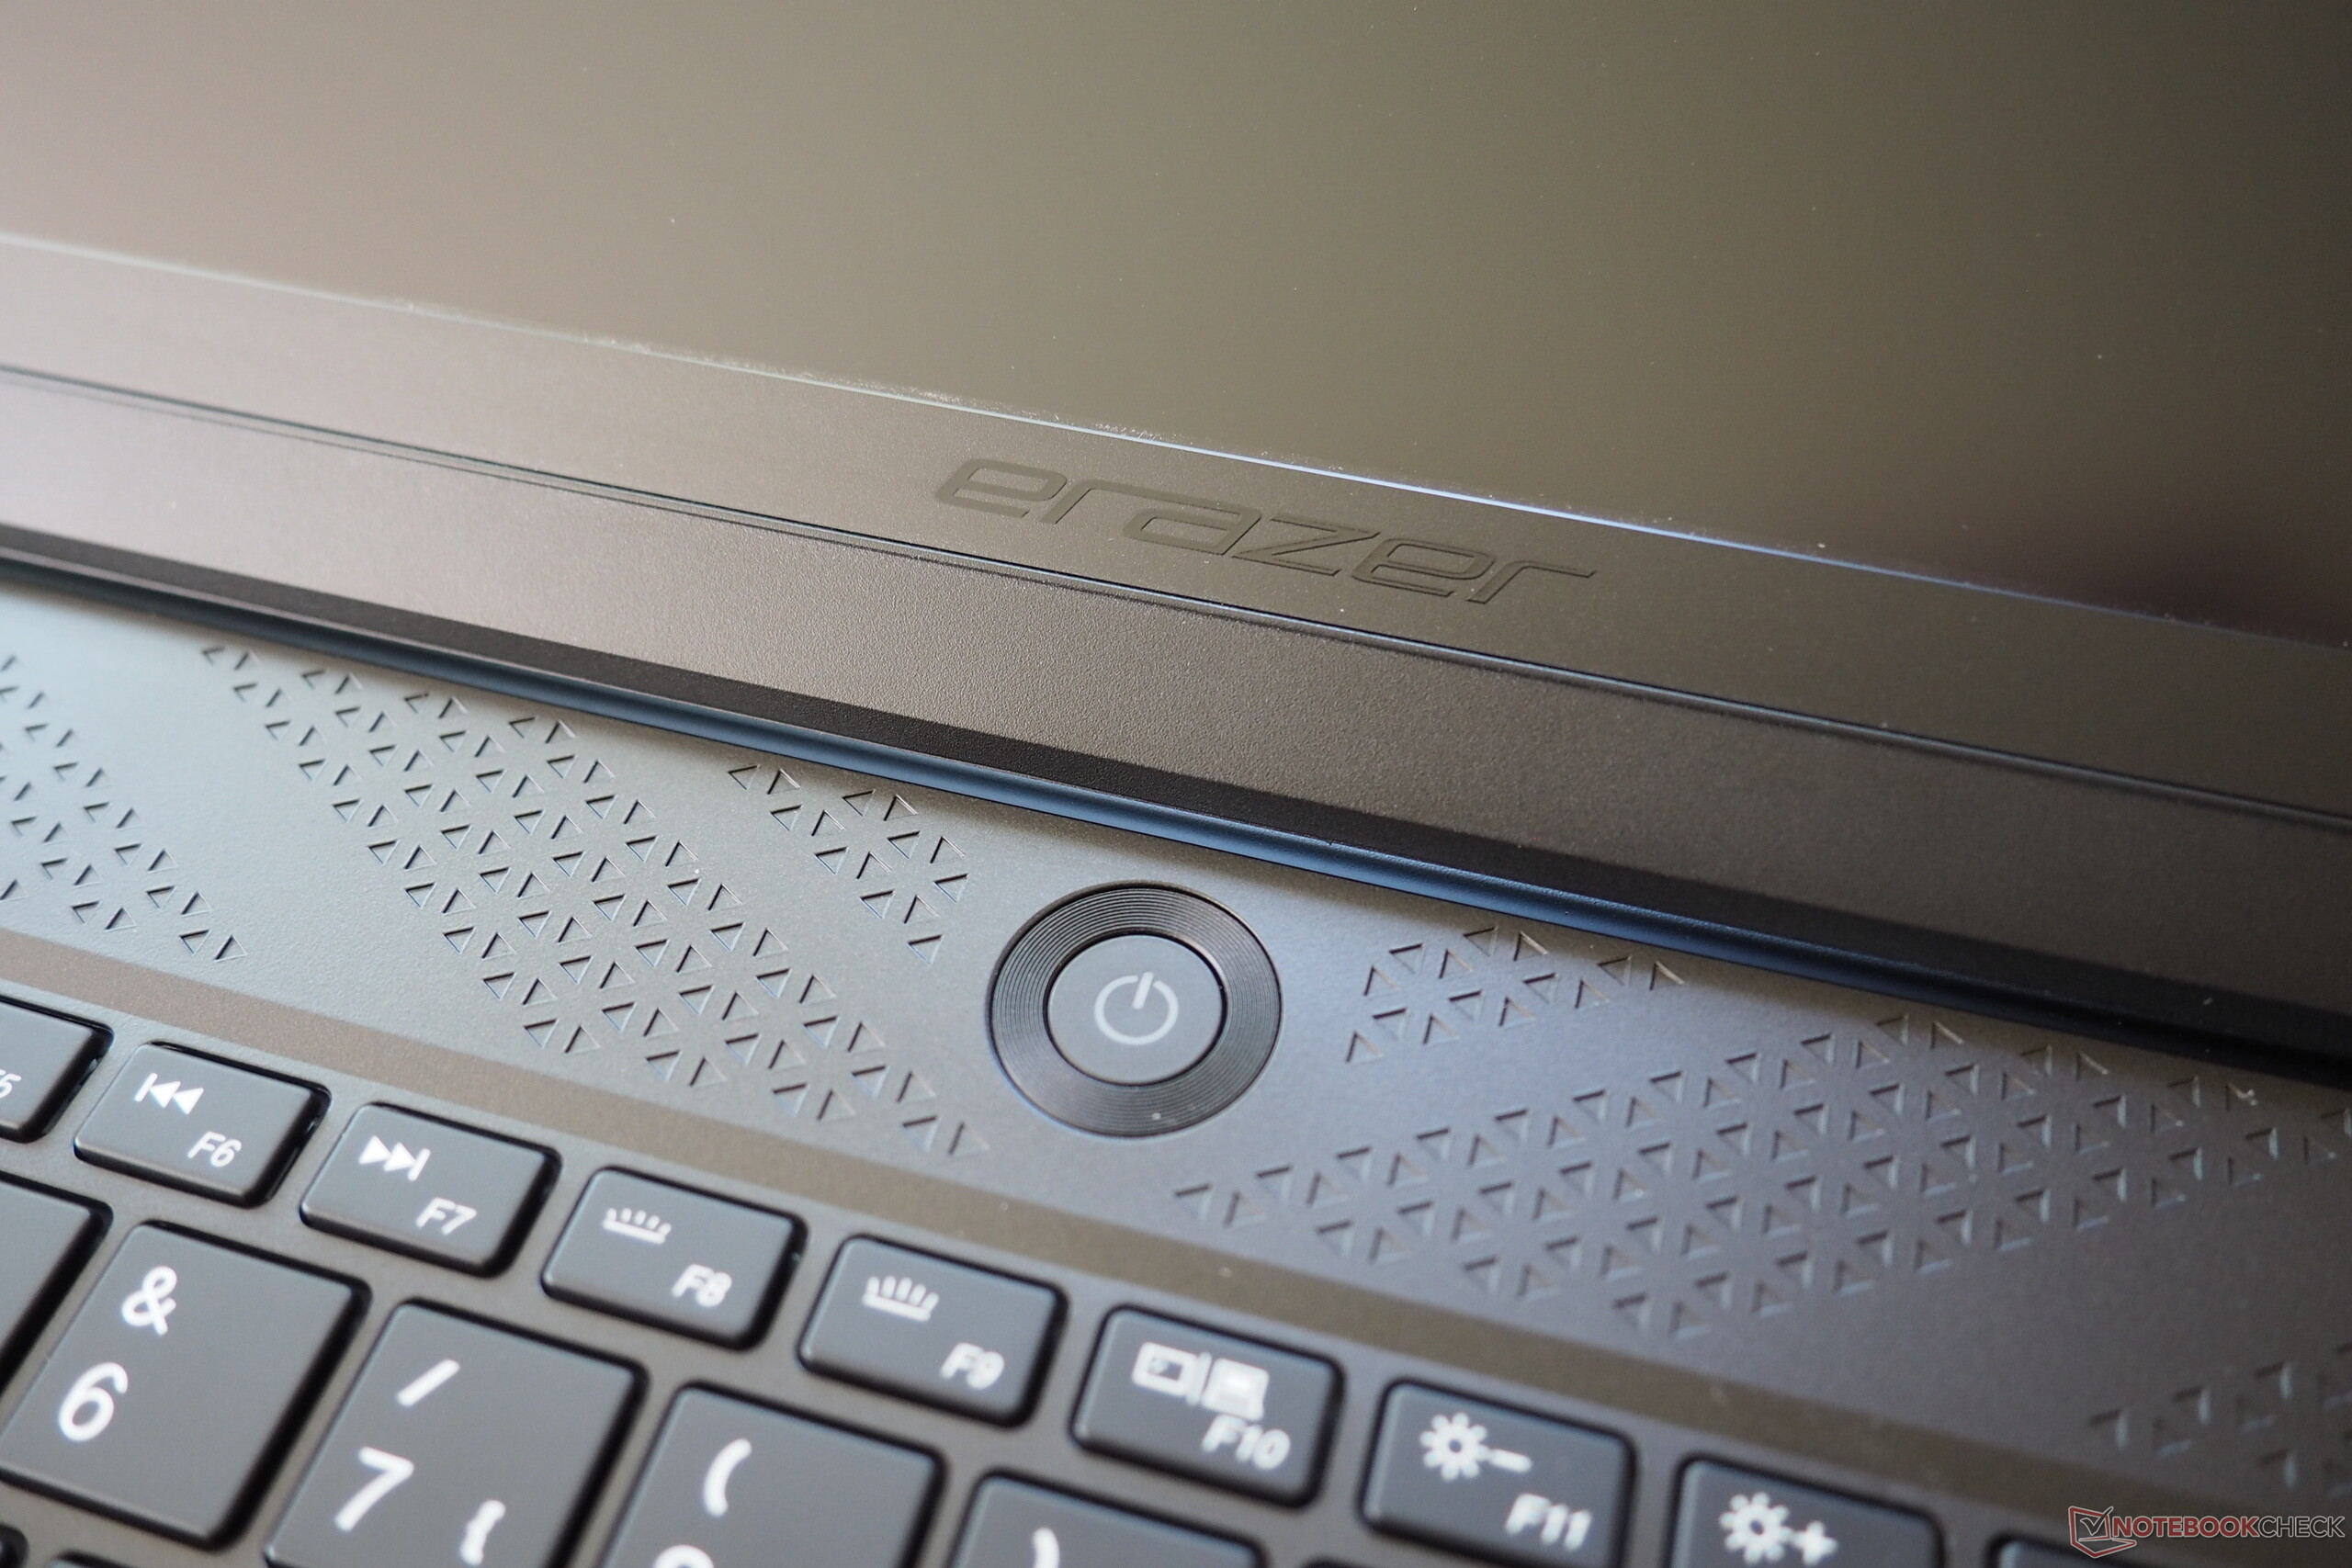
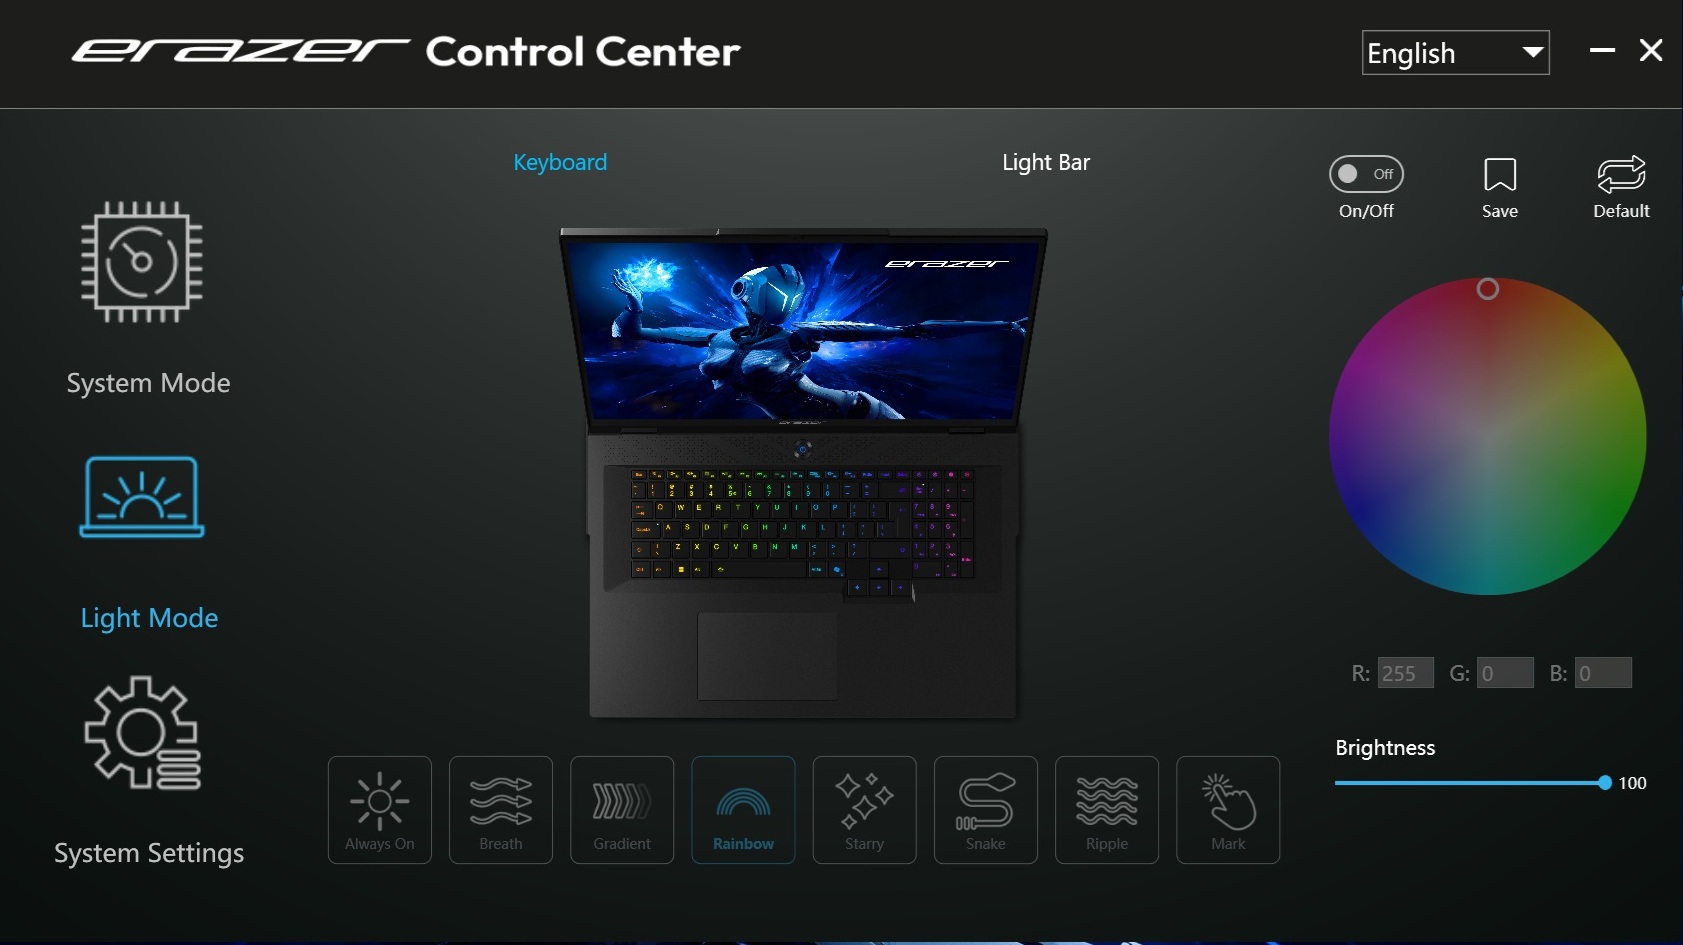
Se desidera un potente sostituto del desktop, potrebbe apprezzare Erazer Beast 18 X1. Sebbene il 18 pollici possa diventare estremamente rumoroso sotto carico (anche in modalità bilanciata), come molti altri portatili da gioco, gli utenti che non sono molto sensibili al rumore e/o che giocano comunque con le cuffie saranno in grado di sopportare il volume. L'enorme dispositivo fa una figura solida e guadagna punti con una connettività piuttosto ricca, che include Thunderbolt 5, una tastiera RGB ed eleganti strisce luminose sul lato e sul retro (vedere le foto). I dispositivi di input sono da decenti a buoni, ma il modello non è davvero in grado di impressionare.
Il laptop GeForce RTX 5080 di Nvidia ha prestazioni che rientrano nell'intervallo previsto, mentre il Core Ultra 9 275HX di Intel perde un po' di prestazioni in caso di carico prolungato (ne parleremo tra poco). La concorrenza comprende il Aorus Master 18 e il Asus ROG Strix Scar 18che abbiamo testato con il laptop RTX 5090 più potente.
Pro
Contro
Prezzo e disponibilità
Il Medion Erazer Beast 18 X1 MD62731 è in listino a circa 3.700 euro sulla homepage di Medion quotato.
Specifiche
Caso
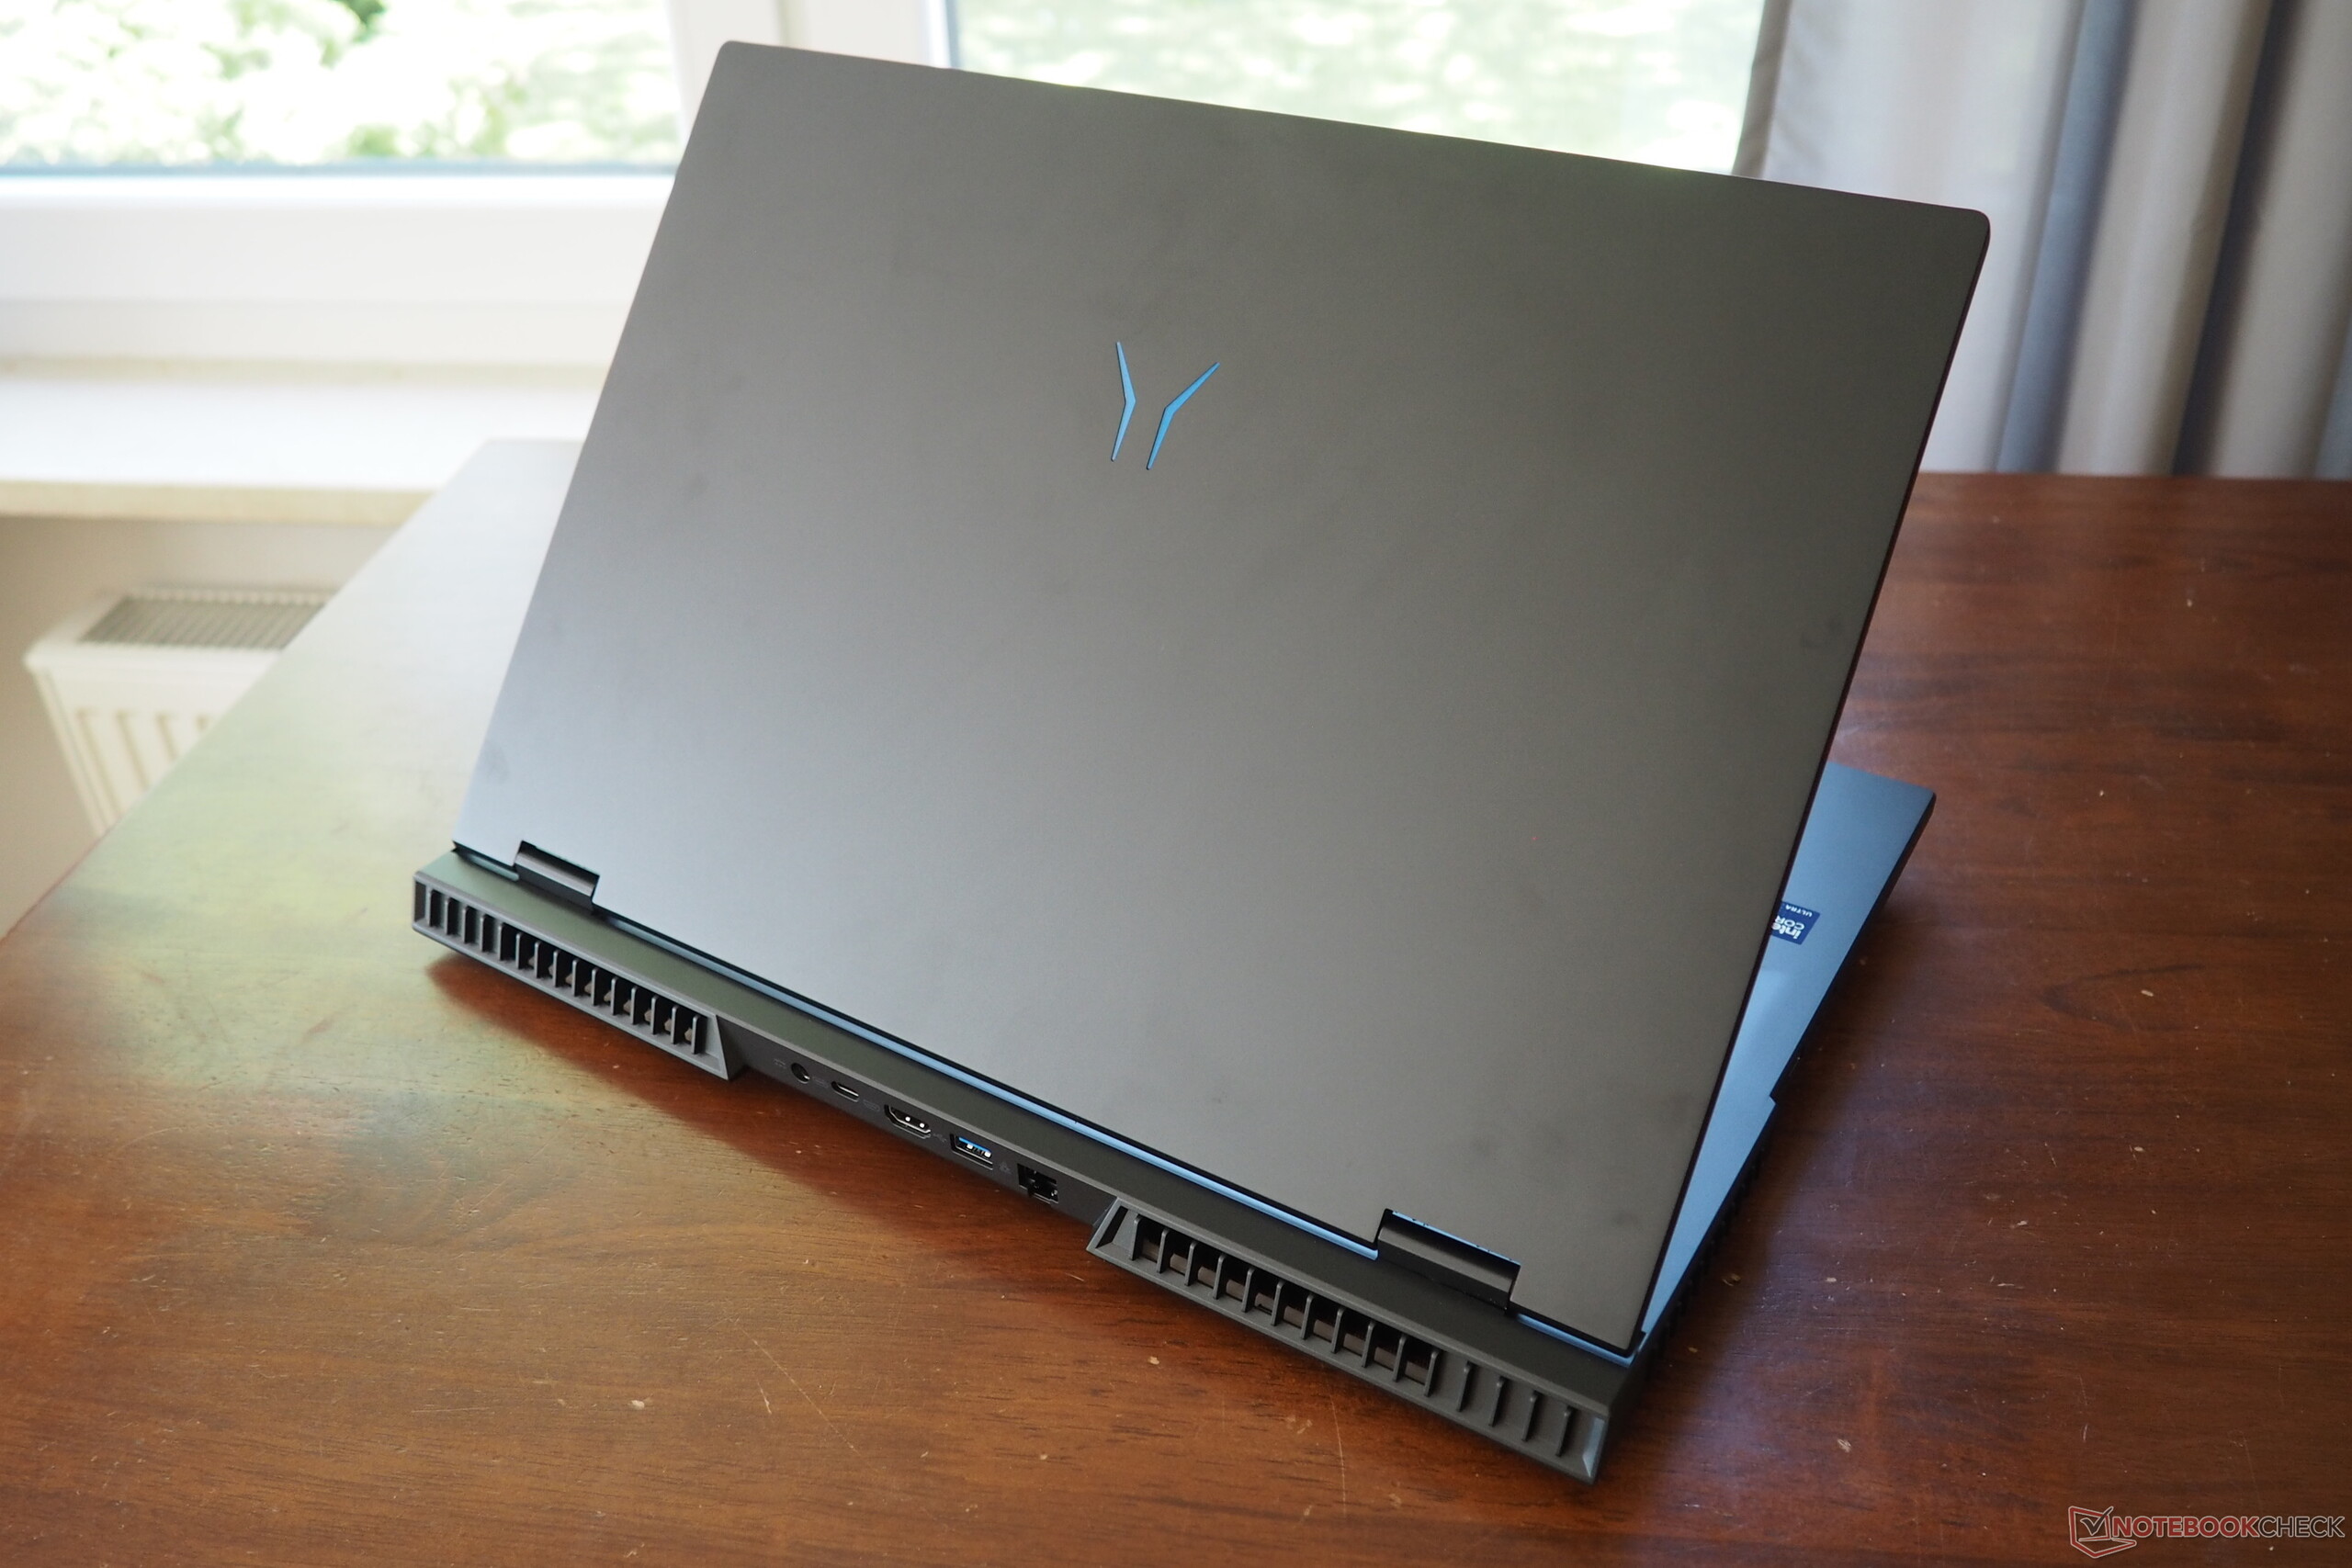
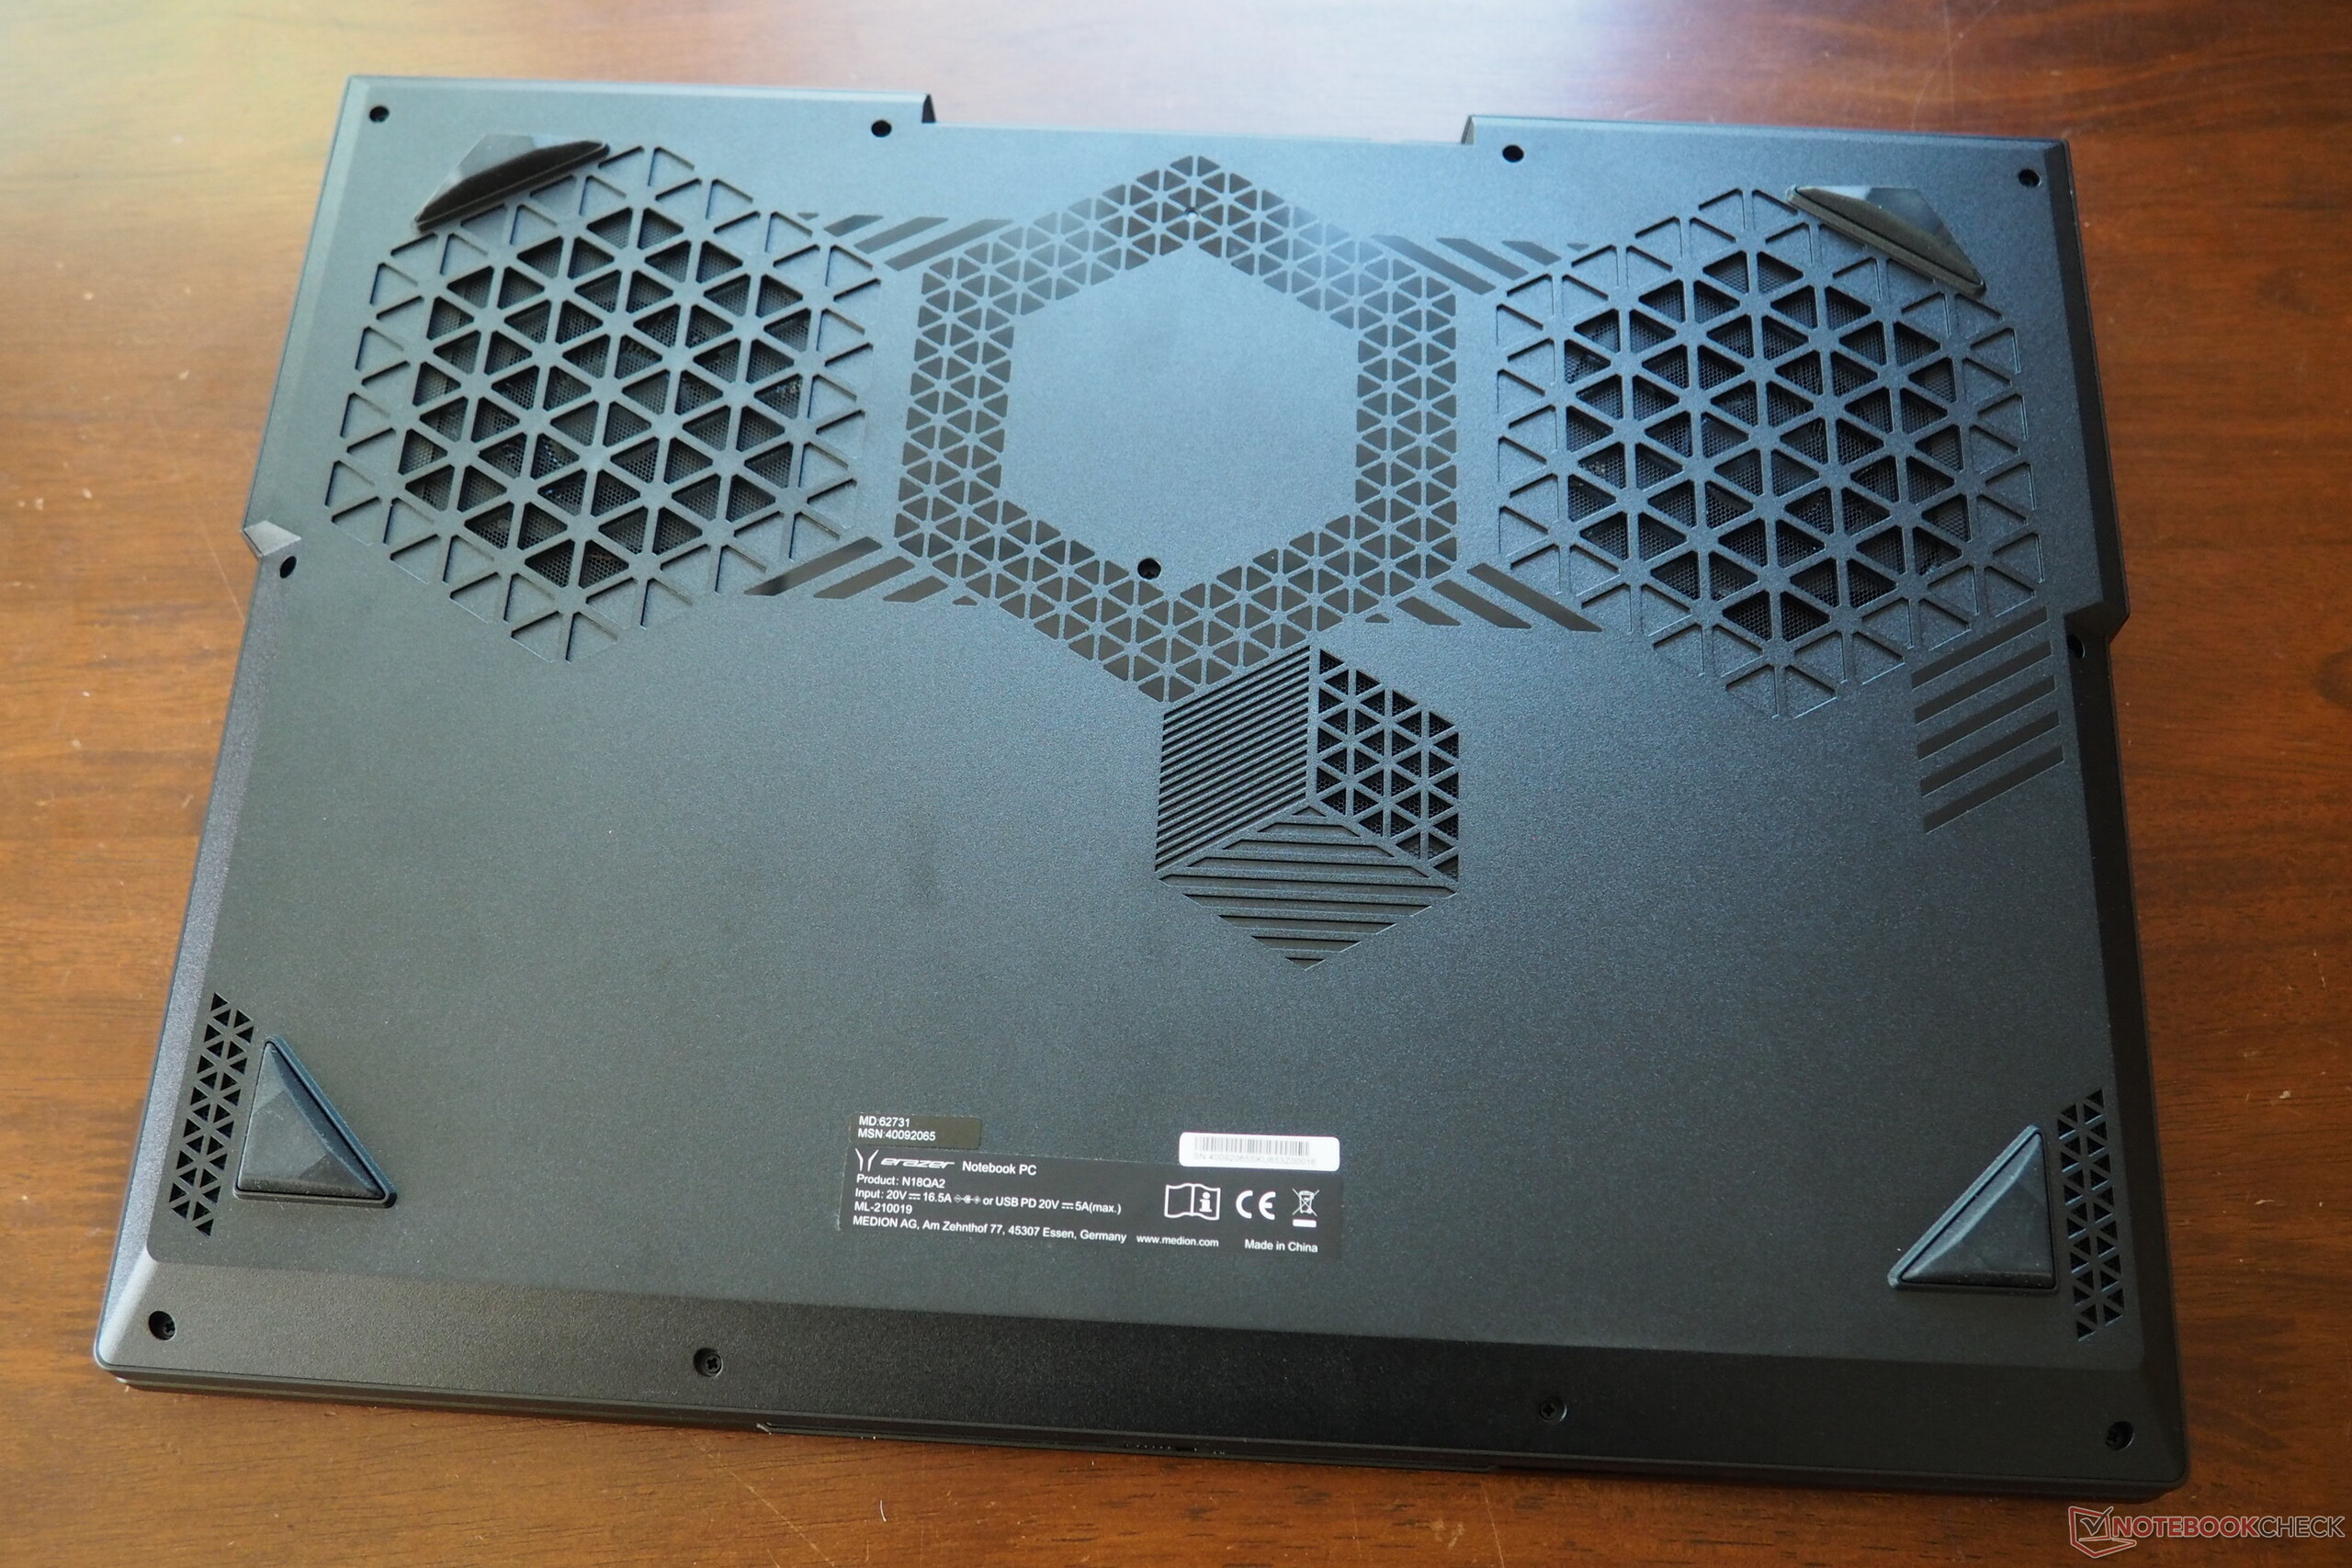
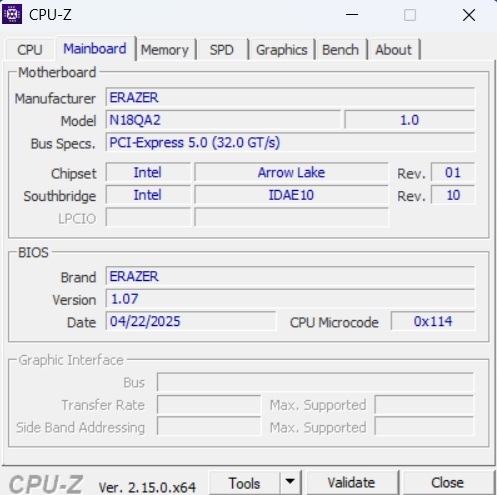
In termini di qualità, Medion offre la solita media. Mentre il coperchio del modello da 18 pollici è in alluminio, l'unità di base è in plastica. Nonostante la struttura relativamente più spessa, quest'ultima può essere leggermente piegata in alcuni punti, ma questo accade principalmente solo quando si applica una maggiore pressione. D'altra parte, il generoso angolo di apertura di 150° merita un elogio, anche se le cerniere potrebbero essere un po' più strette. Con un'altezza complessiva di poco meno di 3 cm (senza piedini per il case), Beast 18 X1 si allinea alle sue controparti di Aorus e Asusanche se il peso è leggermente superiore, da 3,6 a 3,3-3,4 kg.

Attrezzatura
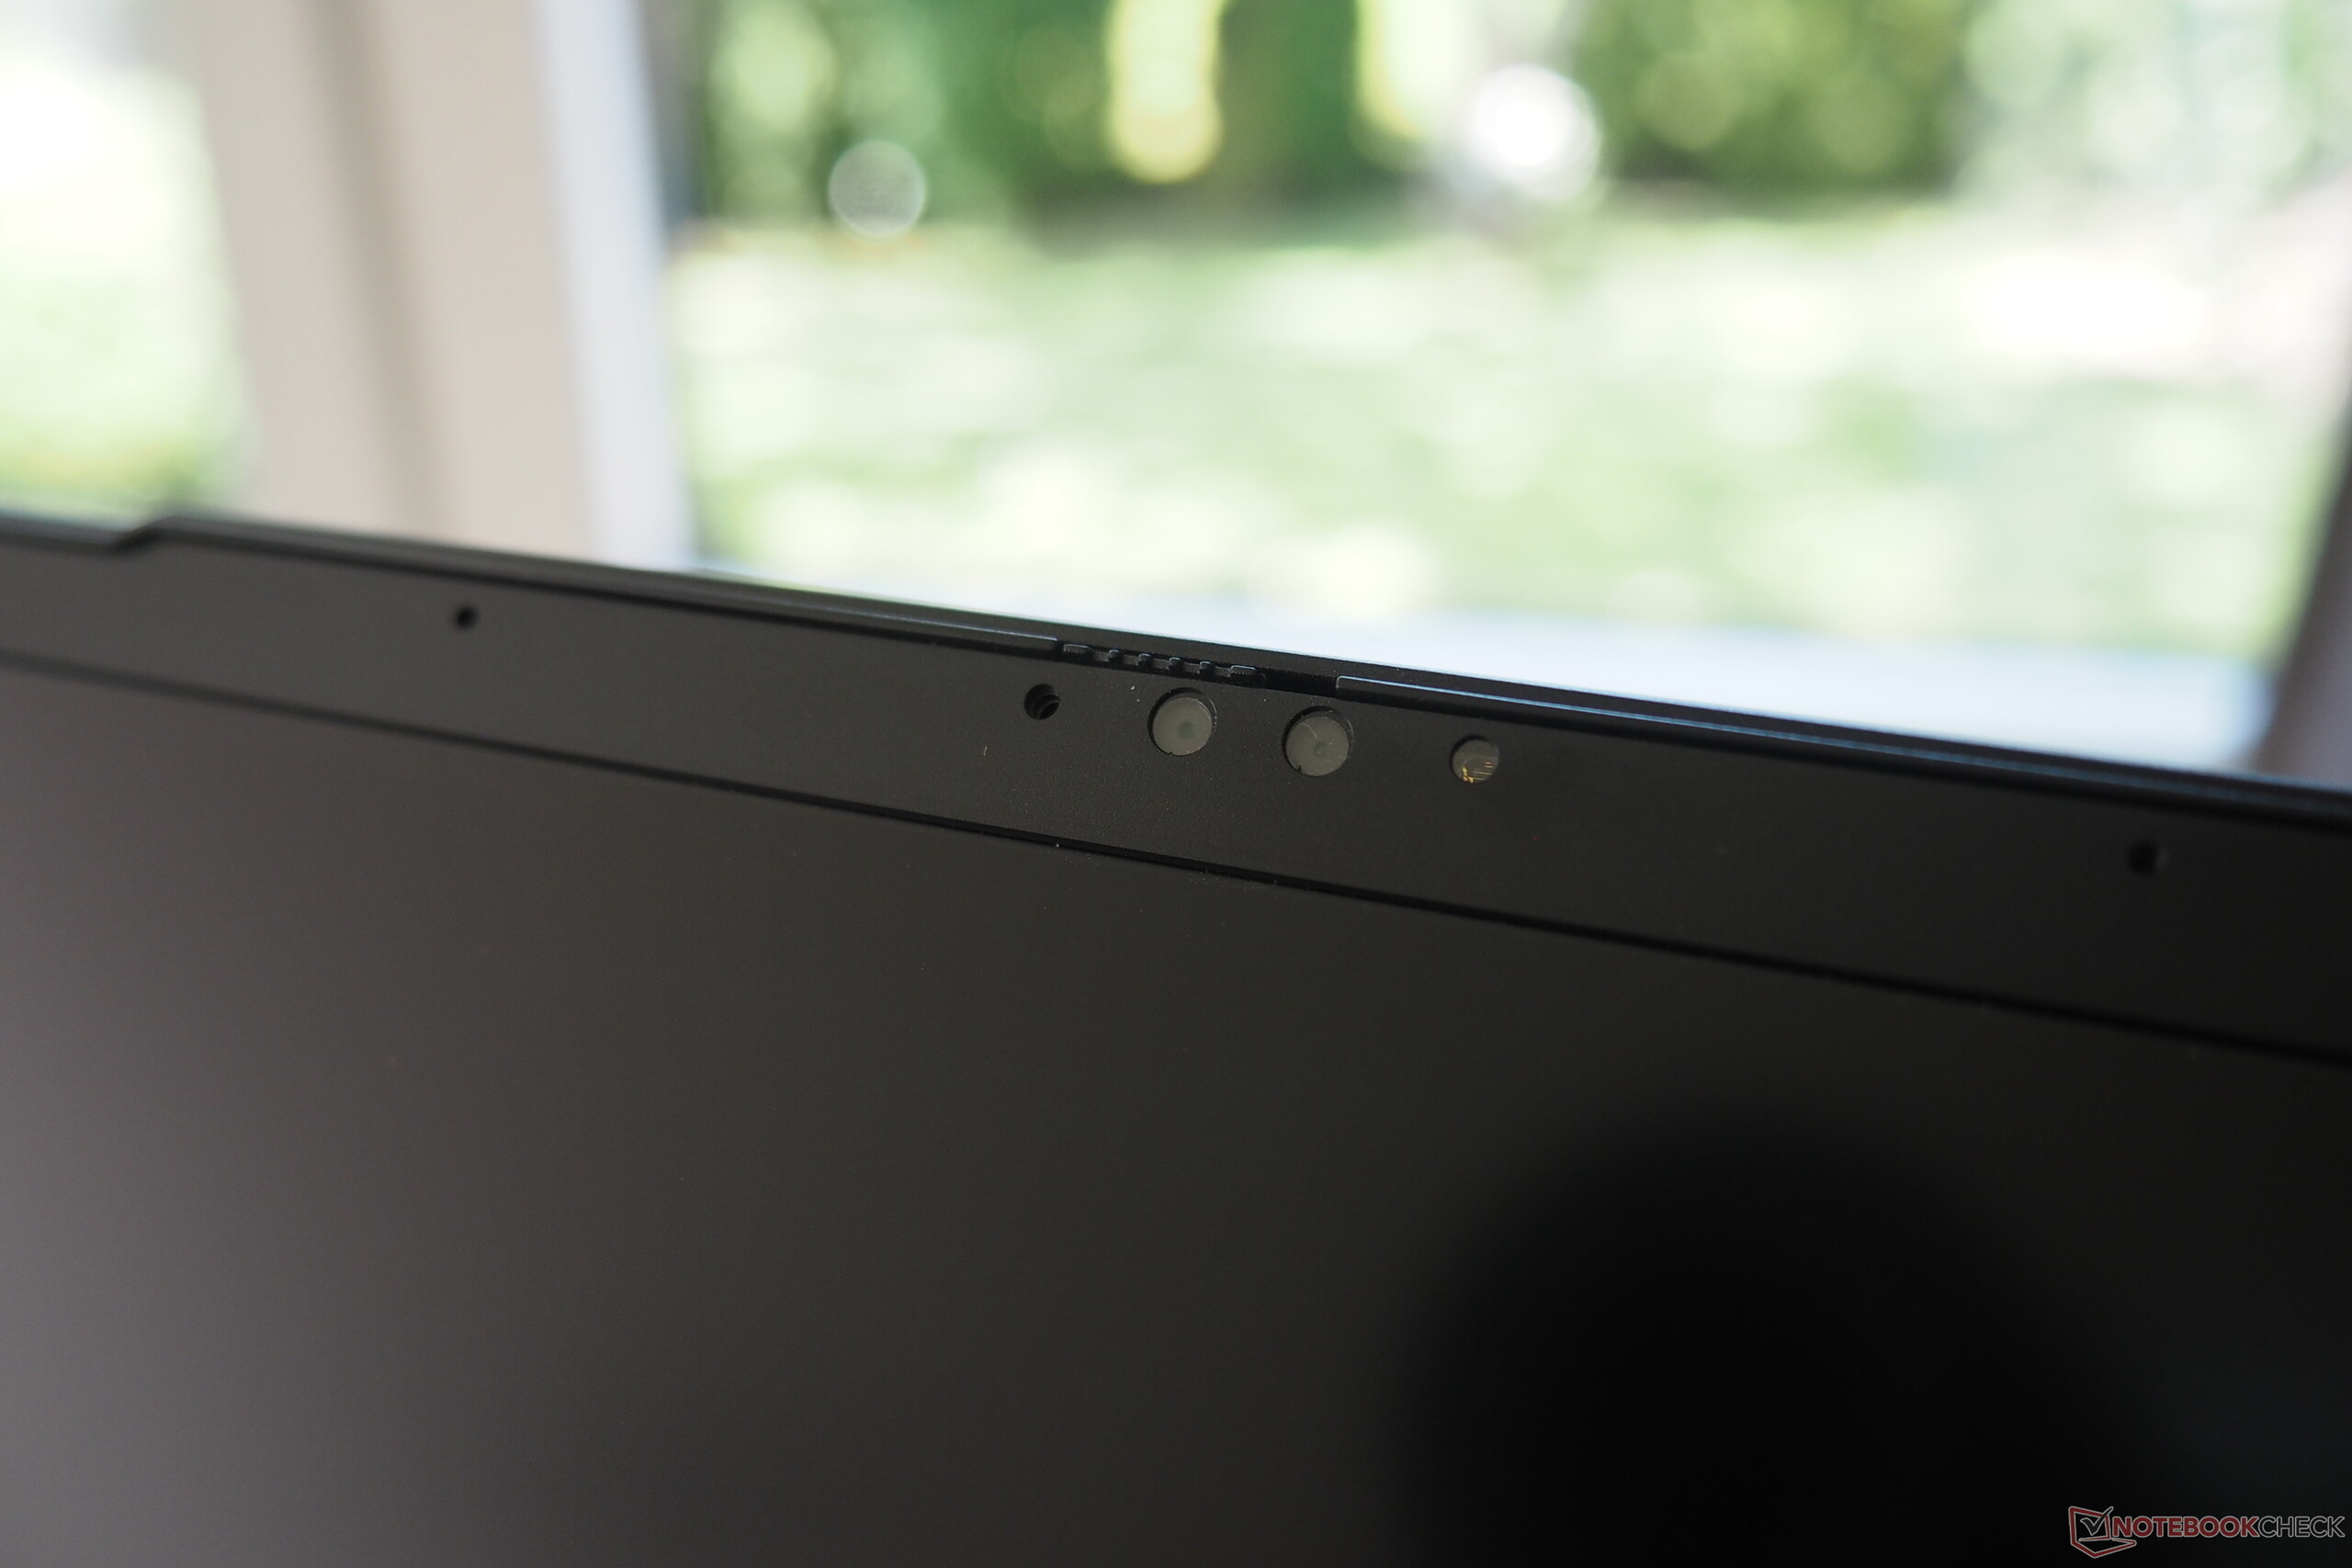
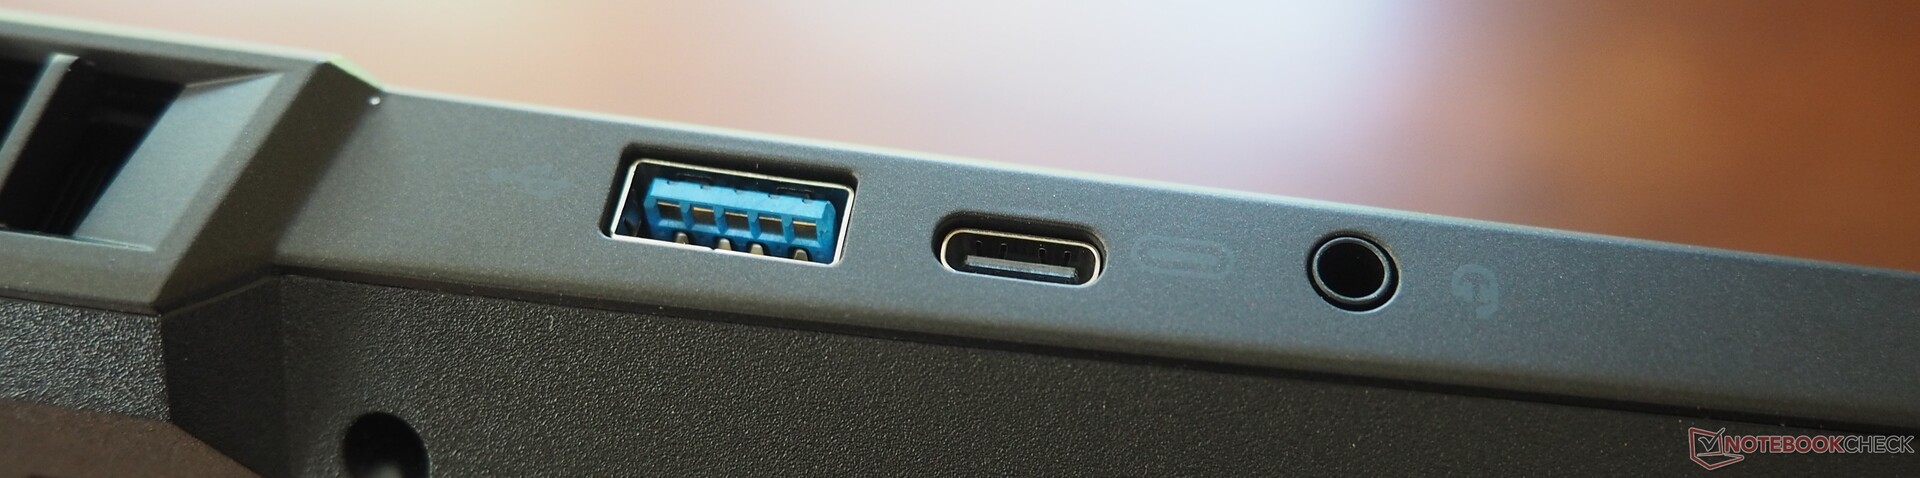
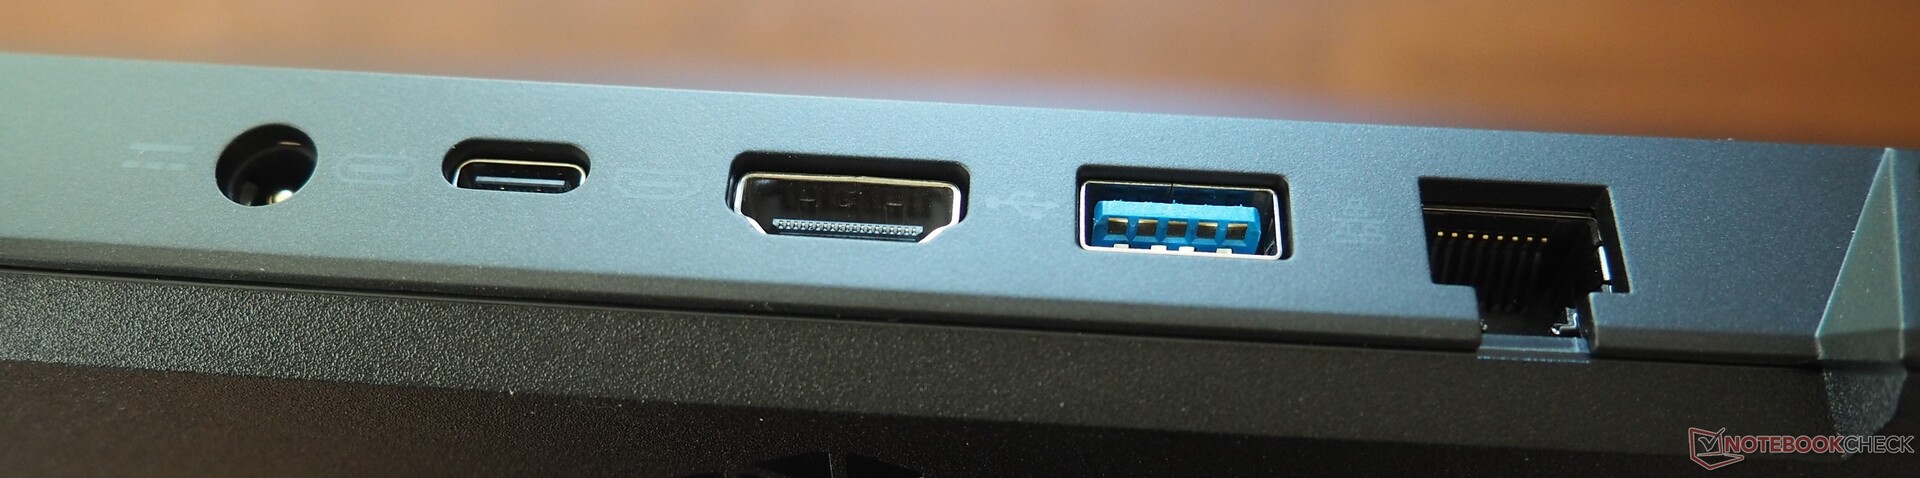
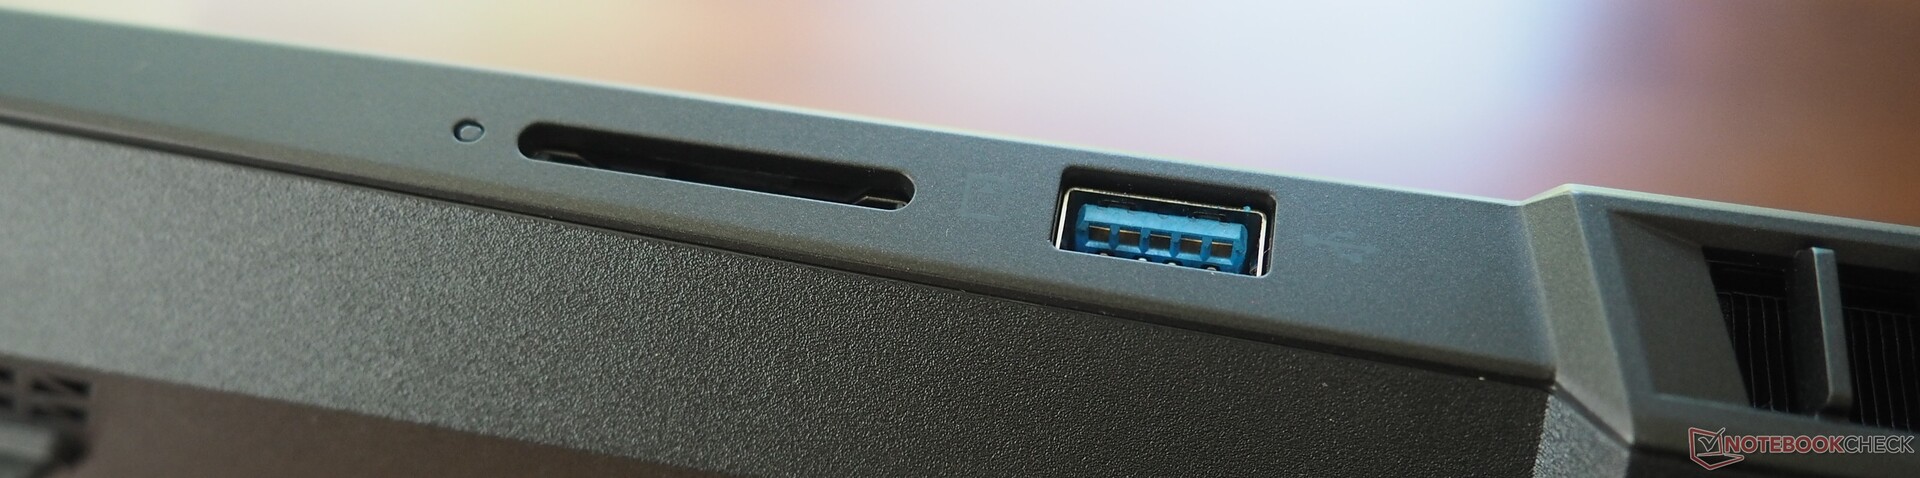
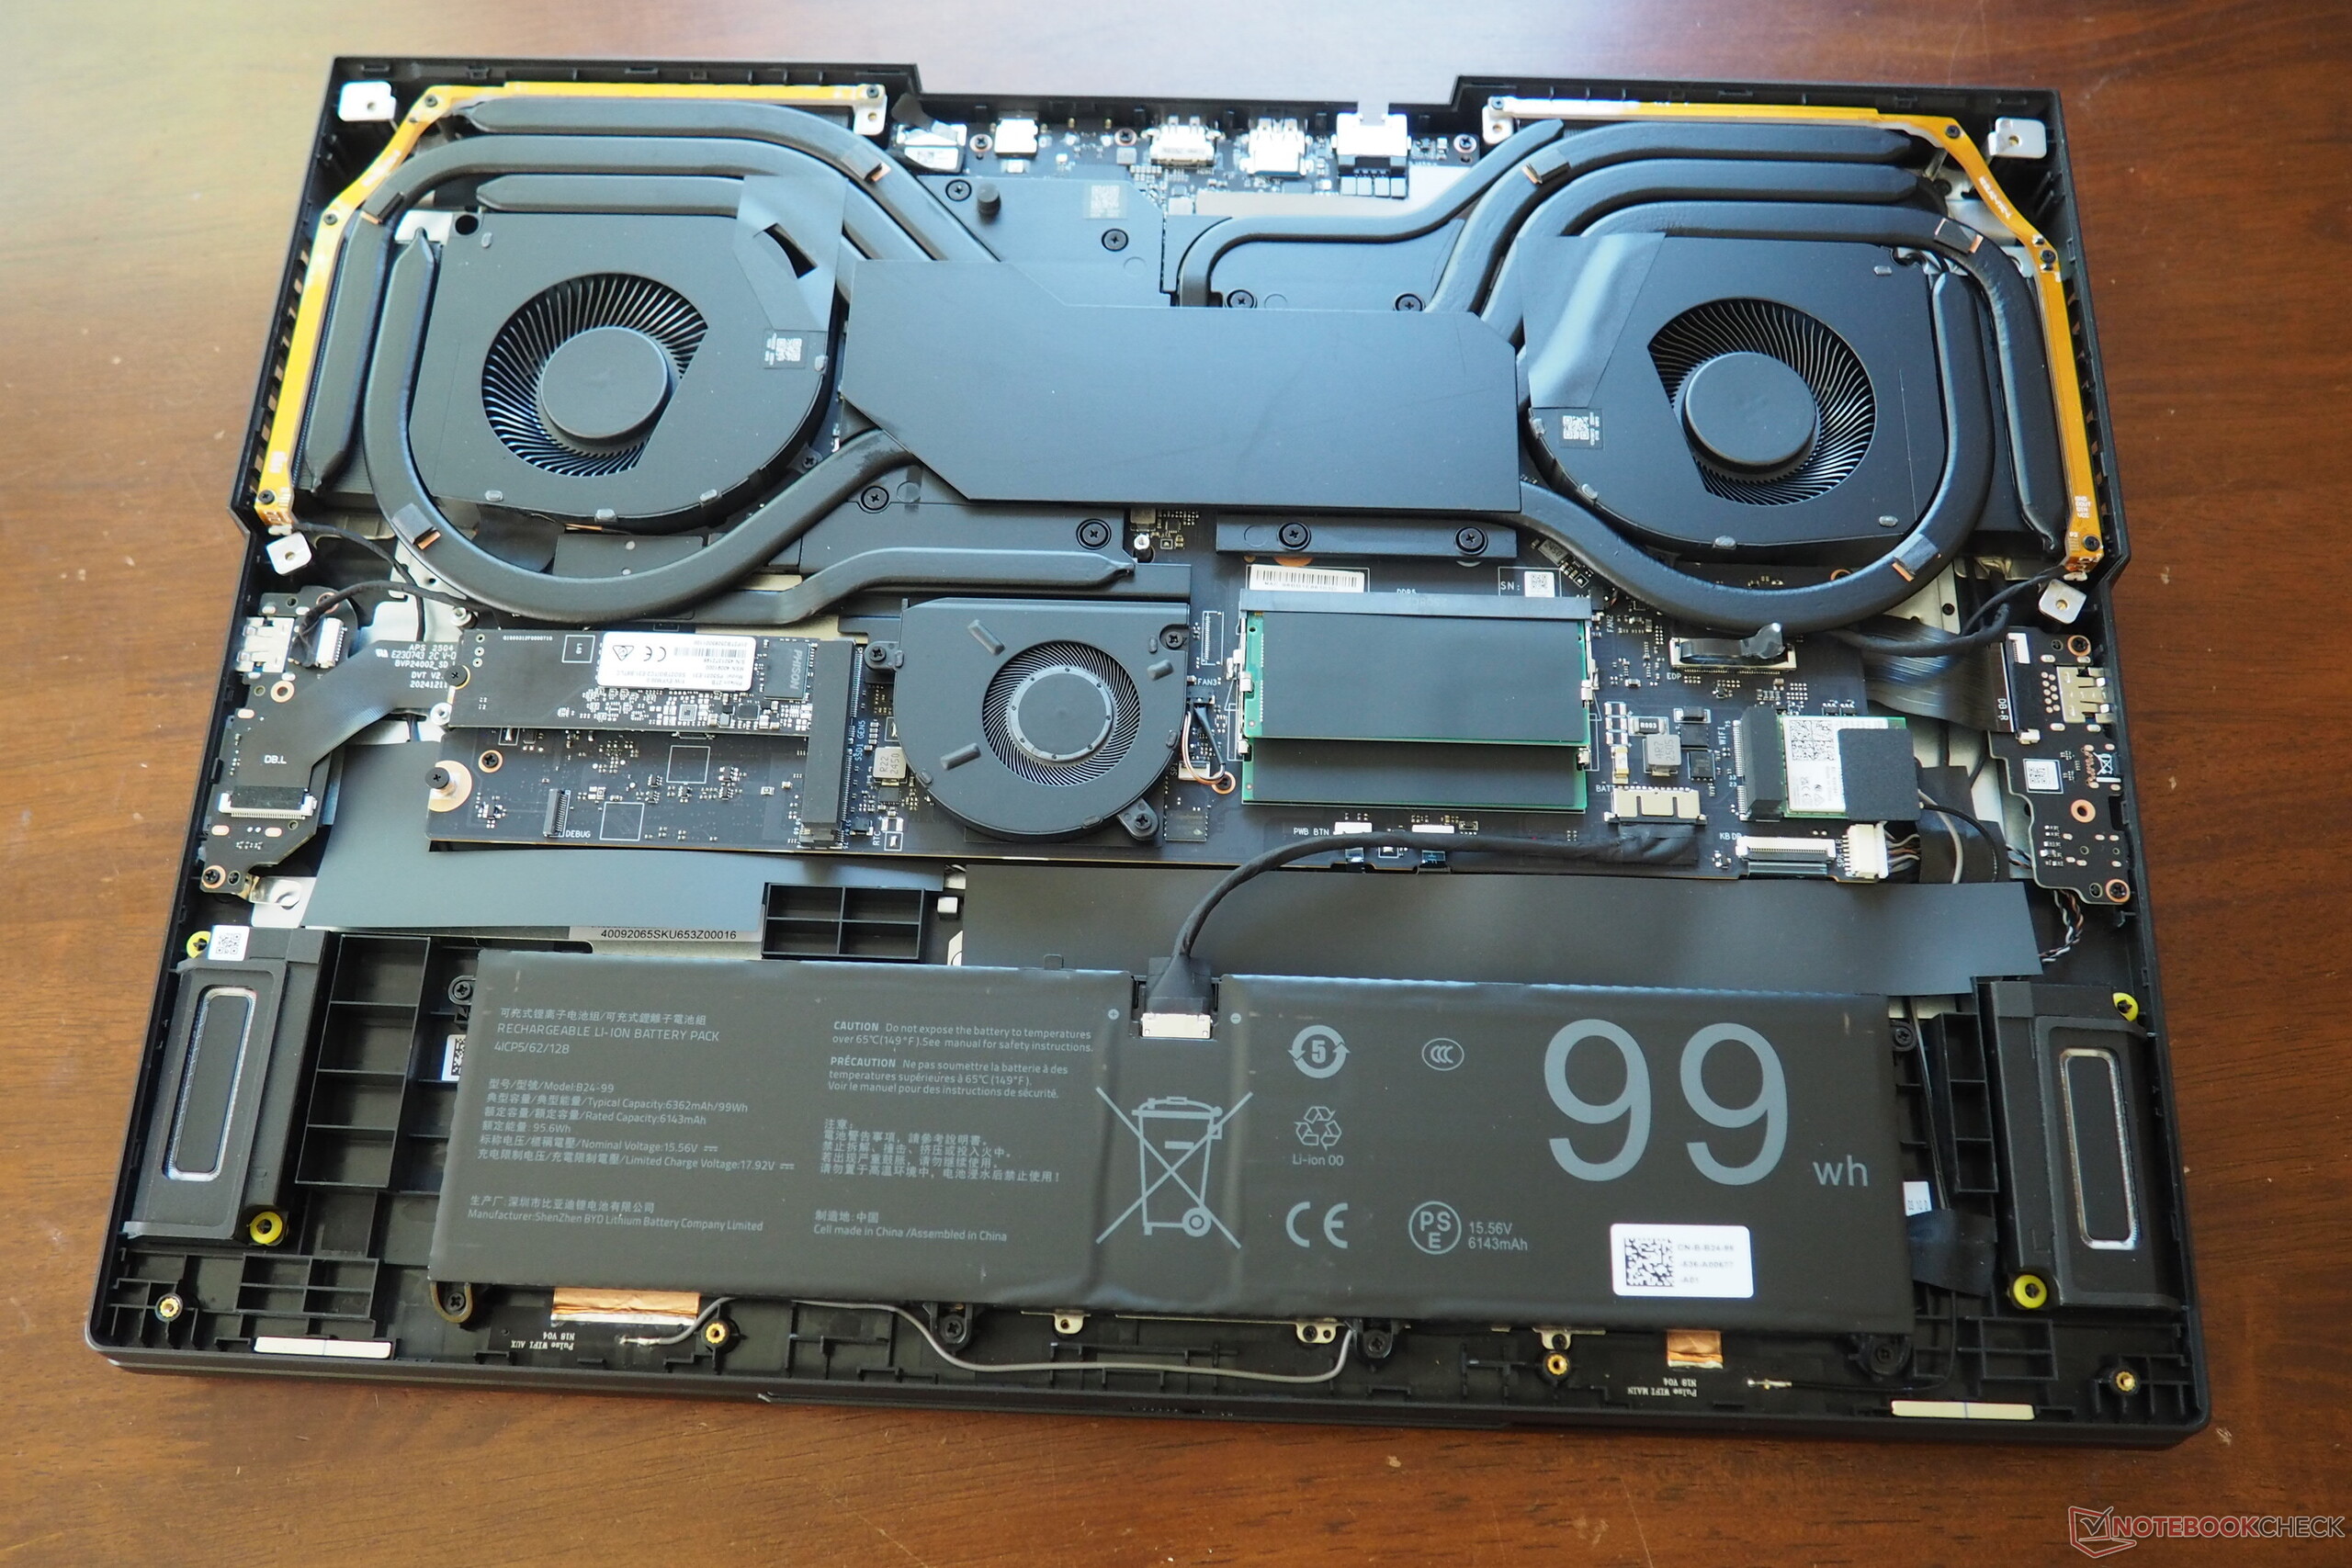
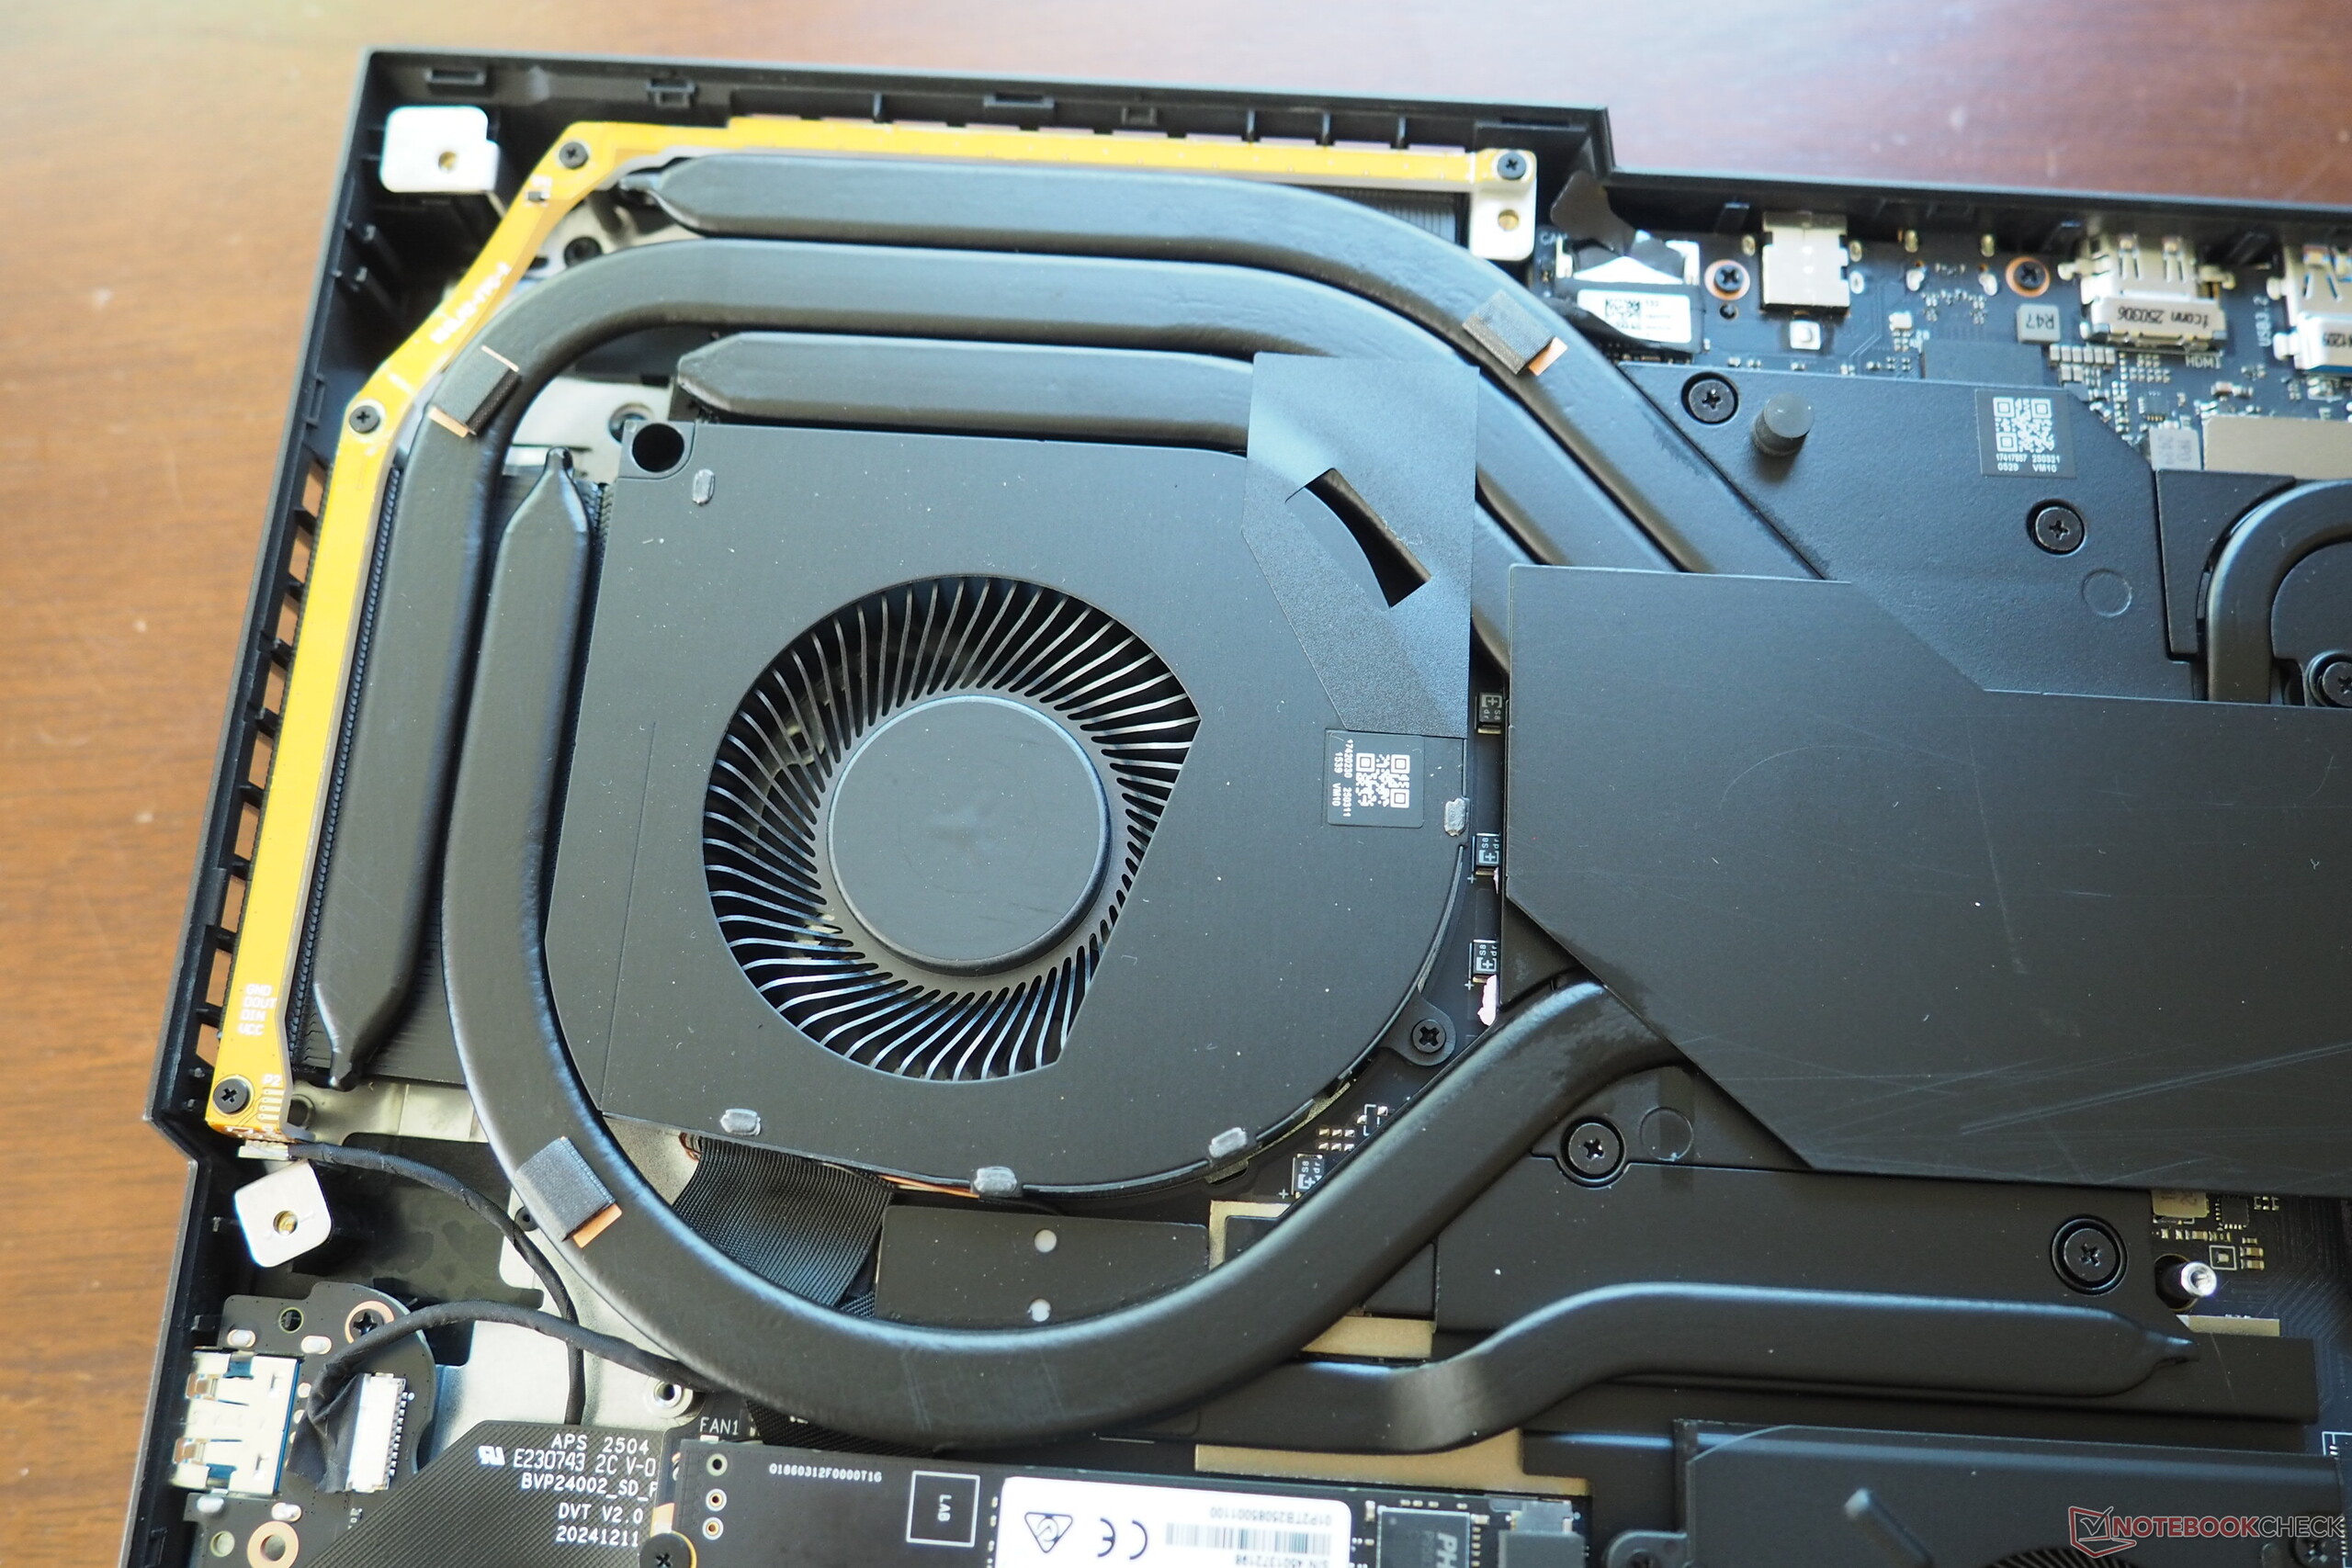
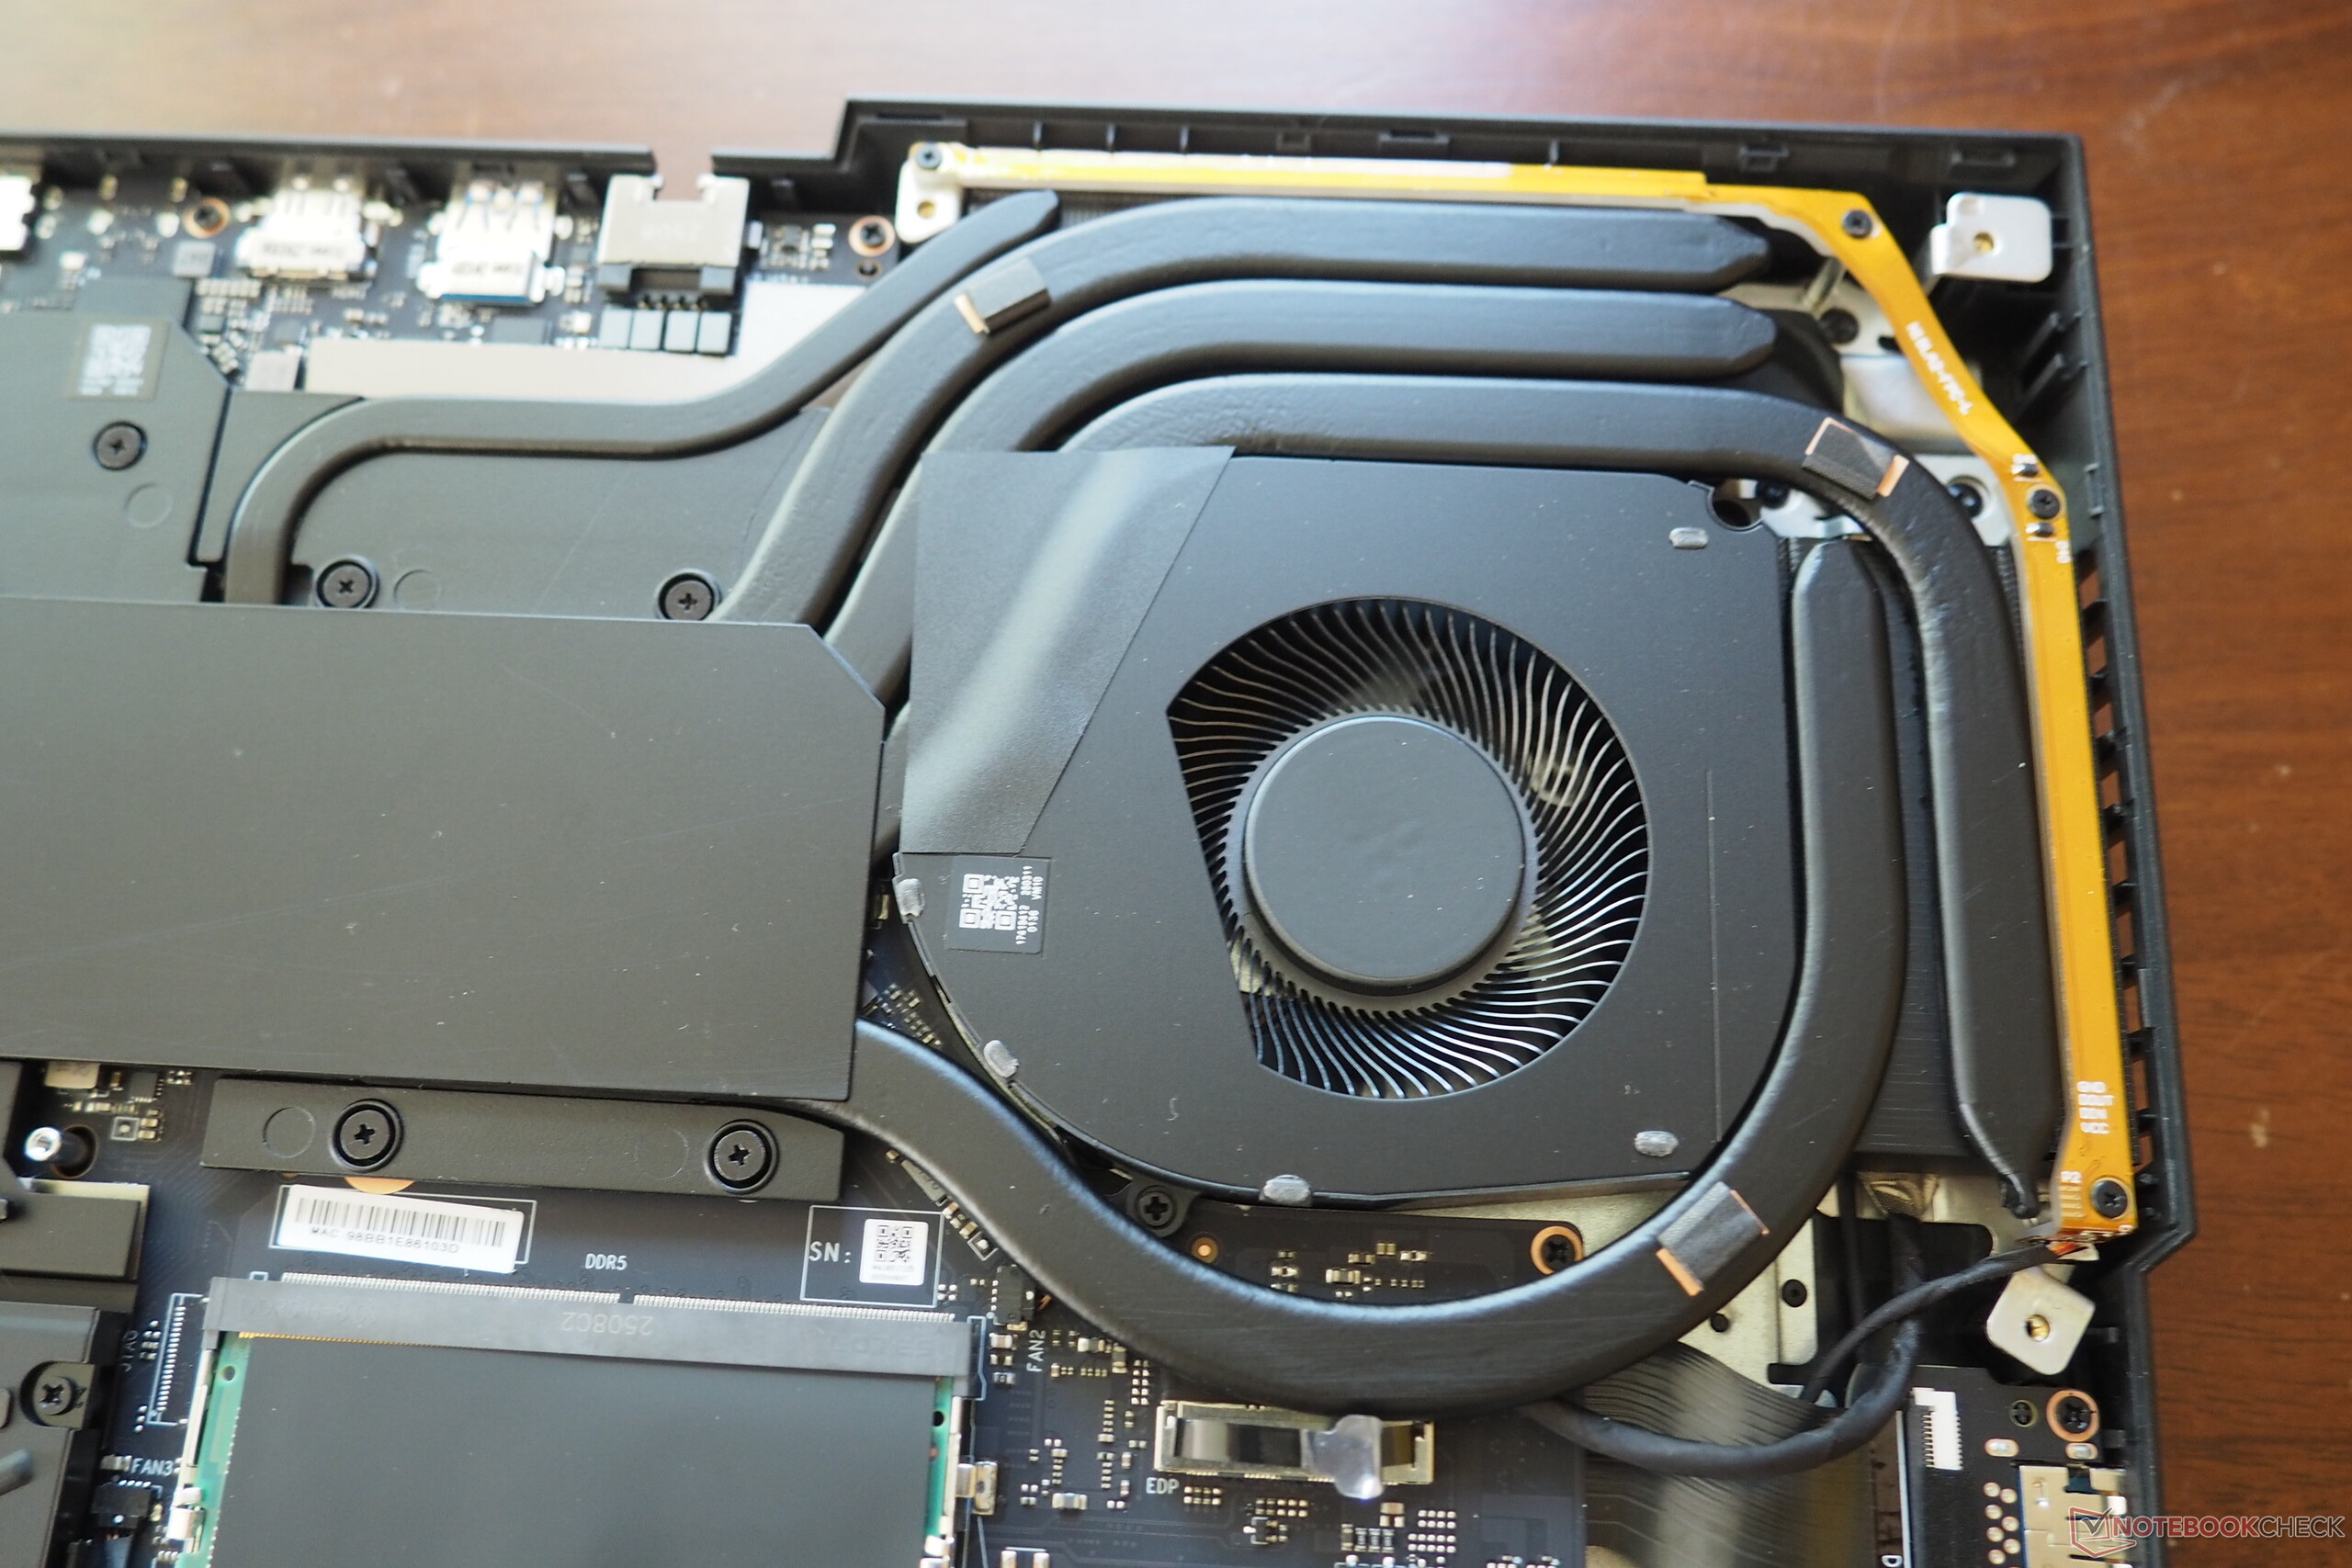
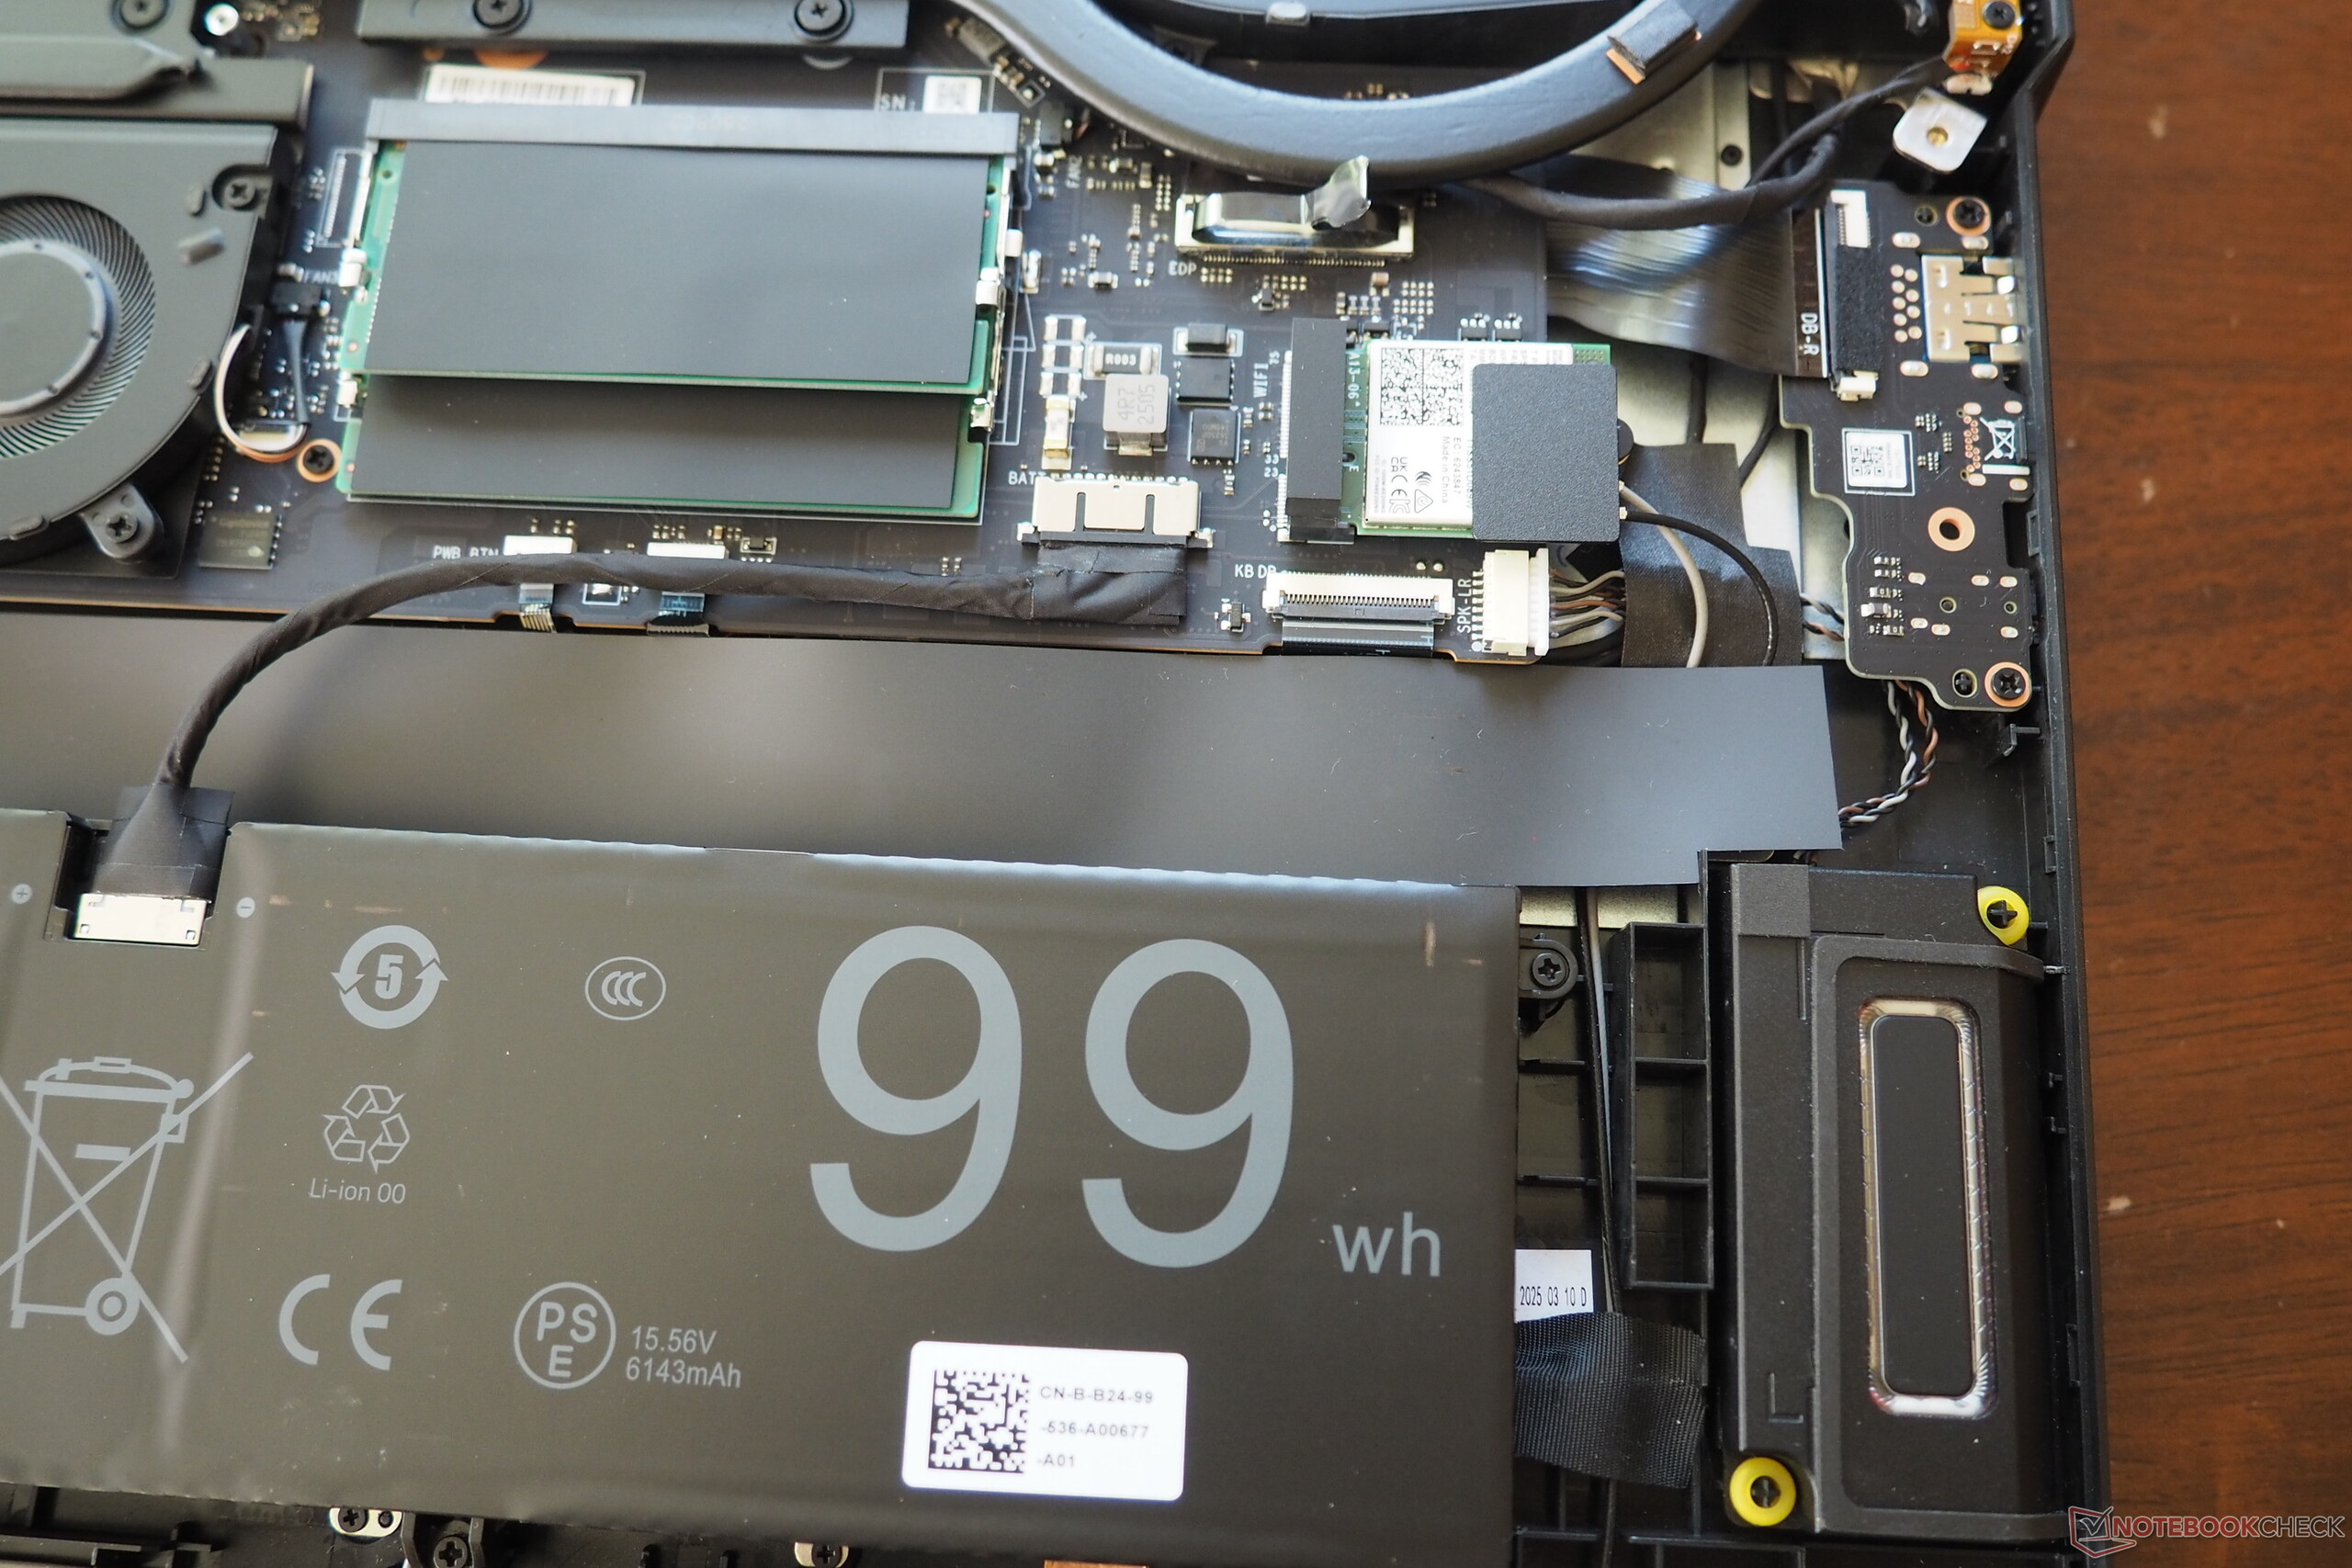
La selezione di interfacce è impressionante, come si addice a un desktop replacement. Oltre a due porte USB-A (3.2 Gen1), sono presenti anche due porte Type-C, una delle quali supporta l'interfaccia Thunderbolt 5. Sono presenti anche una presa audio, un'uscita HDMI 2.1, un lettore di schede piacevolmente veloce e una porta di rete da 2,5 Gbit. Le connessioni wireless sono gestite da un chip Intel Wi-Fi 7 (BE200), che ha ottenuto un punteggio particolarmente buono nel test con la sua velocità. Nel frattempo, la webcam FHD non genera alcun rumore, ma offre una copertura fisica, il che non è scontato. La manutenzione di Erazer Beast 18 X1 è moderatamente facile o difficile: Dopo aver rimosso 11 viti Phillips, la piastra di base può essere estratta dal suo ancoraggio, rivelando un sistema di raffreddamento con tre ventole. Entrambi i due slot per la RAM sono occupati, ma c'è ancora spazio per gli slot M.2.
Lettore di schede SD
| SD Card Reader | |
| average JPG Copy Test (av. of 3 runs) | |
| Medion Erazer Beast 18 X1 MD62731 (AV PRO microSD 128 GB V60) | |
| Aorus Master 18 AM8H (AV PRO microSD 128 GB V60) | |
| Media della classe Gaming (20.9 - 210, n=54, ultimi 2 anni) | |
| Acer Predator Helios 18 N23Q2 | |
| MSI GE78HX 13VH-070US (Angelibird AV Pro V60) | |
| maximum AS SSD Seq Read Test (1GB) | |
| Aorus Master 18 AM8H (AV PRO microSD 128 GB V60) | |
| Medion Erazer Beast 18 X1 MD62731 (AV PRO microSD 128 GB V60) | |
| Media della classe Gaming (25.5 - 261, n=51, ultimi 2 anni) | |
| MSI GE78HX 13VH-070US (Angelibird AV Pro V60) | |
| Acer Predator Helios 18 N23Q2 | |
Comunicazione
Webcam


Dispositivi di ingresso
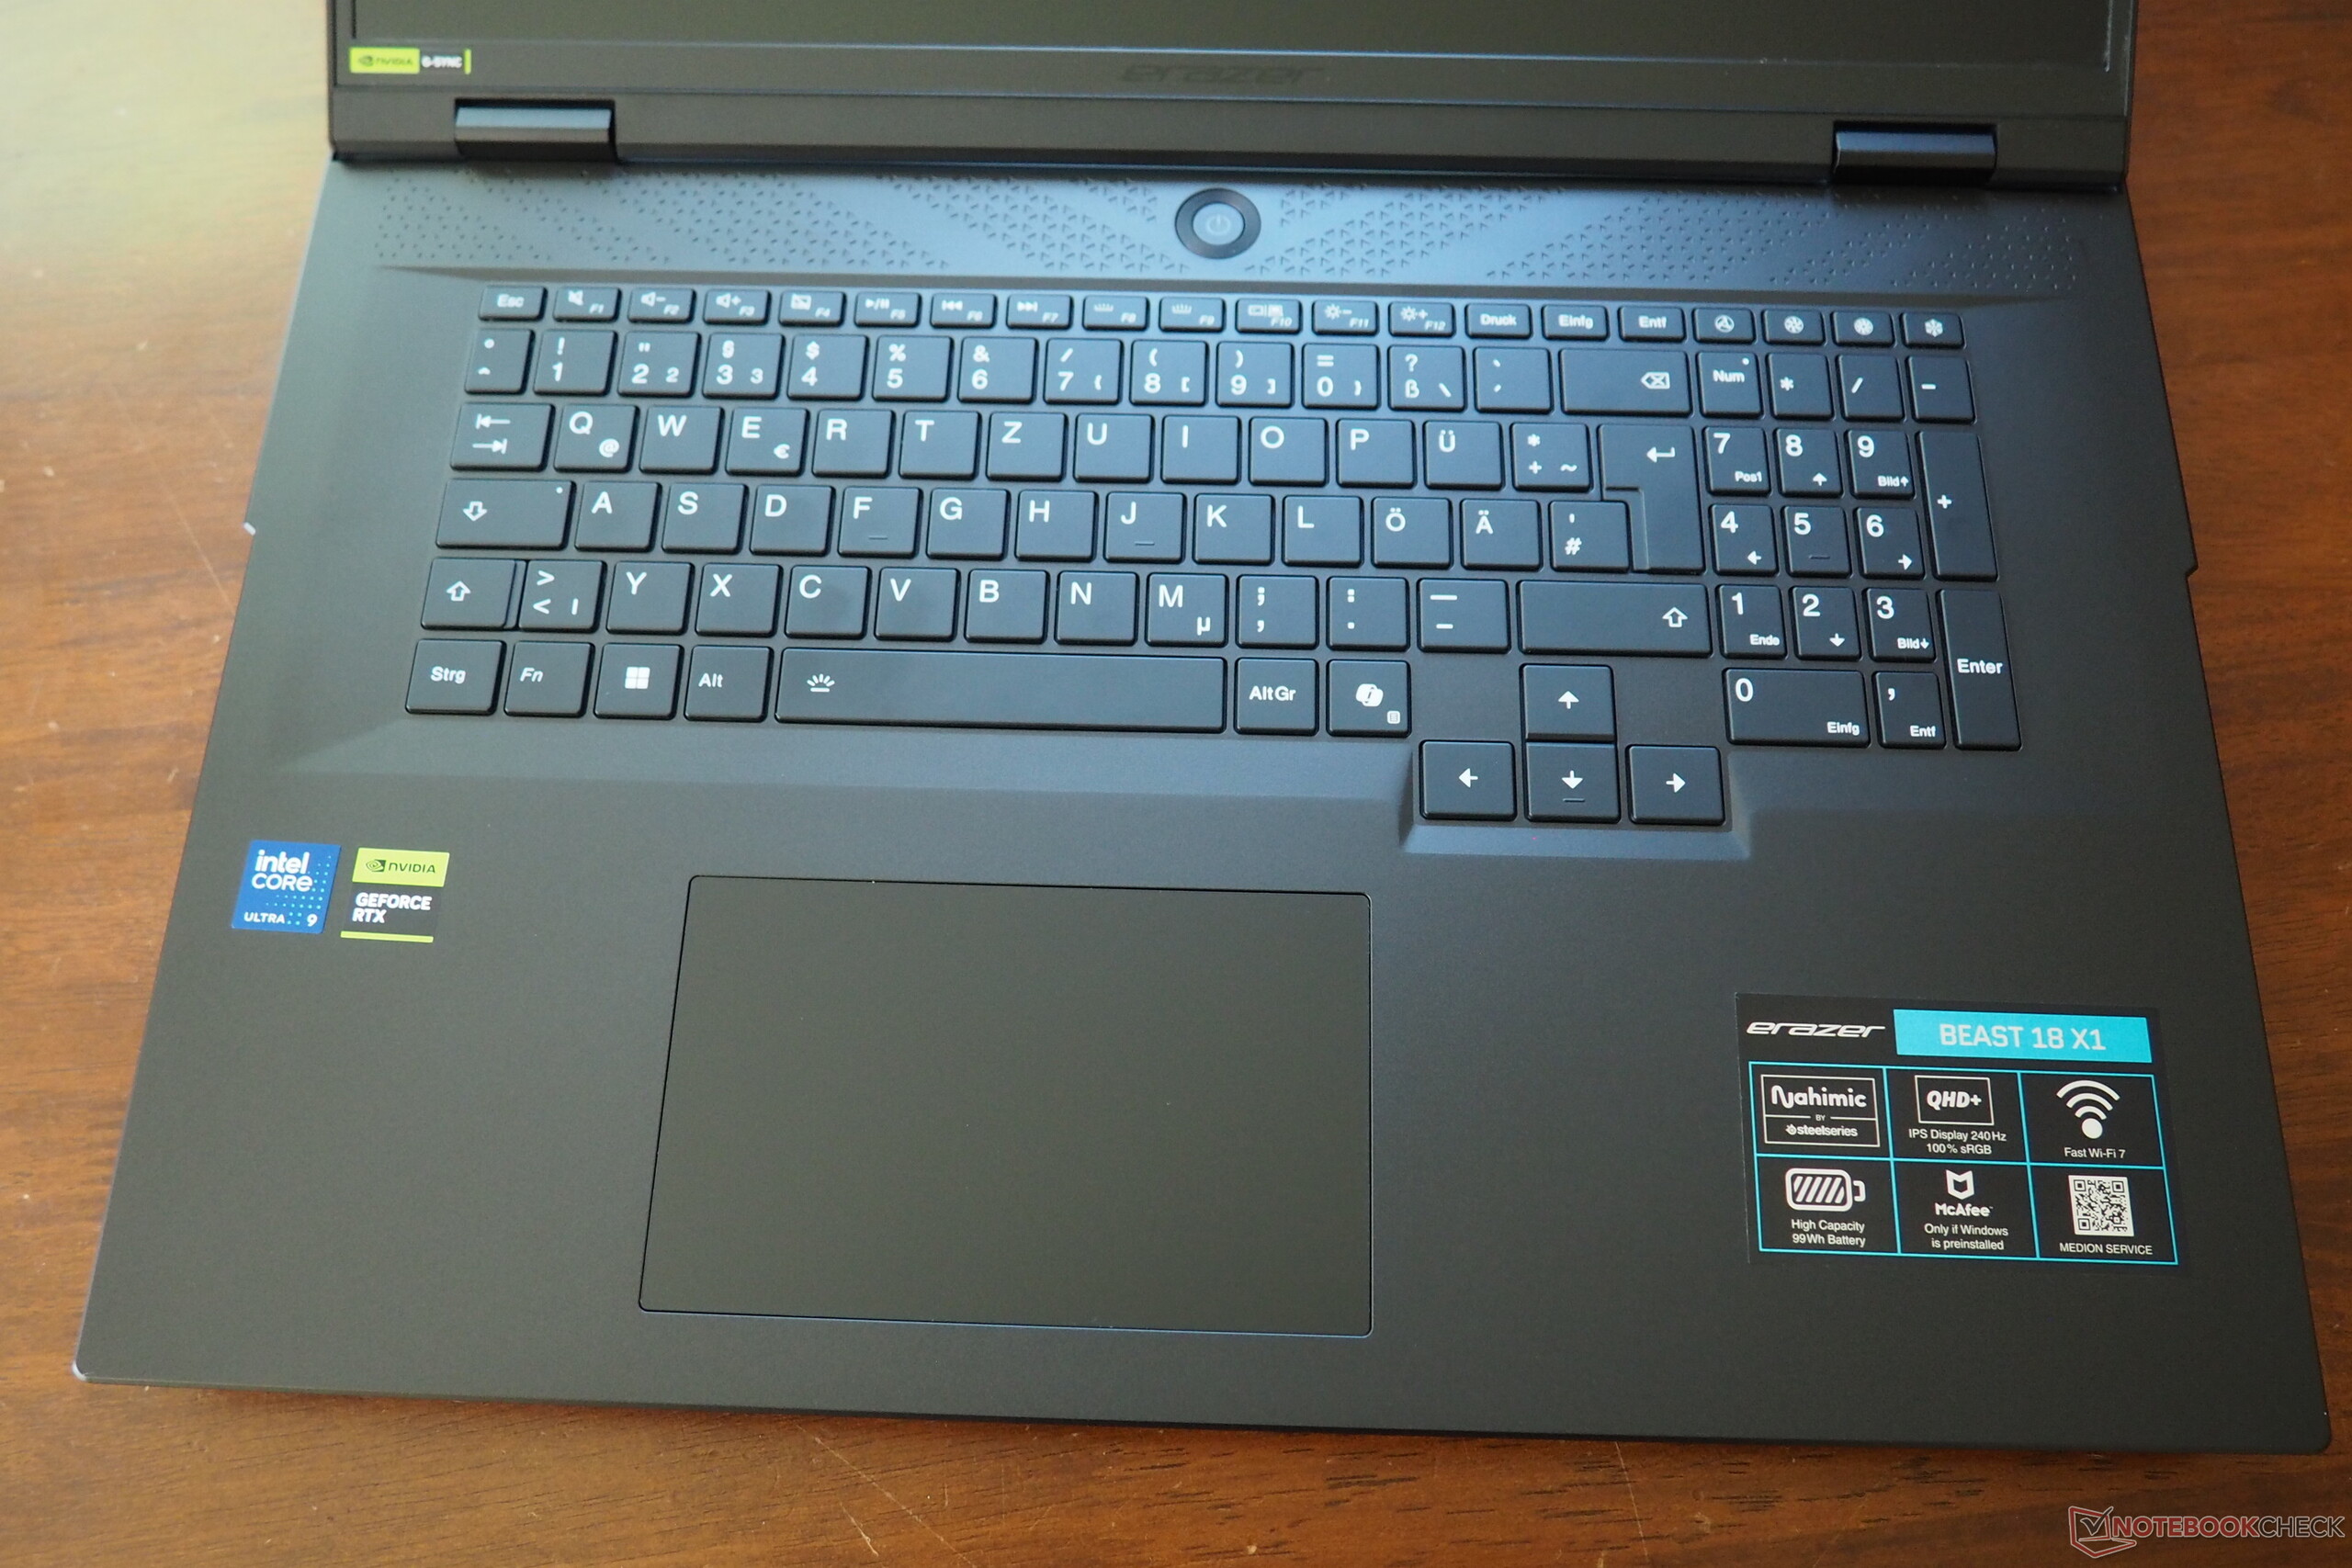
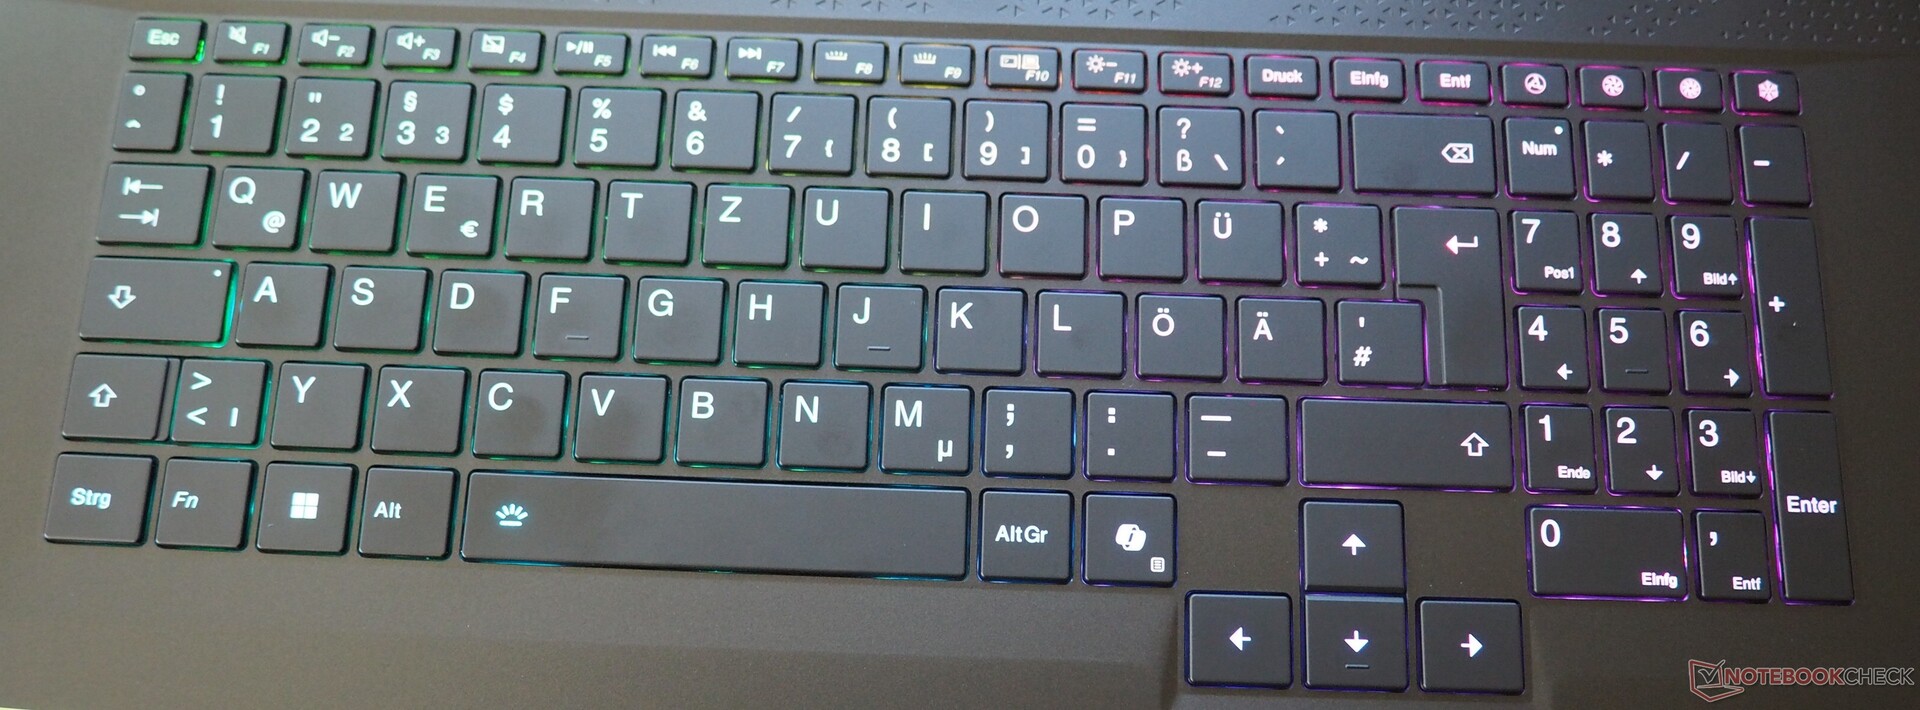
La tastiera chiclet ha un tastierino numerico dedicato e convince con frecce direzionali di dimensioni normali e (nell'angolo in alto a destra) pratici tasti speciali per il controllo della ventola. Il feedback e la sensazione dei tasti ci sembrano accettabili; l'Aorus Master 18, ad esempio, si comporta ancora meglio qui. Il clickpad potrebbe essere più stabile in alcuni punti, ma con una dimensione di circa 13 x 8 cm, è di dimensioni adeguate per un prodotto da 18 pollici.
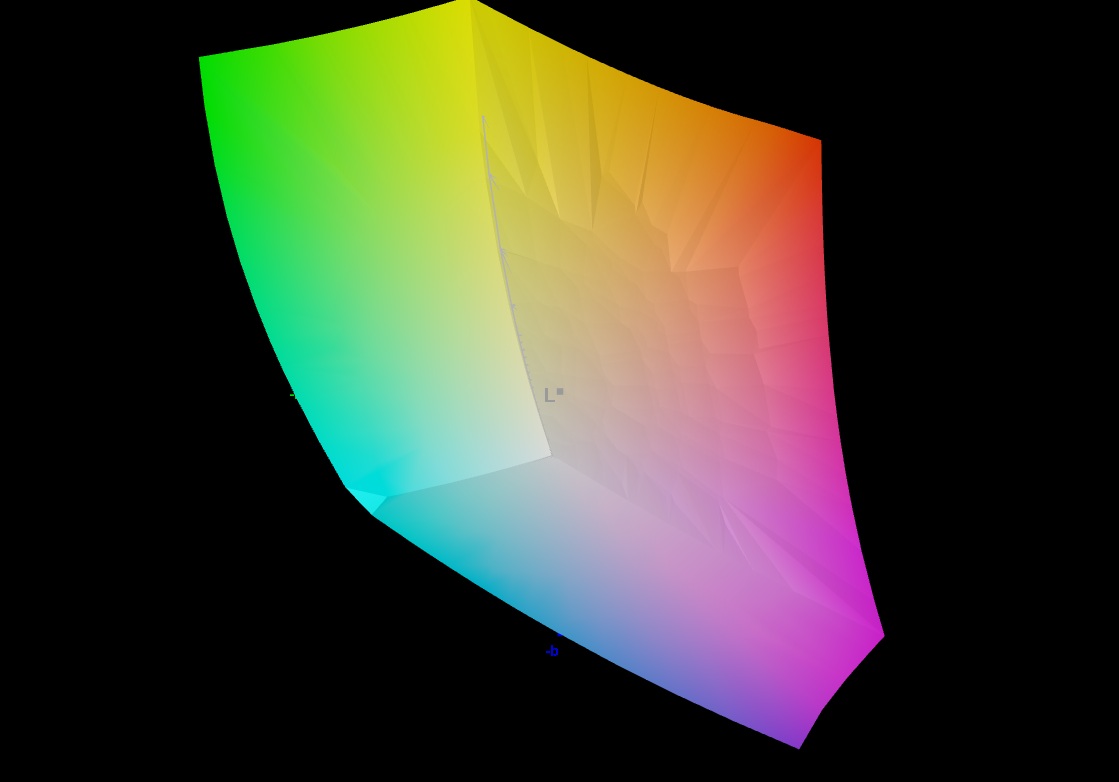
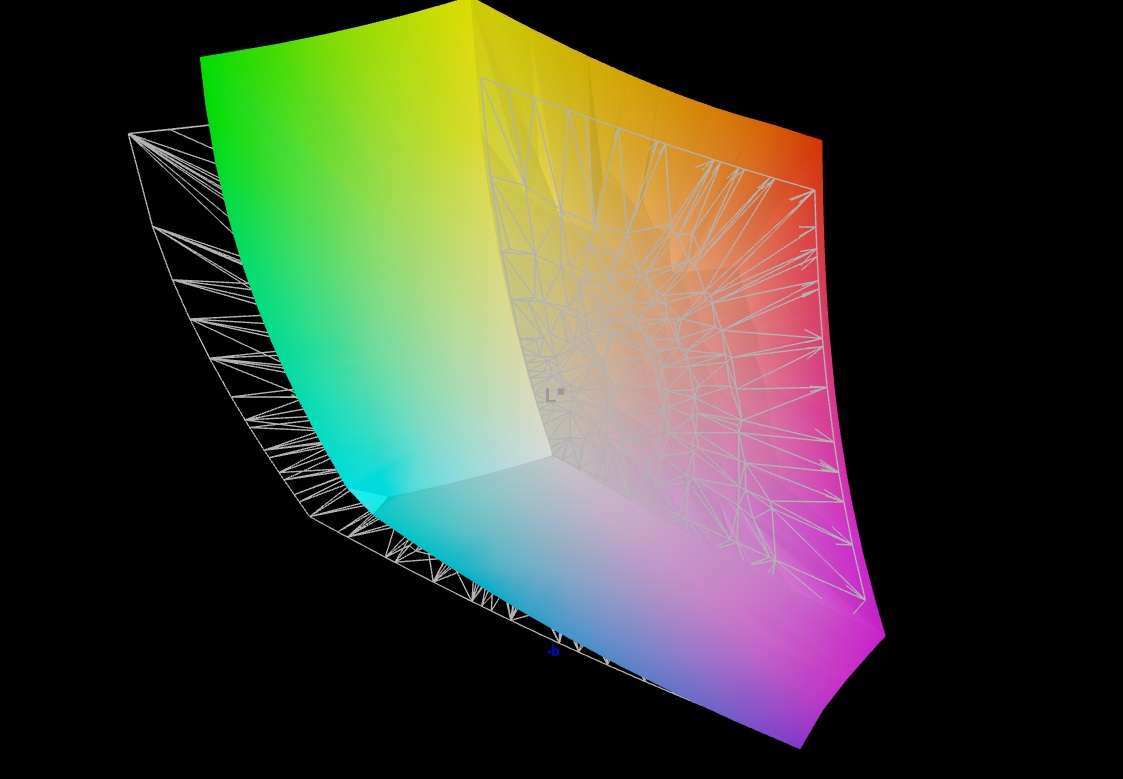
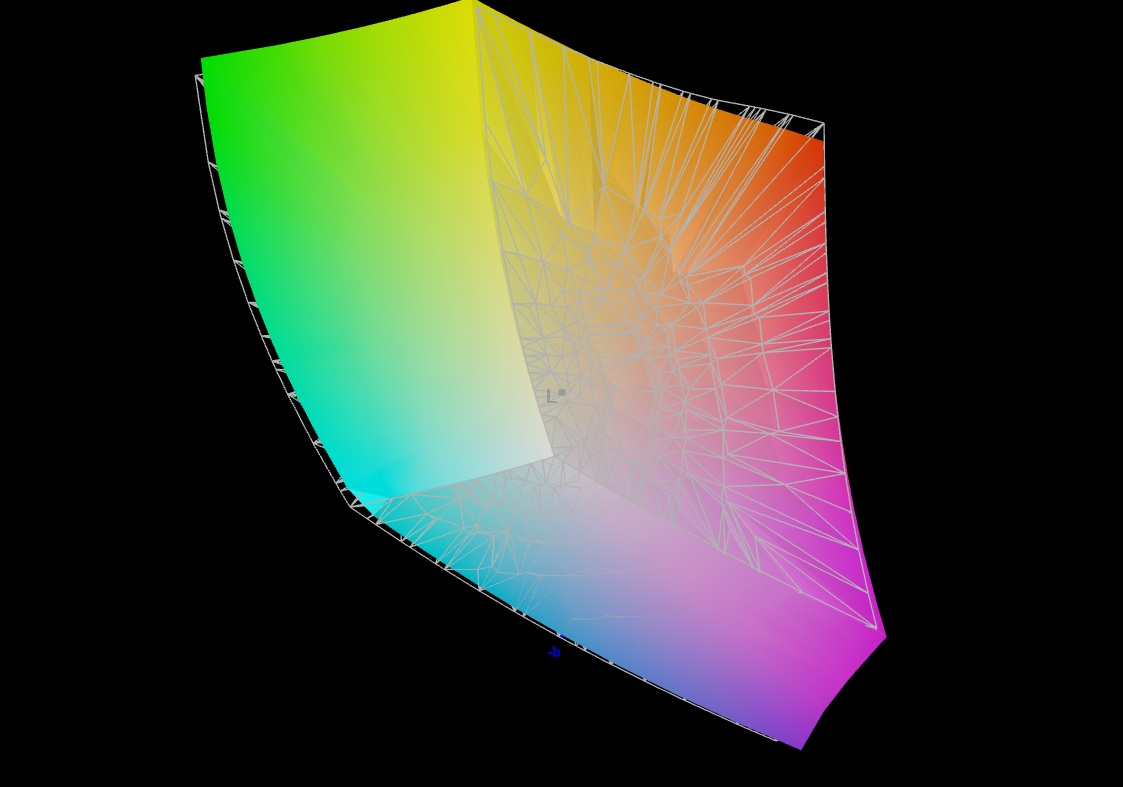
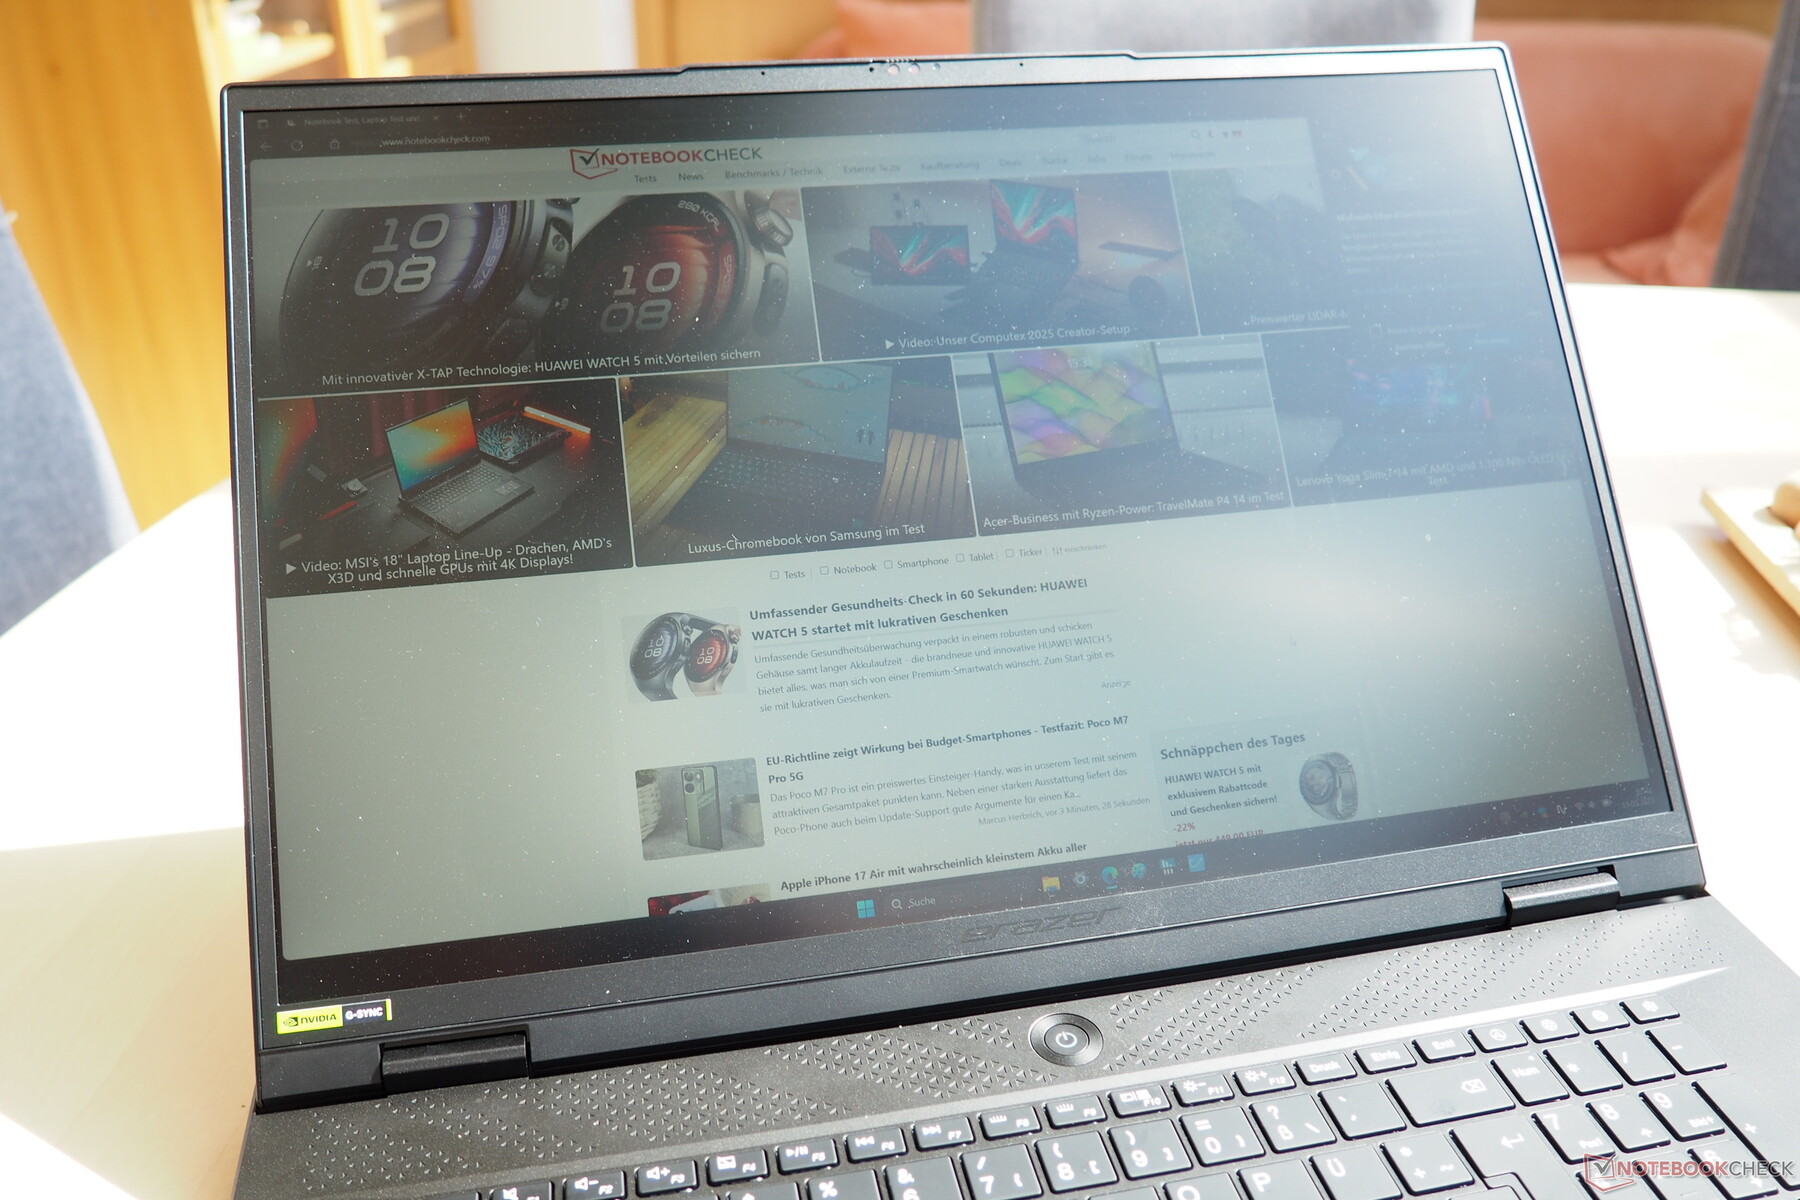
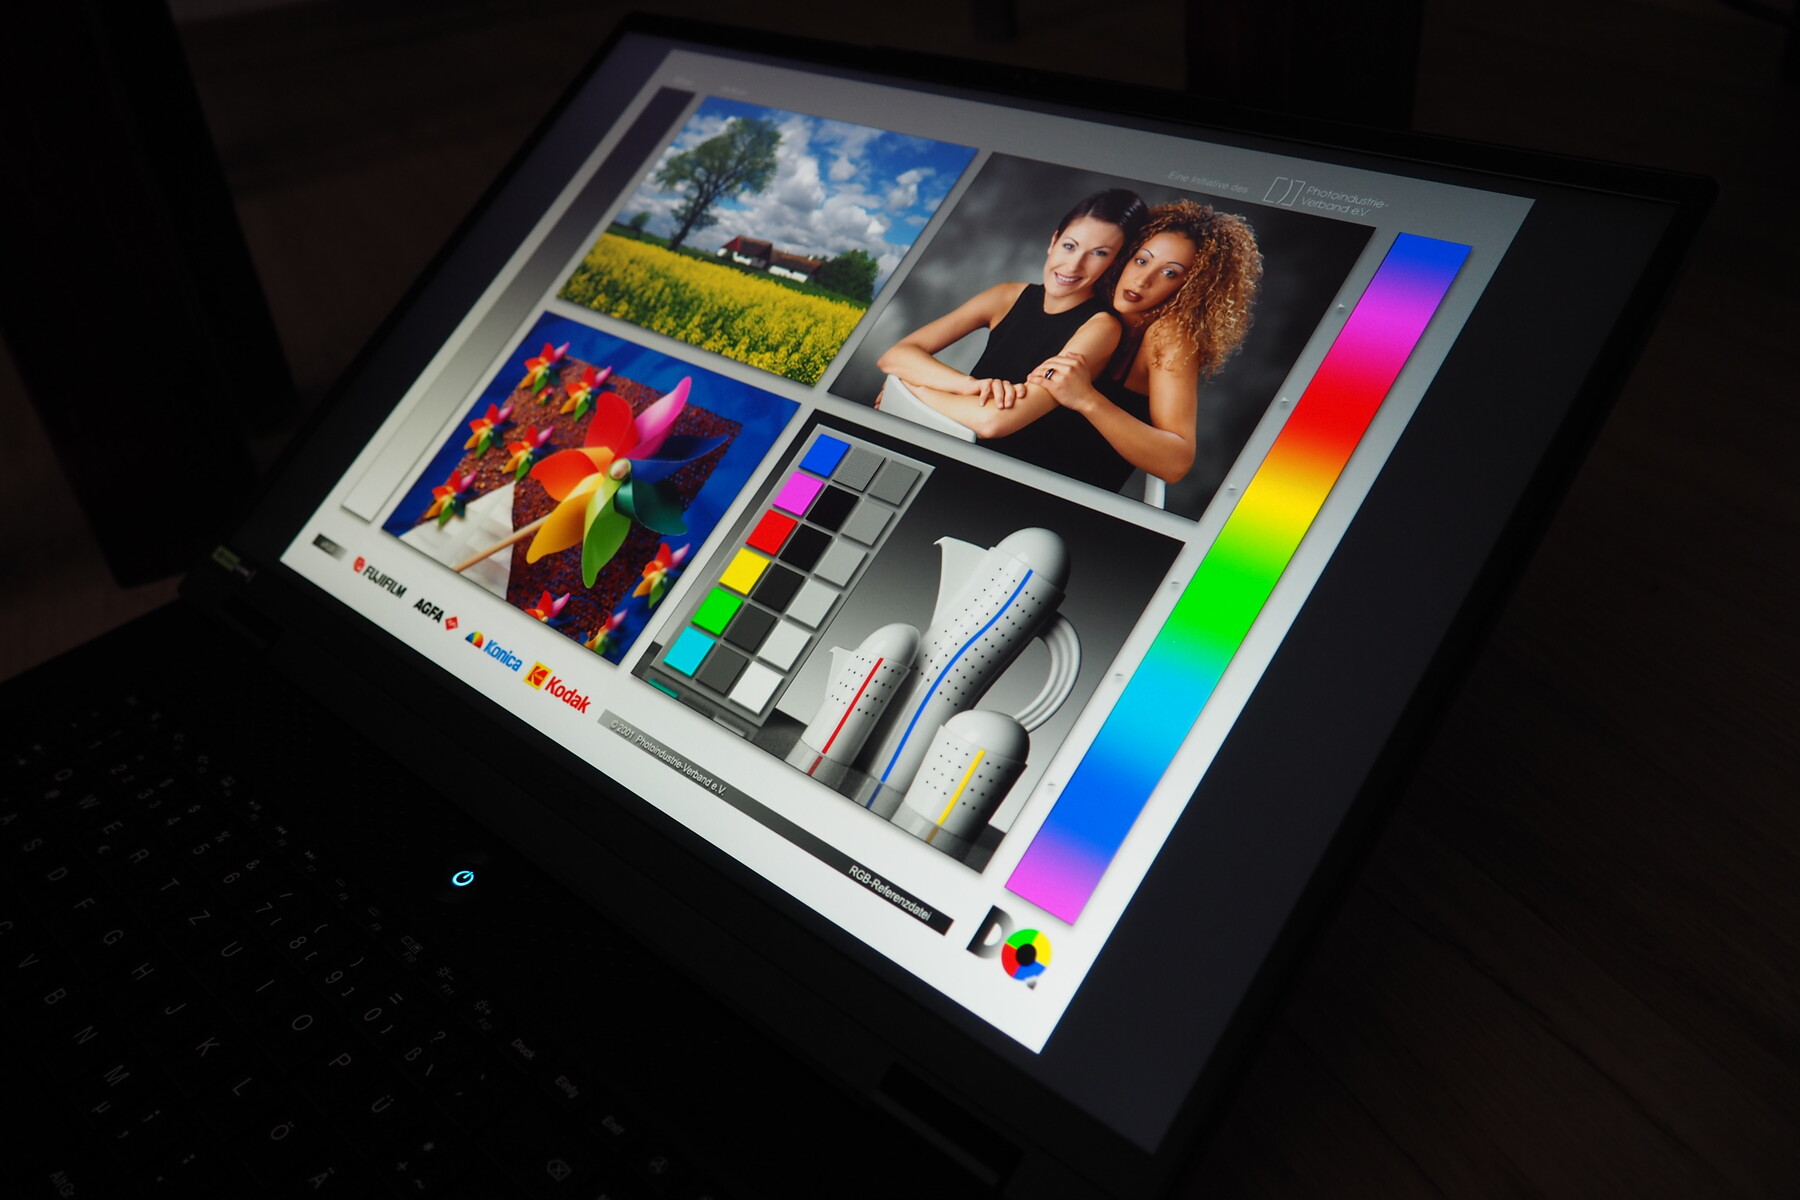
Display
Medion non utilizza un pannello OLED o mini-LED, ma si affida a un classico display IPS, che tuttavia offre buone prestazioni nella maggior parte delle discipline.
| |||||||||||||||||||||||||
Distribuzione della luminosità: 89 %
Al centro con la batteria: 478 cd/m²
Contrasto: 1195:1 (Nero: 0.4 cd/m²)
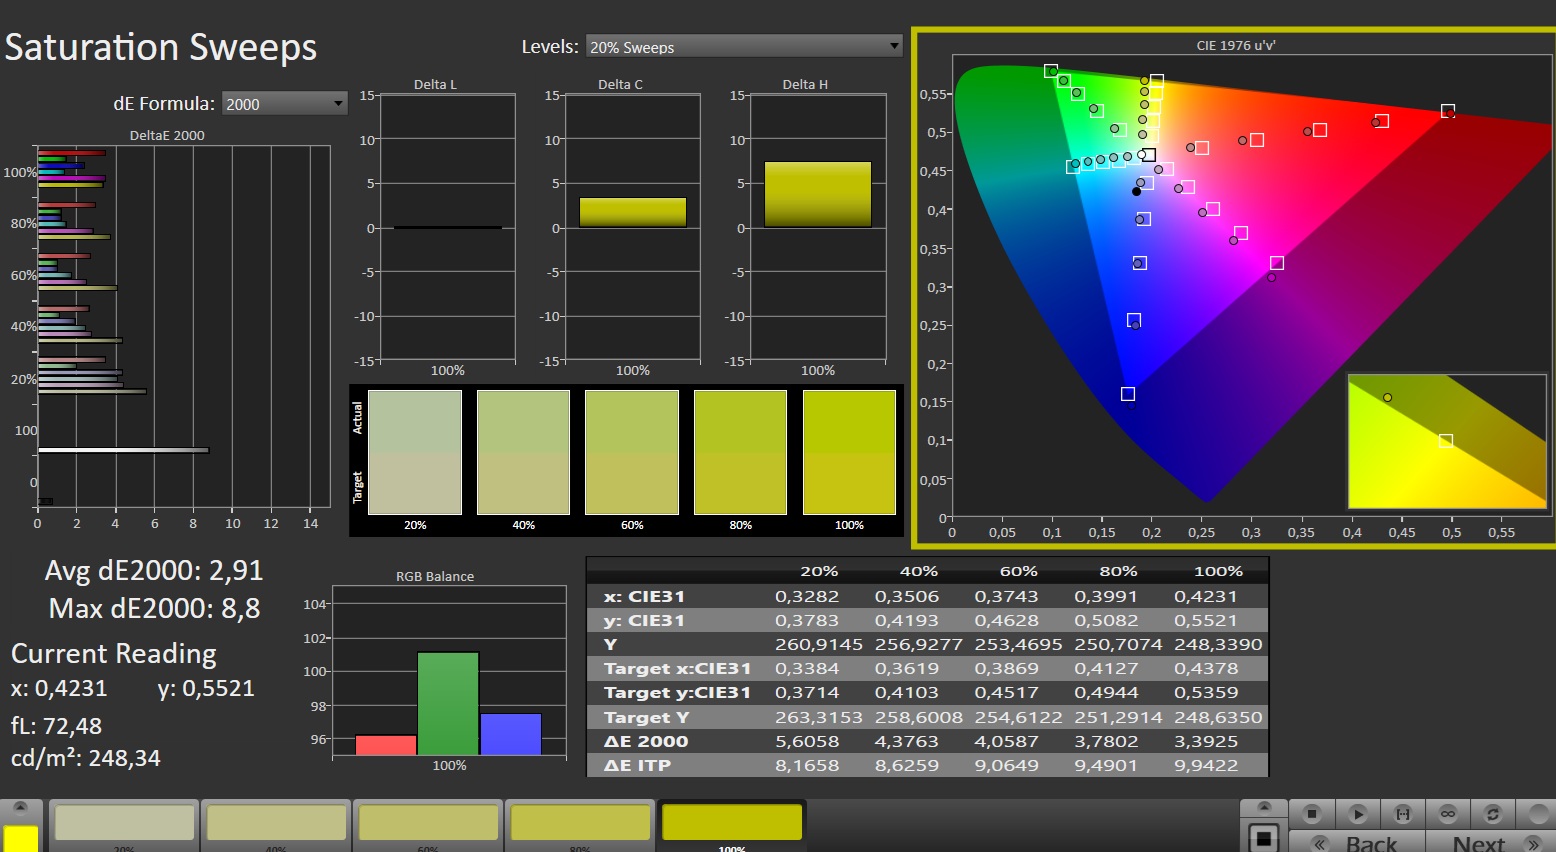
ΔE ColorChecker Calman: 3.94 | ∀{0.5-29.43 Ø4.72}
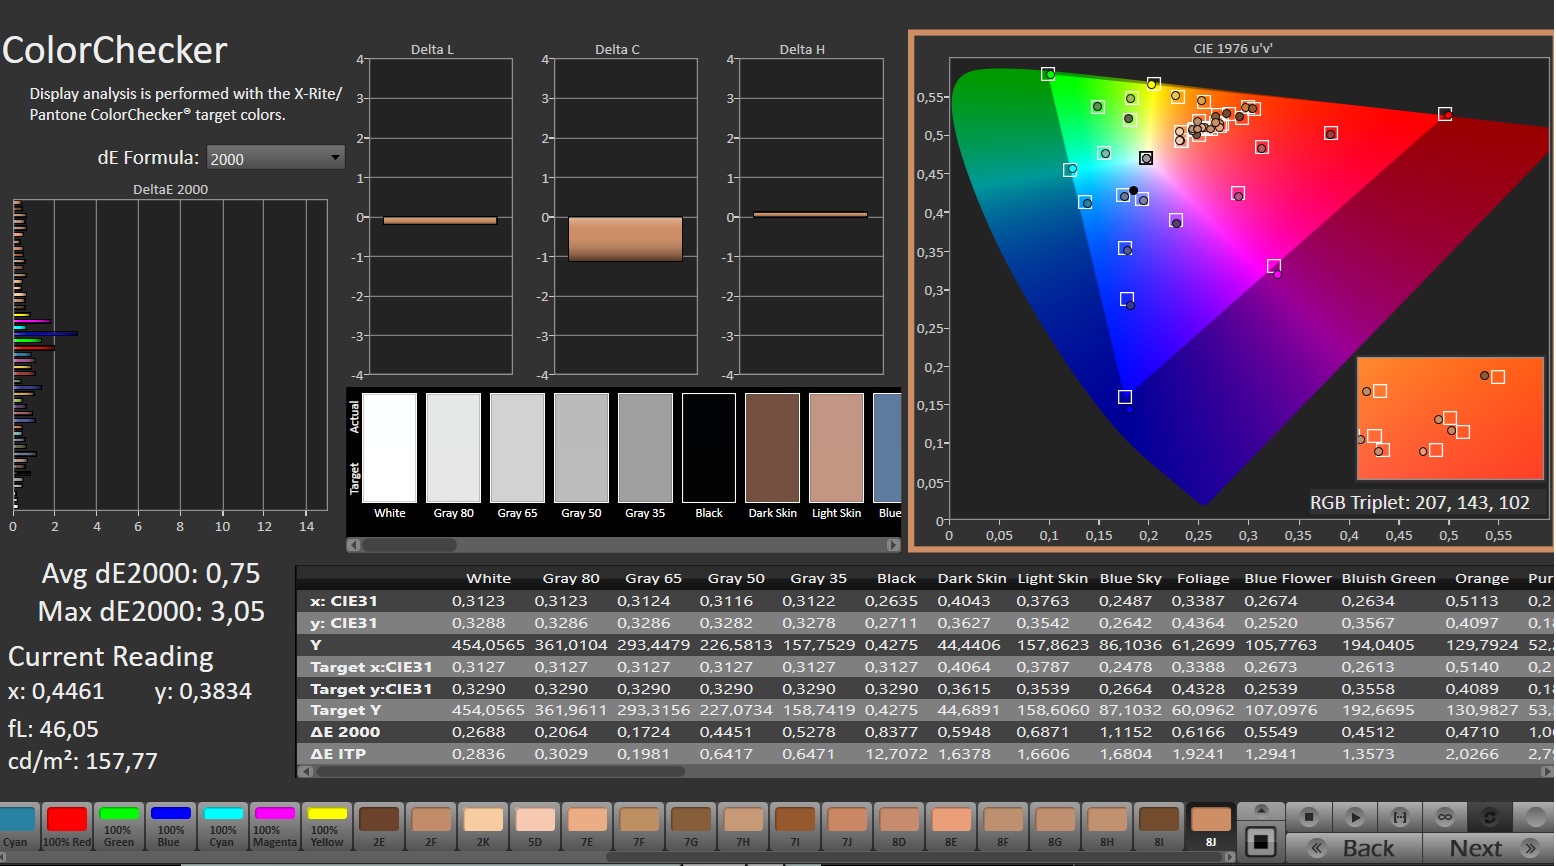
calibrated: 0.75
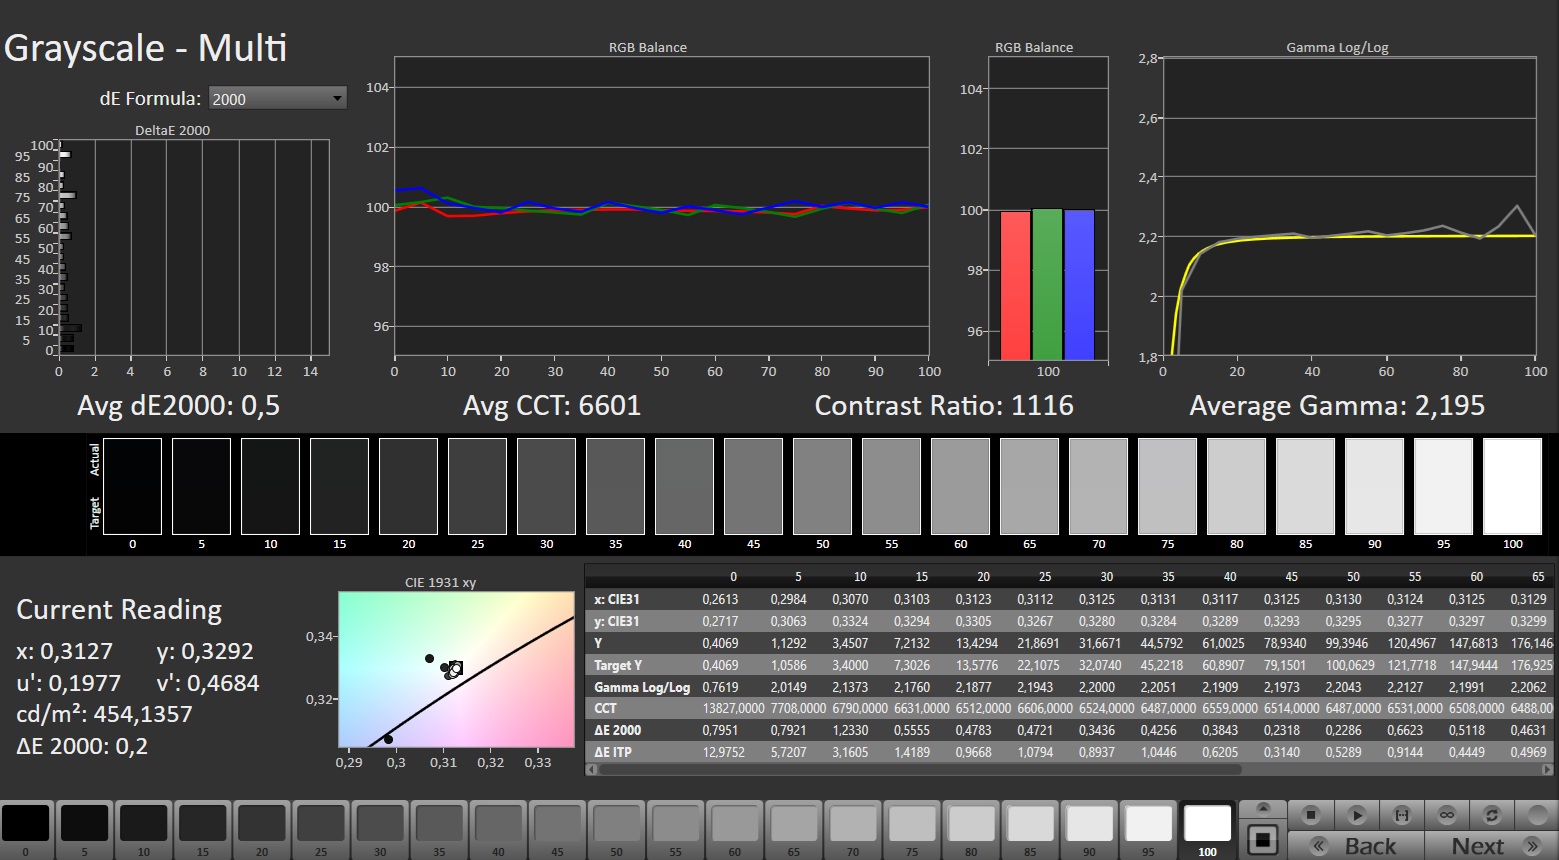
ΔE Greyscale Calman: 5.5 | ∀{0.09-98 Ø4.97}
84.7% AdobeRGB 1998 (Argyll 3D)
99.9% sRGB (Argyll 3D)
97.1% Display P3 (Argyll 3D)
Gamma: 2.212
CCT: 7059 K
| Medion Erazer Beast 18 X1 MD62731 BOEhydis NE180QDM-NZ2, IPS, 2560x1600, 18", 240 Hz | MSI GE78HX 13VH-070US AU Optronics B170QAN01.2, IPS, 2560x1600, 17", 240 Hz | Acer Predator Helios 18 N23Q2 AUO45A8 (B180QAN01.2), IPS, 2560x1600, 18", 250 Hz | Asus Strix Scar 18 G835LX N180QDM-NM2, Mini-LED, 2560x1600, 18", 240 Hz | Aorus Master 18 AM8H NE180QDM-NM1 (BOE0C58), Mini-LED, 2560x1600, 18", 240 Hz | Lenovo Legion Pro 7i 16 Gen 10 Samsung ATNA60HU01-0, OLED, 2560x1600, 16", 240 Hz | |
|---|---|---|---|---|---|---|
| Display | 1% | 4% | 2% | 2% | 4% | |
| Display P3 Coverage (%) | 97.1 | 97.6 1% | 99.8 3% | 99 2% | 99.9 3% | 99.5 2% |
| sRGB Coverage (%) | 99.9 | 99.9 0% | 100 0% | 100 0% | 100 0% | 100 0% |
| AdobeRGB 1998 Coverage (%) | 84.7 | 86.5 2% | 91.8 8% | 87.2 3% | 87.7 4% | 94.4 11% |
| Response Times | 19% | -90% | -37% | -102% | 95% | |
| Response Time Grey 50% / Grey 80% * (ms) | 5.6 ? | 4.2 ? 25% | 7.6 ? -36% | 7.4 ? -32% | 16.4 ? -193% | 0.28 ? 95% |
| Response Time Black / White * (ms) | 7.3 ? | 6.4 ? 12% | 17.8 ? -144% | 10.4 ? -42% | 8.1 ? -11% | 0.43 ? 94% |
| PWM Frequency (Hz) | 2509 | 20610 ? | 1398 ? | 1438 ? | ||
| PWM Amplitude * (%) | 100 | 100 | 29 | |||
| Screen | -15% | -14% | 119% | 53% | 20% | |
| Brightness middle (cd/m²) | 478 | 398.6 -17% | 360 -25% | 764 60% | 438 -8% | 490.4 3% |
| Brightness (cd/m²) | 456 | 384 -16% | 355 -22% | 747 64% | 451 -1% | 498 9% |
| Brightness Distribution (%) | 89 | 89 0% | 92 3% | 93 4% | 90 1% | 97 9% |
| Black Level * (cd/m²) | 0.4 | 0.46 -15% | 0.21 48% | 0.1 75% | 0.13 67% | |
| Contrast (:1) | 1195 | 867 -27% | 1714 43% | 7640 539% | 3369 182% | |
| Colorchecker dE 2000 * | 3.94 | 4.05 -3% | 3.82 3% | 1.2 70% | 1.25 68% | 3.2 19% |
| Colorchecker dE 2000 max. * | 8.6 | 8.68 -1% | 7.38 14% | 2.8 67% | 4.93 43% | 6.04 30% |
| Colorchecker dE 2000 calibrated * | 0.75 | 1.02 -36% | 2.24 -199% | 0.84 -12% | ||
| Greyscale dE 2000 * | 5.5 | 6.5 -18% | 5.06 8% | 1.5 73% | 1.7 69% | 1 82% |
| Gamma | 2.212 99% | 2.11 104% | 2.52 87% | 2.17 101% | 2.173 101% | 2.24 98% |
| CCT | 7059 92% | 7518 86% | 5657 115% | 6556 99% | 6518 100% | 6373 102% |
| Media totale (Programma / Settaggio) | 2% /
-7% | -33% /
-21% | 28% /
68% | -16% /
17% | 40% /
29% |
* ... Meglio usare valori piccoli
A cominciare dallo spazio colore, che copre quasi il 100% di sRGB e DCI-P3 (AdobeRGB è coperto all'85%). Anche la luminosità è buona, con una media di 456 cd/m² disponibili.
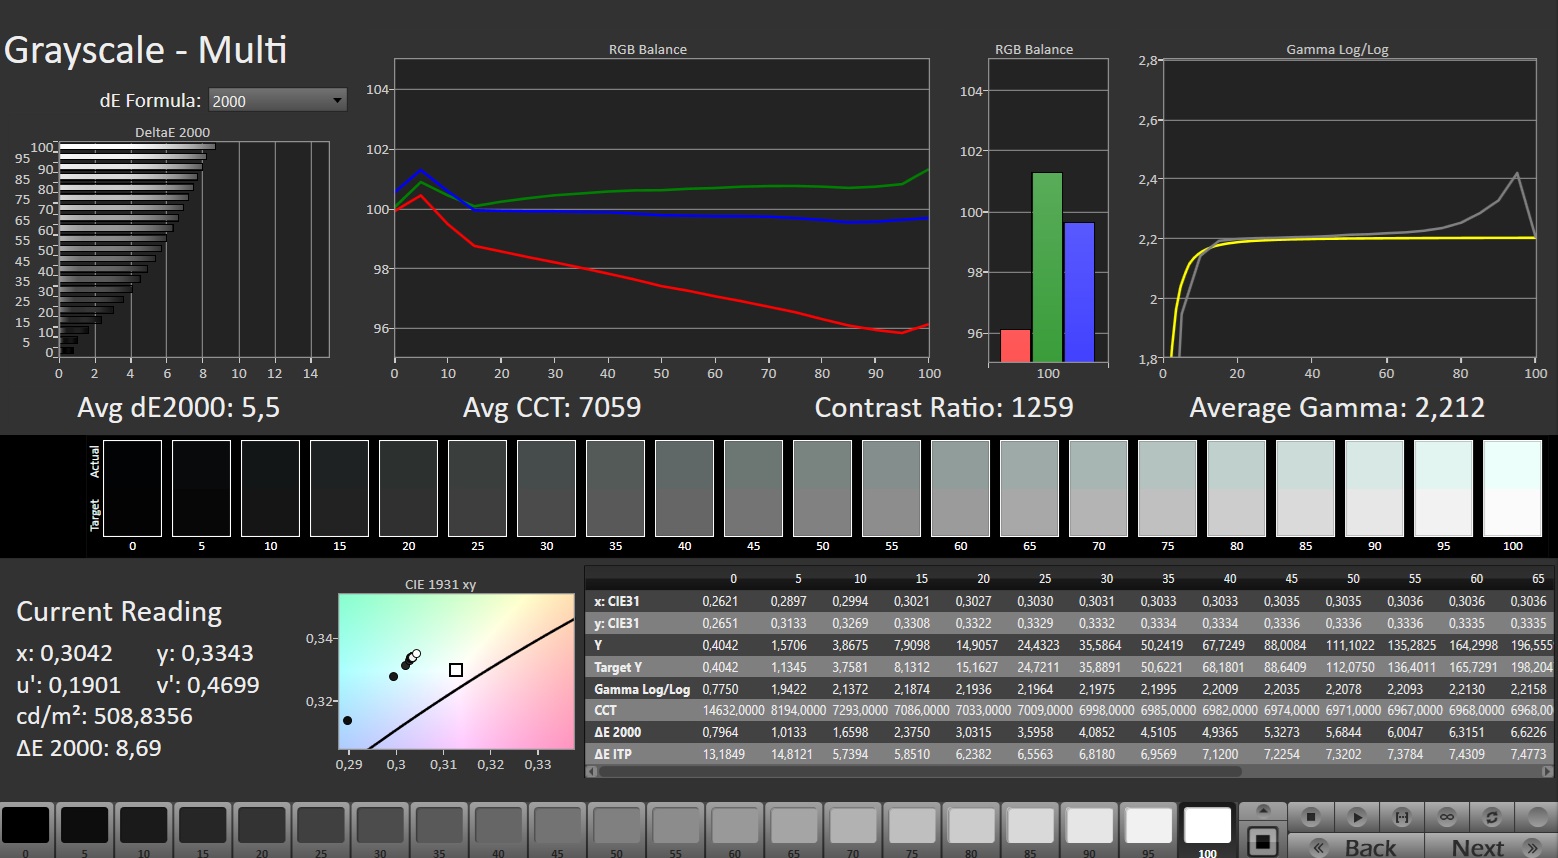
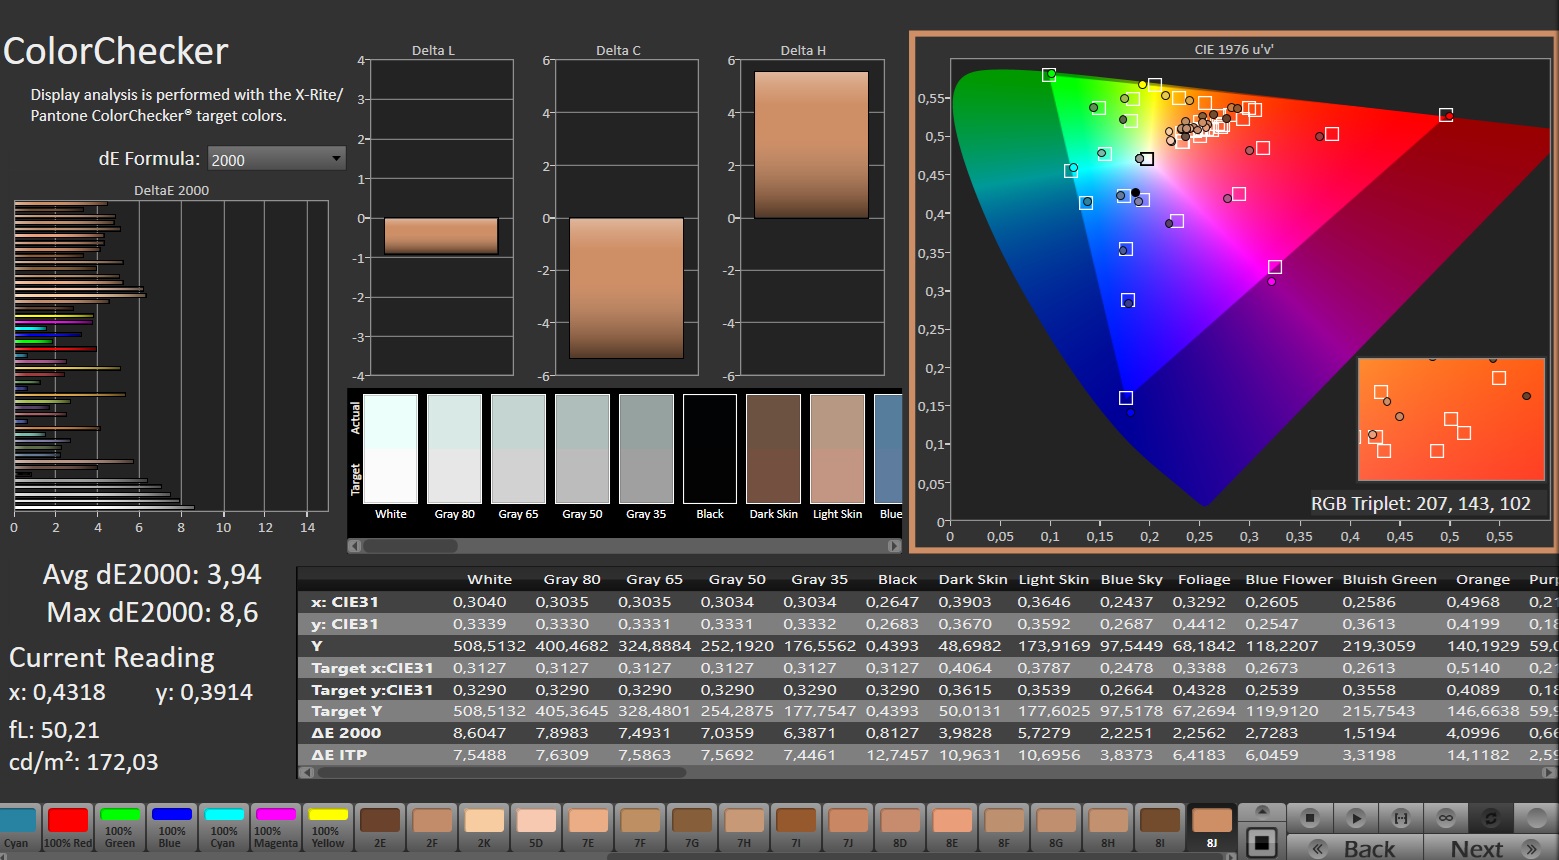
Il contrasto è solo decente a causa del mediocre valore del nero di 0,4 cd/m², ma 1.195:1 rientra comunque nella consueta gamma IPS. Lo stesso vale per gli angoli di visione e il tempo di risposta che, secondo le nostre misurazioni, si aggira tra i 5 e i 7 ms.
Secondo le specifiche, lo schermo da 18 pollici supporta anche una frequenza di aggiornamento di 240 Hz. Ha una risoluzione di 2.560 x 1.600 pixel (formato 16:10), che non è né bassa né particolarmente alta in relazione alla diagonale dello schermo.
Tempi di risposta del Display
| ↔ Tempi di risposta dal Nero al Bianco | ||
|---|---|---|
| 7.3 ms ... aumenta ↗ e diminuisce ↘ combinato | ↗ 2.2 ms Incremento | 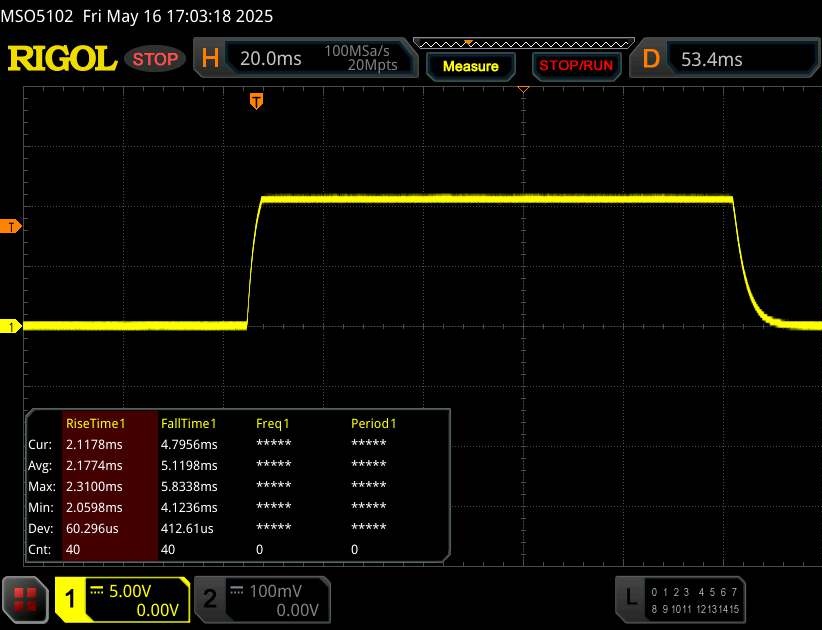 |
| ↘ 5.1 ms Calo | ||
| Lo schermo ha mostrato valori di risposta molto veloci nei nostri tests ed è molto adatto per i gaming veloce. In confronto, tutti i dispositivi di test variano da 0.1 (minimo) a 240 (massimo) ms. » 22 % di tutti i dispositivi è migliore. Questo significa che i tempi di risposta rilevati sono migliori rispettto alla media di tutti i dispositivi testati (19.8 ms). | ||
| ↔ Tempo di risposta dal 50% Grigio all'80% Grigio | ||
| 5.6 ms ... aumenta ↗ e diminuisce ↘ combinato | ↗ 2.7 ms Incremento | 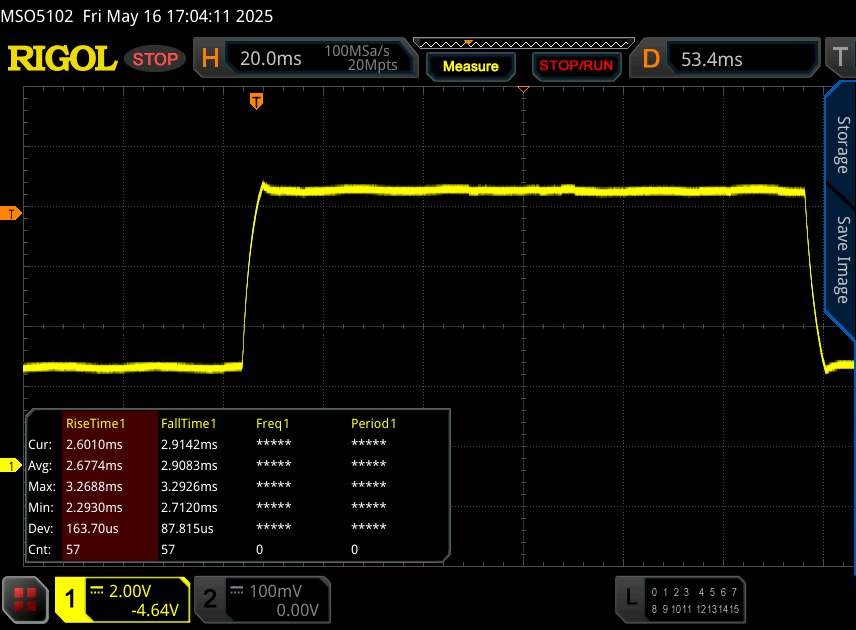 |
| ↘ 2.9 ms Calo | ||
| Lo schermo ha mostrato valori di risposta molto veloci nei nostri tests ed è molto adatto per i gaming veloce. In confronto, tutti i dispositivi di test variano da 0.165 (minimo) a 636 (massimo) ms. » 18 % di tutti i dispositivi è migliore. Questo significa che i tempi di risposta rilevati sono migliori rispettto alla media di tutti i dispositivi testati (31 ms). | ||
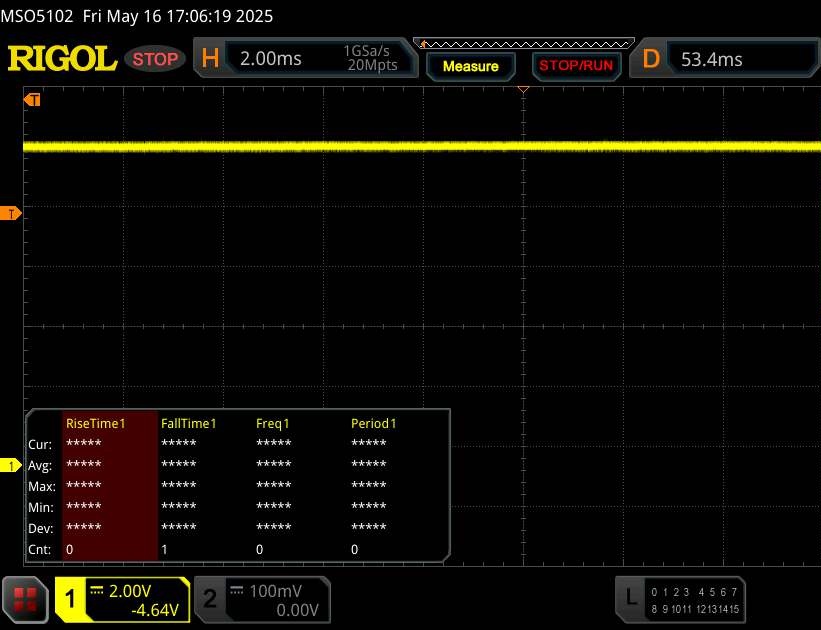
Sfarfallio dello schermo / PWM (Pulse-Width Modulation)
| flickering dello schermo / PWM non rilevato |  | ||
In confronto: 52 % di tutti i dispositivi testati non utilizza PWM per ridurre la luminosita' del display. Se è rilevato PWM, una media di 7778 (minimo: 5 - massimo: 343500) Hz è stata rilevata. | |||
Prestazioni
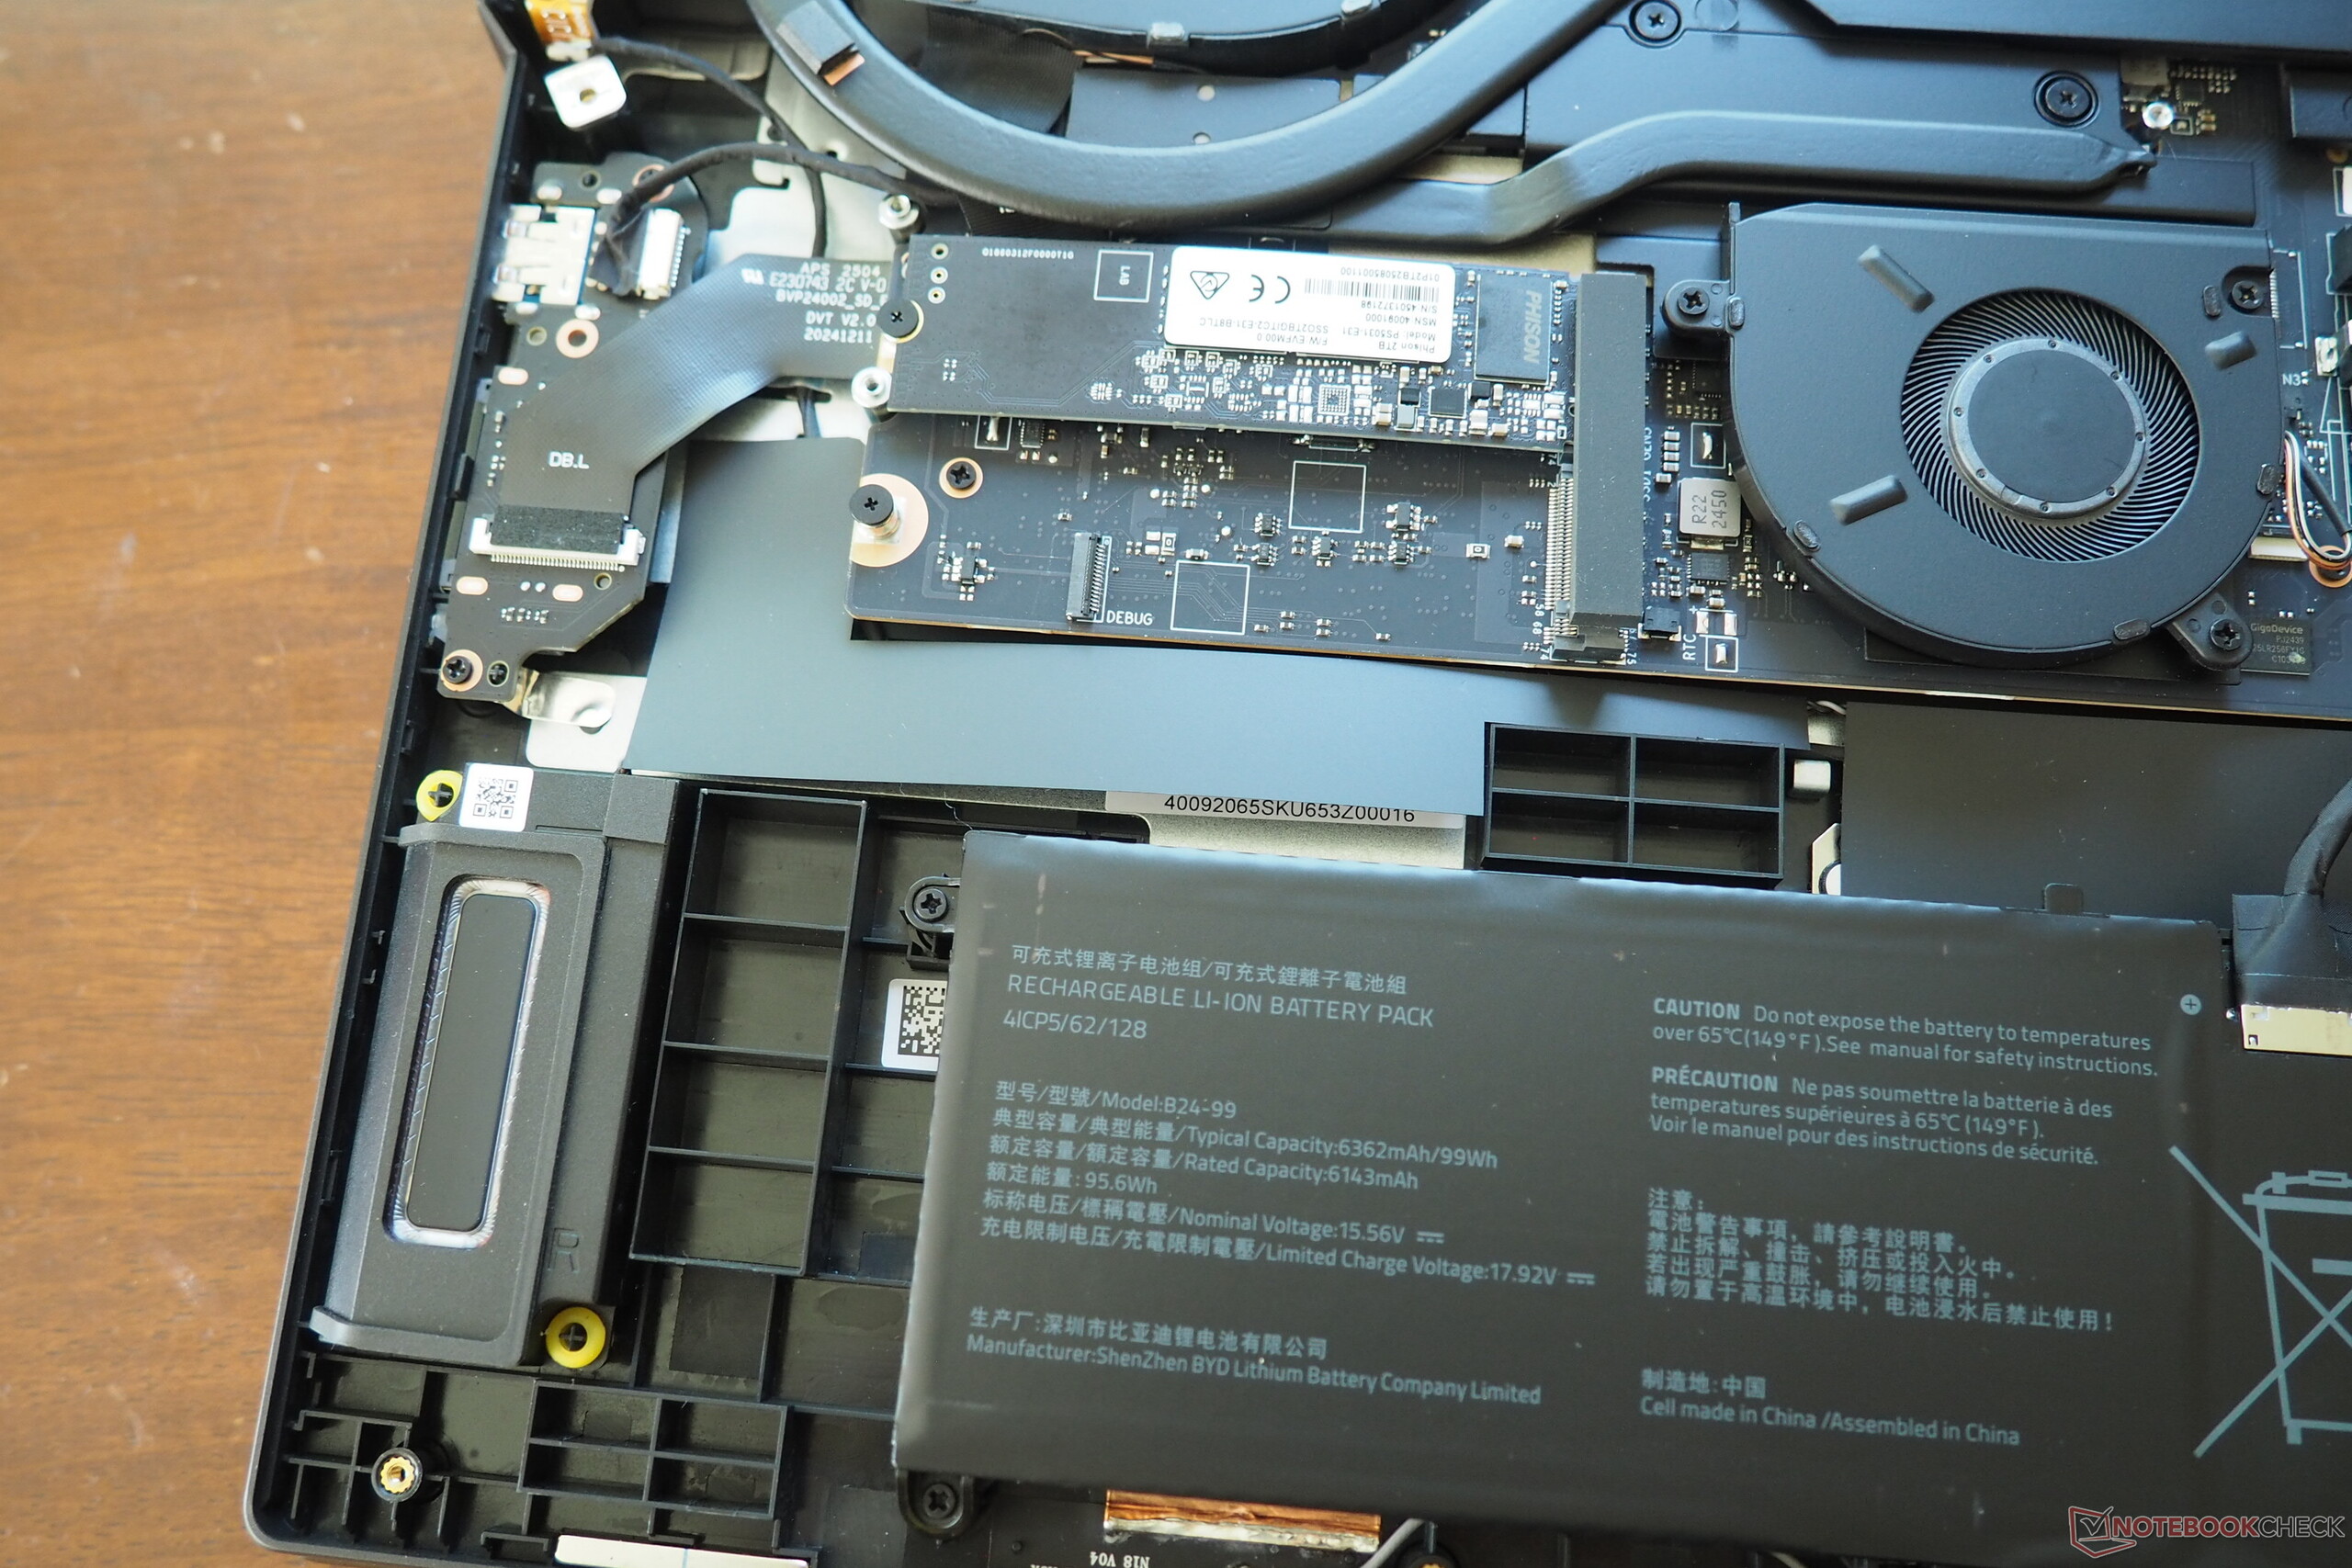
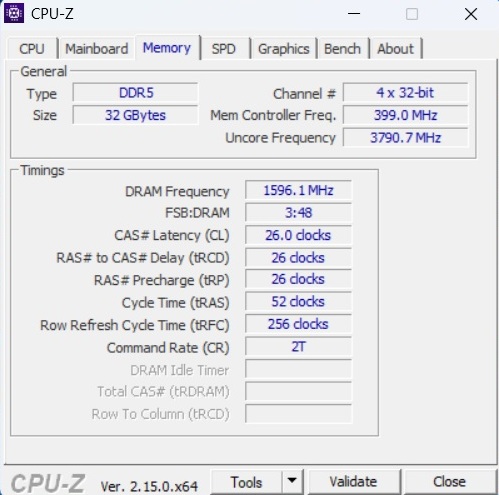
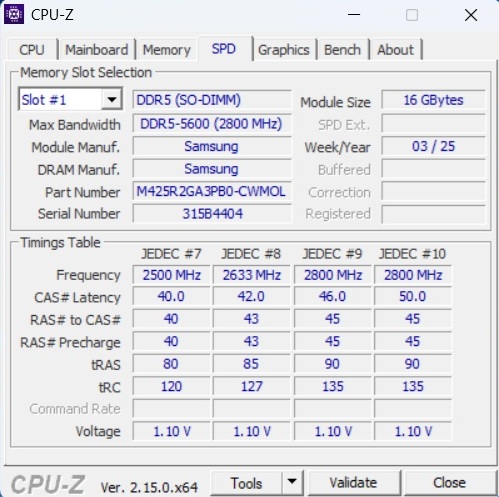
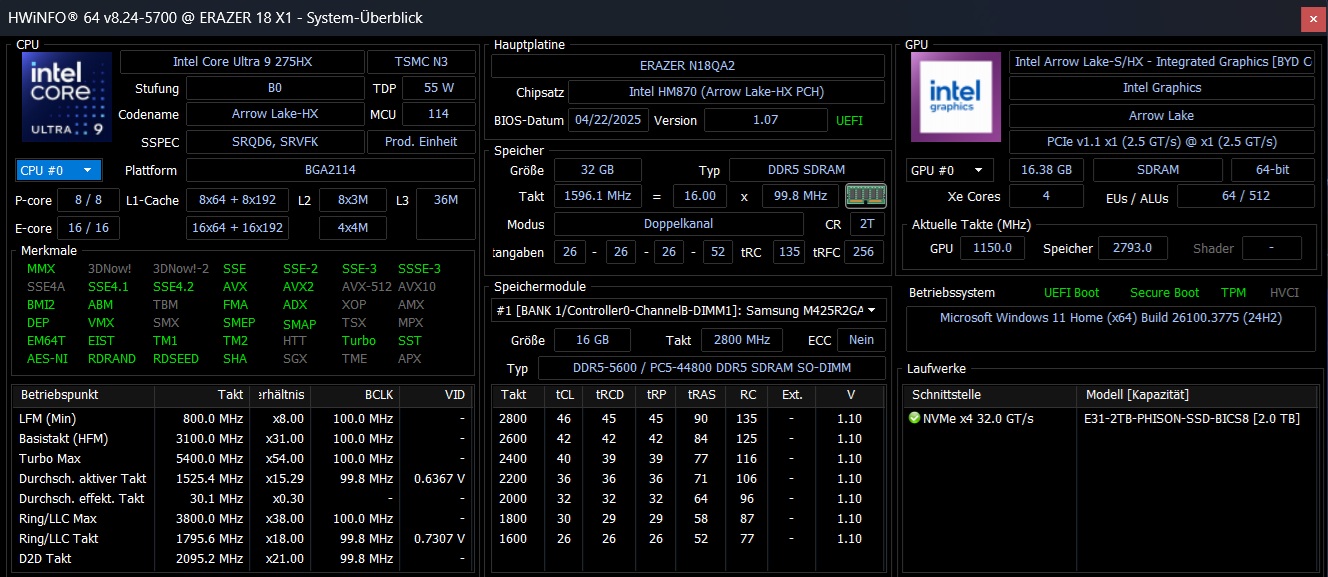
Beast 18 X1 non solo appartiene al segmento di fascia alta in termini di prezzo, ma anche in termini di prestazioni. 32 GB di RAM sono adeguati nel 2025 quanto un SSD da 2 TB, sebbene ci si possa aspettare (anche) di più per oltre 4.000 dollari. Per inciso, Medion offre anche la Beast 18 X1 con la RTX 5090 mobile a ~5.650 dollari.
Condizioni del test
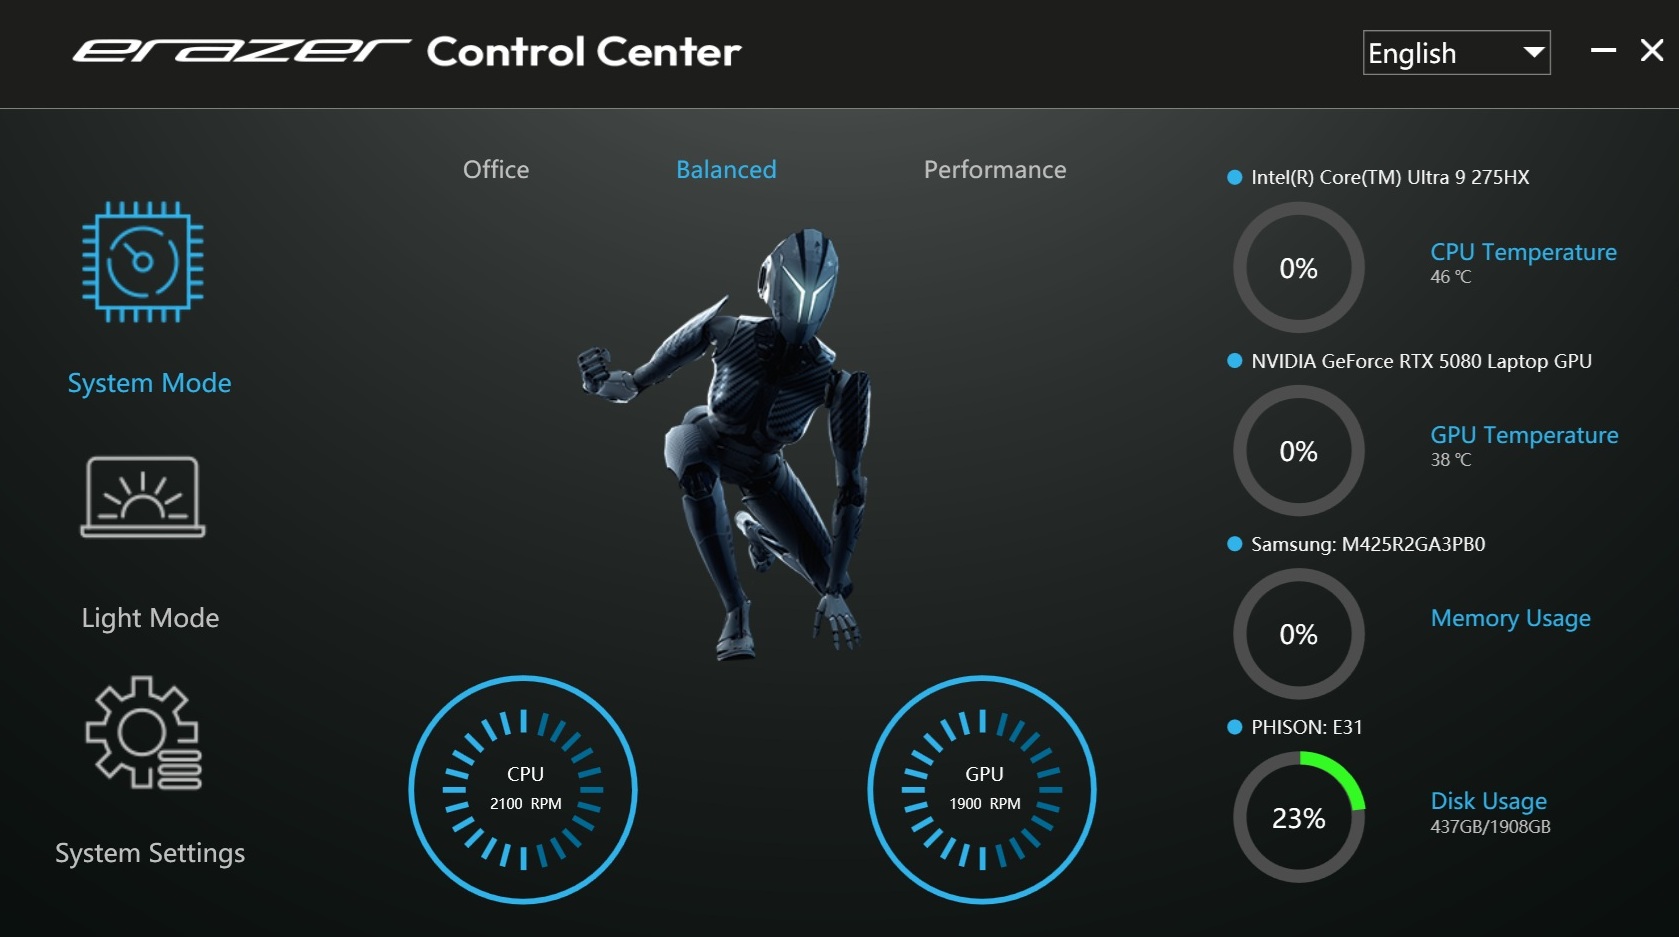
Ci sono tre modalità operative nel Centro di controllo di Erazer, alcune delle quali hanno un impatto significativo sulle emissioni e sulla velocità. Poiché il 18 pollici è quasi assurdamente rumoroso in modalità Performance, con oltre 60 dB(A) in alcuni punti, per le misurazioni ci siamo limitati alla modalità Bilanciata, altrettanto udibile, che consuma leggermente di più la potenza della CPU rispetto a quella della GPU (vedere tabella).
| Modalità Centro di Controllo Erazer | Ufficio | Bilanciato | Prestazioni |
| Cyberpunk 2077 Rumore | max. 46 dB(A) | max. 53 dB(A) | max. 61 dB(A) |
| Prestazioni di Cyberpunk 2077 (FHD/Ultra) | 78,8 fps | 139,8 fps | 146,5 fps |
| Punteggio Cinebench R15 Multi | 3596 Punti | 4871 Punti | 6154 Punti |
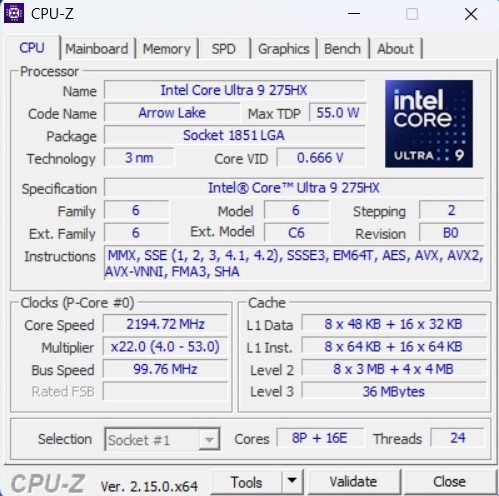
Processore
Se si prende come base la modalità bilanciata, l'installazione del Core Ultra 9 275HX installatoche contiene 8 core per le prestazioni e 16 core per l'efficienza (ciascuno senza Hyper-Threading), le prestazioni sono leggermente inferiori al valore medio determinato finora per questa CPU e raggiungono all'incirca il livello dell'Aorus Master 18 (anch'esso non è stato testato in modalità massima a causa del forte rumore di fondo). È particolarmente spiacevole che i risultati nel ciclo Cinebench calino di diversi punti percentuali con il passare del tempo, cosa che non accade con i dispositivi della concorrenza.
Cinebench R15 Multi loop
* ... Meglio usare valori piccoli
AIDA64: FP32 Ray-Trace | FPU Julia | CPU SHA3 | CPU Queen | FPU SinJulia | FPU Mandel | CPU AES | CPU ZLib | FP64 Ray-Trace | CPU PhotoWorxx
| Performance rating | |
| Asus Strix Scar 18 G835LX | |
| Lenovo Legion Pro 7i 16 Gen 10 | |
| Media Intel Core Ultra 9 275HX | |
| Acer Predator Helios 18 N23Q2 | |
| Aorus Master 18 AM8H | |
| MSI GE78HX 13VH-070US | |
| Media della classe Gaming | |
| Medion Erazer Beast 18 X1 MD62731 | |
| AIDA64 / FP32 Ray-Trace | |
| Asus Strix Scar 18 G835LX | |
| Lenovo Legion Pro 7i 16 Gen 10 | |
| Media Intel Core Ultra 9 275HX (28039 - 39895, n=30) | |
| Aorus Master 18 AM8H | |
| Media della classe Gaming (10227 - 85542, n=109, ultimi 2 anni) | |
| Medion Erazer Beast 18 X1 MD62731 | |
| MSI GE78HX 13VH-070US | |
| Acer Predator Helios 18 N23Q2 | |
| AIDA64 / FPU Julia | |
| Asus Strix Scar 18 G835LX | |
| Lenovo Legion Pro 7i 16 Gen 10 | |
| Media Intel Core Ultra 9 275HX (140254 - 200744, n=30) | |
| Aorus Master 18 AM8H | |
| MSI GE78HX 13VH-070US | |
| Medion Erazer Beast 18 X1 MD62731 | |
| Acer Predator Helios 18 N23Q2 | |
| Media della classe Gaming (51376 - 238426, n=109, ultimi 2 anni) | |
| AIDA64 / CPU SHA3 | |
| Asus Strix Scar 18 G835LX | |
| Lenovo Legion Pro 7i 16 Gen 10 | |
| Media Intel Core Ultra 9 275HX (6710 - 9817, n=30) | |
| Aorus Master 18 AM8H | |
| Medion Erazer Beast 18 X1 MD62731 | |
| MSI GE78HX 13VH-070US | |
| Acer Predator Helios 18 N23Q2 | |
| Media della classe Gaming (2180 - 9817, n=109, ultimi 2 anni) | |
| AIDA64 / CPU Queen | |
| MSI GE78HX 13VH-070US | |
| Asus Strix Scar 18 G835LX | |
| Lenovo Legion Pro 7i 16 Gen 10 | |
| Acer Predator Helios 18 N23Q2 | |
| Media Intel Core Ultra 9 275HX (113887 - 140937, n=30) | |
| Aorus Master 18 AM8H | |
| Media della classe Gaming (49785 - 173351, n=98, ultimi 2 anni) | |
| Medion Erazer Beast 18 X1 MD62731 | |
| AIDA64 / FPU SinJulia | |
| MSI GE78HX 13VH-070US | |
| Acer Predator Helios 18 N23Q2 | |
| Media della classe Gaming (4424 - 33636, n=109, ultimi 2 anni) | |
| Asus Strix Scar 18 G835LX | |
| Lenovo Legion Pro 7i 16 Gen 10 | |
| Media Intel Core Ultra 9 275HX (11172 - 14425, n=30) | |
| Aorus Master 18 AM8H | |
| Medion Erazer Beast 18 X1 MD62731 | |
| AIDA64 / FPU Mandel | |
| Asus Strix Scar 18 G835LX | |
| Lenovo Legion Pro 7i 16 Gen 10 | |
| Media Intel Core Ultra 9 275HX (72596 - 104508, n=30) | |
| Aorus Master 18 AM8H | |
| Medion Erazer Beast 18 X1 MD62731 | |
| Media della classe Gaming (25115 - 128721, n=109, ultimi 2 anni) | |
| MSI GE78HX 13VH-070US | |
| Acer Predator Helios 18 N23Q2 | |
| AIDA64 / CPU AES | |
| Acer Predator Helios 18 N23Q2 | |
| Asus Strix Scar 18 G835LX | |
| MSI GE78HX 13VH-070US | |
| Lenovo Legion Pro 7i 16 Gen 10 | |
| Media Intel Core Ultra 9 275HX (105608 - 247074, n=30) | |
| Aorus Master 18 AM8H | |
| Medion Erazer Beast 18 X1 MD62731 | |
| Media della classe Gaming (39258 - 247074, n=109, ultimi 2 anni) | |
| AIDA64 / CPU ZLib | |
| Asus Strix Scar 18 G835LX | |
| MSI GE78HX 13VH-070US | |
| Lenovo Legion Pro 7i 16 Gen 10 | |
| Media Intel Core Ultra 9 275HX (1582 - 2263, n=30) | |
| Acer Predator Helios 18 N23Q2 | |
| Aorus Master 18 AM8H | |
| Medion Erazer Beast 18 X1 MD62731 | |
| Media della classe Gaming (574 - 2531, n=109, ultimi 2 anni) | |
| AIDA64 / FP64 Ray-Trace | |
| Asus Strix Scar 18 G835LX | |
| Lenovo Legion Pro 7i 16 Gen 10 | |
| Media Intel Core Ultra 9 275HX (14847 - 21854, n=30) | |
| Aorus Master 18 AM8H | |
| Media della classe Gaming (5509 - 45446, n=109, ultimi 2 anni) | |
| MSI GE78HX 13VH-070US | |
| Acer Predator Helios 18 N23Q2 | |
| Medion Erazer Beast 18 X1 MD62731 | |
| AIDA64 / CPU PhotoWorxx | |
| Asus Strix Scar 18 G835LX | |
| Lenovo Legion Pro 7i 16 Gen 10 | |
| Acer Predator Helios 18 N23Q2 | |
| MSI GE78HX 13VH-070US | |
| Media Intel Core Ultra 9 275HX (37482 - 62916, n=30) | |
| Aorus Master 18 AM8H | |
| Medion Erazer Beast 18 X1 MD62731 | |
| Media della classe Gaming (12271 - 89891, n=109, ultimi 2 anni) | |
Prestazioni del sistema
Per quanto riguarda le prestazioni del sistema, la differenza tra i concorrenti è limitata. Soggettivamente, a volte notiamo dei blocchi all'apertura dei programmi, che, come spesso accade, sono probabilmente dovuti alla commutazione della grafica. La generazione Blackwell di Nvidia, o il suo driver attuale, ha un problema maggiore rispetto ad Ada Lovelace (abbiamo notato lo stesso problema anche con Aorus Master 18).
PCMark 10: Score | Essentials | Productivity | Digital Content Creation
CrossMark: Overall | Productivity | Creativity | Responsiveness
WebXPRT 3: Overall
WebXPRT 4: Overall
Mozilla Kraken 1.1: Total
| Performance rating | |
| Aorus Master 18 AM8H | |
| Asus Strix Scar 18 G835LX | |
| Lenovo Legion Pro 7i 16 Gen 10 | |
| Media Intel Core Ultra 9 275HX, NVIDIA GeForce RTX 5080 Laptop | |
| Acer Predator Helios 18 N23Q2 -1! | |
| MSI GE78HX 13VH-070US | |
| Media della classe Gaming | |
| Medion Erazer Beast 18 X1 MD62731 | |
| PCMark 10 / Score | |
| Lenovo Legion Pro 7i 16 Gen 10 | |
| MSI GE78HX 13VH-070US | |
| Media Intel Core Ultra 9 275HX, NVIDIA GeForce RTX 5080 Laptop (7805 - 10409, n=9) | |
| Asus Strix Scar 18 G835LX | |
| Aorus Master 18 AM8H | |
| Acer Predator Helios 18 N23Q2 | |
| Medion Erazer Beast 18 X1 MD62731 | |
| Media della classe Gaming (5828 - 11574, n=96, ultimi 2 anni) | |
| PCMark 10 / Essentials | |
| MSI GE78HX 13VH-070US | |
| Lenovo Legion Pro 7i 16 Gen 10 | |
| Aorus Master 18 AM8H | |
| Acer Predator Helios 18 N23Q2 | |
| Asus Strix Scar 18 G835LX | |
| Media Intel Core Ultra 9 275HX, NVIDIA GeForce RTX 5080 Laptop (10206 - 11472, n=9) | |
| Media della classe Gaming (8810 - 12600, n=100, ultimi 2 anni) | |
| Medion Erazer Beast 18 X1 MD62731 | |
| PCMark 10 / Productivity | |
| Media della classe Gaming (6845 - 21327, n=98, ultimi 2 anni) | |
| Media Intel Core Ultra 9 275HX, NVIDIA GeForce RTX 5080 Laptop (8319 - 20616, n=9) | |
| Acer Predator Helios 18 N23Q2 | |
| MSI GE78HX 13VH-070US | |
| Medion Erazer Beast 18 X1 MD62731 | |
| Lenovo Legion Pro 7i 16 Gen 10 | |
| Asus Strix Scar 18 G835LX | |
| Aorus Master 18 AM8H | |
| PCMark 10 / Digital Content Creation | |
| Lenovo Legion Pro 7i 16 Gen 10 | |
| Asus Strix Scar 18 G835LX | |
| Aorus Master 18 AM8H | |
| Media Intel Core Ultra 9 275HX, NVIDIA GeForce RTX 5080 Laptop (10505 - 19351, n=9) | |
| Medion Erazer Beast 18 X1 MD62731 | |
| MSI GE78HX 13VH-070US | |
| Acer Predator Helios 18 N23Q2 | |
| Media della classe Gaming (7602 - 19657, n=98, ultimi 2 anni) | |
| CrossMark / Overall | |
| Aorus Master 18 AM8H | |
| Asus Strix Scar 18 G835LX | |
| Acer Predator Helios 18 N23Q2 | |
| Media Intel Core Ultra 9 275HX, NVIDIA GeForce RTX 5080 Laptop (1857 - 2244, n=9) | |
| Lenovo Legion Pro 7i 16 Gen 10 | |
| Media della classe Gaming (1366 - 2409, n=97, ultimi 2 anni) | |
| MSI GE78HX 13VH-070US | |
| Medion Erazer Beast 18 X1 MD62731 | |
| CrossMark / Productivity | |
| Aorus Master 18 AM8H | |
| Acer Predator Helios 18 N23Q2 | |
| Asus Strix Scar 18 G835LX | |
| Media Intel Core Ultra 9 275HX, NVIDIA GeForce RTX 5080 Laptop (1764 - 2122, n=9) | |
| Lenovo Legion Pro 7i 16 Gen 10 | |
| Media della classe Gaming (1386 - 2254, n=97, ultimi 2 anni) | |
| MSI GE78HX 13VH-070US | |
| Medion Erazer Beast 18 X1 MD62731 | |
| CrossMark / Creativity | |
| Asus Strix Scar 18 G835LX | |
| Aorus Master 18 AM8H | |
| Acer Predator Helios 18 N23Q2 | |
| Media Intel Core Ultra 9 275HX, NVIDIA GeForce RTX 5080 Laptop (2115 - 2498, n=9) | |
| Lenovo Legion Pro 7i 16 Gen 10 | |
| Media della classe Gaming (1343 - 2729, n=97, ultimi 2 anni) | |
| Medion Erazer Beast 18 X1 MD62731 | |
| MSI GE78HX 13VH-070US | |
| CrossMark / Responsiveness | |
| Aorus Master 18 AM8H | |
| Acer Predator Helios 18 N23Q2 | |
| Media Intel Core Ultra 9 275HX, NVIDIA GeForce RTX 5080 Laptop (1466 - 2096, n=9) | |
| Asus Strix Scar 18 G835LX | |
| Media della classe Gaming (1226 - 2334, n=97, ultimi 2 anni) | |
| MSI GE78HX 13VH-070US | |
| Lenovo Legion Pro 7i 16 Gen 10 | |
| Medion Erazer Beast 18 X1 MD62731 | |
| WebXPRT 3 / Overall | |
| Lenovo Legion Pro 7i 16 Gen 10 | |
| Asus Strix Scar 18 G835LX | |
| Media Intel Core Ultra 9 275HX, NVIDIA GeForce RTX 5080 Laptop (306 - 378, n=9) | |
| Medion Erazer Beast 18 X1 MD62731 | |
| Acer Predator Helios 18 N23Q2 | |
| Media della classe Gaming (242 - 532, n=101, ultimi 2 anni) | |
| MSI GE78HX 13VH-070US | |
| Aorus Master 18 AM8H | |
| WebXPRT 4 / Overall | |
| Asus Strix Scar 18 G835LX | |
| Lenovo Legion Pro 7i 16 Gen 10 | |
| Medion Erazer Beast 18 X1 MD62731 | |
| Media Intel Core Ultra 9 275HX, NVIDIA GeForce RTX 5080 Laptop (285 - 336, n=9) | |
| Aorus Master 18 AM8H | |
| MSI GE78HX 13VH-070US | |
| Media della classe Gaming (176.4 - 354, n=101, ultimi 2 anni) | |
| Mozilla Kraken 1.1 / Total | |
| MSI GE78HX 13VH-070US | |
| Media della classe Gaming (391 - 590, n=106, ultimi 2 anni) | |
| Acer Predator Helios 18 N23Q2 | |
| Aorus Master 18 AM8H | |
| Medion Erazer Beast 18 X1 MD62731 | |
| Media Intel Core Ultra 9 275HX, NVIDIA GeForce RTX 5080 Laptop (405 - 432, n=9) | |
| Asus Strix Scar 18 G835LX | |
| Lenovo Legion Pro 7i 16 Gen 10 | |
* ... Meglio usare valori piccoli
| PCMark 10 Score | 8378 punti | |
Aiuto | ||
| AIDA64 / Memory Copy | |
| Lenovo Legion Pro 7i 16 Gen 10 | |
| Asus Strix Scar 18 G835LX | |
| Media Intel Core Ultra 9 275HX (56003 - 94460, n=30) | |
| Acer Predator Helios 18 N23Q2 | |
| Medion Erazer Beast 18 X1 MD62731 | |
| MSI GE78HX 13VH-070US | |
| Aorus Master 18 AM8H | |
| Media della classe Gaming (21750 - 129946, n=109, ultimi 2 anni) | |
| AIDA64 / Memory Read | |
| Lenovo Legion Pro 7i 16 Gen 10 | |
| Acer Predator Helios 18 N23Q2 | |
| Medion Erazer Beast 18 X1 MD62731 | |
| Asus Strix Scar 18 G835LX | |
| MSI GE78HX 13VH-070US | |
| Media Intel Core Ultra 9 275HX (55795 - 97151, n=30) | |
| Aorus Master 18 AM8H | |
| Media della classe Gaming (22956 - 118858, n=109, ultimi 2 anni) | |
| AIDA64 / Memory Write | |
| Lenovo Legion Pro 7i 16 Gen 10 | |
| Asus Strix Scar 18 G835LX | |
| Media Intel Core Ultra 9 275HX (55663 - 116129, n=30) | |
| Medion Erazer Beast 18 X1 MD62731 | |
| MSI GE78HX 13VH-070US | |
| Media della classe Gaming (22297 - 135096, n=109, ultimi 2 anni) | |
| Acer Predator Helios 18 N23Q2 | |
| Aorus Master 18 AM8H | |
| AIDA64 / Memory Latency | |
| Aorus Master 18 AM8H | |
| Media Intel Core Ultra 9 275HX (105.8 - 161.6, n=30) | |
| Medion Erazer Beast 18 X1 MD62731 | |
| Lenovo Legion Pro 7i 16 Gen 10 | |
| Asus Strix Scar 18 G835LX | |
| Media della classe Gaming (75.3 - 259, n=109, ultimi 2 anni) | |
| MSI GE78HX 13VH-070US | |
| Acer Predator Helios 18 N23Q2 | |
* ... Meglio usare valori piccoli
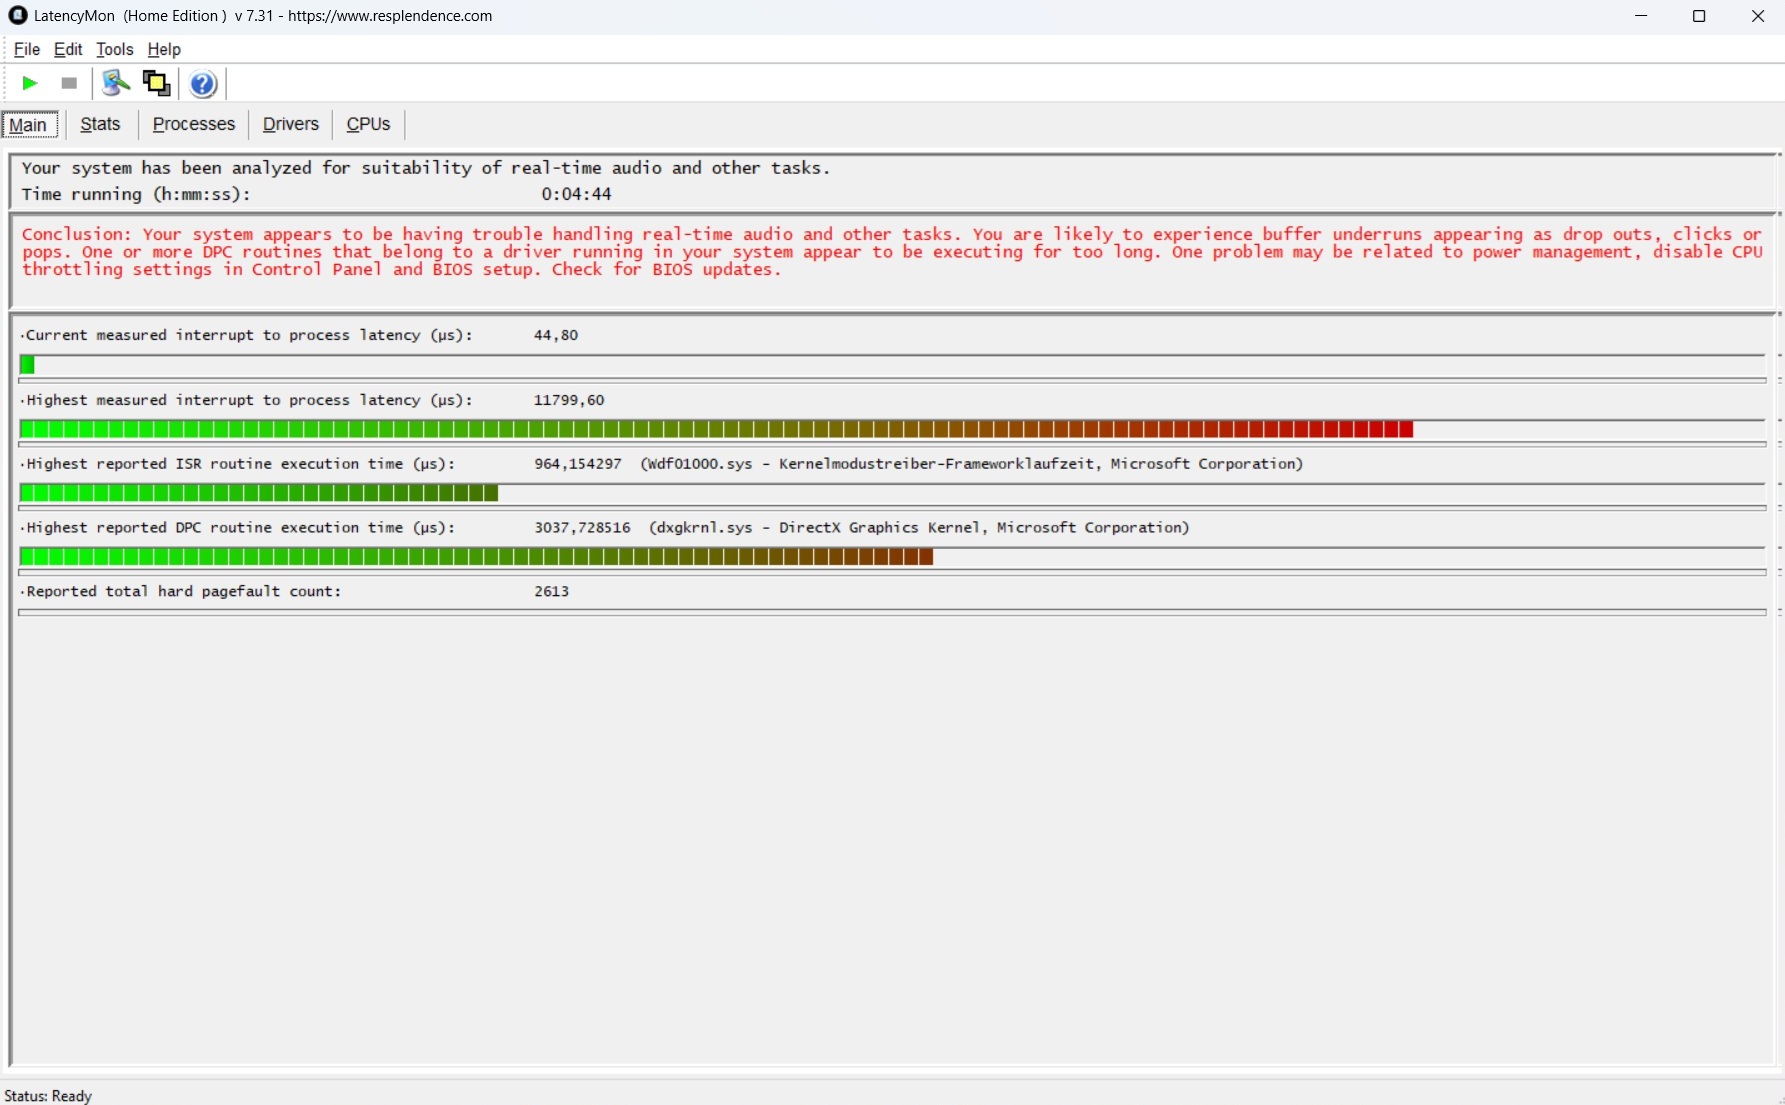
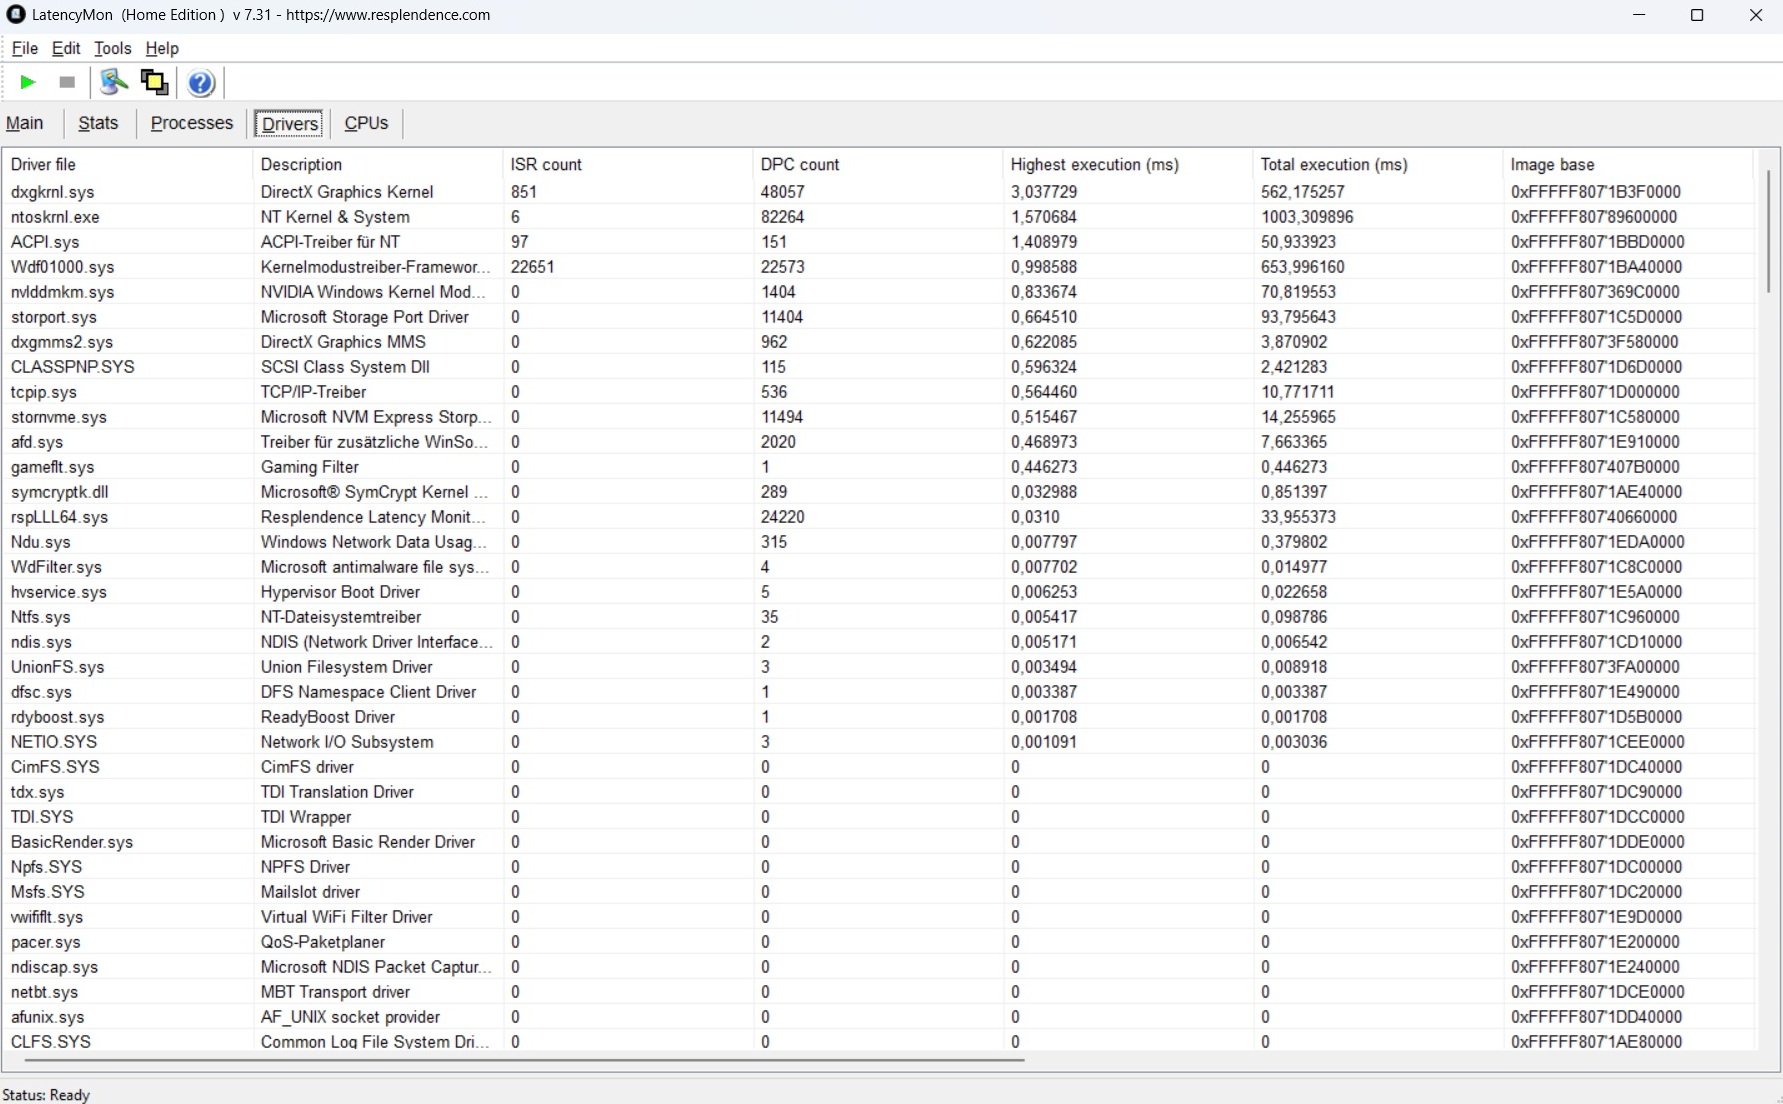
Latenze DPC
In generale, le latenze non sono il punto forte di Beast 18 X1: un massimo di 11.799 µs è addirittura peggiore di quello di Acer Predator Helios 18 (8.290 µs).
| DPC Latencies / LatencyMon - interrupt to process latency (max), Web, Youtube, Prime95 | |
| Medion Erazer Beast 18 X1 MD62731 | |
| Acer Predator Helios 18 N23Q2 | |
| MSI GE78HX 13VH-070US | |
| Aorus Master 18 AM8H | |
| Asus Strix Scar 18 G835LX | |
| Lenovo Legion Pro 7i 16 Gen 10 | |
* ... Meglio usare valori piccoli
Memoria di massa
Tuttavia, il veloce SSD PCIe Gen. 5x4 merita rispetto. L'unità da 2 TB supera i 10.000 MB/s nei test sequenziali e può persino funzionare senza throttling a lungo termine.

* ... Meglio usare valori piccoli
Continuous read: DiskSpd Read Loop, Queue Depth 8
Scheda grafica
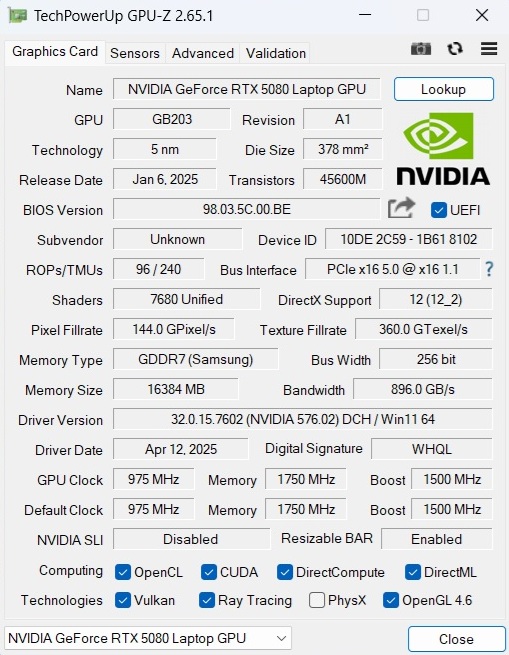
Il GeForce RTX 5080 attualmente è il secondo modello di notebook più potente di Nvidia della serie Blackwell, dopo il laptop RTX 5090 RTX 5090. Tuttavia, quest'ultimo ha solo un vantaggio limitato nel nostro corso 3DMark, se si considera la concorrenza. Al contrario, l'RTX 5080 non è molto più veloce del vecchio laptop Laptop RTX 4080che può almeno tenere bene il passo nei test sintetici. Nel frattempo, 16 GB di VRAM GDDR7 non sono una rivelazione per la fascia di prezzo, ma sono comunque migliori dei 12 GB GDDR6X del predecessore. Il livello TGP può raggiungere un massimo di 175 watt.
| 3DMark 11 Performance | 44491 punti | |
| 3DMark Ice Storm Standard Score | 245418 punti | |
| 3DMark Cloud Gate Standard Score | 61468 punti | |
| 3DMark Fire Strike Score | 30780 punti | |
| 3DMark Time Spy Score | 20170 punti | |
Aiuto | ||
* ... Meglio usare valori piccoli
Prestazioni di gioco
Nei benchmark di gioco, il divario tra i dispositivi concorrenti è un po' più ampio, ma nella pratica, spesso non si noterà molto. Fondamentalmente, la RTX 5080 mobile è sufficientemente veloce per eseguire senza problemi la maggior parte dei giochi moderni con i dettagli massimi e la risoluzione nativa QHD+. Le cose si fanno difficili solo con titoli molto esigenti o moderatamente ottimizzati, come ad esempio The Elder Scrolls: Oblivion Remastered. In questo caso si raccomanda l'uso dell'upscaling (parola chiave DLSS) e/o della generazione (multi) di fotogrammi. Con il Stalker 2la frequenza dei fotogrammi in QHD raddoppia di conseguenza (vedere tabella).
| Stalker 2 | |
| 2560x1440 Epic Preset | |
| Aorus Master 18 AM8H | |
| Medion Erazer Beast 18 X1 MD62731 | |
| Media NVIDIA GeForce RTX 5080 Laptop (41.5 - 58.5, n=2) | |
| Media della classe Gaming (29 - 110.7, n=13, ultimi 2 anni) | |
| 2560x1440 Epic Preset + Quality DLSS + FG | |
| Aorus Master 18 AM8H | |
| Medion Erazer Beast 18 X1 MD62731 | |
| Media NVIDIA GeForce RTX 5080 Laptop (80.7 - 122.1, n=2) | |
| Media della classe Gaming (58.3 - 134.6, n=12, ultimi 2 anni) | |
| Horizon Forbidden West | |
| 2560x1440 Very High Preset AA:T | |
| Aorus Master 18 AM8H | |
| Medion Erazer Beast 18 X1 MD62731 | |
| Media NVIDIA GeForce RTX 5080 Laptop (n=1) | |
| Media della classe Gaming (39.6 - 100.9, n=10, ultimi 2 anni) | |
| 2560x1440 Very High Preset + DLSS Quality | |
| Aorus Master 18 AM8H | |
| Medion Erazer Beast 18 X1 MD62731 | |
| Media NVIDIA GeForce RTX 5080 Laptop (n=1) | |
| Media della classe Gaming (58.4 - 116.6, n=8, ultimi 2 anni) | |
| Ghost of Tsushima | |
| 2560x1440 Very High Preset AA:T | |
| Aorus Master 18 AM8H | |
| Medion Erazer Beast 18 X1 MD62731 | |
| Media NVIDIA GeForce RTX 5080 Laptop (n=1) | |
| Media della classe Gaming (22.7 - 100.3, n=13, ultimi 2 anni) | |
| 2560x1440 Very High Preset + Quality DLSS | |
| Aorus Master 18 AM8H | |
| Medion Erazer Beast 18 X1 MD62731 | |
| Media NVIDIA GeForce RTX 5080 Laptop (n=1) | |
| Media della classe Gaming (55.2 - 105.2, n=10, ultimi 2 anni) | |
| Senua's Saga Hellblade 2 | |
| 2560x1440 High Preset | |
| Aorus Master 18 AM8H | |
| Medion Erazer Beast 18 X1 MD62731 | |
| Media NVIDIA GeForce RTX 5080 Laptop (n=1) | |
| Media della classe Gaming (24.2 - 63.1, n=11, ultimi 2 anni) | |
| 2560x1440 High Preset + Quality DLSS | |
| Aorus Master 18 AM8H | |
| Medion Erazer Beast 18 X1 MD62731 | |
| Media NVIDIA GeForce RTX 5080 Laptop (n=1) | |
| Media della classe Gaming (39.6 - 81.9, n=9, ultimi 2 anni) | |
| Space Marine 2 | |
| 2560x1440 Ultra Preset AA:T | |
| Aorus Master 18 AM8H | |
| Medion Erazer Beast 18 X1 MD62731 | |
| Media NVIDIA GeForce RTX 5080 Laptop (n=1) | |
| Media della classe Gaming (48.2 - 107.4, n=11, ultimi 2 anni) | |
| 2560x1440 Ultra Preset + Quality DLSS | |
| Aorus Master 18 AM8H | |
| Medion Erazer Beast 18 X1 MD62731 | |
| Media NVIDIA GeForce RTX 5080 Laptop (n=1) | |
| Media della classe Gaming (58.5 - 100.8, n=10, ultimi 2 anni) | |
| Until Dawn | |
| 2560x1440 Ultra Preset | |
| Aorus Master 18 AM8H | |
| Medion Erazer Beast 18 X1 MD62731 | |
| Media NVIDIA GeForce RTX 5080 Laptop (n=1) | |
| Media della classe Gaming (30.4 - 76.6, n=11, ultimi 2 anni) | |
| 2560x1440 Ultra Preset + Quality DLSS + Ray Tracing | |
| Aorus Master 18 AM8H | |
| Medion Erazer Beast 18 X1 MD62731 | |
| Media NVIDIA GeForce RTX 5080 Laptop (n=1) | |
| Media della classe Gaming (39.5 - 86.3, n=10, ultimi 2 anni) | |
| Kingdom Come Deliverance 2 | |
| 2560x1440 Ultra Preset | |
| Aorus Master 18 AM8H | |
| Medion Erazer Beast 18 X1 MD62731 | |
| Media NVIDIA GeForce RTX 5080 Laptop (n=1) | |
| Media della classe Gaming (36.8 - 97.2, n=13, ultimi 2 anni) | |
| 2560x1440 Ultra Preset + Quality DLSS | |
| Medion Erazer Beast 18 X1 MD62731 | |
| Media NVIDIA GeForce RTX 5080 Laptop (n=1) | |
| Aorus Master 18 AM8H | |
| Media della classe Gaming (50.3 - 115.5, n=13, ultimi 2 anni) | |
| The Elder Scrolls IV Oblivion Remastered | |
| 2560x1440 Ultra Preset AA:T | |
| Medion Erazer Beast 18 X1 MD62731 | |
| Media NVIDIA GeForce RTX 5080 Laptop (17.9 - 36.6, n=3) | |
| Media della classe Gaming (12.7 - 45.9, n=14, ultimi 2 anni) | |
| 2560x1440 Ultra Preset + Quality DLSS | |
| Medion Erazer Beast 18 X1 MD62731 | |
| Media NVIDIA GeForce RTX 5080 Laptop (51 - 53.2, n=2) | |
| Media della classe Gaming (25.3 - 59.7, n=12, ultimi 2 anni) | |
| basso | medio | alto | ultra | QHD DLSS | QHD | |
|---|---|---|---|---|---|---|
| GTA V (2015) | 185.4 | 170.6 | 139.5 | 137.4 | ||
| Dota 2 Reborn (2015) | 211 | 186.4 | 175.1 | 162.3 | ||
| Final Fantasy XV Benchmark (2018) | 218 | 189.9 | 152.1 | |||
| X-Plane 11.11 (2018) | 143 | 132.2 | 108.9 | |||
| Strange Brigade (2018) | 434 | 403 | 371 | 281 | ||
| Baldur's Gate 3 (2023) | 202 | 181.6 | 179.6 | 130.5 | ||
| Cyberpunk 2077 (2023) | 157.8 | 148.1 | 139.8 | 96.4 | ||
| Counter-Strike 2 (2023) | 345 | 290 | 255 | 205 | ||
| Prince of Persia The Lost Crown (2024) | 356 | 356 | 356 | 356 | ||
| Helldivers 2 (2024) | 135.9 | 134.5 | 131.9 | 127.8 | ||
| Dragon's Dogma 2 (2024) | 84.8 | 82.3 | ||||
| Horizon Forbidden West (2024) | 148.2 | 117.7 | 115.5 | 110.6 | 90.7 | |
| Ghost of Tsushima (2024) | 110.7 | 105.7 | 97.5 | 96.1 | 76.7 | |
| Senua's Saga Hellblade 2 (2024) | 99.3 | 76 | 81 | 55.1 | ||
| Star Wars Outlaws (2024) | 79.8 | 72.7 | 67.8 | 64.8 | 51.4 | |
| Space Marine 2 (2024) | 90 | 89.7 | 88.7 | 86.9 | 86.2 | |
| Until Dawn (2024) | 92.9 | 91 | 81.6 | 74.4 | 59 | |
| Stalker 2 (2024) | 90.7 | 78.1 | 72.6 | 122.1 | 58.5 | |
| Kingdom Come Deliverance 2 (2025) | 173.8 | 145.6 | 101.6 | 98.9 | 74.5 | |
| Civilization 7 (2025) | 173.4 | 165.5 | 158 | |||
| The Elder Scrolls IV Oblivion Remastered (2025) | 106.3 | 94.1 | 50.6 | 53.2 | 36.6 | |
| Doom: The Dark Ages (2025) | 113 | 104 | 101 | 97 | 72 |
Abbiamo testato come si comportano le prestazioni 3D per un periodo di tempo più lungo con Cyberpunk 2077 testato. Nel corso del test, si sono verificati occasionalmente brevi cali di FPS, ma si trattava solo di cali sottili e non enormi.
Cyberpunk 2077 Ultra FPS chart
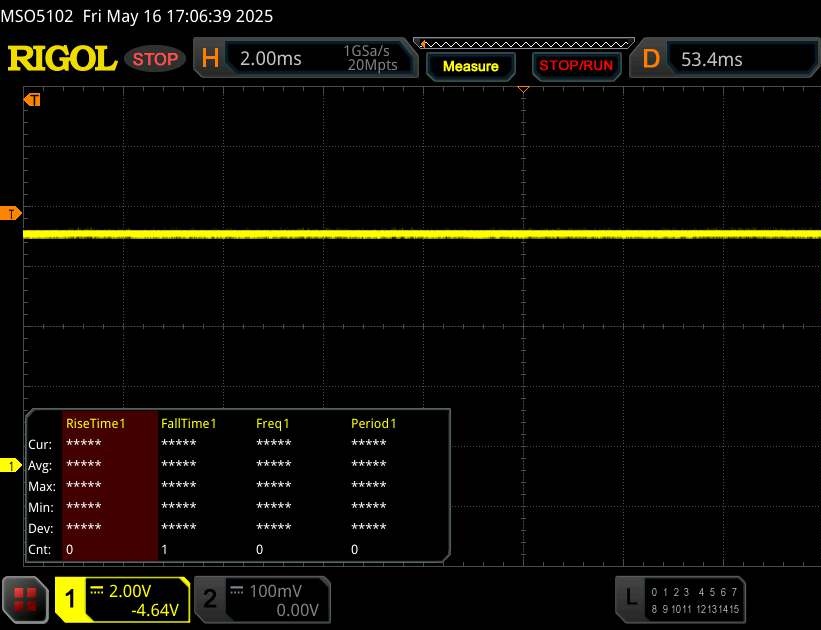
Emissioni
Emissioni di rumore
Una delle maggiori critiche di Beast 18 X1 è il modesto controllo della ventola. Anche quando si utilizza la modalità Bilanciata, il sistema di raffreddamento a volte raggiunge uno sgradevole valore di 40 dB(A) o addirittura superiore in modalità idle, che alla lunga potrebbe infastidire molti utenti. Sotto carico, i valori di rumorosità vengono raggiunti già con il profilo Bilanciato, che alcuni concorrenti generano solo in modalità Performance (confronti lo Strix Scar 18, ad esempio).
Rumorosità
| Idle |
| 25 / 39 / 42 dB(A) |
| Sotto carico |
| 52 / 55 dB(A) |
 | ||
30 dB silenzioso 40 dB(A) udibile 50 dB(A) rumoroso |
||
min: | ||
| Medion Erazer Beast 18 X1 MD62731 Ultra 9 275HX, GeForce RTX 5080 Laptop | MSI GE78HX 13VH-070US i9-13950HX, GeForce RTX 4080 Laptop GPU | Acer Predator Helios 18 N23Q2 i9-13900HX, GeForce RTX 4080 Laptop GPU | Asus Strix Scar 18 G835LX Ultra 9 275HX, GeForce RTX 5090 Laptop | Aorus Master 18 AM8H Ultra 9 275HX, GeForce RTX 5090 Laptop | Lenovo Legion Pro 7i 16 Gen 10 Ultra 9 275HX, GeForce RTX 5080 Laptop | |
|---|---|---|---|---|---|---|
| Noise | 13% | 18% | 8% | 7% | 20% | |
| off /ambiente * (dB) | 25 | 23.4 6% | 23 8% | 23.3 7% | 25 -0% | 22.9 8% |
| Idle Minimum * (dB) | 25 | 24.2 3% | 23 8% | 29.8 -19% | 26 -4% | 22.9 8% |
| Idle Average * (dB) | 39 | 25.6 34% | 23 41% | 29.8 24% | 29 26% | 22.9 41% |
| Idle Maximum * (dB) | 42 | 31 26% | 23 45% | 29.8 29% | 34 19% | 26.3 37% |
| Load Average * (dB) | 52 | 43.3 17% | 45.26 13% | 42.9 17% | 50 4% | 27.8 47% |
| Cyberpunk 2077 ultra * (dB) | 53 | 53.7 -1% | 52 2% | 54.2 -2% | ||
| Load Maximum * (dB) | 55 | 59.1 -7% | 59.94 -9% | 53.7 2% | 53 4% | 53.9 2% |
| Witcher 3 ultra * (dB) | 56.3 | 59.82 |
* ... Meglio usare valori piccoli
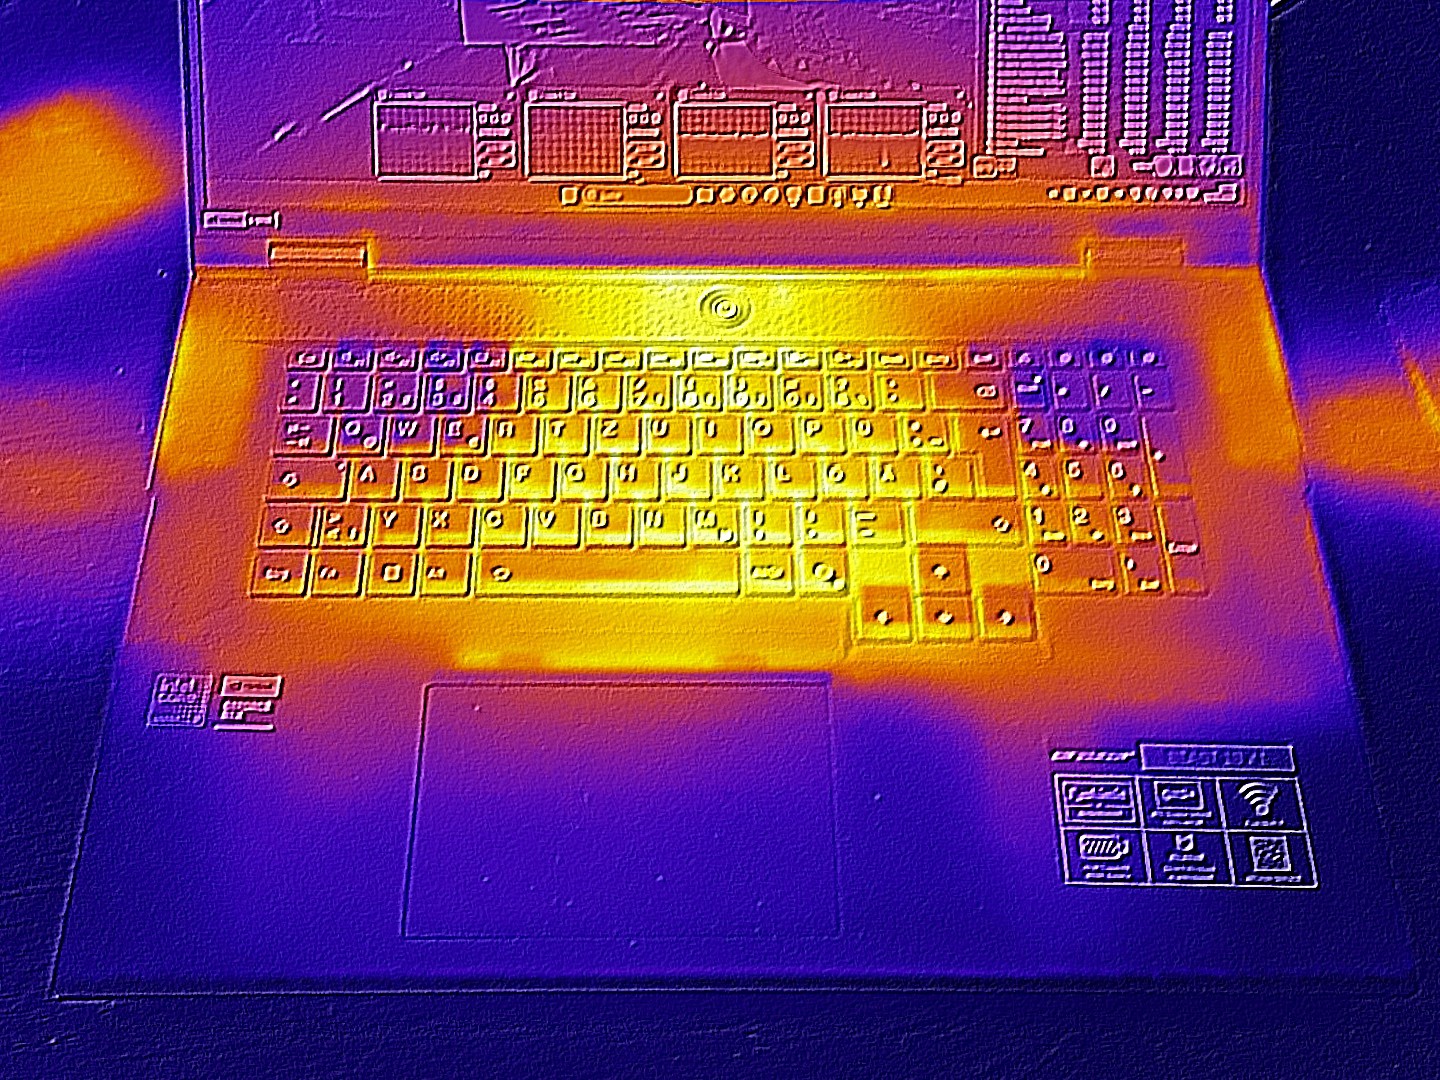
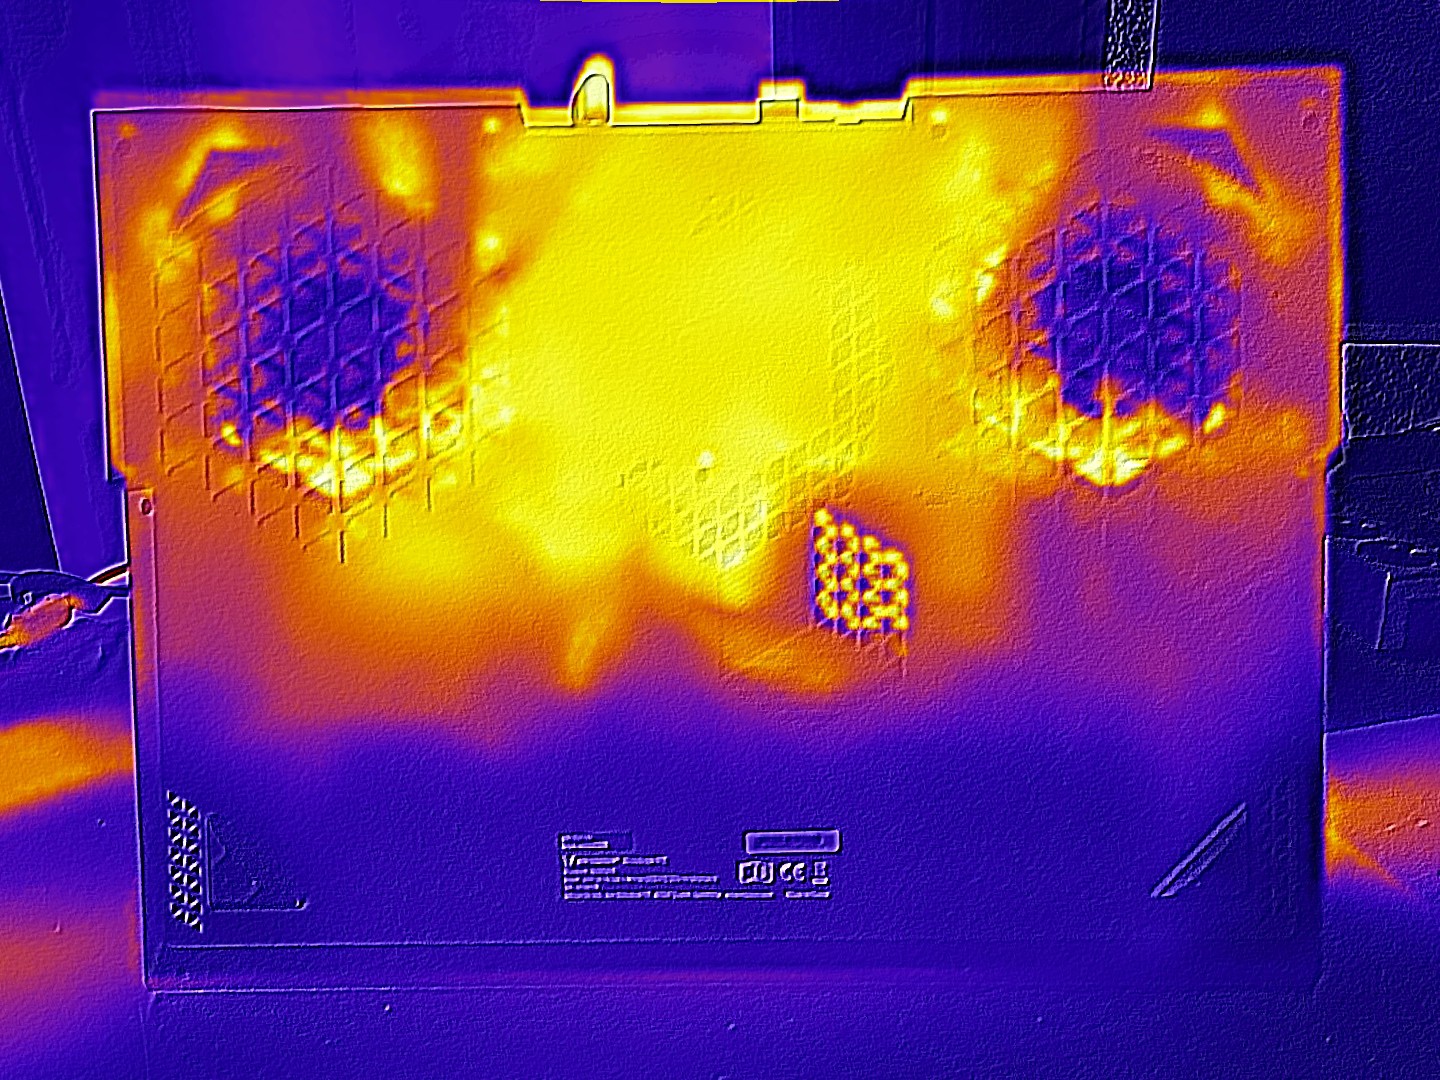
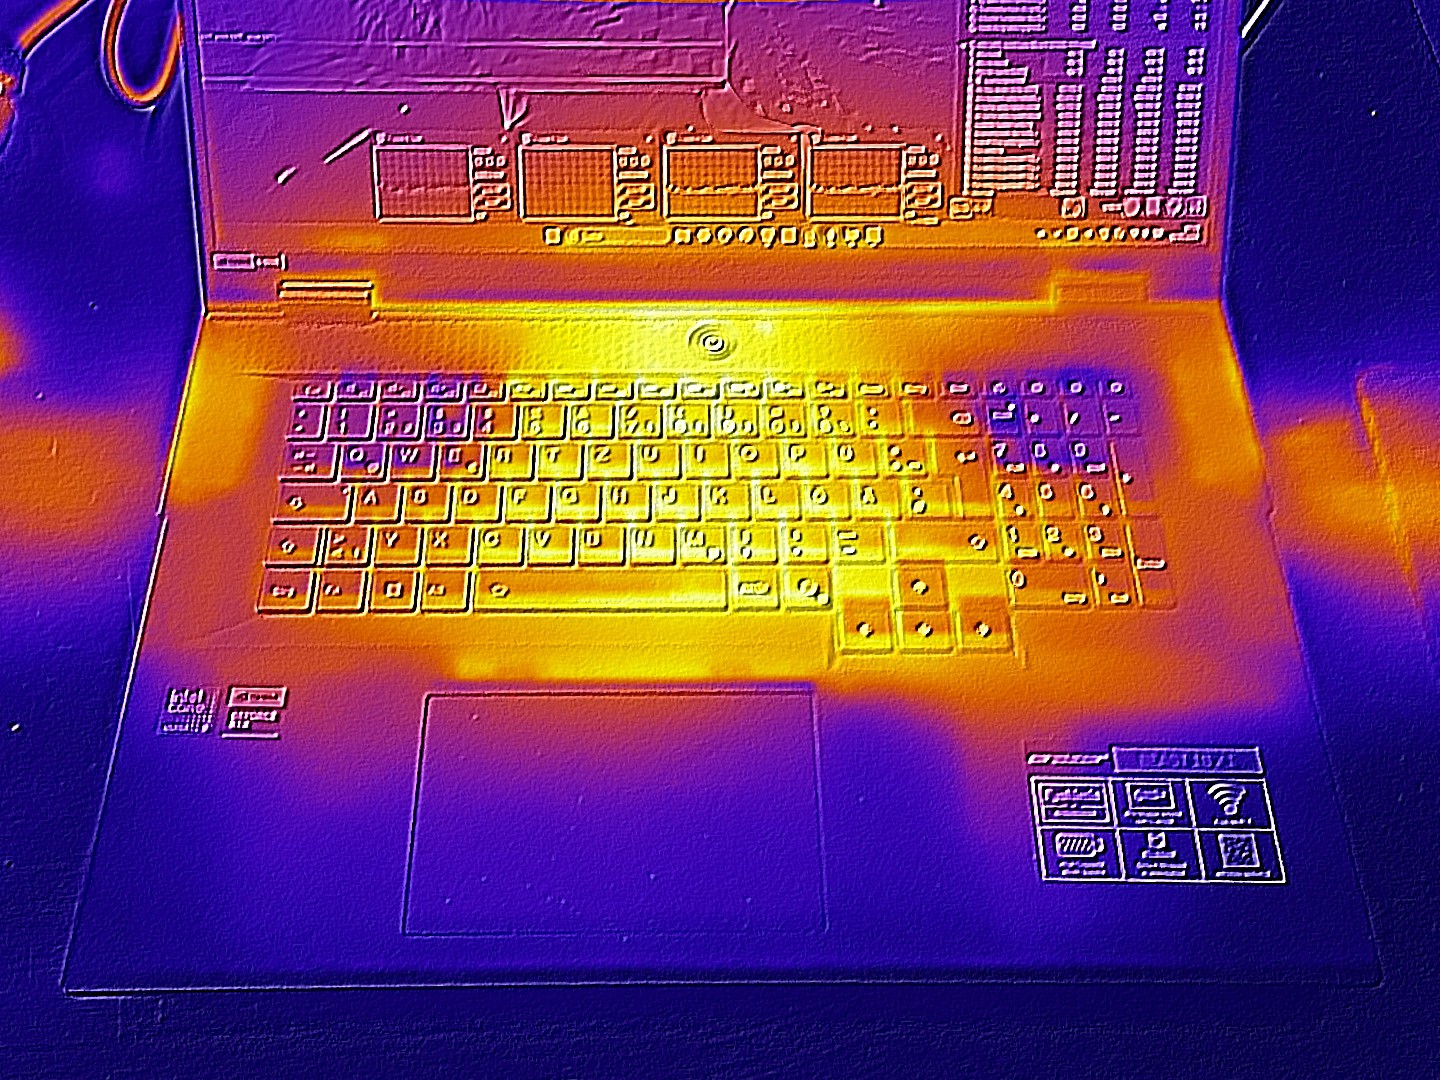
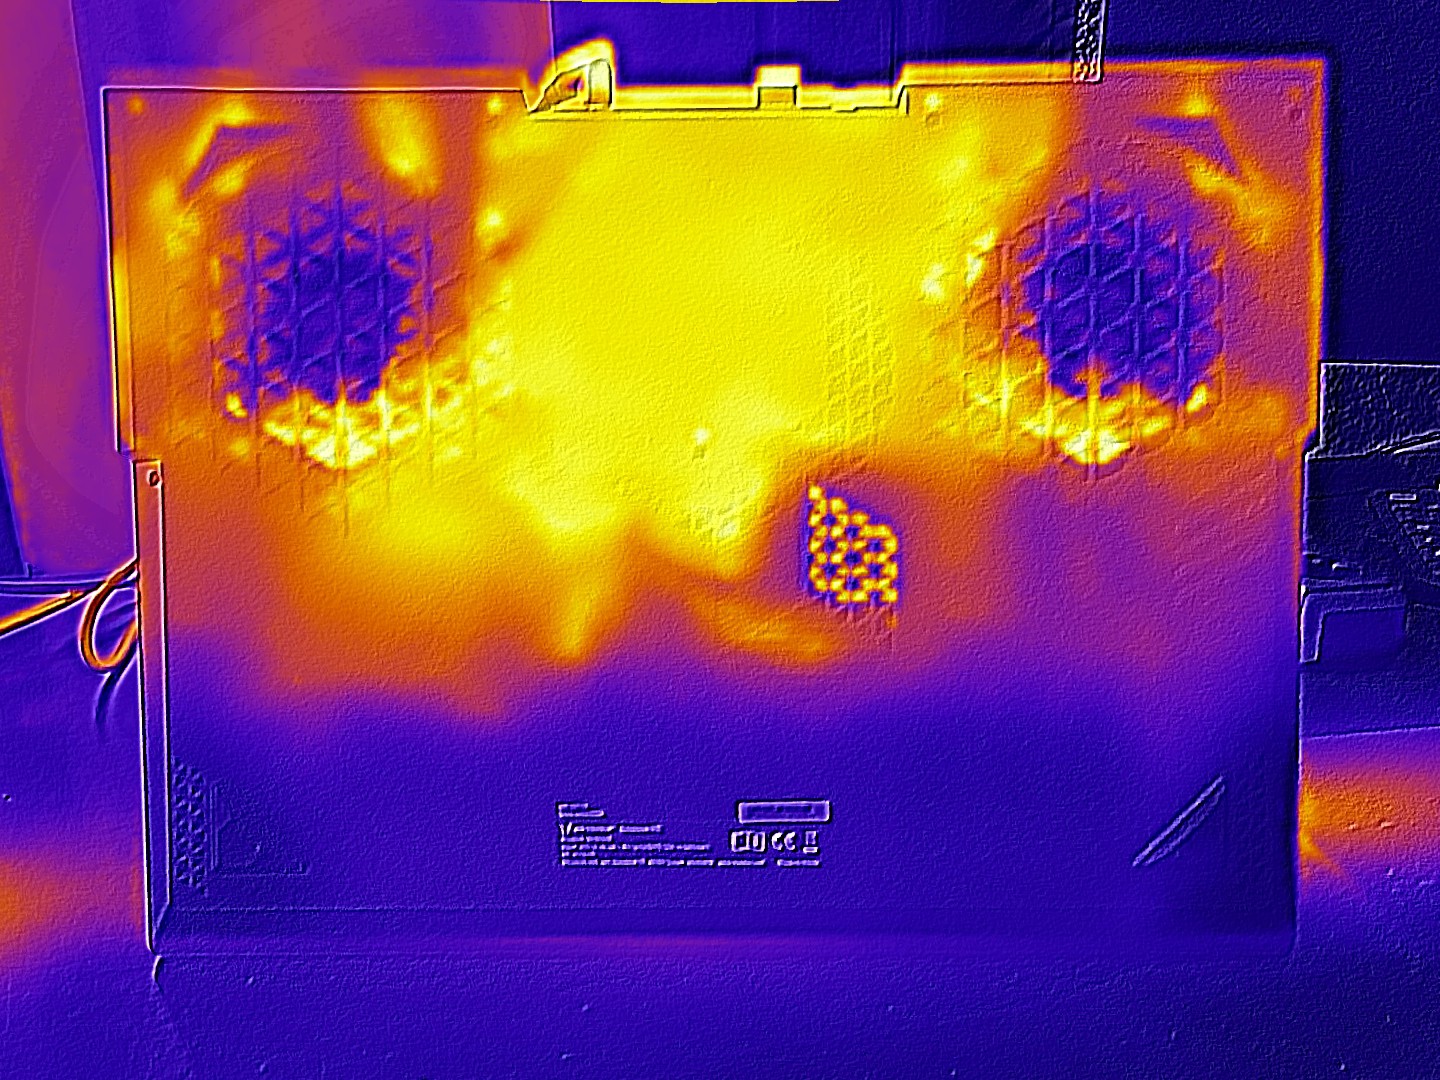
Temperatura
Le temperature del case sono meno preoccupanti. Un massimo di 47 °C nella parte superiore e di 48 °C in quella inferiore è tipico di un portatile di fascia alta. In modalità idle, le superfici rimangono per lo più al di sotto dei 30 °C, mantenendosi piacevolmente fresche.
(-) La temperatura massima sul lato superiore è di 47 °C / 117 F, rispetto alla media di 40.4 °C / 105 F, che varia da 21.2 a 68.8 °C per questa classe Gaming.
(-) Il lato inferiore si riscalda fino ad un massimo di 48 °C / 118 F, rispetto alla media di 43.2 °C / 110 F
(+) In idle, la temperatura media del lato superiore è di 27.9 °C / 82 F, rispetto alla media deld ispositivo di 33.9 °C / 93 F.
(-) 3: The average temperature for the upper side is 42 °C / 108 F, compared to the average of 33.9 °C / 93 F for the class Gaming.
(-) I poggiapolsi e il touchpad possono diventare molto caldi al tatto con un massimo di 41 °C / 105.8 F.
(-) La temperatura media della zona del palmo della mano di dispositivi simili e'stata di 28.8 °C / 83.8 F (-12.2 °C / -22 F).
| Medion Erazer Beast 18 X1 MD62731 Ultra 9 275HX, GeForce RTX 5080 Laptop | MSI GE78HX 13VH-070US i9-13950HX, GeForce RTX 4080 Laptop GPU | Acer Predator Helios 18 N23Q2 i9-13900HX, GeForce RTX 4080 Laptop GPU | Asus Strix Scar 18 G835LX Ultra 9 275HX, GeForce RTX 5090 Laptop | Aorus Master 18 AM8H Ultra 9 275HX, GeForce RTX 5090 Laptop | Lenovo Legion Pro 7i 16 Gen 10 Ultra 9 275HX, GeForce RTX 5080 Laptop | |
|---|---|---|---|---|---|---|
| Heat | 6% | -7% | 5% | -8% | 3% | |
| Maximum Upper Side * (°C) | 47 | 37.4 20% | 35 26% | 45.6 3% | 50 -6% | 42.6 9% |
| Maximum Bottom * (°C) | 48 | 45 6% | 56 -17% | 46 4% | 46 4% | 41.2 14% |
| Idle Upper Side * (°C) | 29 | 29.8 -3% | 34 -17% | 28.9 -0% | 36 -24% | 32.6 -12% |
| Idle Bottom * (°C) | 33 | 32.4 2% | 39 -18% | 29.2 12% | 35 -6% | 32.4 2% |
* ... Meglio usare valori piccoli
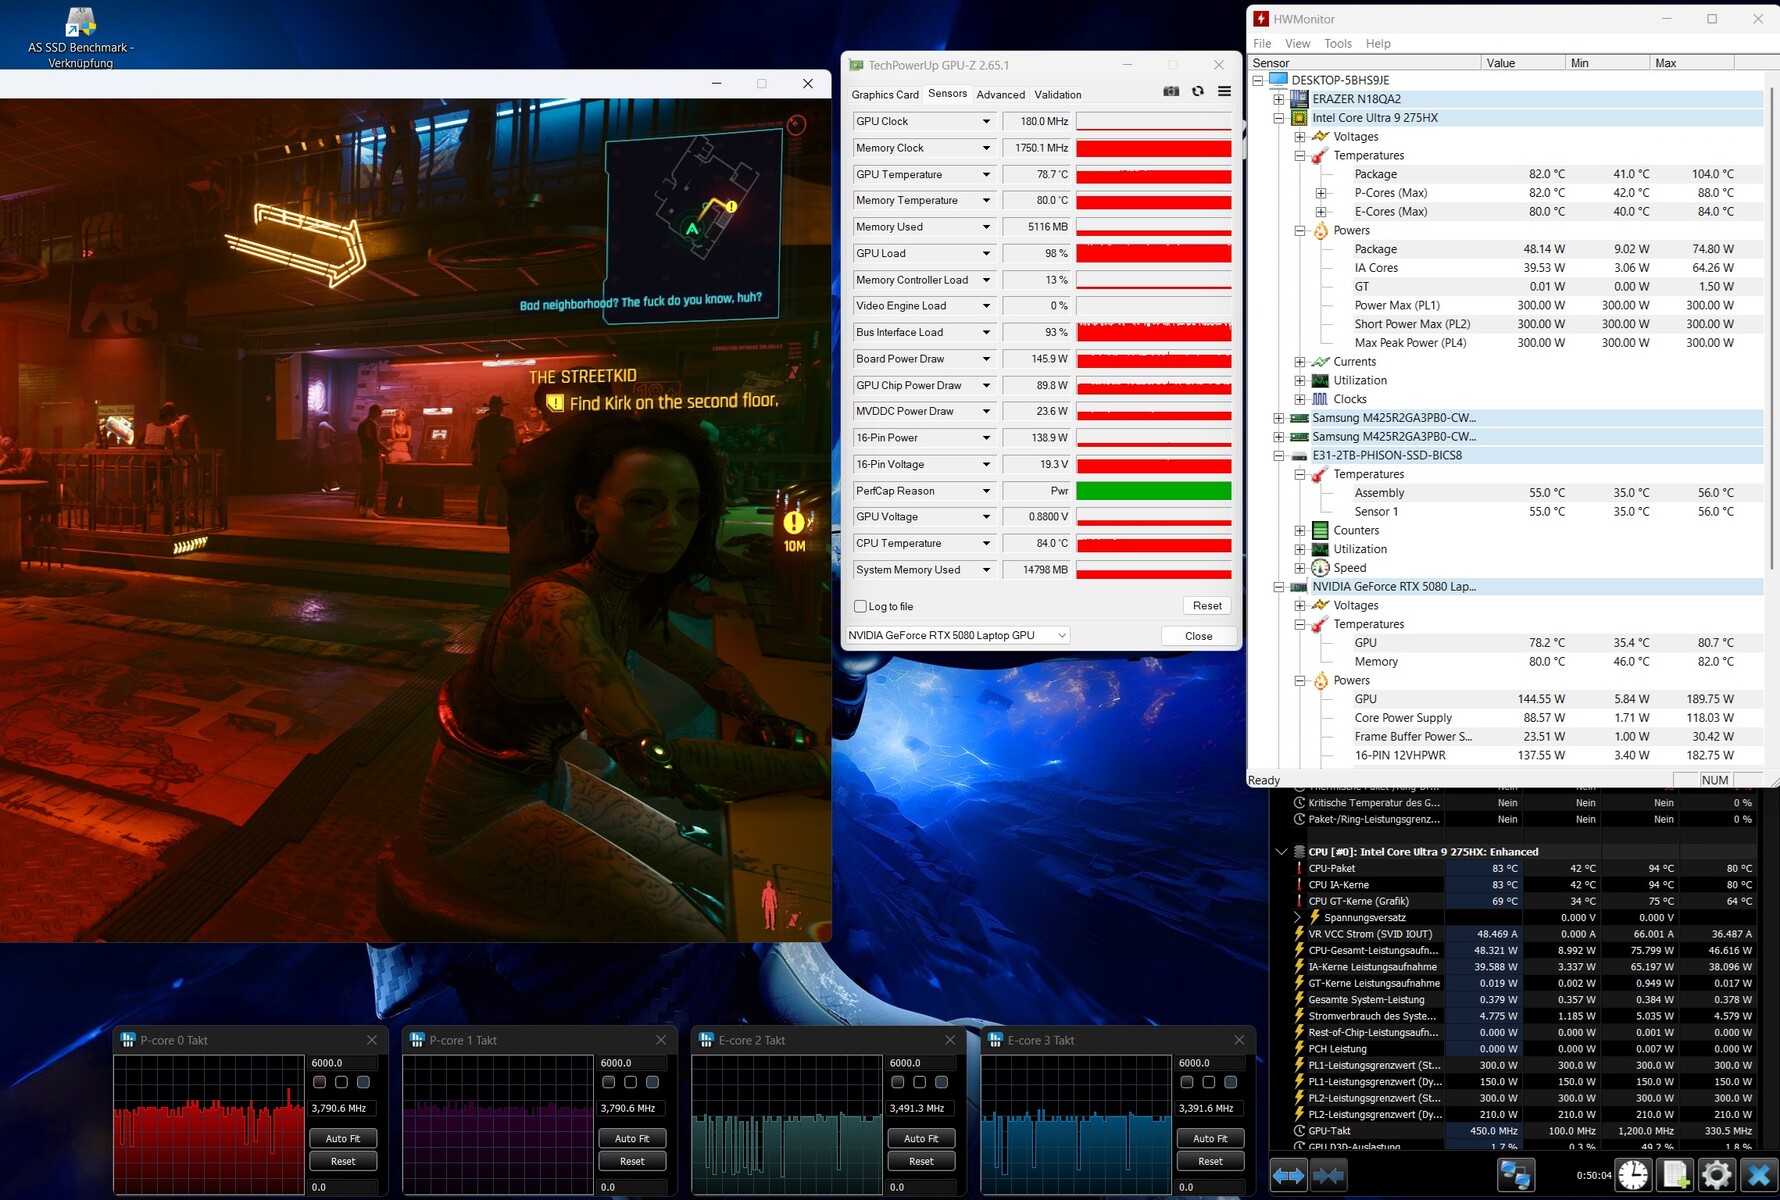
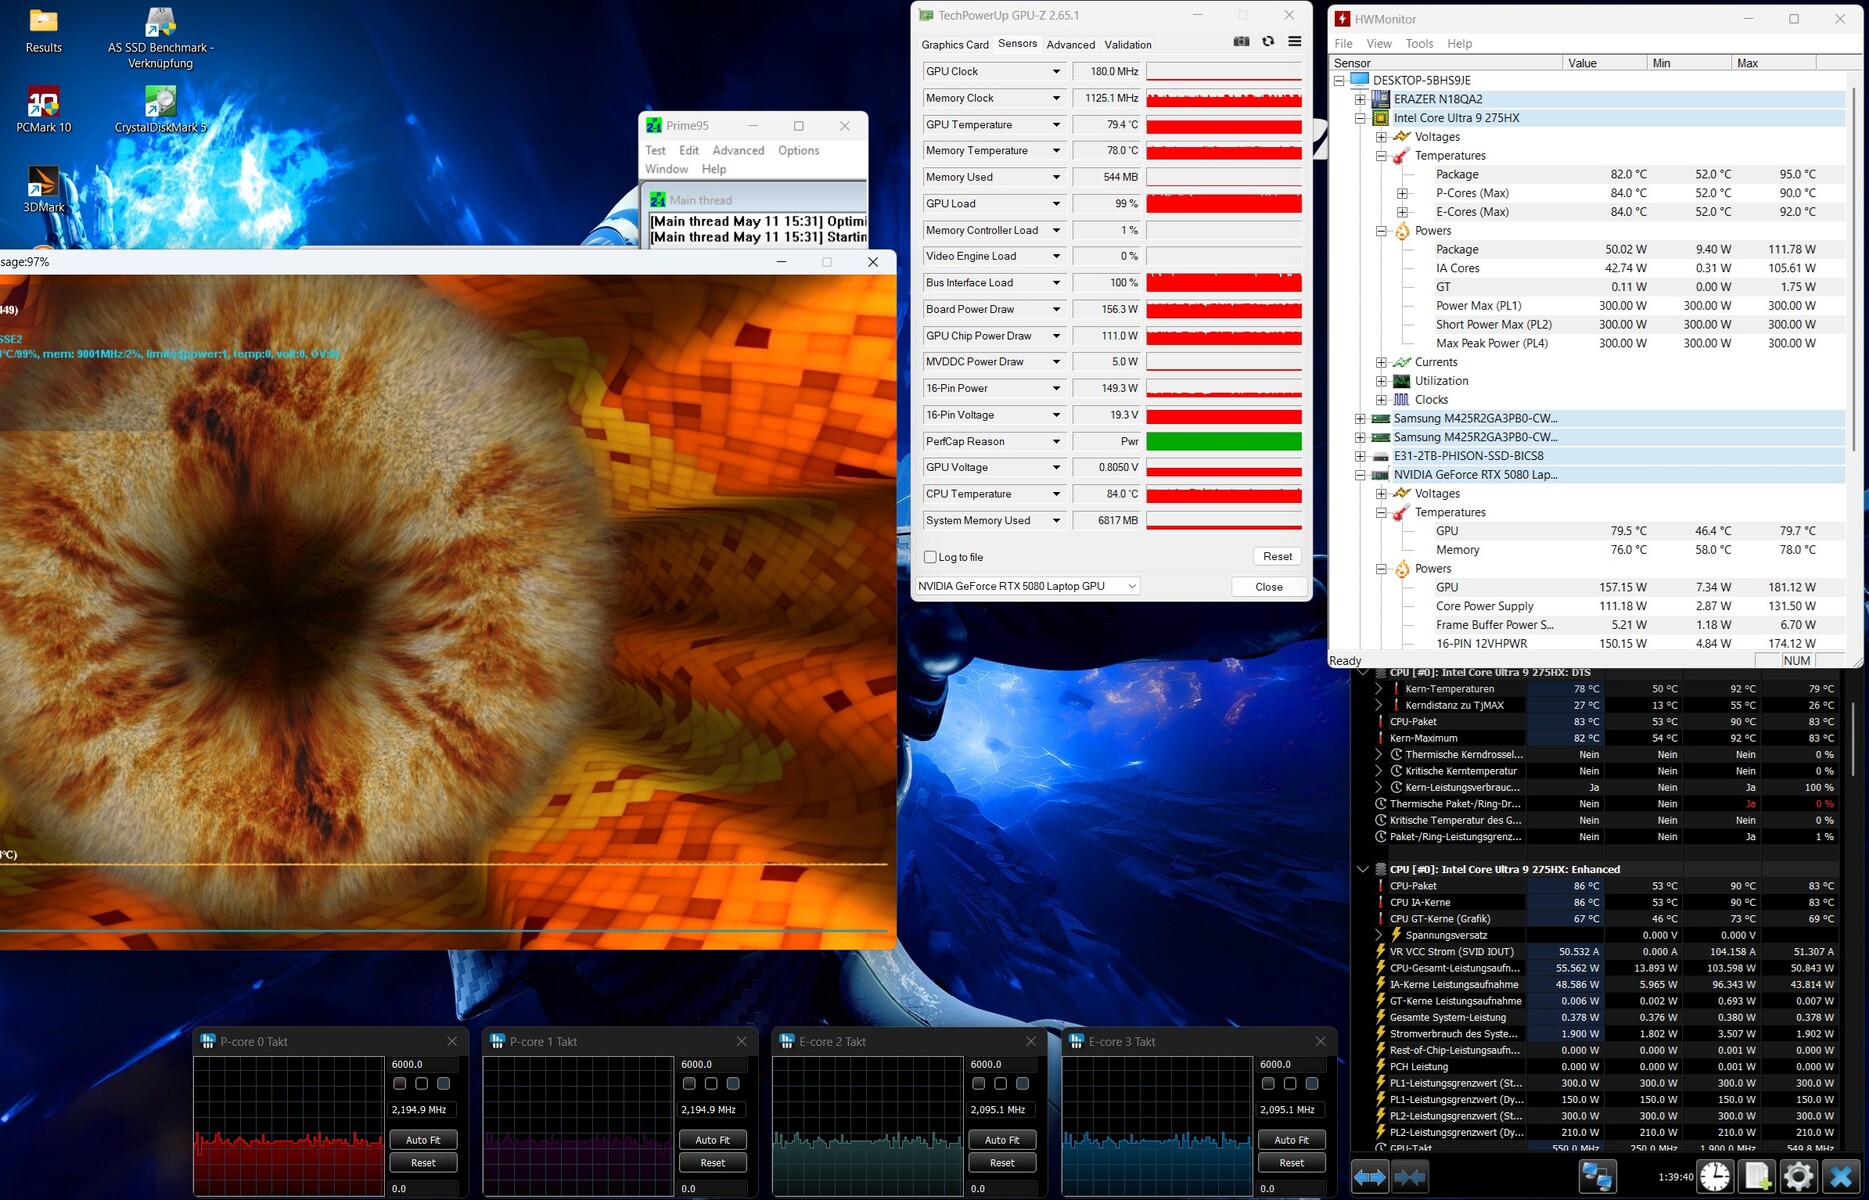
Test da sforzo
Il nostro test di stress con Furmark e Prime95 non ha fatto sudare troppo i componenti. Circa 80 °C per la CPU e la GPU sono accettabili.
Altoparlante
Il sistema audio è in grado di riempire anche le stanze più grandi, con un volume massimo di 89 dB(A). Secondo l'analisi audio, la qualità del suono è leggermente inferiore a quella dell'Aorus Master 18, ma rimane relativamente buona per un notebook, nonostante le consuete debolezze dei bassi.
Medion Erazer Beast 18 X1 MD62731 analisi audio
(+) | gli altoparlanti sono relativamente potenti (89 dB)
Bassi 100 - 315 Hz
(-) | quasi nessun basso - in media 18.6% inferiori alla media
(±) | la linearità dei bassi è media (13% delta rispetto alla precedente frequenza)
Medi 400 - 2000 Hz
(+) | medi bilanciati - solo only 2.8% rispetto alla media
(+) | medi lineari (4.5% delta rispetto alla precedente frequenza)
Alti 2 - 16 kHz
(±) | alti elevati - circa 5.3% superiori alla media
(+) | alti lineari (6.4% delta rispetto alla precedente frequenza)
Nel complesso 100 - 16.000 Hz
(+) | suono nel complesso lineare (14.2% differenza dalla media)
Rispetto alla stessa classe
» 25% di tutti i dispositivi testati in questa classe è stato migliore, 7% simile, 68% peggiore
» Il migliore ha avuto un delta di 6%, medio di 18%, peggiore di 132%
Rispetto a tutti i dispositivi testati
» 17% di tutti i dispositivi testati in questa classe è stato migliore, 4% similare, 79% peggiore
» Il migliore ha avuto un delta di 4%, medio di 24%, peggiore di 134%
Aorus Master 18 AM8H analisi audio
(±) | potenza degli altiparlanti media ma buona (77 dB)
Bassi 100 - 315 Hz
(±) | bassi ridotti - in media 8.7% inferiori alla media
(±) | la linearità dei bassi è media (10.3% delta rispetto alla precedente frequenza)
Medi 400 - 2000 Hz
(+) | medi bilanciati - solo only 3% rispetto alla media
(+) | medi lineari (4.3% delta rispetto alla precedente frequenza)
Alti 2 - 16 kHz
(+) | Alti bilanciati - appena 2.8% dalla media
(+) | alti lineari (5.4% delta rispetto alla precedente frequenza)
Nel complesso 100 - 16.000 Hz
(+) | suono nel complesso lineare (11.9% differenza dalla media)
Rispetto alla stessa classe
» 12% di tutti i dispositivi testati in questa classe è stato migliore, 4% simile, 84% peggiore
» Il migliore ha avuto un delta di 6%, medio di 18%, peggiore di 132%
Rispetto a tutti i dispositivi testati
» 9% di tutti i dispositivi testati in questa classe è stato migliore, 2% similare, 89% peggiore
» Il migliore ha avuto un delta di 4%, medio di 24%, peggiore di 134%
Gestione dell'energia
Consumo di energia
Al minimo, il consumo energetico fluttua in modo simile al livello di rumore. Idealmente, è di soli 7,9-16,6 watt, un valore migliore di tutti i dispositivi di confronto (la dGPU si attiva automaticamente quando si collega un monitor esterno). In modalità 3D, il consumo energetico arriva a 330 watt e anche l'alimentatore in dotazione è specificato a 330 watt.
| Off / Standby | |
| Idle | |
| Sotto carico |
|
Leggenda:
min: | |
| Medion Erazer Beast 18 X1 MD62731 Ultra 9 275HX, GeForce RTX 5080 Laptop | MSI GE78HX 13VH-070US i9-13950HX, GeForce RTX 4080 Laptop GPU | Acer Predator Helios 18 N23Q2 i9-13900HX, GeForce RTX 4080 Laptop GPU | Asus Strix Scar 18 G835LX Ultra 9 275HX, GeForce RTX 5090 Laptop | Aorus Master 18 AM8H Ultra 9 275HX, GeForce RTX 5090 Laptop | Lenovo Legion Pro 7i 16 Gen 10 Ultra 9 275HX, GeForce RTX 5080 Laptop | Media della classe Gaming | |
|---|---|---|---|---|---|---|---|
| Power Consumption | -60% | -38% | -75% | -97% | -107% | -27% | |
| Idle Minimum * (Watt) | 7.9 | 16.1 -104% | 16 -103% | 11.4 -44% | 29 -267% | 28.5 -261% | 13.1 ? -66% |
| Idle Average * (Watt) | 11.5 | 24 -109% | 19 -65% | 39.2 -241% | 33 -187% | 38.8 -237% | 18.7 ? -63% |
| Idle Maximum * (Watt) | 16.6 | 34 -105% | 21.3 -28% | 40.2 -142% | 48 -189% | 45.6 -175% | 24.4 ? -47% |
| Load Average * (Watt) | 130 | 123.6 5% | 124 5% | 161.2 -24% | 141 -8% | 132.2 -2% | 108.1 ? 17% |
| Cyberpunk 2077 ultra * (Watt) | 253 | 303 -20% | 283 -12% | 318 -26% | |||
| Cyberpunk 2077 ultra external monitor * (Watt) | 245 | 295 -20% | 283 -16% | 319 -30% | |||
| Load Maximum * (Watt) | 330 | 285.7 13% | 319 3% | 430.9 -31% | 340 -3% | 384 -16% | 254 ? 23% |
| Witcher 3 ultra * (Watt) | 286 | 289 |
* ... Meglio usare valori piccoli
Power consumption Cyberpunk / Stress test
Power consumption with external monitor
Durata della batteria
Grazie al consumo energetico moderato in modalità idle, Erazer Beast 18 X1 offre la durata della batteria più lunga tra i dispositivi del test. Circa 8 ore di navigazione in Internet con la luminosità impostata a 150 cd/m² è una cifra più che rispettabile.
| Medion Erazer Beast 18 X1 MD62731 Ultra 9 275HX, GeForce RTX 5080 Laptop, 99 Wh | MSI GE78HX 13VH-070US i9-13950HX, GeForce RTX 4080 Laptop GPU, 99 Wh | Acer Predator Helios 18 N23Q2 i9-13900HX, GeForce RTX 4080 Laptop GPU, 90 Wh | Asus Strix Scar 18 G835LX Ultra 9 275HX, GeForce RTX 5090 Laptop, 90 Wh | Aorus Master 18 AM8H Ultra 9 275HX, GeForce RTX 5090 Laptop, 99 Wh | Lenovo Legion Pro 7i 16 Gen 10 Ultra 9 275HX, GeForce RTX 5080 Laptop, 99 Wh | Media della classe Gaming | |
|---|---|---|---|---|---|---|---|
| Autonomia della batteria | -23% | -44% | -30% | -38% | -32% | -11% | |
| WiFi v1.3 (h) | 7.9 | 6.1 -23% | 4.4 -44% | 5.5 -30% | 4.9 -38% | 5.4 -32% | 7.04 ? -11% |
| Reader / Idle (h) | 7.3 | 5.8 | 8.71 ? | ||||
| Load (h) | 1.5 | 1.7 | 1.2 | 1.9 | 0.8 | 1.47 ? | |
| H.264 (h) | 4.8 | 5.8 | 8.26 ? | ||||
| Cyberpunk 2077 ultra 150cd (h) | 0.7 |
Valutazione complessiva di Notebookcheck
Medion Erazer Beast 18 X1 si distingue dalla concorrenza dei 18 pollici per la sua rispettabile durata della batteria, ma tende ad essere più rumoroso sotto carico (nella stessa modalità di prestazioni) rispetto alle sue controparti.
Medion Erazer Beast 18 X1 MD62731
- 05/21/2025 v8
Florian Glaser
 Total Sustainability Score:
 Confronto tra le possibili alternative
Transparency
La selezione dei dispositivi da recensire viene effettuata dalla nostra redazione. Il campione di prova è stato fornito all'autore come prestito dal produttore o dal rivenditore ai fini di questa recensione. L'istituto di credito non ha avuto alcuna influenza su questa recensione, né il produttore ne ha ricevuto una copia prima della pubblicazione. Non vi era alcun obbligo di pubblicare questa recensione. In quanto società mediatica indipendente, Notebookcheck non è soggetta all'autorità di produttori, rivenditori o editori.
Ecco come Notebookcheck esegue i test
Ogni anno, Notebookcheck esamina in modo indipendente centinaia di laptop e smartphone utilizzando procedure standardizzate per garantire che tutti i risultati siano comparabili. Da circa 20 anni sviluppiamo continuamente i nostri metodi di prova e nel frattempo stabiliamo gli standard di settore. Nei nostri laboratori di prova, tecnici ed editori esperti utilizzano apparecchiature di misurazione di alta qualità. Questi test comportano un processo di validazione in più fasi. Il nostro complesso sistema di valutazione si basa su centinaia di misurazioni e parametri di riferimento ben fondati, che mantengono l'obiettività.