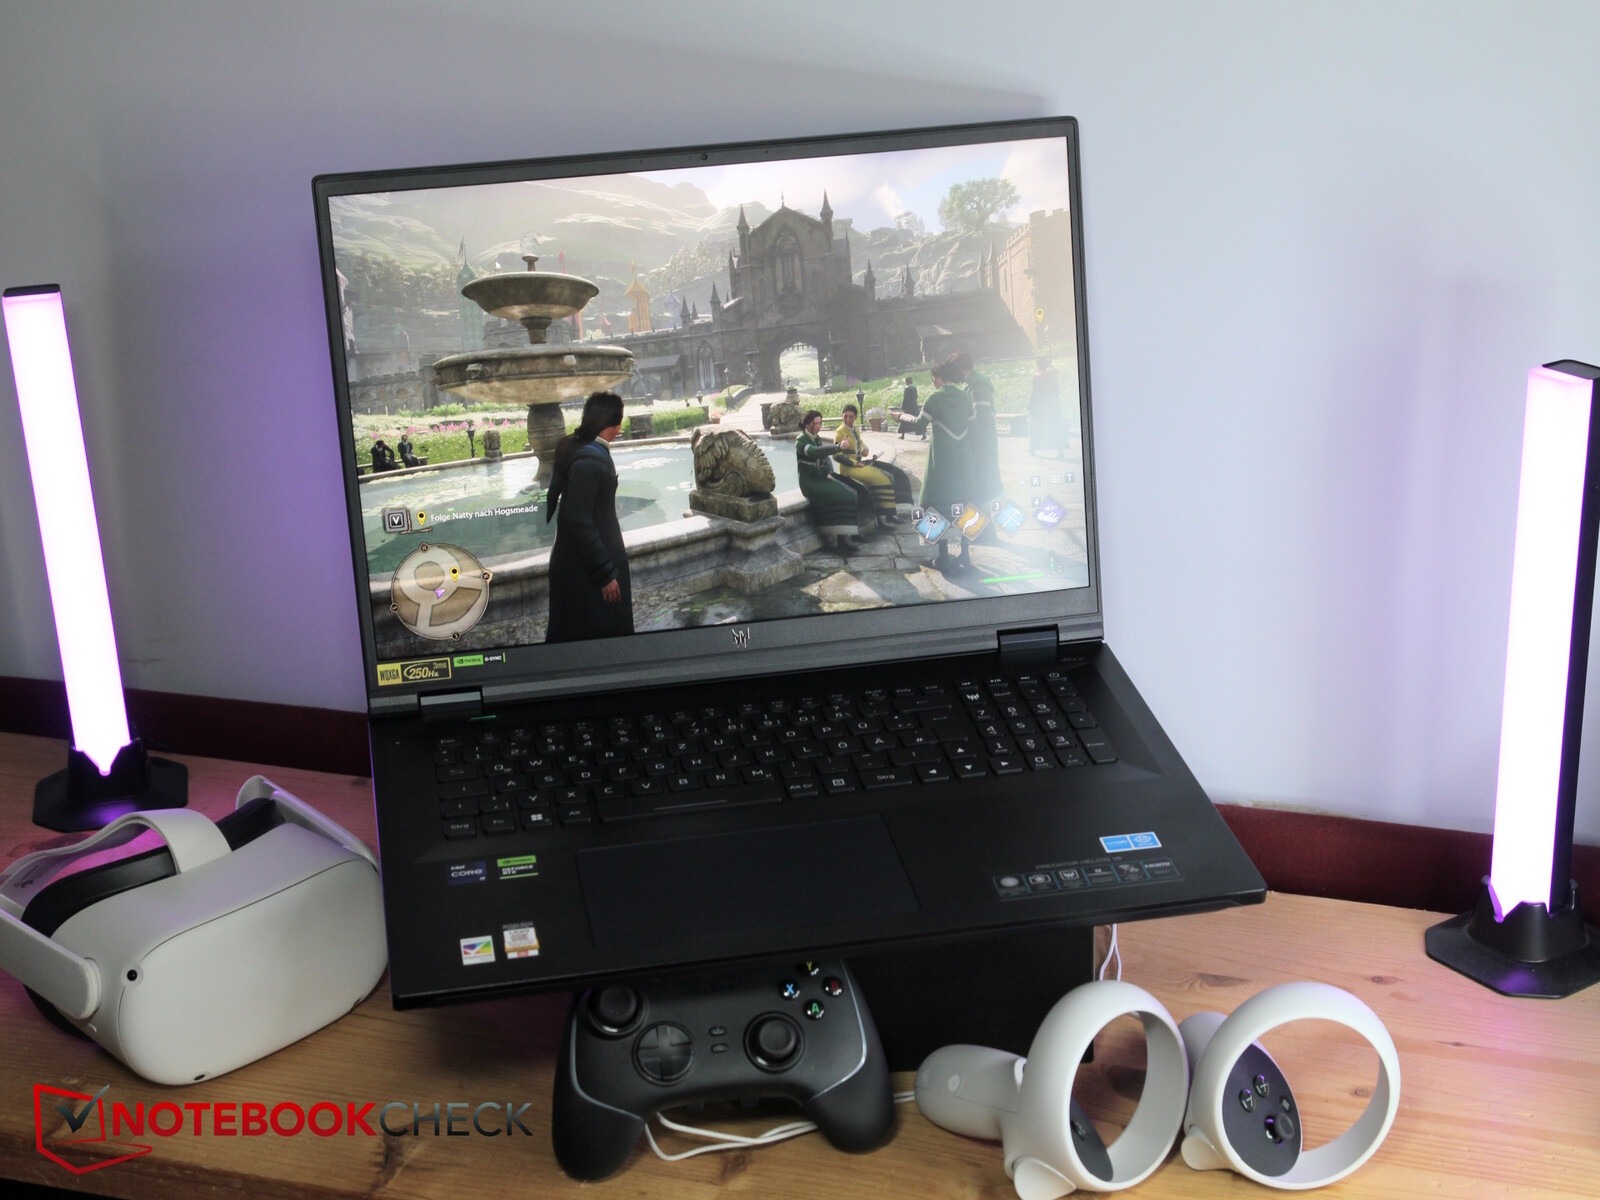
Recensione del computer portatile Acer Predator Helios 18: Gamer RTX 4080 con display MiniLED a oltre 1.000 nits

La RTX 4060 equipaggiato Acer Predator Helios 16 ha ottenuto un punteggio di ben 90 percento nella nostra recensione di luglio. Ora, diamo un'occhiata al modello di fascia alta da 18 pollici con un processore Intel HX, una RTX 4080 e un display MiniLED.
Per il confronto, utilizziamo altri gamer da 18 pollici e da 17 pollici con specifiche simili, poiché Predator Helios 18 è il primo con RTX 4080 tra le nostre recensioni di computer portatili da 18 pollici. I concorrenti includono ilMSI Raider GE78 HX 13VHe l'HP Omen 17 HP Omen 17, l' Alienware m18 R1, il Asus ROG Strix G18 G814JI e il Razer Blade 18.
Potenziali concorrenti a confronto
Punteggio | Data | Modello | Peso | Altezza | Dimensione | Risoluzione | Prezzo |
|---|---|---|---|---|---|---|---|
| 88.3 % v7 (old) | 10/2023 | Acer Predator Helios 18 N23Q2 i9-13900HX, GeForce RTX 4080 Laptop GPU | 3.2 kg | 29.15 mm | 18.00" | 2560x1600 | |
| 88.3 % v7 (old) | 03/2023 | MSI GE78HX 13VH-070US i9-13950HX, GeForce RTX 4080 Laptop GPU | 3 kg | 23 mm | 17.00" | 2560x1600 | |
| 85.4 % v7 (old) | 03/2023 | HP Omen 17-ck2097ng i9-13900HX, GeForce RTX 4080 Laptop GPU | 2.8 kg | 27 mm | 17.30" | 2560x1440 | |
| 90.7 % v7 (old) | 04/2023 | Alienware m18 R1 i9-13980HX, GeForce RTX 4090 Laptop GPU | 3.9 kg | 26.7 mm | 18.00" | 1920x1200 | |
| 87.4 % v7 (old) | 03/2023 | Asus ROG Strix G18 G814JI i7-13650HX, GeForce RTX 4070 Laptop GPU | 3 kg | 31 mm | 18.00" | 2560x1600 | |
| 91.4 % v7 (old) | 02/2023 | Razer Blade 18 RTX 4070 i9-13950HX, GeForce RTX 4070 Laptop GPU | 3 kg | 21.9 mm | 18.00" | 2560x1600 |
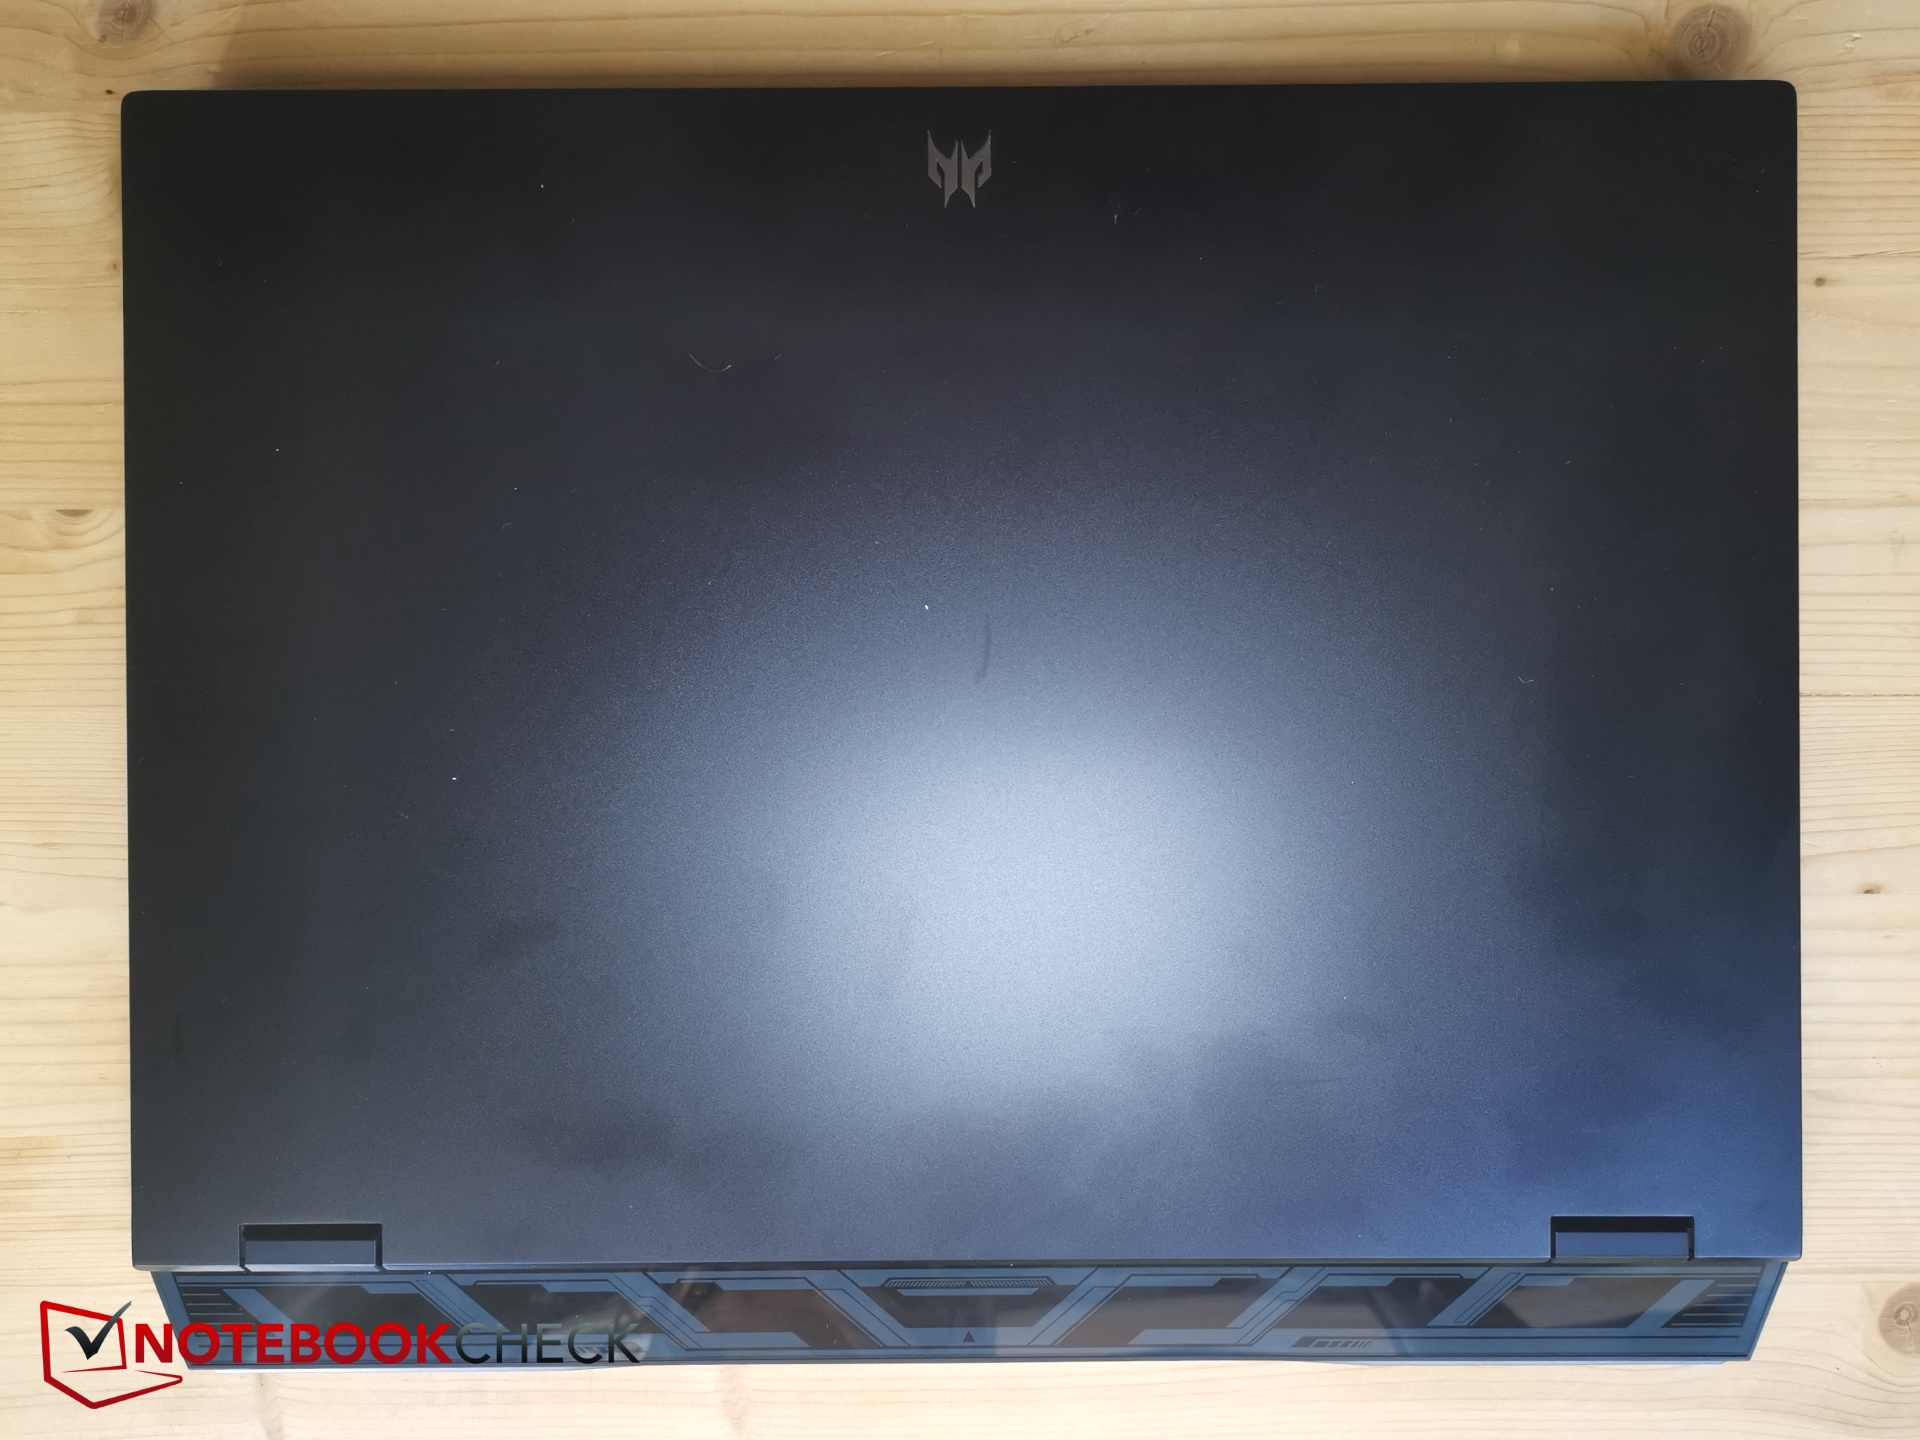
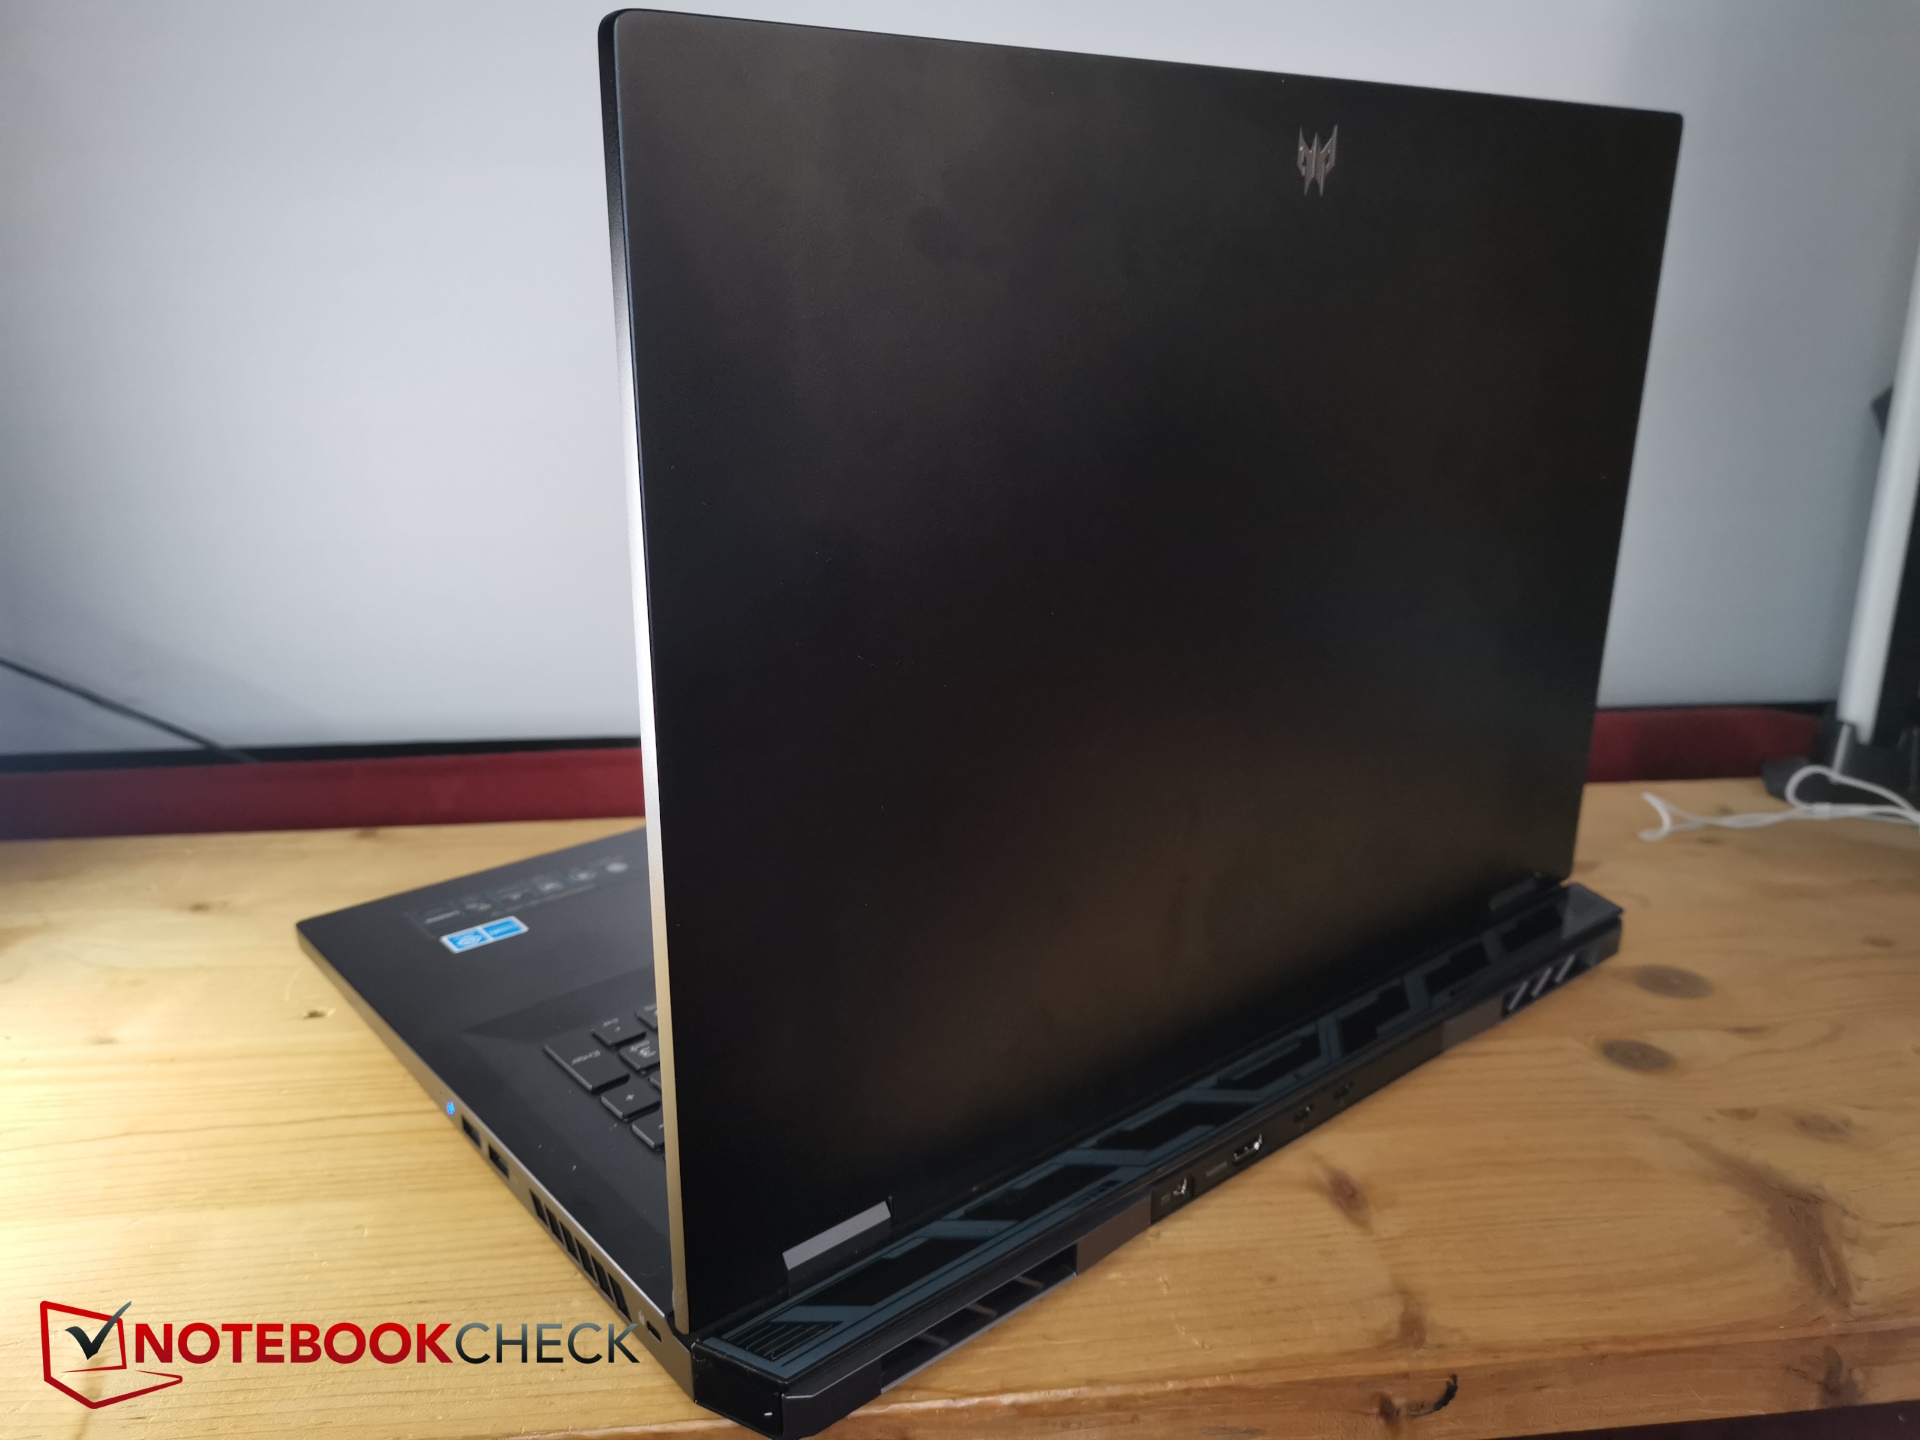
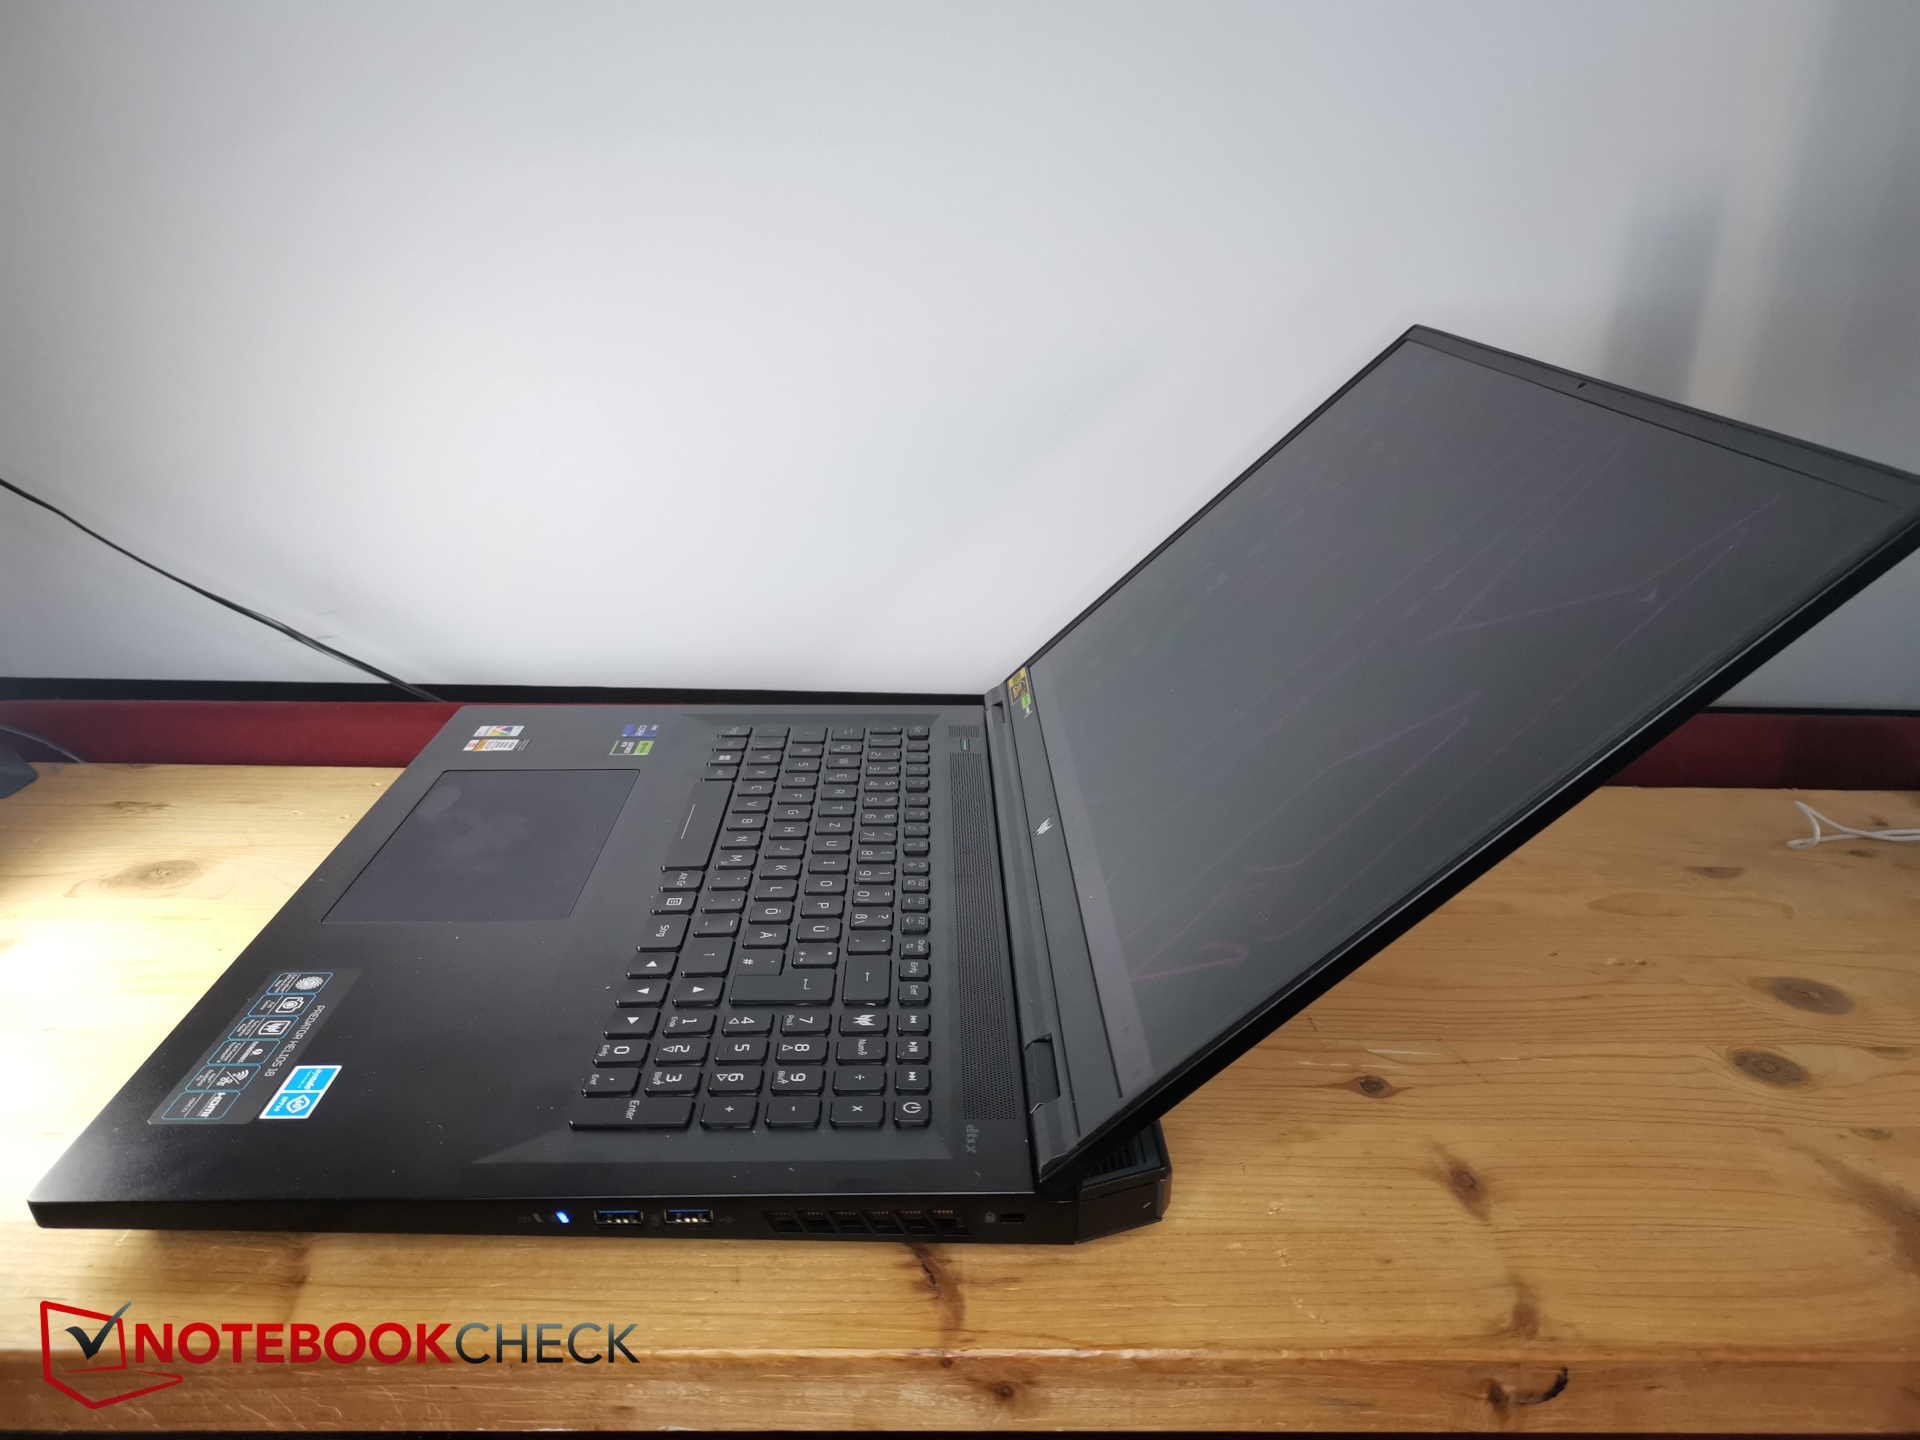
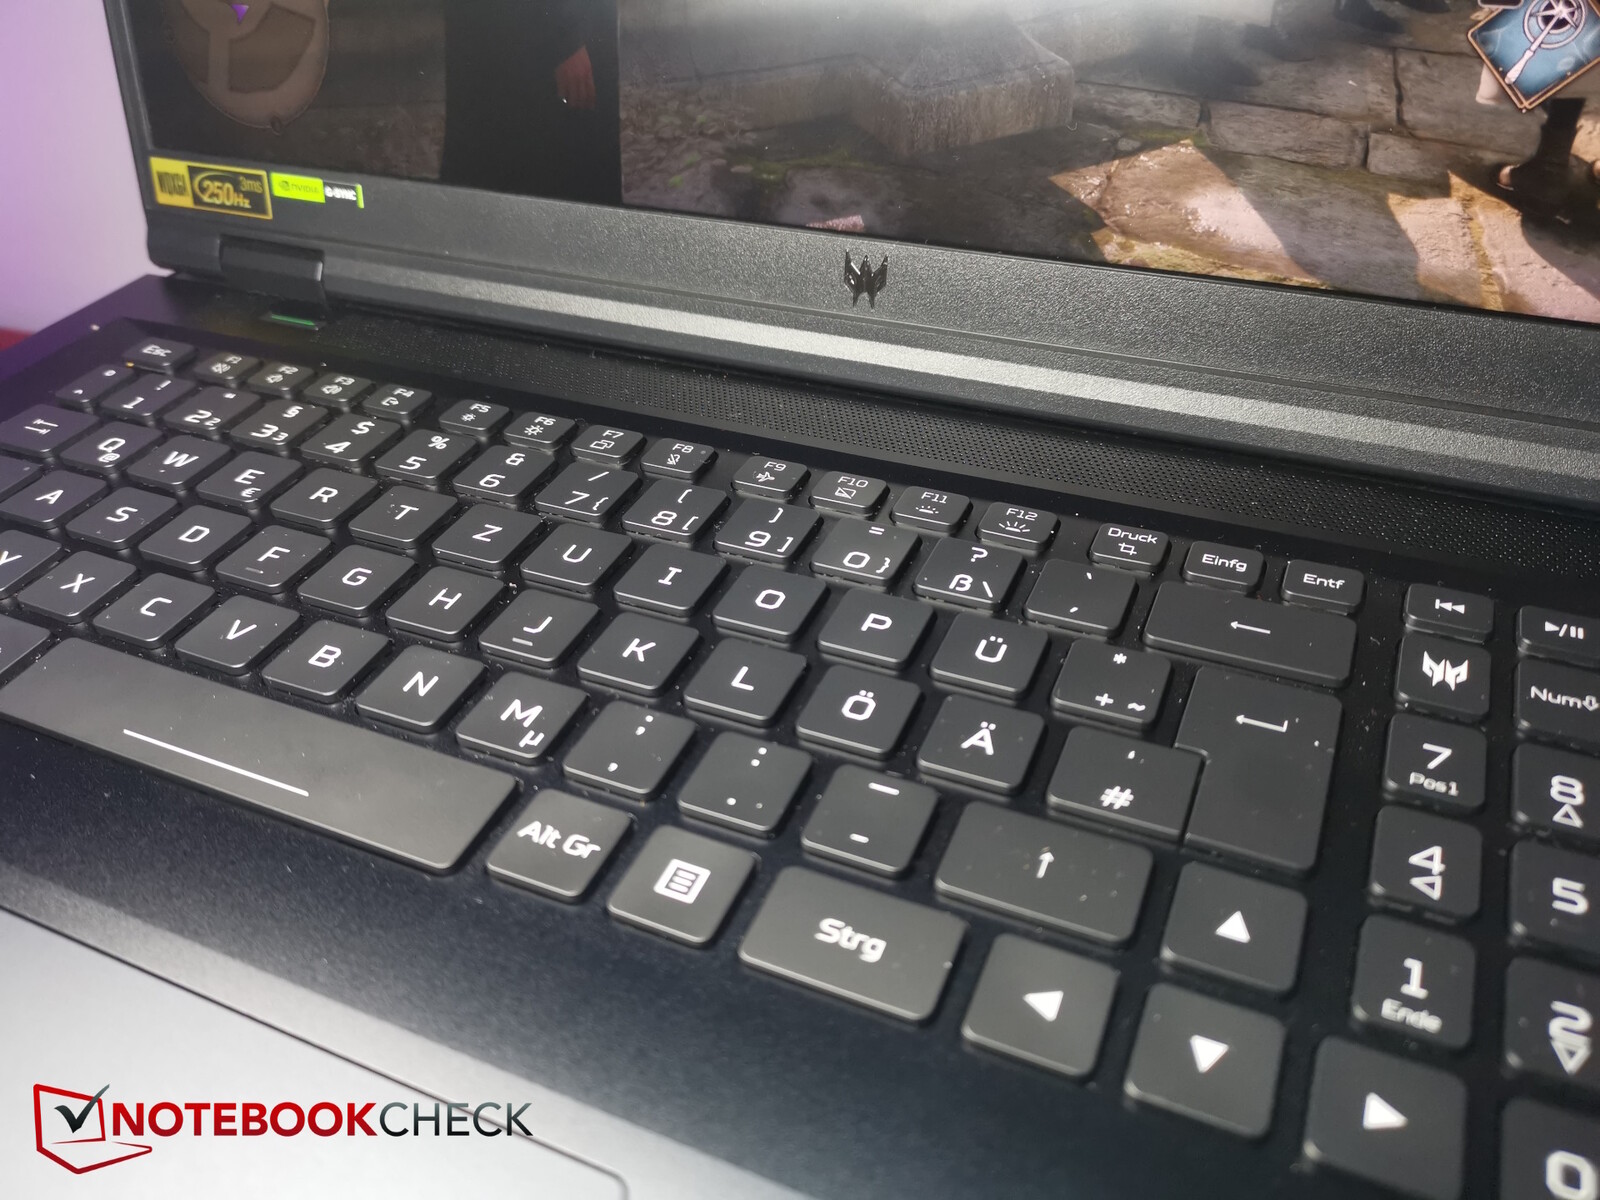
Custodia - Alluminio nero per l'Acer Predator
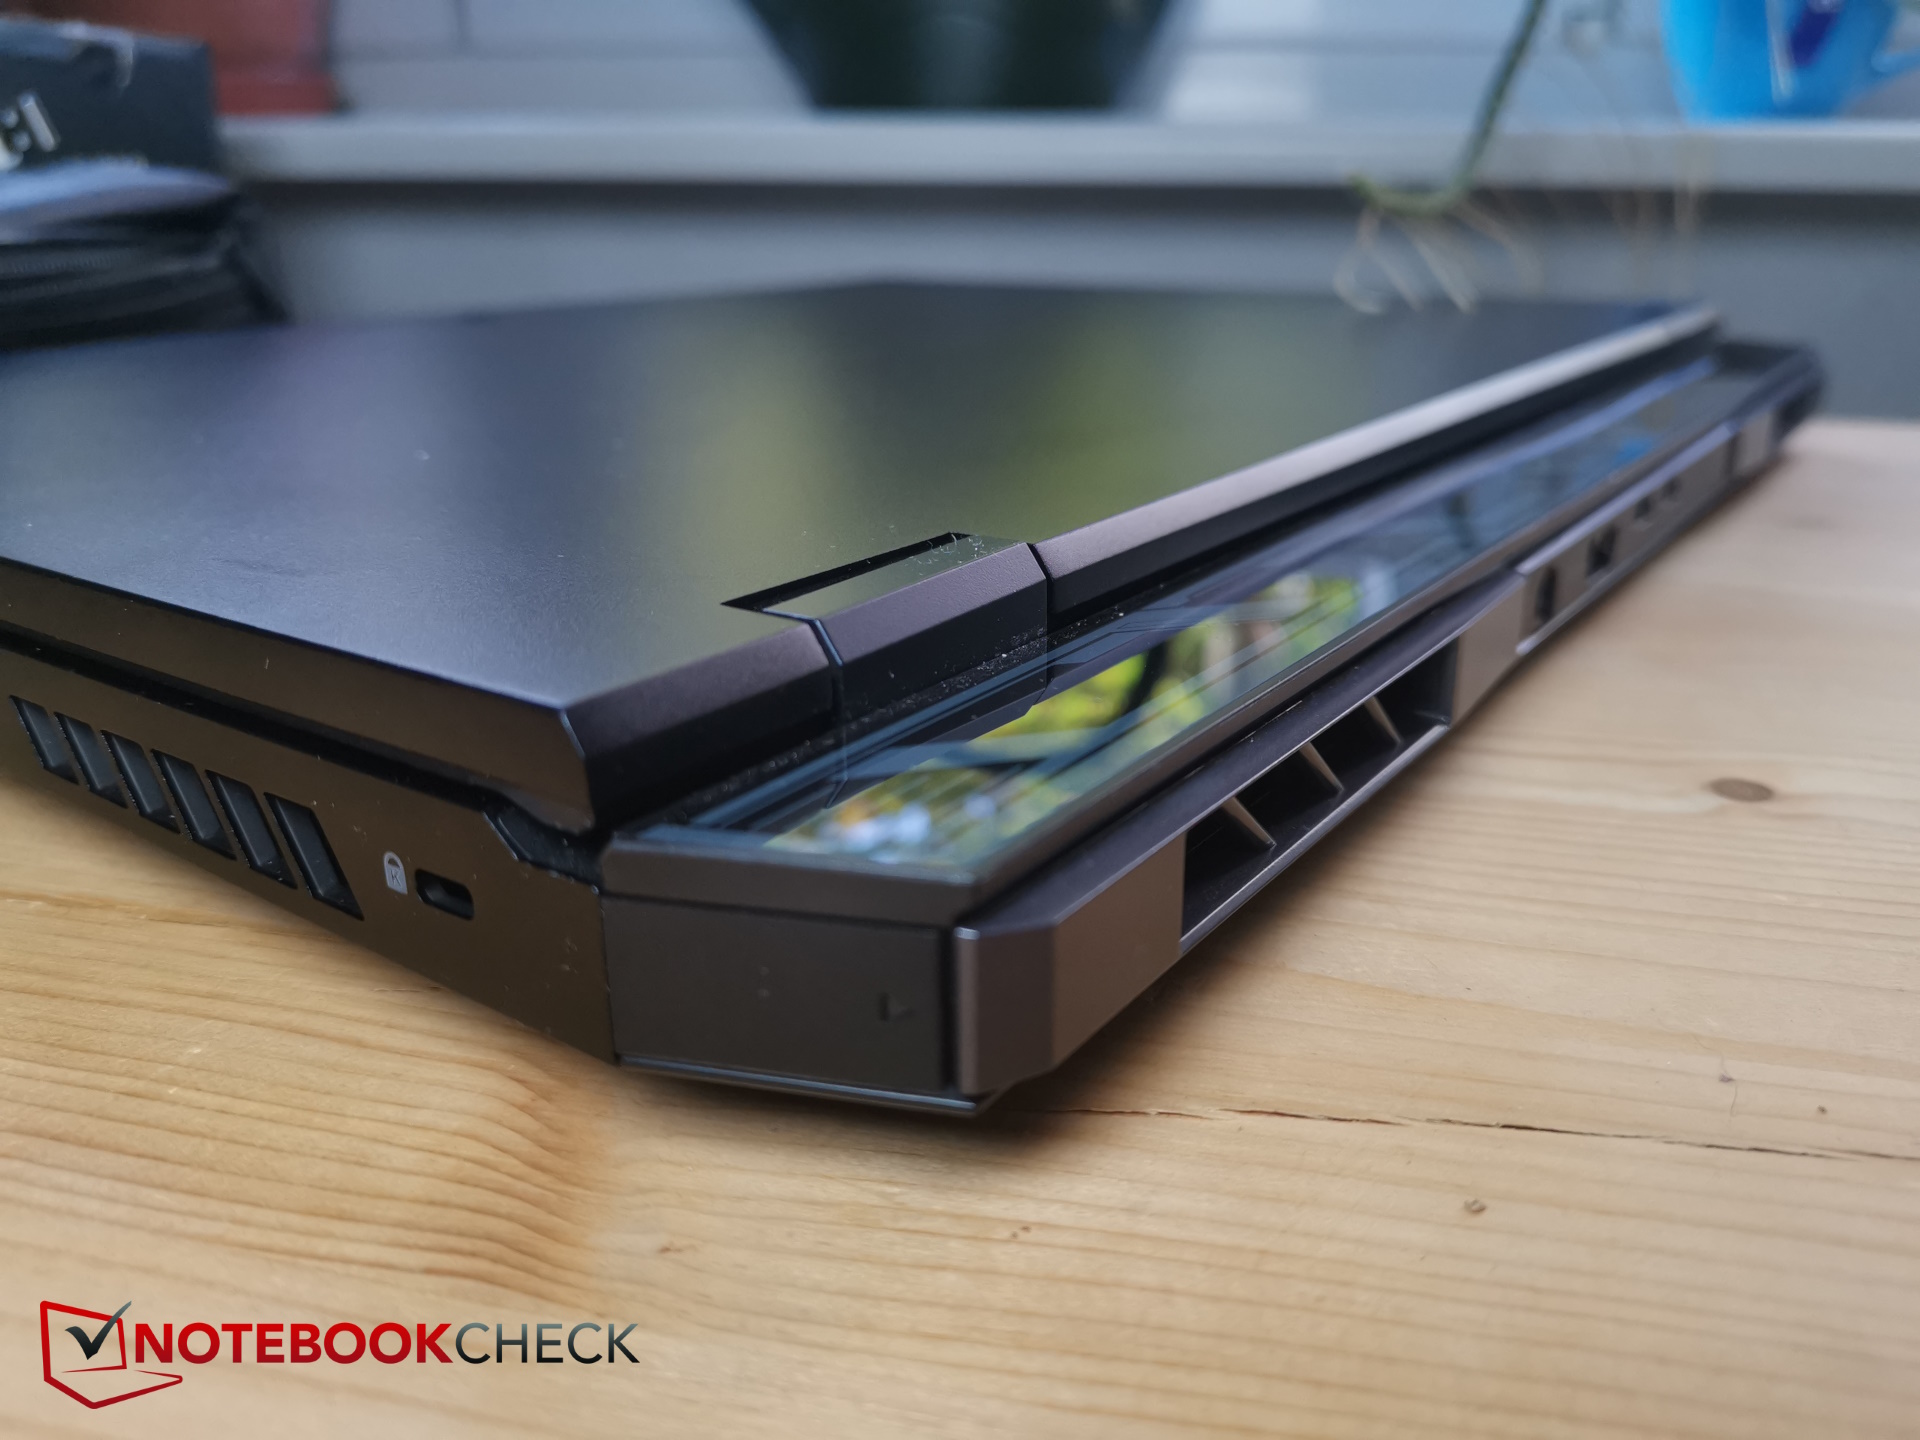
Acer progetta Helios 18 in un nero scuro, quasi invisibile. Ma il dispositivo non fa alcun tentativo di nascondere la sua natura di gioco, caratterizzata dal piccolo logo Predator sul coperchio del display e dal sistema di raffreddamento sporgente sul retro.
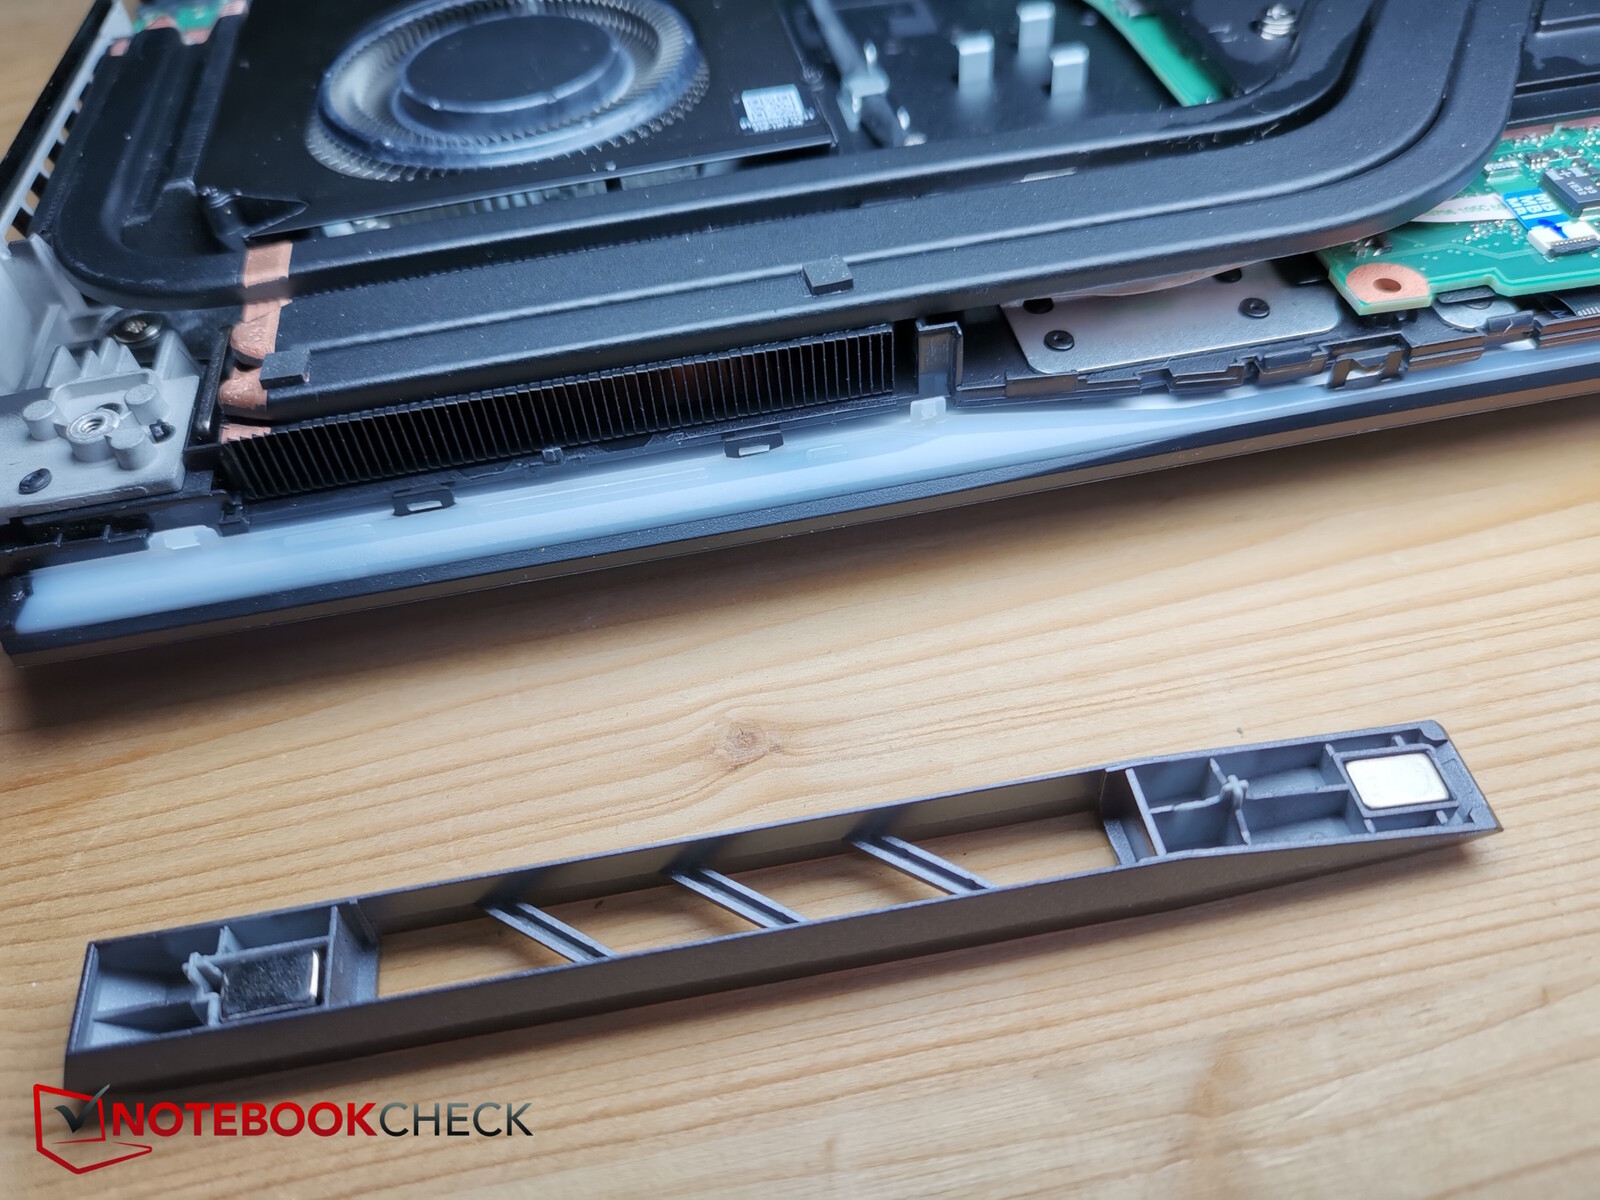
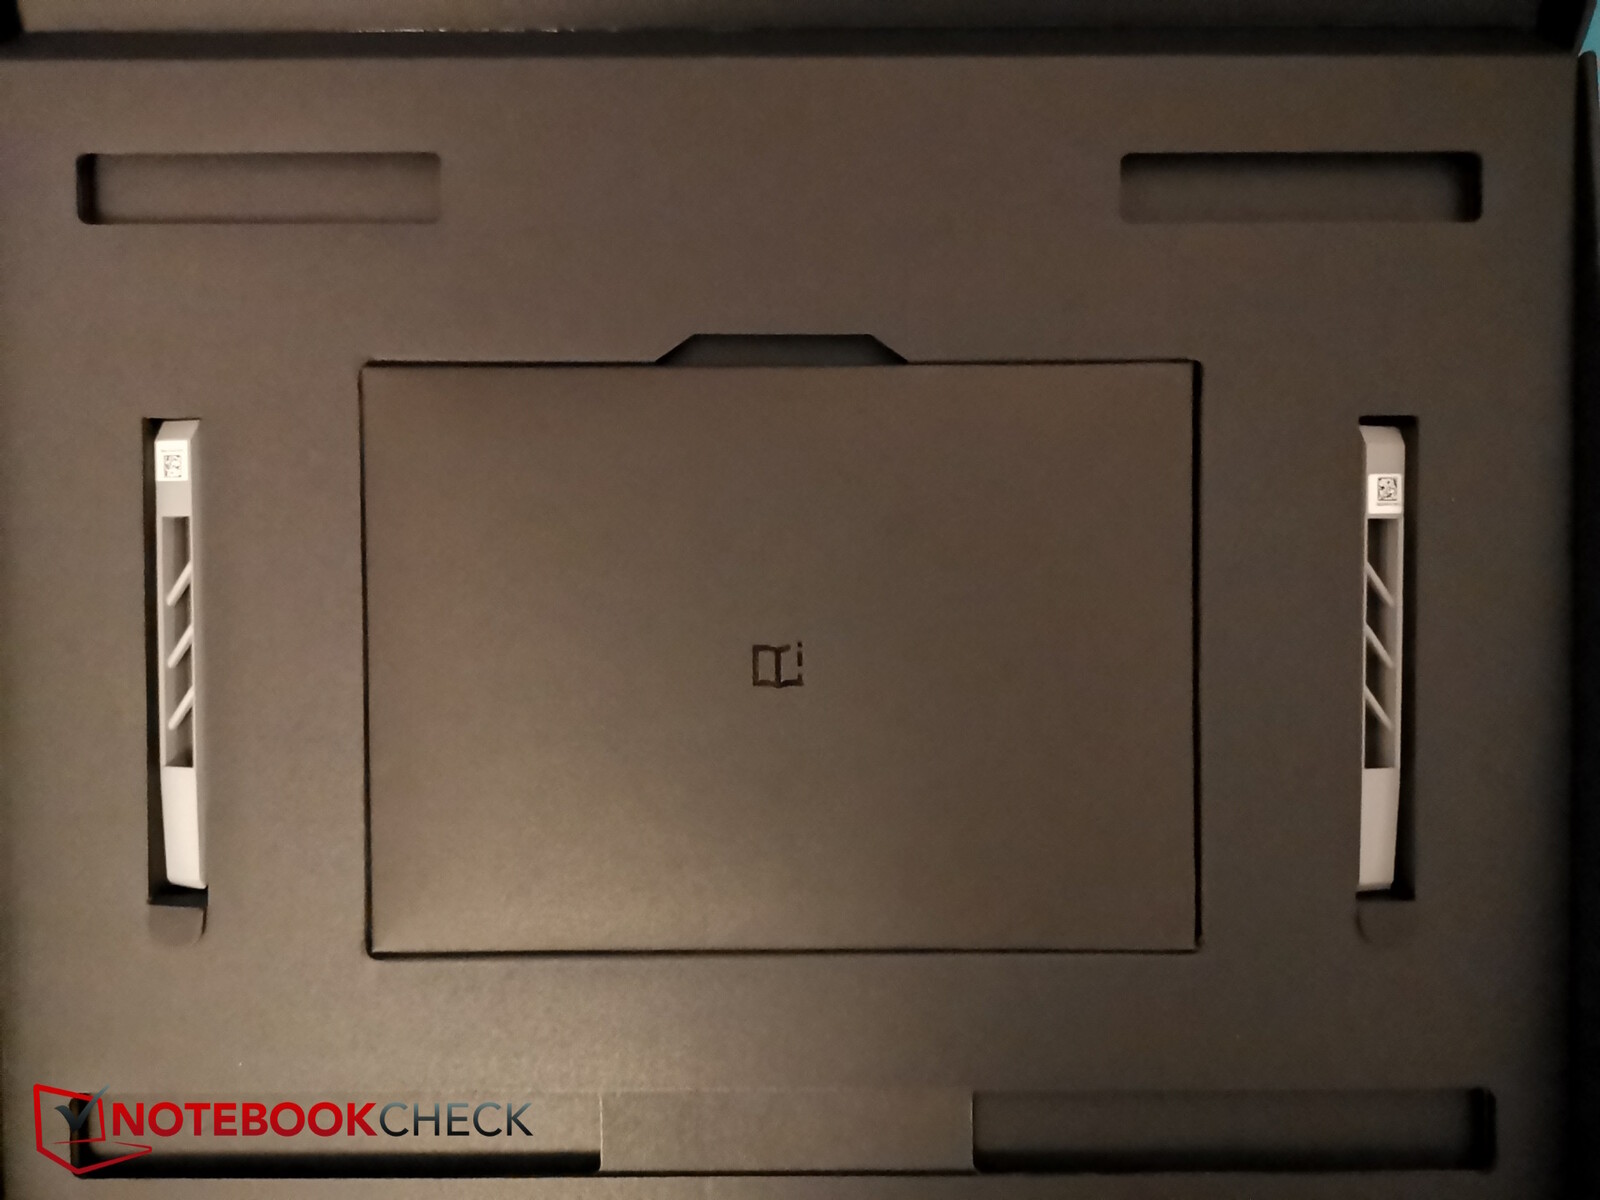
La lavorazione non lascia spazio a critiche: le lacune sono impercettibili. Le uscite d'aria posteriori possono anche essere personalizzate - Acer include un'altra coppia di griglie di ventilazione, che possono essere ulteriormente personalizzate con una stampante 3D.
Il coperchio del display e la base sono in alluminio, mentre i bordi del display, l'unità di raffreddamento posteriore e la parte inferiore del portatile sono in plastica. Il metallo conferisce a Helios 18 una buona rigidità e nulla scricchiola o si incrina quando viene sottoposto a sollecitazioni torsionali. Tuttavia, le impronte digitali si accumulano facilmente qui e il lato superiore della base può essere premuto un po' nonostante il metallo, anche durante la digitazione. Ma questo rimane nei limiti ed è dovuto all'ampia superficie.
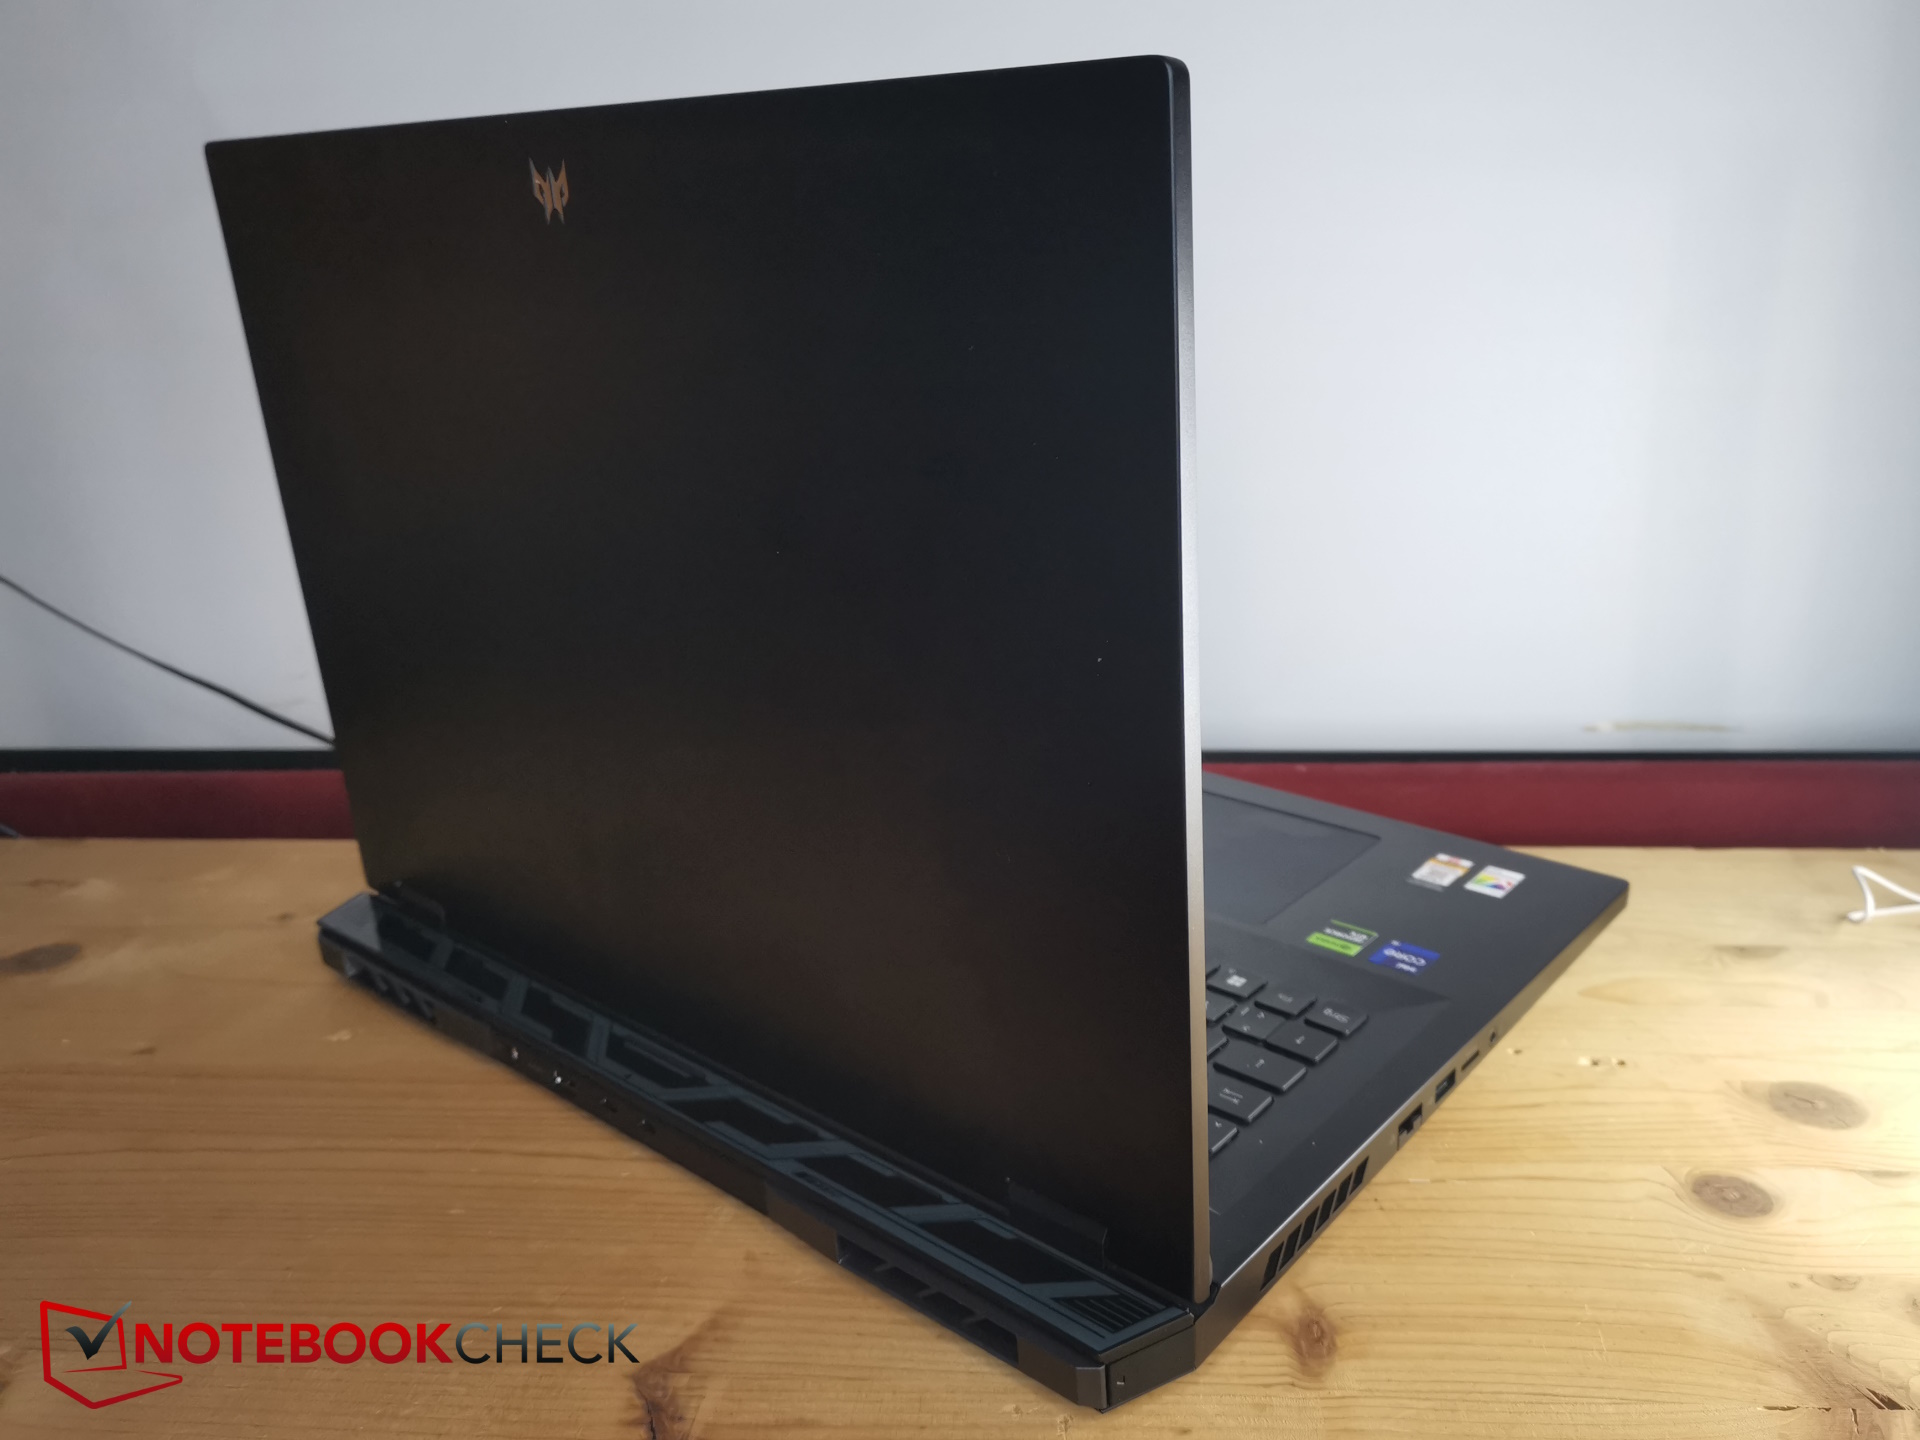
Rispetto alla concorrenza da 18 pollici, Helios 18 si colloca nel mezzo in termini di dimensioni. L'Alienware m18 è leggermente più grande, l'Asus ROG Strix G18 è più piccolo. Quest'ultimo è un po' più spesso, mentre l'Alienware m18 è più sottile. In termini di peso, l'Alien è chiaramente più pesante, il G18 leggermente più leggero.
I gamer da 17 pollici sono in parte molto più piccoli e anche più sottili.
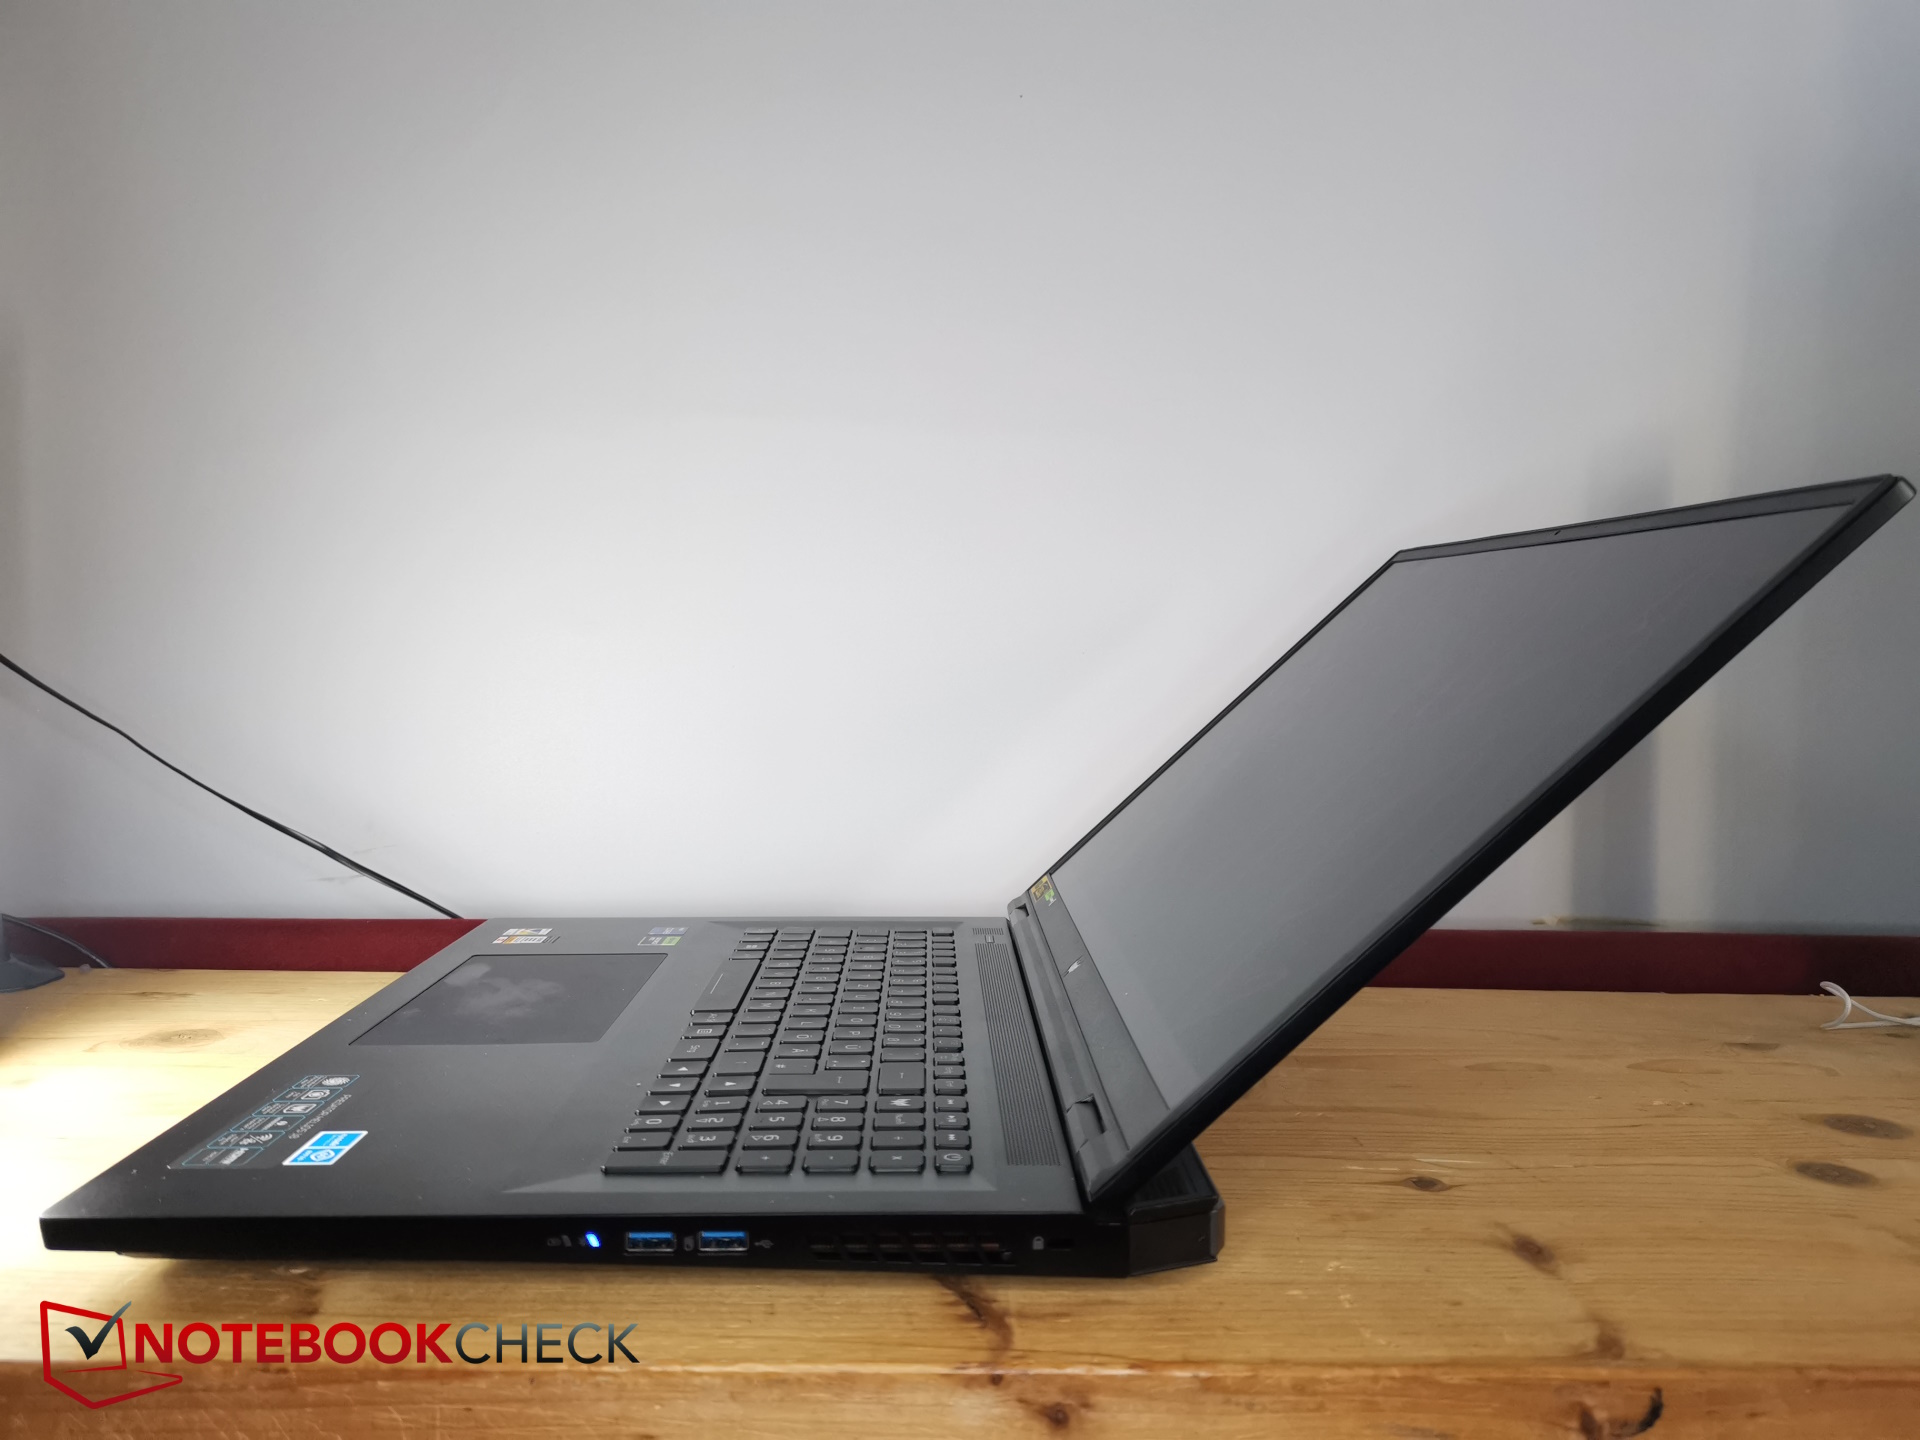
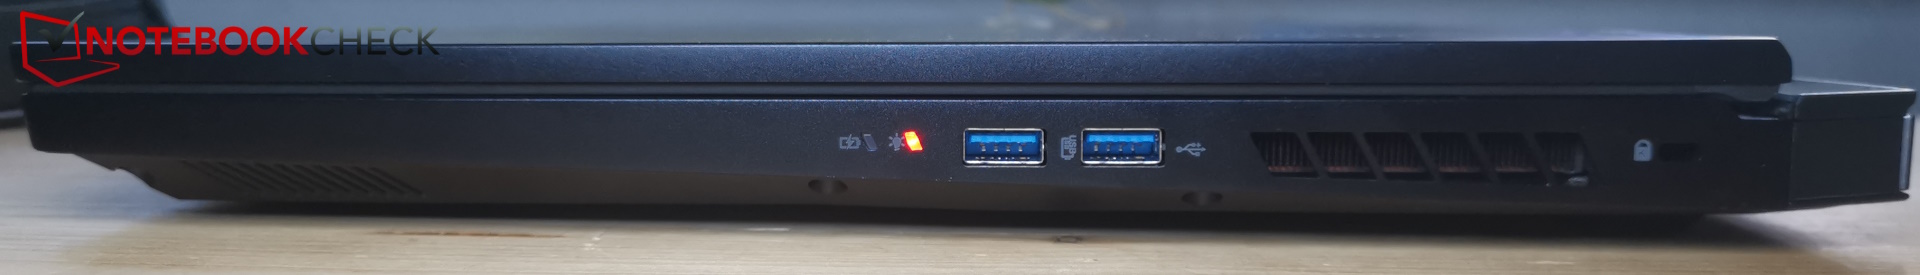
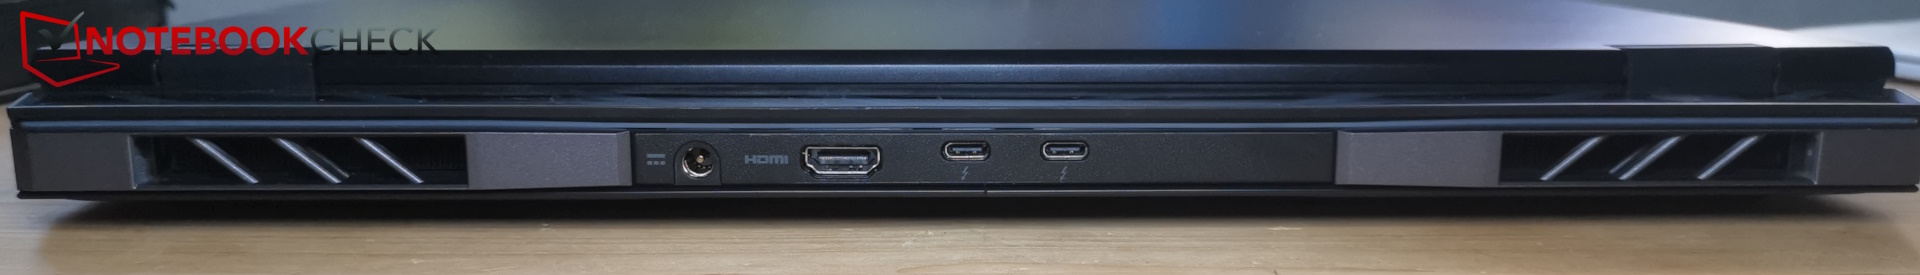
Equipaggiamento - 2x Thunderbolt 4 nel Predator Helios
Helios 18 dispone di tutte le porte necessarie. Sono presenti due porte Thunderbolt 4 sotto forma di USB-C. Solo PowerDelivery non è disponibile. Il lettore di schede SD accetta "solo" schede MicroSD.
Le porte sono distribuite su tre lati, anche se il retro ha ancora spazio e avrebbe potuto facilmente ospitare una delle tante porte a sinistra. Avremmo preferito la porta LAN sul retro e una delle sempre più importanti porte USB-C sul lato.
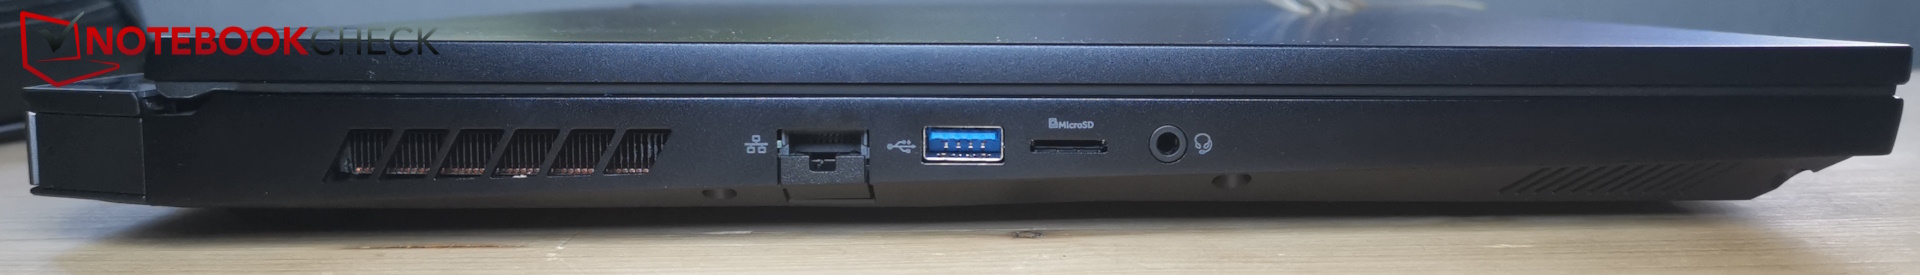
Lettore di schede SD
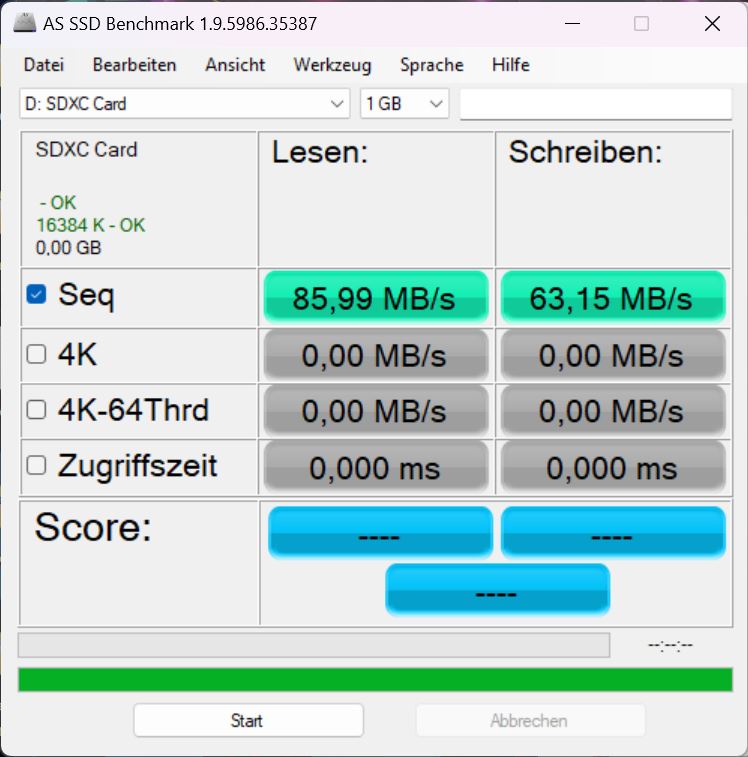
Le schede microSD inserite scorrono in posizione e non sporgono. L'inserimento della nostra AV PRO microSD 128 GB V60 si è rivelato un po' complicato, perché è stato necessario spingerla verso l'interno un po' più a fondo per bloccarla e sganciarla.
La velocità è di livello medio e non notevole; i lettori di schede nel Blade 18 o nel Alienware m18sono significativamente più veloci.
| SD Card Reader | |
| average JPG Copy Test (av. of 3 runs) | |
| Razer Blade 18 RTX 4070 (Angelibird AV Pro V60) | |
| Alienware m18 R1 (Angelibird AV Pro V60) | |
| Media della classe Gaming (20.9 - 210, n=54, ultimi 2 anni) | |
| HP Omen 17-ck2097ng (AV PRO microSD 128 GB V60) | |
| Acer Predator Helios 18 N23Q2 | |
| MSI GE78HX 13VH-070US (Angelibird AV Pro V60) | |
| maximum AS SSD Seq Read Test (1GB) | |
| Alienware m18 R1 (Angelibird AV Pro V60) | |
| Razer Blade 18 RTX 4070 (Angelibird AV Pro V60) | |
| Media della classe Gaming (25.5 - 261, n=51, ultimi 2 anni) | |
| MSI GE78HX 13VH-070US (Angelibird AV Pro V60) | |
| Acer Predator Helios 18 N23Q2 | |
| HP Omen 17-ck2097ng (AV PRO microSD 128 GB V60) | |
Comunicazione
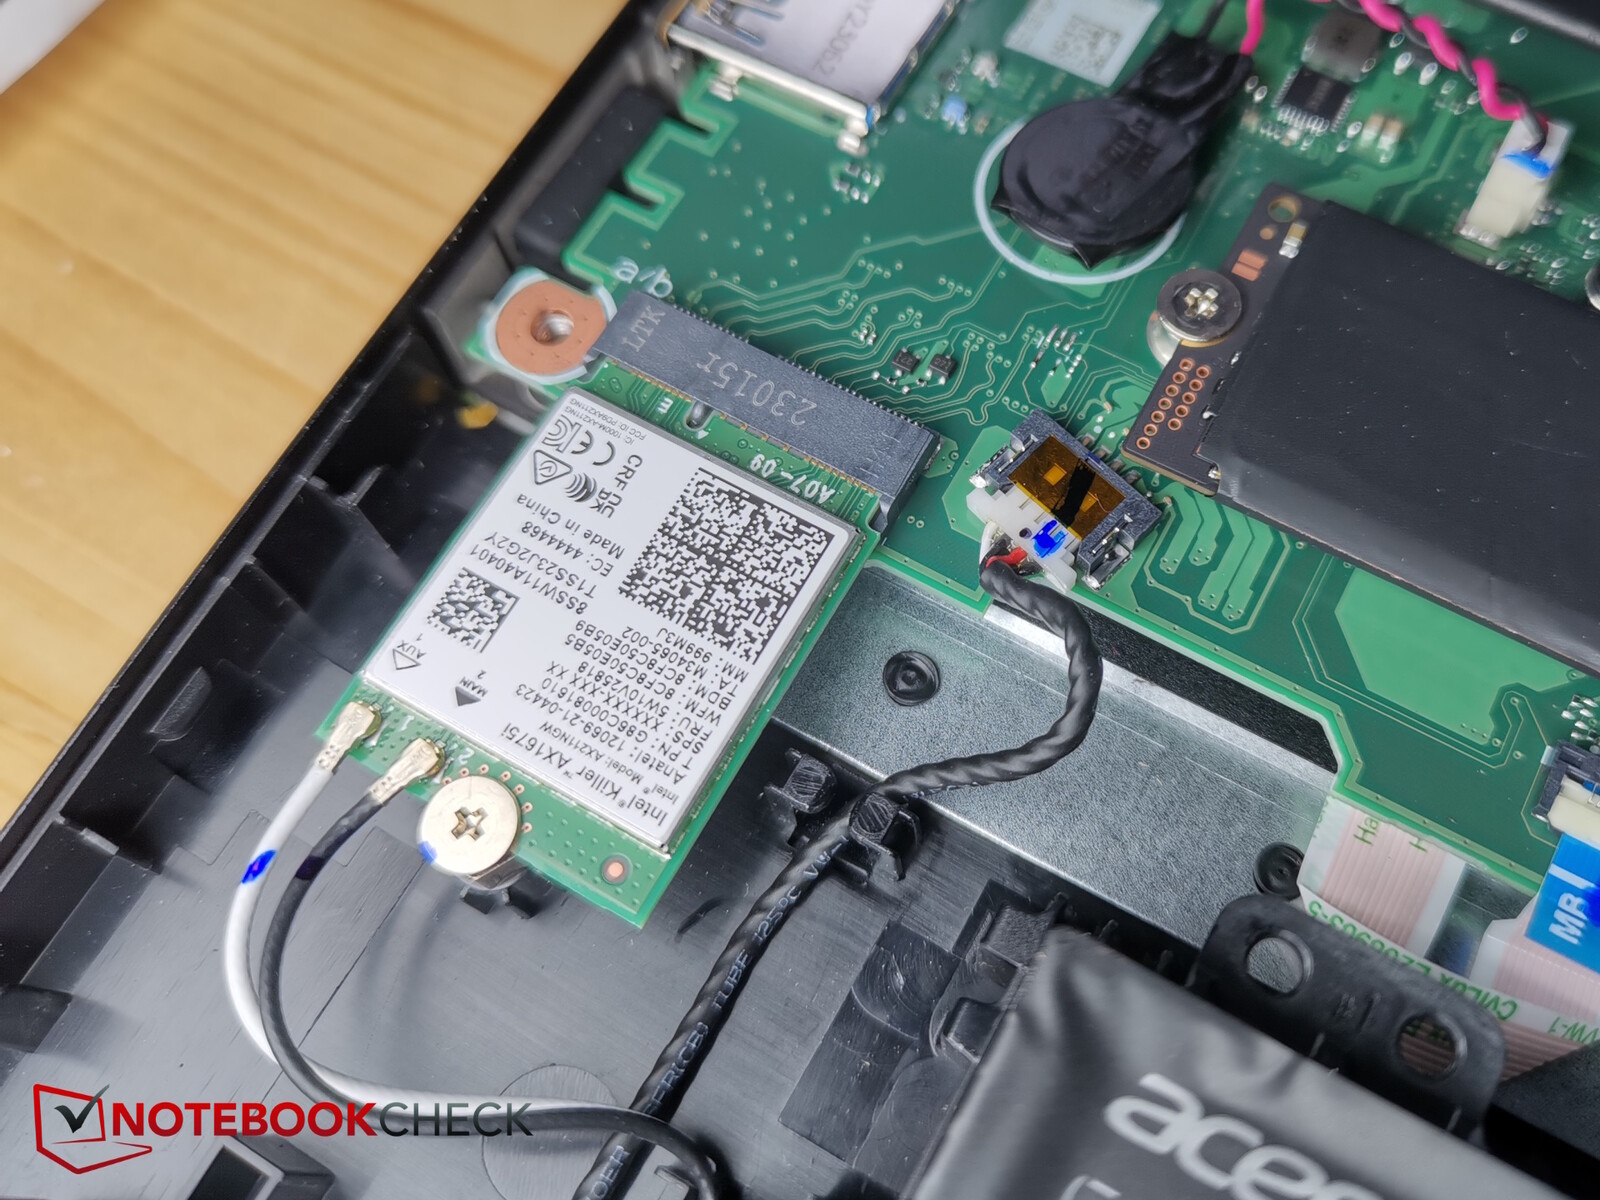
Acer utilizza il modulo WiFi Killer WiFi 6E AX1675i, che supporta 6E in modalità 6 GHz e garantisce una buona velocità di trasferimento di circa 1,5 Mbps. Nella rete a 5 GHz è considerevolmente più lento, raggiungendo circa 900 Mbit/s.
Le velocità di trasferimento si dimostrano molto stabili.
Webcam
La fotocamera scatta foto e video in FullHD. La qualità è accettabile: le deviazioni dei colori rimangono nei limiti. I toni del blu presentano le deviazioni più elevate.


Sicurezza
Il TPM è presente a bordo, così come un collegamento per una serratura in acciaio. Tuttavia, non c'è un sensore di impronte digitali.
Accessori e garanzia
Oltre al computer portatile, all'alimentatore e alla consueta documentazione, la fornitura comprende anche una coppia di copriventola alternativi per il retro di Helios 18.
Acer offre una garanzia standard di 24 mesi in Germania. Questa garanzia potrebbe essere diversa in altri Paesi, quindi i potenziali acquirenti dovrebbero verificare prima dell'acquisto.
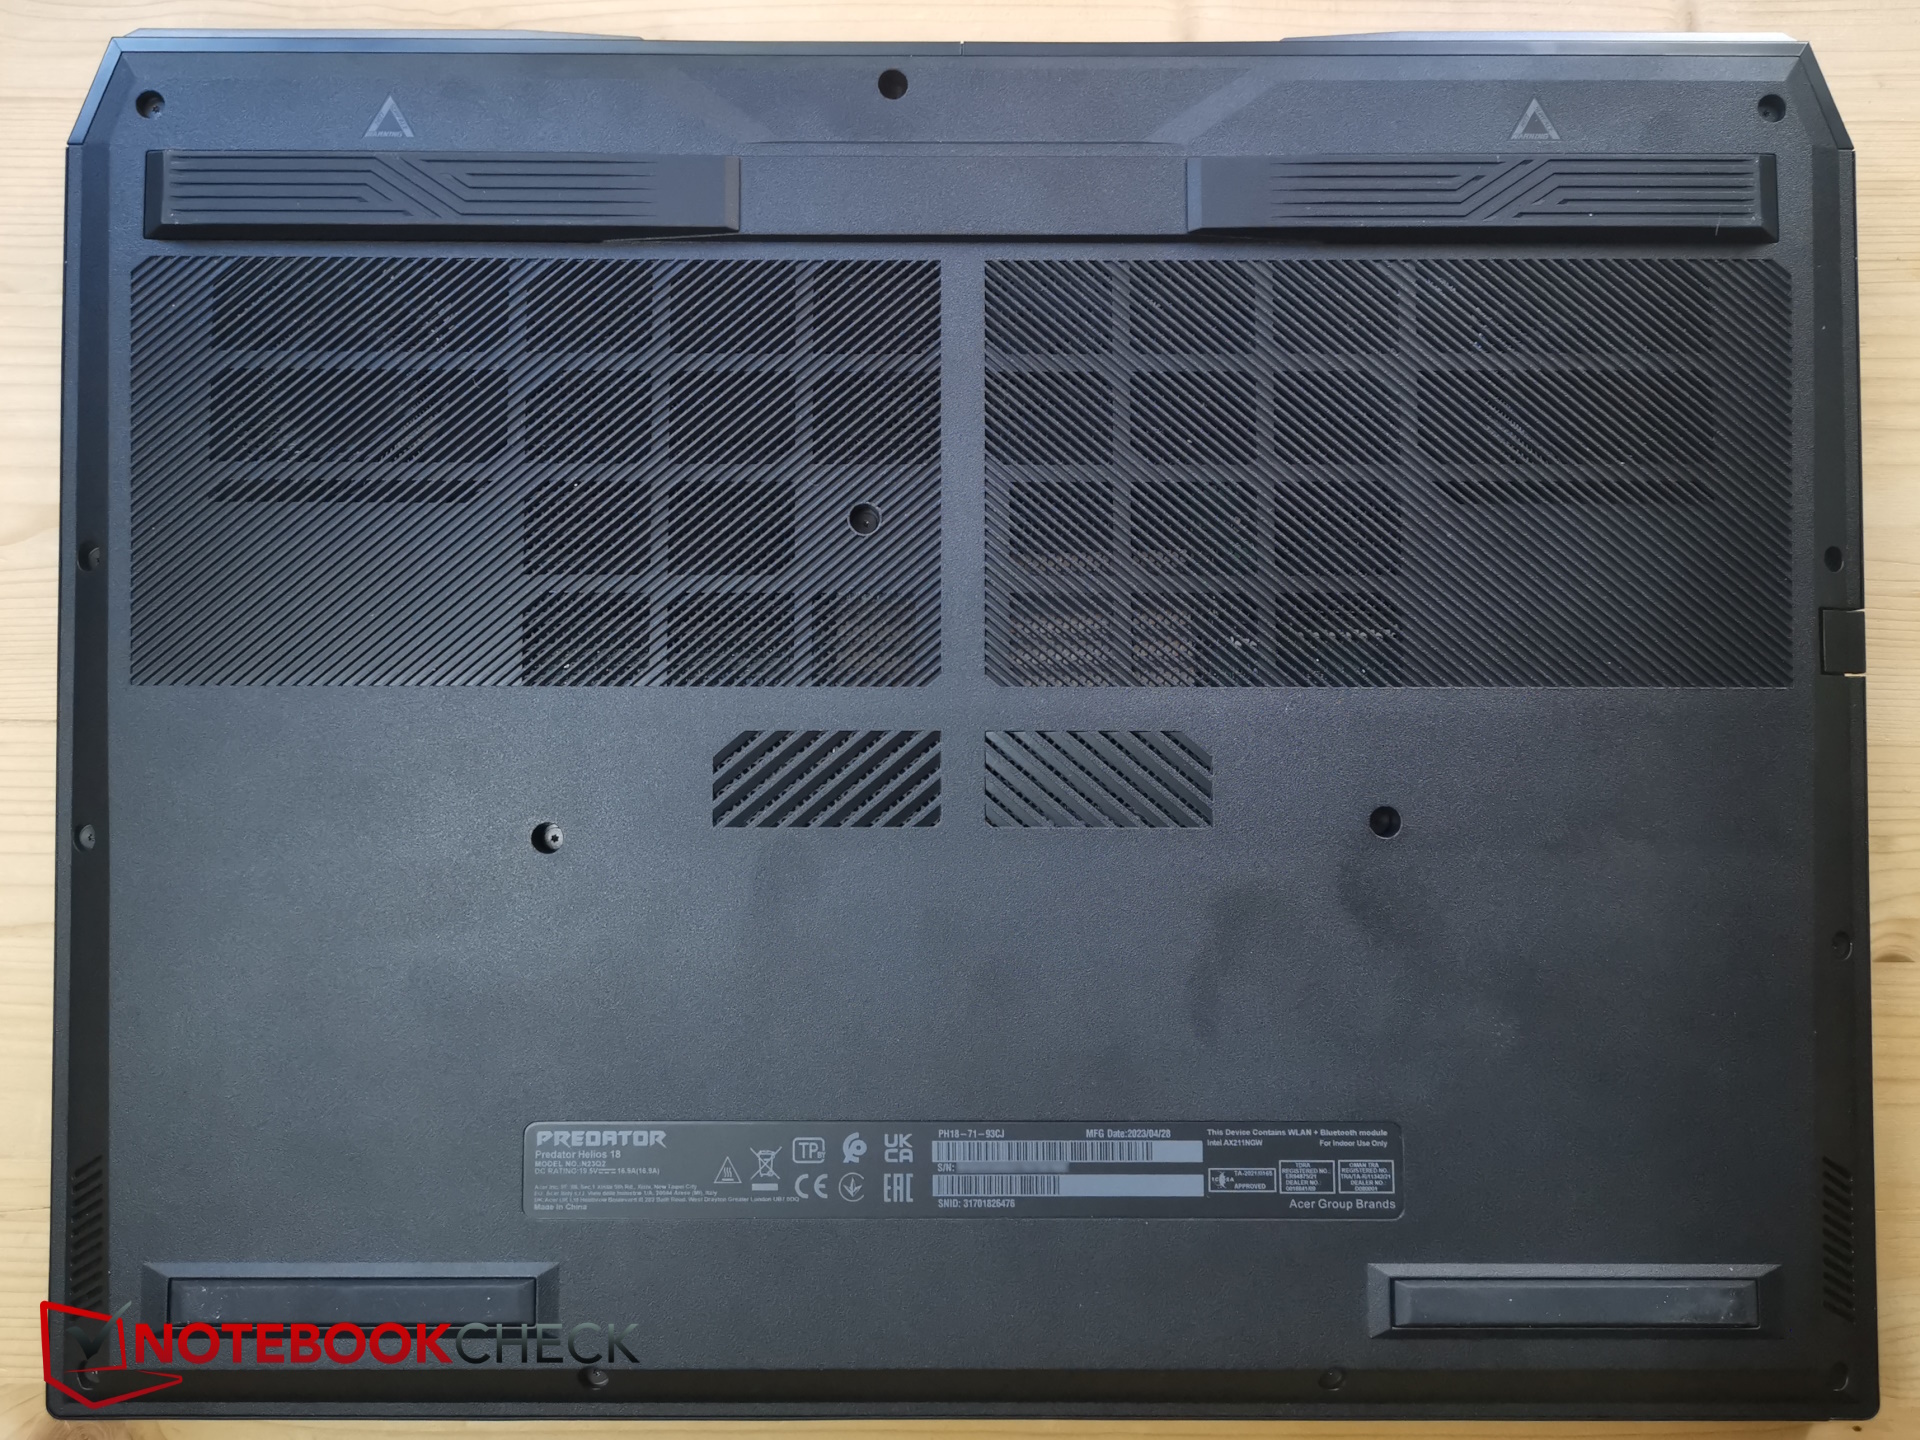
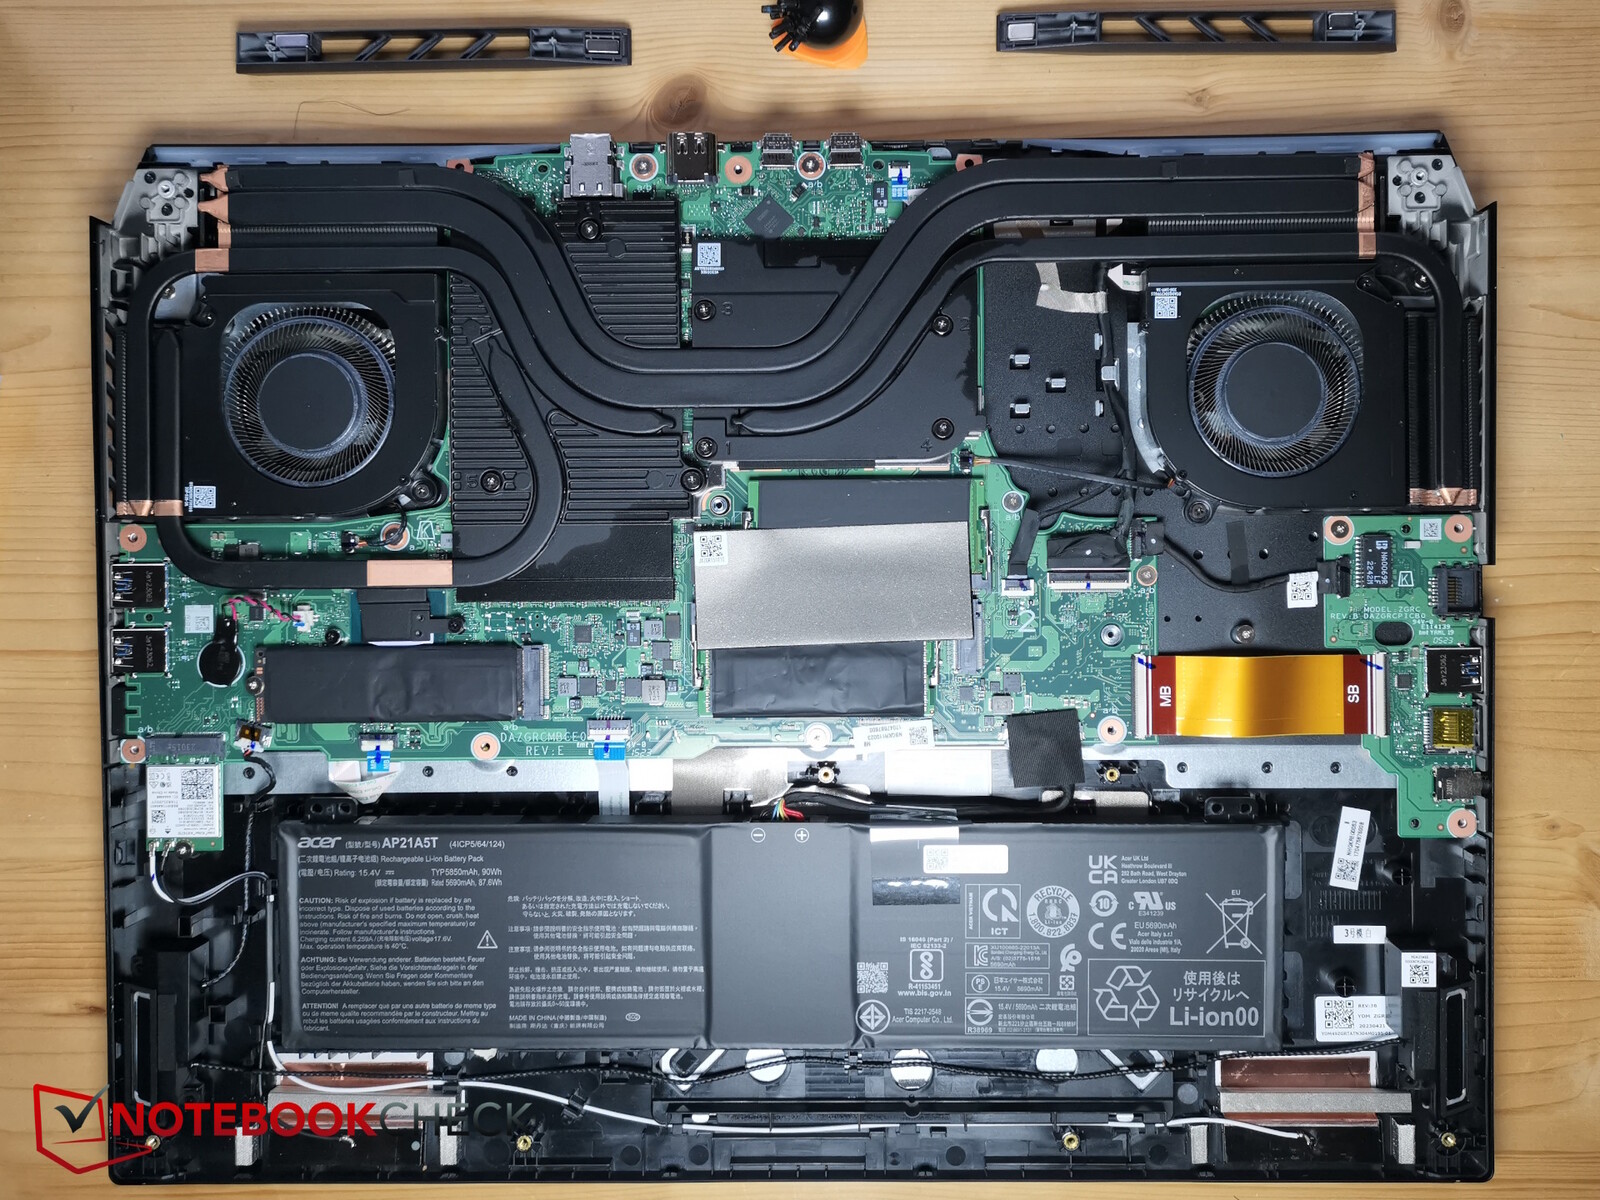
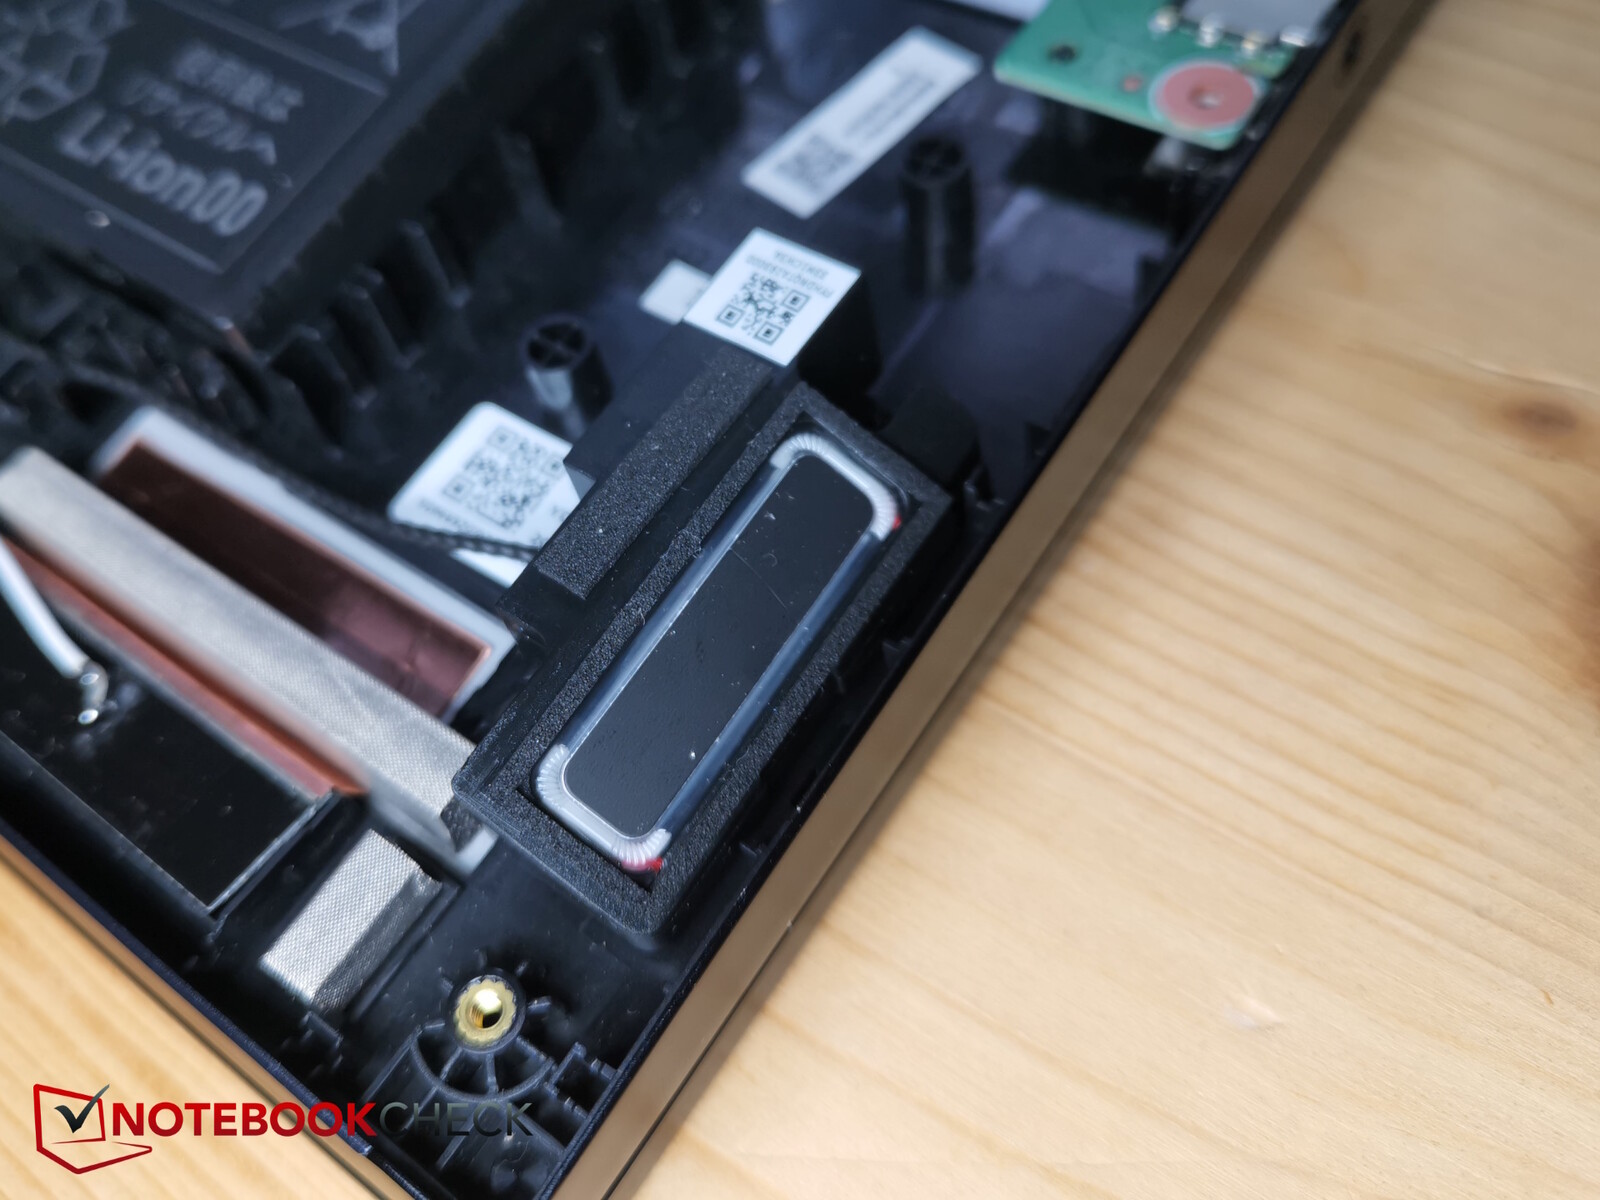
Manutenzione
L'apertura di Helios 18 non è altrettanto facile a causa dei morsetti stretti e della base rigida in alluminio, ma è comunque gestibile. Innanzitutto, è necessario allentare 14 viti Torx della stessa dimensione. Dopodiché, è meglio fare leva sul retro per aprirlo dagli angoli anteriori, preferibilmente con un utensile di plastica a lama stretta
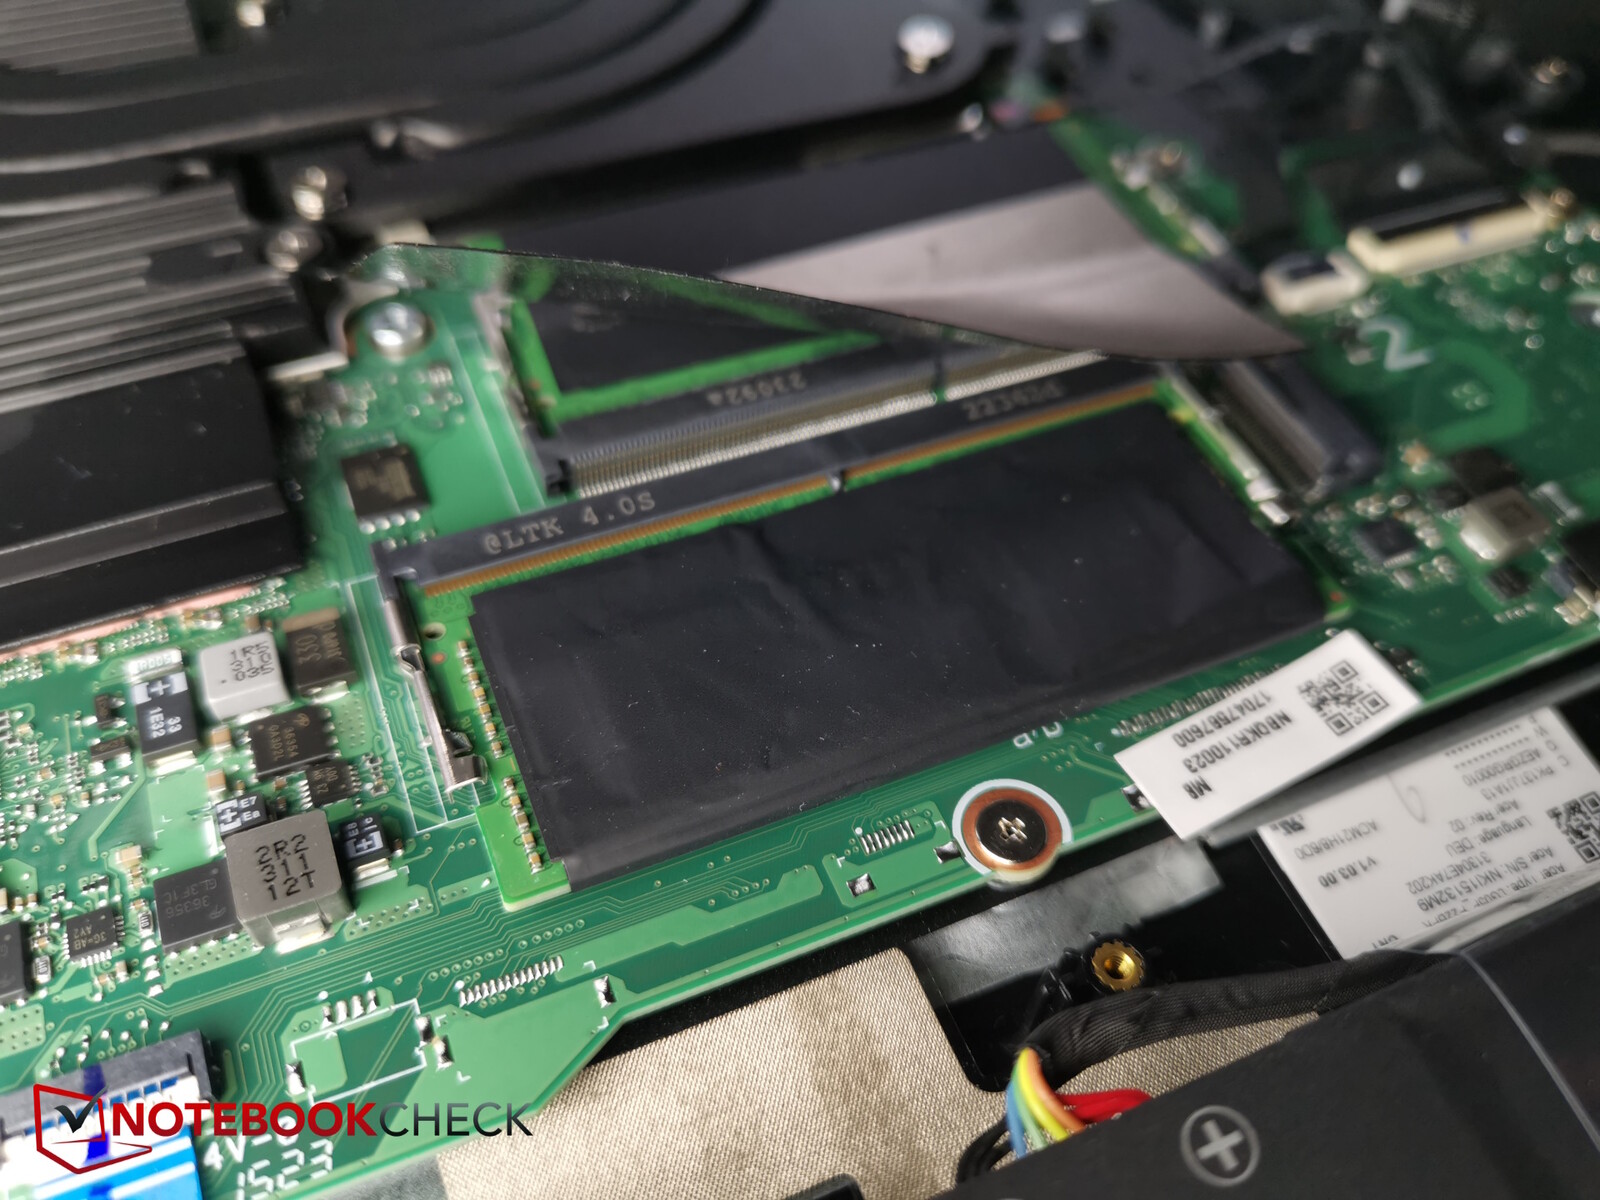
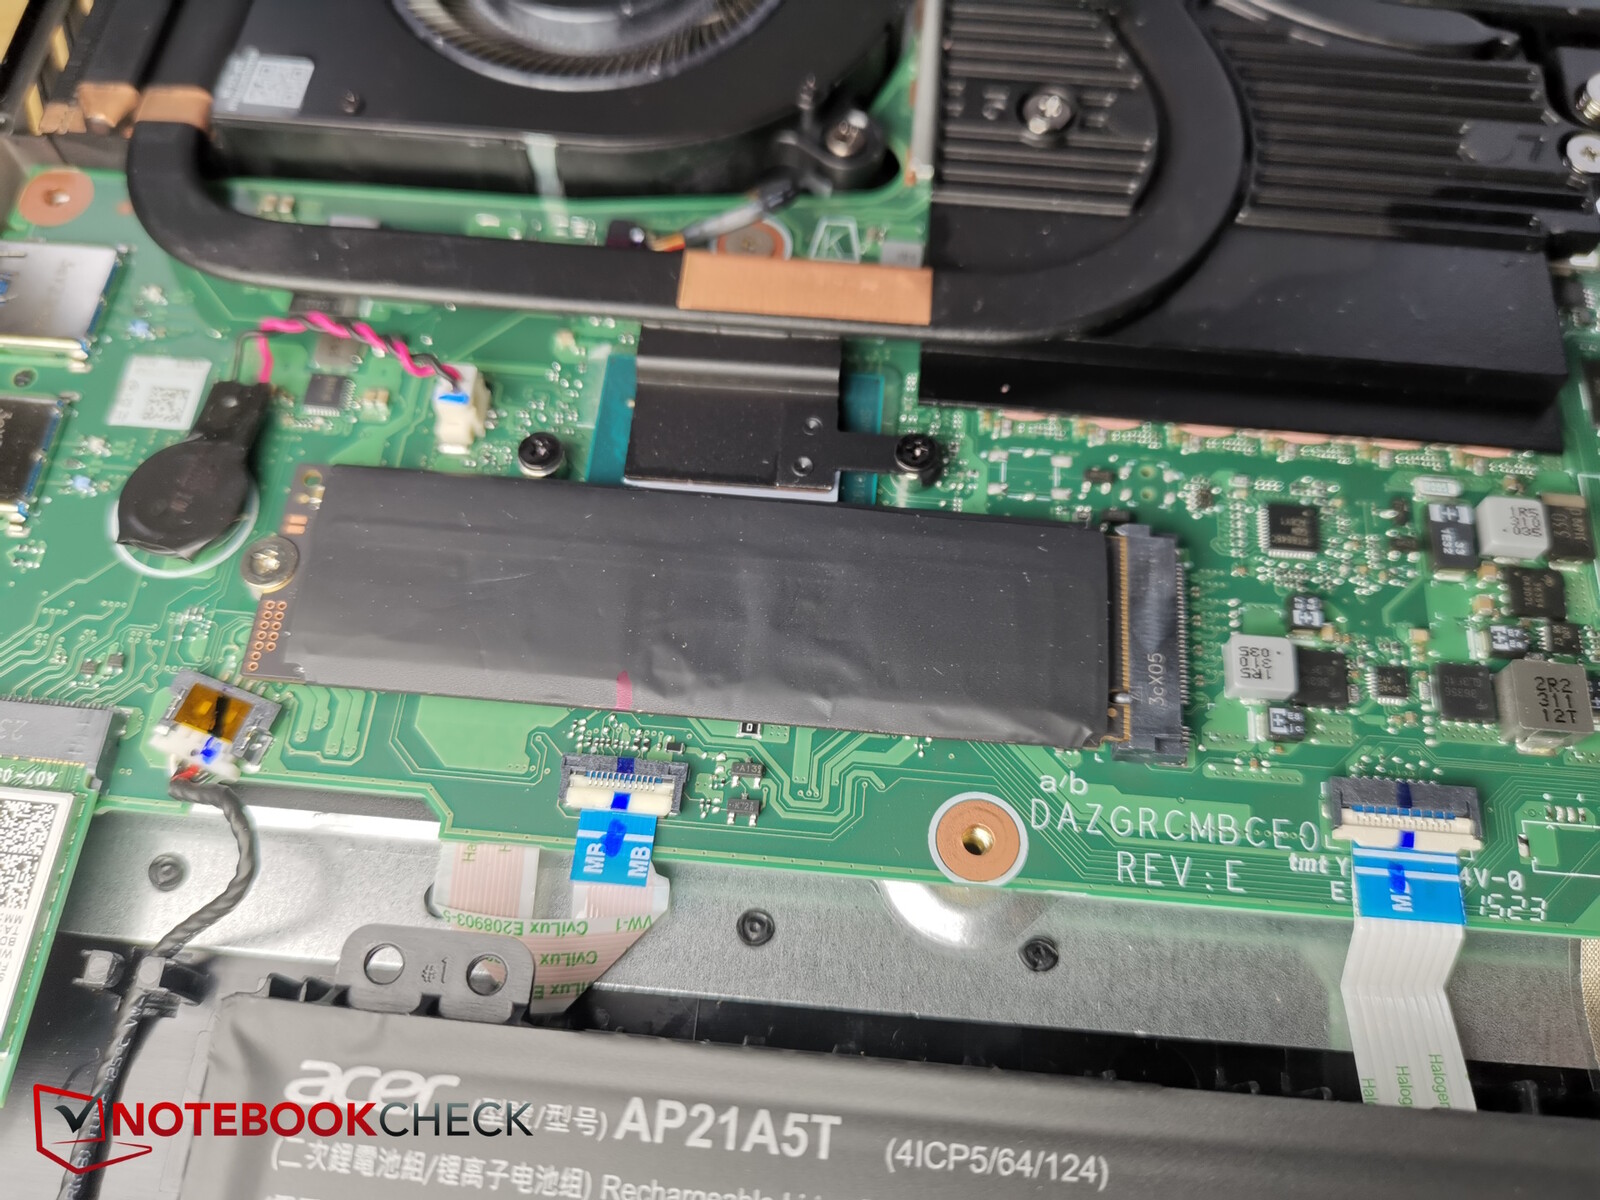
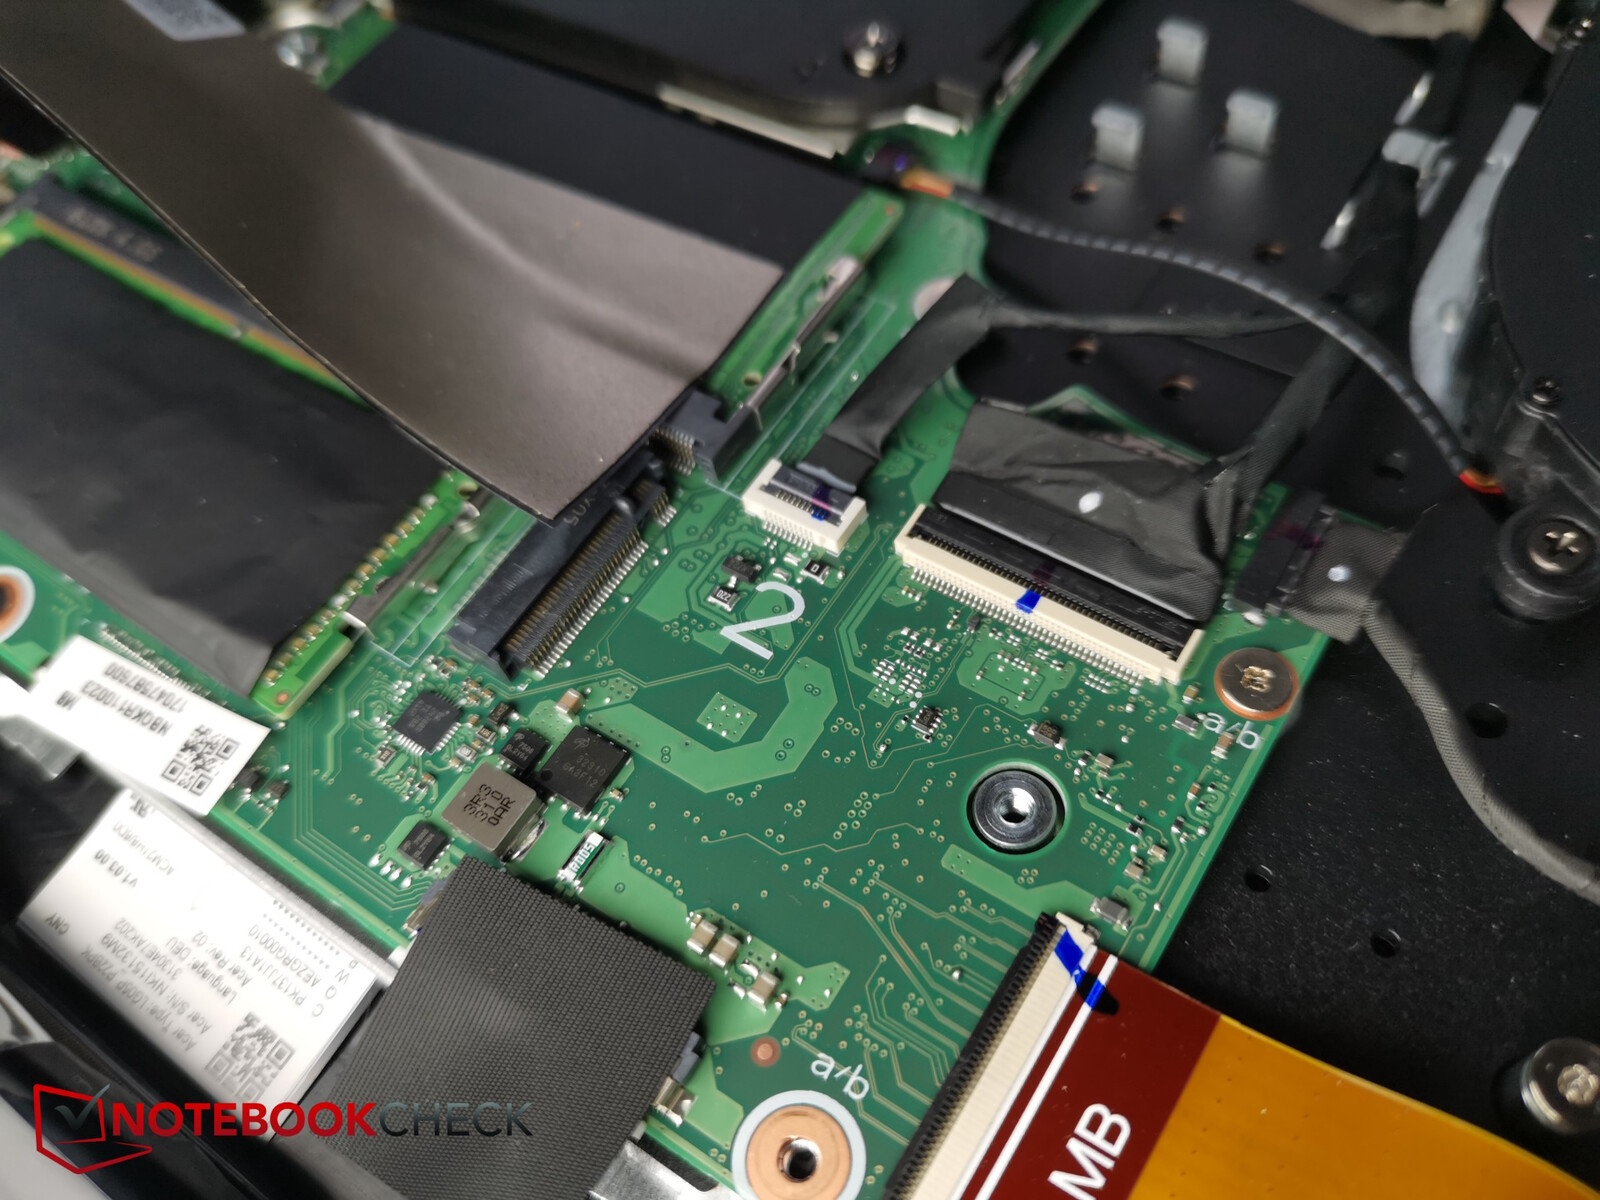
Una volta all'interno dell'Acer Predator, gli utenti hanno accesso alle ventole, alla batteria, all'SSD (più il secondo slot), agli slot della RAM e al modulo WiFi.
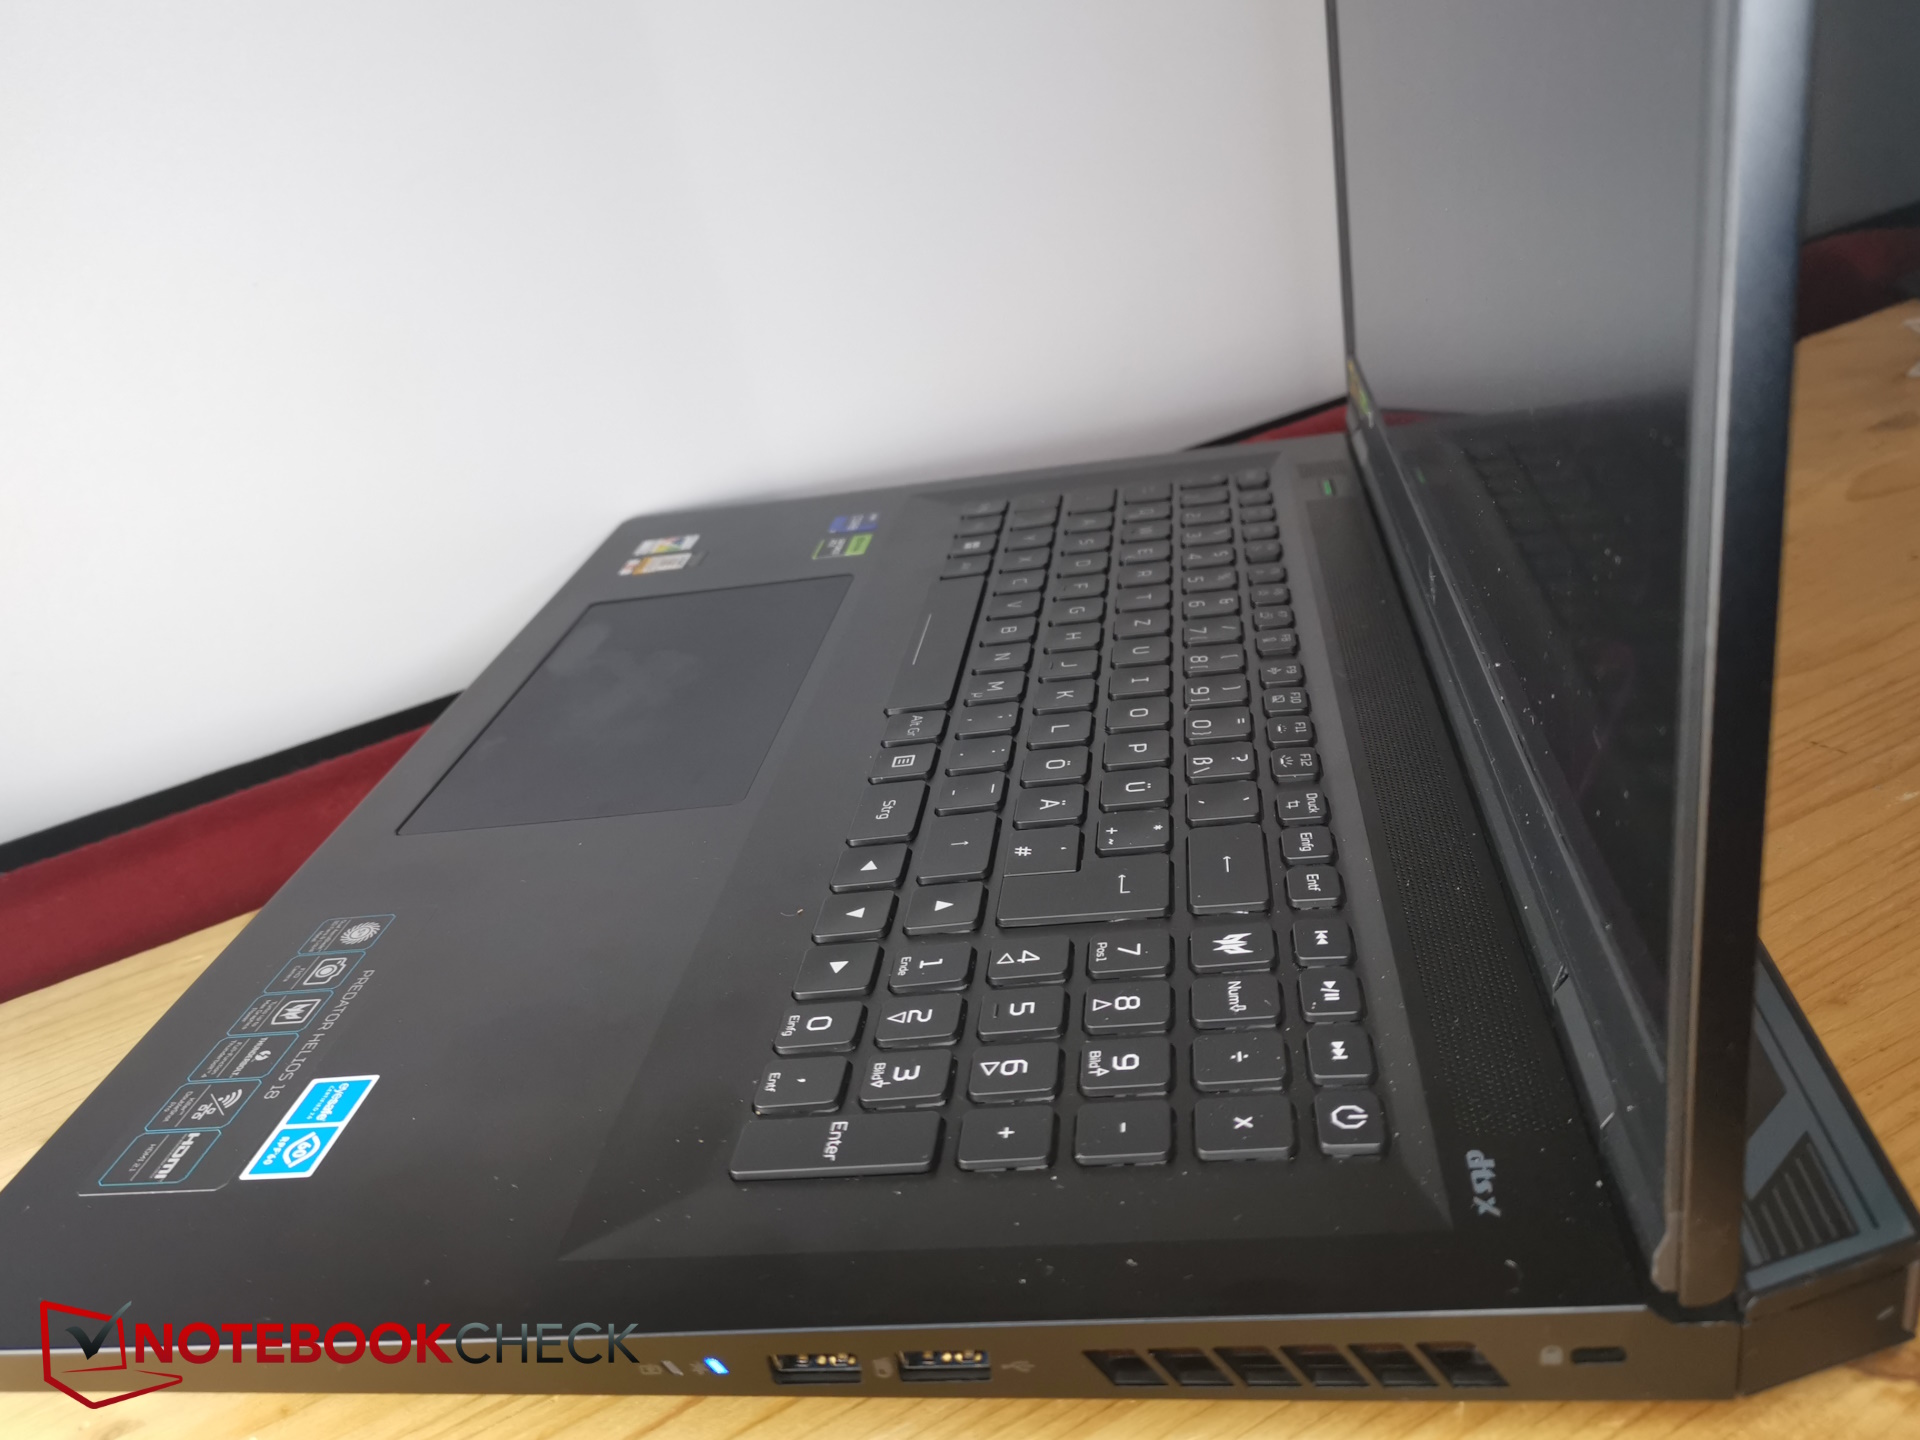
Dispositivi di input - anche MiniLED per i tasti
Tastiera
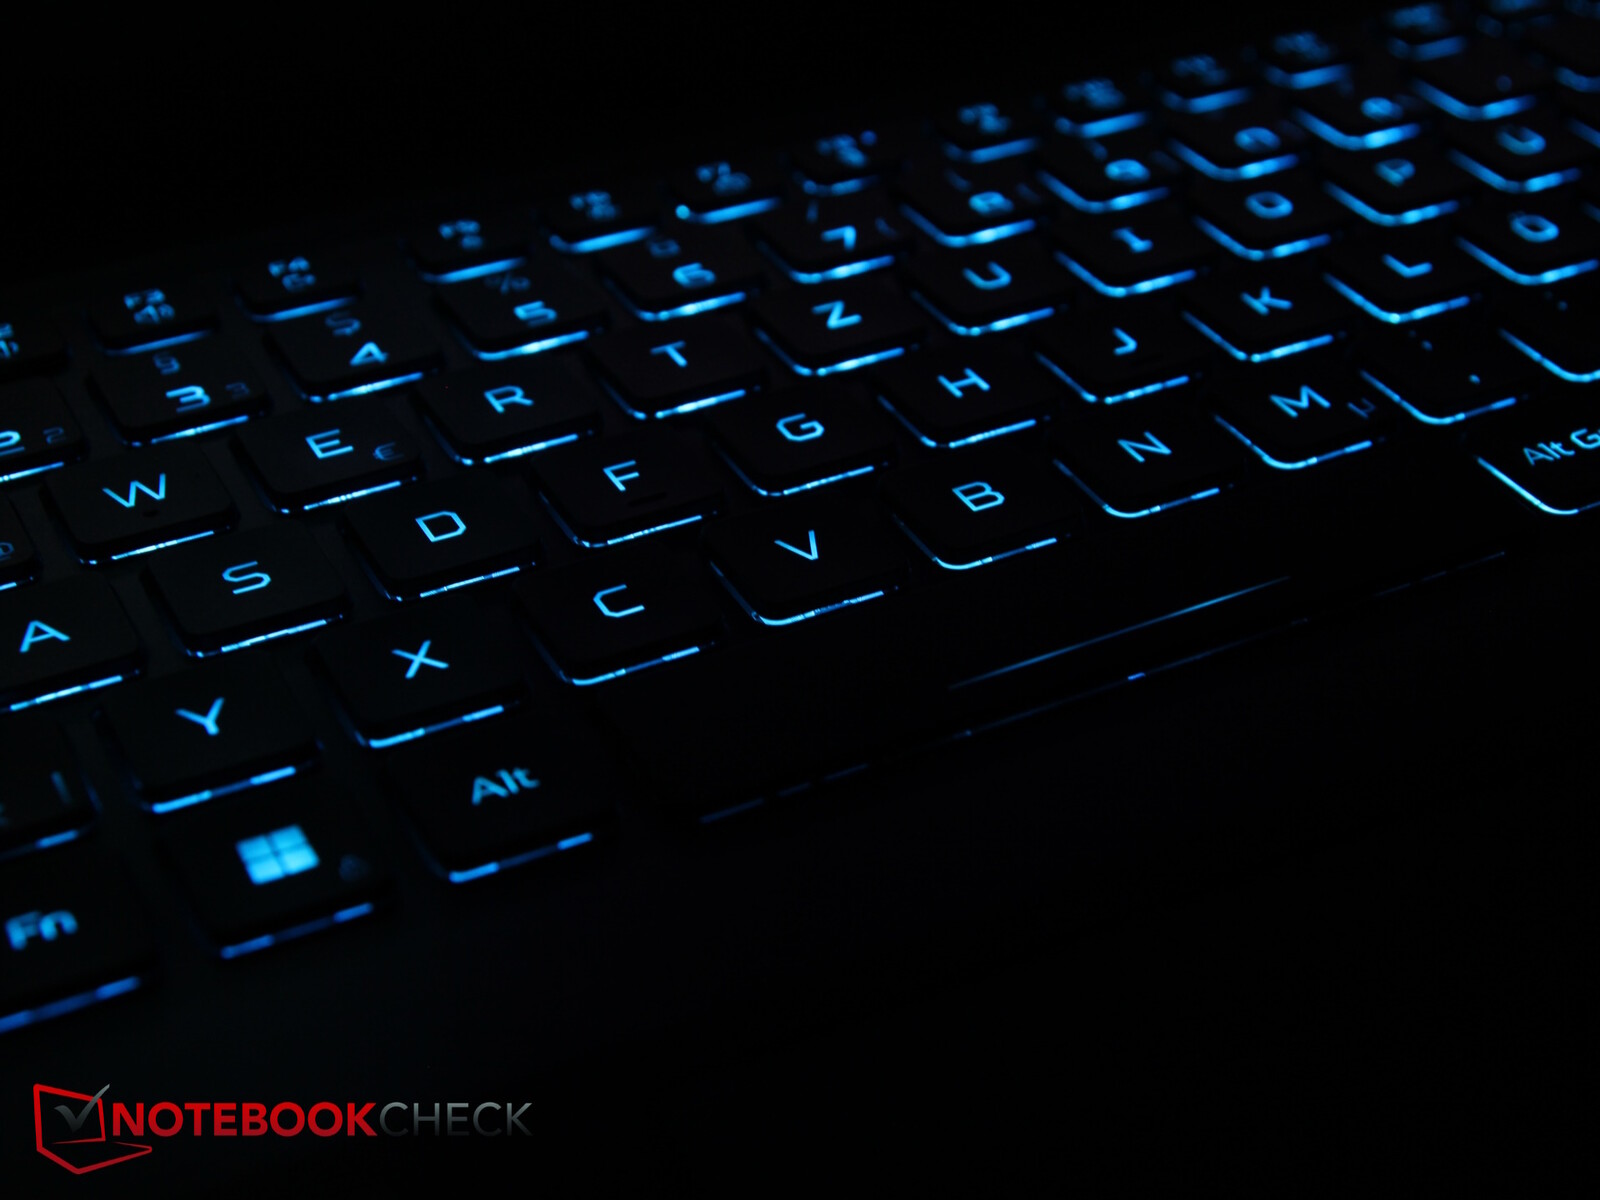
Il Predator ha un layout molto ordinato che comprende tasti freccia a grandezza naturale, un tastierino numerico a destra e tasti extra per richiamare il software Predator Sense e cambiare modalità di prestazioni
I tasti sono di 1,5 x 1,5 mm, hanno una corsa media e un feedback evidente, che potrebbe essere un po' più solido. Il rumore di battitura è moderato e la velocità di battitura è rapida.
Secondo Acer, la retroilluminazione RGB per tasto funziona tramite MiniLED, proprio come il display, e può essere regolata su quattro livelli.
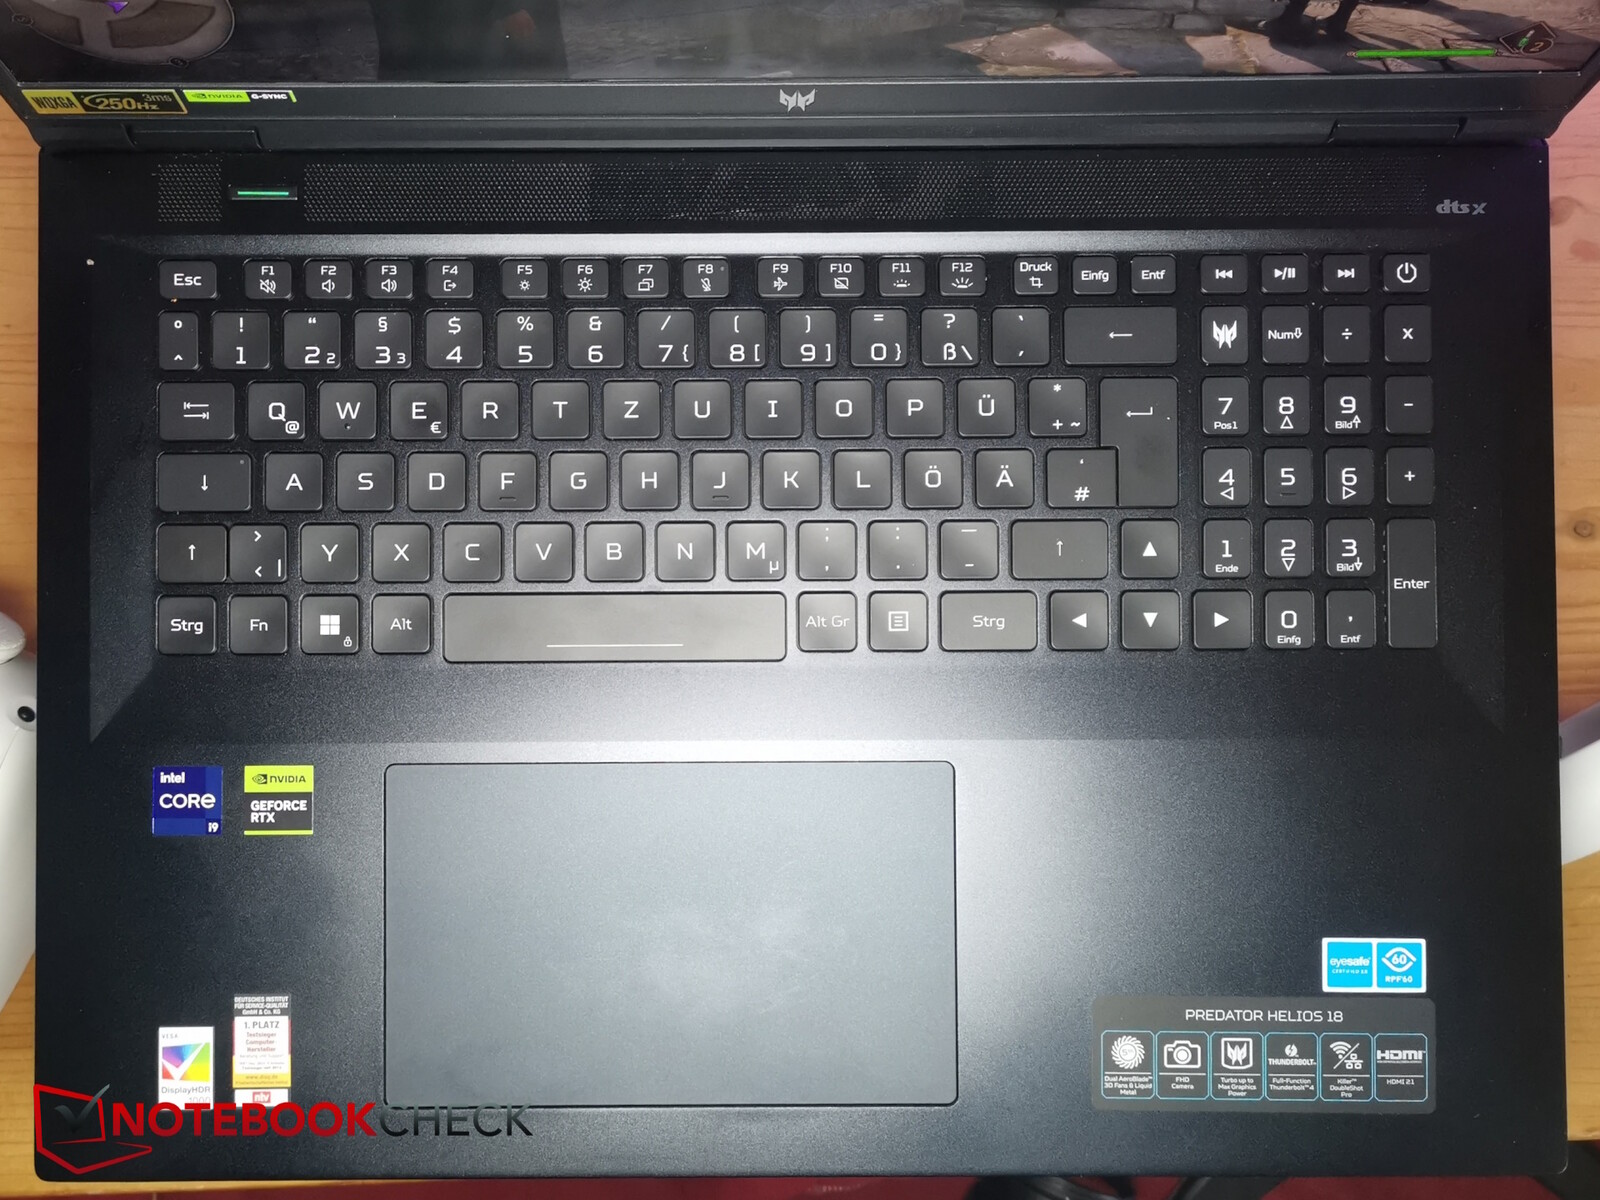
Touchpad
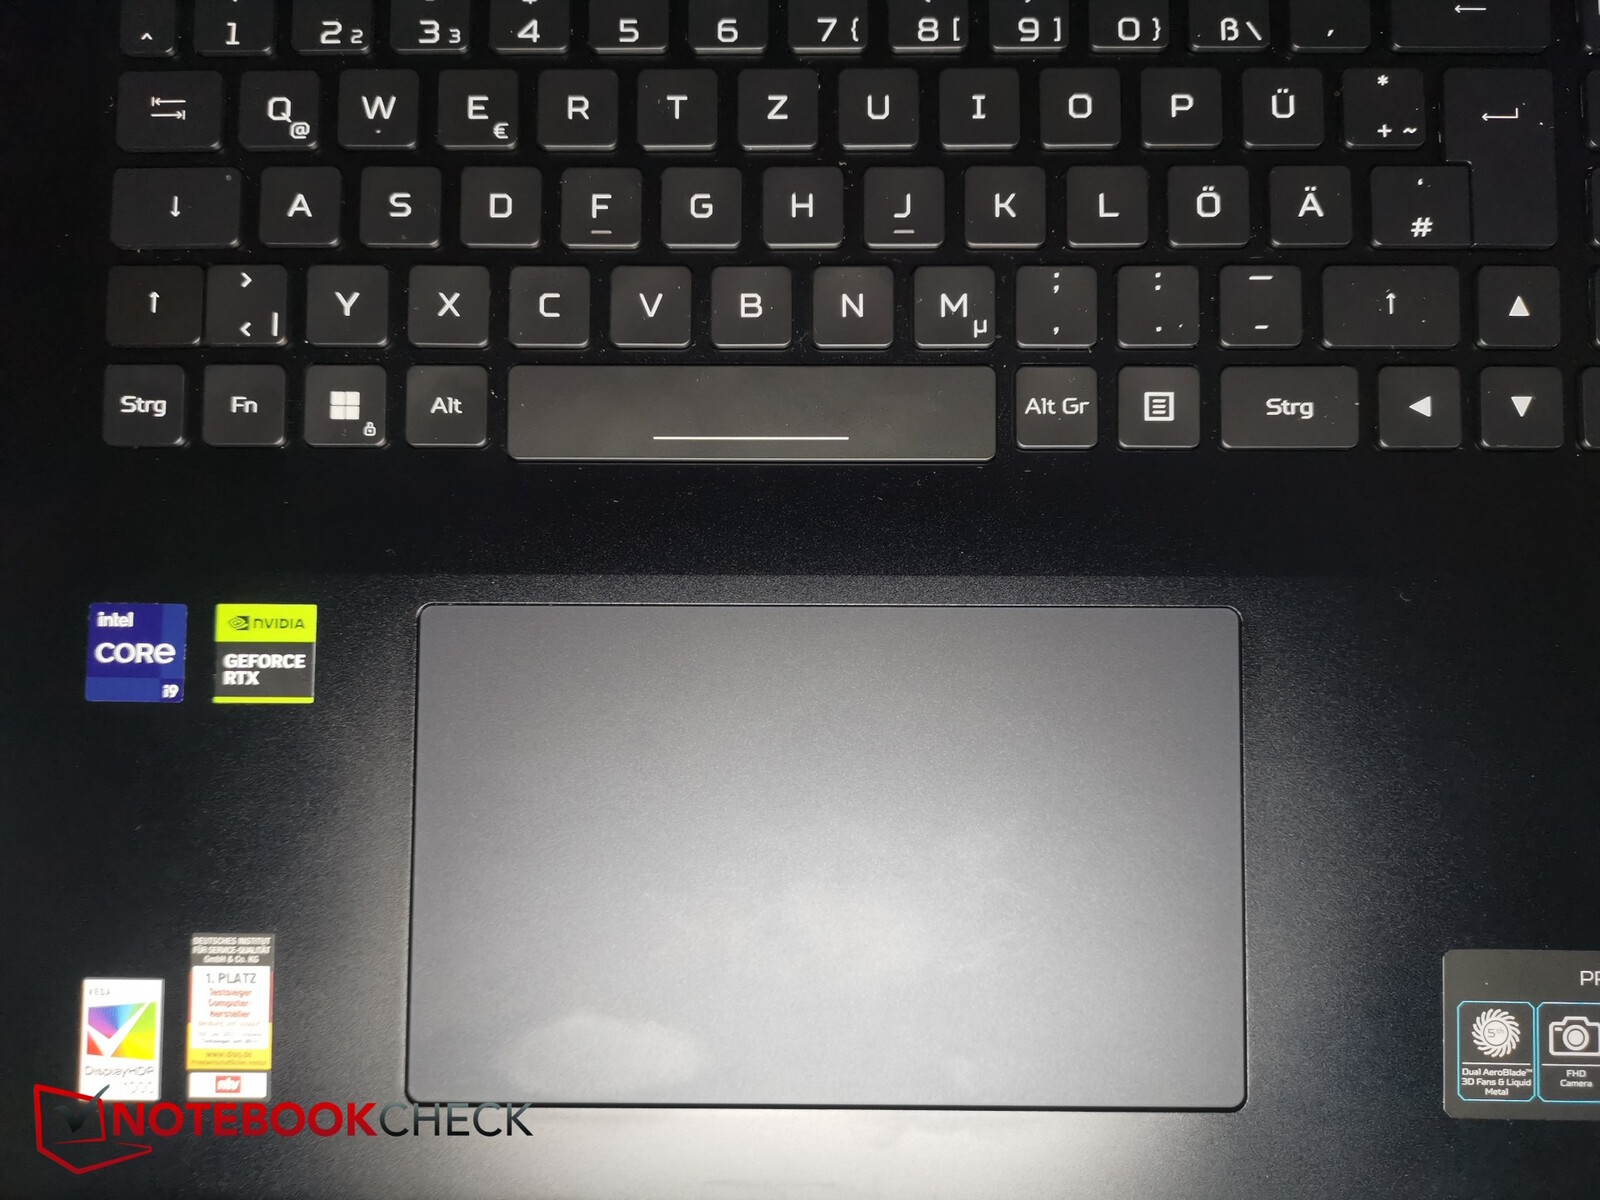
Il touchpad del 18 pollici è davvero enorme (circa 15,2 x 9,1 cm) e offre ottime proprietà di scorrimento che non causano quasi mai balbuzie.
I pulsanti integrati sono molto silenziosi e hanno una corsa estremamente breve, ma si attivano in modo affidabile e forniscono un buon feedback.
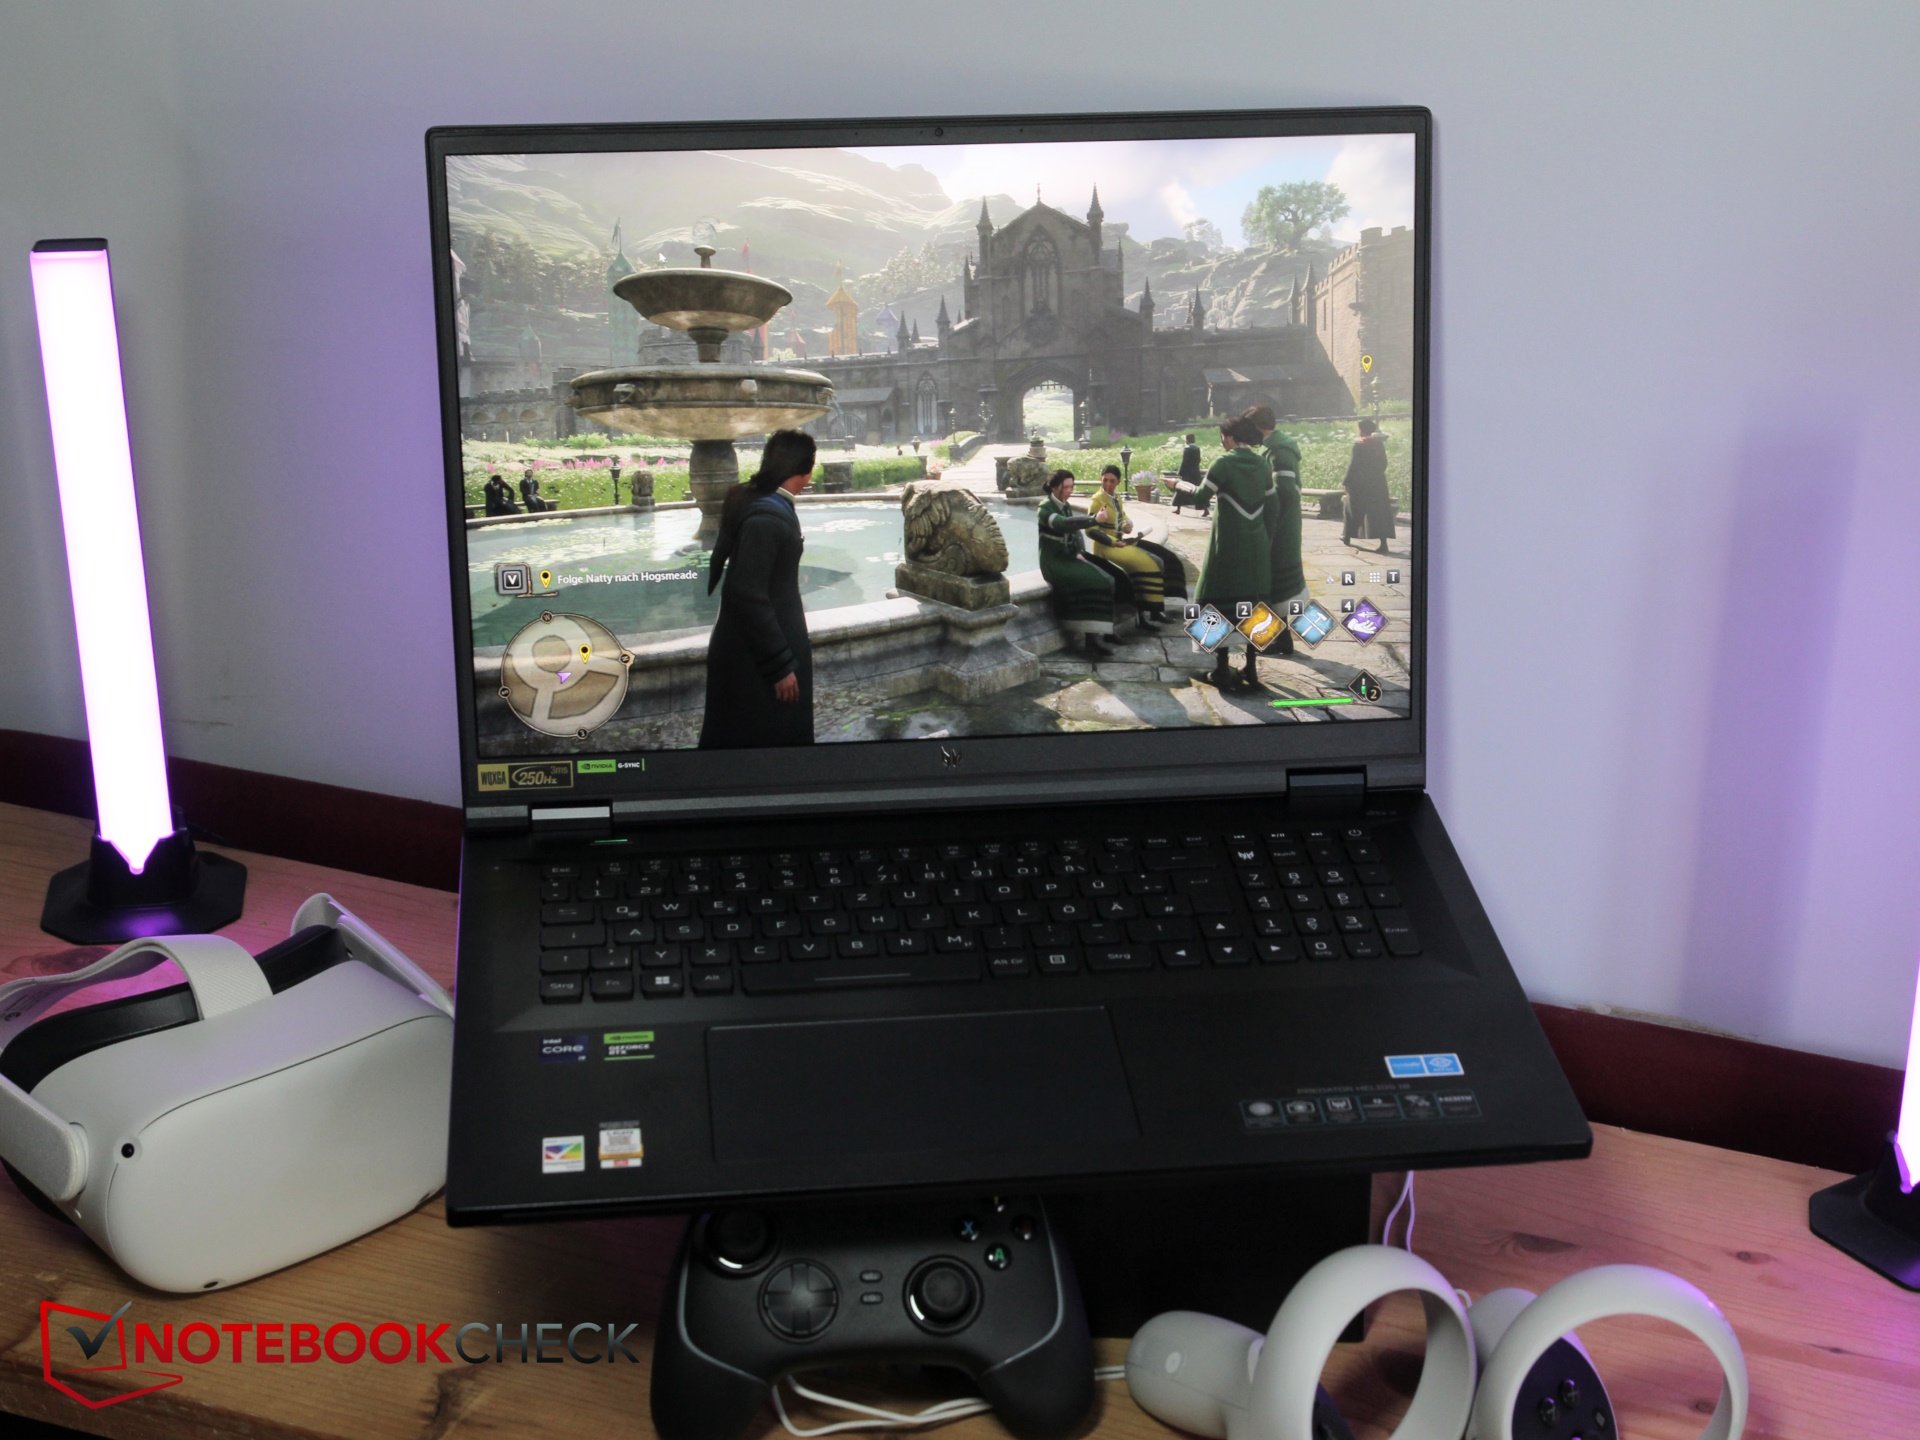
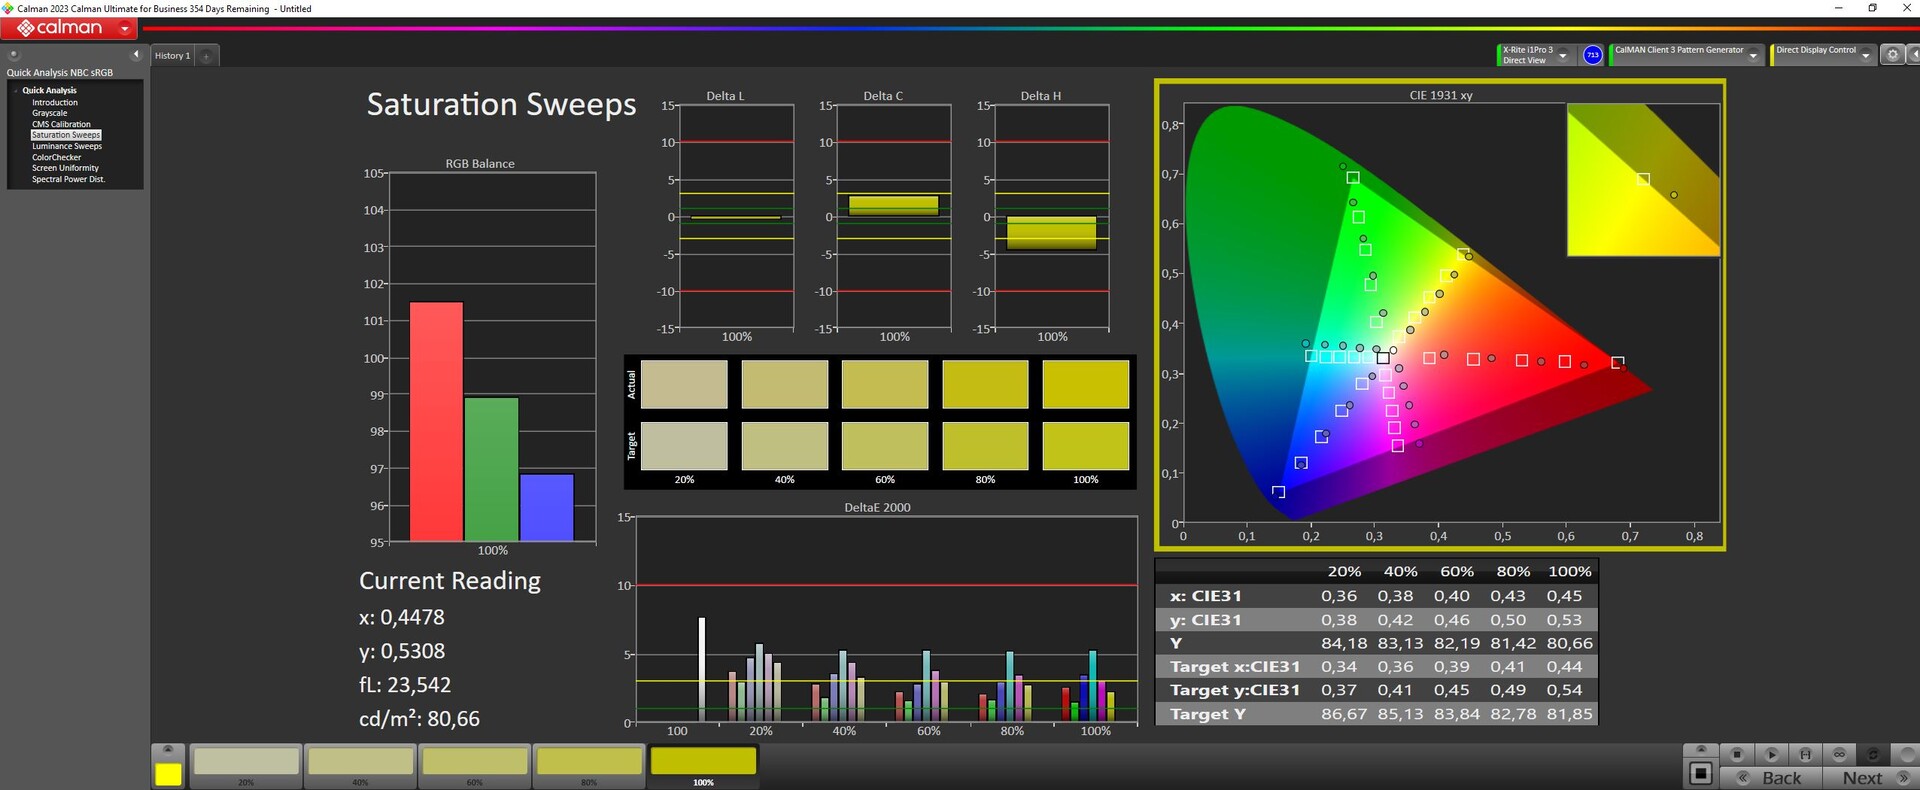
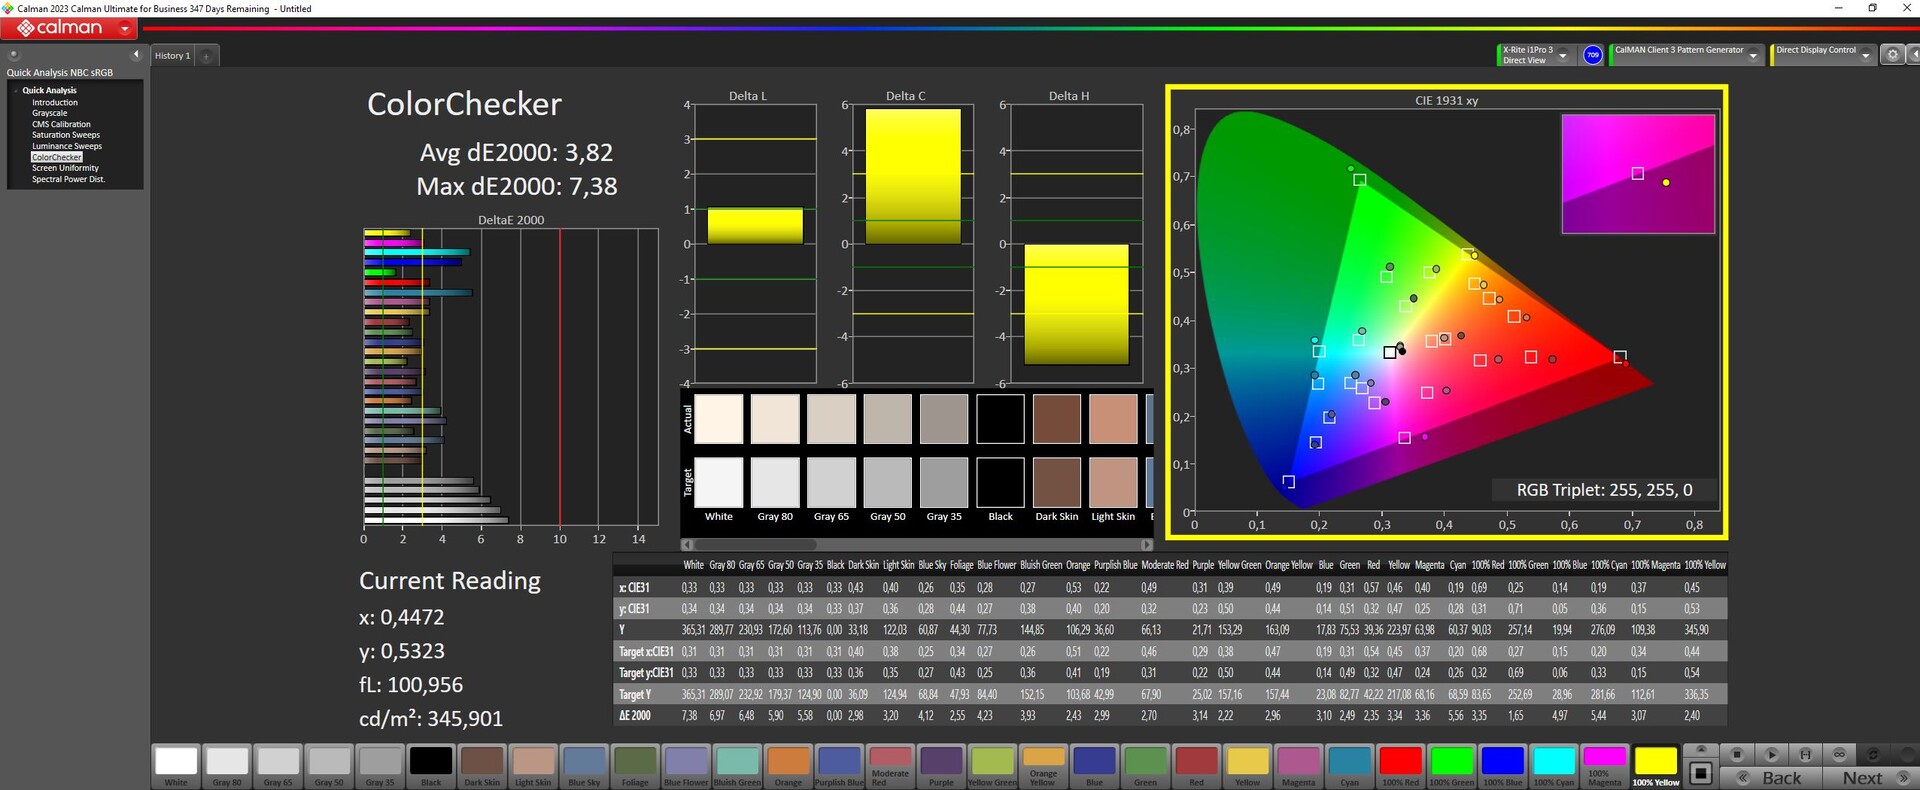
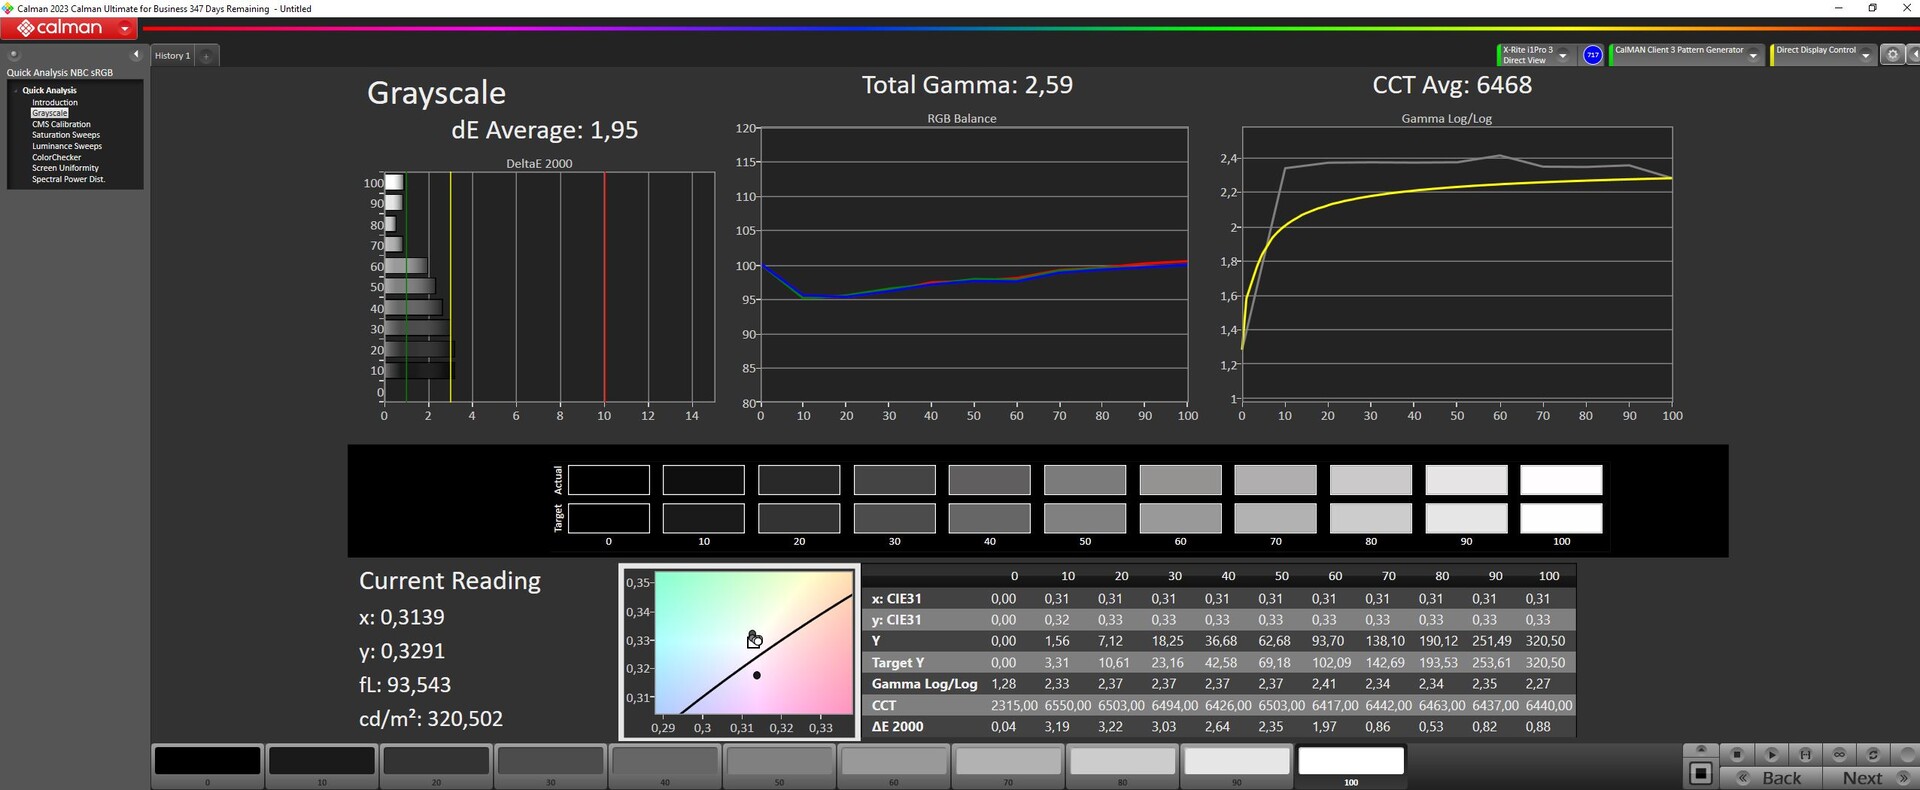
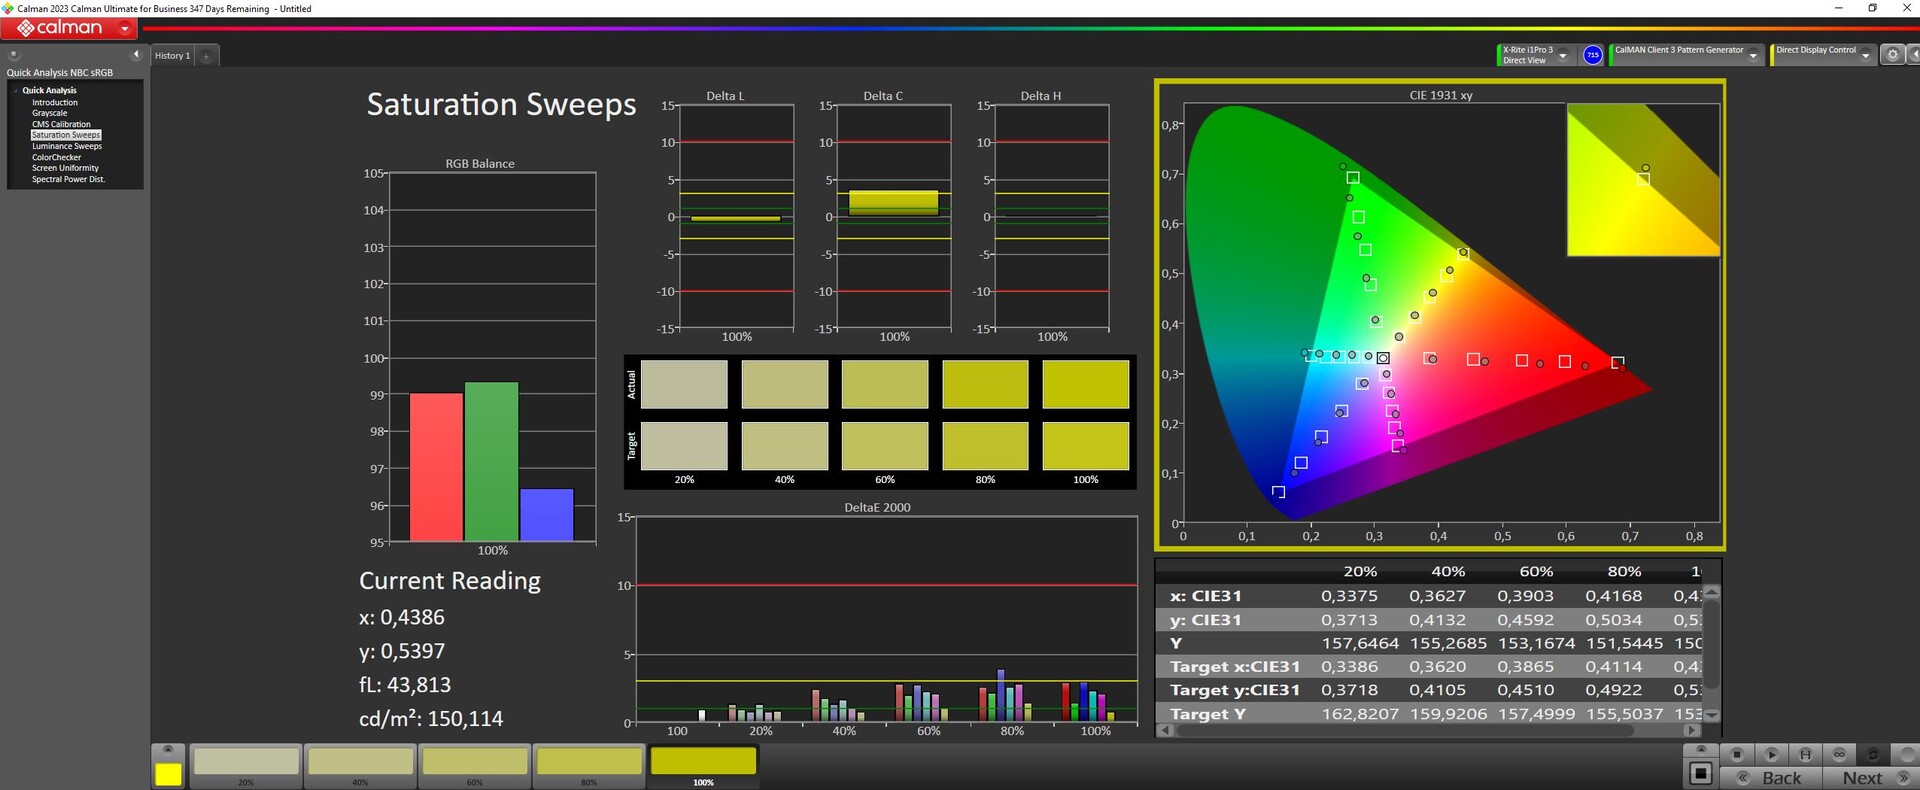
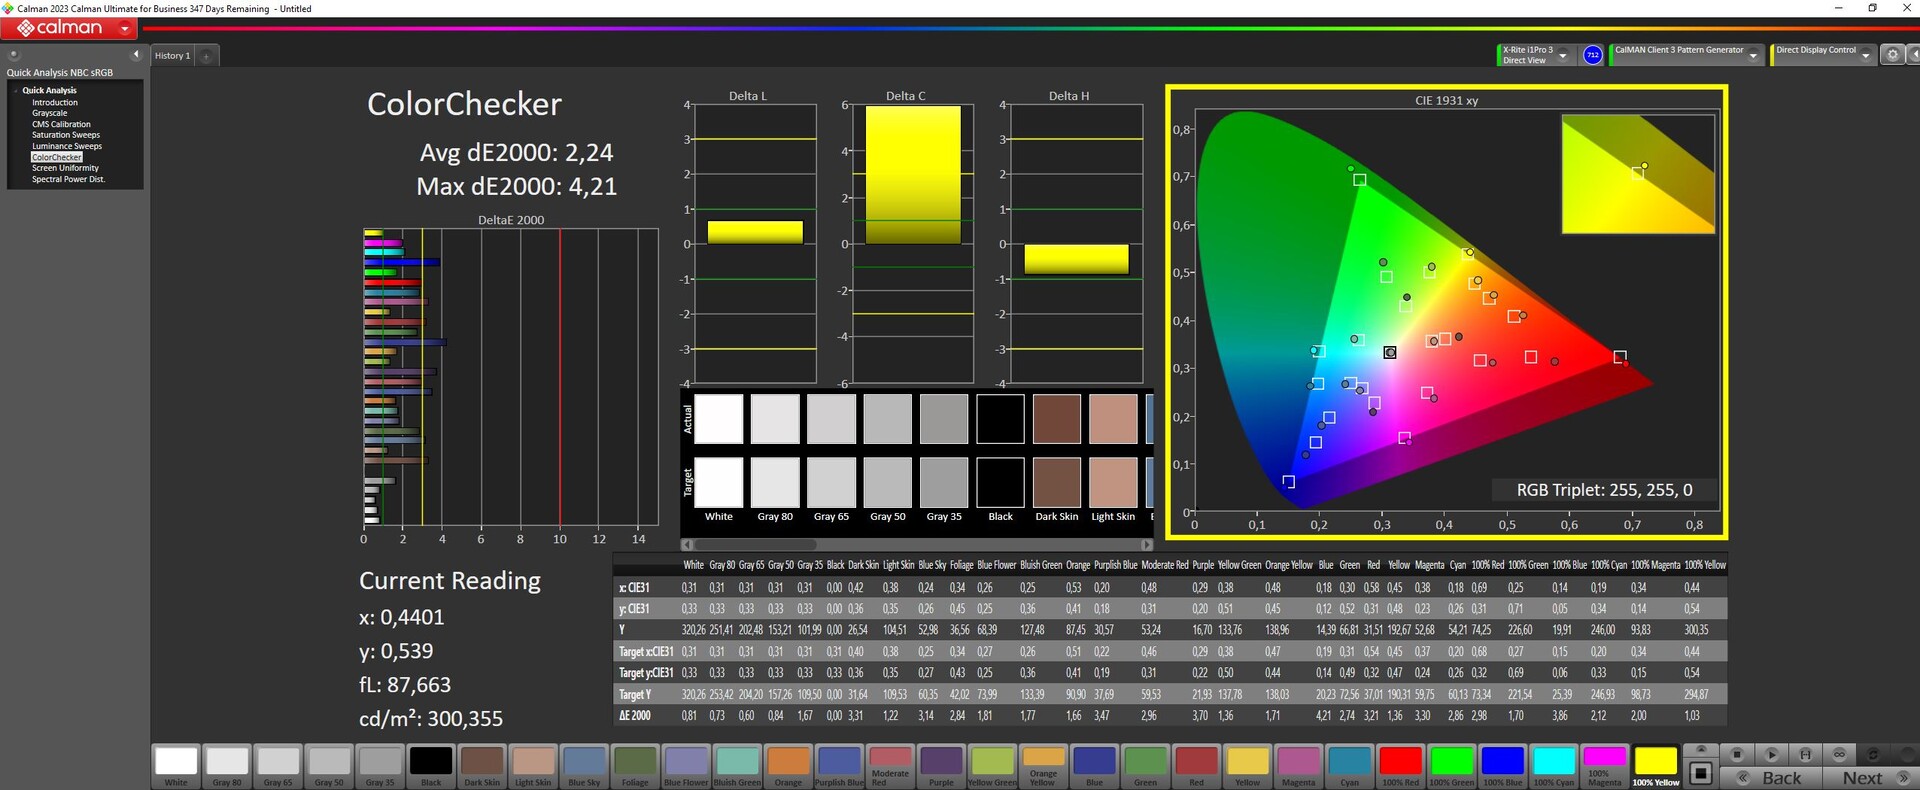
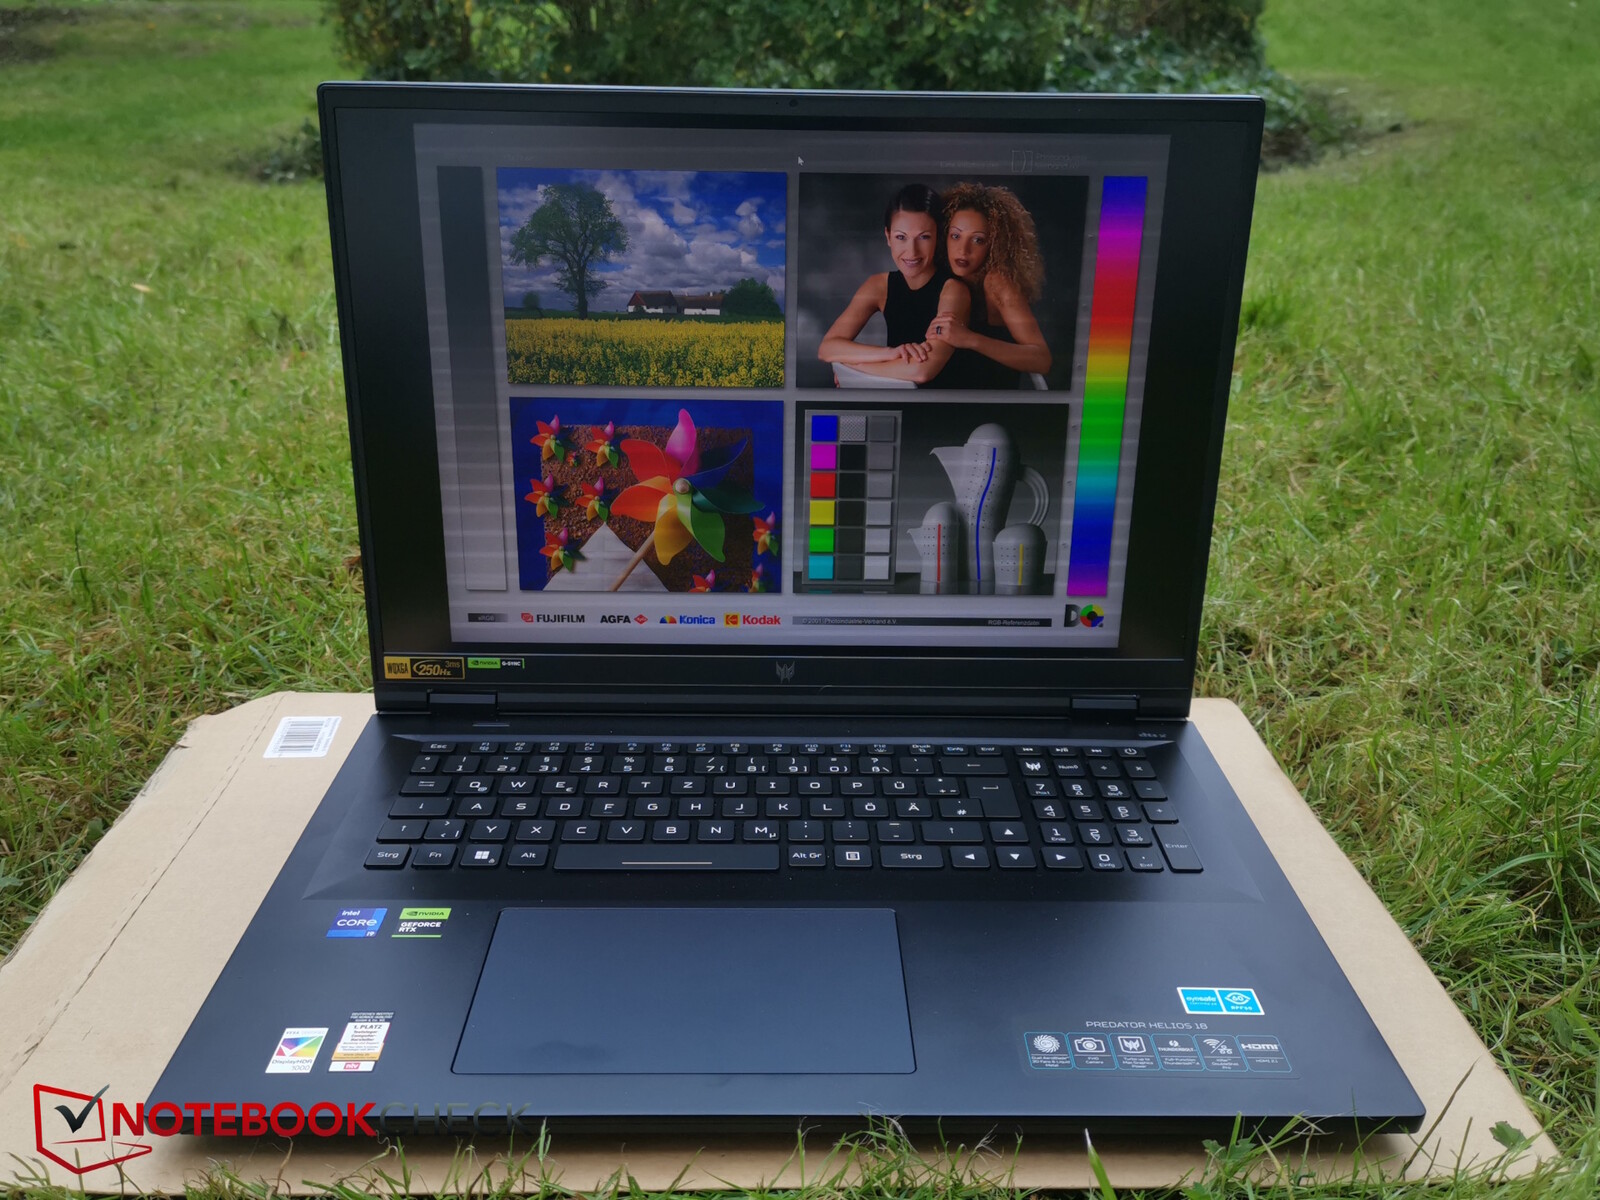
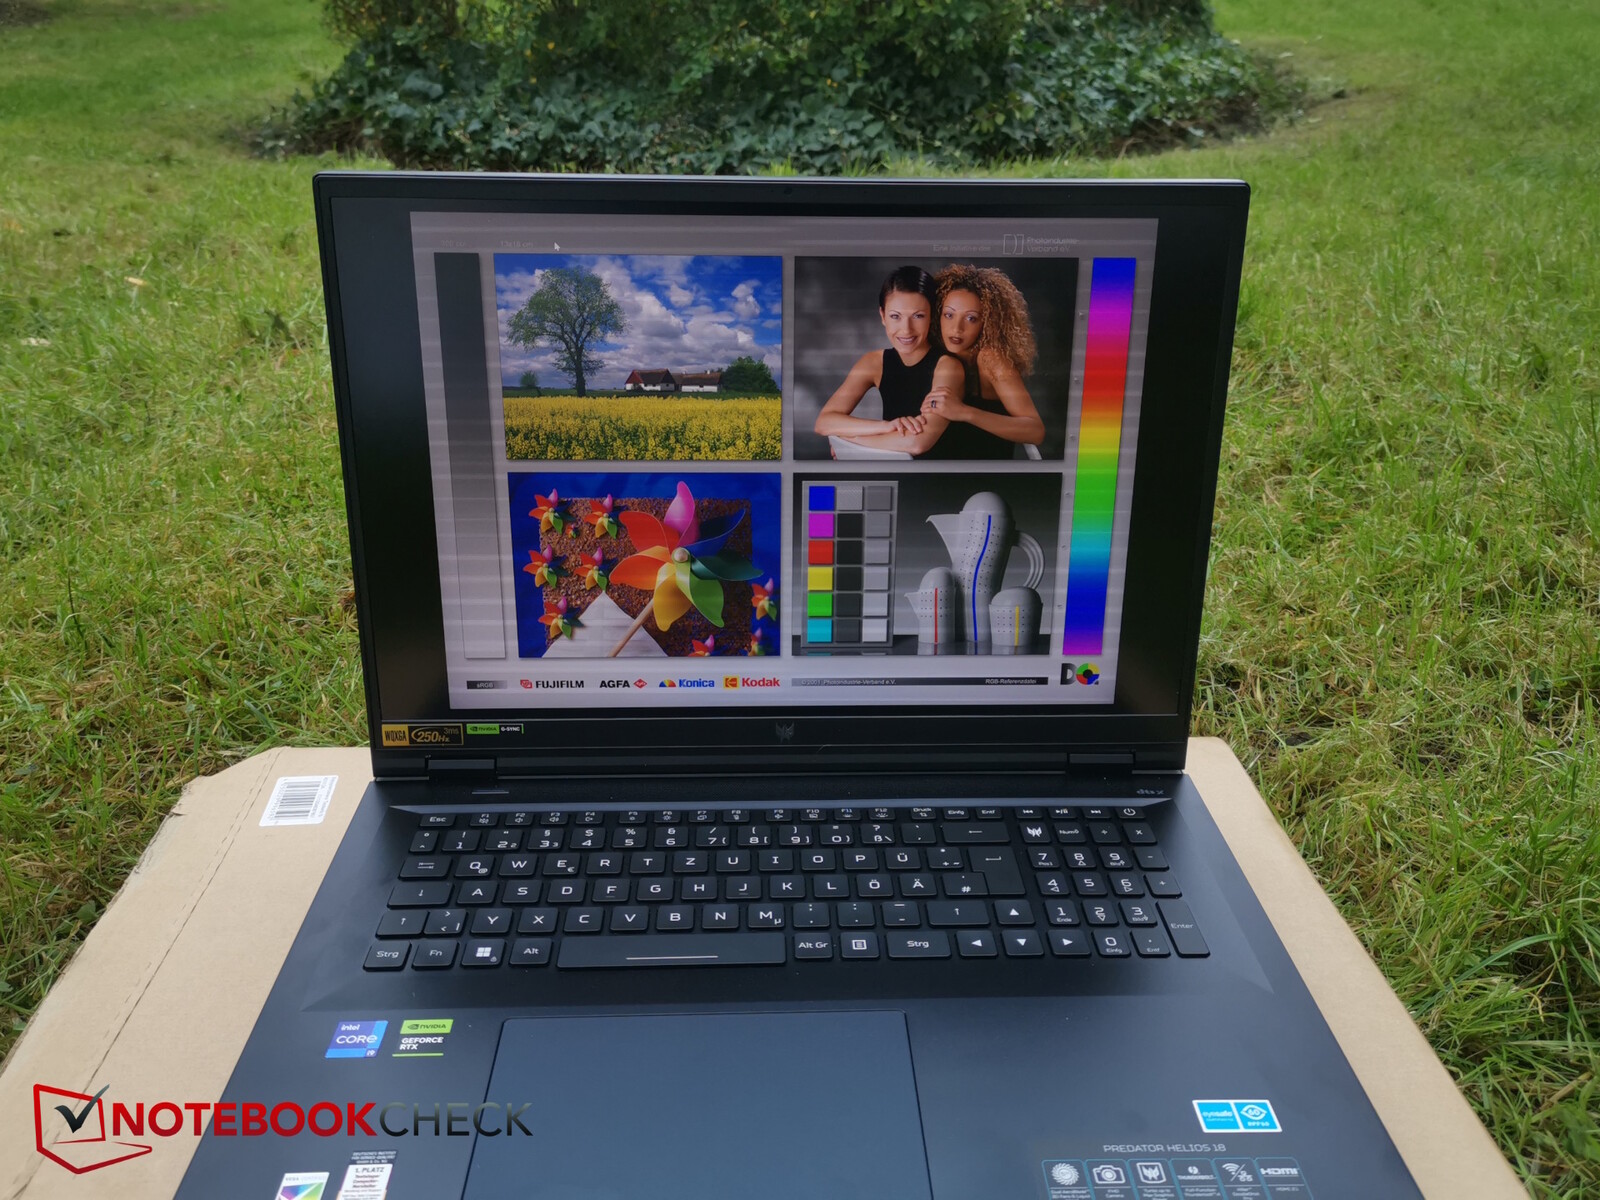
Display - MiniLED a oltre 1.000 nits
Helios 18 è disponibile come opzione con il fantastico display MiniLED a 250 Hz, installato anche nel nostro dispositivo di prova. Qui non sono visibili aloni, il nero è ricco senza fastidiosi artefatti luminosi e il contrasto è altrettanto buono.
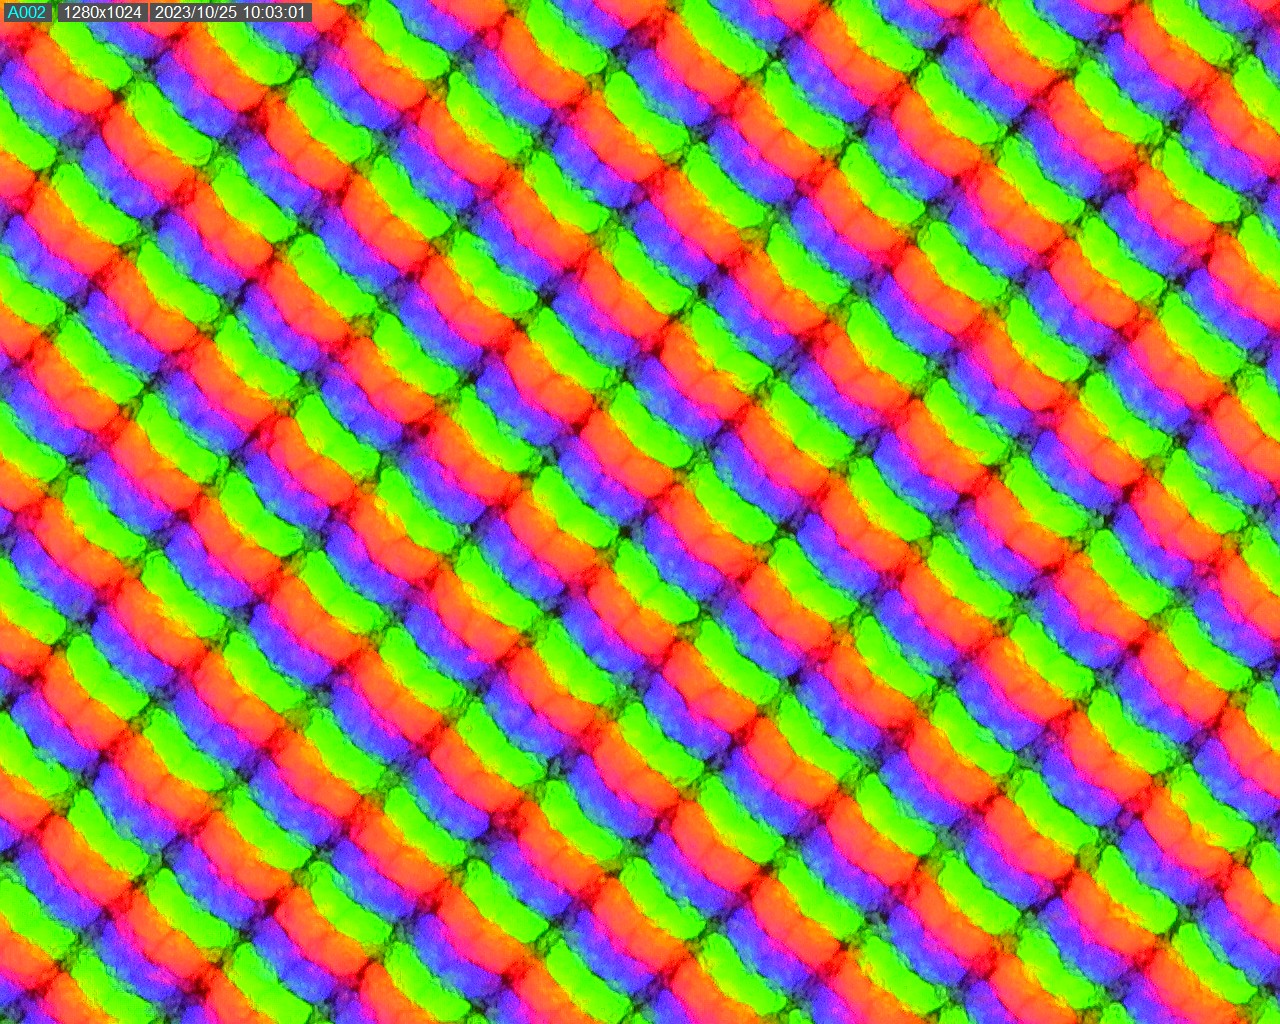
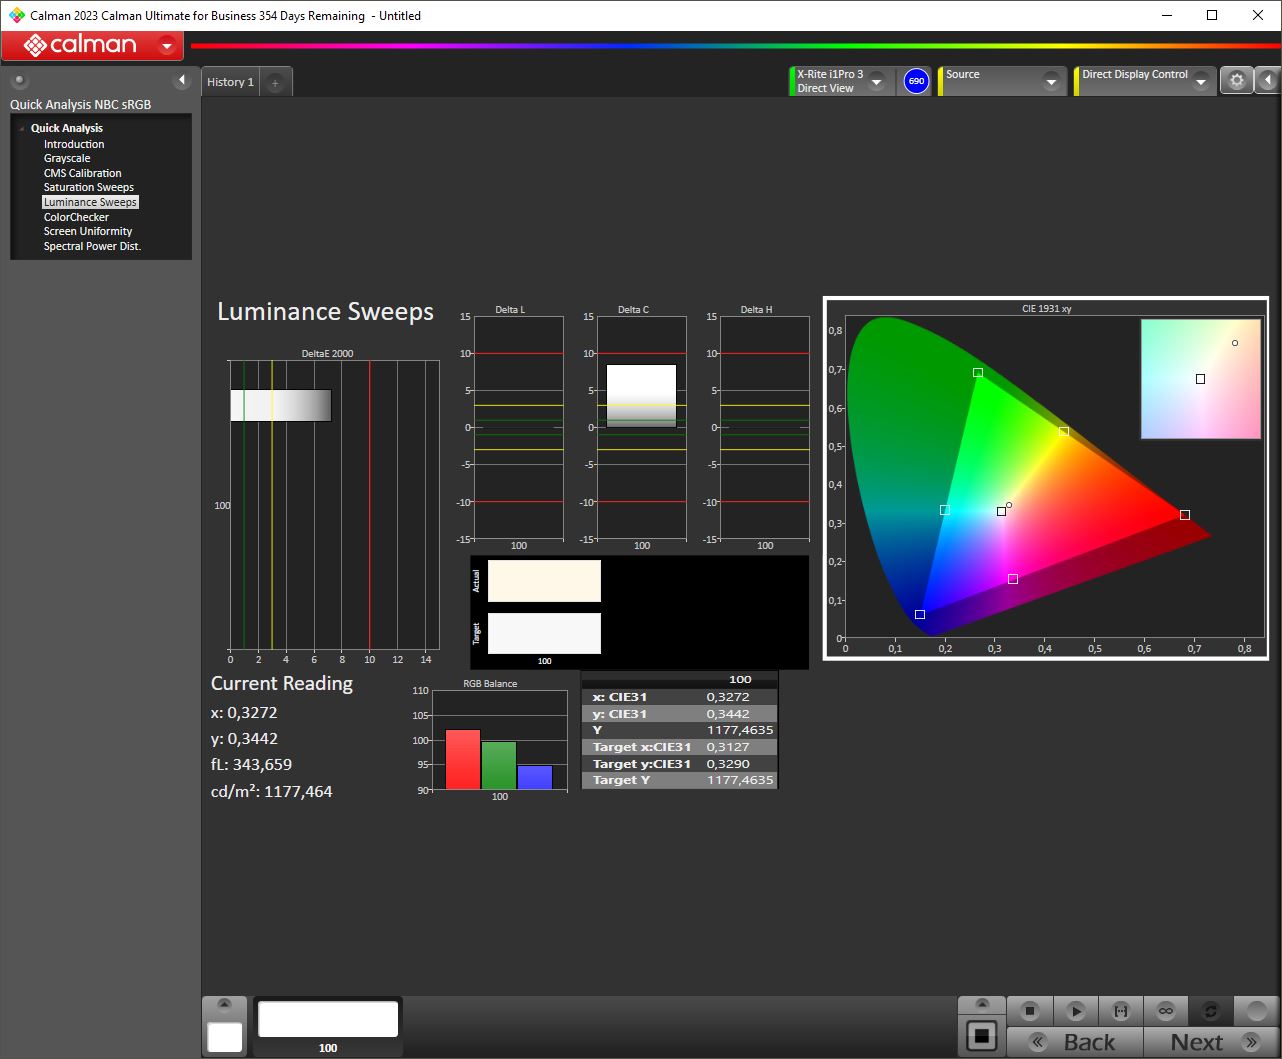
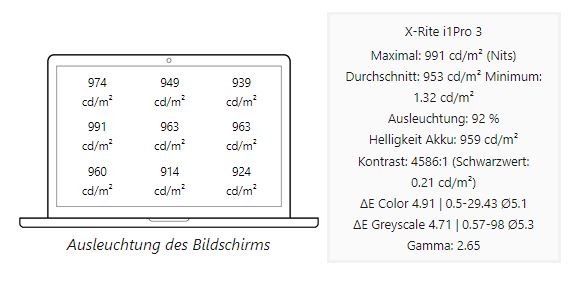
In modalità SDR normale, il pannello AU Optronics raggiunge circa 350 nit. Tuttavia, lo schermo produce una luminosità ancora maggiore in modalità HDR. Qui abbiamo misurato un picco di luminosità di oltre 1.100 nit! L'illuminazione è un ottimo 92% in entrambi i casi.
Illuminazione in modalità HDR
Illumination in SDR mode
| |||||||||||||||||||||||||
Distribuzione della luminosità: 92 %
Al centro con la batteria: 359 cd/m²
Contrasto: 1714:1 (Nero: 0.21 cd/m²)
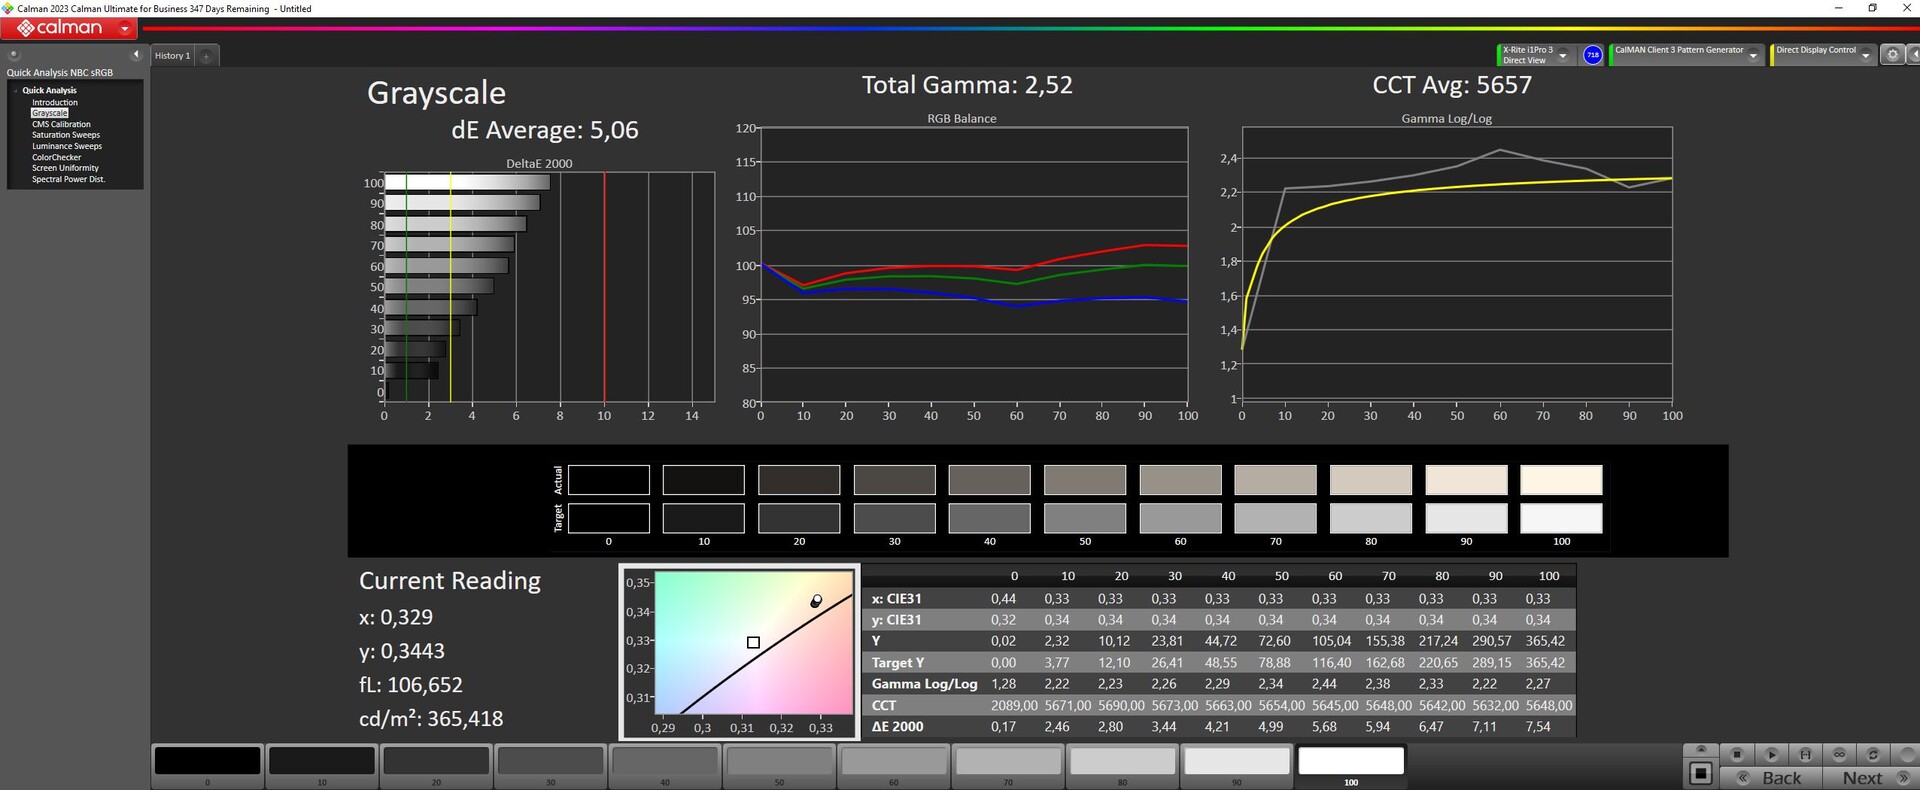
ΔE ColorChecker Calman: 3.82 | ∀{0.5-29.43 Ø4.72}
calibrated: 2.24
ΔE Greyscale Calman: 5.06 | ∀{0.09-98 Ø4.97}
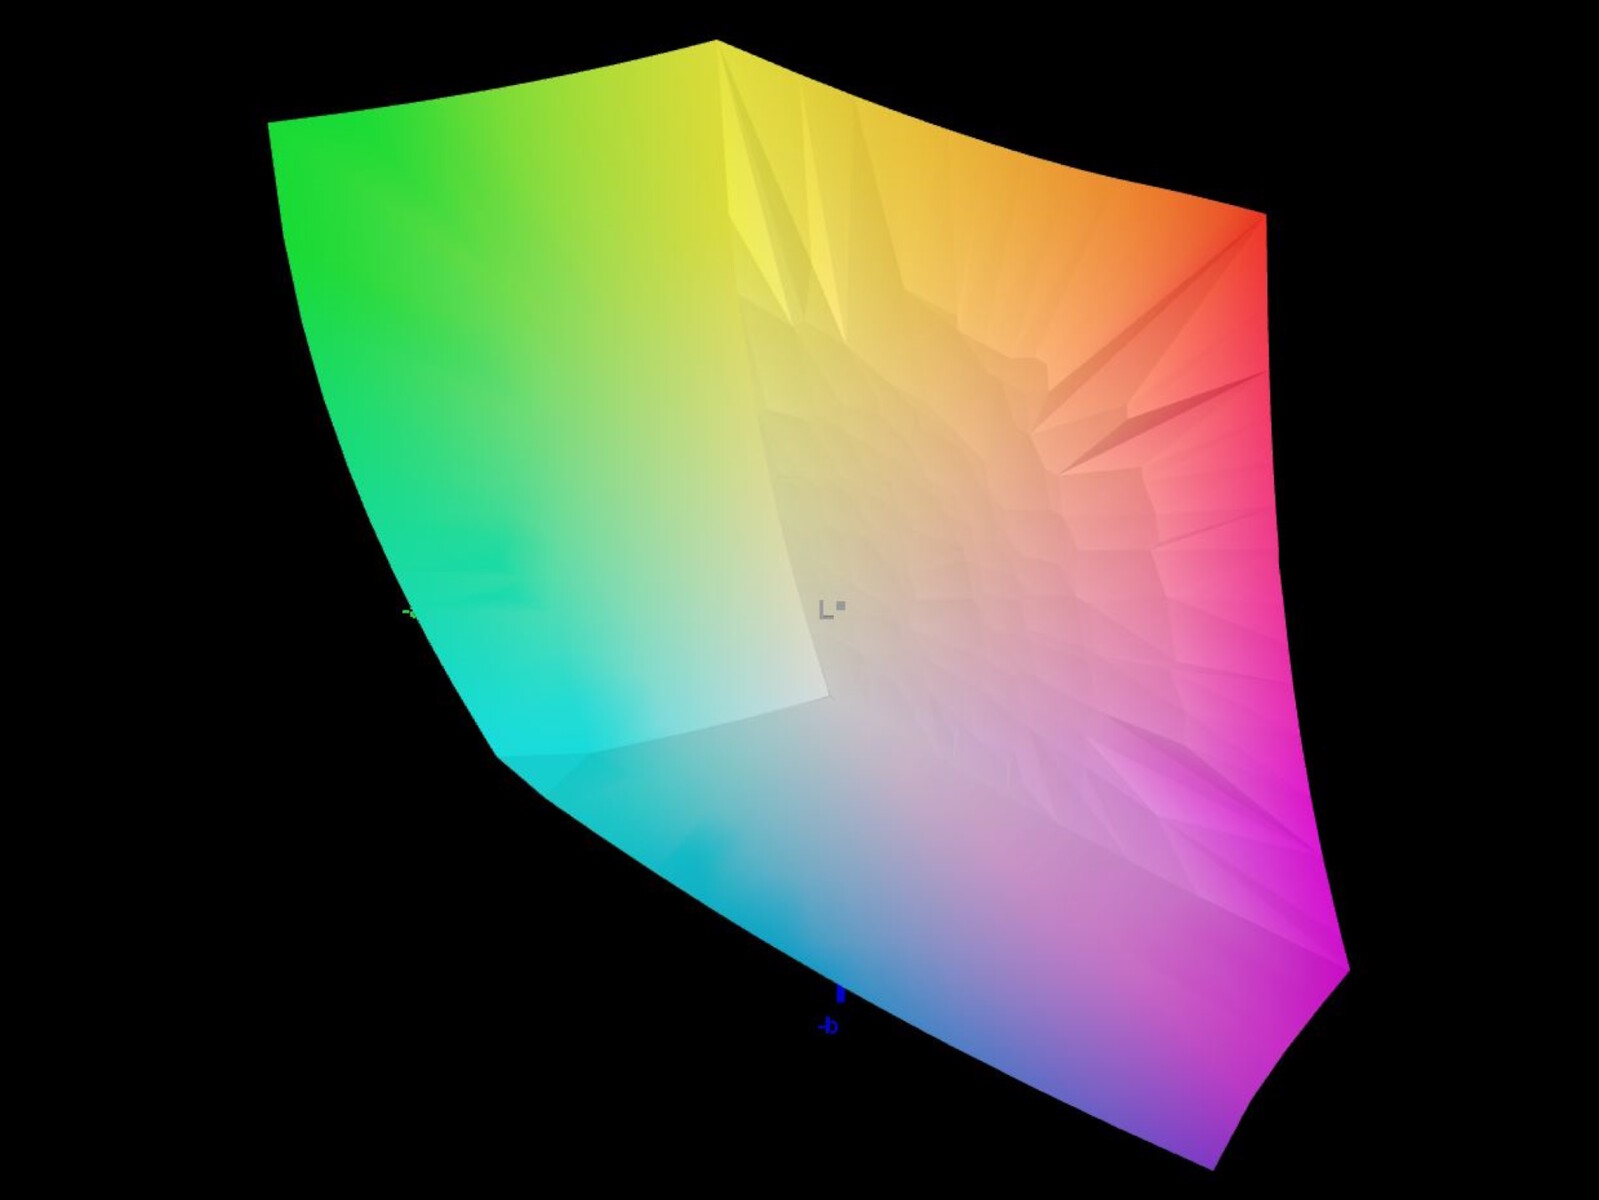
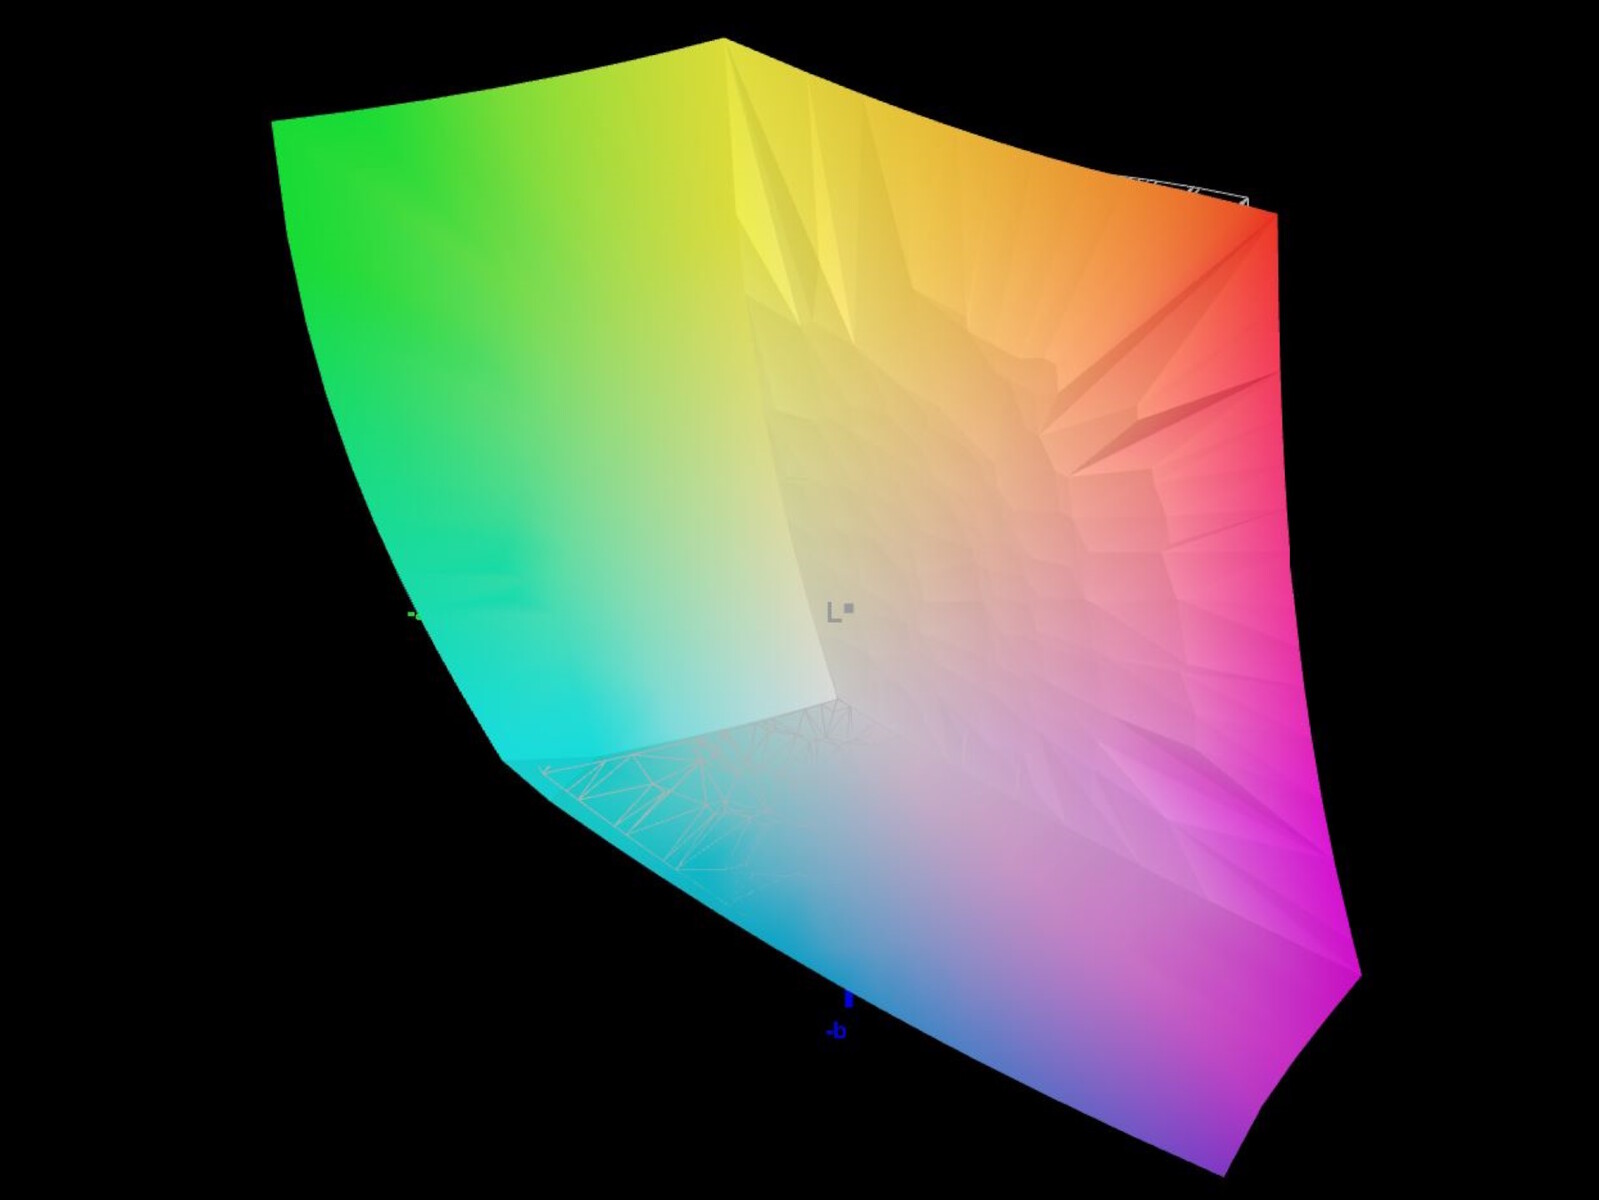
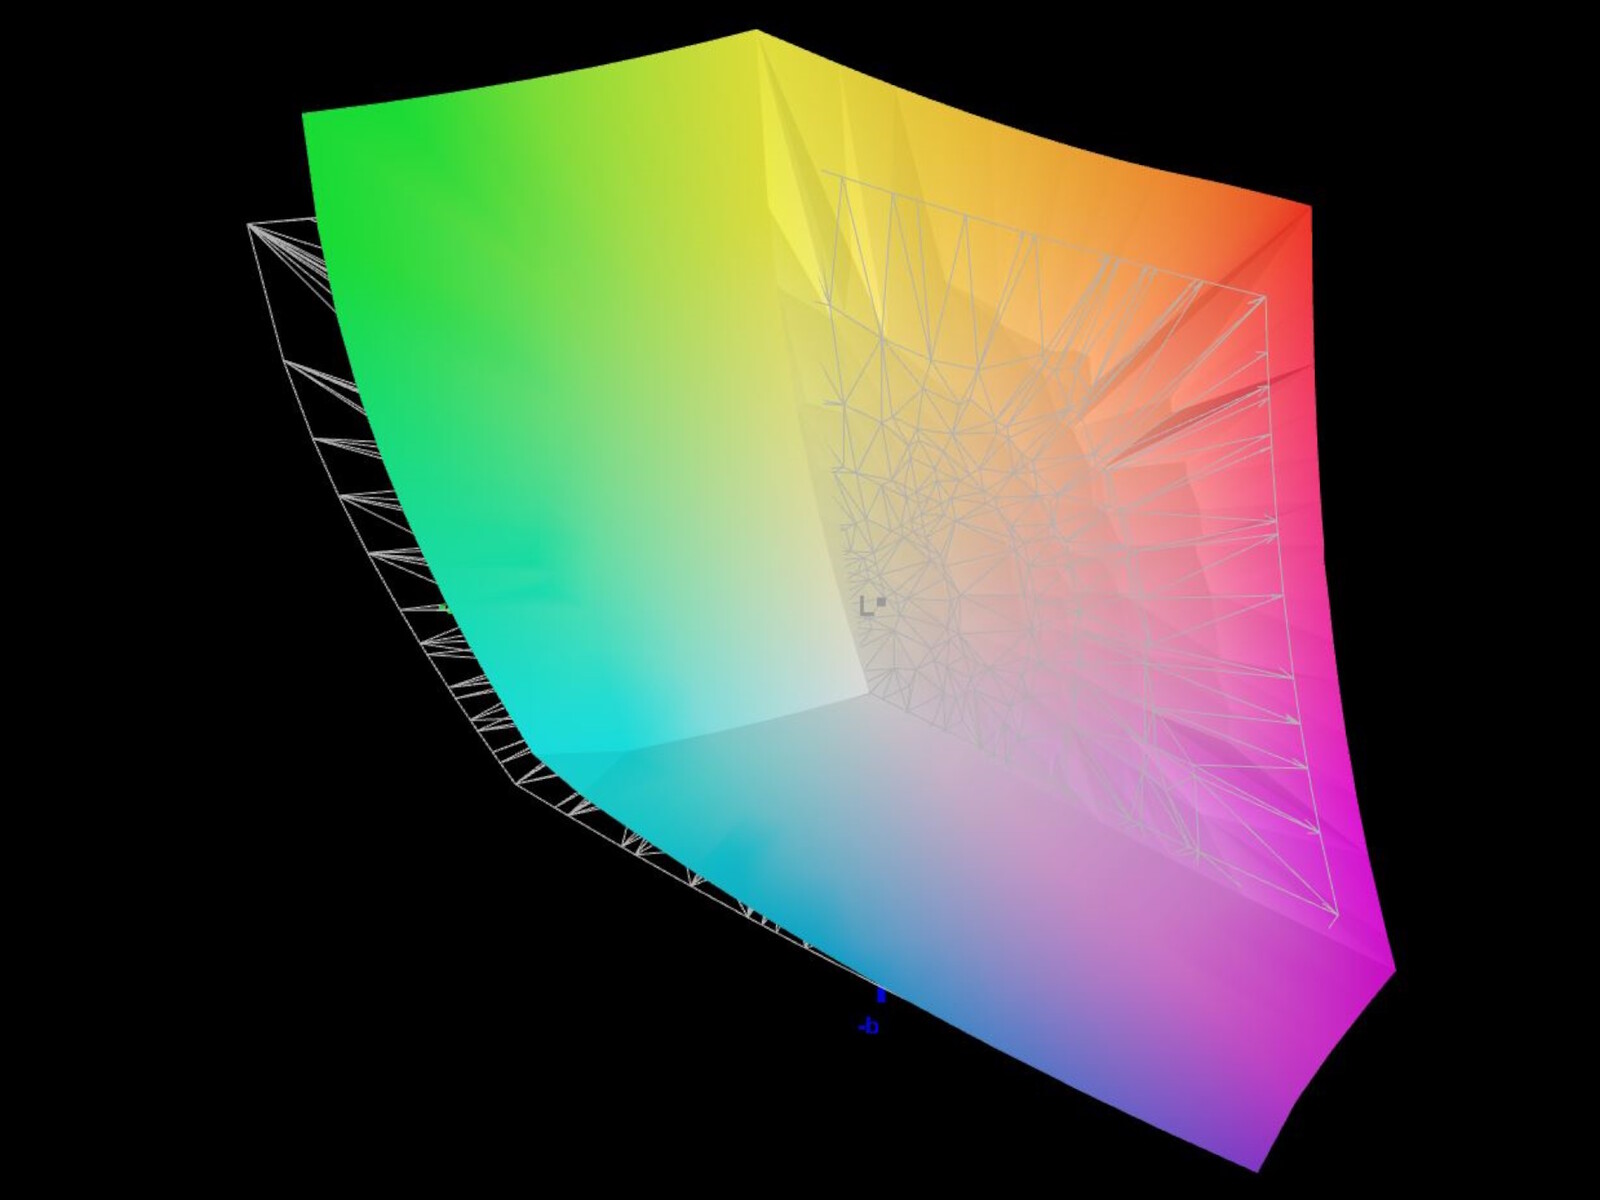
91.8% AdobeRGB 1998 (Argyll 3D)
100% sRGB (Argyll 3D)
99.8% Display P3 (Argyll 3D)
Gamma: 2.52
CCT: 5657 K
| Acer Predator Helios 18 N23Q2 AUO45A8 (B180QAN01.2), IPS, 2560x1600, 18" | MSI GE78HX 13VH-070US AU Optronics B170QAN01.2, IPS, 2560x1600, 17" | HP Omen 17-ck2097ng BOE BOE09BF, IPS, 2560x1440, 17.3" | Alienware m18 R1 Chi Mei 180JME, IPS, 1920x1200, 18" | Asus ROG Strix G18 G814JI NE180QDM-NZ2 (BOE0B35), IPS, 2560x1600, 18" | Razer Blade 18 RTX 4070 AU Optronics B180QAN01.0, IPS, 2560x1600, 18" | |
|---|---|---|---|---|---|---|
| Display | -3% | -19% | -1% | -3% | -3% | |
| Display P3 Coverage (%) | 99.8 | 97.6 -2% | 67.4 -32% | 97.7 -2% | 98.1 -2% | 96.9 -3% |
| sRGB Coverage (%) | 100 | 99.9 0% | 97.6 -2% | 100 0% | 99.9 0% | 99.8 0% |
| AdobeRGB 1998 Coverage (%) | 91.8 | 86.5 -6% | 69.6 -24% | 89.8 -2% | 85.6 -7% | 85.3 -7% |
| Response Times | 55% | -28% | 53% | 38% | 50% | |
| Response Time Grey 50% / Grey 80% * (ms) | 7.6 ? | 4.2 ? 45% | 15.6 ? -105% | 3 ? 61% | 5.6 ? 26% | 4.2 ? 45% |
| Response Time Black / White * (ms) | 17.8 ? | 6.4 ? 64% | 8.9 ? 50% | 9.9 ? 44% | 9 ? 49% | 8 ? 55% |
| PWM Frequency (Hz) | 2509 | |||||
| Screen | -17% | 13% | 20% | 8% | -3% | |
| Brightness middle (cd/m²) | 360 | 398.6 11% | 371 3% | 372.8 4% | 471 31% | 549.6 53% |
| Brightness (cd/m²) | 355 | 384 8% | 350 -1% | 367 3% | 422 19% | 524 48% |
| Brightness Distribution (%) | 92 | 89 -3% | 90 -2% | 97 5% | 83 -10% | 89 -3% |
| Black Level * (cd/m²) | 0.21 | 0.46 -119% | 0.32 -52% | 0.32 -52% | 0.47 -124% | 0.53 -152% |
| Contrast (:1) | 1714 | 867 -49% | 1159 -32% | 1165 -32% | 1002 -42% | 1037 -39% |
| Colorchecker dE 2000 * | 3.82 | 4.05 -6% | 1.74 54% | 1.92 50% | 2.05 46% | 3.32 13% |
| Colorchecker dE 2000 max. * | 7.38 | 8.68 -18% | 3.59 51% | 3.65 51% | 4.15 44% | 6.63 10% |
| Colorchecker dE 2000 calibrated * | 2.24 | 1.02 54% | 1.01 55% | 0.51 77% | 0.8 64% | 2.7 -21% |
| Greyscale dE 2000 * | 5.06 | 6.5 -28% | 2.8 45% | 1.5 70% | 2.8 45% | 2 60% |
| Gamma | 2.52 87% | 2.11 104% | 2.19 100% | 2.34 94% | 2.204 100% | 2.29 96% |
| CCT | 5657 115% | 7518 86% | 6474 100% | 6607 98% | 7122 91% | 6319 103% |
| Media totale (Programma / Settaggio) | 12% /
-4% | -11% /
1% | 24% /
20% | 14% /
10% | 15% /
4% |
* ... Meglio usare valori piccoli
Abbiamo effettuato la misurazione rispetto allo spazio colore P3. Il display copre quasi completamente sRGB e DisplayP3. AdobeRGB ha una copertura del 92%. Grazie soprattutto a P3, lo schermo luminoso e ad alto contrasto è adatto anche all'editing di immagini e video.
Tuttavia, appena uscito dalla scatola, il display supera l'importante valore DeltaE di 3 per i colori e la scala di grigi. La nostra calibrazione manuale migliora le deviazioni dei colori e spinge i valori DeltaE al di sotto della soglia. Anche l'abbassamento della luminosità a 160 nit può apportare ulteriori miglioramenti. Il nostro file icc calibrato può essere scaricato gratuitamente qui sopra.
Tempi di risposta del Display
| ↔ Tempi di risposta dal Nero al Bianco | ||
|---|---|---|
| 17.8 ms ... aumenta ↗ e diminuisce ↘ combinato | ↗ 15.6 ms Incremento | 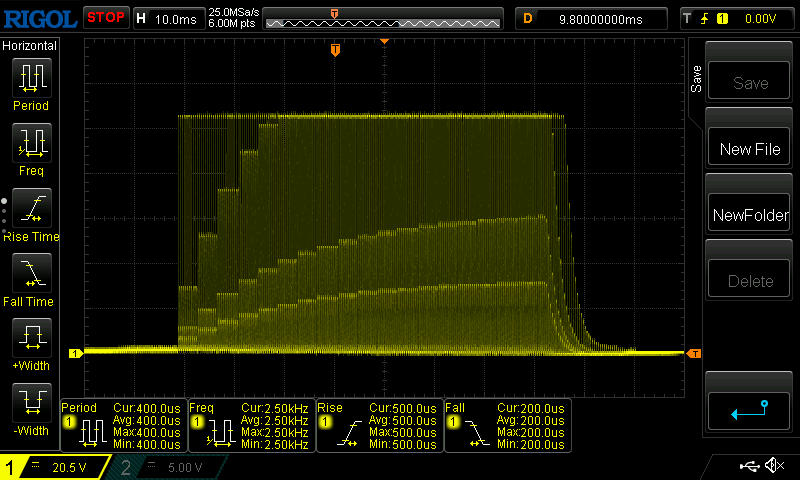 |
| ↘ 2.2 ms Calo | ||
| Lo schermo mostra buoni tempi di risposta durante i nostri tests, ma potrebbe essere troppo lento per i gamers competitivi. In confronto, tutti i dispositivi di test variano da 0.1 (minimo) a 240 (massimo) ms. » 40 % di tutti i dispositivi è migliore. Questo significa che i tempi di risposta rilevati sono migliori rispettto alla media di tutti i dispositivi testati (19.8 ms). | ||
| ↔ Tempo di risposta dal 50% Grigio all'80% Grigio | ||
| 7.6 ms ... aumenta ↗ e diminuisce ↘ combinato | ↗ 4.4 ms Incremento | 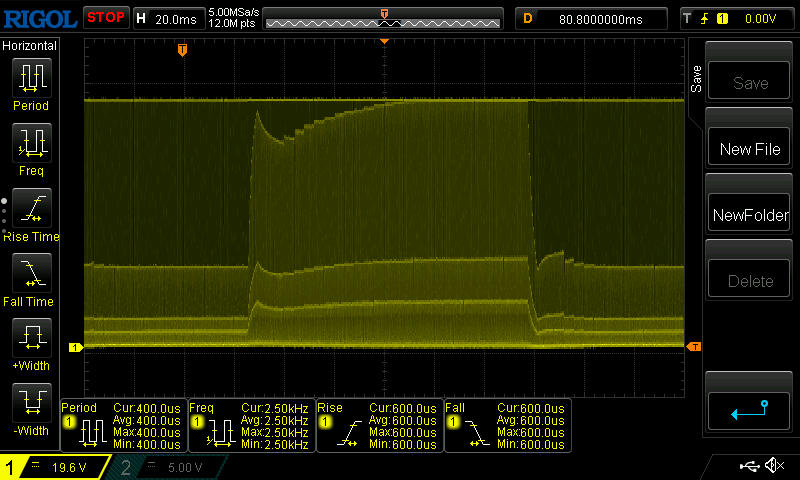 |
| ↘ 3.2 ms Calo | ||
| Lo schermo ha mostrato valori di risposta molto veloci nei nostri tests ed è molto adatto per i gaming veloce. In confronto, tutti i dispositivi di test variano da 0.165 (minimo) a 636 (massimo) ms. » 20 % di tutti i dispositivi è migliore. Questo significa che i tempi di risposta rilevati sono migliori rispettto alla media di tutti i dispositivi testati (31 ms). | ||
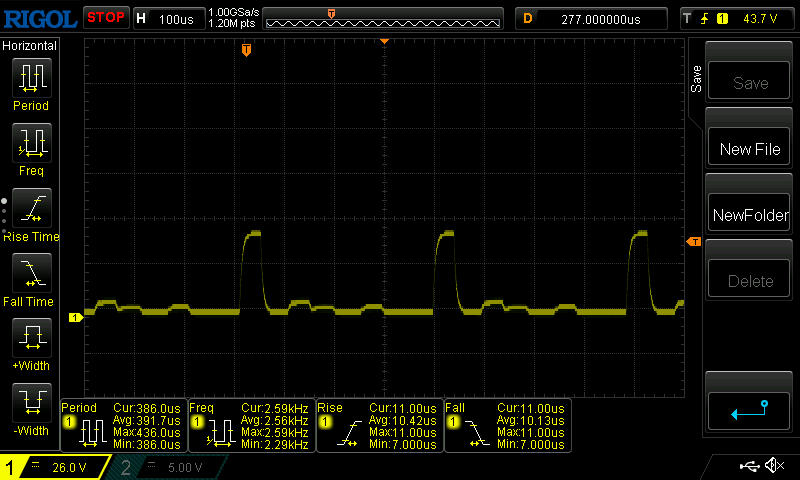
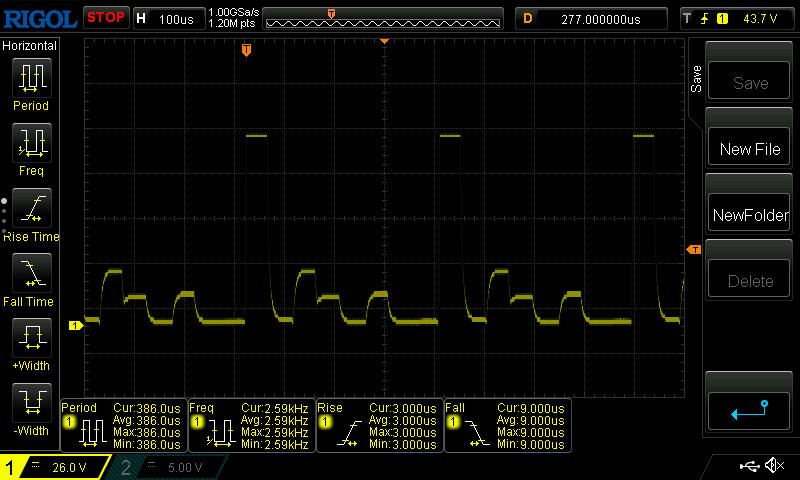
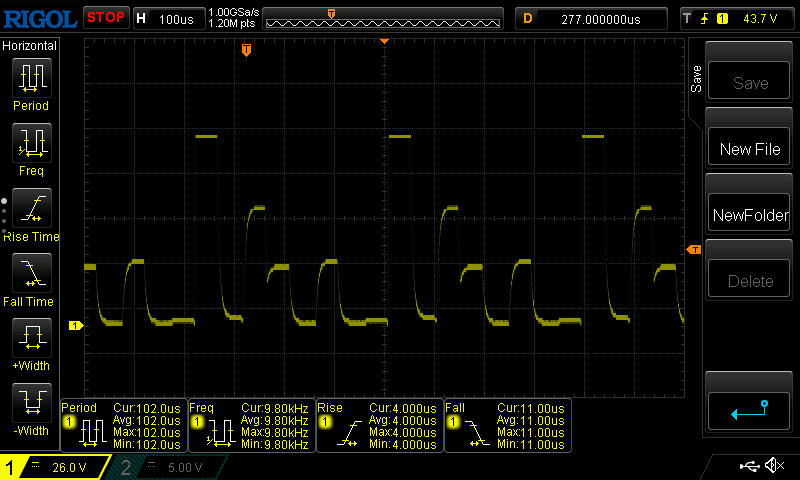
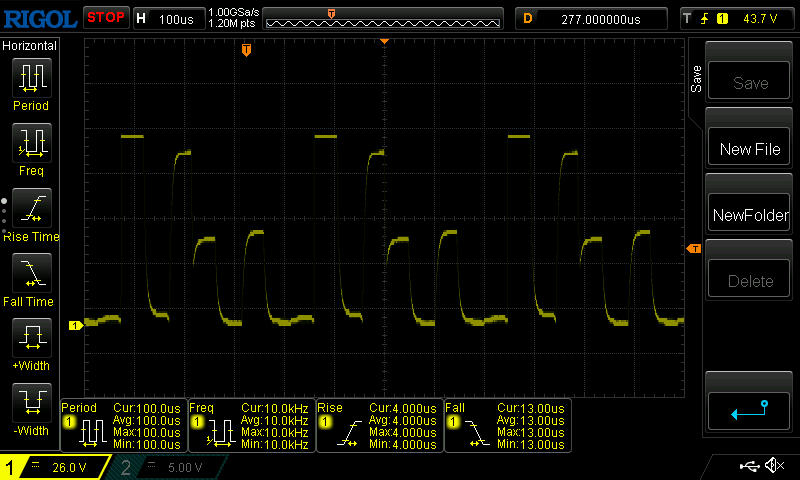
Sfarfallio dello schermo / PWM (Pulse-Width Modulation)
| flickering dello schermo / PWM rilevato | 2509 Hz | 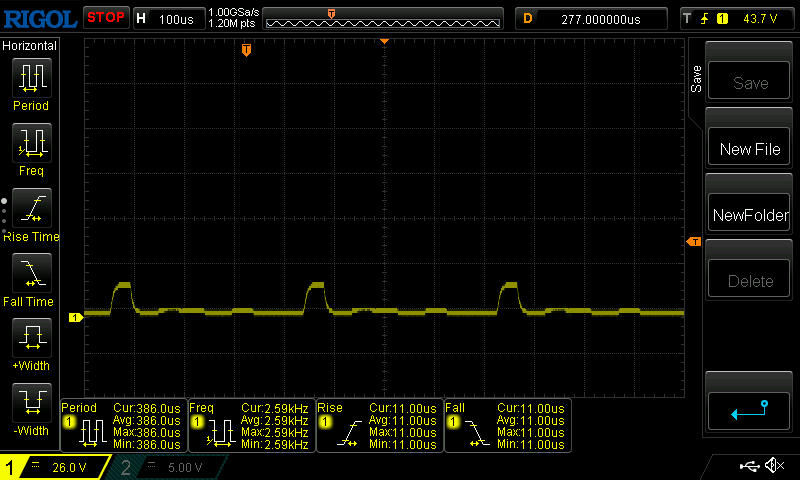 | |
Il display sfarfalla a 2509 Hz (Probabilmente a causa dell'uso di PWM) . La frequenza di 2509 Hz è abbastanza alta, quindi la maggioranza degli utenti sensibili al PWM non dovrebbero notare alcun flickering. In confronto: 52 % di tutti i dispositivi testati non utilizza PWM per ridurre la luminosita' del display. Se è rilevato PWM, una media di 7763 (minimo: 5 - massimo: 343500) Hz è stata rilevata. | |||
Il PWM viene utilizzato per il controllo della luminosità del display. Alla luminosità minima, la frequenza è più bassa, intorno ai 2,5 kHz, ma è comunque abbastanza alta da non causare problemi alle persone sensibili.
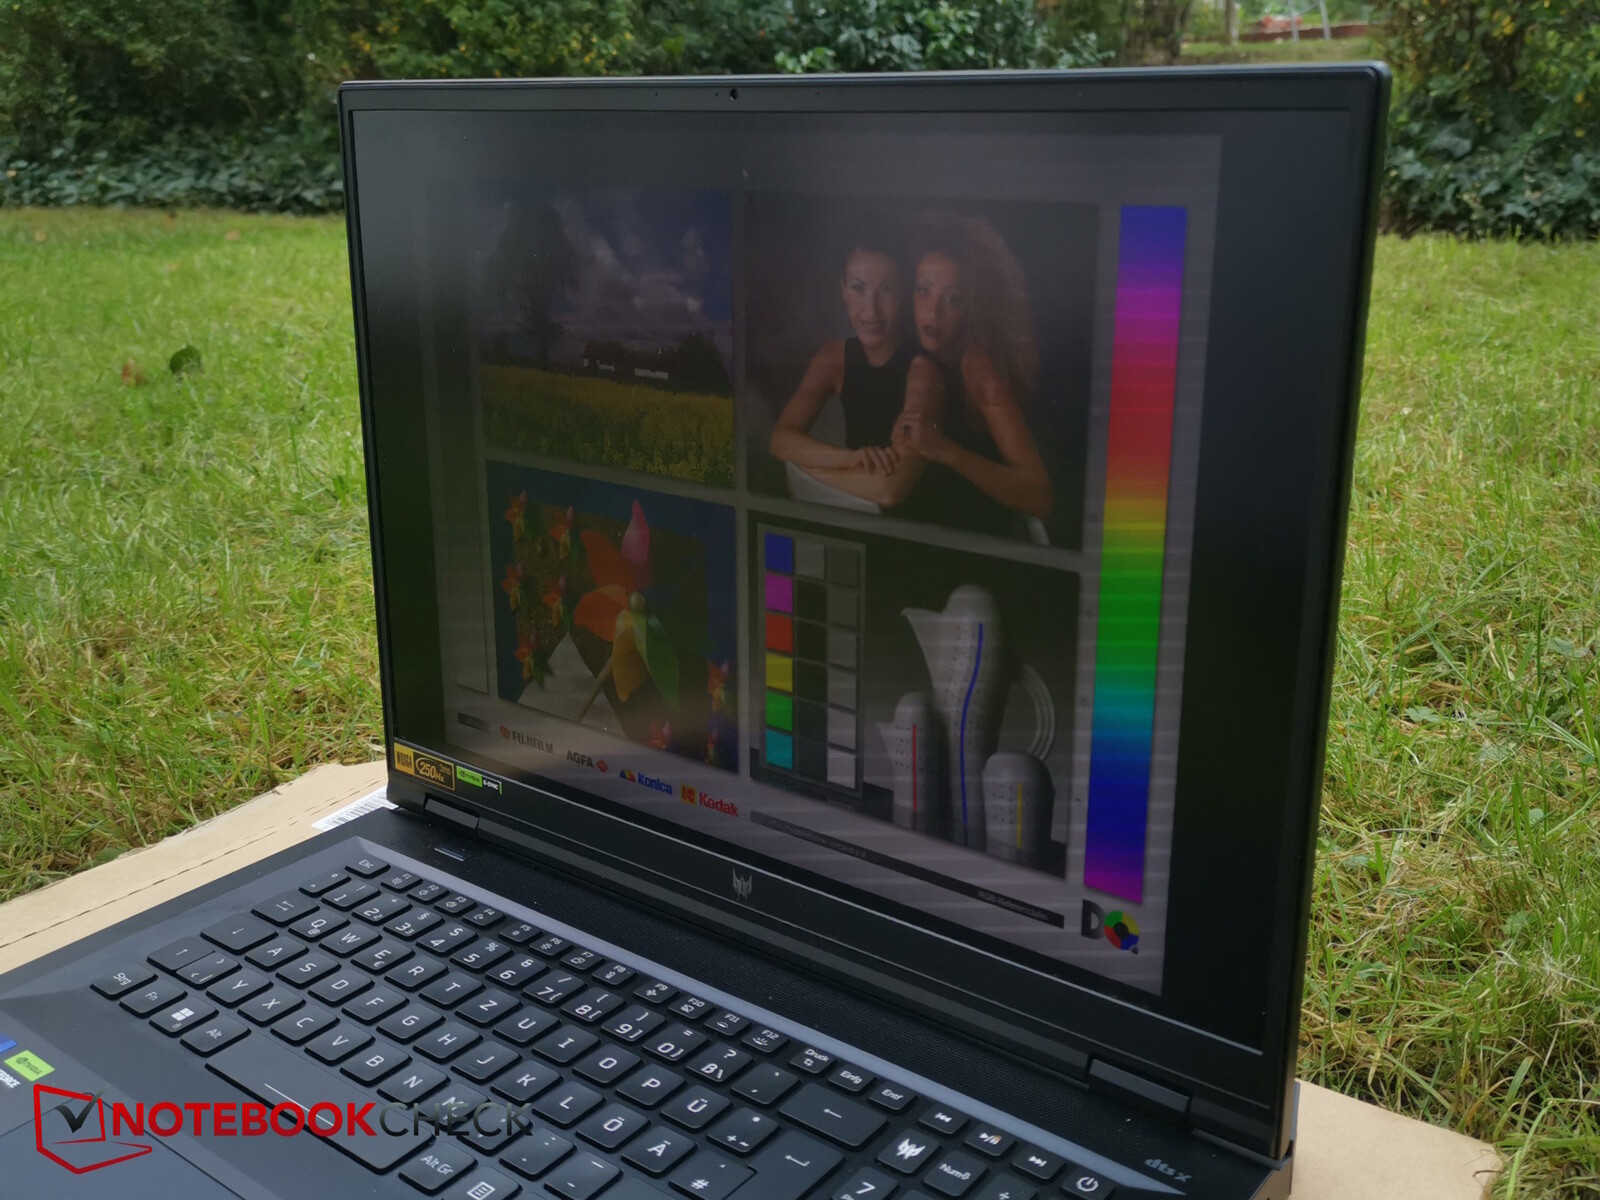
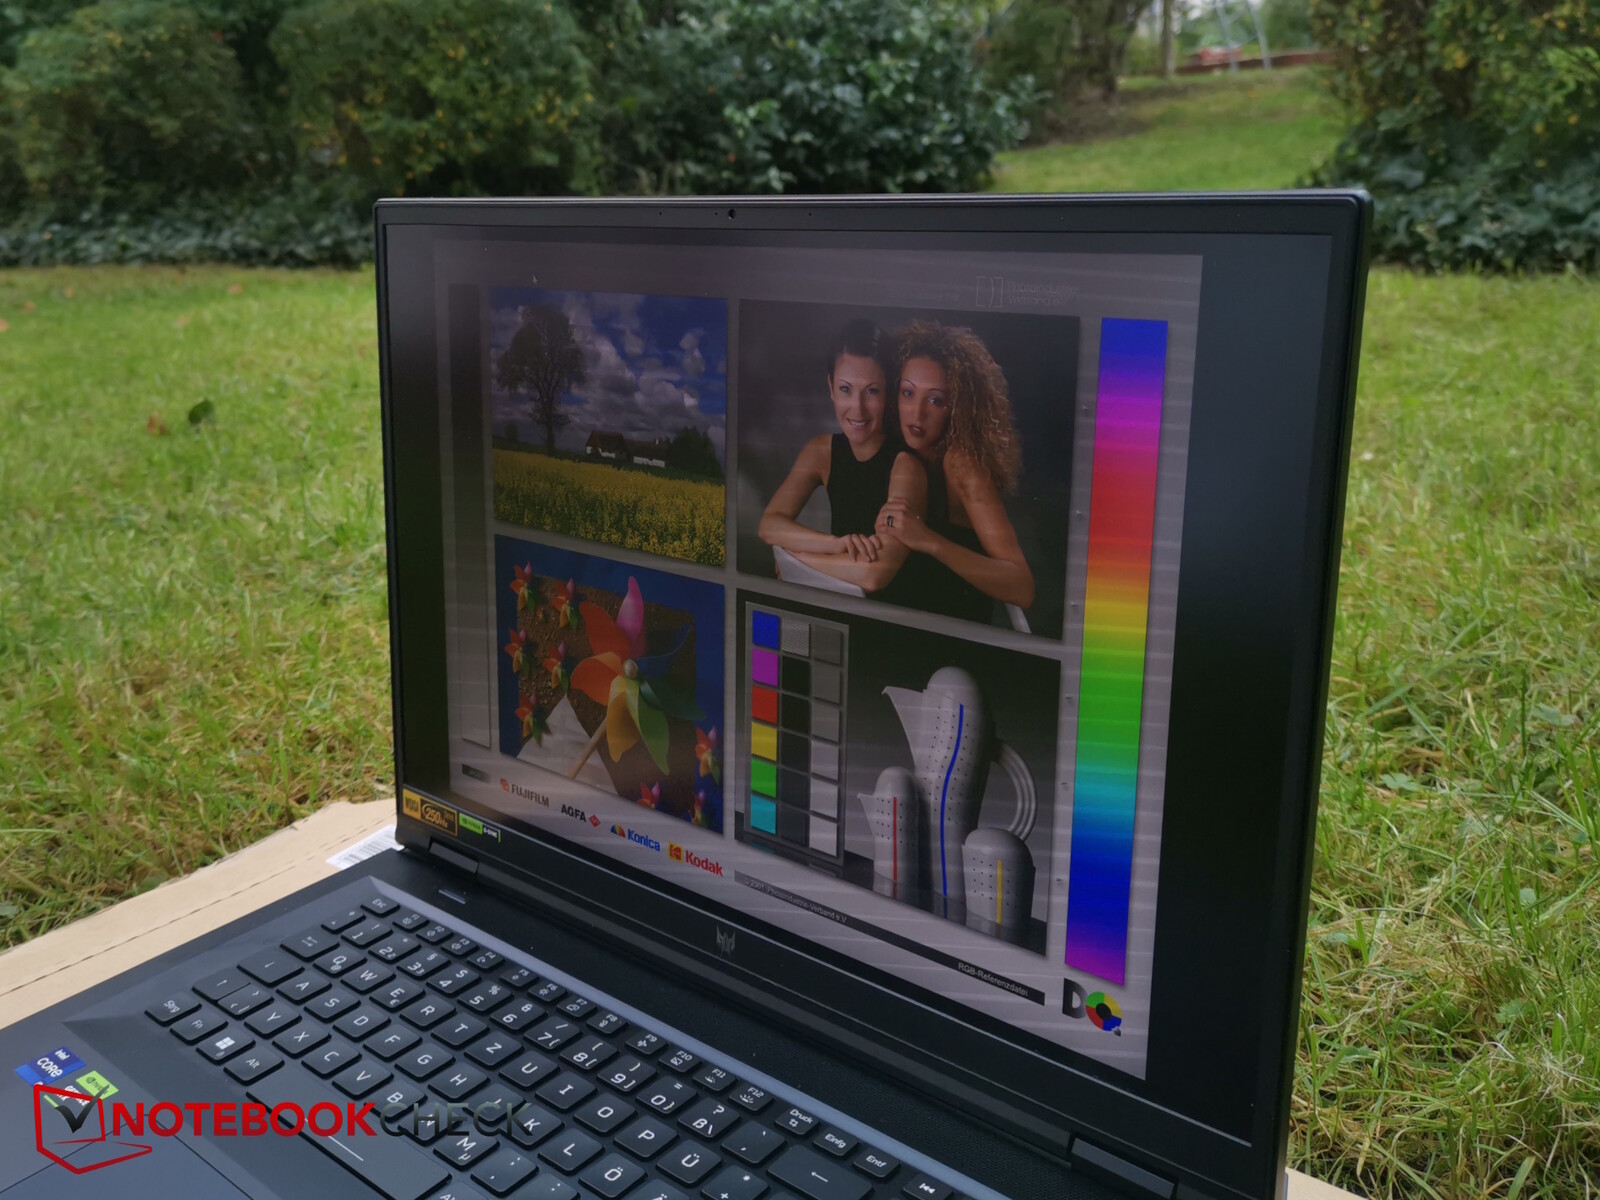
All'aperto, potrebbe essere utile impostare lo schermo su HDR per renderlo ancora più luminoso. All'ombra, i contenuti si vedono comunque molto bene.

Prestazioni - CPU HX e RTX 4080
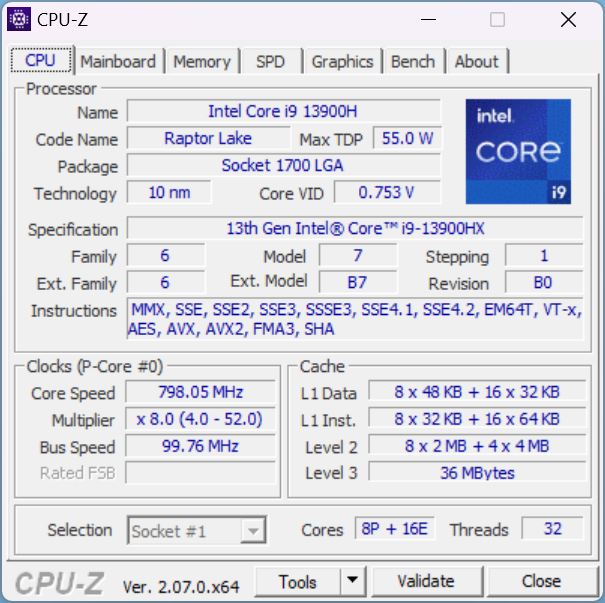
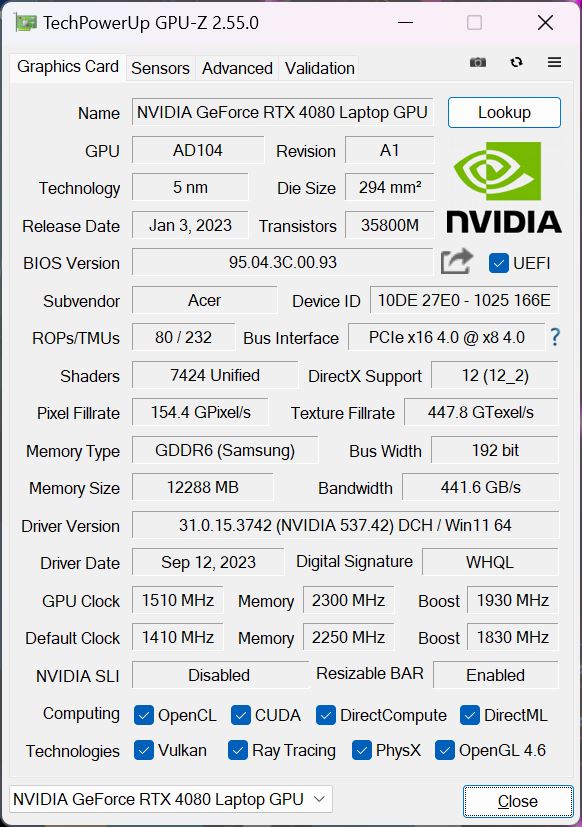
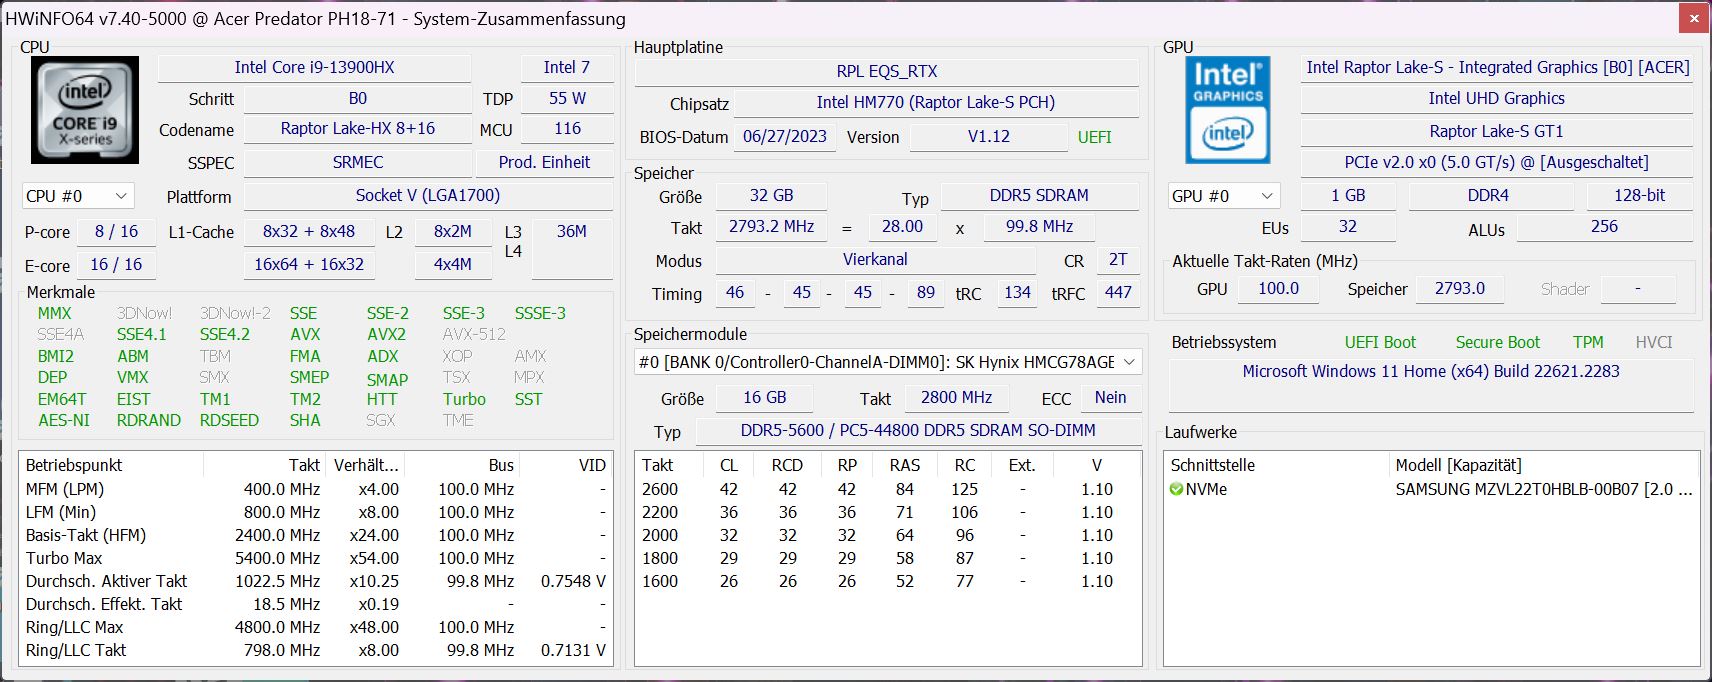
Equipaggiato con un Intel Core i9-13900HX e una GeForce GPU RTX 4080 Laptopoltre a 32 GB di RAM e a un display MiniLED da 18 pollici, abbiamo un sostituto del desktop estremamente potente e un gamer di fascia alta che dovrebbe eseguire il rendering di tutti i giochi attuali in modo fluido, anche con la risoluzione nativa WQXGA.
Grazie all'ottimo display, il portatile può anche fungere da workstation per i creativi.
Condizioni del test
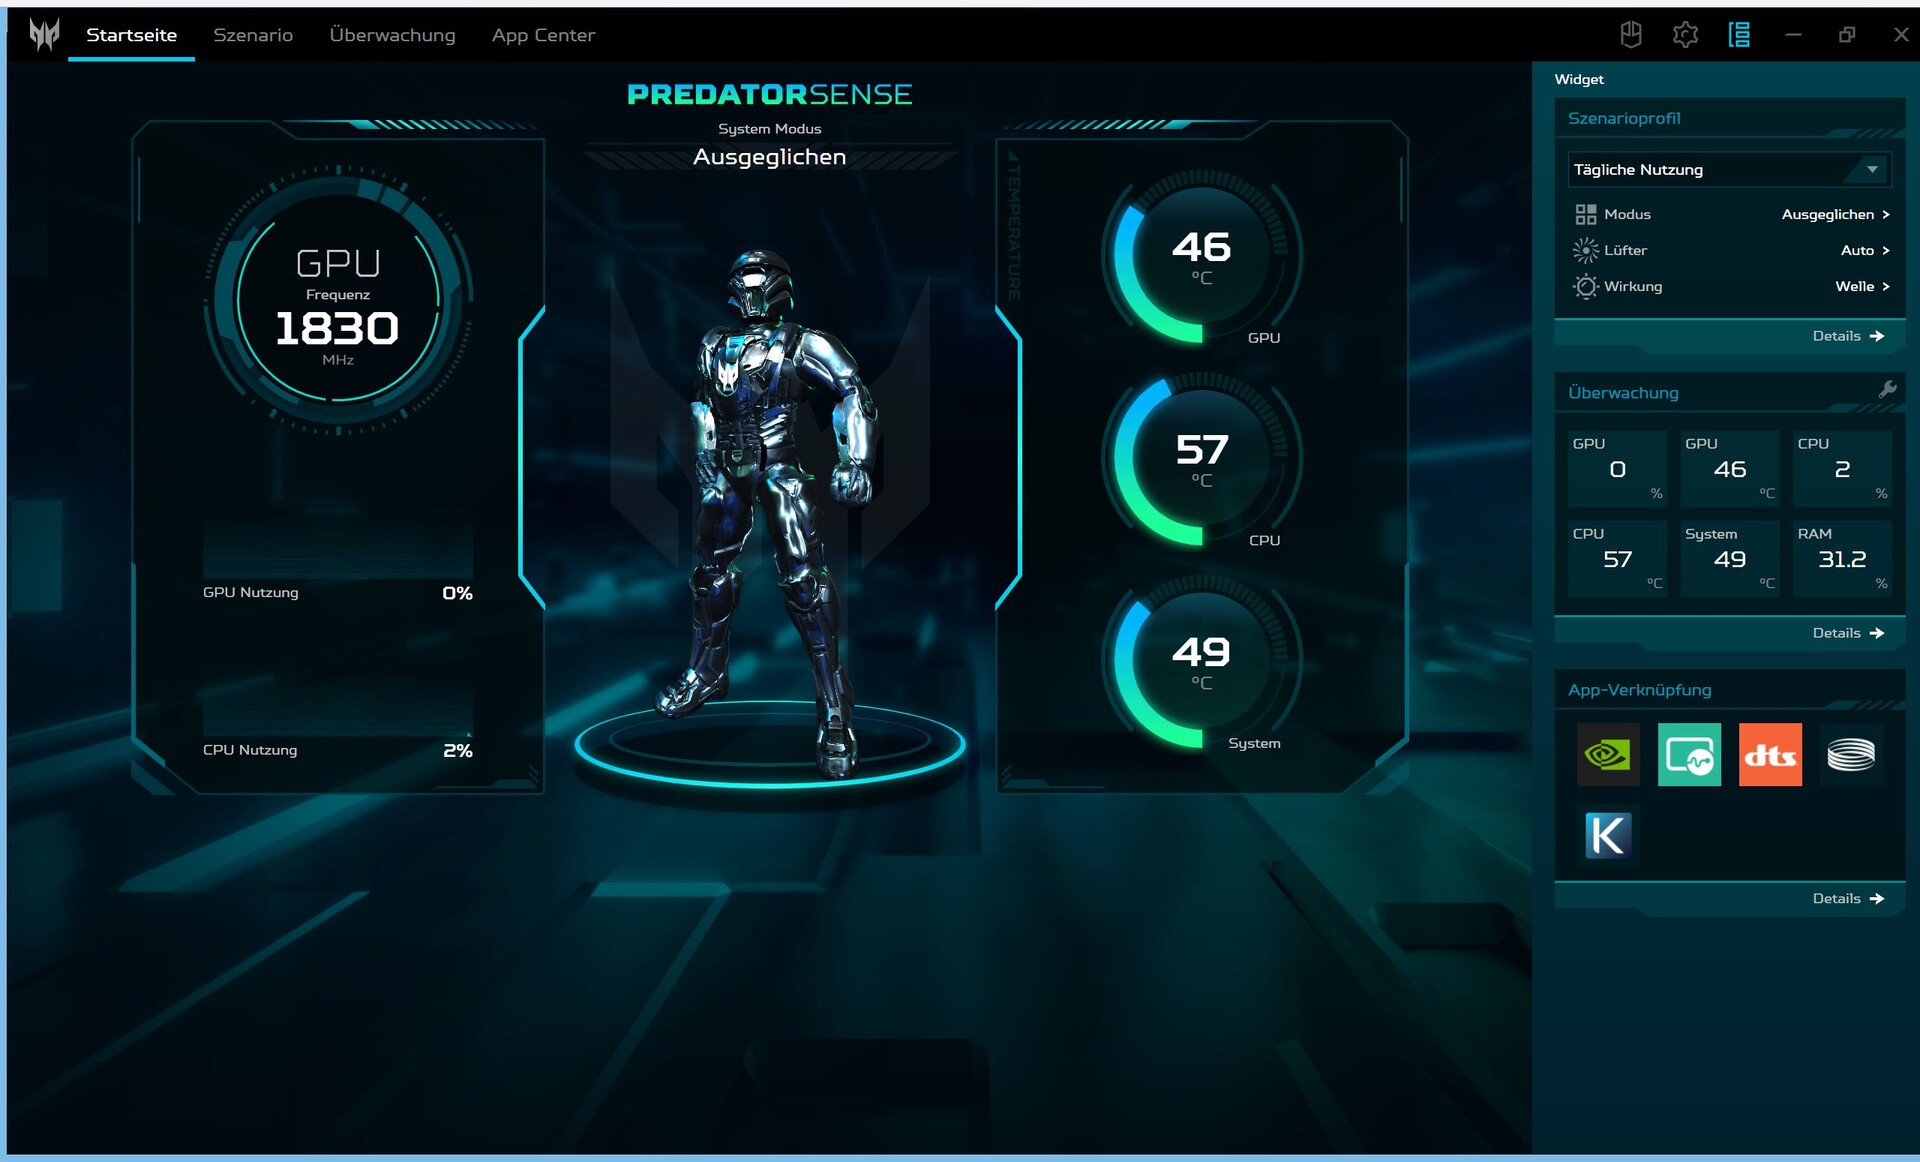
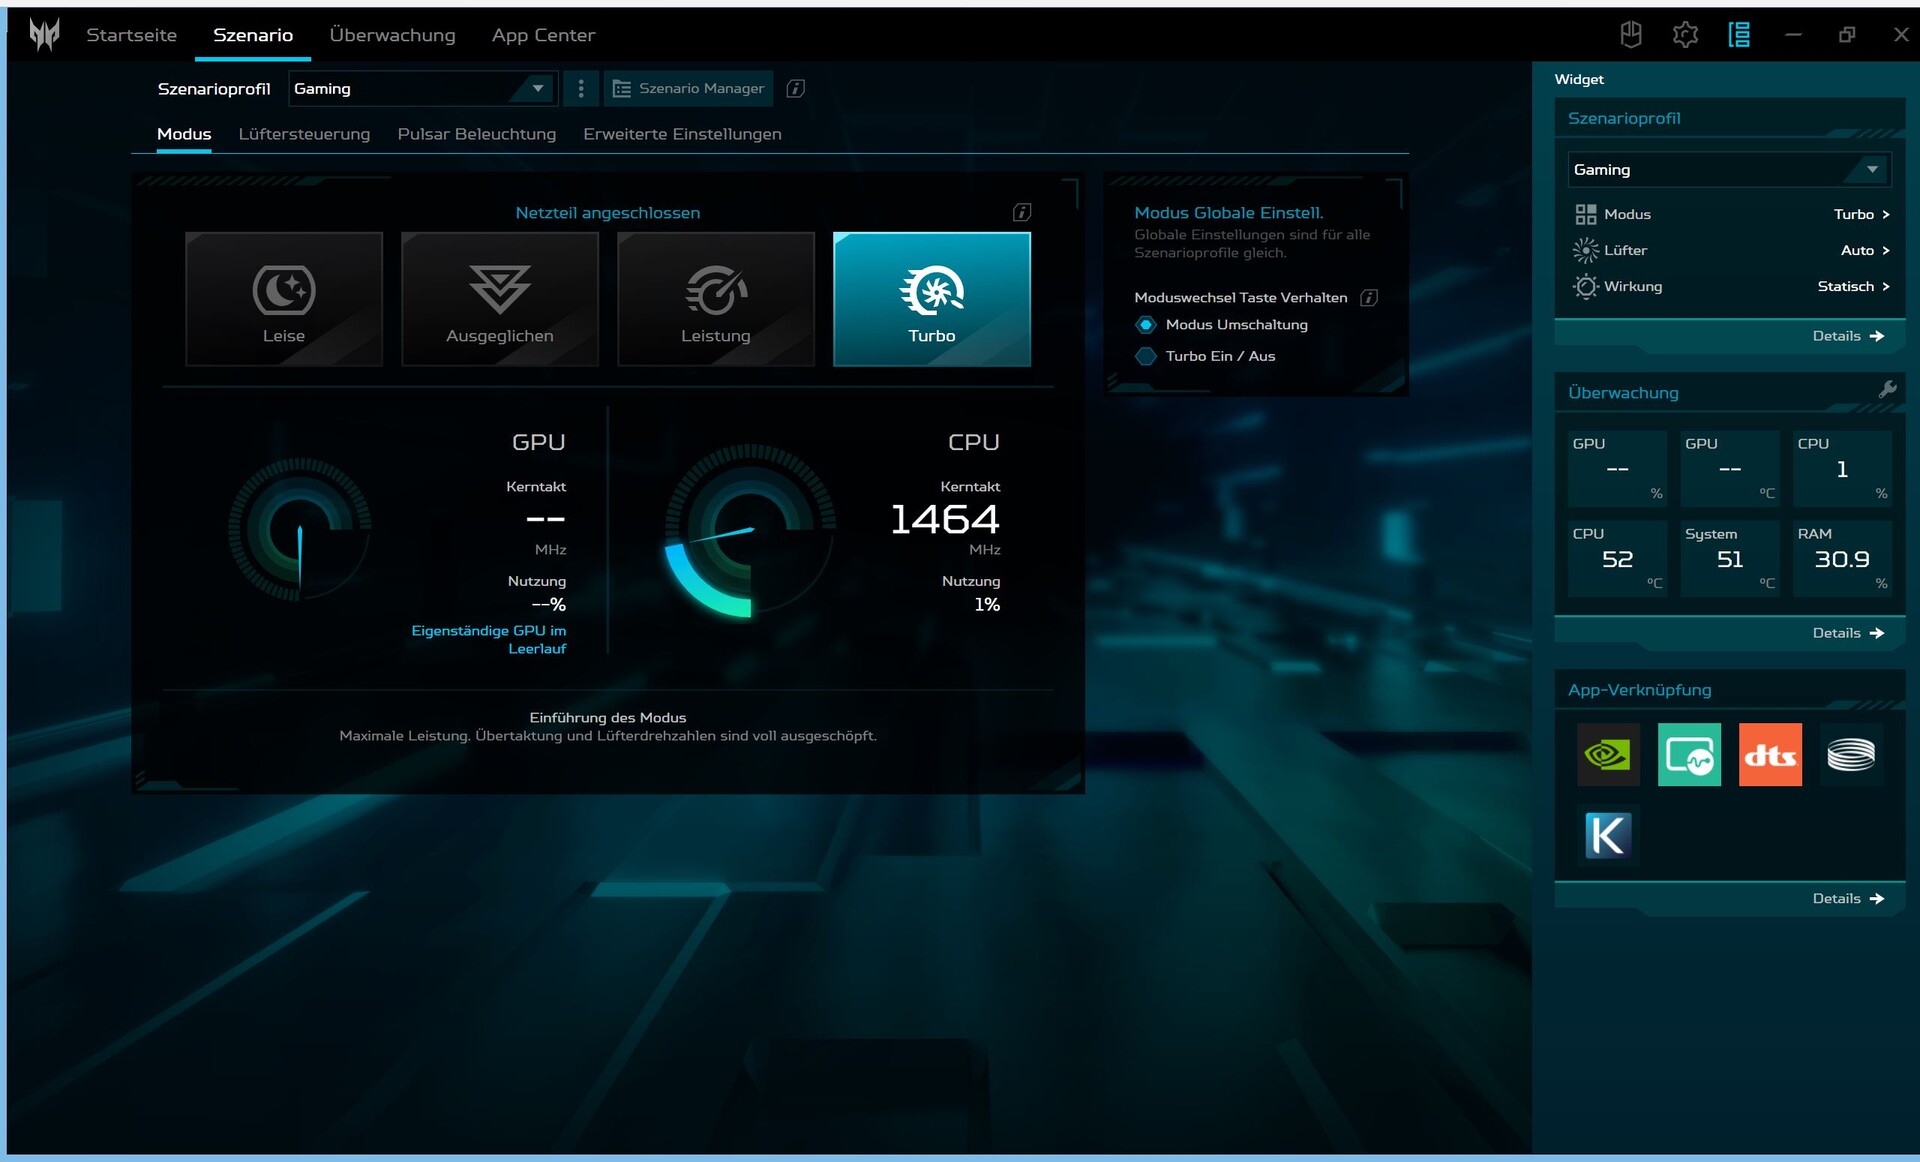
Acer installa, tra l'altro, il software Predator Sense sul suo portatile da gioco. Qui è possibile personalizzare quattro modalità di prestazioni(Eco, Bilanciato, Prestazioni, Turbo) e altre opzioni (ad esempio, l'illuminazione della tastiera). Il software è abbastanza chiaro, ma non offre un numero di impostazioni (manuali) pari a quello dei dispositivi concorrenti. Ad esempio, manca un'opzione per la commutazione della GPU e le impostazioni per regolare manualmente i parametri delle prestazioni.
Purtroppo, Acer installa anche altri software come McAfee o Acer Care, che riguardano più che altro l'assistenza. Inoltre, abbiamo ricevuto pubblicità non richiesta da Acer. Una volta abbiamo persino ricevuto una richiesta non richiesta di installare il browser Opera. Questa pubblicità forzata attraverso il software obbligatorio del produttore è un vero fastidio e purtroppo sta diventando sempre più frequente, ad esempio da parte di Lenovo nel LOQ 16cliccando sull'hub di giochi "Planet9" in Sense, si attiva una richiesta di cookie che include vari e fastidiosi pulsanti di "interesse legittimo", che devono essere tutti deselezionati individualmente se gli utenti desiderano rinunciare.
Abbiamo utilizzato principalmente la modalità Turbo per ottenere i migliori risultati di benchmark, ma riportiamo anche informazioni sulle altre modalità.

Processore
Il Intel Core i9-13900HXè una vera CPU di fascia alta della serie Raptor-Lake. Può eseguire 32 thread con 8 core P (incluso l'hyperthreading) e 16 core E. I suoi core hanno un clock di base di 1,6 (core E) e 2,2 GHz (core P) e raggiungono un turbo single-core di 3,9 - 5,4 GHz.
Nel ciclo Cinebench R15 (ciclo CB15), l'Helios offre prestazioni forti e, soprattutto, costanti, che tuttavia sono minimamente superate dall'MSI GE78HX e Alienware m18 R1 con una CPU leggermente più potente (i9-13950HX e i9-13980HX). L'HP Omen con la stessa CPU supera facilmente l'Helios, così come i dispositivi concorrenti con CPU H anziché HX.
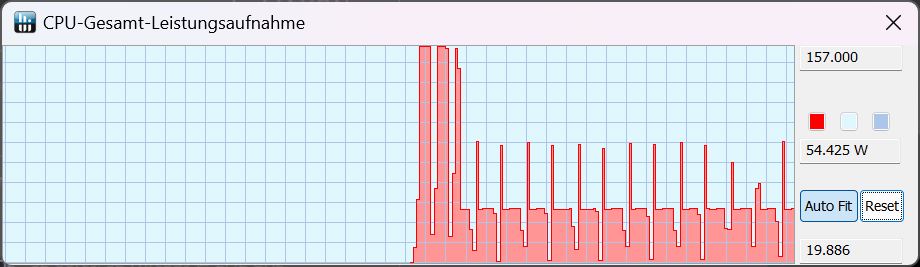
Abbiamo elencato tutti i valori TDP raggiunti per ogni modalità di prestazione durante i loop CB15 in una tabella qui sotto. In modalità batteria, si può ancora scegliere tra le modalità Bilanciata ed Eco . In entrambe le modalità, il TDP è ancora di 25 W e il punteggio del CB15 è di circa 1.300 punti, un calo di oltre il 70%! Quindi non c'è una vera differenza di prestazioni tra le due modalità.
| Modalità TDP/Performance | Turbo | Performance | Bilanciato | Silenzioso | Batteria Bilanciato | Batteria Silenzioso |
|---|---|---|---|---|---|---|
| Inizio del CB15 | 157 | 157 | 157 | 157 | 25 | 25 |
| Storia successiva del CB15 | 157 | 125 | 85 | 25 | 55 | 25 |
Cinebench R15 Multi Sustained Load
Cinebench R23: Multi Core | Single Core
Cinebench R20: CPU (Multi Core) | CPU (Single Core)
Cinebench R15: CPU Multi 64Bit | CPU Single 64Bit
Blender: v2.79 BMW27 CPU
7-Zip 18.03: 7z b 4 | 7z b 4 -mmt1
Geekbench 5.5: Multi-Core | Single-Core
HWBOT x265 Benchmark v2.2: 4k Preset
LibreOffice : 20 Documents To PDF
R Benchmark 2.5: Overall mean
| CPU Performance rating | |
| MSI GE78HX 13VH-070US | |
| Alienware m18 R1 | |
| Acer Predator Helios 18 N23Q2 | |
| Razer Blade 18 RTX 4070 | |
| Media Intel Core i9-13900HX | |
| HP Omen 17-ck2097ng | |
| Media della classe Gaming | |
| Asus ROG Strix G18 G814JI | |
| Cinebench R23 / Multi Core | |
| MSI GE78HX 13VH-070US | |
| Alienware m18 R1 | |
| Acer Predator Helios 18 N23Q2 | |
| Razer Blade 18 RTX 4070 | |
| Media Intel Core i9-13900HX (24270 - 32623, n=23) | |
| HP Omen 17-ck2097ng | |
| Media della classe Gaming (10488 - 40970, n=110, ultimi 2 anni) | |
| Asus ROG Strix G18 G814JI | |
| Cinebench R23 / Single Core | |
| MSI GE78HX 13VH-070US | |
| Alienware m18 R1 | |
| HP Omen 17-ck2097ng | |
| Acer Predator Helios 18 N23Q2 | |
| Razer Blade 18 RTX 4070 | |
| Media Intel Core i9-13900HX (1867 - 2105, n=20) | |
| Media della classe Gaming (1166 - 2356, n=110, ultimi 2 anni) | |
| Asus ROG Strix G18 G814JI | |
| Cinebench R20 / CPU (Multi Core) | |
| MSI GE78HX 13VH-070US | |
| Alienware m18 R1 | |
| Acer Predator Helios 18 N23Q2 | |
| Razer Blade 18 RTX 4070 | |
| Media Intel Core i9-13900HX (9152 - 12541, n=21) | |
| HP Omen 17-ck2097ng | |
| Media della classe Gaming (4029 - 16108, n=109, ultimi 2 anni) | |
| Asus ROG Strix G18 G814JI | |
| Cinebench R20 / CPU (Single Core) | |
| Alienware m18 R1 | |
| HP Omen 17-ck2097ng | |
| Acer Predator Helios 18 N23Q2 | |
| MSI GE78HX 13VH-070US | |
| Razer Blade 18 RTX 4070 | |
| Media Intel Core i9-13900HX (722 - 810, n=21) | |
| Media della classe Gaming (442 - 895, n=109, ultimi 2 anni) | |
| Asus ROG Strix G18 G814JI | |
| Cinebench R15 / CPU Multi 64Bit | |
| MSI GE78HX 13VH-070US | |
| Alienware m18 R1 | |
| Acer Predator Helios 18 N23Q2 | |
| Media Intel Core i9-13900HX (3913 - 4970, n=22) | |
| Razer Blade 18 RTX 4070 | |
| HP Omen 17-ck2097ng | |
| Media della classe Gaming (1578 - 6271, n=108, ultimi 2 anni) | |
| Asus ROG Strix G18 G814JI | |
| Cinebench R15 / CPU Single 64Bit | |
| MSI GE78HX 13VH-070US | |
| Alienware m18 R1 | |
| HP Omen 17-ck2097ng | |
| Razer Blade 18 RTX 4070 | |
| Acer Predator Helios 18 N23Q2 | |
| Media della classe Gaming (188.8 - 343, n=109, ultimi 2 anni) | |
| Media Intel Core i9-13900HX (247 - 304, n=22) | |
| Asus ROG Strix G18 G814JI | |
| Blender / v2.79 BMW27 CPU | |
| Asus ROG Strix G18 G814JI | |
| HP Omen 17-ck2097ng | |
| Media della classe Gaming (80 - 330, n=107, ultimi 2 anni) | |
| Media Intel Core i9-13900HX (101 - 153, n=22) | |
| Razer Blade 18 RTX 4070 | |
| Acer Predator Helios 18 N23Q2 | |
| MSI GE78HX 13VH-070US | |
| Alienware m18 R1 | |
| 7-Zip 18.03 / 7z b 4 | |
| Alienware m18 R1 | |
| MSI GE78HX 13VH-070US | |
| Acer Predator Helios 18 N23Q2 | |
| Razer Blade 18 RTX 4070 | |
| Media Intel Core i9-13900HX (90675 - 127283, n=21) | |
| HP Omen 17-ck2097ng | |
| Media della classe Gaming (33491 - 148086, n=108, ultimi 2 anni) | |
| Asus ROG Strix G18 G814JI | |
| 7-Zip 18.03 / 7z b 4 -mmt1 | |
| MSI GE78HX 13VH-070US | |
| Acer Predator Helios 18 N23Q2 | |
| HP Omen 17-ck2097ng | |
| Alienware m18 R1 | |
| Razer Blade 18 RTX 4070 | |
| Media Intel Core i9-13900HX (6340 - 7177, n=21) | |
| Media della classe Gaming (4199 - 7436, n=108, ultimi 2 anni) | |
| Asus ROG Strix G18 G814JI | |
| Geekbench 5.5 / Multi-Core | |
| Alienware m18 R1 | |
| MSI GE78HX 13VH-070US | |
| Acer Predator Helios 18 N23Q2 | |
| HP Omen 17-ck2097ng | |
| Razer Blade 18 RTX 4070 | |
| Media Intel Core i9-13900HX (17614 - 21075, n=22) | |
| Media della classe Gaming (6460 - 27010, n=108, ultimi 2 anni) | |
| Asus ROG Strix G18 G814JI | |
| Geekbench 5.5 / Single-Core | |
| MSI GE78HX 13VH-070US | |
| HP Omen 17-ck2097ng | |
| Alienware m18 R1 | |
| Acer Predator Helios 18 N23Q2 | |
| Media della classe Gaming (986 - 2474, n=108, ultimi 2 anni) | |
| Razer Blade 18 RTX 4070 | |
| Media Intel Core i9-13900HX (1345 - 2093, n=22) | |
| Asus ROG Strix G18 G814JI | |
| HWBOT x265 Benchmark v2.2 / 4k Preset | |
| MSI GE78HX 13VH-070US | |
| Alienware m18 R1 | |
| Razer Blade 18 RTX 4070 | |
| Acer Predator Helios 18 N23Q2 | |
| Media Intel Core i9-13900HX (23.5 - 34.4, n=22) | |
| Media della classe Gaming (11.5 - 44.3, n=108, ultimi 2 anni) | |
| HP Omen 17-ck2097ng | |
| Asus ROG Strix G18 G814JI | |
| LibreOffice / 20 Documents To PDF | |
| Asus ROG Strix G18 G814JI | |
| Acer Predator Helios 18 N23Q2 | |
| Media della classe Gaming (19 - 88.8, n=108, ultimi 2 anni) | |
| MSI GE78HX 13VH-070US | |
| Alienware m18 R1 | |
| HP Omen 17-ck2097ng | |
| Razer Blade 18 RTX 4070 | |
| Media Intel Core i9-13900HX (32.8 - 51.1, n=21) | |
| R Benchmark 2.5 / Overall mean | |
| Asus ROG Strix G18 G814JI | |
| Media della classe Gaming (0.3439 - 0.759, n=109, ultimi 2 anni) | |
| Media Intel Core i9-13900HX (0.375 - 0.4564, n=22) | |
| Acer Predator Helios 18 N23Q2 | |
| Razer Blade 18 RTX 4070 | |
| Alienware m18 R1 | |
| HP Omen 17-ck2097ng | |
| MSI GE78HX 13VH-070US | |
* ... Meglio usare valori piccoli
AIDA64: FP32 Ray-Trace | FPU Julia | CPU SHA3 | CPU Queen | FPU SinJulia | FPU Mandel | CPU AES | CPU ZLib | FP64 Ray-Trace | CPU PhotoWorxx
| Performance rating | |
| Alienware m18 R1 | |
| Acer Predator Helios 18 N23Q2 | |
| MSI GE78HX 13VH-070US | |
| Razer Blade 18 RTX 4070 | |
| Media della classe Gaming | |
| Media Intel Core i9-13900HX | |
| HP Omen 17-ck2097ng | |
| Asus ROG Strix G18 G814JI | |
| AIDA64 / FP32 Ray-Trace | |
| Media della classe Gaming (10227 - 85542, n=107, ultimi 2 anni) | |
| Alienware m18 R1 | |
| MSI GE78HX 13VH-070US | |
| Acer Predator Helios 18 N23Q2 | |
| Razer Blade 18 RTX 4070 | |
| Media Intel Core i9-13900HX (17589 - 27615, n=22) | |
| Asus ROG Strix G18 G814JI | |
| HP Omen 17-ck2097ng | |
| AIDA64 / FPU Julia | |
| Alienware m18 R1 | |
| MSI GE78HX 13VH-070US | |
| Acer Predator Helios 18 N23Q2 | |
| Media della classe Gaming (51376 - 238426, n=107, ultimi 2 anni) | |
| Razer Blade 18 RTX 4070 | |
| Media Intel Core i9-13900HX (88686 - 137015, n=22) | |
| Asus ROG Strix G18 G814JI | |
| HP Omen 17-ck2097ng | |
| AIDA64 / CPU SHA3 | |
| Alienware m18 R1 | |
| MSI GE78HX 13VH-070US | |
| Acer Predator Helios 18 N23Q2 | |
| Razer Blade 18 RTX 4070 | |
| Media della classe Gaming (2180 - 9817, n=107, ultimi 2 anni) | |
| Media Intel Core i9-13900HX (4362 - 7029, n=22) | |
| Asus ROG Strix G18 G814JI | |
| HP Omen 17-ck2097ng | |
| AIDA64 / CPU Queen | |
| Alienware m18 R1 | |
| MSI GE78HX 13VH-070US | |
| Razer Blade 18 RTX 4070 | |
| Acer Predator Helios 18 N23Q2 | |
| HP Omen 17-ck2097ng | |
| Media Intel Core i9-13900HX (125644 - 141385, n=22) | |
| Media della classe Gaming (49785 - 173351, n=94, ultimi 2 anni) | |
| Asus ROG Strix G18 G814JI | |
| AIDA64 / FPU SinJulia | |
| MSI GE78HX 13VH-070US | |
| Alienware m18 R1 | |
| Razer Blade 18 RTX 4070 | |
| Acer Predator Helios 18 N23Q2 | |
| Media Intel Core i9-13900HX (12334 - 17179, n=22) | |
| Media della classe Gaming (4424 - 33636, n=107, ultimi 2 anni) | |
| HP Omen 17-ck2097ng | |
| Asus ROG Strix G18 G814JI | |
| AIDA64 / FPU Mandel | |
| Alienware m18 R1 | |
| Media della classe Gaming (25115 - 128721, n=107, ultimi 2 anni) | |
| MSI GE78HX 13VH-070US | |
| Acer Predator Helios 18 N23Q2 | |
| Razer Blade 18 RTX 4070 | |
| Media Intel Core i9-13900HX (43850 - 69202, n=22) | |
| Asus ROG Strix G18 G814JI | |
| HP Omen 17-ck2097ng | |
| AIDA64 / CPU AES | |
| Acer Predator Helios 18 N23Q2 | |
| Media Intel Core i9-13900HX (89413 - 237881, n=22) | |
| Alienware m18 R1 | |
| MSI GE78HX 13VH-070US | |
| Razer Blade 18 RTX 4070 | |
| Media della classe Gaming (39258 - 247074, n=107, ultimi 2 anni) | |
| HP Omen 17-ck2097ng | |
| Asus ROG Strix G18 G814JI | |
| AIDA64 / CPU ZLib | |
| MSI GE78HX 13VH-070US | |
| Alienware m18 R1 | |
| Acer Predator Helios 18 N23Q2 | |
| Razer Blade 18 RTX 4070 | |
| Media Intel Core i9-13900HX (1284 - 1958, n=22) | |
| Media della classe Gaming (574 - 2531, n=107, ultimi 2 anni) | |
| HP Omen 17-ck2097ng | |
| Asus ROG Strix G18 G814JI | |
| AIDA64 / FP64 Ray-Trace | |
| Media della classe Gaming (5509 - 45446, n=107, ultimi 2 anni) | |
| Alienware m18 R1 | |
| MSI GE78HX 13VH-070US | |
| Acer Predator Helios 18 N23Q2 | |
| Razer Blade 18 RTX 4070 | |
| Media Intel Core i9-13900HX (9481 - 15279, n=22) | |
| Asus ROG Strix G18 G814JI | |
| HP Omen 17-ck2097ng | |
| AIDA64 / CPU PhotoWorxx | |
| Alienware m18 R1 | |
| HP Omen 17-ck2097ng | |
| Acer Predator Helios 18 N23Q2 | |
| MSI GE78HX 13VH-070US | |
| Razer Blade 18 RTX 4070 | |
| Media Intel Core i9-13900HX (42994 - 51994, n=22) | |
| Media della classe Gaming (12271 - 89891, n=107, ultimi 2 anni) | |
| Asus ROG Strix G18 G814JI | |
Prestazioni del sistema
Come per le prestazioni della CPU, Helios è solo marginalmente dietro aMSI GE78HX e di Alienware m18 R1.
La maggior parte delle applicazioni risulta soggettivamente fluida. Solo la commutazione della grafica (Advanced Optimus) è un problema costante per il portatile. Maggiori informazioni su questo aspetto e sui problemi di latenza nelle sezioni seguenti.
CrossMark: Overall | Productivity | Creativity | Responsiveness
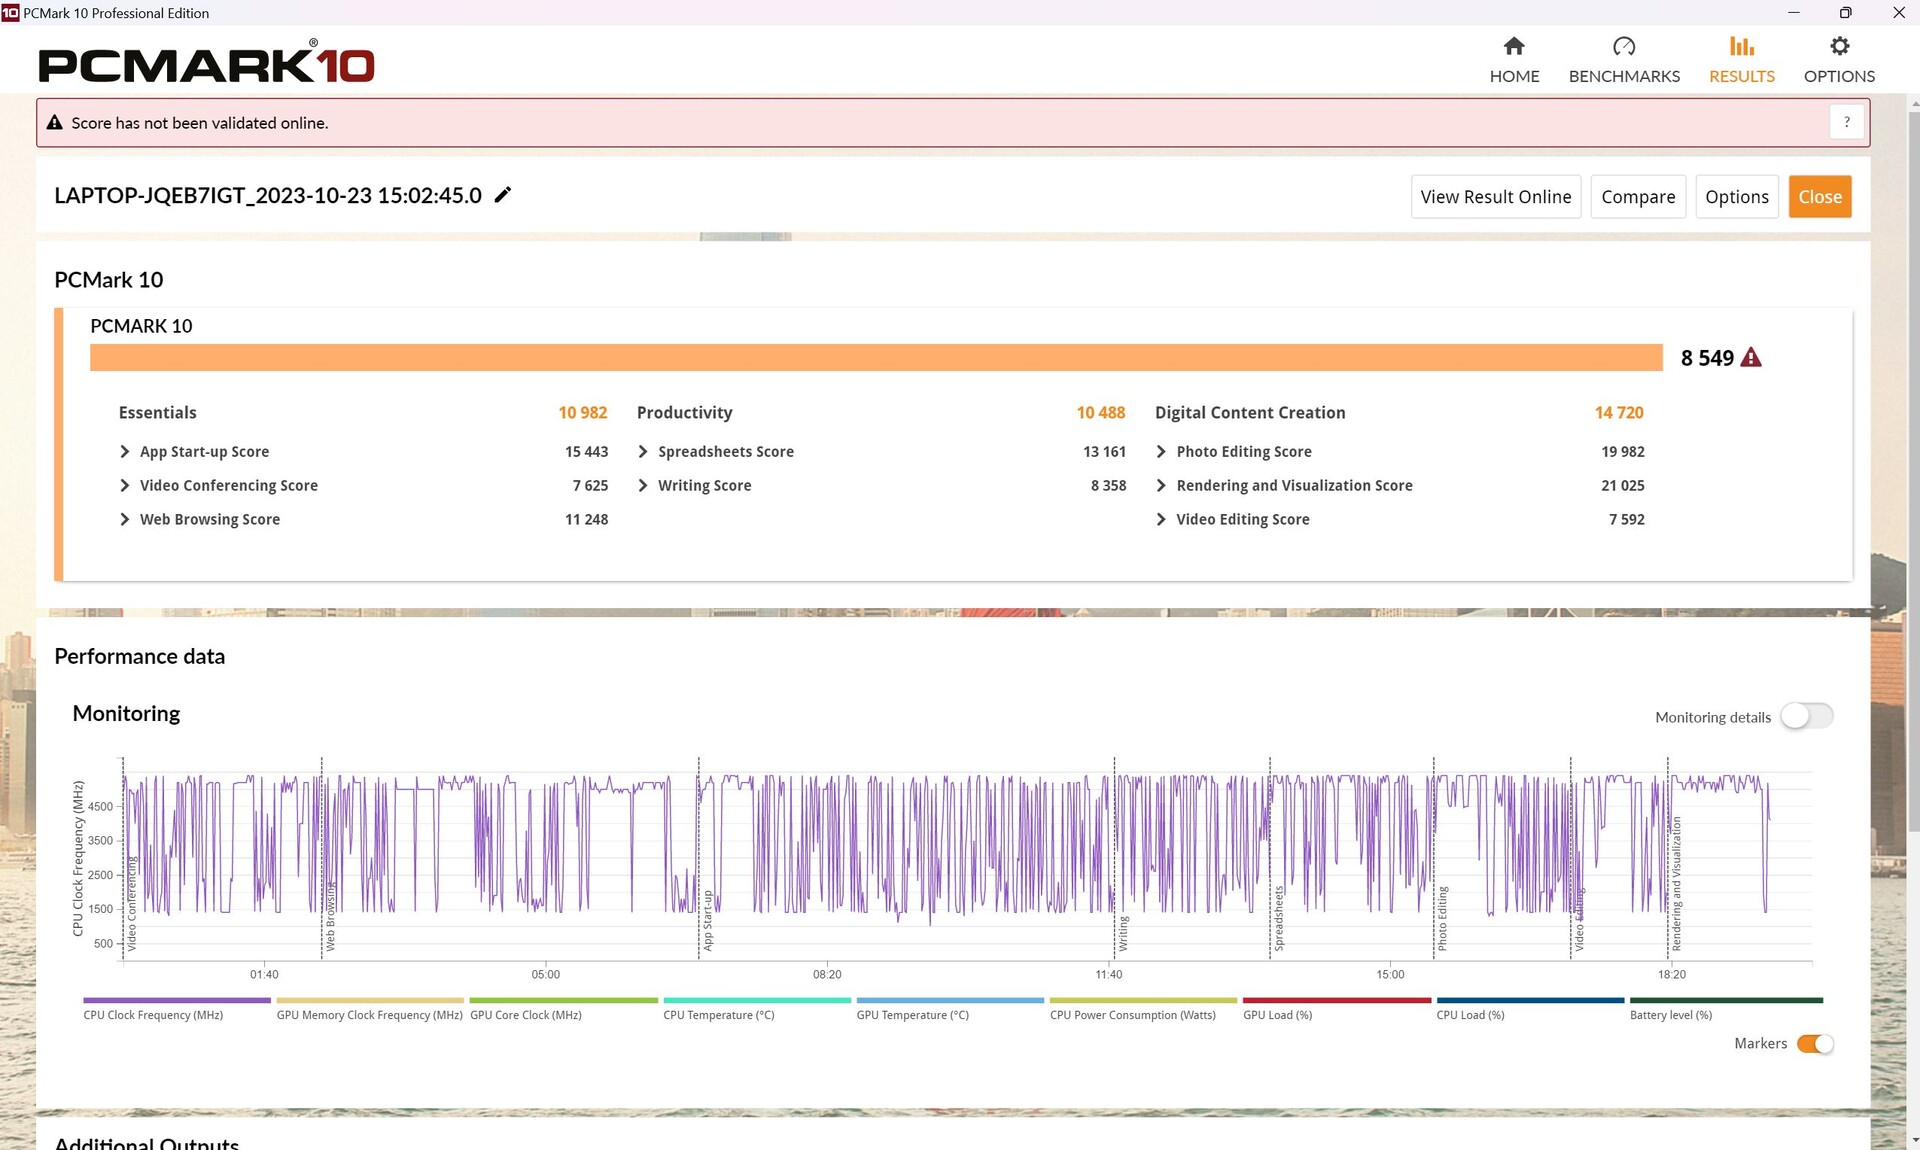
| PCMark 10 / Score | |
| MSI GE78HX 13VH-070US | |
| Alienware m18 R1 | |
| Acer Predator Helios 18 N23Q2 | |
| Media della classe Gaming (5828 - 11574, n=95, ultimi 2 anni) | |
| Media Intel Core i9-13900HX, NVIDIA GeForce RTX 4080 Laptop GPU (7609 - 8549, n=3) | |
| Razer Blade 18 RTX 4070 | |
| HP Omen 17-ck2097ng | |
| Asus ROG Strix G18 G814JI | |
| PCMark 10 / Essentials | |
| HP Omen 17-ck2097ng | |
| Razer Blade 18 RTX 4070 | |
| Media Intel Core i9-13900HX, NVIDIA GeForce RTX 4080 Laptop GPU (10982 - 11824, n=3) | |
| MSI GE78HX 13VH-070US | |
| Alienware m18 R1 | |
| Acer Predator Helios 18 N23Q2 | |
| Media della classe Gaming (8810 - 12600, n=99, ultimi 2 anni) | |
| Asus ROG Strix G18 G814JI | |
| PCMark 10 / Productivity | |
| Media della classe Gaming (6845 - 21327, n=97, ultimi 2 anni) | |
| Acer Predator Helios 18 N23Q2 | |
| MSI GE78HX 13VH-070US | |
| Media Intel Core i9-13900HX, NVIDIA GeForce RTX 4080 Laptop GPU (9976 - 10788, n=3) | |
| Alienware m18 R1 | |
| HP Omen 17-ck2097ng | |
| Razer Blade 18 RTX 4070 | |
| Asus ROG Strix G18 G814JI | |
| PCMark 10 / Digital Content Creation | |
| Alienware m18 R1 | |
| MSI GE78HX 13VH-070US | |
| Acer Predator Helios 18 N23Q2 | |
| Media della classe Gaming (7602 - 19657, n=97, ultimi 2 anni) | |
| Media Intel Core i9-13900HX, NVIDIA GeForce RTX 4080 Laptop GPU (10135 - 14720, n=3) | |
| Razer Blade 18 RTX 4070 | |
| HP Omen 17-ck2097ng | |
| Asus ROG Strix G18 G814JI | |
| CrossMark / Overall | |
| Acer Predator Helios 18 N23Q2 | |
| Alienware m18 R1 | |
| Razer Blade 18 RTX 4070 | |
| Media Intel Core i9-13900HX, NVIDIA GeForce RTX 4080 Laptop GPU (1991 - 2194, n=2) | |
| HP Omen 17-ck2097ng | |
| Media della classe Gaming (1366 - 2409, n=96, ultimi 2 anni) | |
| MSI GE78HX 13VH-070US | |
| CrossMark / Productivity | |
| Acer Predator Helios 18 N23Q2 | |
| Alienware m18 R1 | |
| Razer Blade 18 RTX 4070 | |
| Media Intel Core i9-13900HX, NVIDIA GeForce RTX 4080 Laptop GPU (1828 - 2059, n=2) | |
| Media della classe Gaming (1386 - 2254, n=96, ultimi 2 anni) | |
| MSI GE78HX 13VH-070US | |
| HP Omen 17-ck2097ng | |
| CrossMark / Creativity | |
| Alienware m18 R1 | |
| Acer Predator Helios 18 N23Q2 | |
| Razer Blade 18 RTX 4070 | |
| Media Intel Core i9-13900HX, NVIDIA GeForce RTX 4080 Laptop GPU (2239 - 2411, n=2) | |
| HP Omen 17-ck2097ng | |
| Media della classe Gaming (1343 - 2729, n=96, ultimi 2 anni) | |
| MSI GE78HX 13VH-070US | |
| CrossMark / Responsiveness | |
| Acer Predator Helios 18 N23Q2 | |
| Alienware m18 R1 | |
| Media Intel Core i9-13900HX, NVIDIA GeForce RTX 4080 Laptop GPU (1808 - 1998, n=2) | |
| Razer Blade 18 RTX 4070 | |
| HP Omen 17-ck2097ng | |
| Media della classe Gaming (1226 - 2334, n=96, ultimi 2 anni) | |
| MSI GE78HX 13VH-070US | |
| PCMark 10 Score | 8549 punti | |
Aiuto | ||
| AIDA64 / Memory Copy | |
| Alienware m18 R1 | |
| Acer Predator Helios 18 N23Q2 | |
| HP Omen 17-ck2097ng | |
| MSI GE78HX 13VH-070US | |
| Razer Blade 18 RTX 4070 | |
| Media Intel Core i9-13900HX (67716 - 79193, n=22) | |
| Media della classe Gaming (21750 - 129946, n=107, ultimi 2 anni) | |
| Asus ROG Strix G18 G814JI | |
| AIDA64 / Memory Read | |
| Alienware m18 R1 | |
| Acer Predator Helios 18 N23Q2 | |
| HP Omen 17-ck2097ng | |
| Razer Blade 18 RTX 4070 | |
| MSI GE78HX 13VH-070US | |
| Media Intel Core i9-13900HX (73998 - 88462, n=22) | |
| Media della classe Gaming (22956 - 118858, n=107, ultimi 2 anni) | |
| Asus ROG Strix G18 G814JI | |
| AIDA64 / Memory Write | |
| Alienware m18 R1 | |
| HP Omen 17-ck2097ng | |
| MSI GE78HX 13VH-070US | |
| Media della classe Gaming (22297 - 135096, n=107, ultimi 2 anni) | |
| Razer Blade 18 RTX 4070 | |
| Acer Predator Helios 18 N23Q2 | |
| Media Intel Core i9-13900HX (65472 - 77045, n=22) | |
| Asus ROG Strix G18 G814JI | |
| AIDA64 / Memory Latency | |
| Media della classe Gaming (75.3 - 259, n=107, ultimi 2 anni) | |
| Media Intel Core i9-13900HX (75.3 - 91.1, n=22) | |
| HP Omen 17-ck2097ng | |
| Razer Blade 18 RTX 4070 | |
| MSI GE78HX 13VH-070US | |
| Asus ROG Strix G18 G814JI | |
| Acer Predator Helios 18 N23Q2 | |
| Alienware m18 R1 | |
* ... Meglio usare valori piccoli
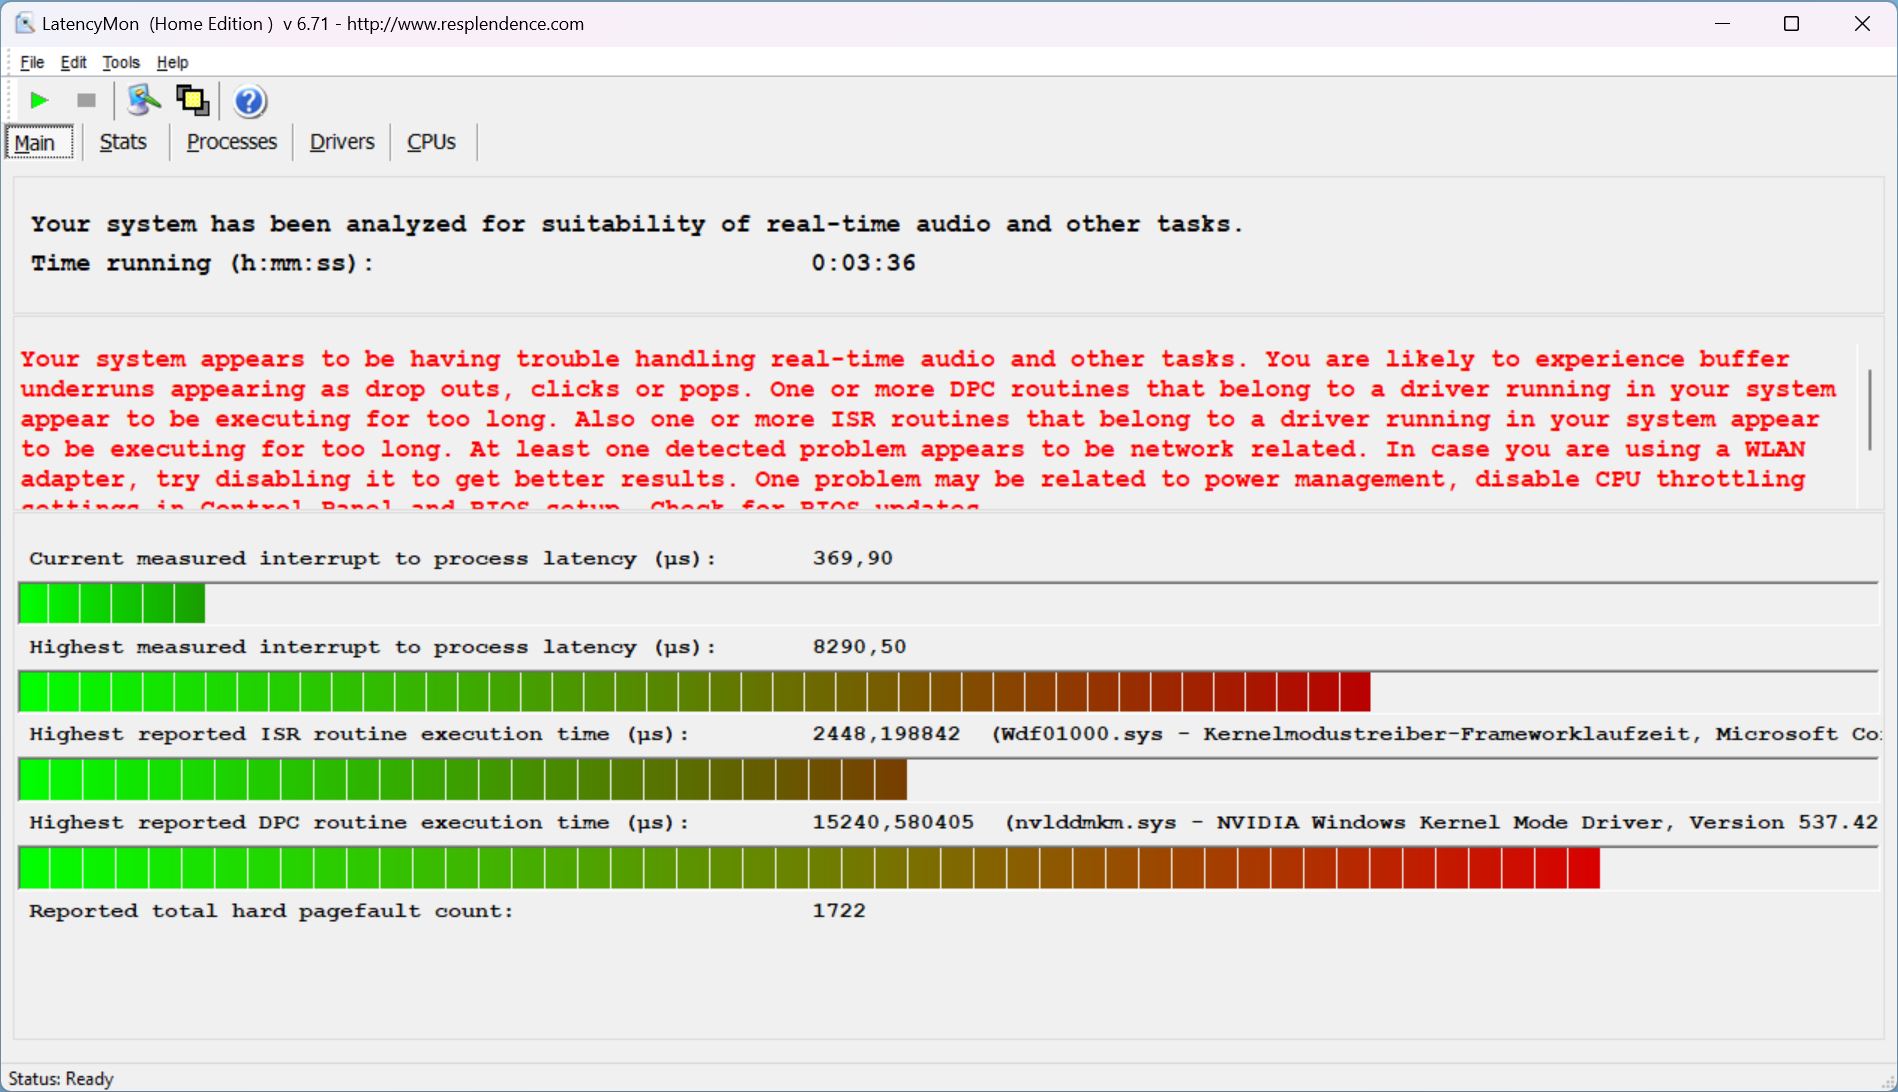
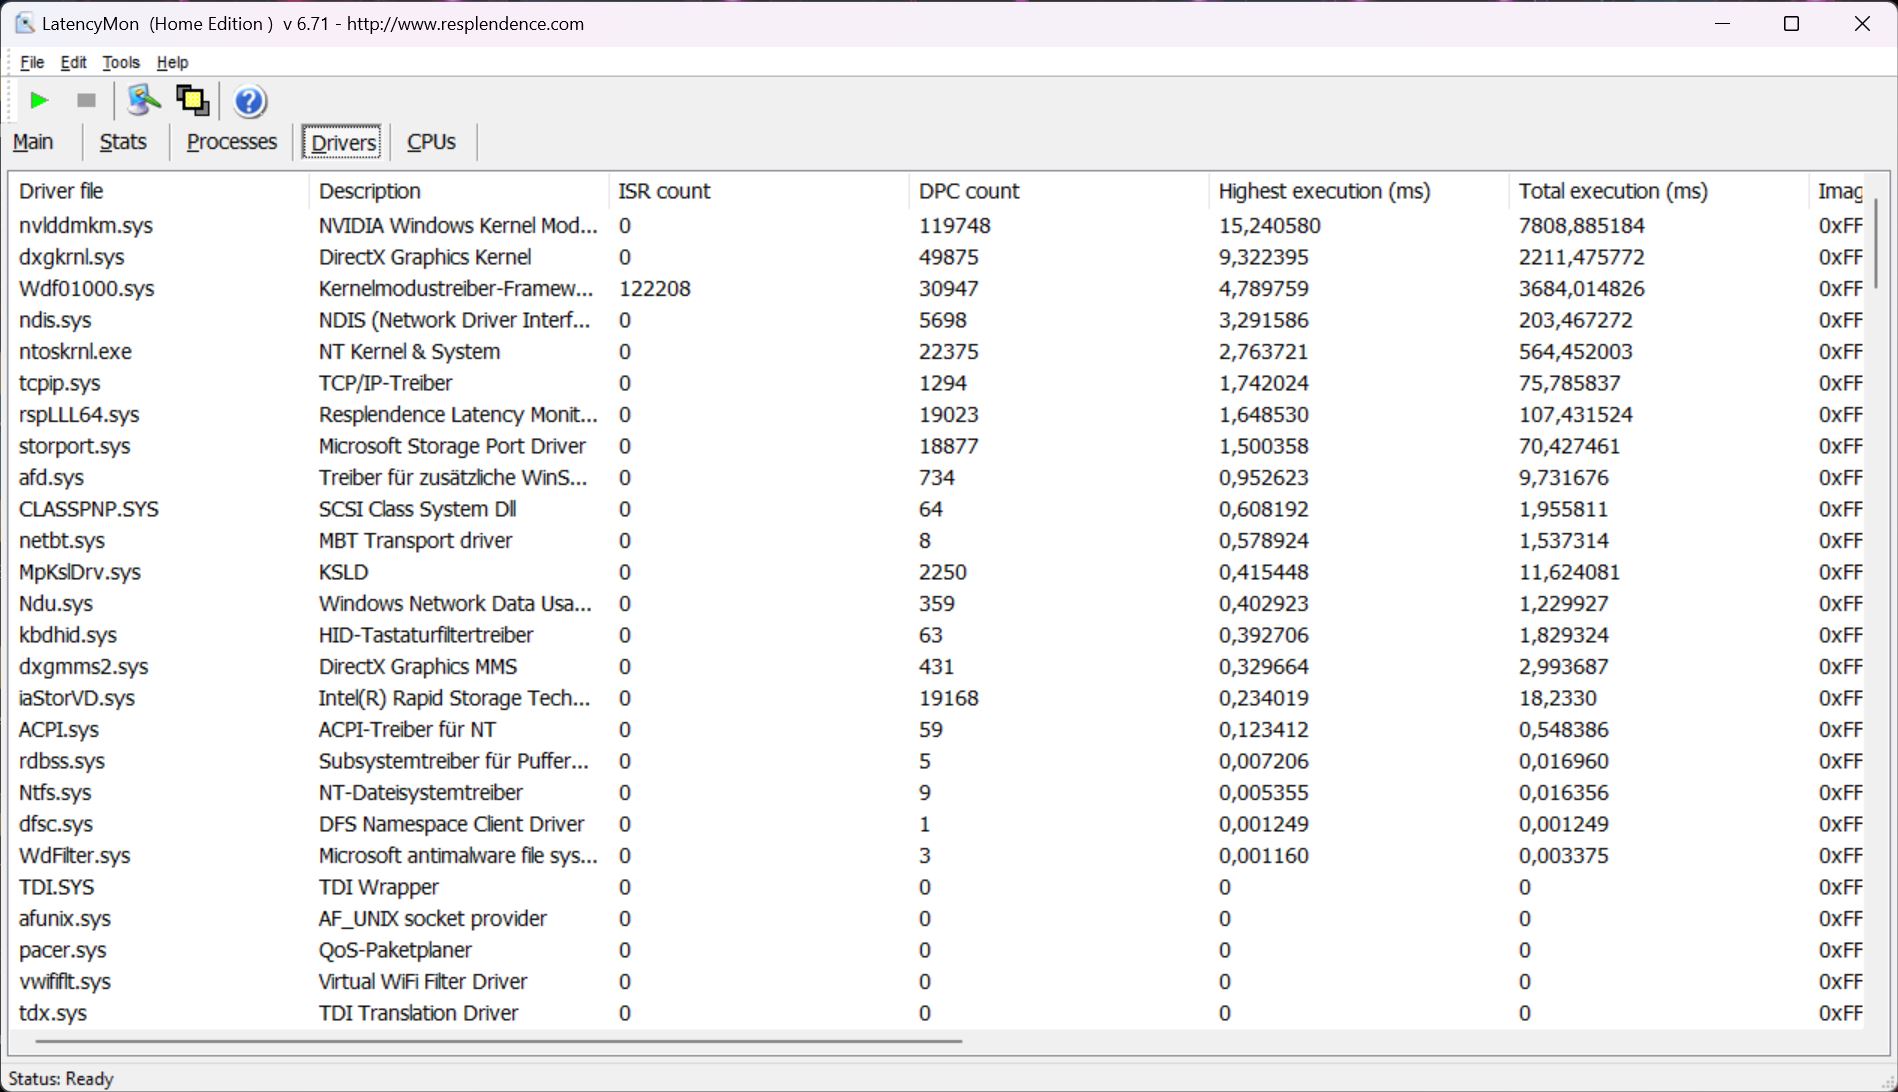
Latenza DPC
Nello stato attuale del driver, il portatile ha problemi di latenza acuti, come rivela LatencyMon. In modalità Bilanciata , si verificano ritardi quando si apre il browser o si sposta una finestra del desktop. Questi aumentano quando si aprono più schede del browser sul nostro sito web, e anche la riproduzione di un video YouTube a 4K/60 fps comporta ben 18 fotogrammi saltati. Acer deve migliorare il driver in questo caso. Tuttavia, anche i computer portatili rivali presentano problemi simili.
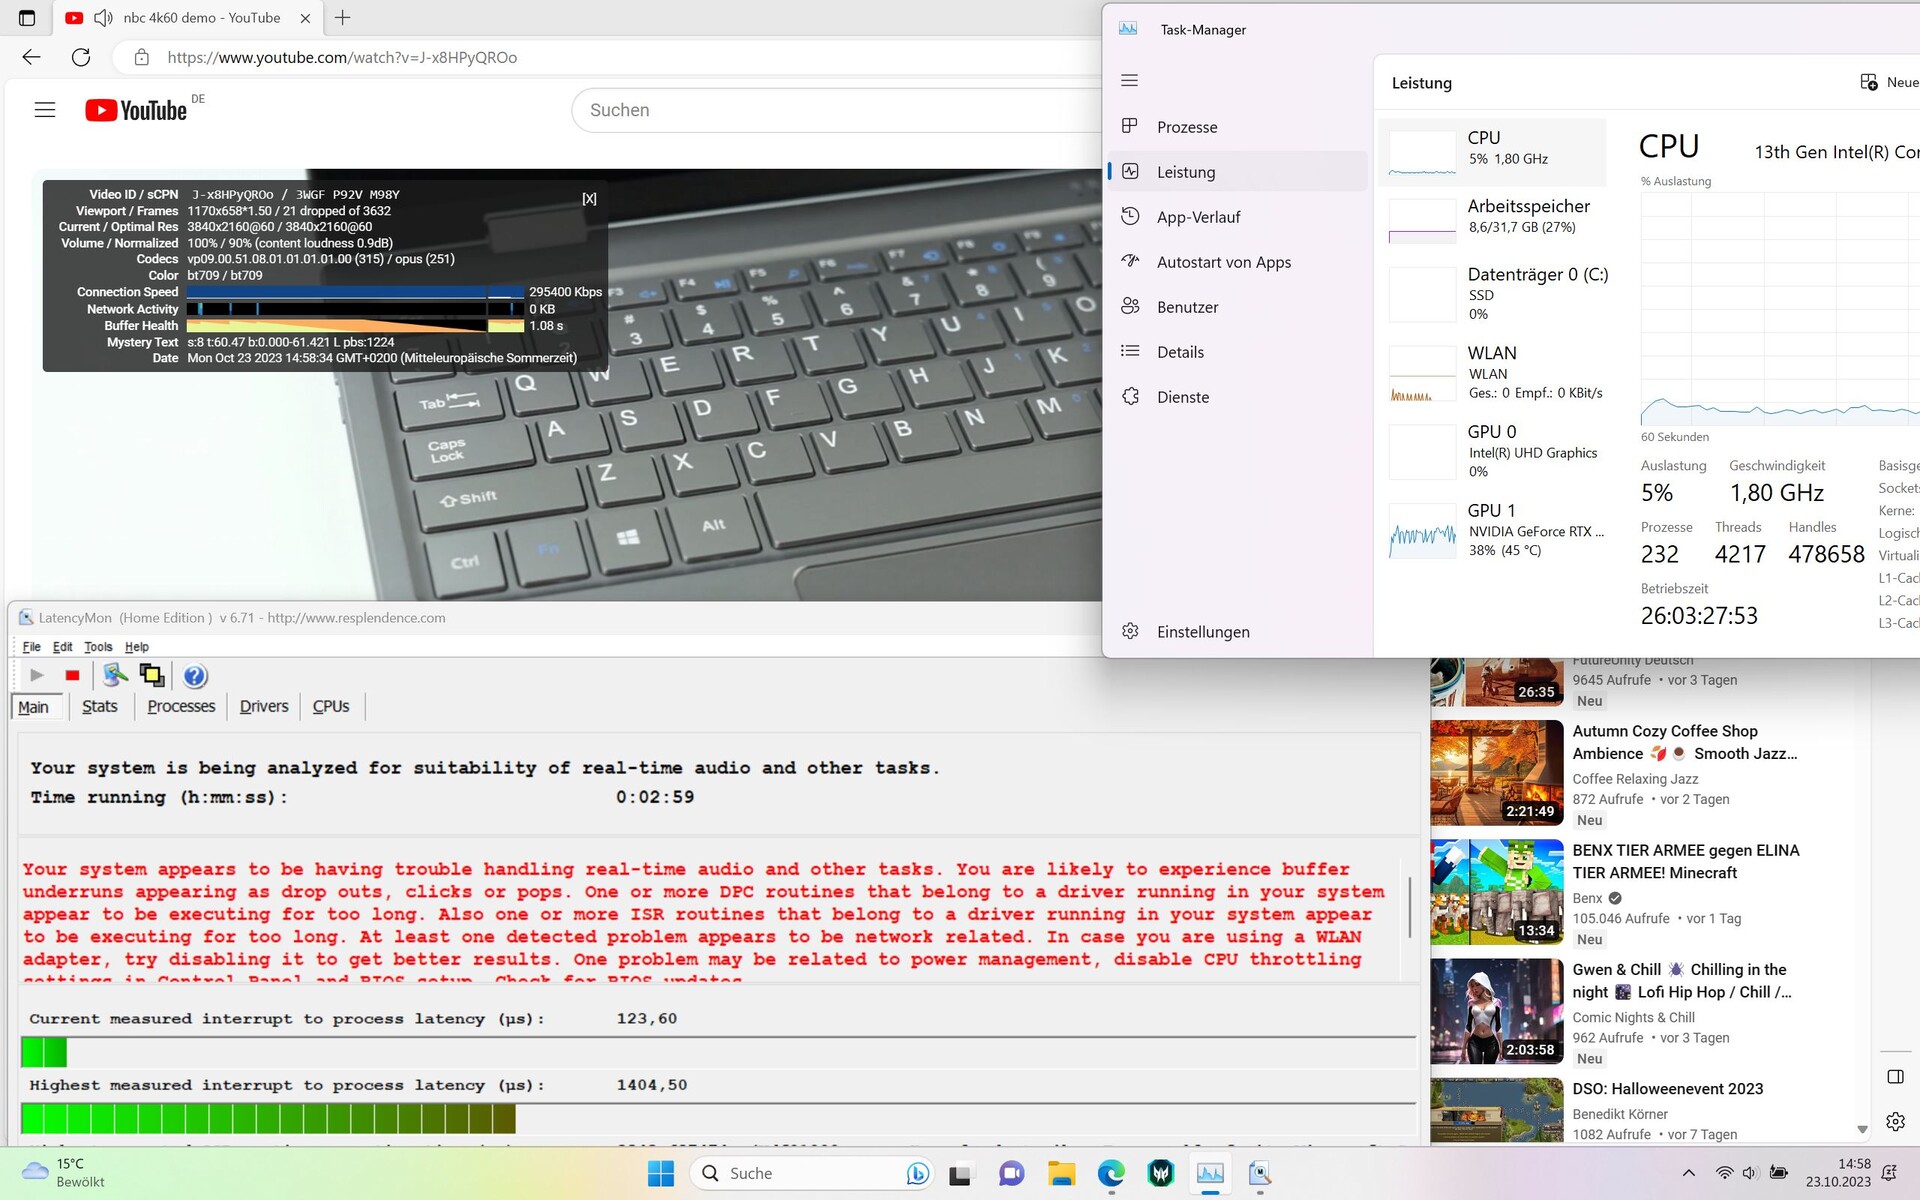
| DPC Latencies / LatencyMon - interrupt to process latency (max), Web, Youtube, Prime95 | |
| Acer Predator Helios 18 N23Q2 | |
| MSI GE78HX 13VH-070US | |
| Alienware m18 R1 | |
| HP Omen 17-ck2097ng | |
| Razer Blade 18 RTX 4070 | |
| Asus ROG Strix G18 G814JI | |
* ... Meglio usare valori piccoli
Dispositivi di archiviazione
Helios 18 è equipaggiato con il Samsung PM9A1, uno degli SSD più veloci nella nostraElenco dei migliori SSDsfortunatamente, questo non si comporta bene nel Predator e le sue prestazioni vengono strozzate molto rapidamente, come mostra il nostro grafico qui sotto. Abbiamo ripetuto lo stesso test in seguito e abbiamo ottenuto lo stesso risultato, perché siamo rimasti sorpresi dal rapido e forte calo. Un comportamento simile di throttling dell'SSD è stato osservato anche nella recensione precedente di Predator Helios 16.

* ... Meglio usare valori piccoli
Sustained Read Performance: DiskSpd Read Loop, Queue Depth 8
Grafikkarte
La RTX 4080è una GPU di fascia alta che è stata introdotta all'inizio del 2023. In Helios 18, può assorbire un massimo di 175 W, incluso Dynamic Boost.
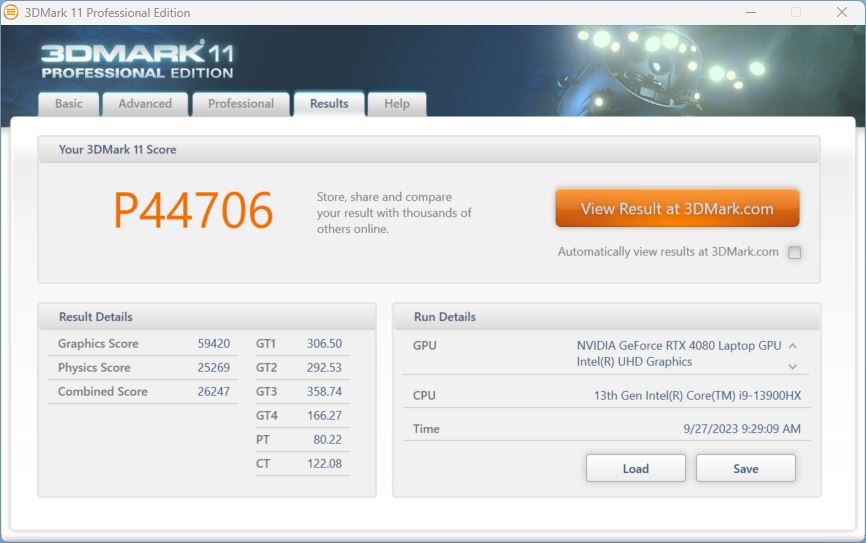
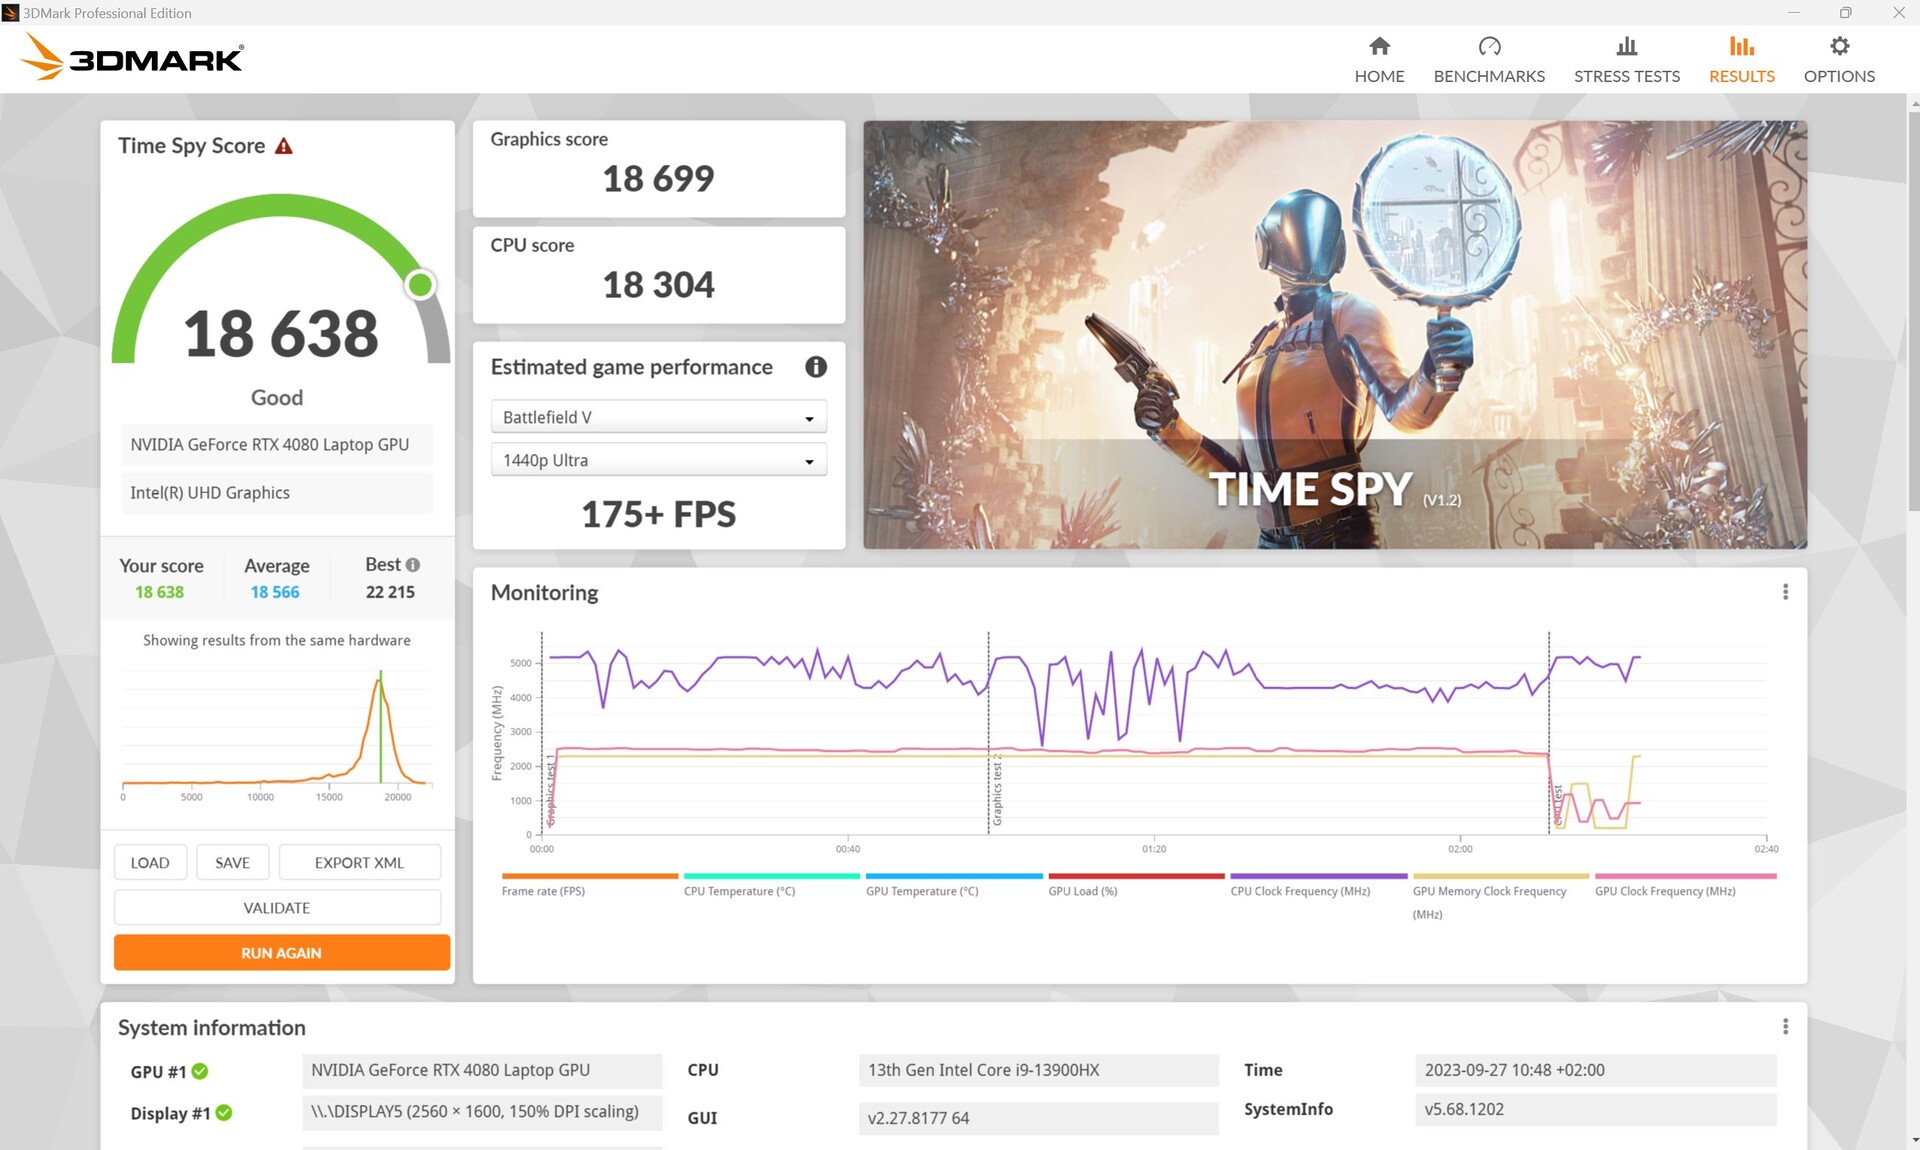
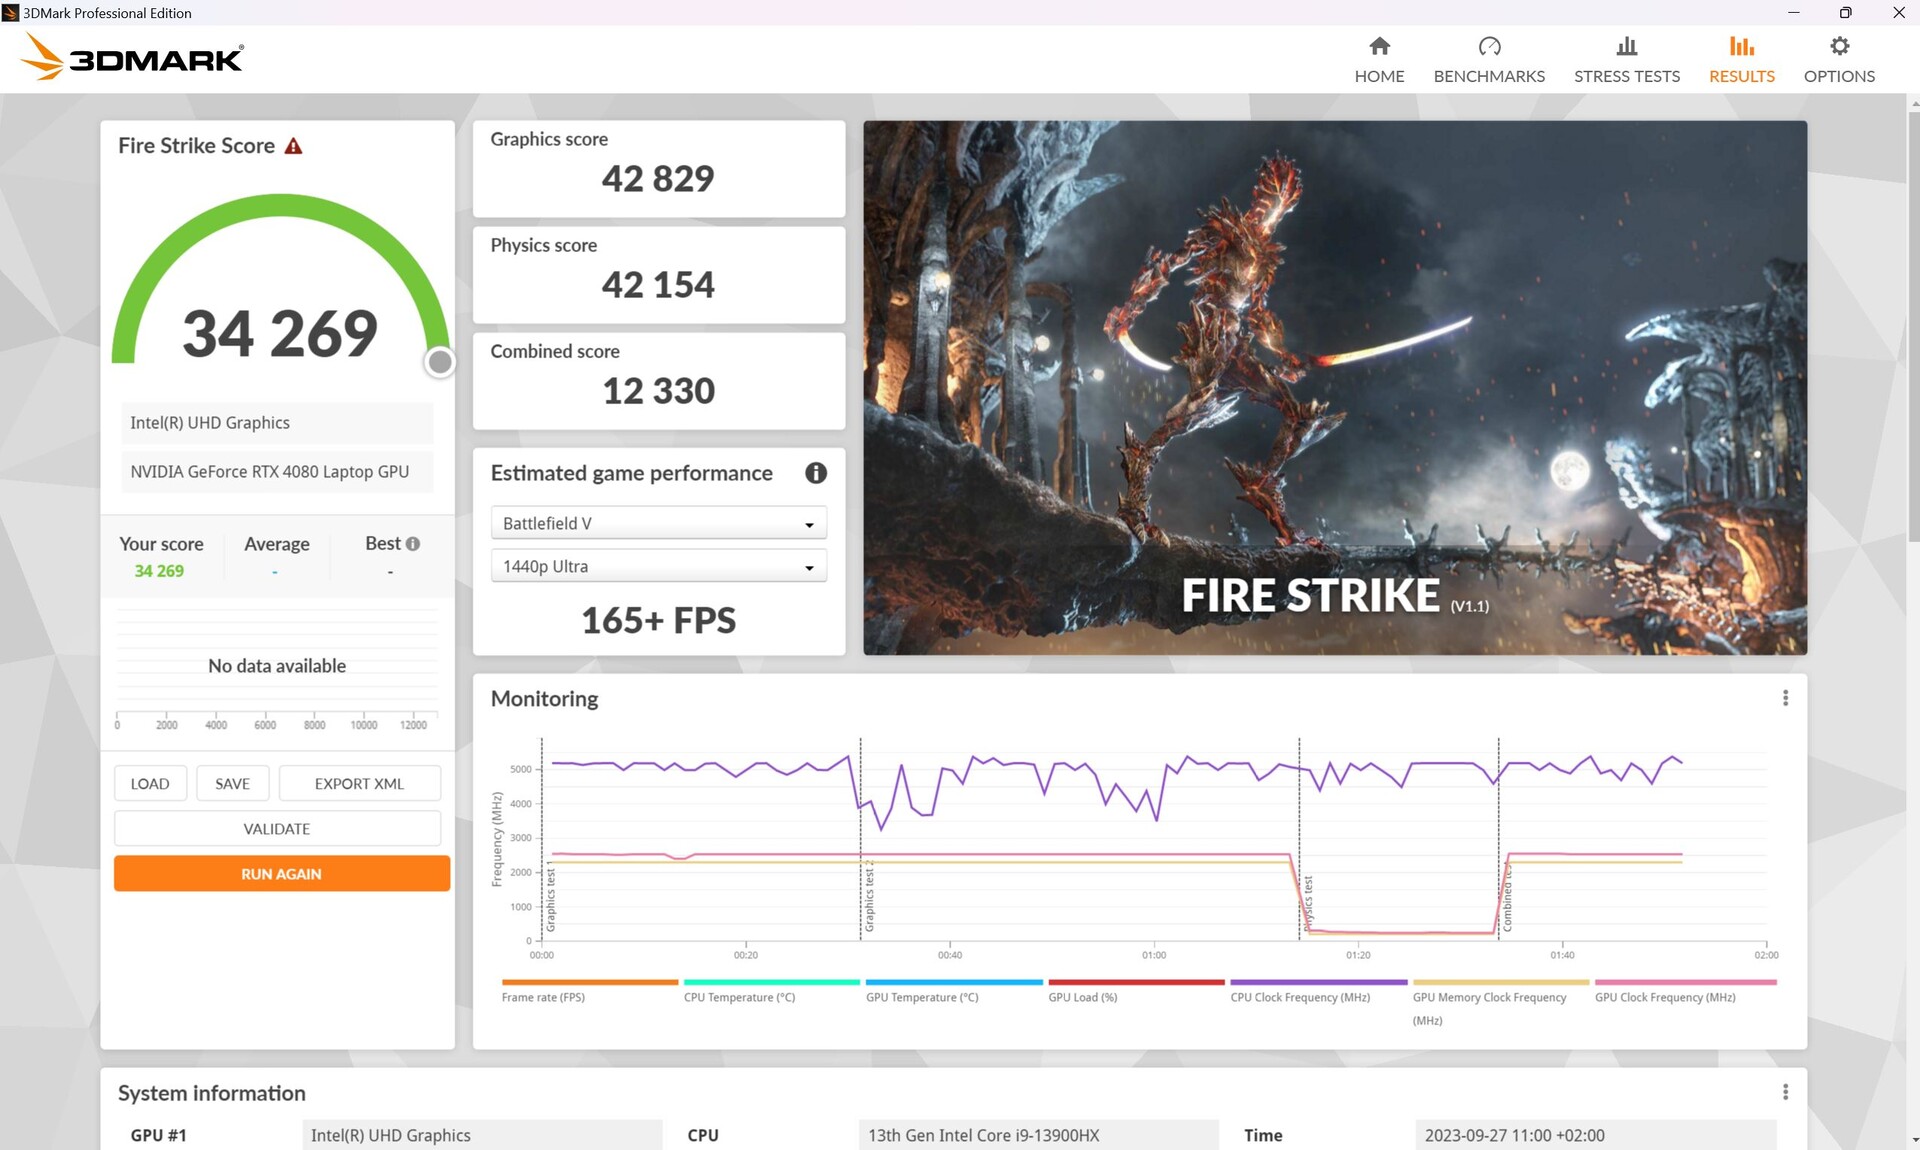
Nei test sintetici di 3DMark, Helios supera di poco la GPU MSI GE78HXcon la stessa GPU per la prima volta. Le prestazioni della RTX 4080 sono superiori di circa il 10% rispetto alla media di tutti i laptop con la stessa GPU nel nostro database.
Lontano dal socket, il Predator riesce comunque a ottenere 6.897 punti grafici in Fire Strike, un calo dell'84%!
| 3DMark Performance rating - Percent | |
| Alienware m18 R1 -1! | |
| Acer Predator Helios 18 N23Q2 | |
| MSI GE78HX 13VH-070US -1! | |
| Media NVIDIA GeForce RTX 4080 Laptop GPU | |
| HP Omen 17-ck2097ng | |
| Media della classe Gaming | |
| Asus ROG Strix G18 G814JI | |
| Razer Blade 18 RTX 4070 -1! | |
| 3DMark 11 Performance | 44706 punti | |
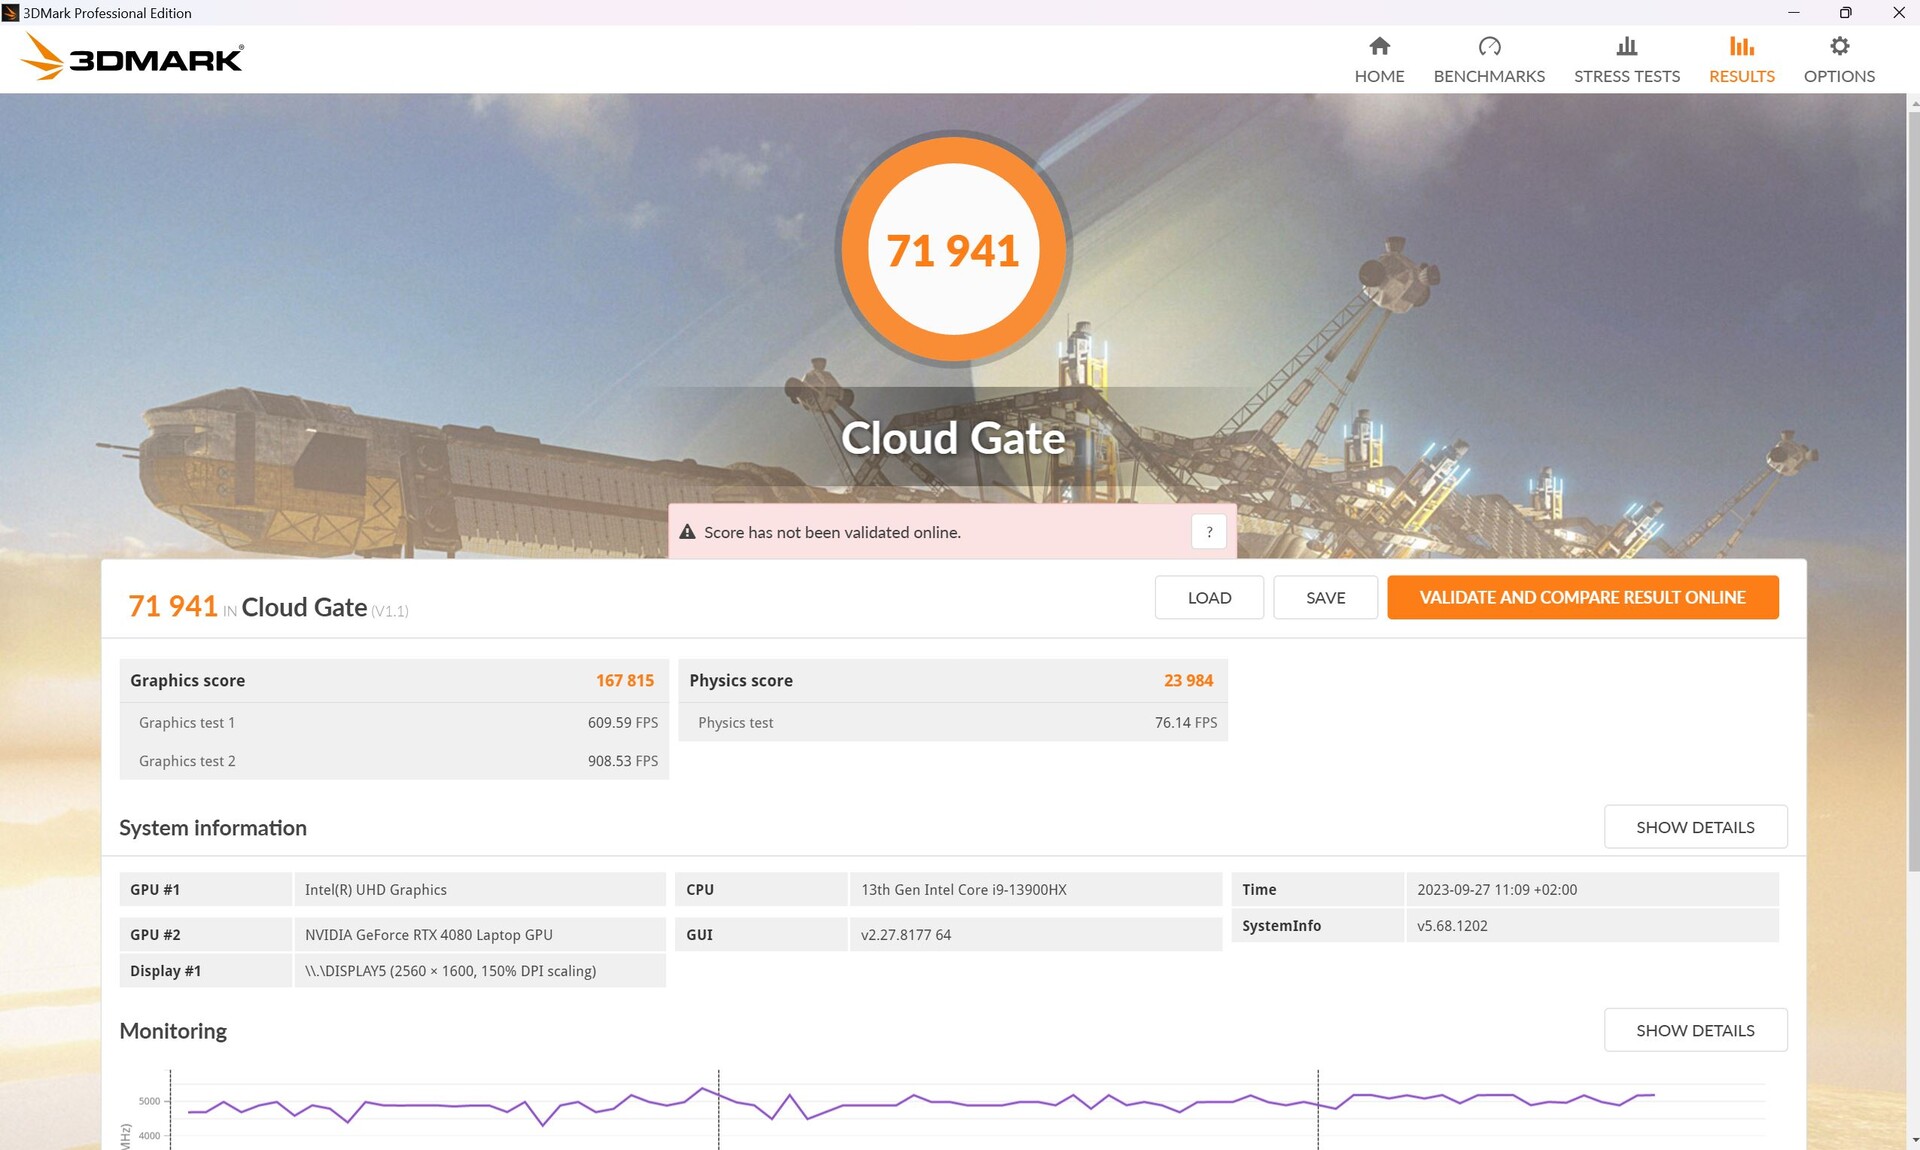
| 3DMark Cloud Gate Standard Score | 71941 punti | |
| 3DMark Fire Strike Score | 34269 punti | |
| 3DMark Time Spy Score | 18638 punti | |
Aiuto | ||
* ... Meglio usare valori piccoli
Prestazioni di gioco
Helios 18 supera di poco anche il modelloMSI GE78HX nei giochi, ma in definitiva entrambi sono alla pari. Alienware m18 R1 con la sua RTX 4090 è circa il 7% più veloce; la differenza è maggiore in Witcher 3 con un +22%, e il nostro Predator è addirittura in testa in GTA V.
| Performance rating - Percent | |
| Alienware m18 R1 | |
| Acer Predator Helios 18 N23Q2 | |
| HP Omen 17-ck2097ng | |
| Media della classe Gaming | |
| MSI GE78HX 13VH-070US | |
| Razer Blade 18 RTX 4070 | |
| Asus ROG Strix G18 G814JI | |
| The Witcher 3 - 1920x1080 Ultra Graphics & Postprocessing (HBAO+) | |
| Alienware m18 R1 | |
| Media della classe Gaming (95 - 240, n=7, ultimi 2 anni) | |
| MSI GE78HX 13VH-070US | |
| Acer Predator Helios 18 N23Q2 | |
| HP Omen 17-ck2097ng | |
| Asus ROG Strix G18 G814JI | |
| Razer Blade 18 RTX 4070 | |
| GTA V - 1920x1080 Highest AA:4xMSAA + FX AF:16x | |
| Acer Predator Helios 18 N23Q2 | |
| Alienware m18 R1 | |
| Media della classe Gaming (48.3 - 186.9, n=97, ultimi 2 anni) | |
| Razer Blade 18 RTX 4070 | |
| HP Omen 17-ck2097ng | |
| Asus ROG Strix G18 G814JI | |
| MSI GE78HX 13VH-070US | |
| Final Fantasy XV Benchmark - 1920x1080 High Quality | |
| Alienware m18 R1 | |
| Acer Predator Helios 18 N23Q2 | |
| MSI GE78HX 13VH-070US | |
| Media della classe Gaming (41 - 215, n=98, ultimi 2 anni) | |
| HP Omen 17-ck2097ng | |
| Asus ROG Strix G18 G814JI | |
| Razer Blade 18 RTX 4070 | |
| Strange Brigade - 1920x1080 ultra AA:ultra AF:16 | |
| Alienware m18 R1 | |
| Acer Predator Helios 18 N23Q2 | |
| Media della classe Gaming (76.3 - 456, n=88, ultimi 2 anni) | |
| HP Omen 17-ck2097ng | |
| MSI GE78HX 13VH-070US | |
| Asus ROG Strix G18 G814JI | |
| Razer Blade 18 RTX 4070 | |
| Dota 2 Reborn - 1920x1080 ultra (3/3) best looking | |
| Alienware m18 R1 | |
| Acer Predator Helios 18 N23Q2 | |
| Razer Blade 18 RTX 4070 | |
| HP Omen 17-ck2097ng | |
| Asus ROG Strix G18 G814JI | |
| Media della classe Gaming (84.8 - 248, n=110, ultimi 2 anni) | |
| MSI GE78HX 13VH-070US | |
| The Witcher 3 | |
| 1920x1080 High Graphics & Postprocessing (Nvidia HairWorks Off) | |
| Alienware m18 R1 | |
| MSI GE78HX 13VH-070US | |
| Acer Predator Helios 18 N23Q2 | |
| Media NVIDIA GeForce RTX 4080 Laptop GPU (246 - 385, n=14) | |
| HP Omen 17-ck2097ng | |
| Media della classe Gaming (181 - 341, n=2, ultimi 2 anni) | |
| Razer Blade 18 RTX 4070 | |
| Asus ROG Strix G18 G814JI | |
| 1920x1080 Ultra Graphics & Postprocessing (HBAO+) | |
| Alienware m18 R1 | |
| Media della classe Gaming (95 - 240, n=7, ultimi 2 anni) | |
| MSI GE78HX 13VH-070US | |
| Acer Predator Helios 18 N23Q2 | |
| Media NVIDIA GeForce RTX 4080 Laptop GPU (130.4 - 186.1, n=20) | |
| HP Omen 17-ck2097ng | |
| Asus ROG Strix G18 G814JI | |
| Razer Blade 18 RTX 4070 | |
| Hogwarts Legacy | |
| 1920x1080 Ultra Preset AA:High T | |
| Media NVIDIA GeForce RTX 4080 Laptop GPU (108 - 131, n=3) | |
| Media della classe Gaming (n=1ultimi 2 anni) | |
| Acer Predator Helios 18 N23Q2 | |
| Asus ROG Strix G18 G814JI | |
| 2560x1440 Ultra Preset AA:High T | |
| Media della classe Gaming (n=1ultimi 2 anni) | |
| Media NVIDIA GeForce RTX 4080 Laptop GPU (76 - 102, n=3) | |
| Acer Predator Helios 18 N23Q2 | |
| Asus ROG Strix G18 G814JI | |
| 1920x1080 Ultra Preset + Full Ray Tracing AA:High T | |
| Acer Predator Helios 18 N23Q2 | |
| Media NVIDIA GeForce RTX 4080 Laptop GPU (53 - 66, n=2) | |
| Asus ROG Strix G18 G814JI | |
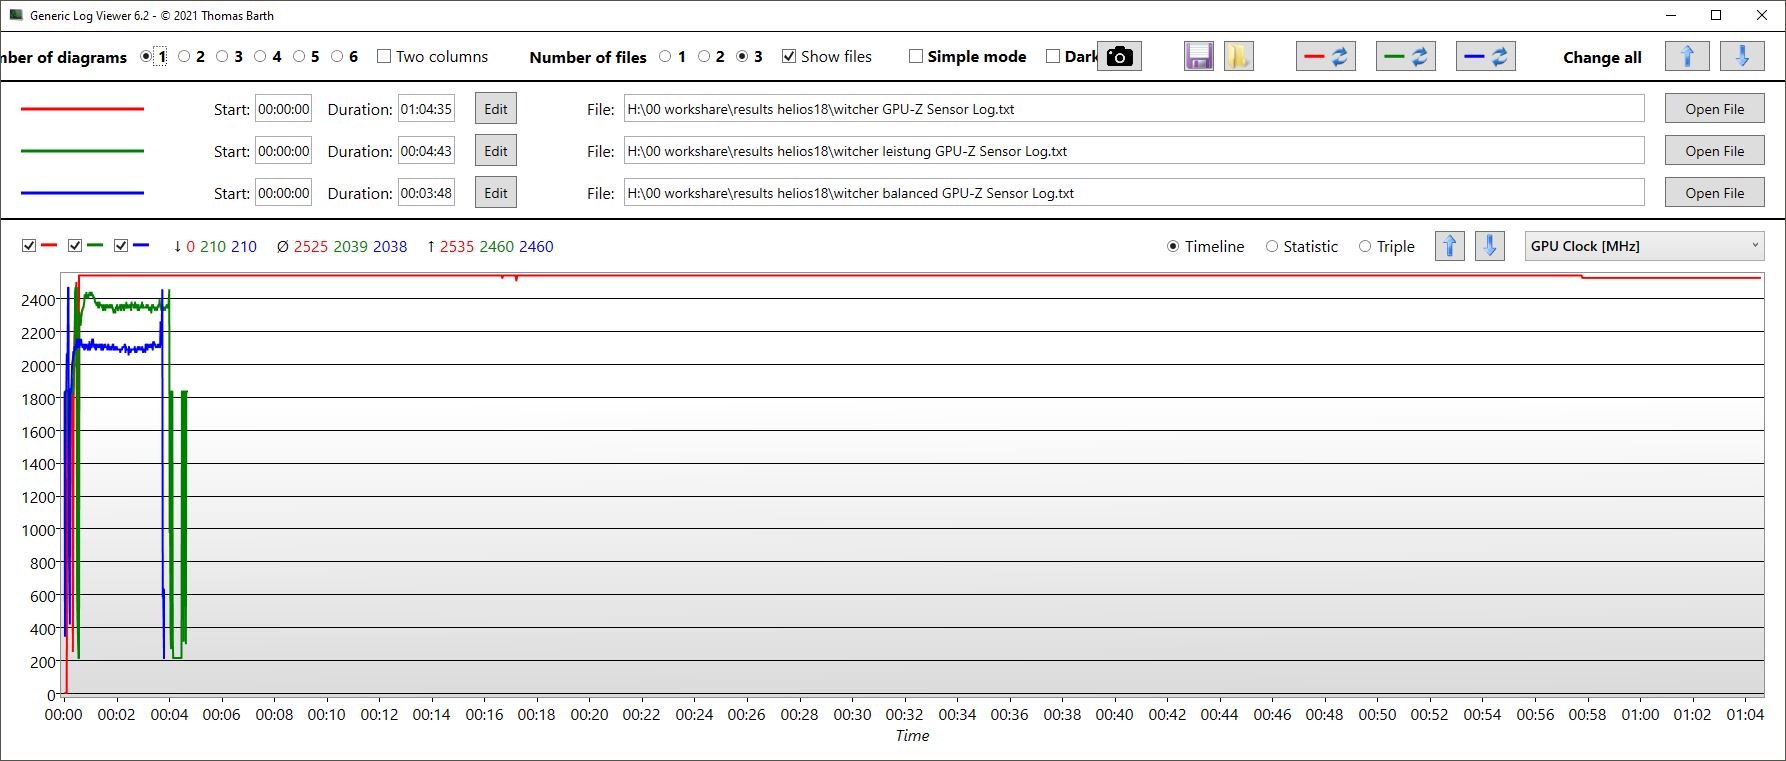
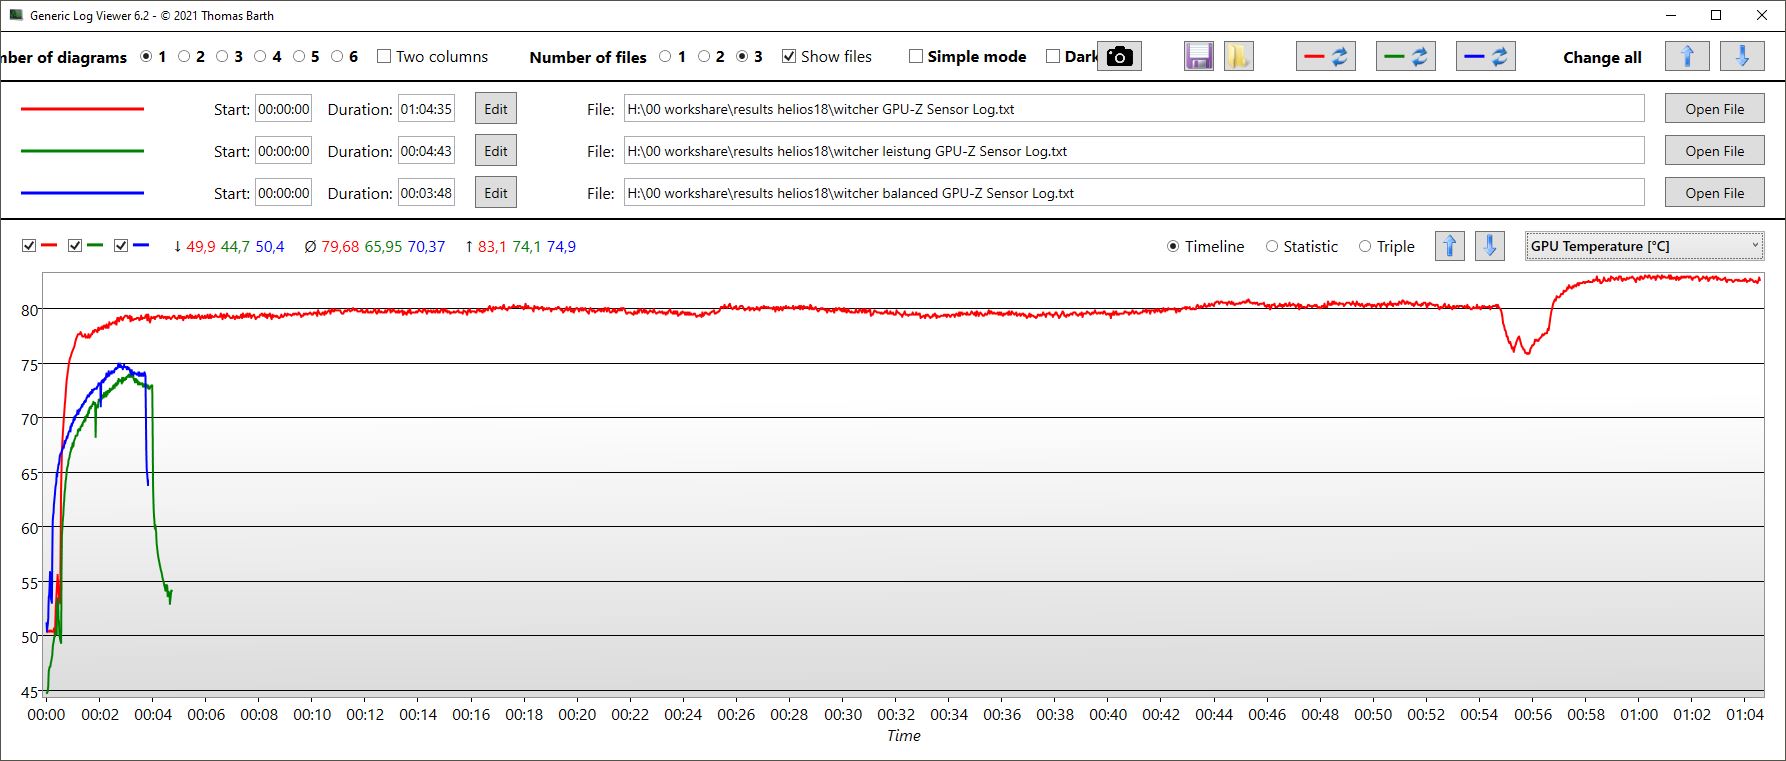
Nel corso di un'ora, la frequenza dei fotogrammi in Witcher 3 rimane abbastanza stabile; le leggere fluttuazioni sono dovute al tipico ciclo giorno/notte del gioco.
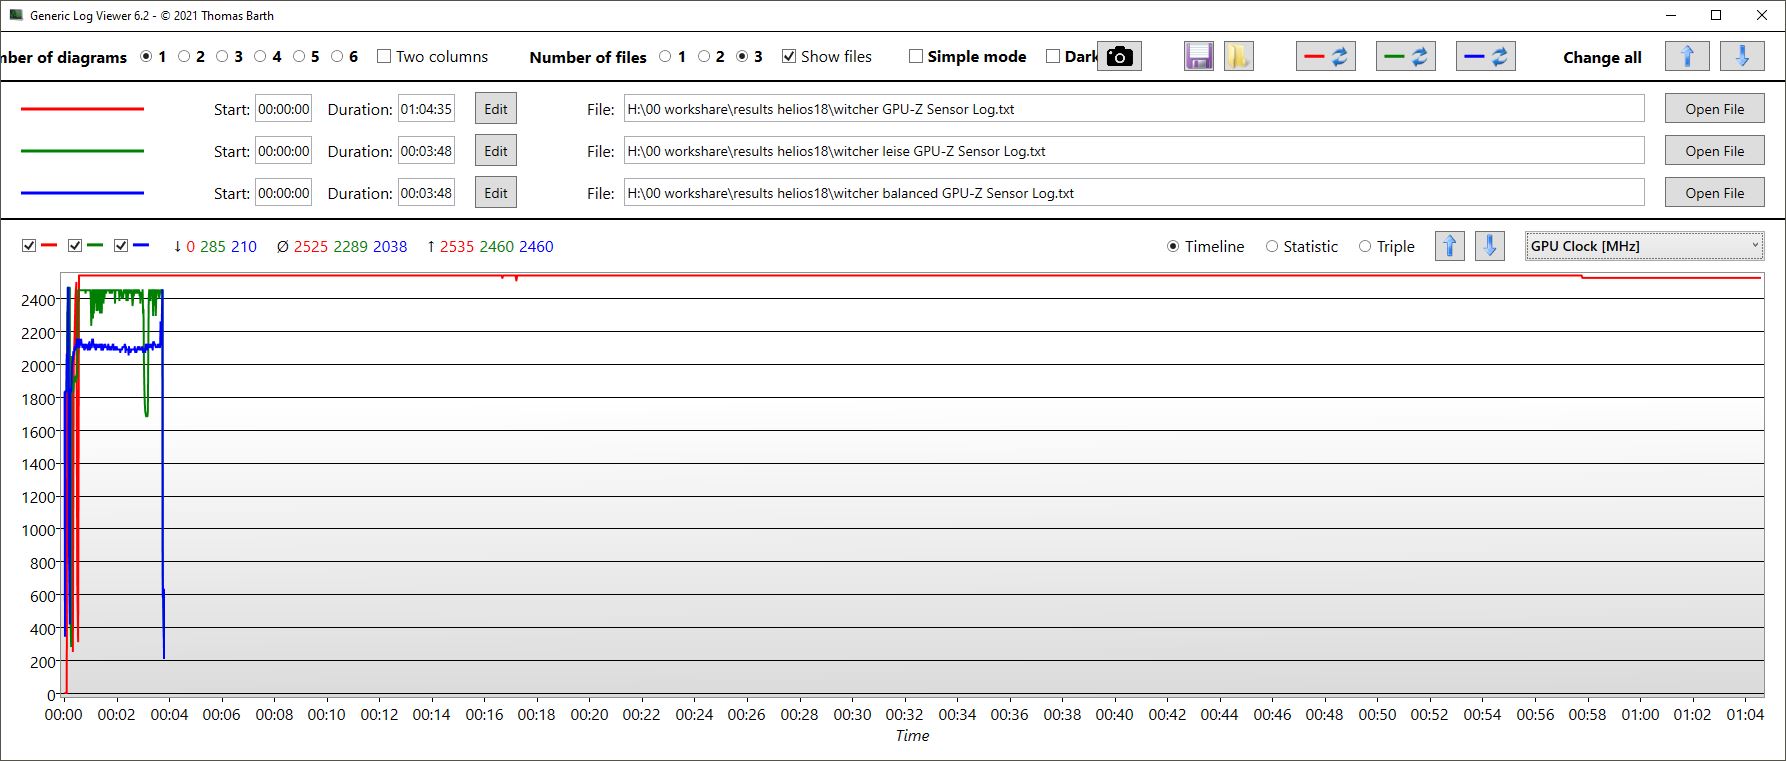
A differenza del benchmark della CPU, ora si nota una chiara differenza tra le modalità Bilanciata e Silenziosa durante il gioco. Quest'ultima, in linea con il suo nome, è molto silenziosa e consuma meno energia. Le tabelle relative a fps, consumo e volume delle singole modalità di prestazioni per Witcher 3 Ultra si trovano nelle seguenti sezioni Emissioni/Temperature.
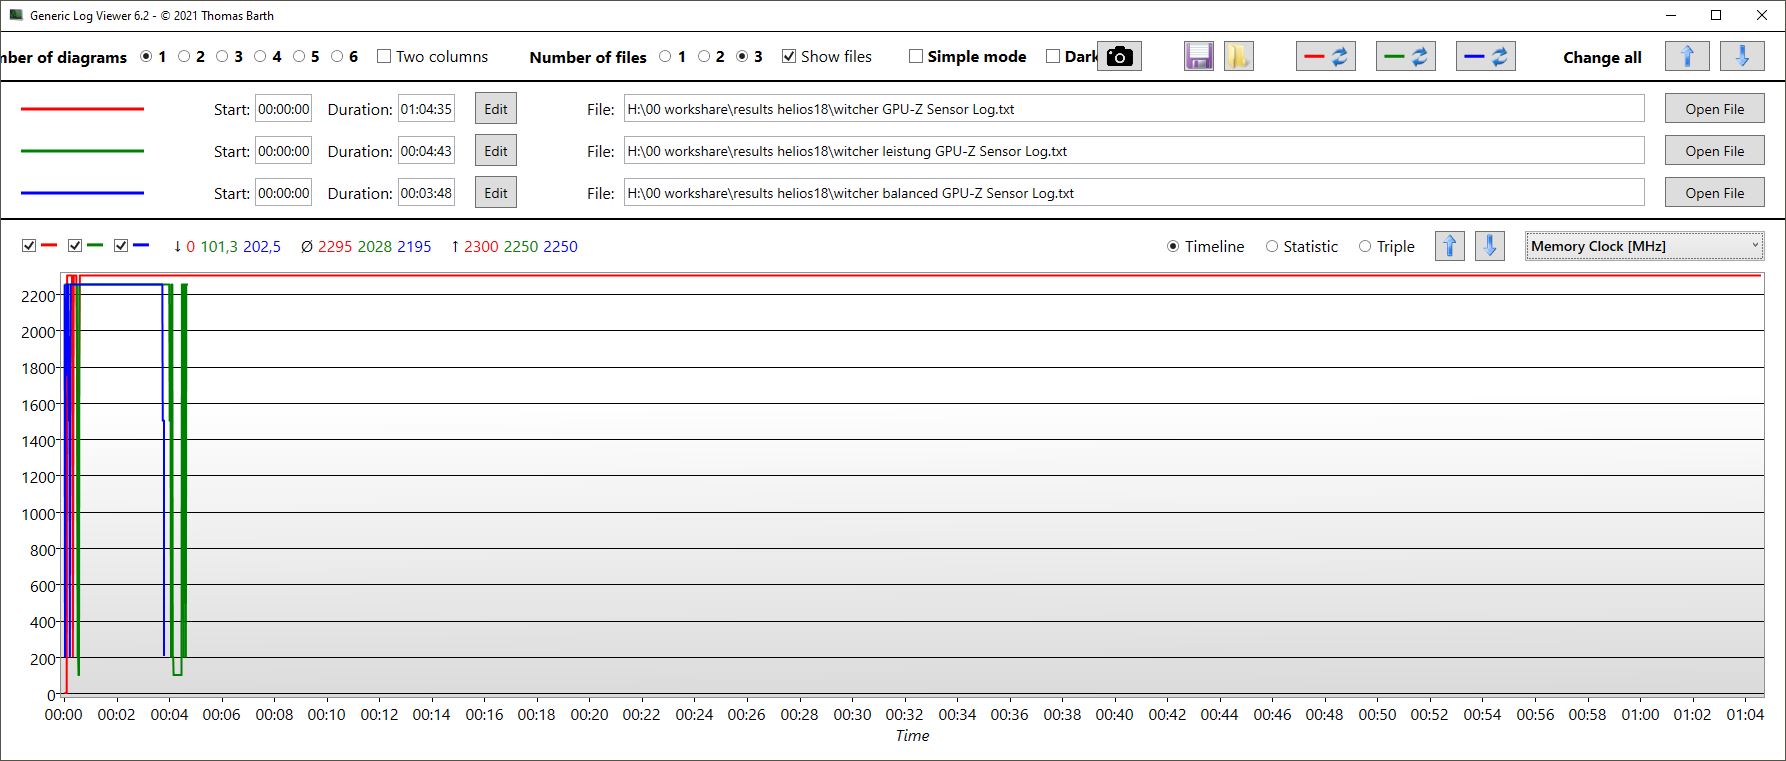
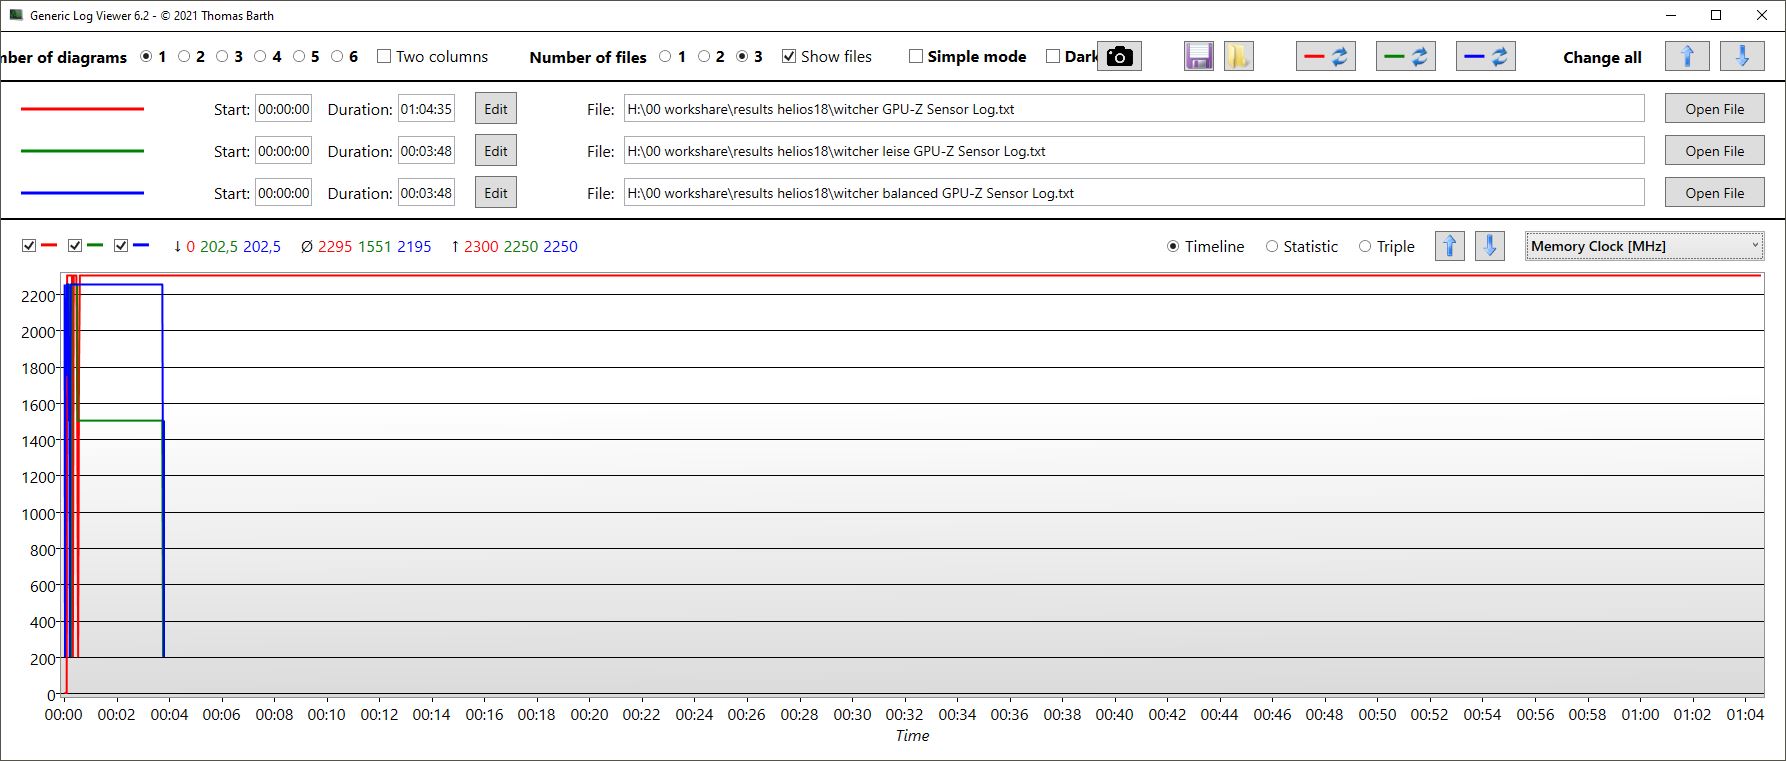
È interessante notare che la GPU ha un clock leggermente più alto in modalità Silenziosa rispetto a quella Bilanciata, ma il clock della memoria è significativamente più basso e anche il consumo energetico è inferiore.
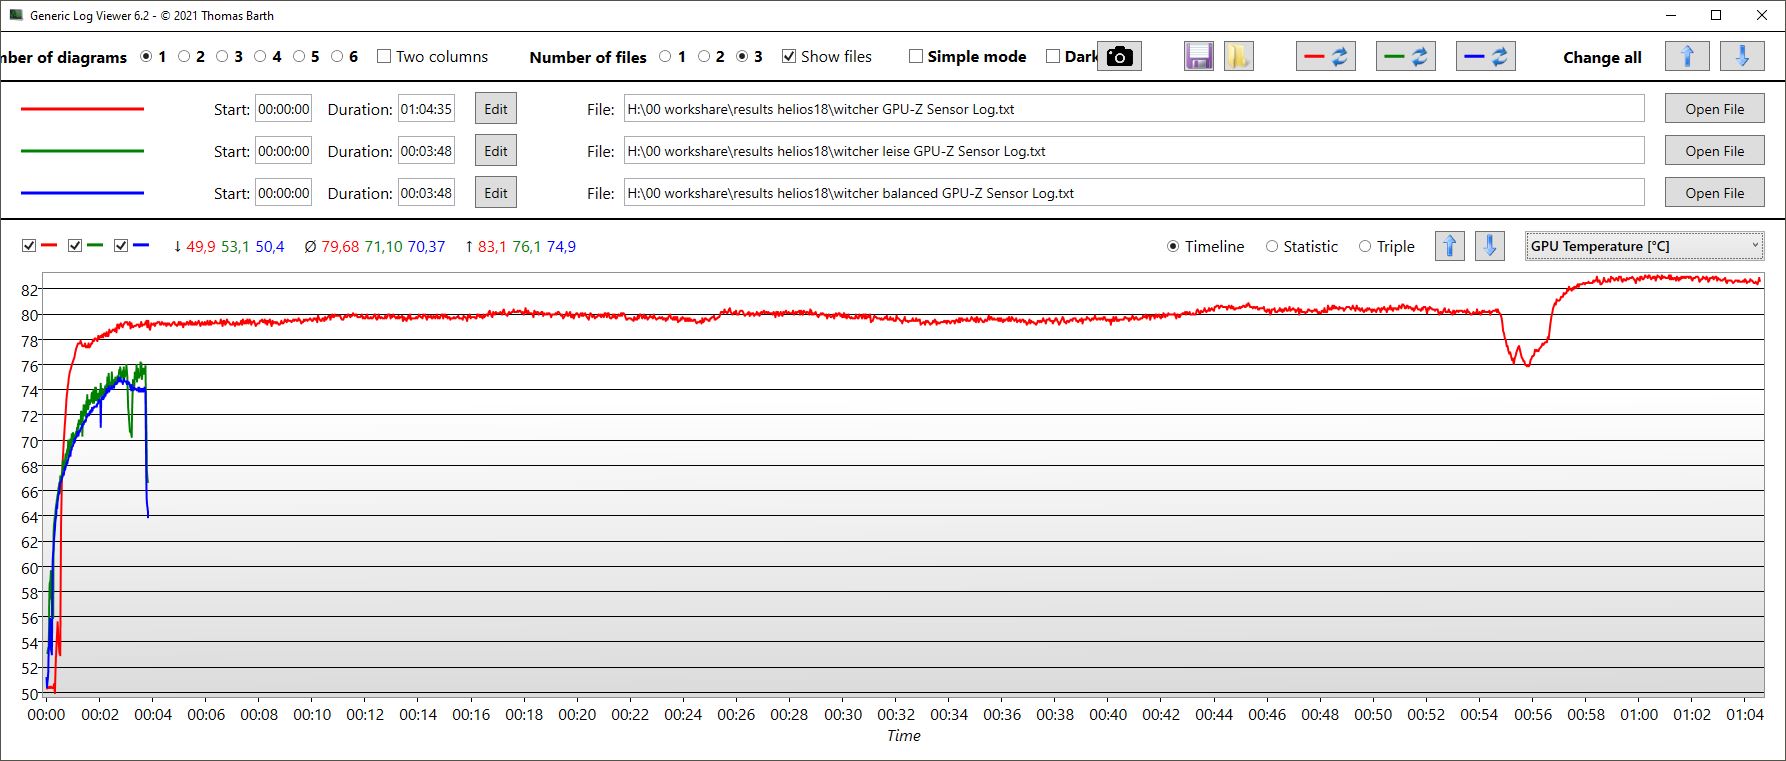
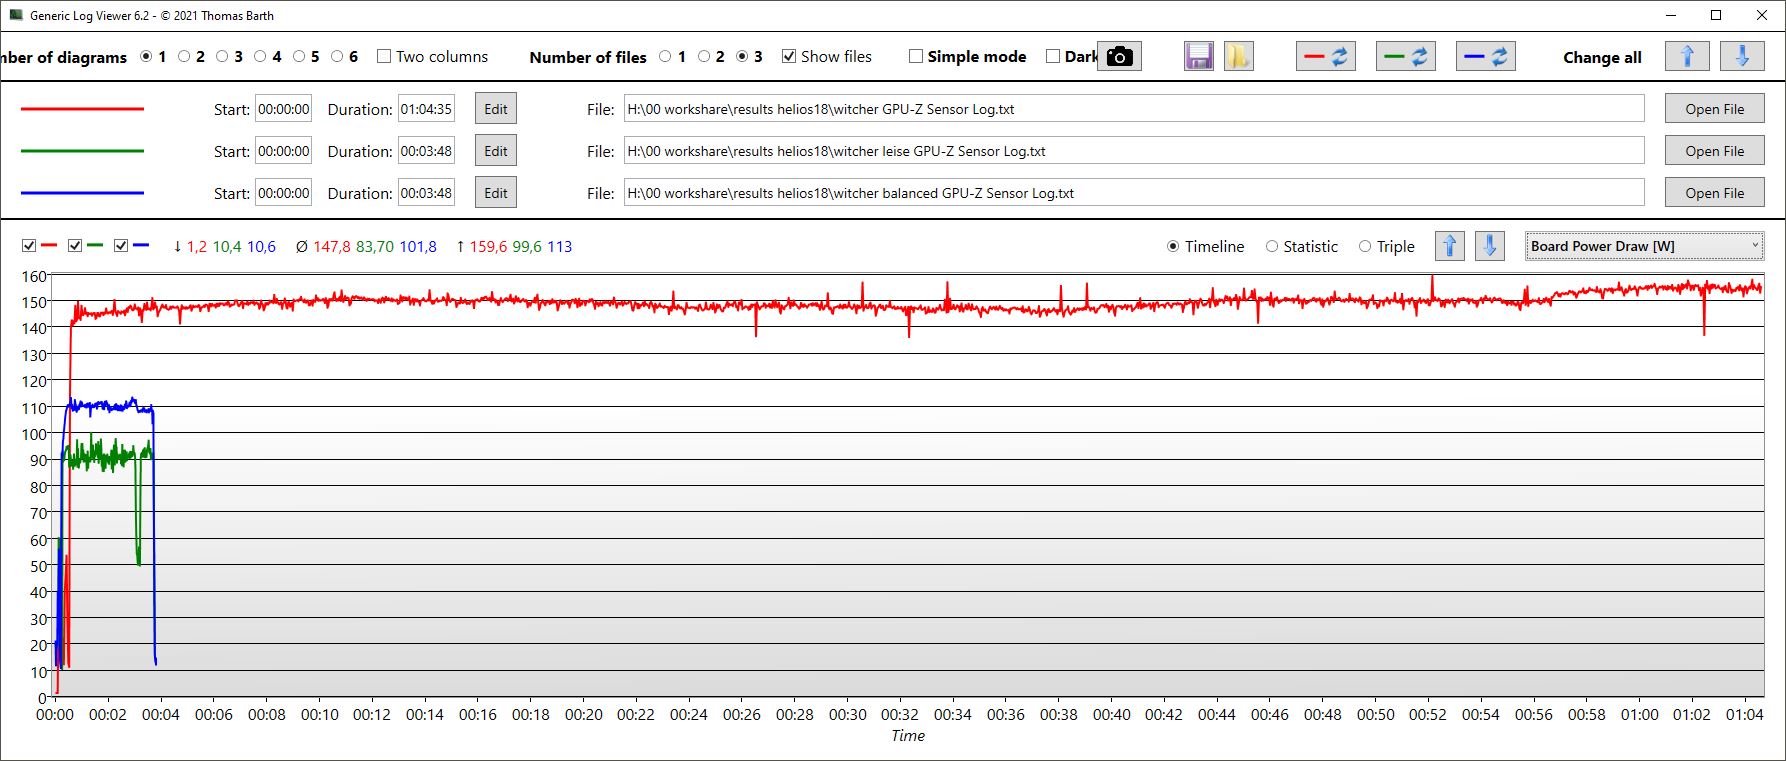
Witcher 3 FPS chart
| basso | medio | alto | ultra | QHD | 4K | |
|---|---|---|---|---|---|---|
| GTA V (2015) | 187.3 | 187.6 | 186.7 | 152.7 | 140.7 | |
| The Witcher 3 (2015) | 642 | 568 | 368 | 175 | 153 | |
| Dota 2 Reborn (2015) | 234 | 211 | 202 | 186.4 | 131 | |
| Final Fantasy XV Benchmark (2018) | 234 | 225 | 182.1 | 136.6 | 79.4 | |
| X-Plane 11.11 (2018) | 199 | 183.5 | 139.5 | 143.7 | ||
| Far Cry 5 (2018) | 199 | 175 | 168 | 158 | 155 | |
| Strange Brigade (2018) | 562 | 448 | 382 | 339 | 238 | |
| Call of Duty Modern Warfare 2 2022 (2022) | 167 | 124 | ||||
| Hogwarts Legacy (2023) | 173 | 157 | 134 | 108 | 81 | |
| F1 23 (2023) | 329 | 329 | 304 | 111 | 73 | |
| Cyberpunk 2077 (2023) | 127.13 | 77.03 | ||||
| Alan Wake 2 (2023) | 100.7 | 71 |
Emissioni - Helios 18 molto rumoroso nel turbo
Rumore
Il rumore della ventola dipende naturalmente molto dalla modalità di prestazioni scelta. In modalità Turbo , il rumore di fondo è molto elevato sotto carico; abbiamo misurato un massimo di poco inferiore a 60 dB, rendendolo il dispositivo più rumoroso nel campo di confronto. IlAlienware con la sua RTX 4090 rimane più silenzioso; solo MSI è altrettanto rumoroso. Al massimo volume, lo chassis inizia persino a vibrare leggermente. Consigliamo quindi la modalità Performance o inferiore. Nella prima, si rinuncia solo al 3-5% delle prestazioni in Witcher 3, ma il volume si abbassa di quasi 10 dB!
Almeno Helios 18 regola bene le sue ventole a seconda del carico e non scatena immediatamente il volume massimo sugli utenti con carichi medi. Tuttavia, la rotazione della ventola non rimane costante durante il gioco, ma fluttua ciclicamente, a volte più e a volte meno forte (Witcher 3).
Le altre modalità di prestazioni possono ridurre il livello di rumore in modo considerevole, vedere la tabella seguente.
| Parametri/Modalità di prestazione | Turbo | Performance | Bilanciato | Silenzioso |
|---|---|---|---|---|
| fps | 176 | 171 | 157 | 100 |
| Volume in dB | 59,82 | 50,74 | 40,77 | 32,36 |
| Consumo in W | 289 | 227 | 182 | 153 |
Rumorosità
| Idle |
| 23 / 23 / 23 dB(A) |
| Sotto carico |
| 45.26 / 59.94 dB(A) |
 | ||
30 dB silenzioso 40 dB(A) udibile 50 dB(A) rumoroso |
||
min: | ||
| Acer Predator Helios 18 N23Q2 GeForce RTX 4080 Laptop GPU, i9-13900HX, Samsung PM9A1 MZVL22T0HBLB | MSI GE78HX 13VH-070US GeForce RTX 4080 Laptop GPU, i9-13950HX, Samsung PM9A1 MZVL22T0HBLB | HP Omen 17-ck2097ng GeForce RTX 4080 Laptop GPU, i9-13900HX, SK hynix PC801 HFS001TEJ9X101N | Alienware m18 R1 GeForce RTX 4090 Laptop GPU, i9-13980HX, SK hynix PC801 HFS001TEJ9X101N | Asus ROG Strix G18 G814JI GeForce RTX 4070 Laptop GPU, i7-13650HX, Micron 2400 MTFDKBA1T0QFM | Razer Blade 18 RTX 4070 GeForce RTX 4070 Laptop GPU, i9-13950HX, SSSTC CA6-8D1024 | |
|---|---|---|---|---|---|---|
| Noise | -6% | -11% | 6% | -2% | 3% | |
| off /ambiente * (dB) | 23 | 23.4 -2% | 24 -4% | 22.8 1% | 25 -9% | 23.5 -2% |
| Idle Minimum * (dB) | 23 | 24.2 -5% | 31 -35% | 23 -0% | 26 -13% | 23.8 -3% |
| Idle Average * (dB) | 23 | 25.6 -11% | 32 -39% | 23 -0% | 28 -22% | 23.8 -3% |
| Idle Maximum * (dB) | 23 | 31 -35% | 33 -43% | 23 -0% | 29 -26% | 26.8 -17% |
| Load Average * (dB) | 45.26 | 43.3 4% | 45 1% | 35.6 21% | 41 9% | 37.3 18% |
| Witcher 3 ultra * (dB) | 59.82 | 56.3 6% | 45 25% | 51.3 14% | 44 26% | 48 20% |
| Load Maximum * (dB) | 59.94 | 59.1 1% | 50 17% | 56.7 5% | 46 23% | 53.5 11% |
* ... Meglio usare valori piccoli
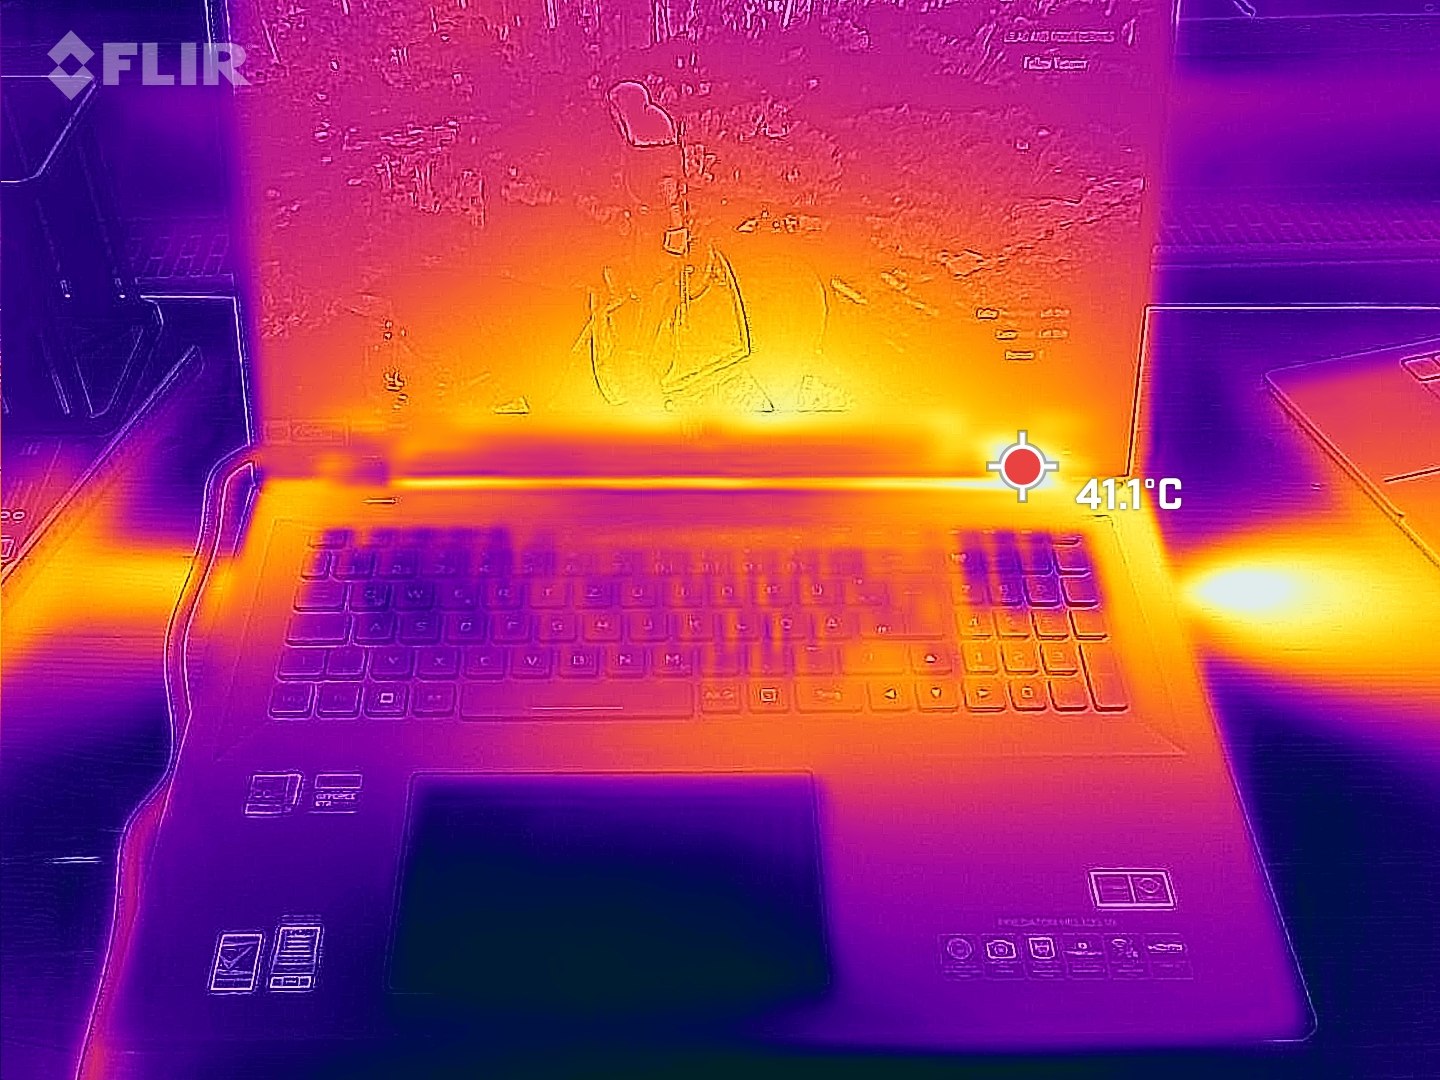
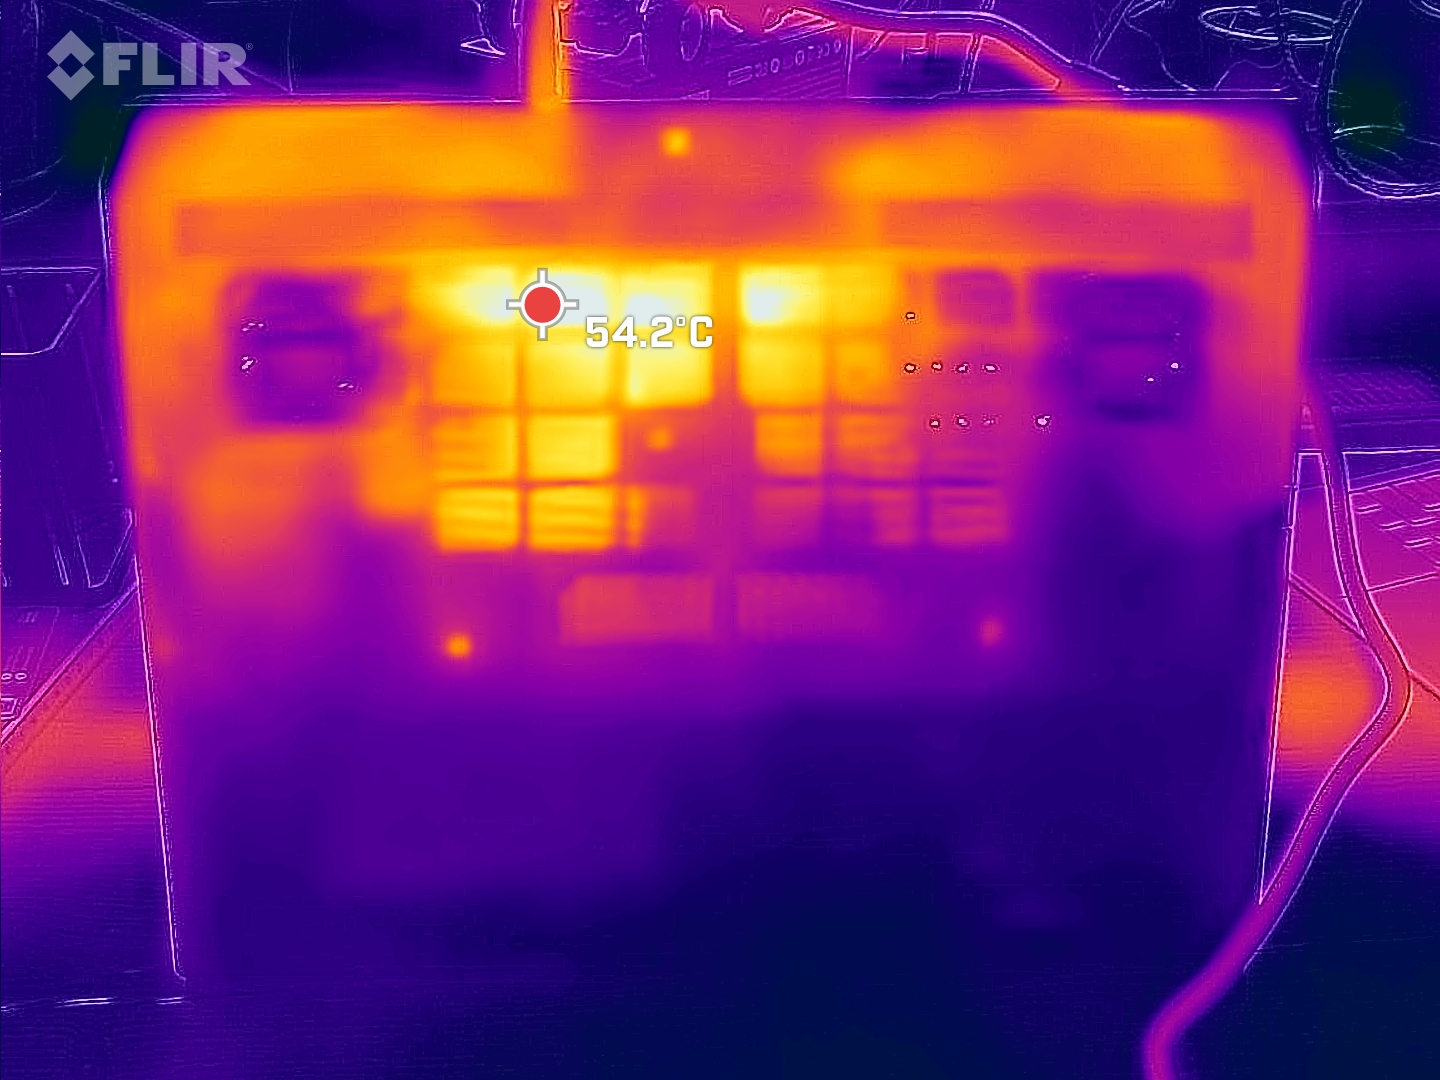
Temperatura
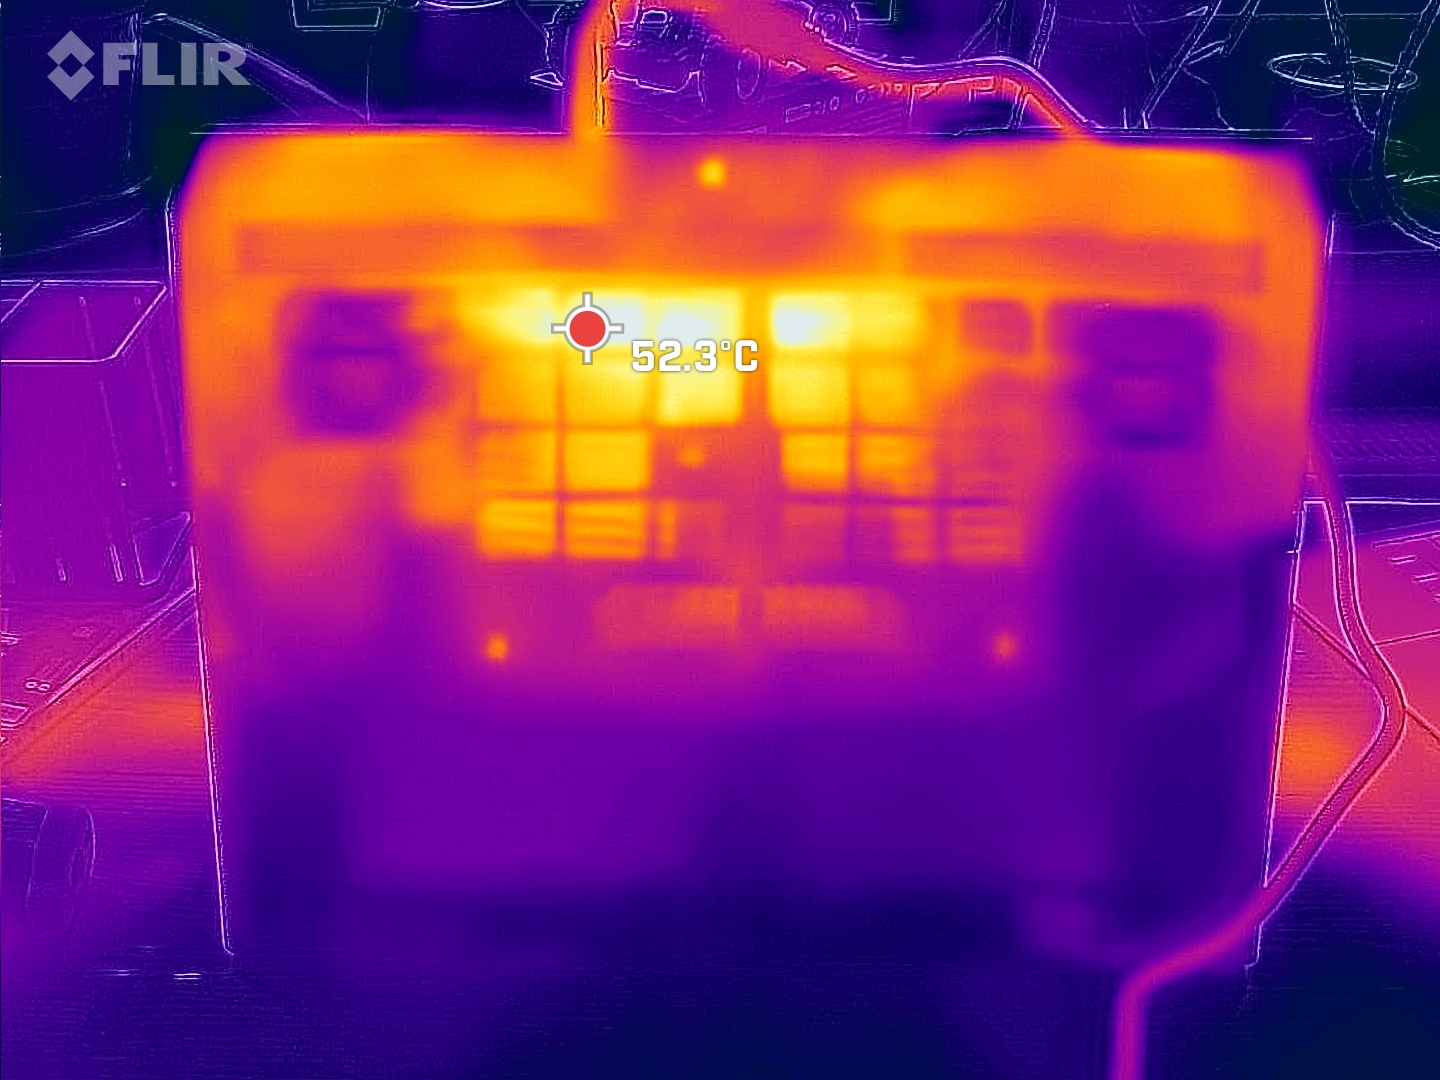
Le temperature superficiali mostrano che le ventole rumorose hanno anche un aspetto positivo. Helios 18 si riscalda solo in modo molto selettivo (lato inferiore centrale e a sinistra del display), ma per il resto rimane quasi insolitamente freddo. Ad esempio, il poggiapolsi sinistro è decisamente freddo dopo un'ora di gioco. Questo dimostra che, da un lato, le ventole rumorose sono configurate in modo troppo aggressivo e, dall'altro, il calore non è distribuito molto bene.
(+) La temperatura massima sul lato superiore è di 35 °C / 95 F, rispetto alla media di 40.4 °C / 105 F, che varia da 21.2 a 68.8 °C per questa classe Gaming.
(-) Il lato inferiore si riscalda fino ad un massimo di 56 °C / 133 F, rispetto alla media di 43.2 °C / 110 F
(+) In idle, la temperatura media del lato superiore è di 31.1 °C / 88 F, rispetto alla media deld ispositivo di 33.9 °C / 93 F.
(+) Riproducendo The Witcher 3, la temperatura media per il lato superiore e' di 30.7 °C / 87 F, rispetto alla media del dispositivo di 33.9 °C / 93 F.
(+) I poggiapolsi e il touchpad sono piu' freddi della temperatura della pelle con un massimo di 29 °C / 84.2 F e sono quindi freddi al tatto.
(±) La temperatura media della zona del palmo della mano di dispositivi simili e'stata di 28.8 °C / 83.8 F (-0.2 °C / -0.4 F).

| Acer Predator Helios 18 N23Q2 Intel Core i9-13900HX, NVIDIA GeForce RTX 4080 Laptop GPU | MSI GE78HX 13VH-070US Intel Core i9-13950HX, NVIDIA GeForce RTX 4080 Laptop GPU | HP Omen 17-ck2097ng Intel Core i9-13900HX, NVIDIA GeForce RTX 4080 Laptop GPU | Alienware m18 R1 Intel Core i9-13980HX, NVIDIA GeForce RTX 4090 Laptop GPU | Asus ROG Strix G18 G814JI Intel Core i7-13650HX, NVIDIA GeForce RTX 4070 Laptop GPU | Razer Blade 18 RTX 4070 Intel Core i9-13950HX, NVIDIA GeForce RTX 4070 Laptop GPU | |
|---|---|---|---|---|---|---|
| Heat | 11% | 14% | 17% | 7% | 11% | |
| Maximum Upper Side * (°C) | 35 | 37.4 -7% | 41 -17% | 39 -11% | 45 -29% | 39.2 -12% |
| Maximum Bottom * (°C) | 56 | 45 20% | 51 9% | 36.4 35% | 47 16% | 35.6 36% |
| Idle Upper Side * (°C) | 34 | 29.8 12% | 24 29% | 29.2 14% | 28 18% | 31.8 6% |
| Idle Bottom * (°C) | 39 | 32.4 17% | 25 36% | 27.8 29% | 31 21% | 33.2 15% |
* ... Meglio usare valori piccoli
Test di stress
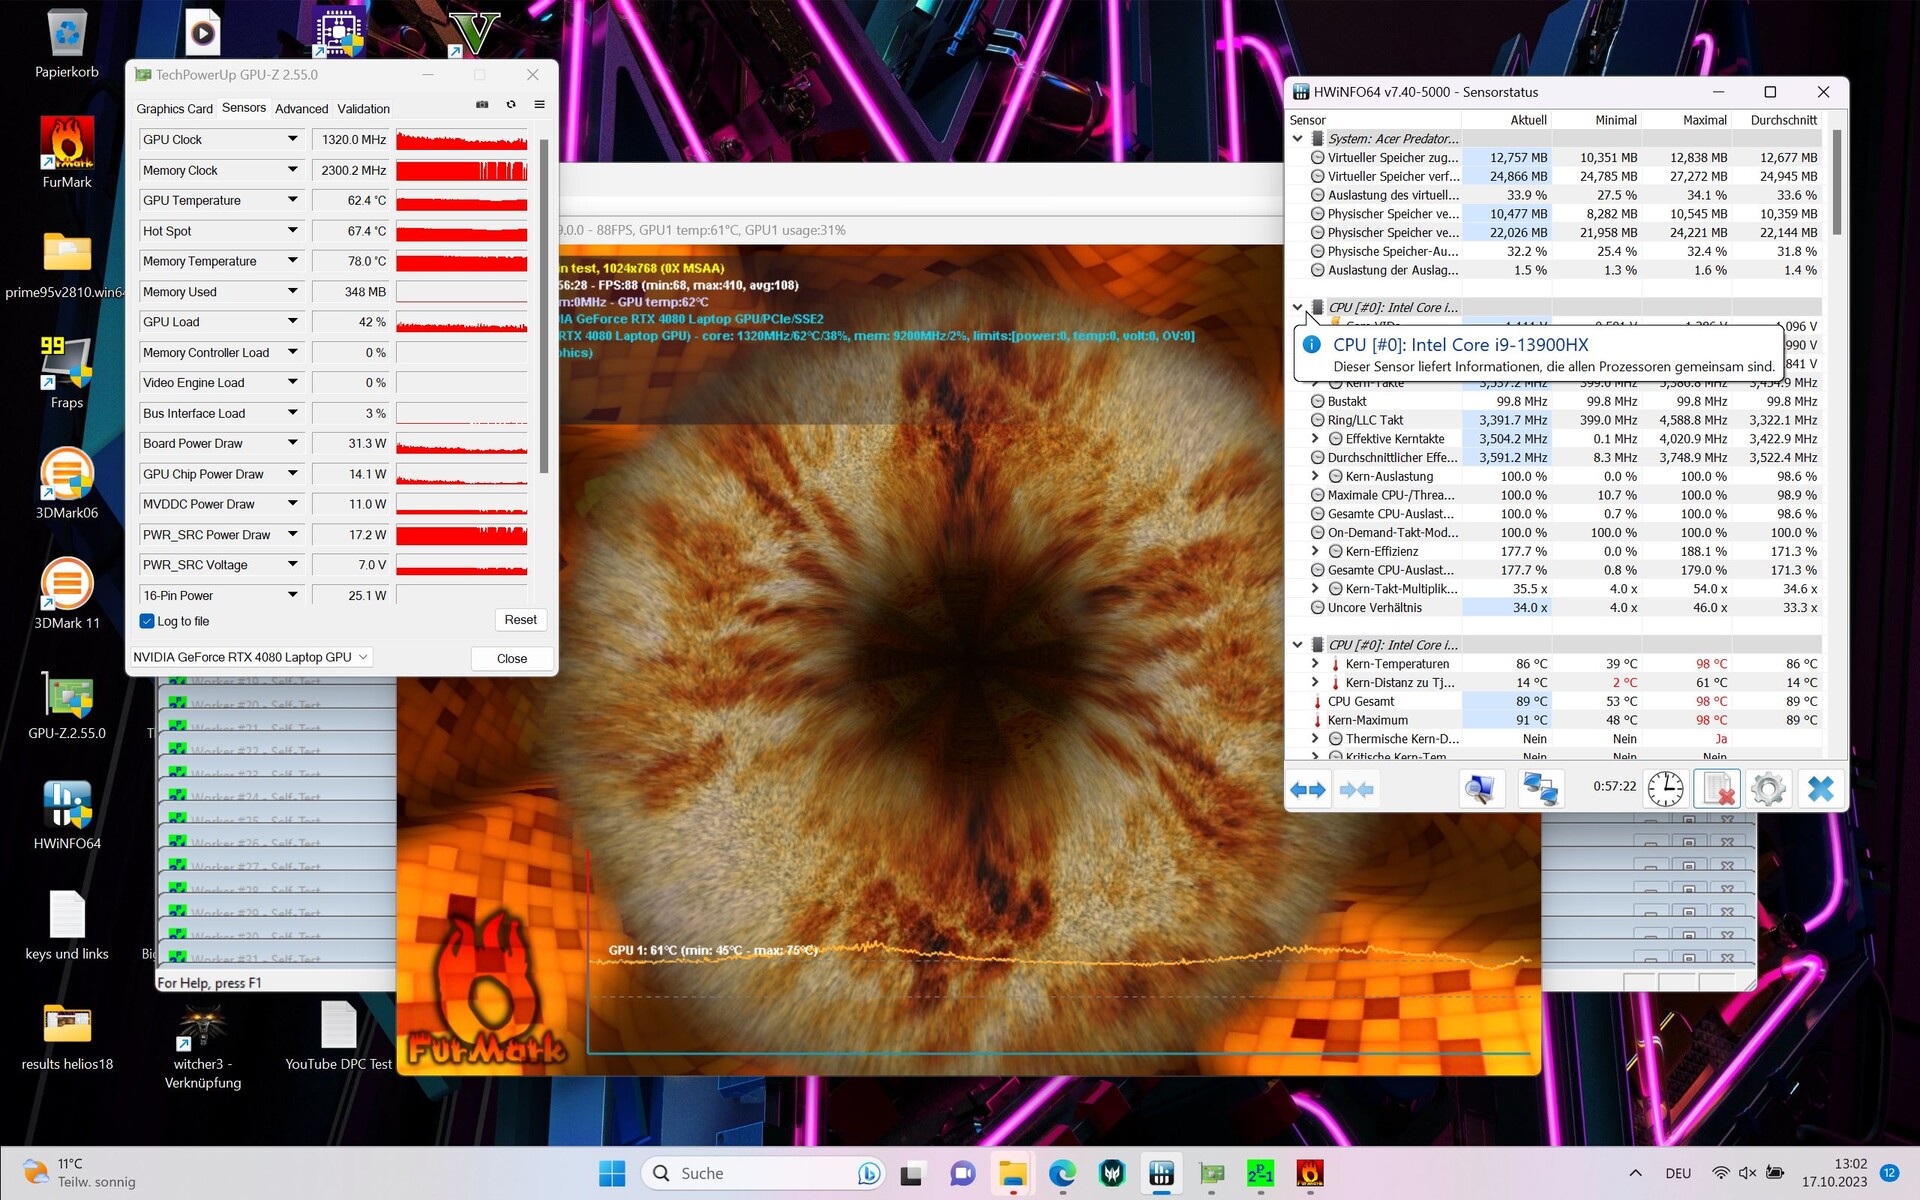
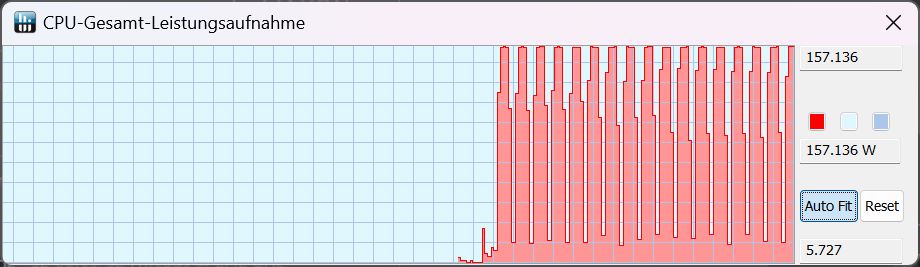
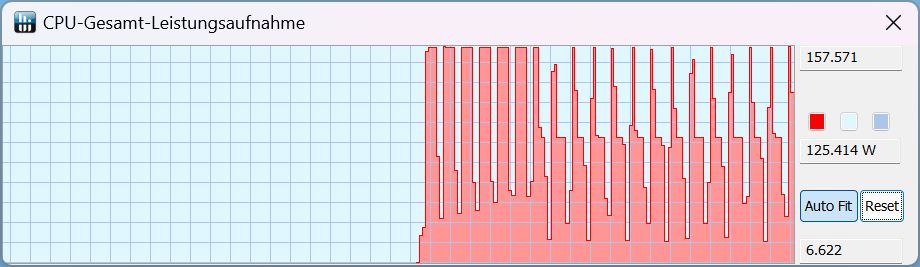
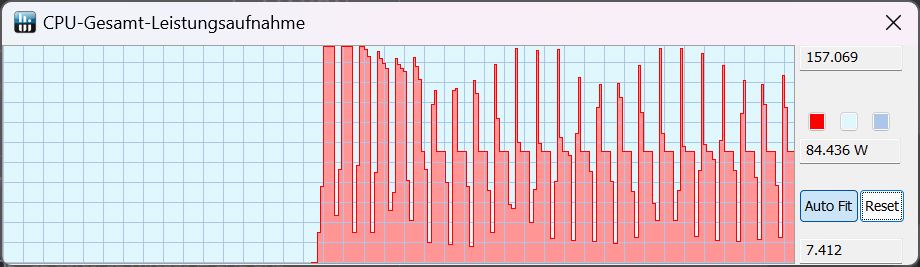
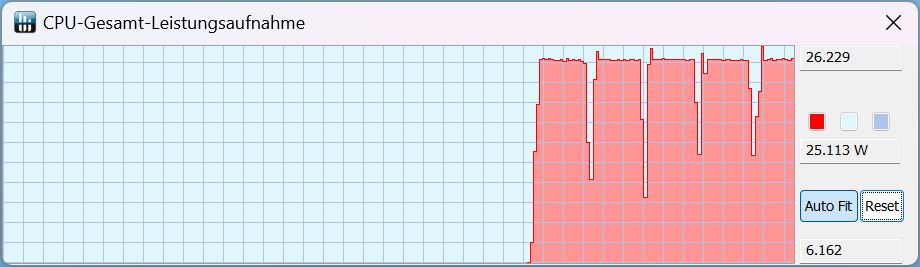
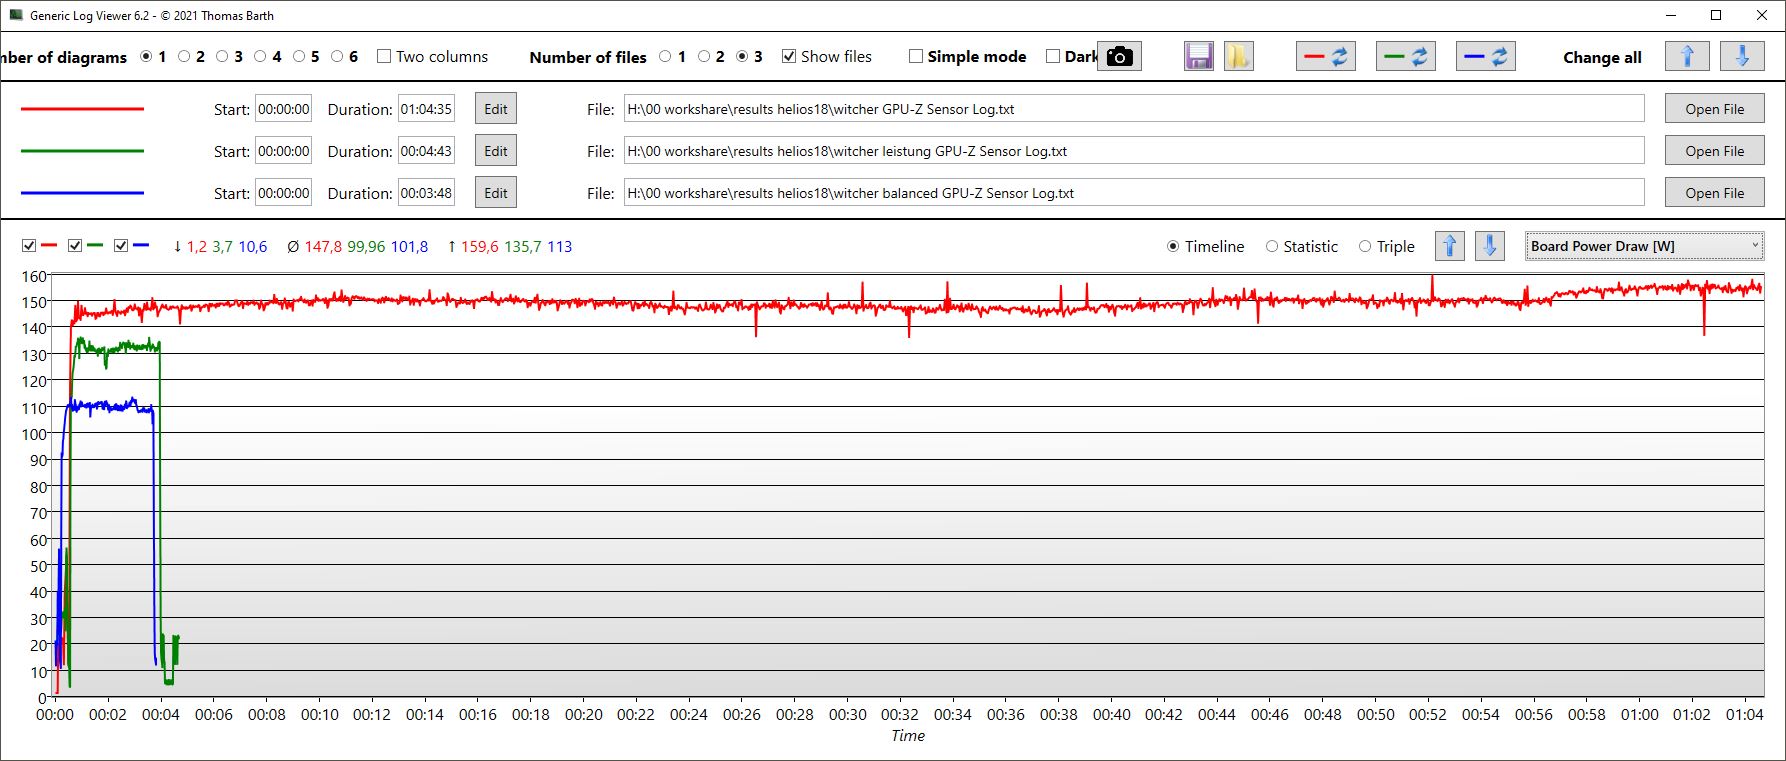
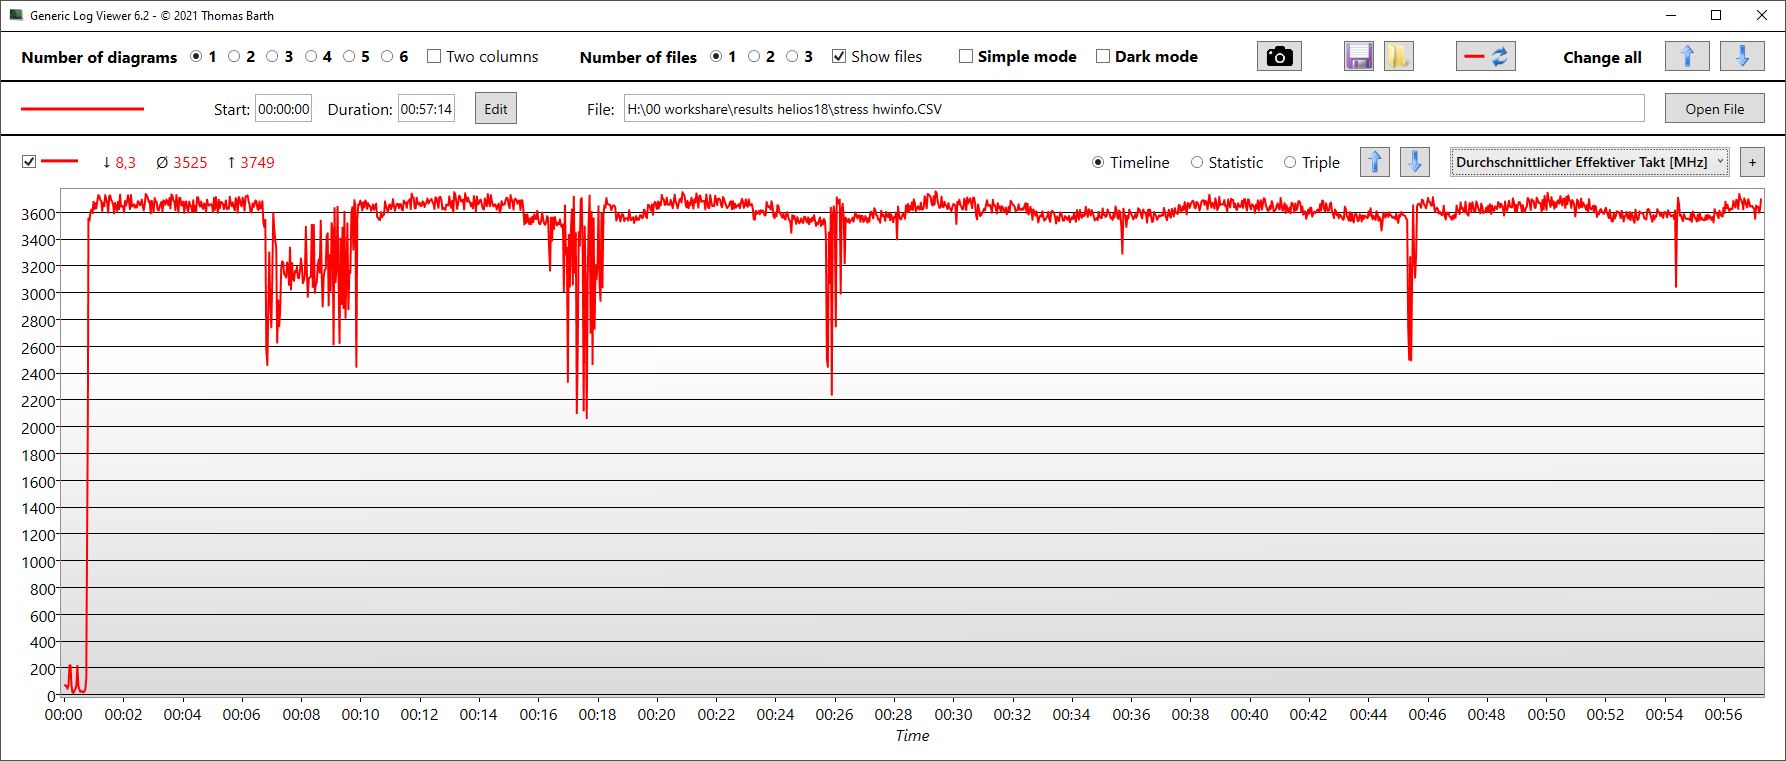
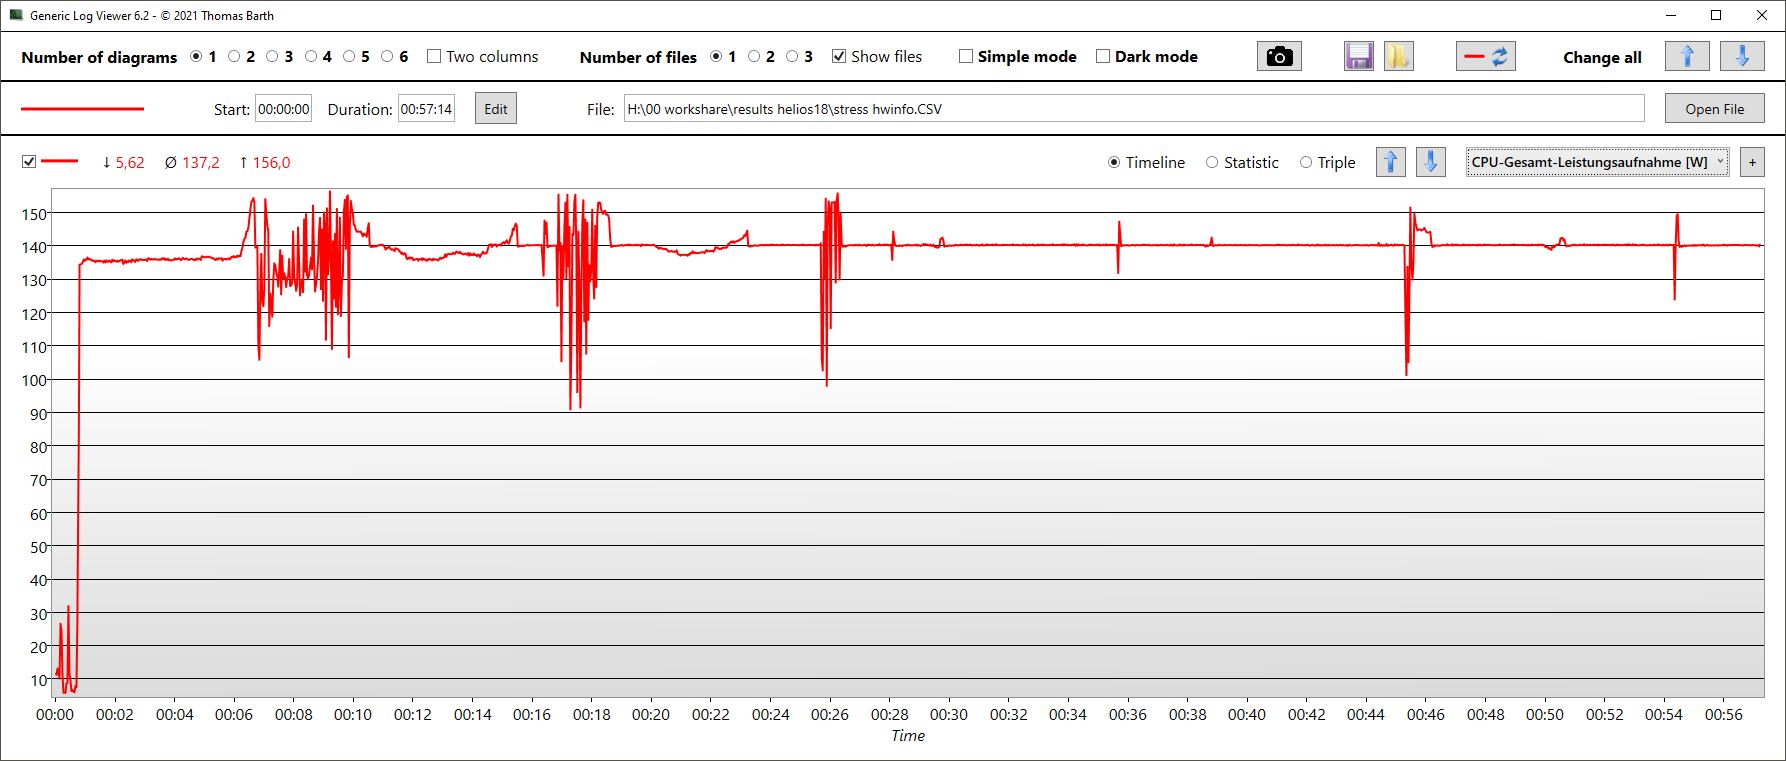
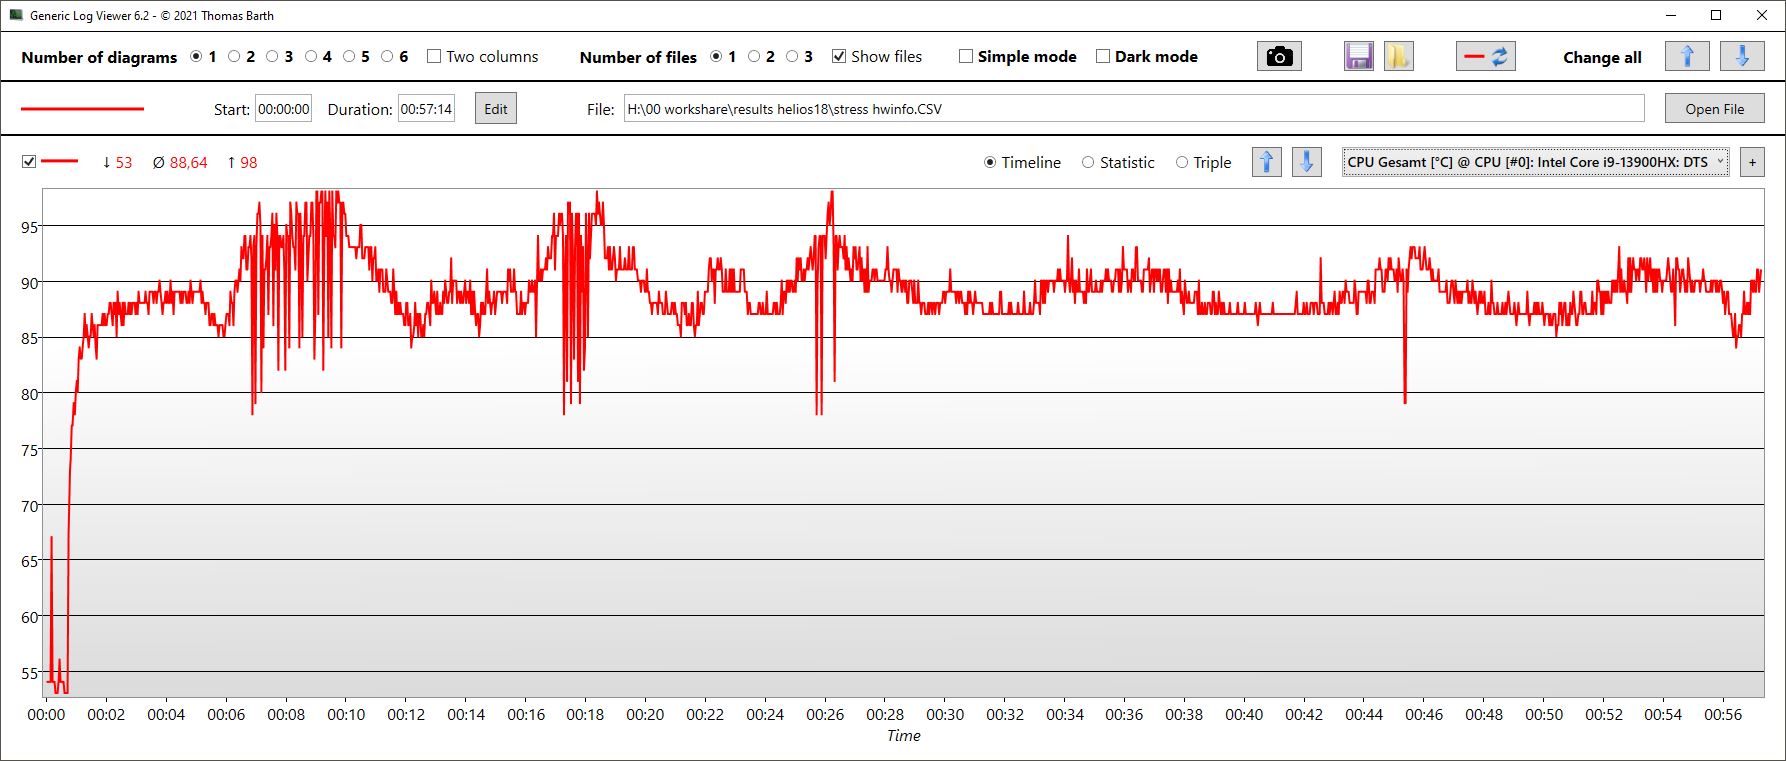
Dopo aver lanciato il nostro stress test, le prestazioni della CPU del Predator rimangono relativamente costanti, con i core che si aggirano costantemente tra 3,4 e 3,6 GHz. Ci sono sempre piccole fluttuazioni che si riflettono nel consumo energetico e anche nella temperatura del core. Le temperature del core della CPU salgono fino a 98 °C, ma si attestano in media a 89 °C. Il consumo di energia della CPU raggiunge un picco di 156 W e una media di 137 W.
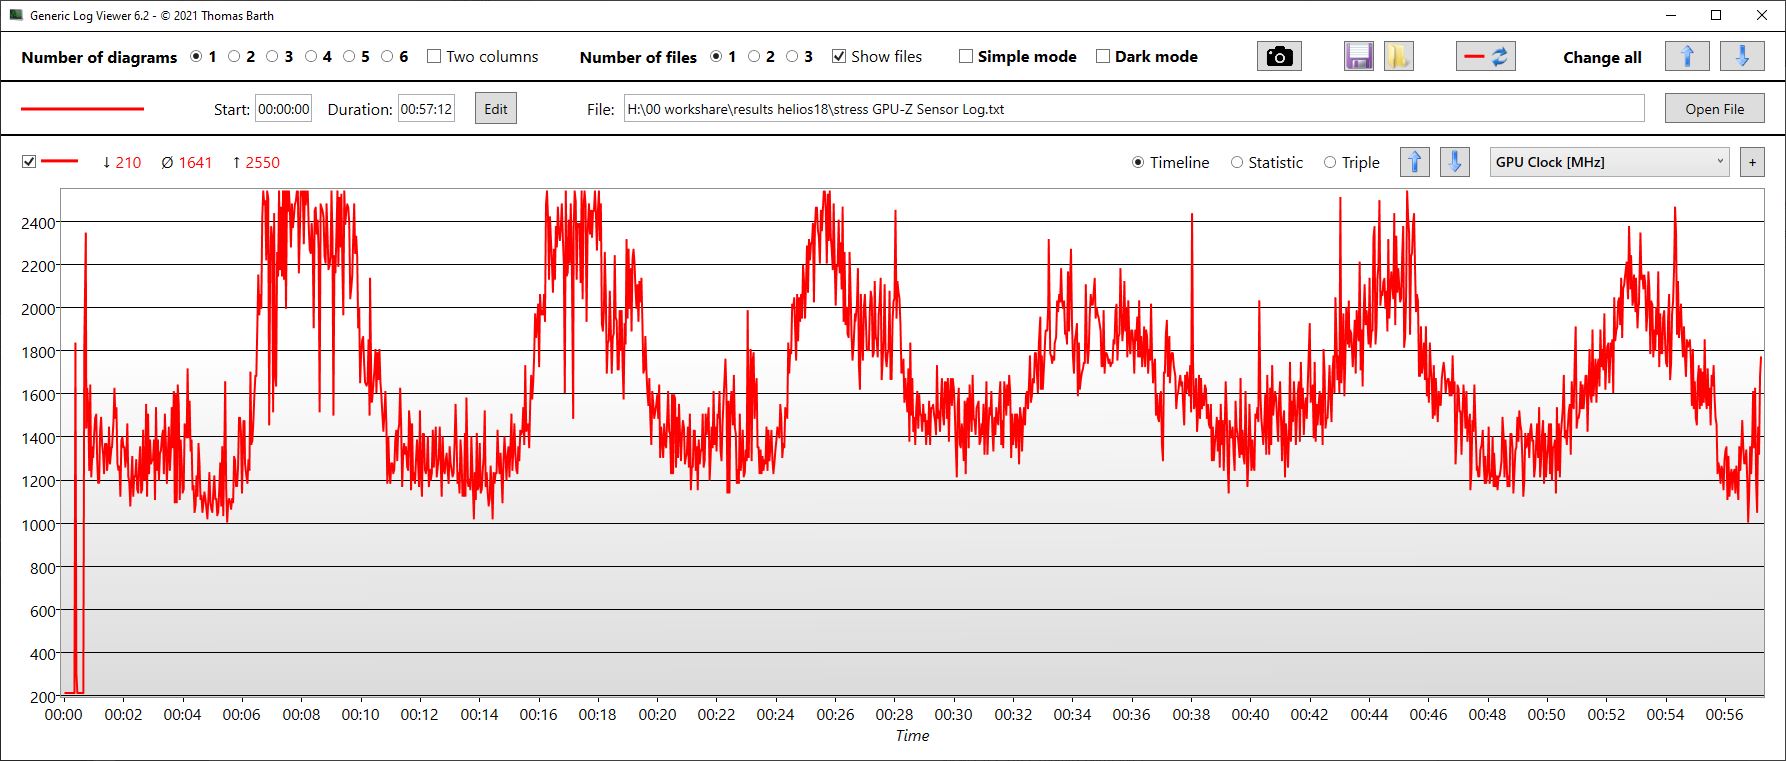
La GPU è molto meno costante e presenta una curva a onda delle prestazioni. La frequenza di clock raggiunge un massimo ciclicamente ricorrente di 2,5 GHz e le valli della curva sono intorno a 1,2 GHz. Allo stesso tempo, abbiamo misurato cali molto spontanei fino a soli 200 MHz per frazioni di secondo nel clock di memoria altrimenti costante di 2,3 GHz. Anche la temperatura della GPU oscilla, ma è di soli 64 °C in media, con un massimo di 76 °C. Il consumo di energia oscilla tra 25 W e 90-100 W.
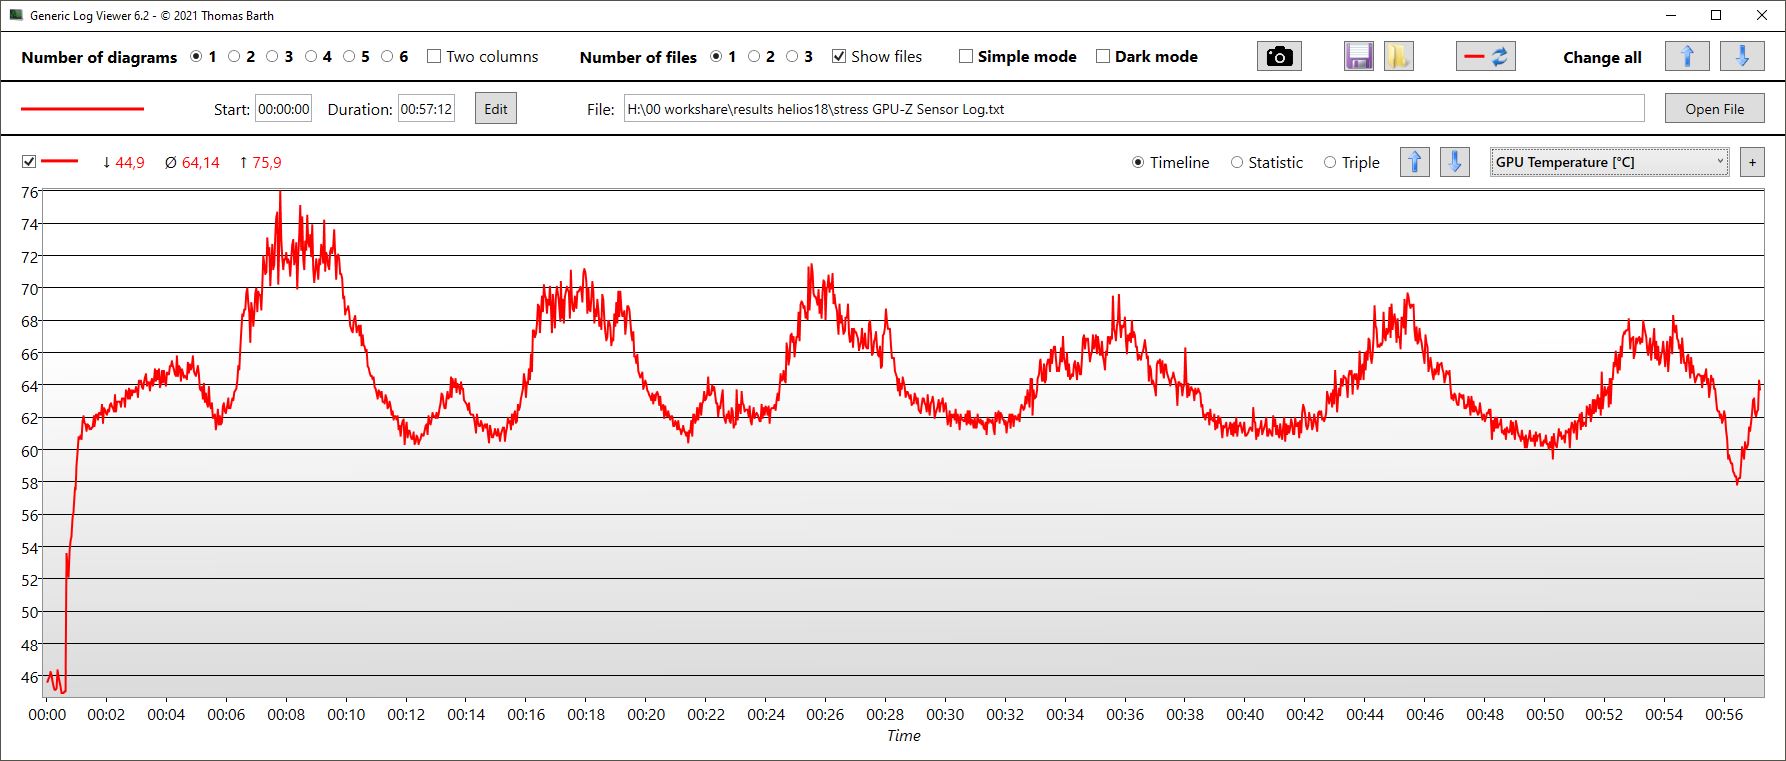
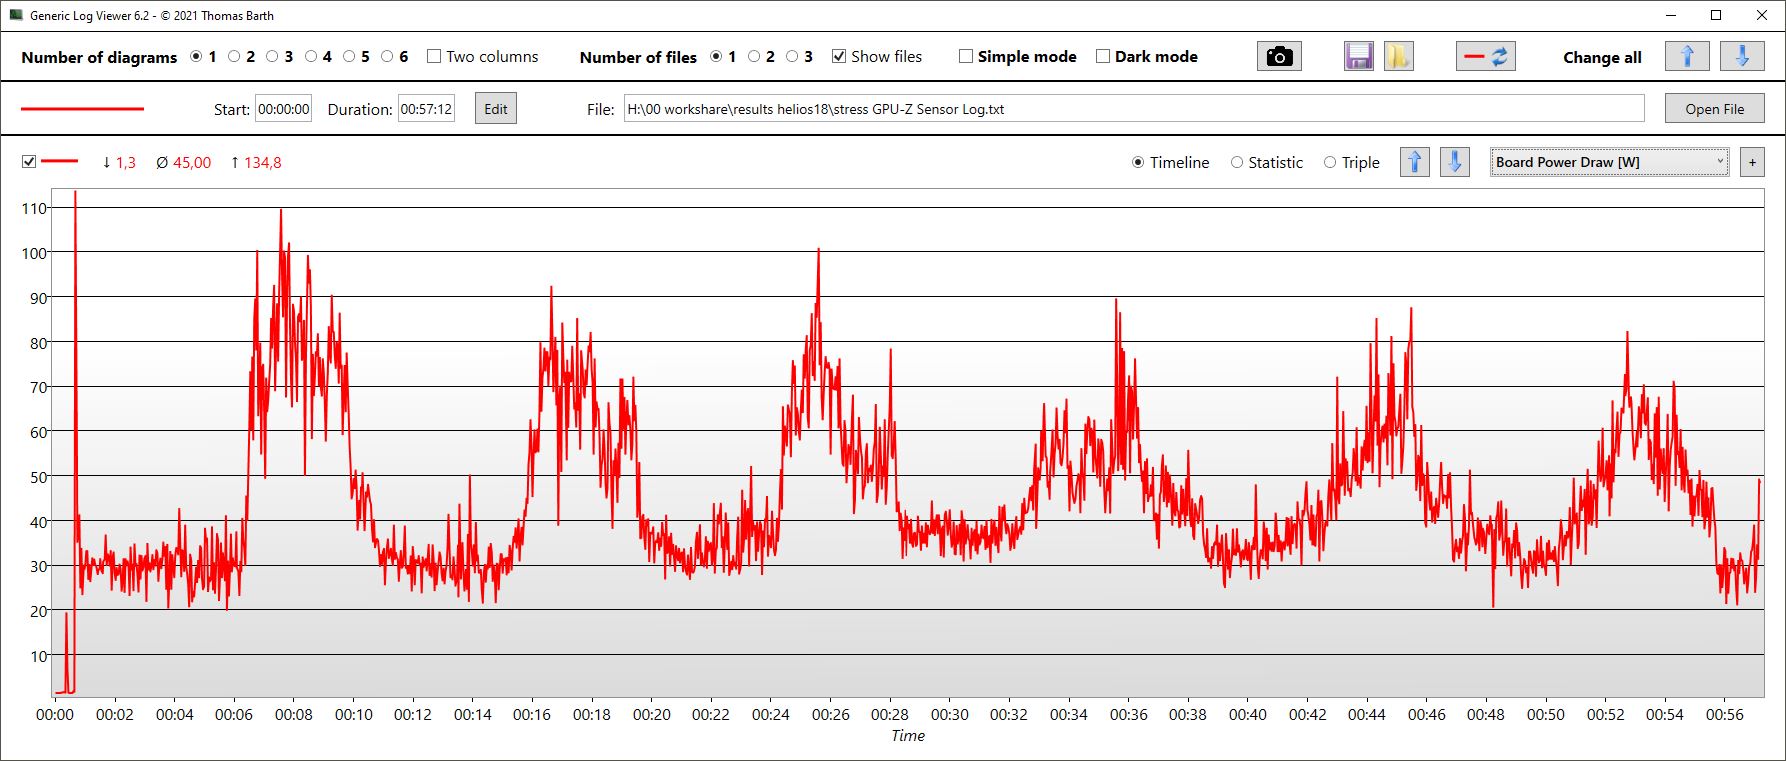
| Clock CPU (GHz) | Clock GPU (MHz) | Temperatura media CPU (°C) | Temperatura media GPU (°C) | |
| Prime95 + FurMark Stress | 3,5 | 1.640 | 89 | 64 |
| Witcher 3 Stress | 527 | 2.525 | 88,5 | 80 |
Altoparlanti
I diffusori possono essere abbastanza rumorosi, ma questo è tutto per quanto riguarda le notizie positive. L'audio è debole, i bassi sono praticamente inesistenti e anche i medi e gli alti non sono particolarmente equilibrati. Ci aspettavamo una qualità audio migliore, soprattutto da un portatile così grande.
È possibile collegare dispositivi audio esterni tramite il jack combinato per le cuffie, tra l'altro. Le cuffie sono comunque un must quando si gioca in modalità Turbo ad alto volume.
Acer Predator Helios 18 N23Q2 analisi audio
(+) | gli altoparlanti sono relativamente potenti (82.74 dB)
Bassi 100 - 315 Hz
(-) | quasi nessun basso - in media 17.6% inferiori alla media
(±) | la linearità dei bassi è media (9.8% delta rispetto alla precedente frequenza)
Medi 400 - 2000 Hz
(±) | medi elevati - circa 9.1% superiore alla media
(±) | linearità dei medi adeguata (8.8% delta rispetto alla precedente frequenza)
Alti 2 - 16 kHz
(±) | alti elevati - circa 5.3% superiori alla media
(+) | alti lineari (6.4% delta rispetto alla precedente frequenza)
Nel complesso 100 - 16.000 Hz
(±) | la linearità complessiva del suono è media (20.3% di differenza rispetto alla media
Rispetto alla stessa classe
» 72% di tutti i dispositivi testati in questa classe è stato migliore, 6% simile, 23% peggiore
» Il migliore ha avuto un delta di 6%, medio di 18%, peggiore di 132%
Rispetto a tutti i dispositivi testati
» 53% di tutti i dispositivi testati in questa classe è stato migliore, 8% similare, 39% peggiore
» Il migliore ha avuto un delta di 4%, medio di 24%, peggiore di 134%
Apple MacBook Pro 16 2021 M1 Pro analisi audio
(+) | gli altoparlanti sono relativamente potenti (84.7 dB)
Bassi 100 - 315 Hz
(+) | bassi buoni - solo 3.8% dalla media
(+) | bassi in lineaa (5.2% delta rispetto alla precedente frequenza)
Medi 400 - 2000 Hz
(+) | medi bilanciati - solo only 1.3% rispetto alla media
(+) | medi lineari (2.1% delta rispetto alla precedente frequenza)
Alti 2 - 16 kHz
(+) | Alti bilanciati - appena 1.9% dalla media
(+) | alti lineari (2.7% delta rispetto alla precedente frequenza)
Nel complesso 100 - 16.000 Hz
(+) | suono nel complesso lineare (4.6% differenza dalla media)
Rispetto alla stessa classe
» 0% di tutti i dispositivi testati in questa classe è stato migliore, 0% simile, 100% peggiore
» Il migliore ha avuto un delta di 5%, medio di 17%, peggiore di 45%
Rispetto a tutti i dispositivi testati
» 0% di tutti i dispositivi testati in questa classe è stato migliore, 0% similare, 100% peggiore
» Il migliore ha avuto un delta di 4%, medio di 24%, peggiore di 134%
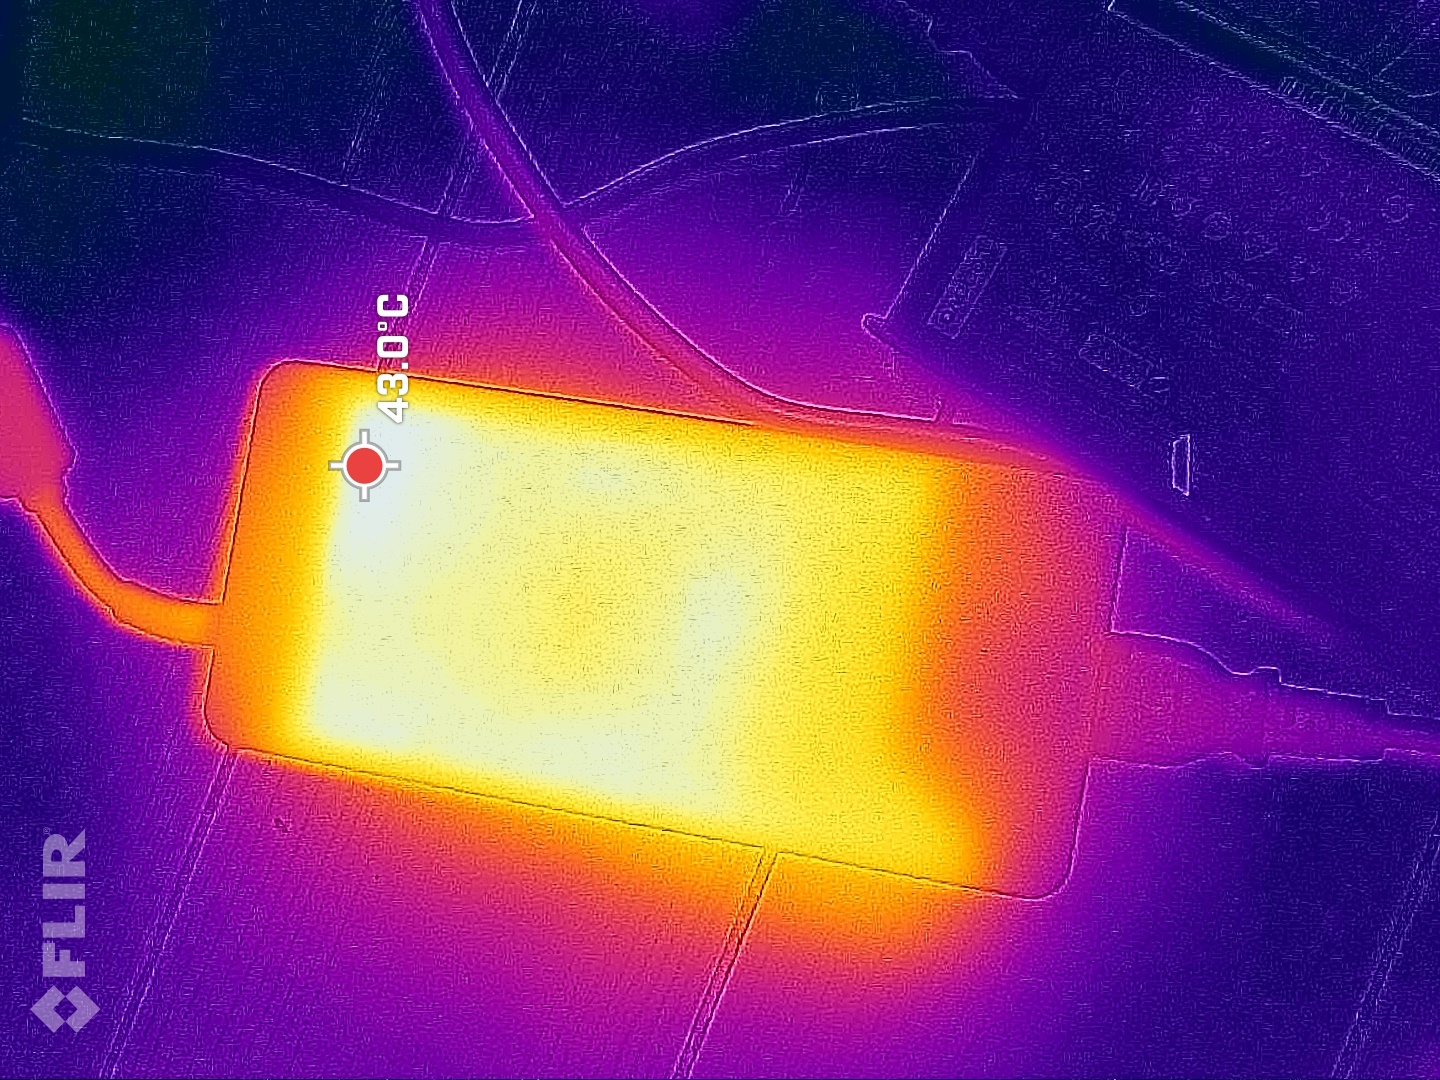
Gestione dell'energia - Consumo e tempo di funzionamento in linea con le aspettative
Consumo di energia
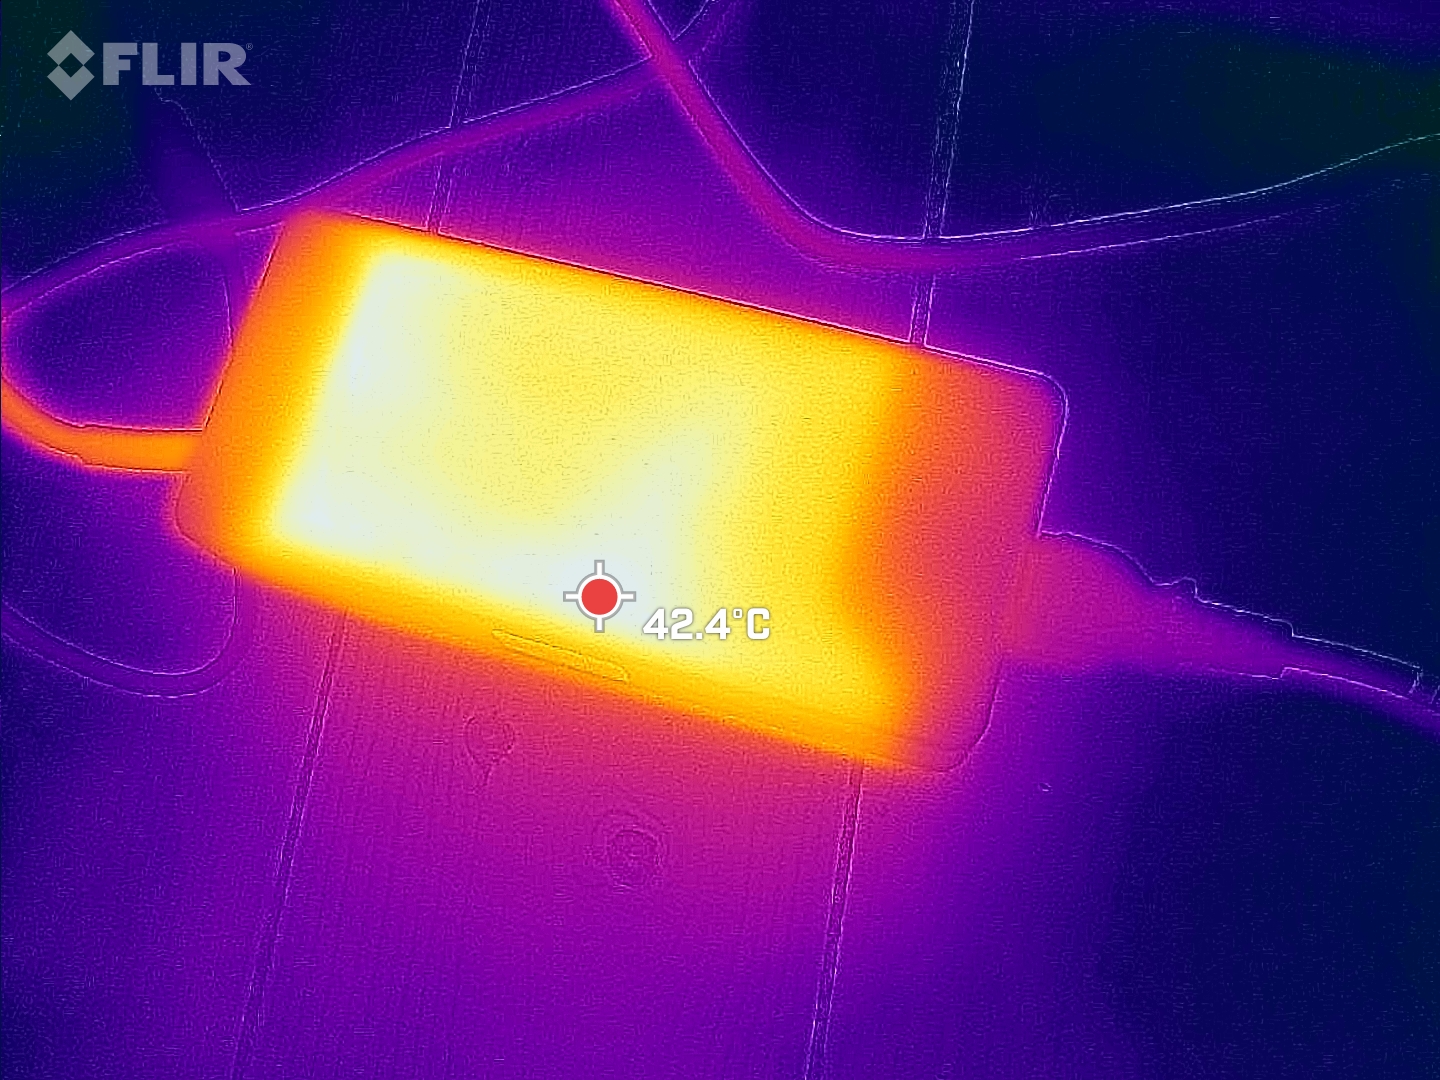
Nessuno si aspetta la frugalità di una CPU HX e di una RTX 4080, e quindi Helios 18 non è una sorpresa. È abbastanza frugale quando è inattivo, ma quando gioca ha bisogno di quasi tanto quanto il modello più o meno altrettanto potenteMSI GE78HXsolo il consumo massimo a breve termine di 319 W è superiore a quello di MSI. L'alimentatore Chicony, grande e pesante, ha una potenza nominale di 330 W e dovrebbe essere in grado di fornire al Predator energia sufficiente in ogni momento, anche negli scenari più impegnativi.
| Off / Standby | |
| Idle | |
| Sotto carico |
|
Leggenda:
min: | |
| Acer Predator Helios 18 N23Q2 i9-13900HX, GeForce RTX 4080 Laptop GPU, Samsung PM9A1 MZVL22T0HBLB, IPS, 2560x1600, 18" | MSI GE78HX 13VH-070US i9-13950HX, GeForce RTX 4080 Laptop GPU, Samsung PM9A1 MZVL22T0HBLB, IPS, 2560x1600, 17" | HP Omen 17-ck2097ng i9-13900HX, GeForce RTX 4080 Laptop GPU, SK hynix PC801 HFS001TEJ9X101N, IPS, 2560x1440, 17.3" | Alienware m18 R1 i9-13980HX, GeForce RTX 4090 Laptop GPU, SK hynix PC801 HFS001TEJ9X101N, IPS, 1920x1200, 18" | Asus ROG Strix G18 G814JI i7-13650HX, GeForce RTX 4070 Laptop GPU, Micron 2400 MTFDKBA1T0QFM, IPS, 2560x1600, 18" | Razer Blade 18 RTX 4070 i9-13950HX, GeForce RTX 4070 Laptop GPU, SSSTC CA6-8D1024, IPS, 2560x1600, 18" | Media NVIDIA GeForce RTX 4080 Laptop GPU | Media della classe Gaming | |
|---|---|---|---|---|---|---|---|---|
| Power Consumption | -13% | -1% | -47% | 20% | -37% | -14% | 8% | |
| Idle Minimum * (Watt) | 16 | 16.1 -1% | 16 -0% | 21.6 -35% | 8 50% | 24.5 -53% | 16.9 ? -6% | 13 ? 19% |
| Idle Average * (Watt) | 19 | 24 -26% | 20 -5% | 25.2 -33% | 15 21% | 34.1 -79% | 22 ? -16% | 18.7 ? 2% |
| Idle Maximum * (Watt) | 21.3 | 34 -60% | 26 -22% | 56.7 -166% | 26 -22% | 47.7 -124% | 34.1 ? -60% | 24.3 ? -14% |
| Load Average * (Watt) | 124 | 123.6 -0% | 135 -9% | 164.1 -32% | 102 18% | 140 -13% | 117.9 ? 5% | 108.2 ? 13% |
| Witcher 3 ultra * (Watt) | 289 | 286 1% | 215 26% | 311 -8% | 178.6 38% | 202 30% | ||
| Load Maximum * (Watt) | 319 | 285.7 10% | 299 6% | 338.9 -6% | 267 16% | 261 18% | 297 ? 7% | 254 ? 20% |
* ... Meglio usare valori piccoli
Power consumption Witcher 3 / Stress test
Power consumption with an external monitor
Durata della batteria
Acer installa una batteria da 90 Wh, mentre MSI e Alienware hanno rispettivamente 99 e 97 Wh. Gli utenti devono assolutamente utilizzare la modalità SDR per il display in modalità batteria, altrimenti i 1000 nit HDR scaricheranno la batteria molto più velocemente.
Helios 18 dura da 4,5 a quasi 5 ore nel test WiFi e video con una luminosità ridotta di 150 nits. MSI è leggermente più duraturo e Alienware ha una durata simile nel test WiFi.
| Acer Predator Helios 18 N23Q2 i9-13900HX, GeForce RTX 4080 Laptop GPU, 90 Wh | MSI GE78HX 13VH-070US i9-13950HX, GeForce RTX 4080 Laptop GPU, 99 Wh | HP Omen 17-ck2097ng i9-13900HX, GeForce RTX 4080 Laptop GPU, 83 Wh | Alienware m18 R1 i9-13980HX, GeForce RTX 4090 Laptop GPU, 97 Wh | Asus ROG Strix G18 G814JI i7-13650HX, GeForce RTX 4070 Laptop GPU, 90 Wh | Razer Blade 18 RTX 4070 i9-13950HX, GeForce RTX 4070 Laptop GPU, 91.7 Wh | Media della classe Gaming | |
|---|---|---|---|---|---|---|---|
| Autonomia della batteria | 14% | -20% | -31% | 28% | -17% | 44% | |
| H.264 (h) | 4.8 | 3.7 -23% | 8.9 ? 85% | ||||
| WiFi v1.3 (h) | 4.4 | 6.1 39% | 3.6 -18% | 4.3 -2% | 8.1 84% | 4 -9% | 7 ? 59% |
| Load (h) | 1.7 | 1.5 -12% | 1.4 -18% | 0.7 -59% | 1.2 -29% | 1.3 -24% | 1.51 ? -11% |
| Reader / Idle (h) | 7.3 | 4.2 | 5.6 | 11.7 | 7 | 8.71 ? |
Pro
Contro
Verdetto - Giocatore forte con potenziale di ottimizzazione nel raffreddamento
Il gamer rivela zero punti deboli in termini di prestazioni. Sia la CPU che la GPU hanno prestazioni leggermente migliori rispetto alla media dei laptop con la stessa configurazione del nostro database. C'è anche il display MiniLED luminoso e ad alto contrasto, mentre anche la lavorazione e le caratteristiche sono impressionanti.
A differenza dell'Helios 16 ben tarato con la sua RTX 4060, le debolezze dell'Helios 18 con una RTX 4080 più esigente diventano evidenti: il sistema di raffreddamento è molto rumoroso in modalità Turbo e non sembra essere ottimizzato in altre aree. Mentre la maggior parte delle aree del portatile rimane insolitamente fresca, il punto caldo è ancora uno dei più caldi della categoria. Allo stesso tempo, il modello SSD teoricamente forte viene strozzato molto rapidamente. Consigliamo di far funzionare il portatile nella più silenziosa modalità Performance .
Acer Predator Helios 18 è un colosso con prestazioni elevate, ma il sistema di raffreddamento rumoroso deve essere ottimizzato.
Finora abbiamo recensito solo concorrenti da 18 pollici con GPU più deboli, per questo motivo consigliare delle alternative non è così facile. In termini di prestazioni, il 17 pollici MSI Raider GE78HX può tenere il passo, ma ha un display più debole.
Prezzo e disponibilità
Acer Predator Helios 18 N23Q2
- 10/25/2023 v7 (old)
Christian Hintze
Transparency
La selezione dei dispositivi da recensire viene effettuata dalla nostra redazione. Il campione di prova è stato fornito all'autore come prestito dal produttore o dal rivenditore ai fini di questa recensione. L'istituto di credito non ha avuto alcuna influenza su questa recensione, né il produttore ne ha ricevuto una copia prima della pubblicazione. Non vi era alcun obbligo di pubblicare questa recensione. In quanto società mediatica indipendente, Notebookcheck non è soggetta all'autorità di produttori, rivenditori o editori.
Ecco come Notebookcheck esegue i test
Ogni anno, Notebookcheck esamina in modo indipendente centinaia di laptop e smartphone utilizzando procedure standardizzate per garantire che tutti i risultati siano comparabili. Da circa 20 anni sviluppiamo continuamente i nostri metodi di prova e nel frattempo stabiliamo gli standard di settore. Nei nostri laboratori di prova, tecnici ed editori esperti utilizzano apparecchiature di misurazione di alta qualità. Questi test comportano un processo di validazione in più fasi. Il nostro complesso sistema di valutazione si basa su centinaia di misurazioni e parametri di riferimento ben fondati, che mantengono l'obiettività.Price comparison

