Recensione del portatile Razer Blade 18: Più piccolo di molti portatili gaming da 17 pollici
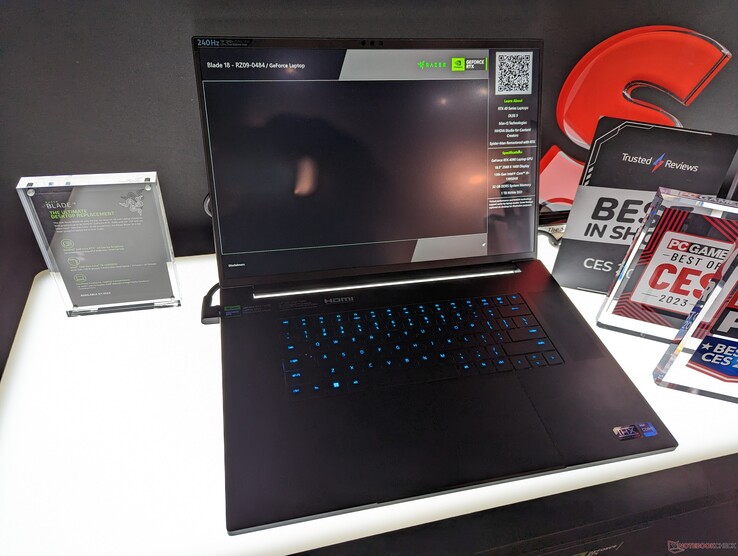
Presentato al CES 2023, il Blade 18 offre lo schermo più grande mai realizzato per un portatile Blade, pur sfoggiando il familiare design dello chassis Razer. Il lancio del modello coincide con il lancio della serie mobile Intel Core di 13a generazione e della serie mobile Nvidia GeForce 40 Ada Lovelace, proprio come è avvenuto per il recente Blade 16.
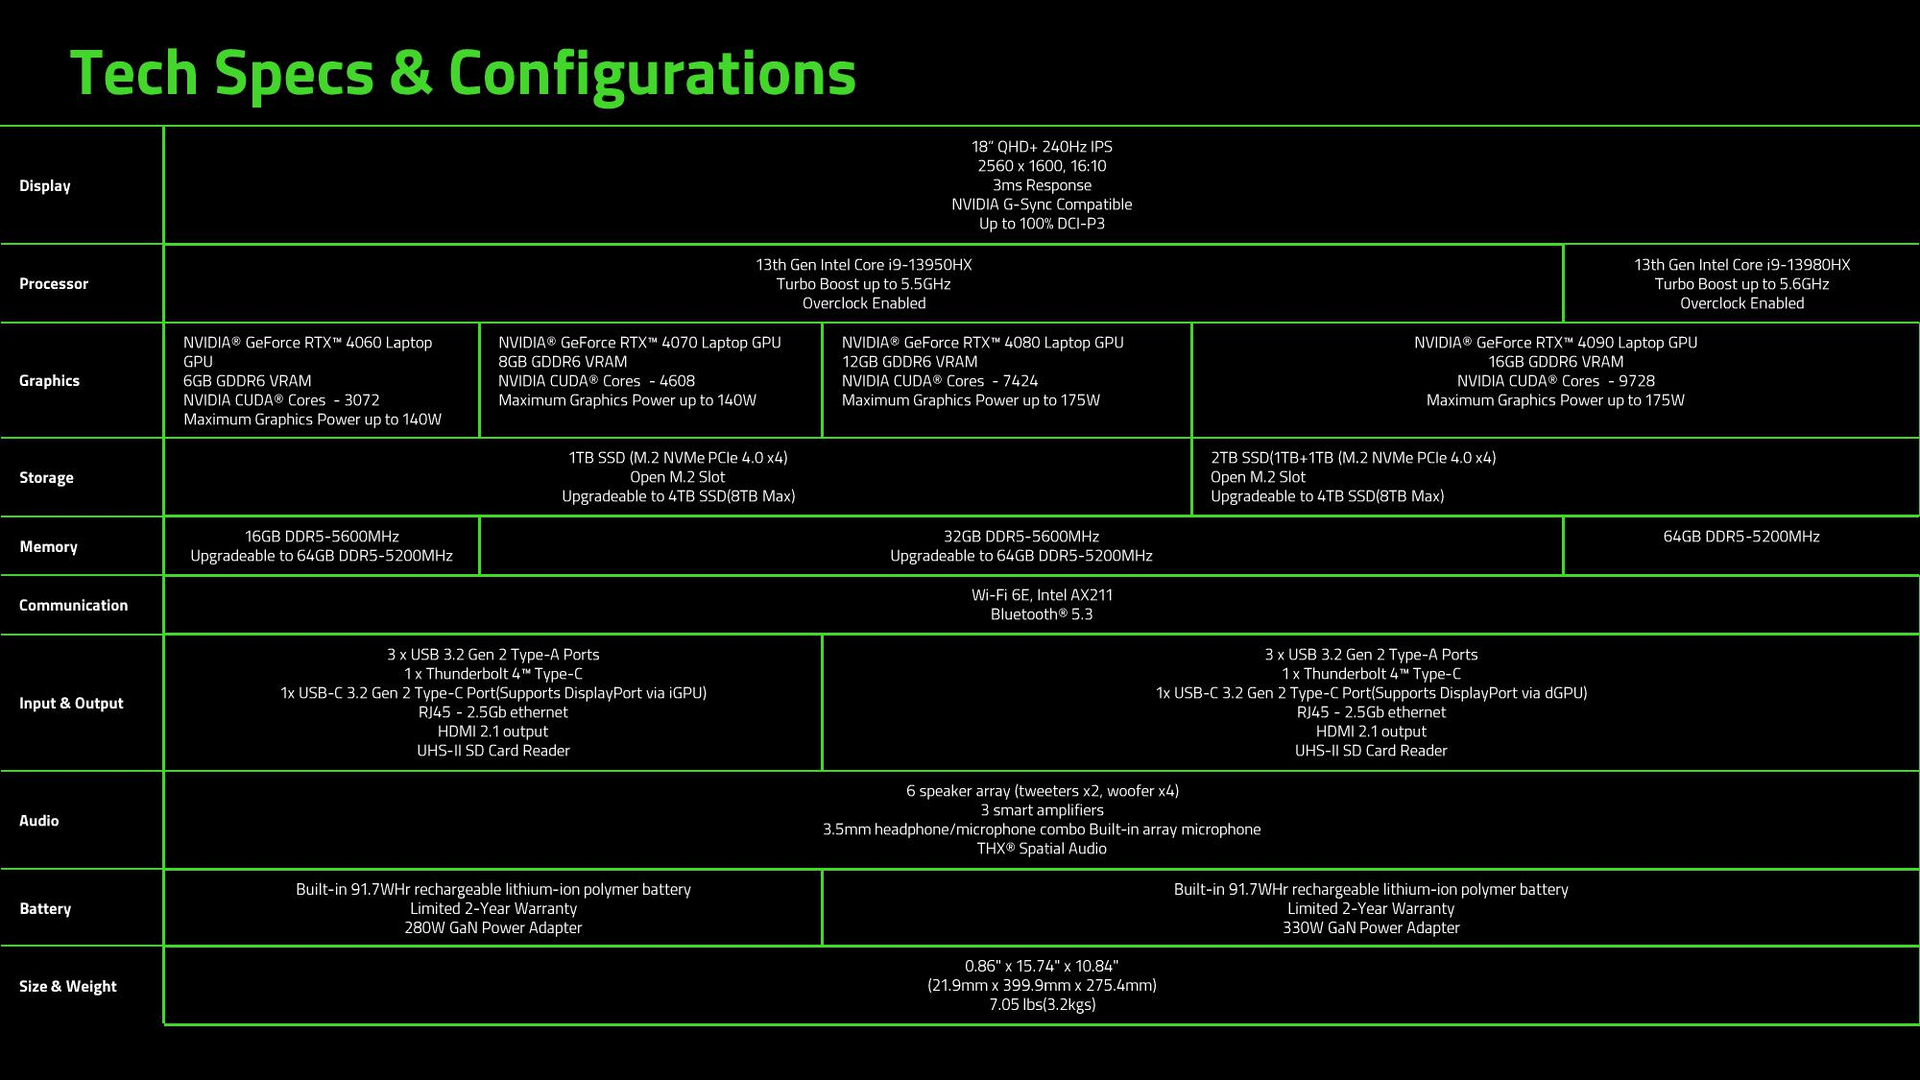
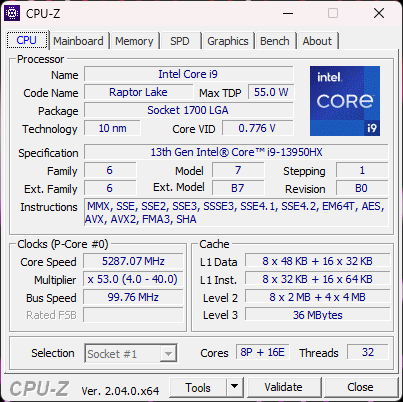
Le configurazioni vanno dalla CPU Core i9-13950HX e dalla GPU RTX 4060 da 140 W di GeForce fino al Core i9-13980HX e alla RTX 4090 da 175 W. Tutte le configurazioni sono dotate dello stesso pannello IPS 16:10 QHD+ 240 Hz. La nostra specifica unità di recensione è una configurazione intermedia con la RTX 4070 da 140 W al prezzo di circa 3.200 dollari.
i portatili da 18 pollici sono poco diffusi, con il vecchio MSI GT83 Titan di 6 anni fa che ne è un esempio notevole. Si prevede che Asus e Dell lanceranno rispettivamente ROG Strix Scar 18 e Alienware m18 per competere direttamente con Razer Blade 18.
Altre recensioni di Razer:
Potenziali concorrenti a confronto
Punteggio | Data | Modello | Peso | Altezza | Dimensione | Risoluzione | Prezzo |
|---|---|---|---|---|---|---|---|
| 91.4 % v7 (old) | 02/2023 | Razer Blade 18 RTX 4070 i9-13950HX, GeForce RTX 4070 Laptop GPU | 3 kg | 21.9 mm | 18.00" | 2560x1600 | |
| 89.9 % v7 (old) | 07/2022 | Razer Blade 17 Early 2022 i9-12900H, GeForce RTX 3080 Ti Laptop GPU | 2.8 kg | 19.9 mm | 17.30" | 3840x2160 | |
| 89 % v7 (old) | 02/2023 | MSI Titan GT77 HX 13VI i9-13950HX, GeForce RTX 4090 Laptop GPU | 3.5 kg | 23 mm | 17.30" | 3840x2160 | |
| 83.3 % v7 (old) | 01/2023 | Gigabyte G7 KE i5-12500H, GeForce RTX 3060 Laptop GPU | 2.6 kg | 25 mm | 17.30" | 1920x1080 | |
| 86.1 % v7 (old) | 01/2023 | Alienware m17 R5 (R9 6900HX, RX 6850M XT) R9 6900HX, Radeon RX 6850M XT | 3.4 kg | 26.7 mm | 17.00" | 3840x2160 | |
| 86.9 % v7 (old) | 11/2022 | Asus ROG Strix Scar 17 SE G733CX-LL014W i9-12950HX, GeForce RTX 3080 Ti Laptop GPU | 2.9 kg | 28.3 mm | 17.30" | 2560x1440 |
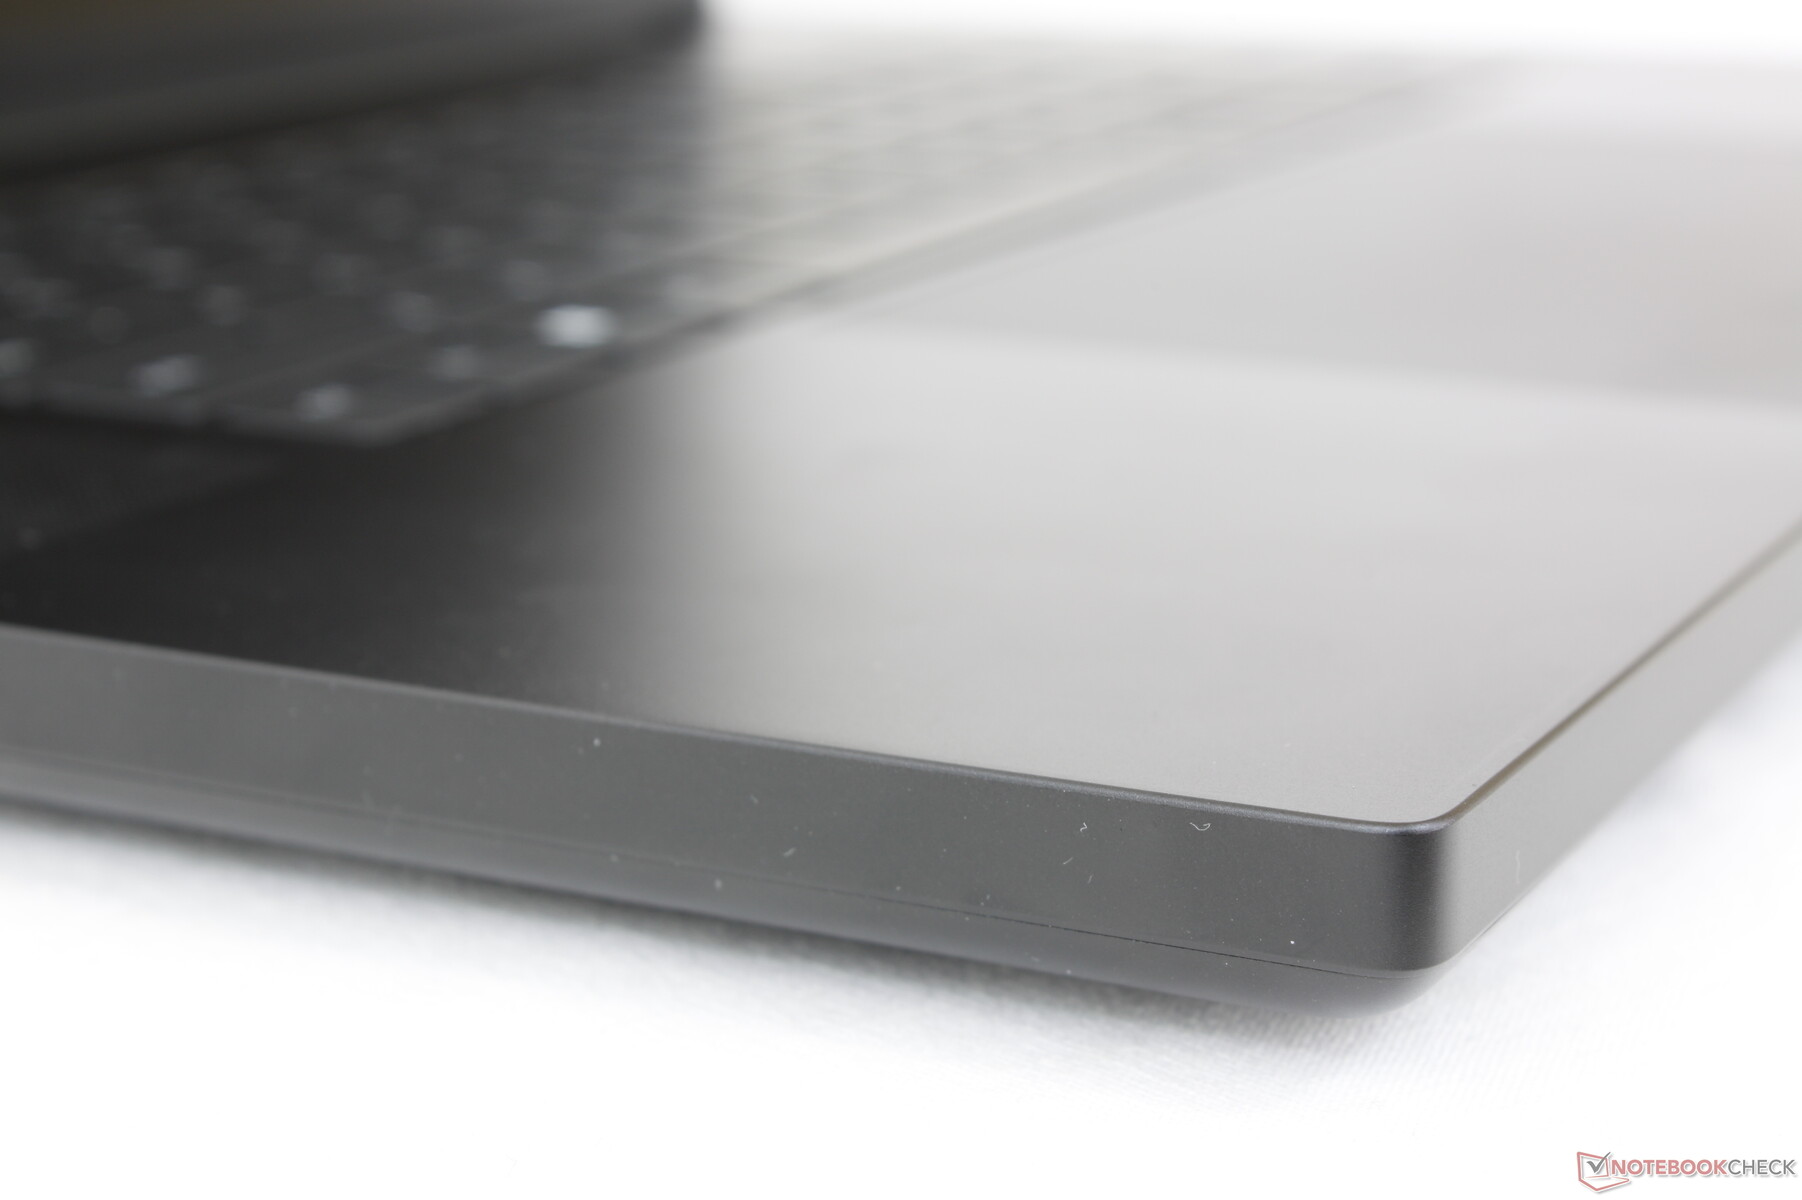
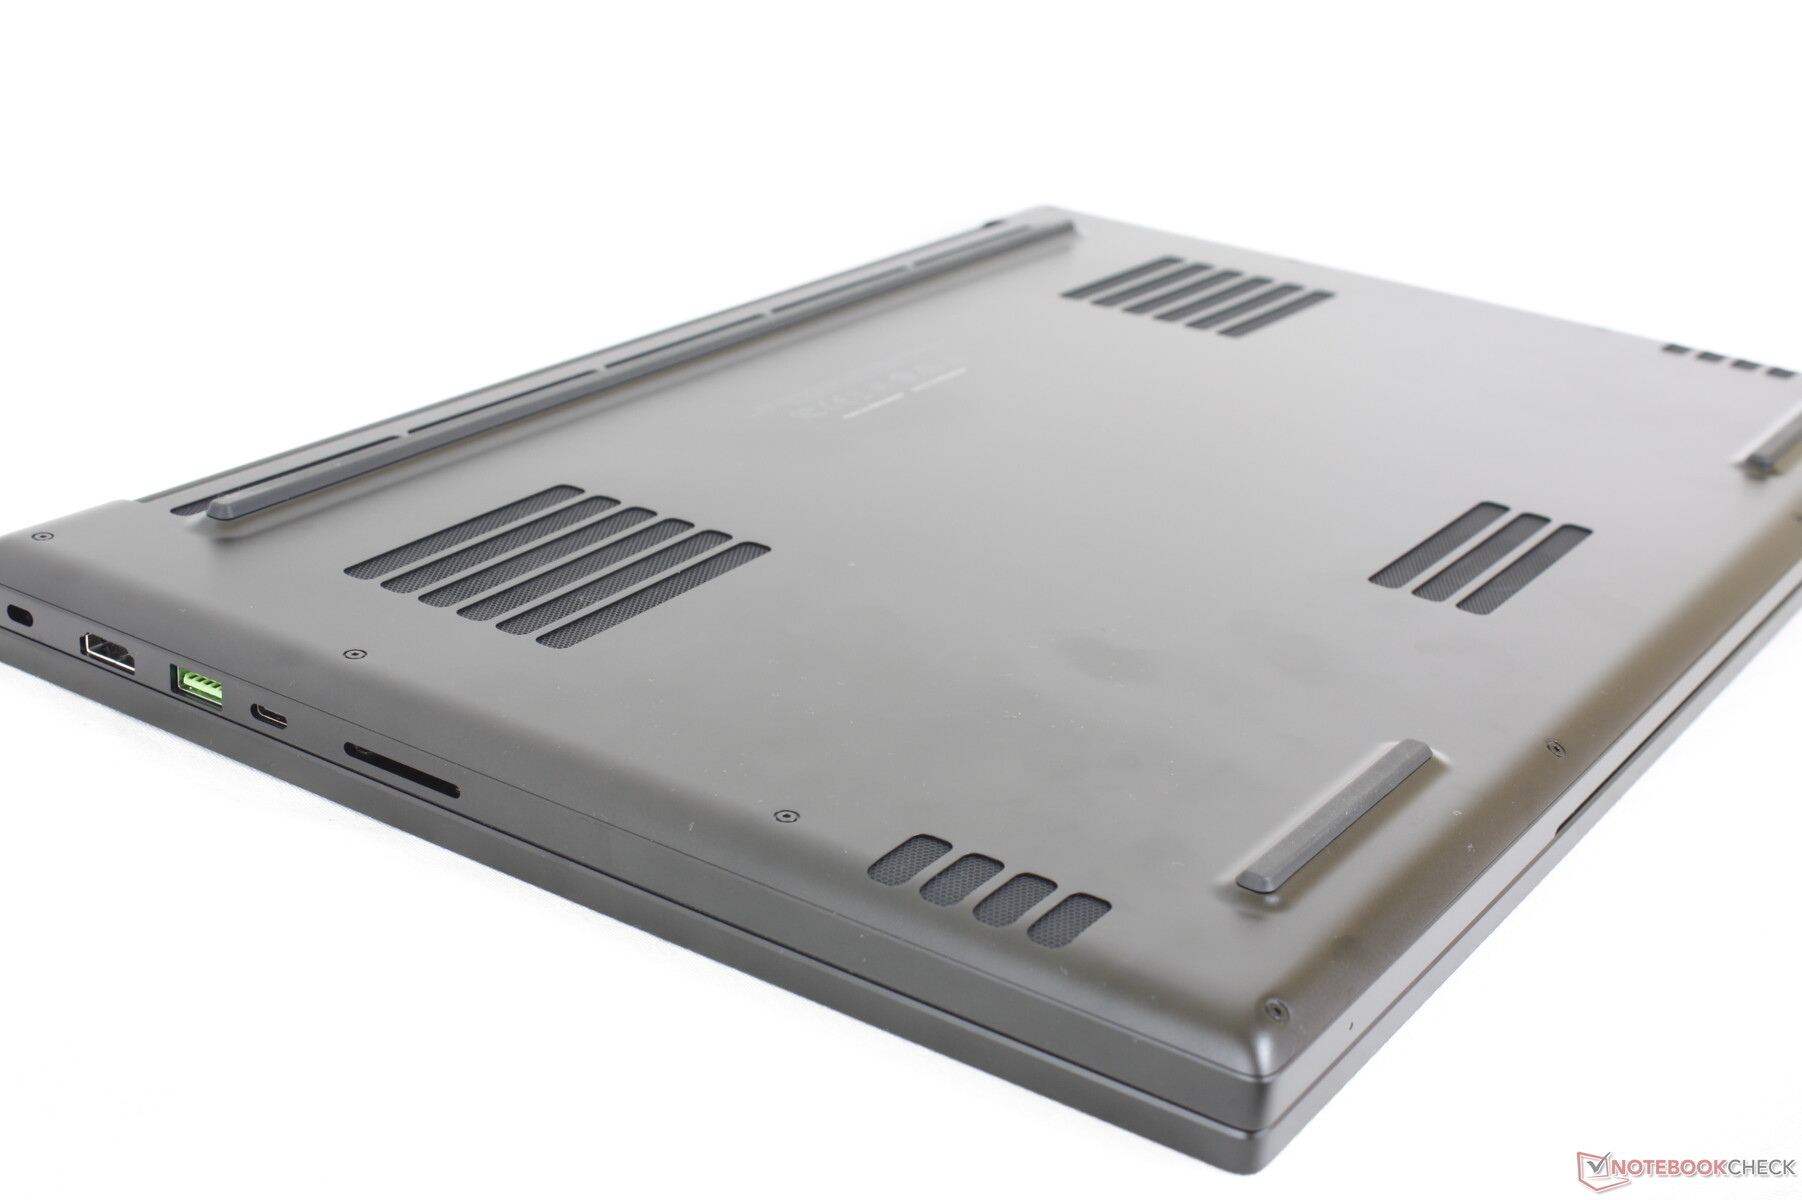
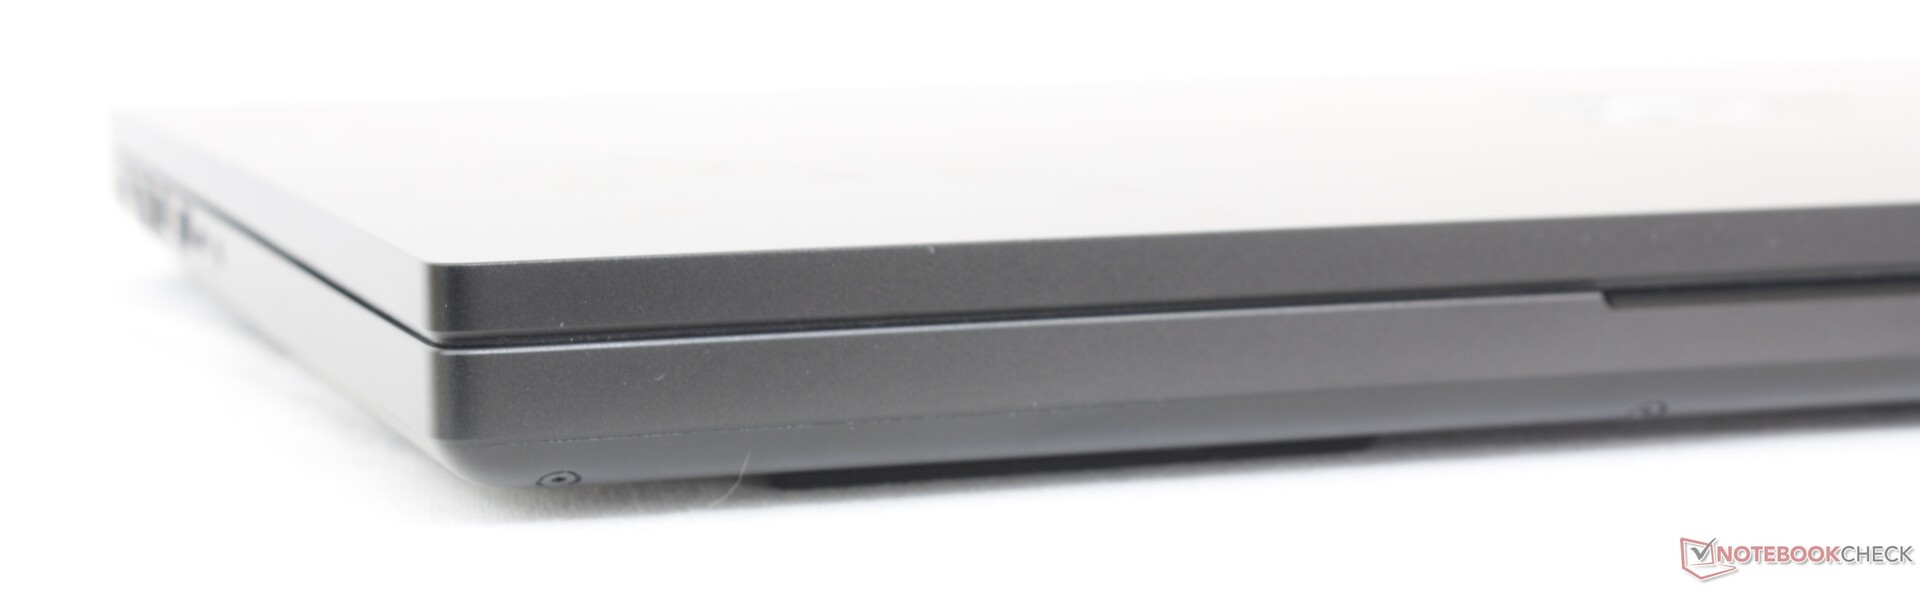
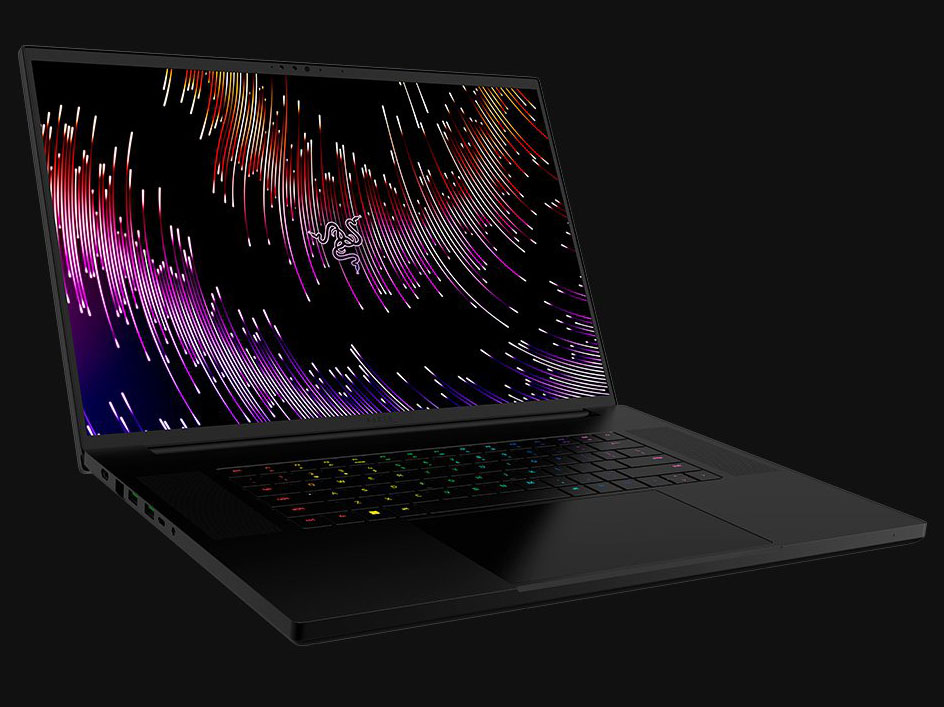
Custodia - Appena più grande del Blade 17
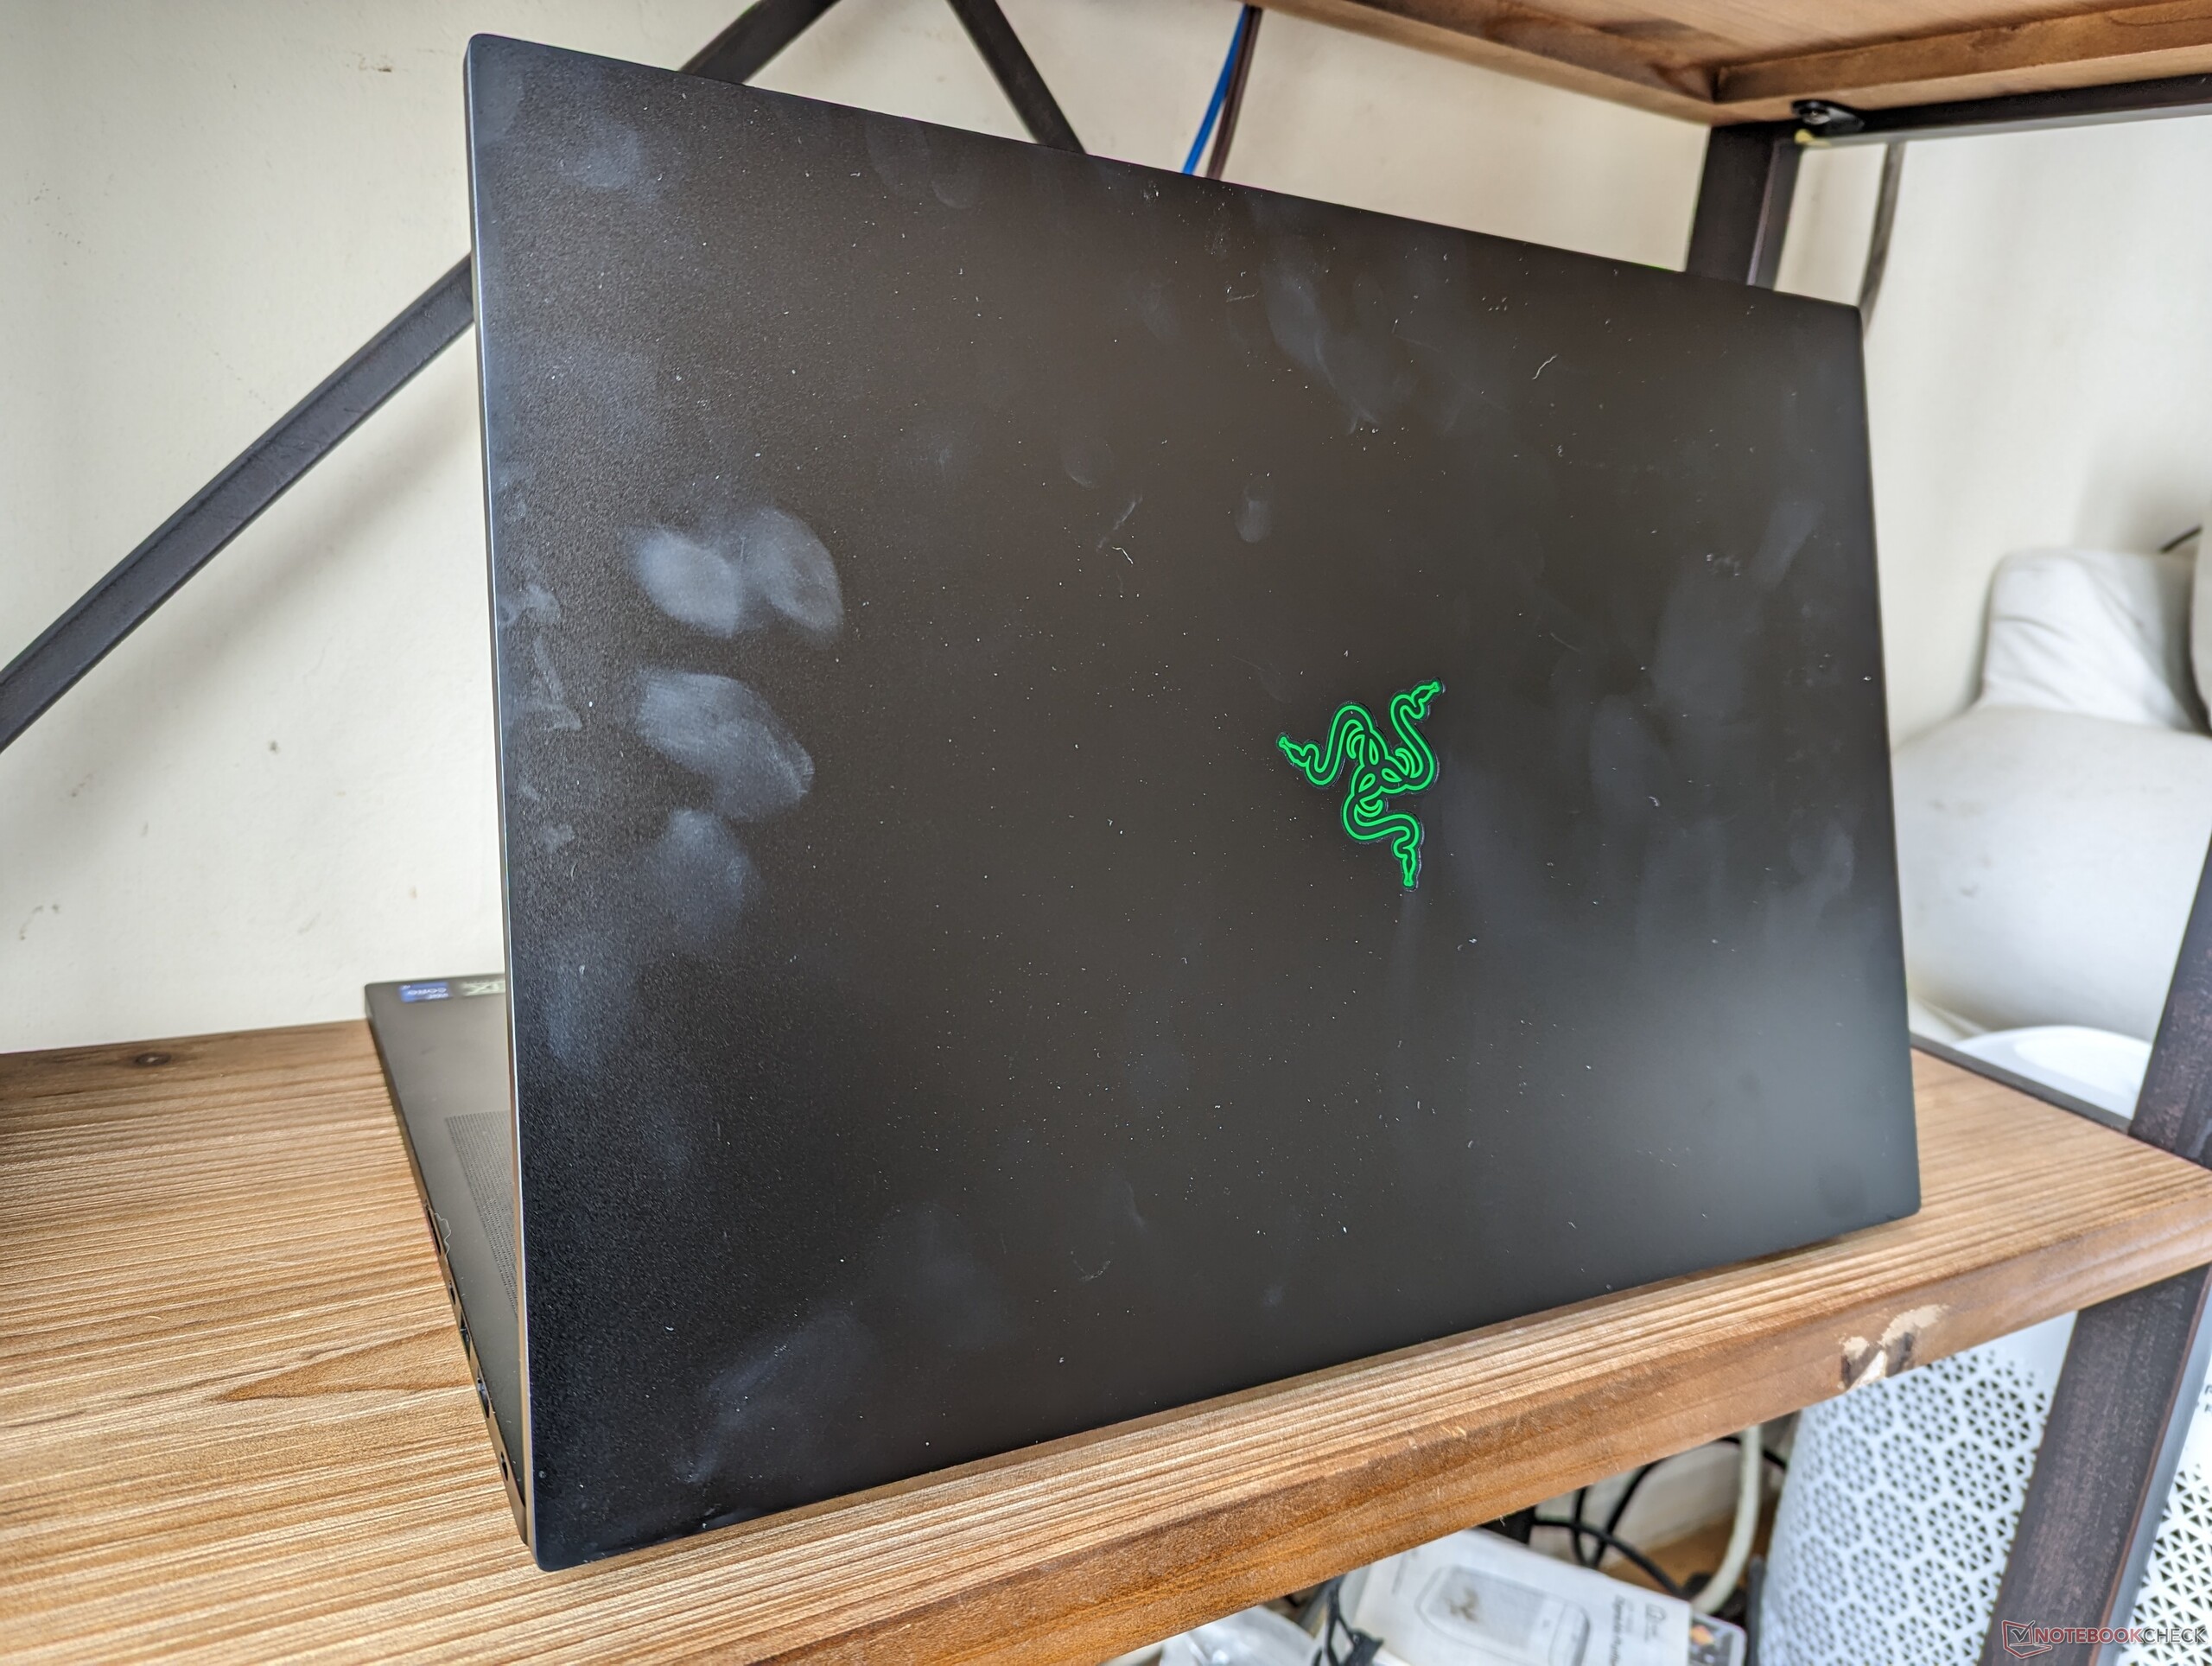
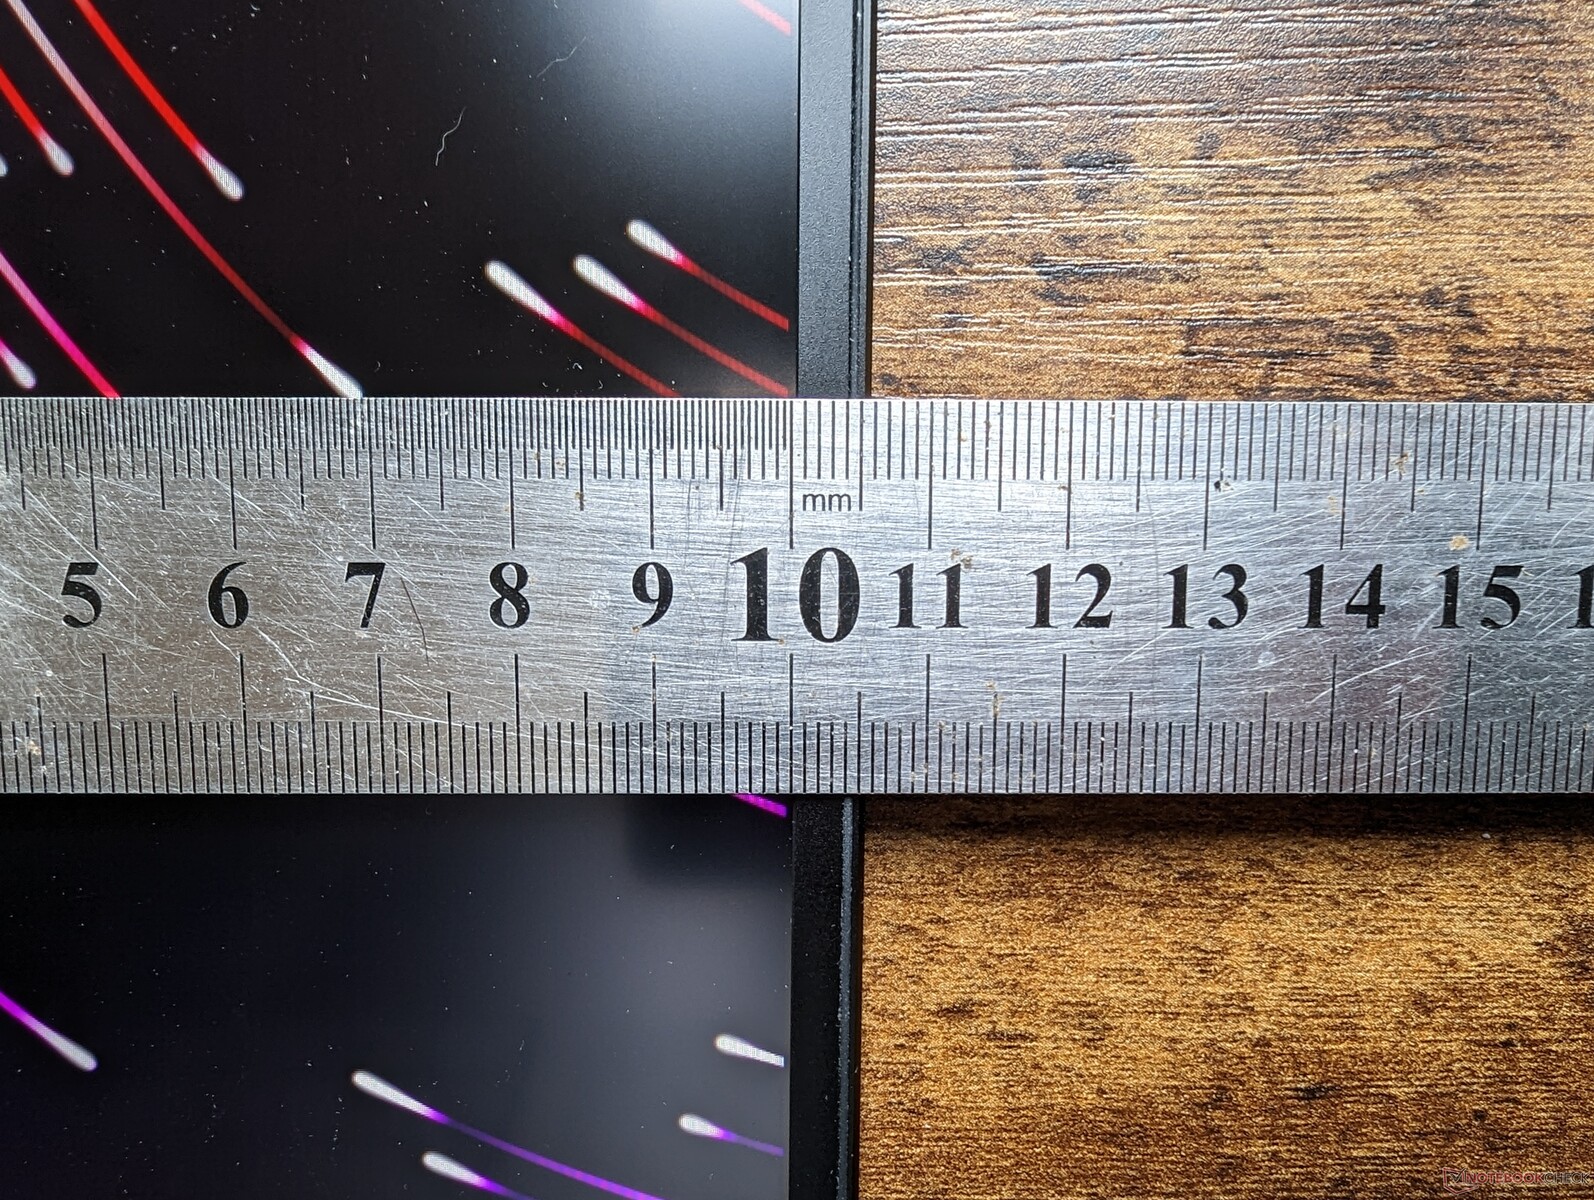
Il Blade 18 può rappresentare una nuova dimensione dello schermo, ma non riserva nuove sorprese in termini di design del telaio. Il modello ha l'aspetto e la sensazione di un Blade 17 da cima a fondo. La più grande differenza visiva riguarda la cornice del mento molto più piccola sul Blade 18 rispetto al Blade 17, per un rapporto schermo/corpo più elevato.
Il fattore di forma più grande da 18 pollici fortunatamente non influisce sulla rigidità dello chassis. Sia la base che il coperchio sono solidi come quelli del Blade 17 e danno un'impressione simile a quella di un MacBook Pro. Le cerniere in particolare reggono bene nonostante il grande schermo, ma il loro angolo massimo è ancora ben al di sotto dei 180 gradi. Il punto più debole del portatile è forse proprio al centro del coperchio esterno, dove la superficie si deforma più facilmente a causa della pressione esercitata.
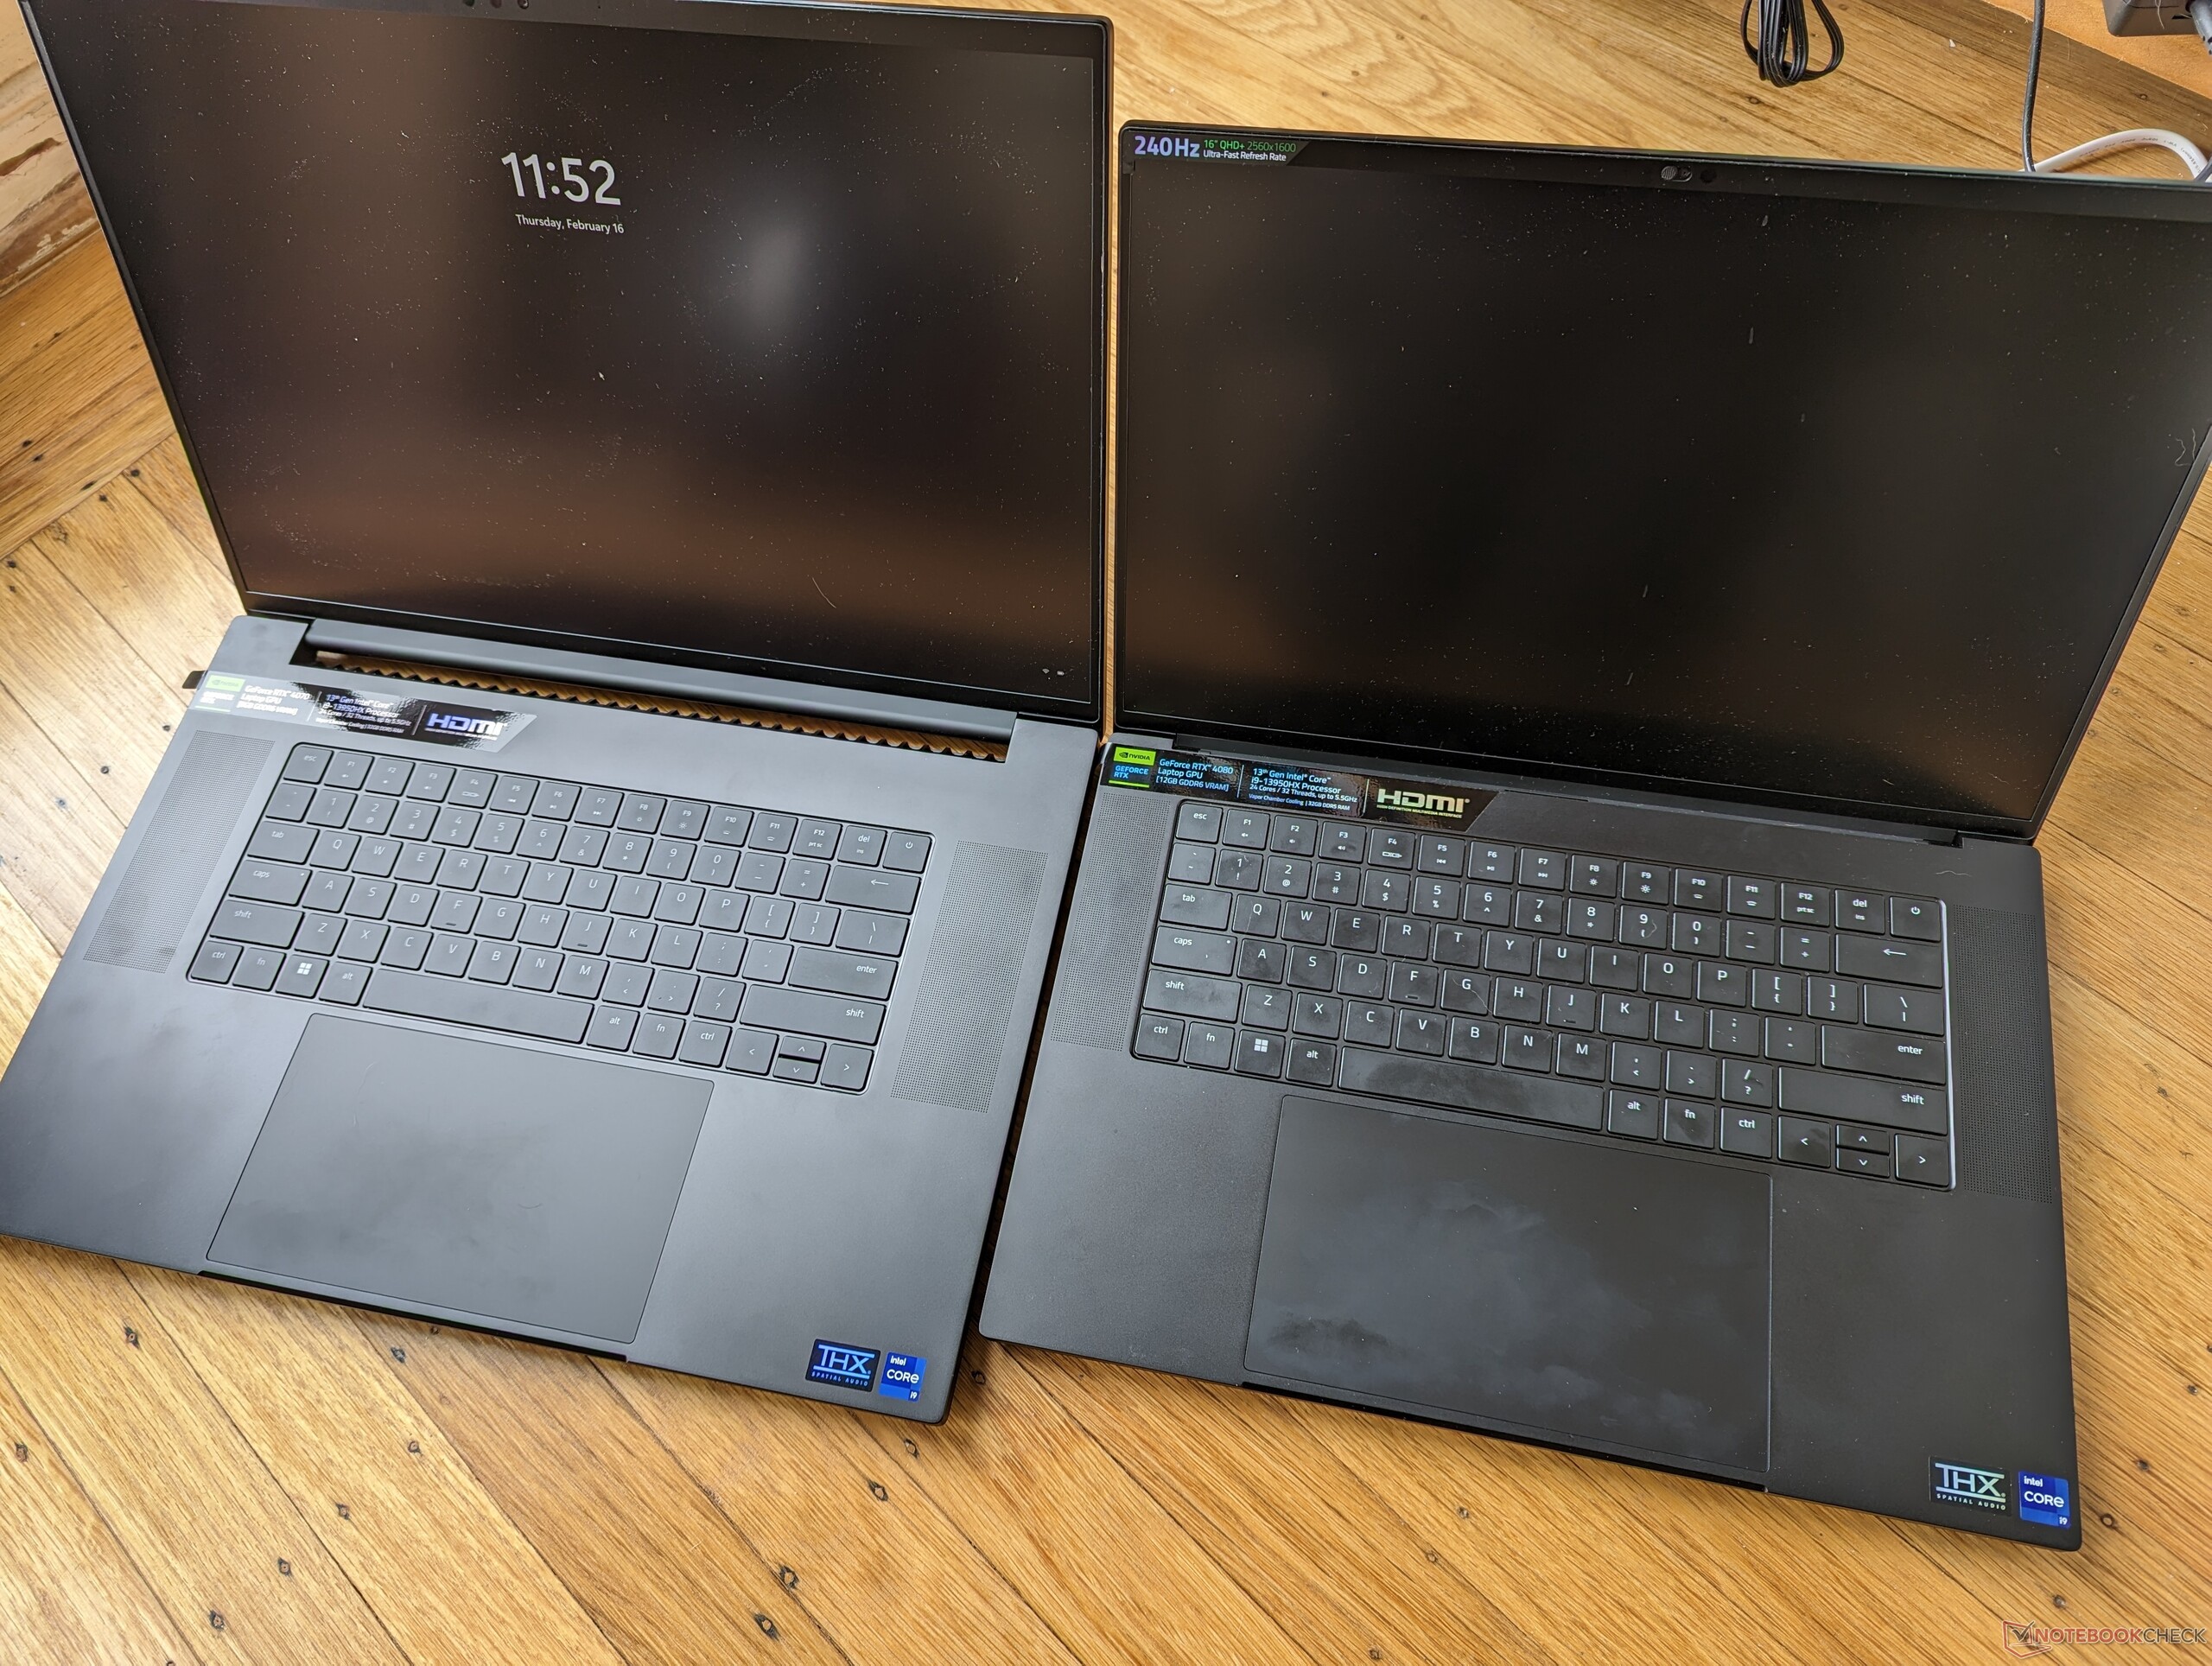
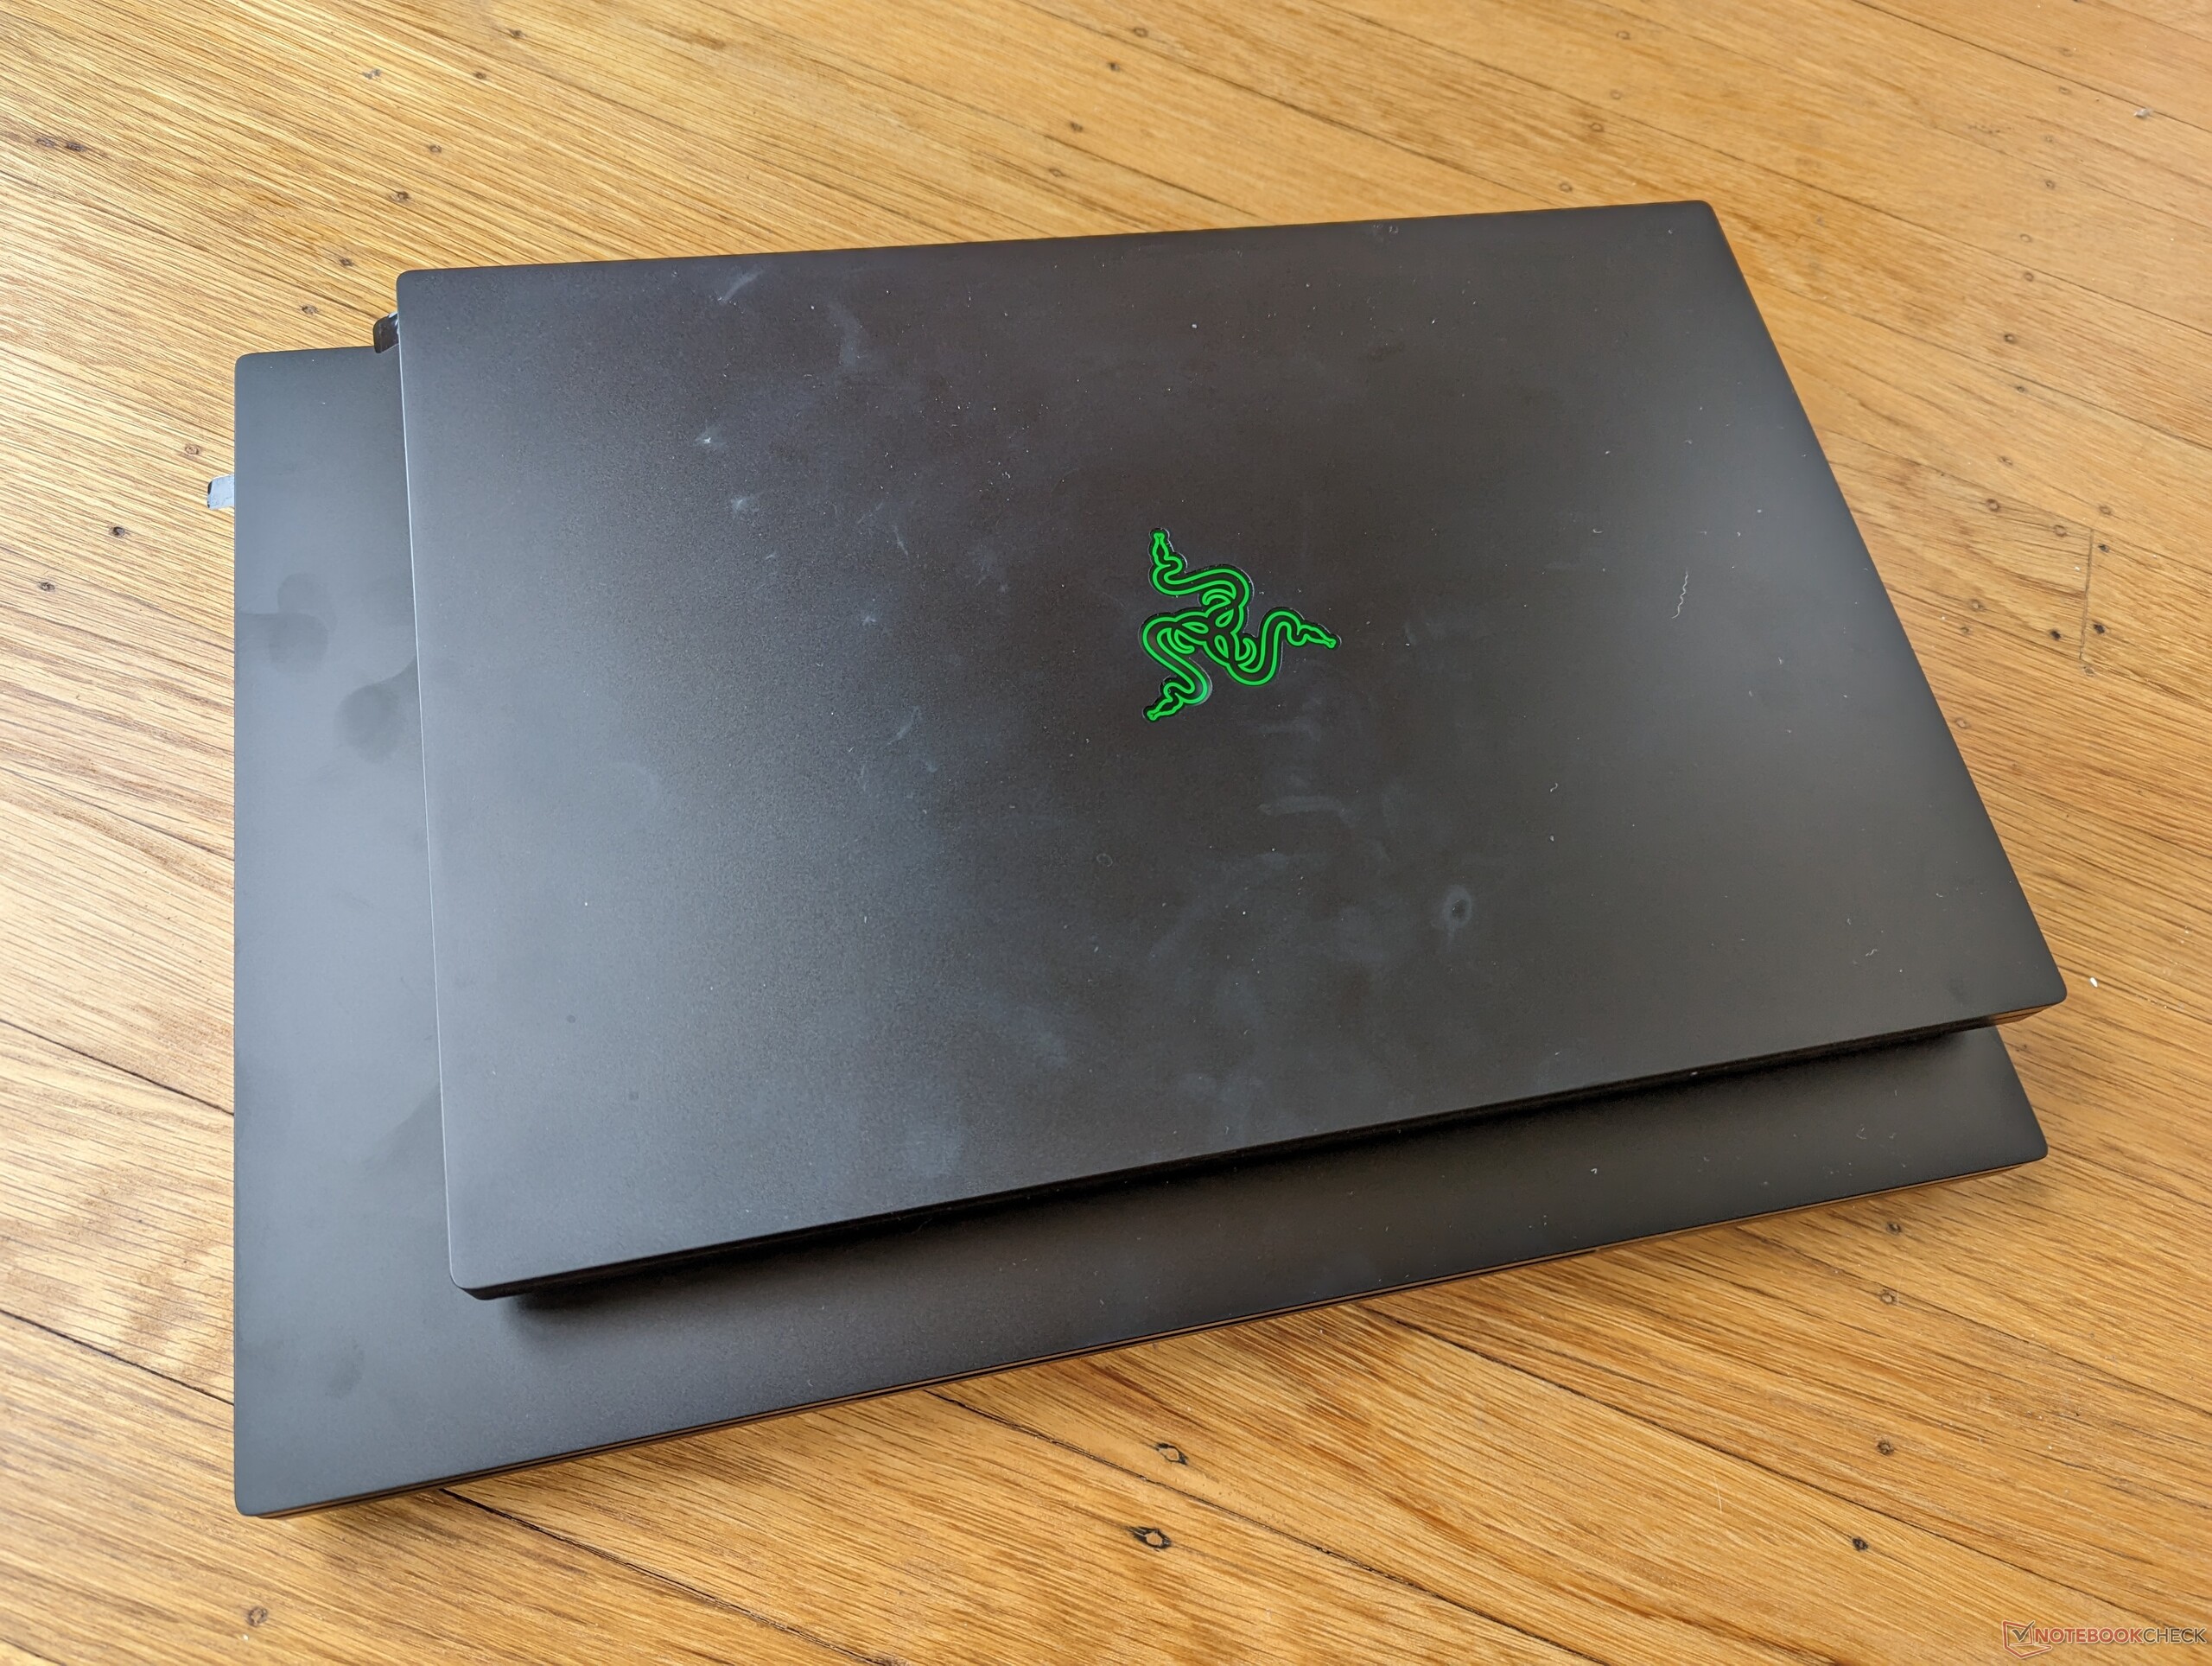
Razer è orgogliosa di sottolineare che il Blade 18 è solo il 18% più grande in termini di volume e il 7% più pesante del Blade 17 del 2022, nonostante le differenze di dimensioni dello schermo. Pertanto, il nuovo modello da 18 pollici non risulta così ingombrante come ci si potrebbe aspettare inizialmente. Infatti, alcuni portatili da gioco da 17,3 pollici sono più grandi o addirittura più pesanti del Blade 18, tra cui l'Asus ROG Strix Scar 17 SE o Alienware m17 R5.
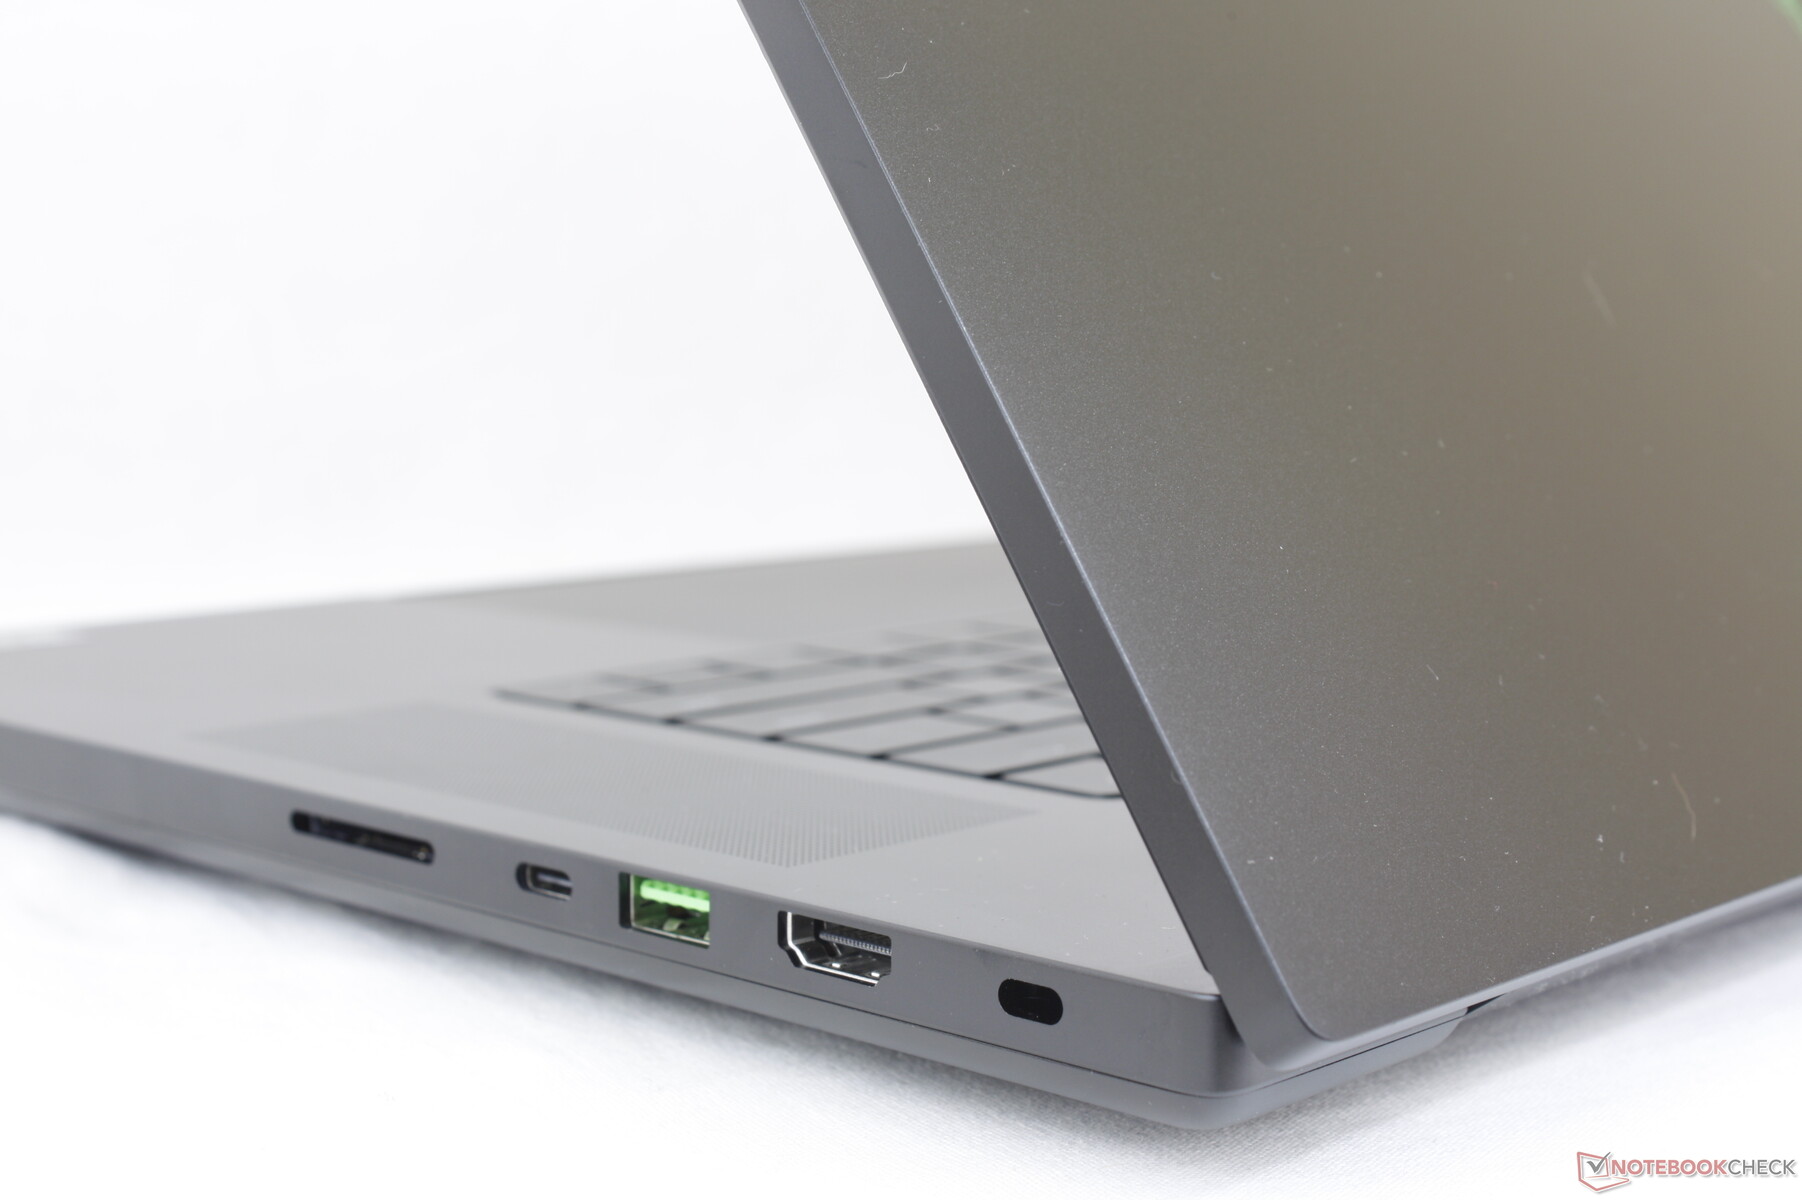
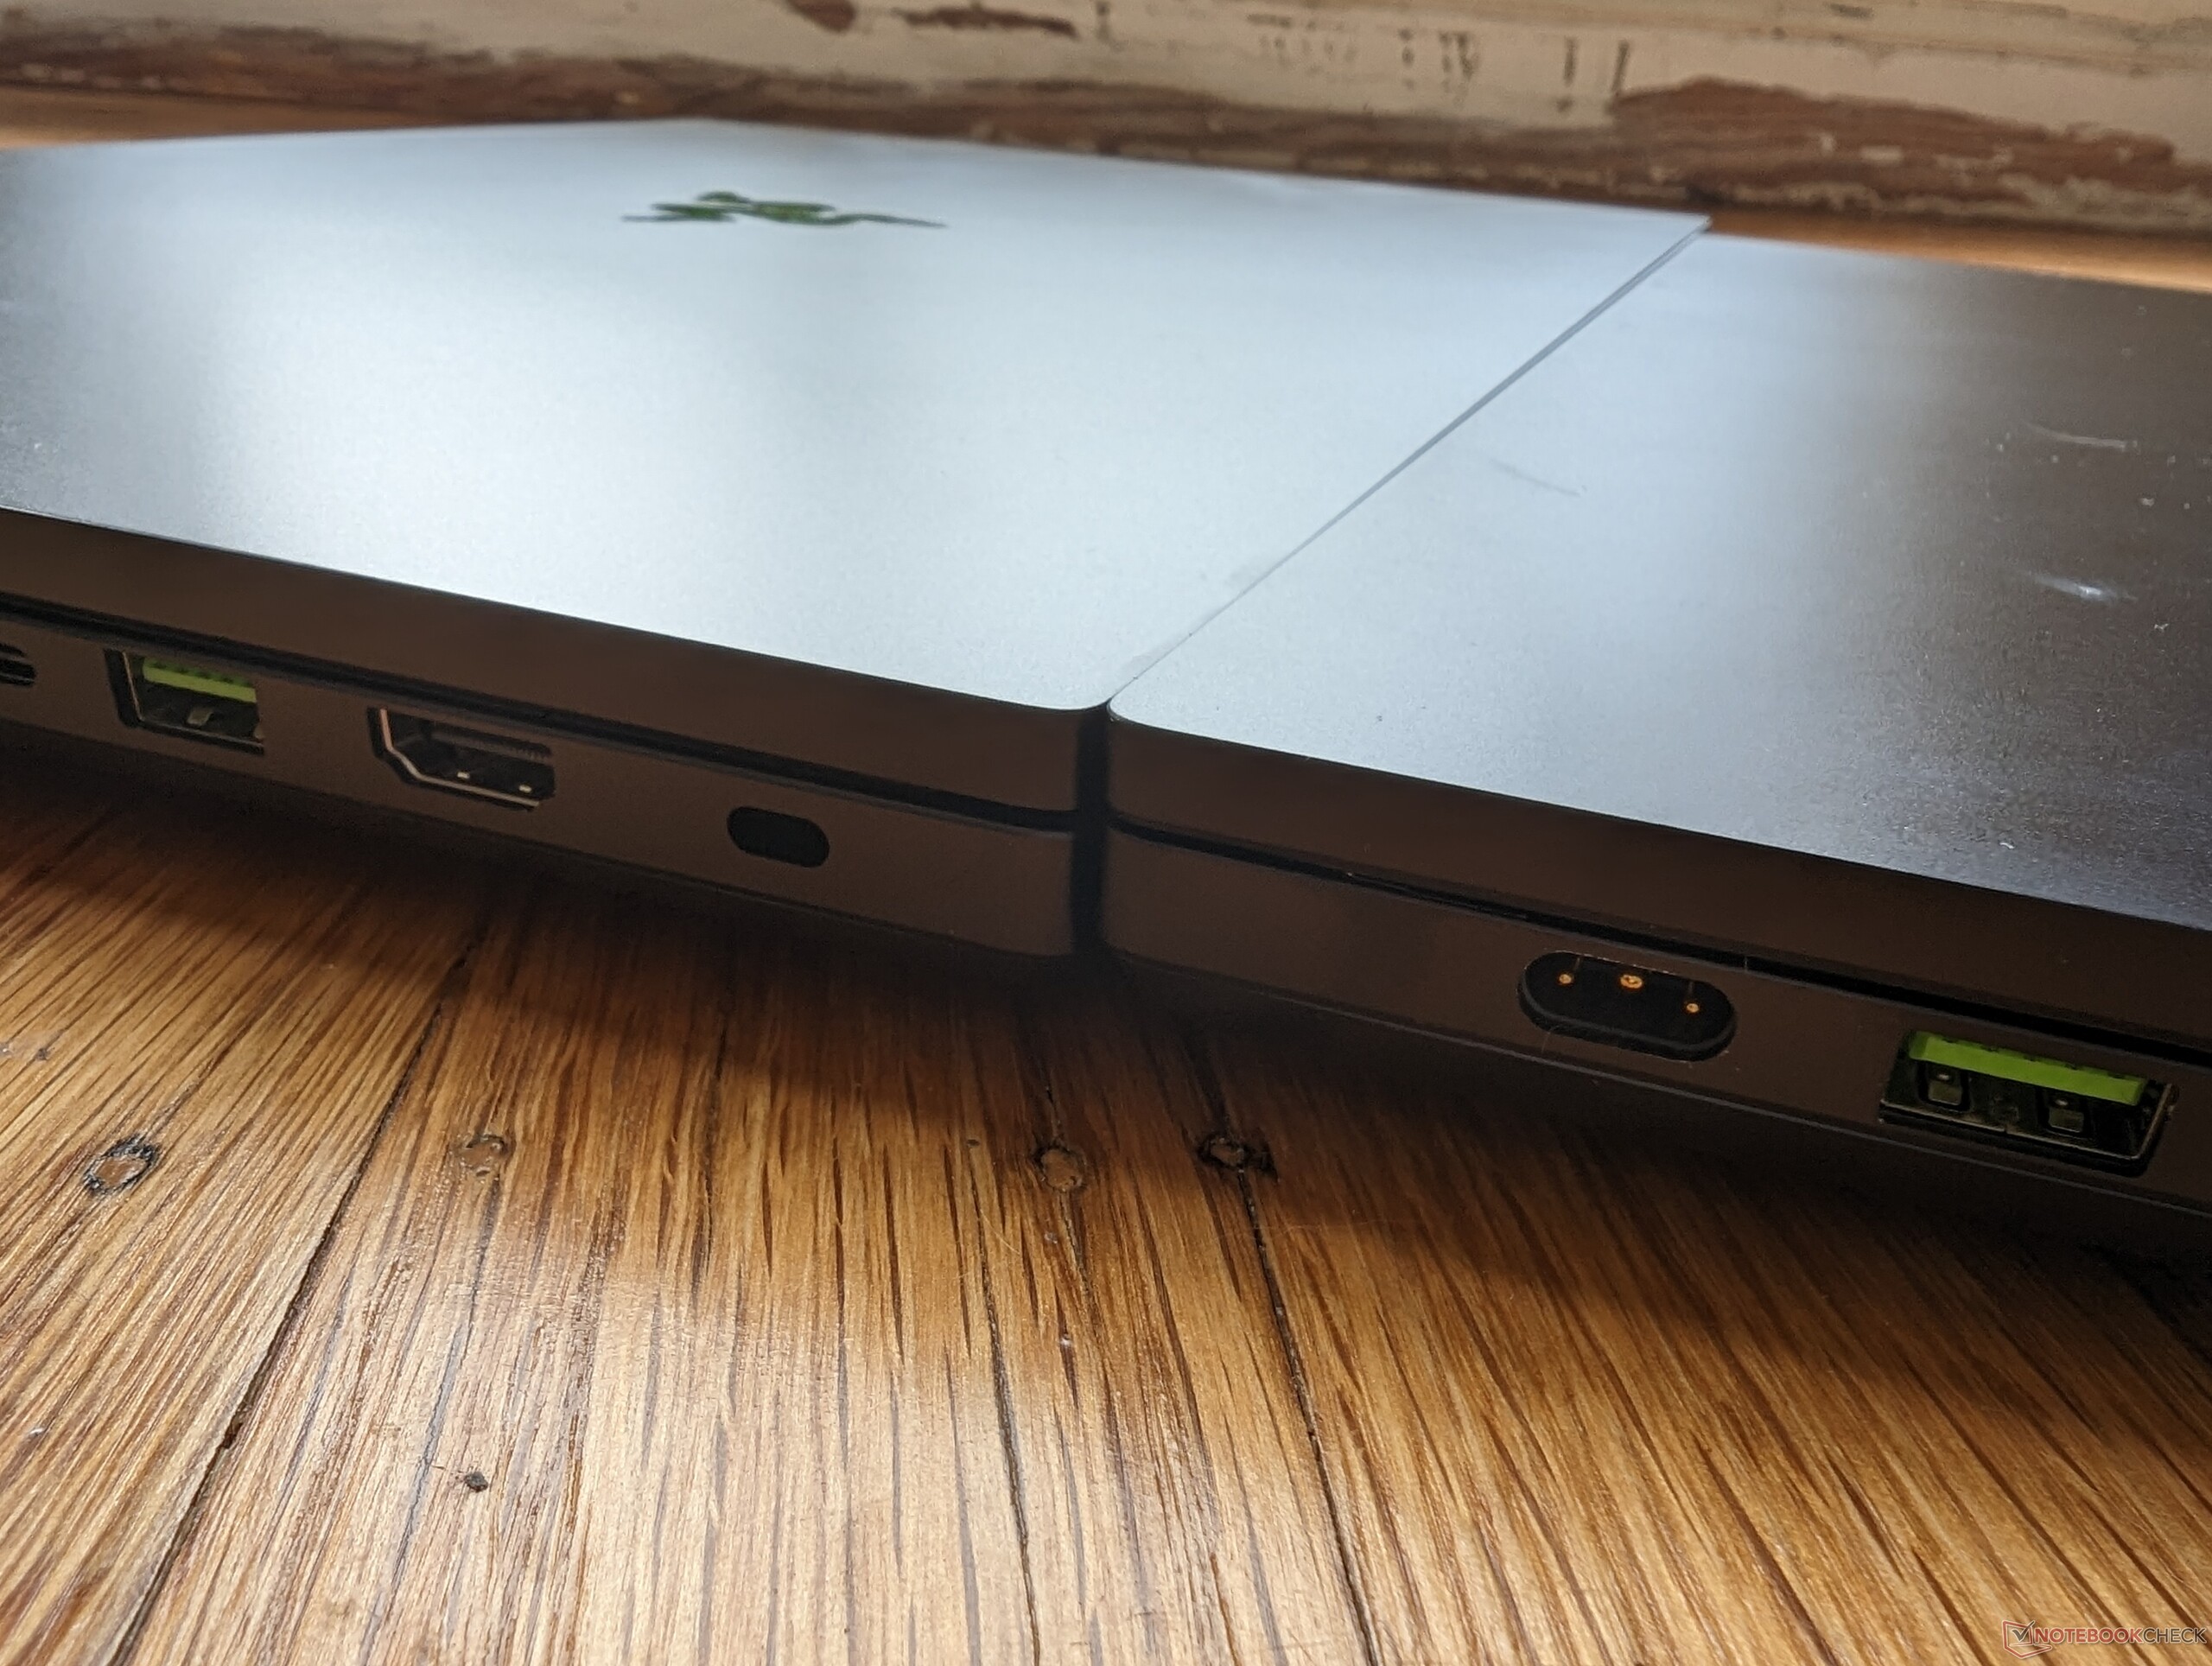
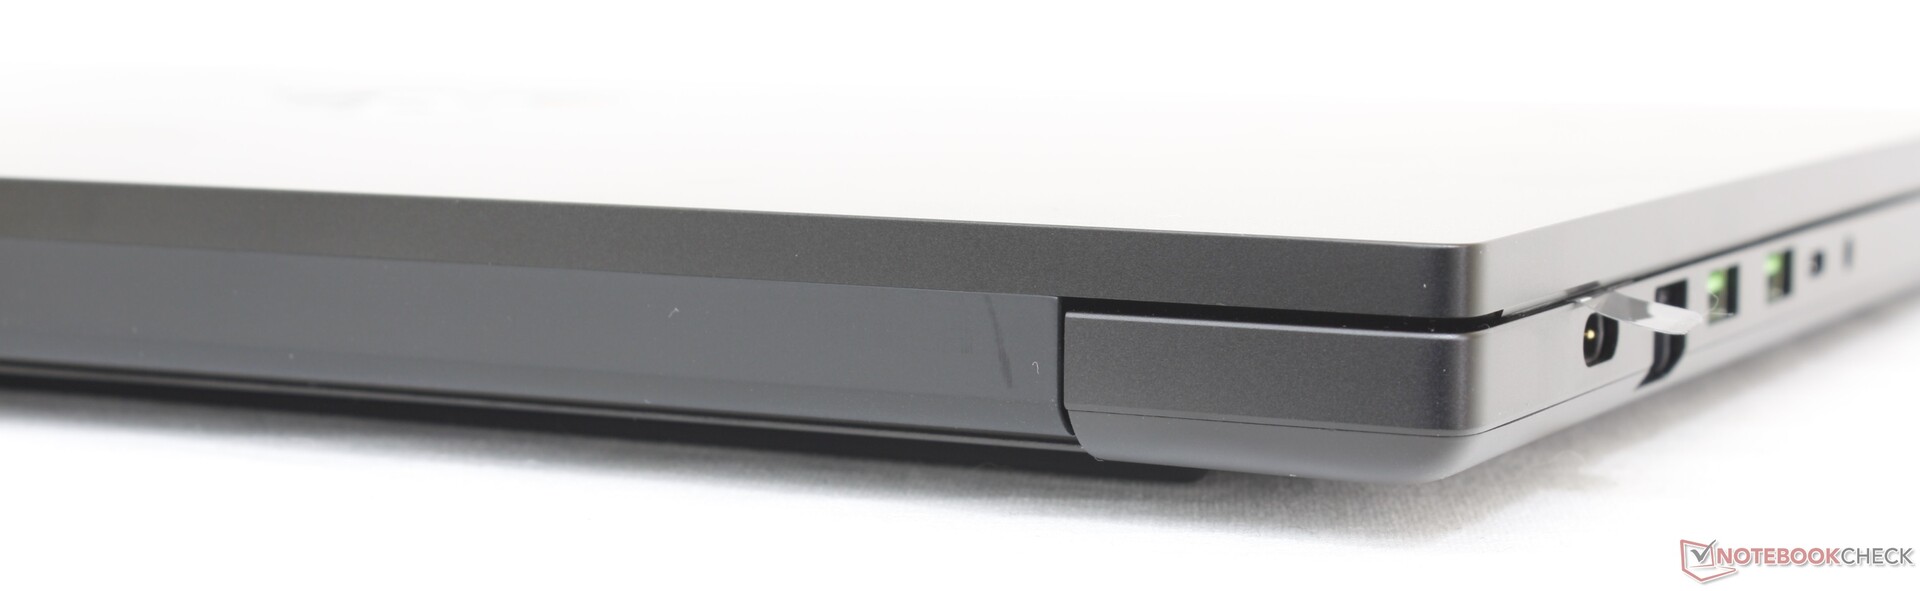
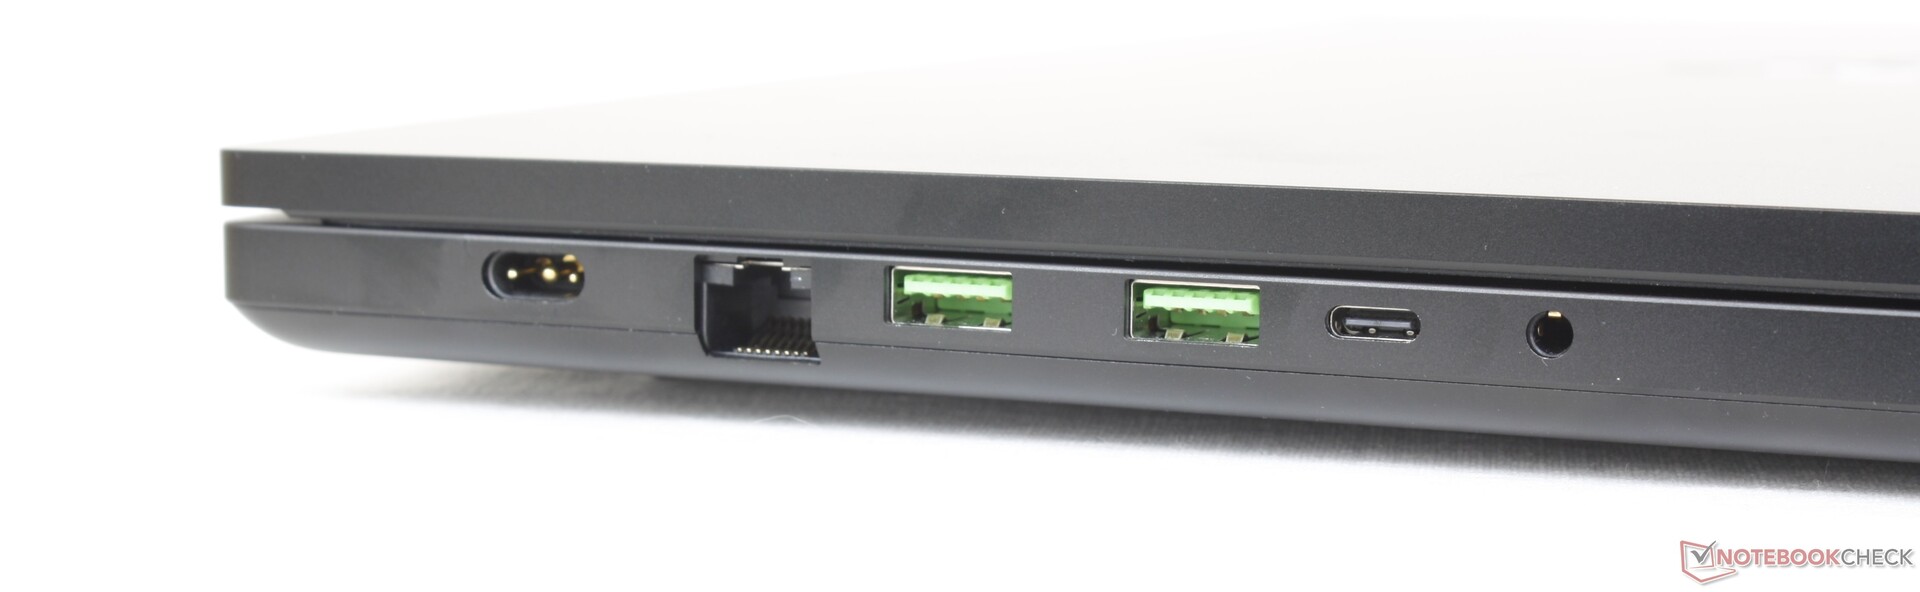
Connettività: il solito
Il nuovo modello eredita tutte le porte del Blade 17 per una buona selezione di opzioni di connettività. Tuttavia, avremmo voluto vedere qualcosa di più per distinguere meglio il Blade 18 dai suoi fratelli minori. Ad esempio, una porta HDMI avrebbe aggiunto maggiore versatilità allo spazioso schermo da 18 pollici.
Tenete presente che solo una delle due porte USB-C è compatibile con i dispositivi Thunderbolt.
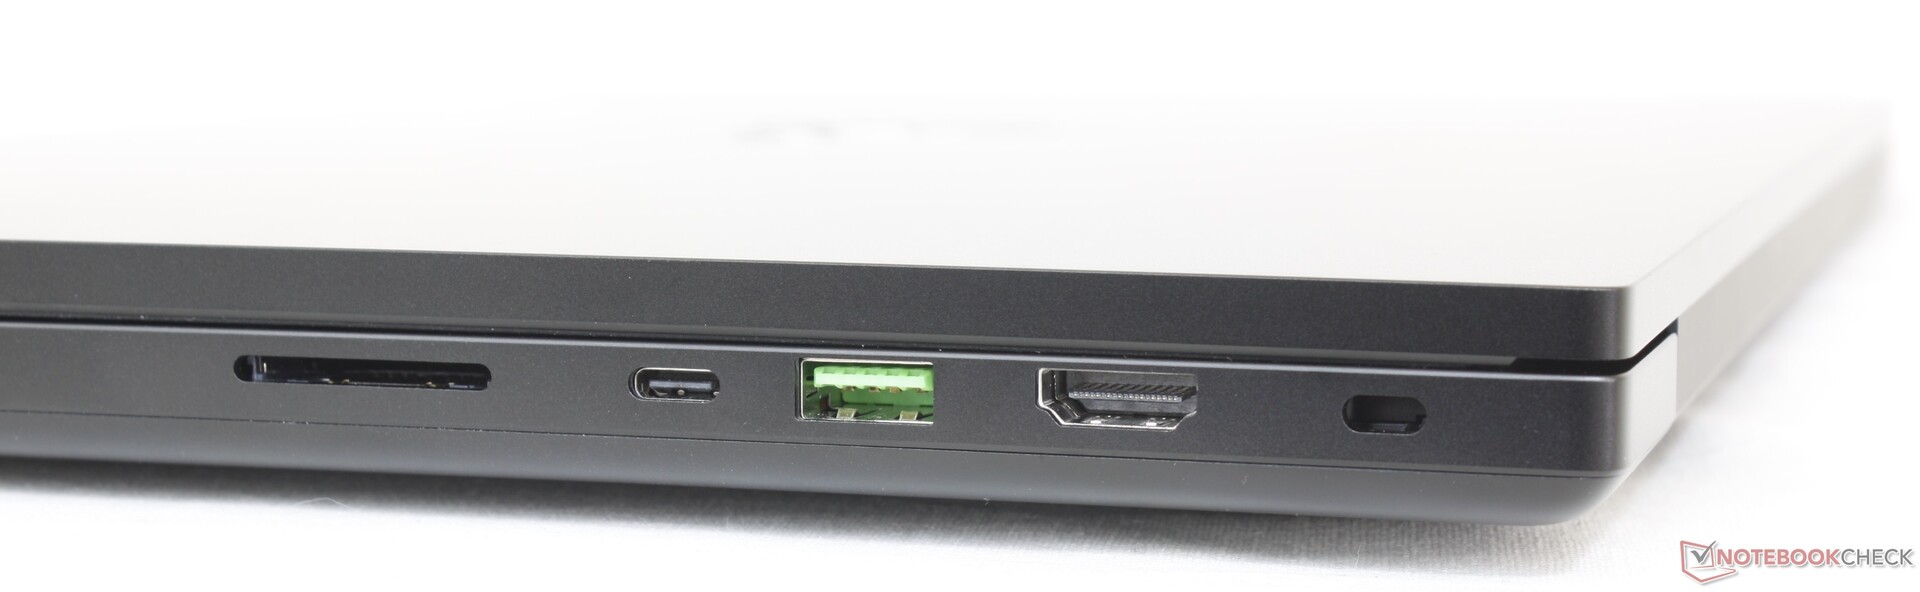
Lettore di schede SD
Siamo in grado di spostare 1 GB di immagini dalla nostra scheda di prova UHS-II al desktop in soli 5 secondi rispetto ai circa 13 secondi dellaMSI Titan GT77.
| SD Card Reader | |
| average JPG Copy Test (av. of 3 runs) | |
| Razer Blade 18 RTX 4070 (Angelibird AV Pro V60) | |
| Razer Blade 17 Early 2022 (AV PRO microSD 128 GB V60) | |
| Razer Blade 16 Early 2023 (AV PRO microSD 128 GB V60) | |
| MSI Titan GT77 HX 13VI (Angelibird AV Pro V60) | |
| maximum AS SSD Seq Read Test (1GB) | |
| Razer Blade 18 RTX 4070 (Angelibird AV Pro V60) | |
| Razer Blade 16 Early 2023 (AV PRO microSD 128 GB V60) | |
| Gigabyte G7 KE (AV PRO microSD 128 GB V60) | |
| MSI Titan GT77 HX 13VI (Angelibird AV Pro V60) | |
Comunicazione
L'Intel AX211 è fornito di serie per la connettività Wi-Fi 6E e Bluetooth 5.3, mentre il Blade 17 viene fornito con il Killer AX1690i. Il Killer AX1690i è il derivato specifico per il gioco dell'Intel AX211 e quindi gli utenti non dovrebbero notare differenze significative nelle prestazioni tra i due.
| Networking | |
| iperf3 transmit AXE11000 6GHz | |
| Asus ROG Strix Scar 17 SE G733CX-LL014W | |
| Razer Blade 18 RTX 4070 | |
| iperf3 receive AXE11000 6GHz | |
| Asus ROG Strix Scar 17 SE G733CX-LL014W | |
| Razer Blade 18 RTX 4070 | |
| iperf3 receive AXE11000 | |
| Razer Blade 17 Early 2022 | |
| Gigabyte G7 KE | |
| MSI Titan GT77 HX 13VI | |
| Razer Blade 18 RTX 4070 | |
| Alienware m17 R5 (R9 6900HX, RX 6850M XT) | |
| iperf3 transmit AXE11000 | |
| Gigabyte G7 KE | |
| MSI Titan GT77 HX 13VI | |
| Razer Blade 18 RTX 4070 | |
| Alienware m17 R5 (R9 6900HX, RX 6850M XT) | |
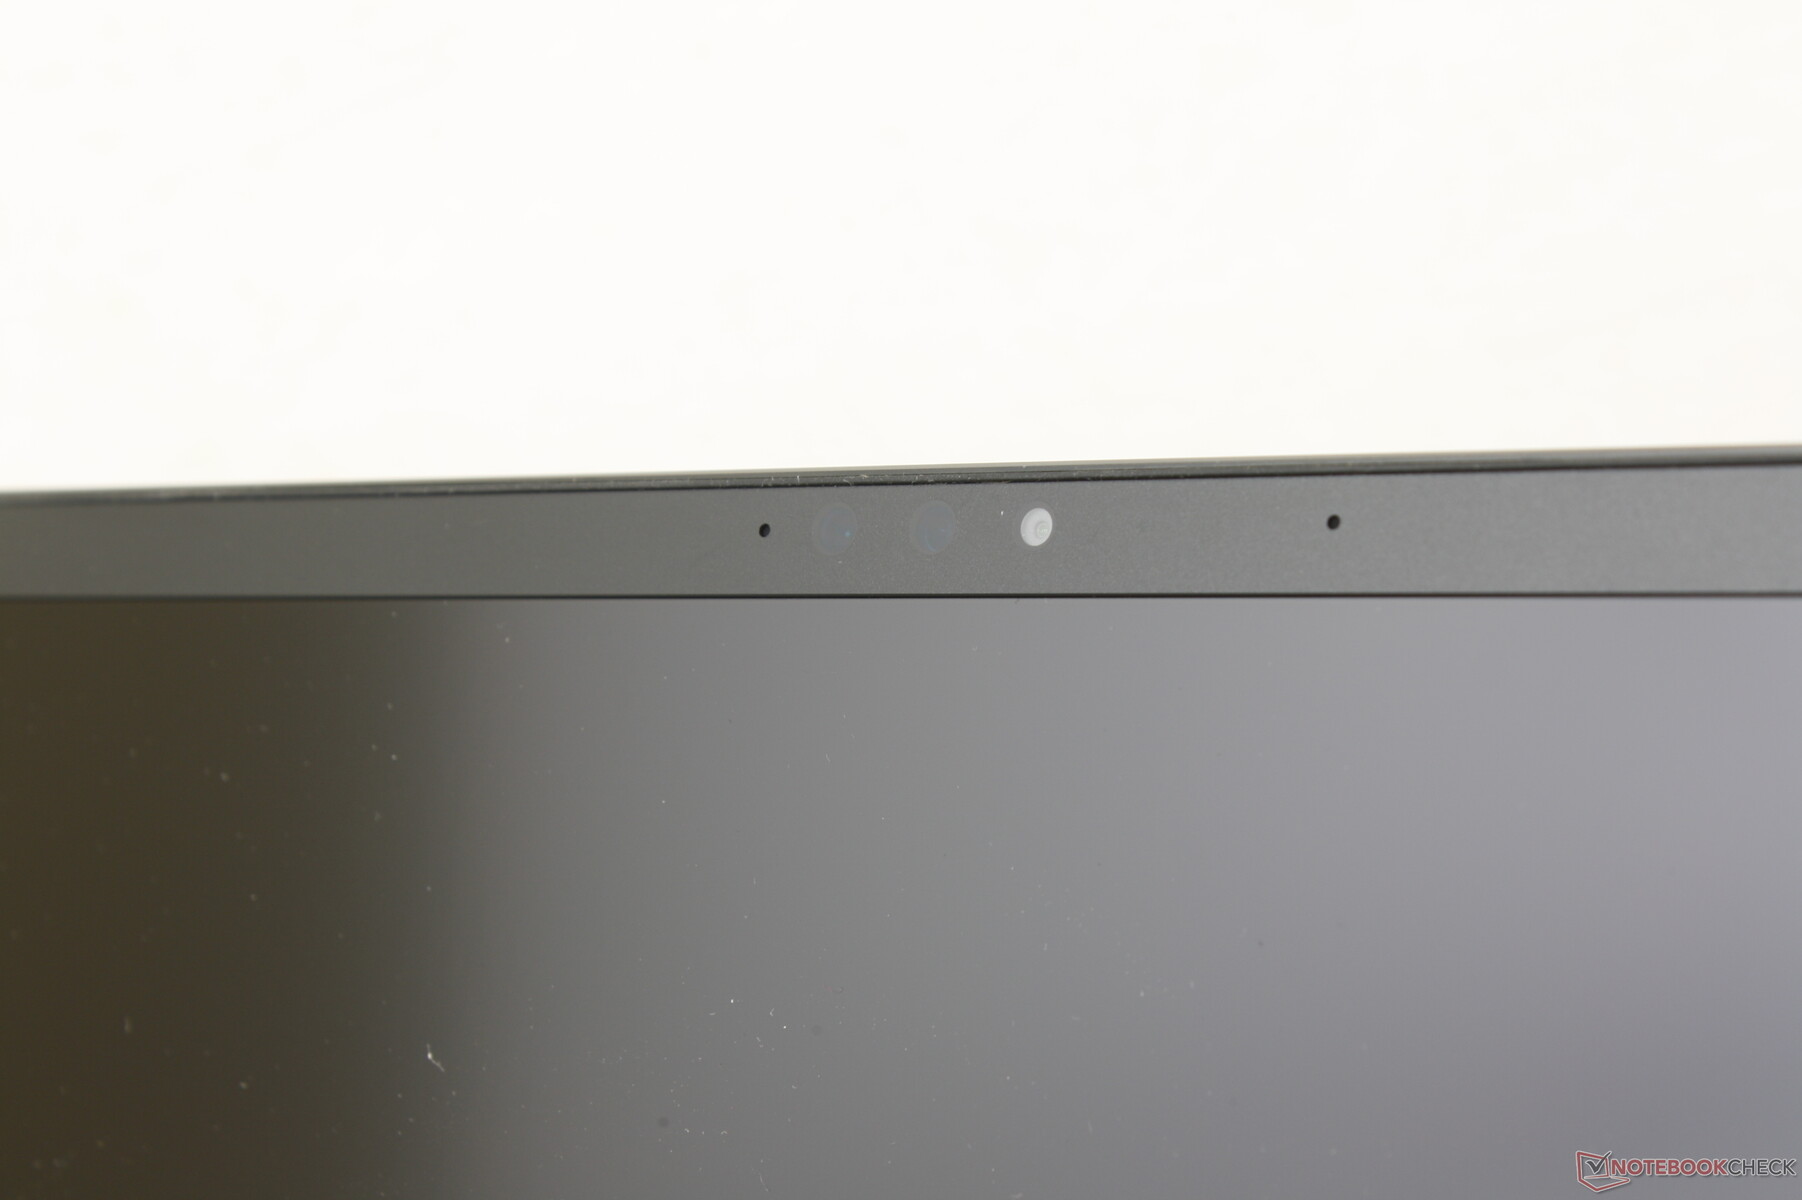
Webcam - Ora a 5 MP
Razer ha migliorato la webcam da 2 MP sul Blade 17 a 5 MP sul Blade 18. Ci aspettiamo che il produttore inizi ad aggiornare i modelli Blade più piccoli con lo stesso sensore da 5 MP in un prossimo futuro. Le immagini sono più nitide con il sensore da 5 MP, mentre i colori non sono cambiati di molto. L'IR è di serie per il supporto di Windows Hello.
Stranamente, non c'è un otturatore fisico per la privacy della webcam anche se il Blade 16 ne incorpora uno. Non c'è nemmeno un tasto di spegnimento digitale o un tasto di scelta rapida.


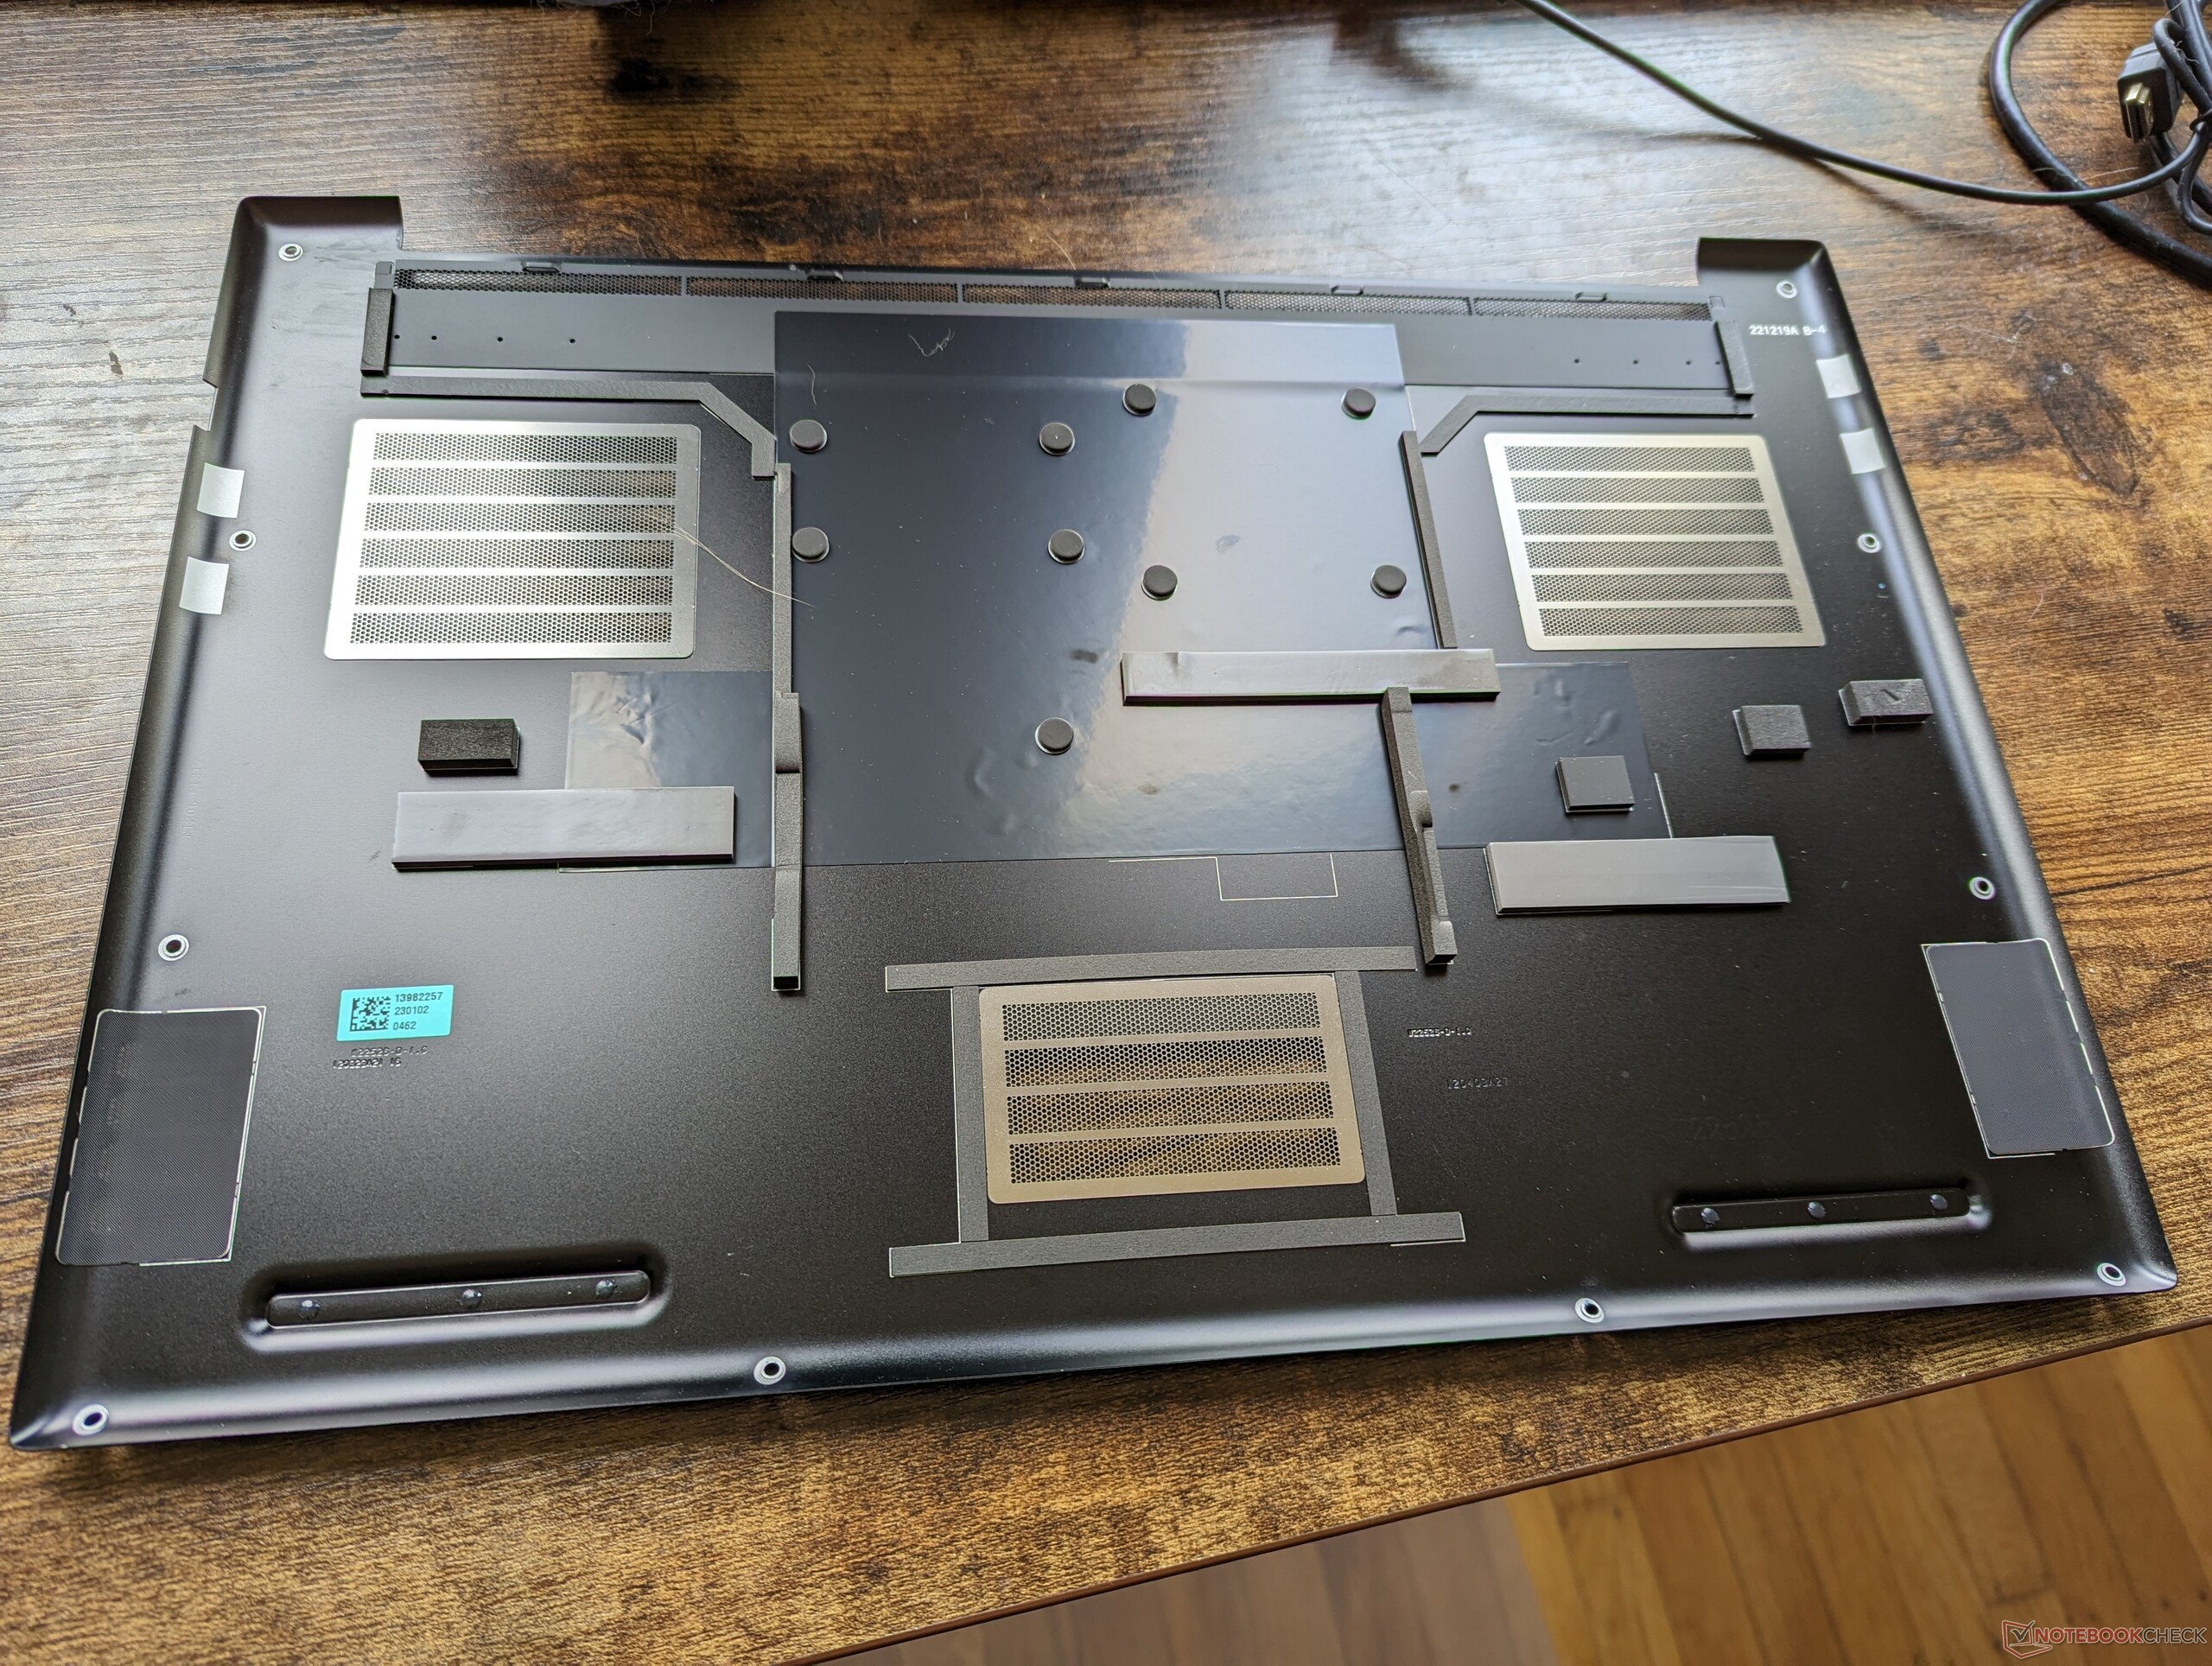
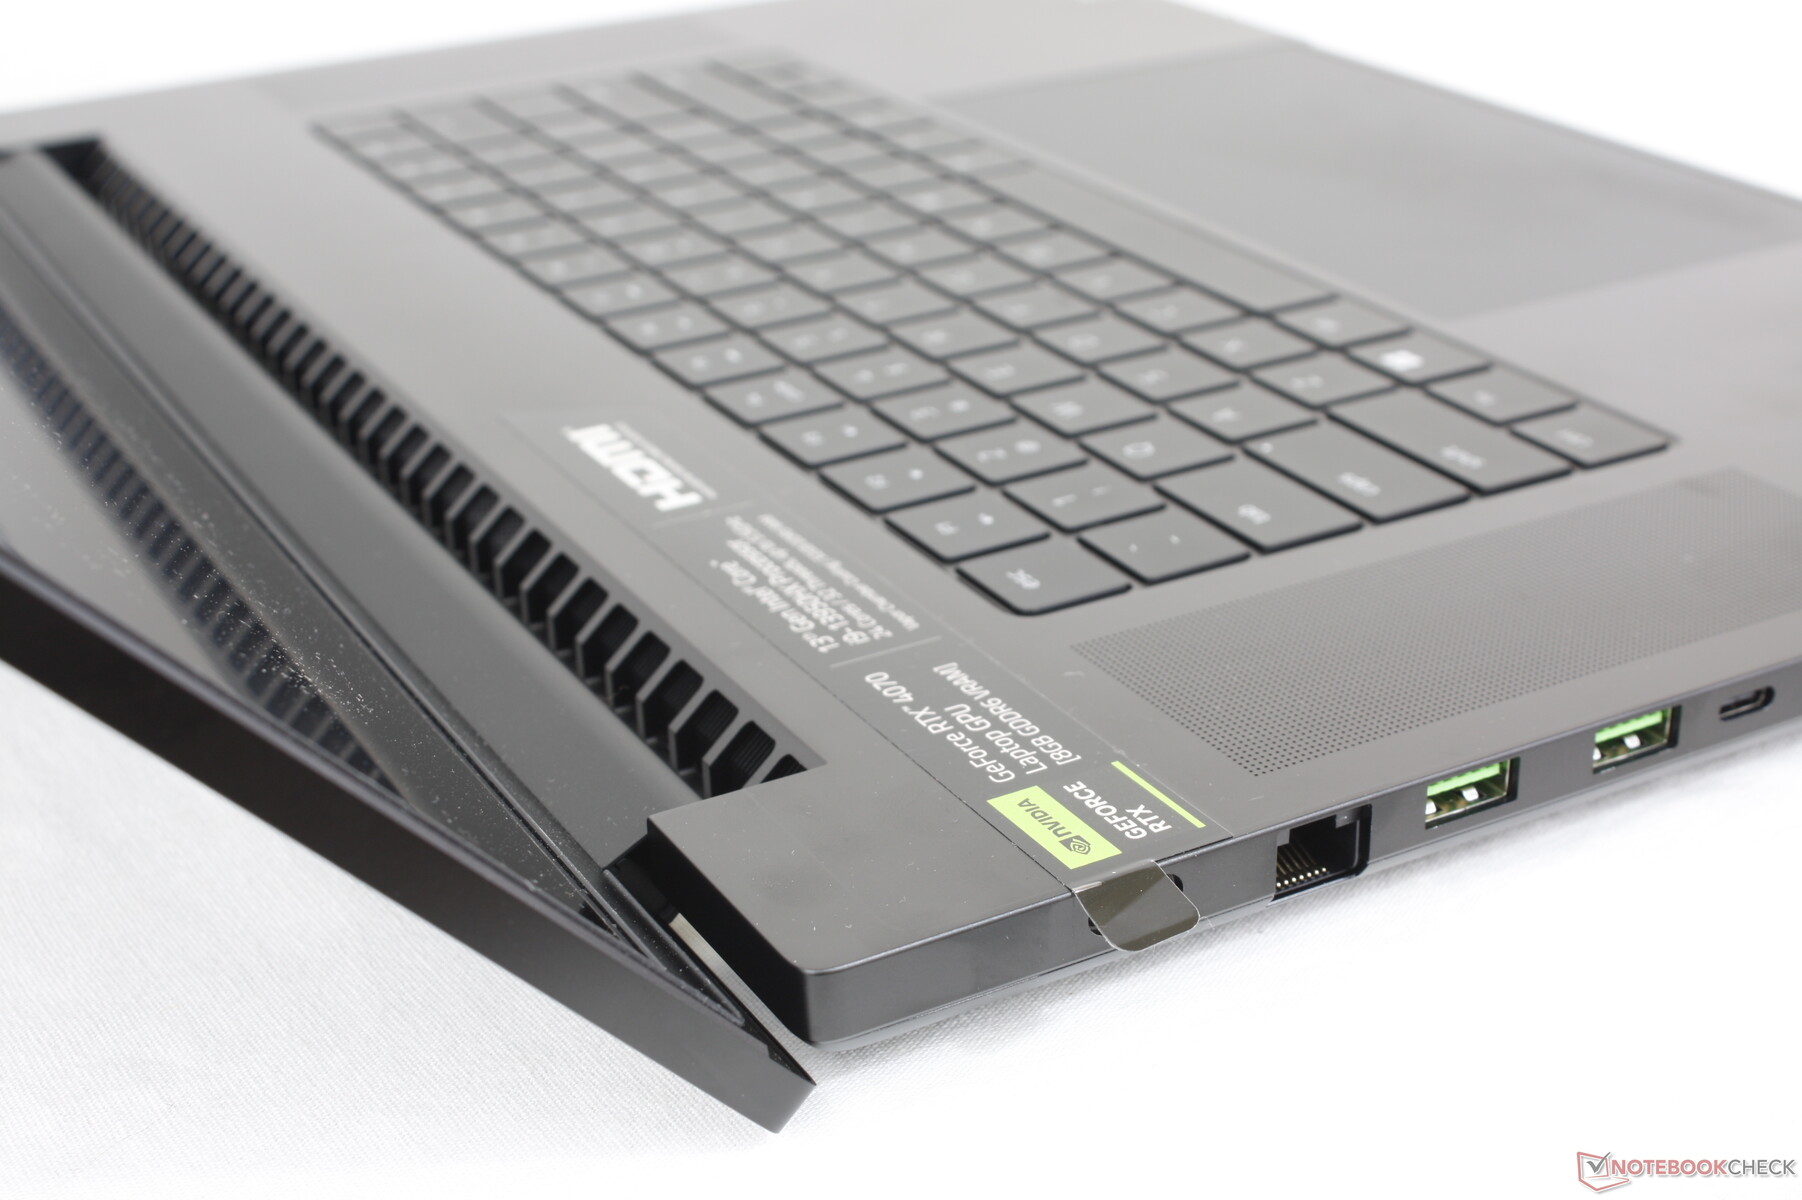
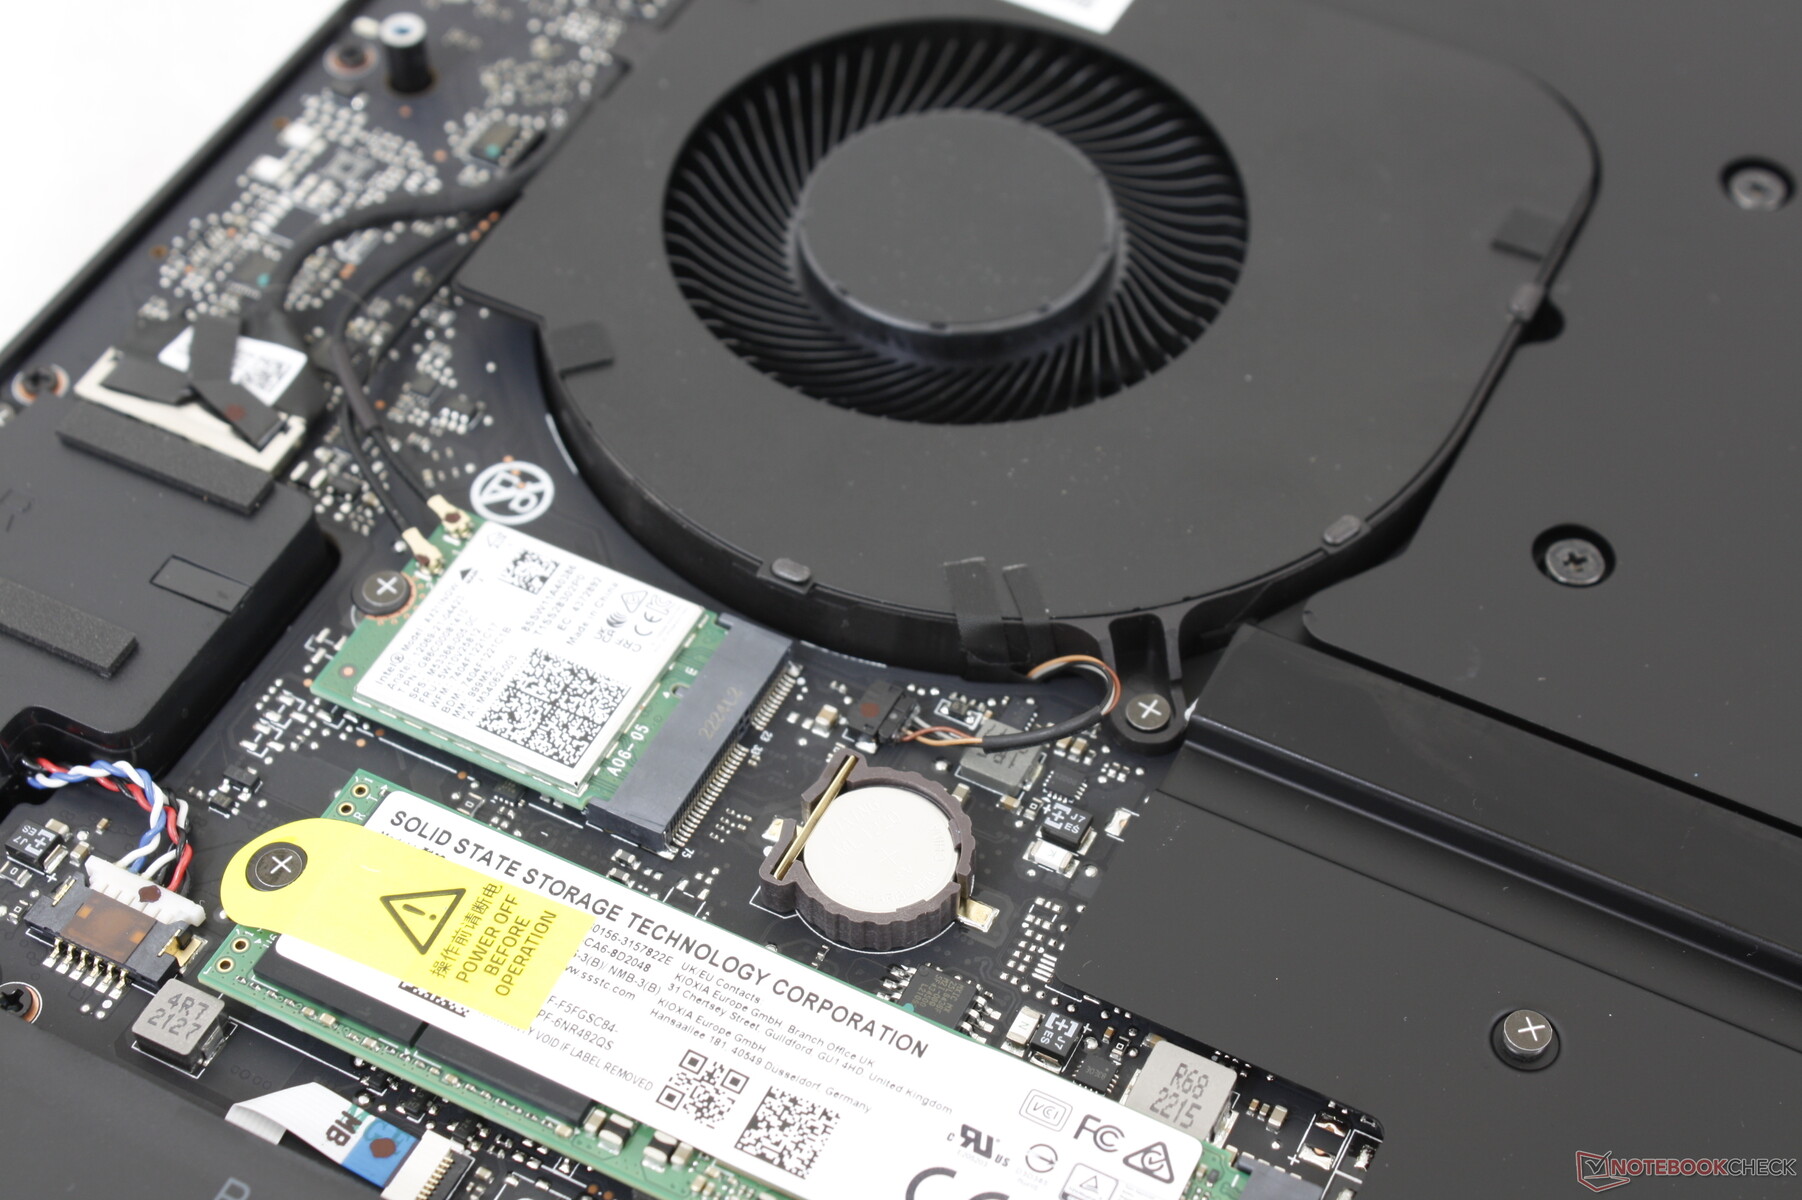
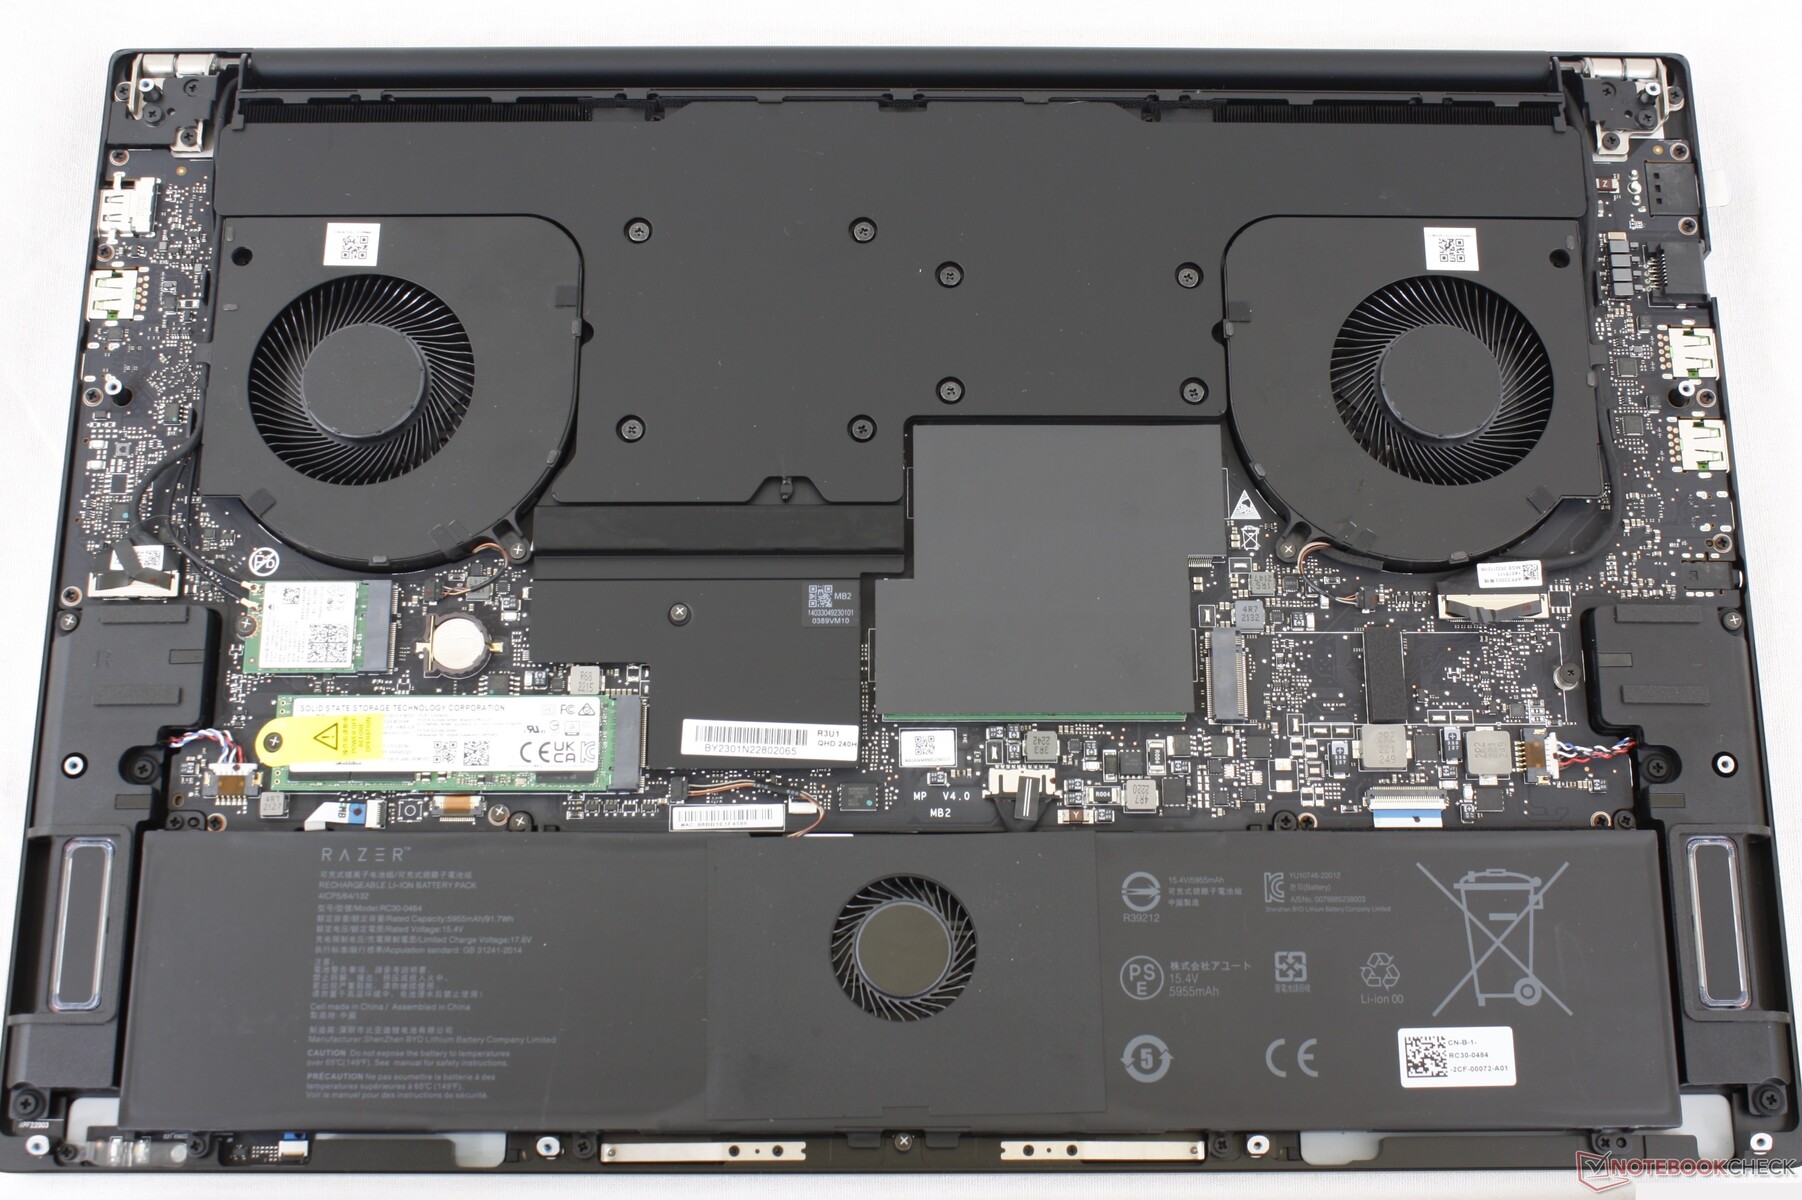
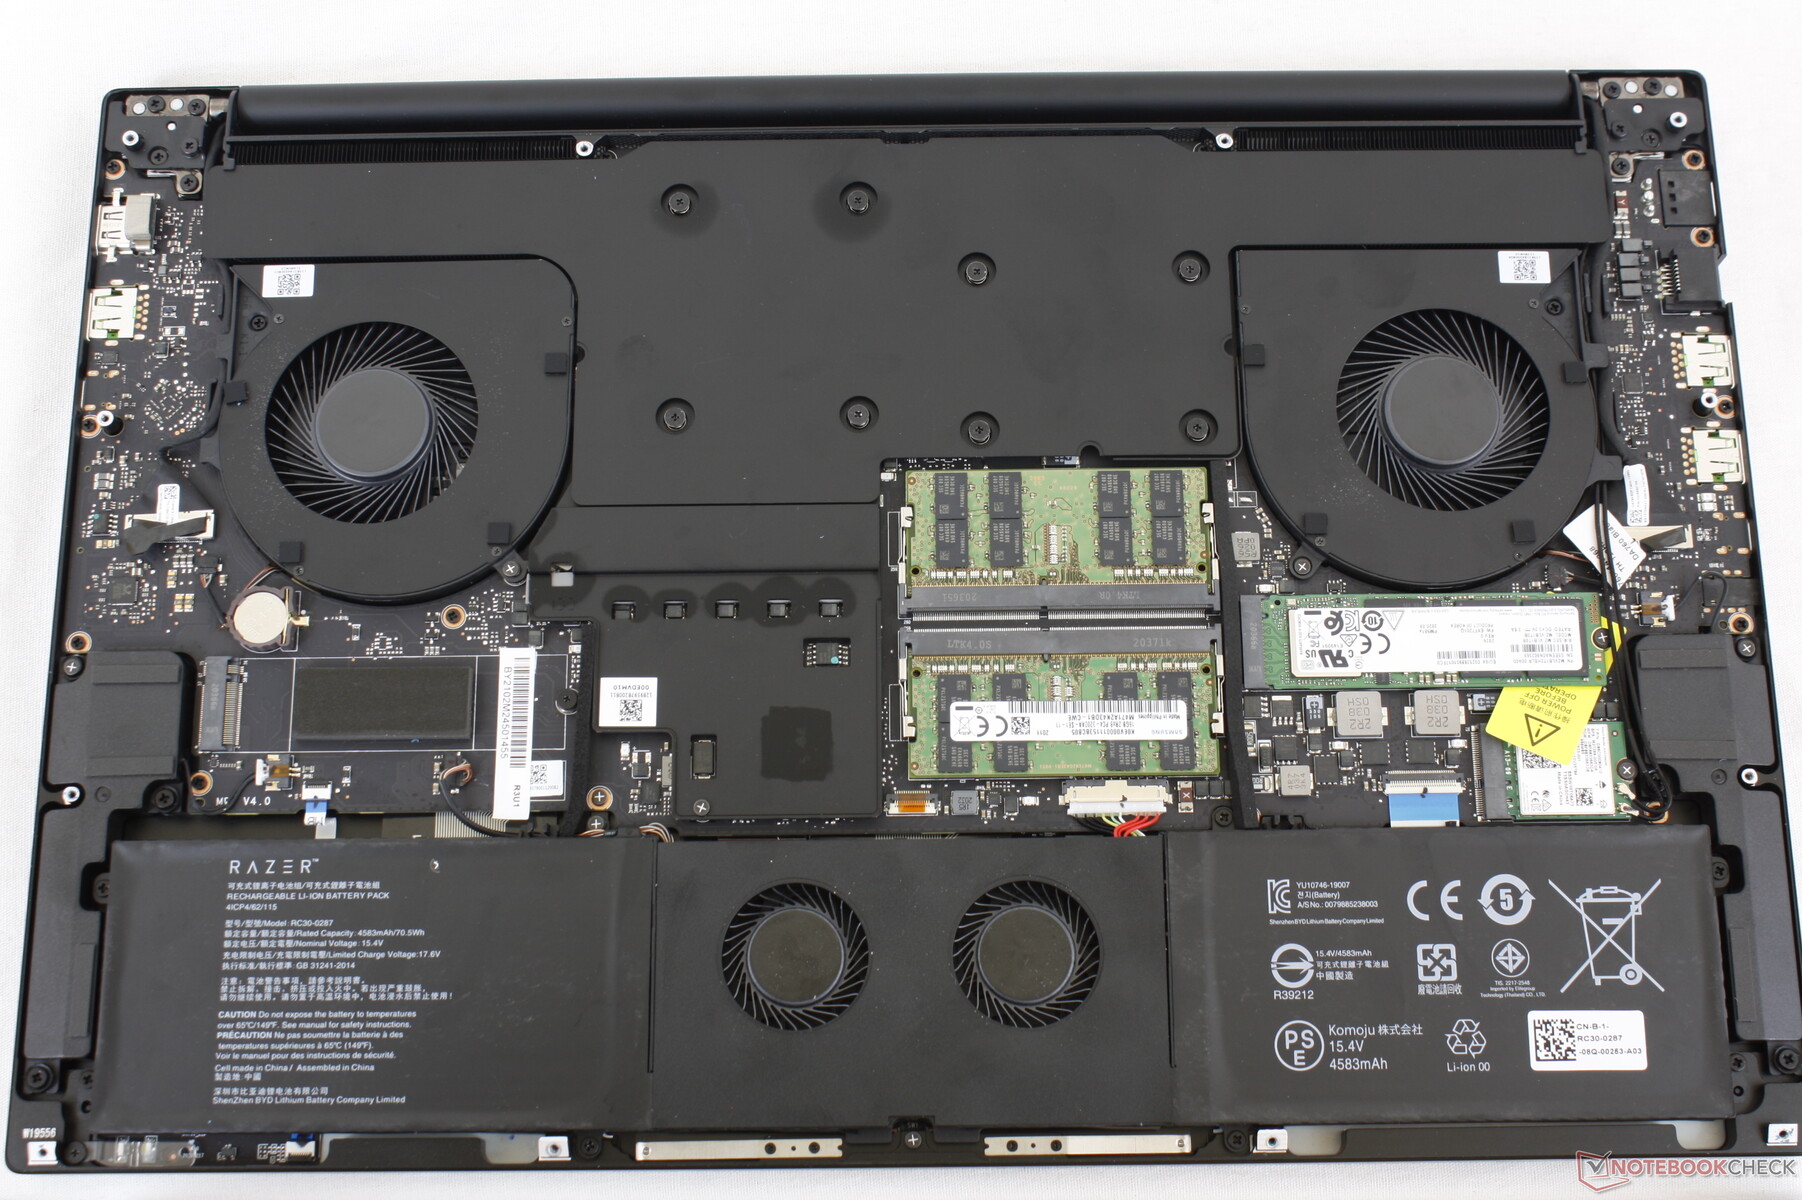
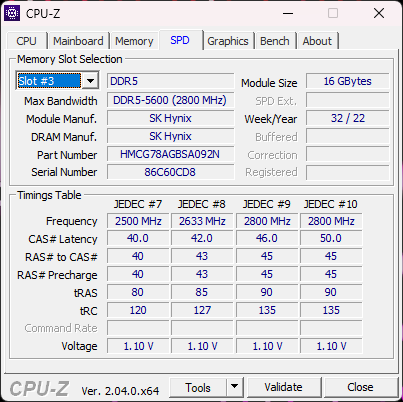
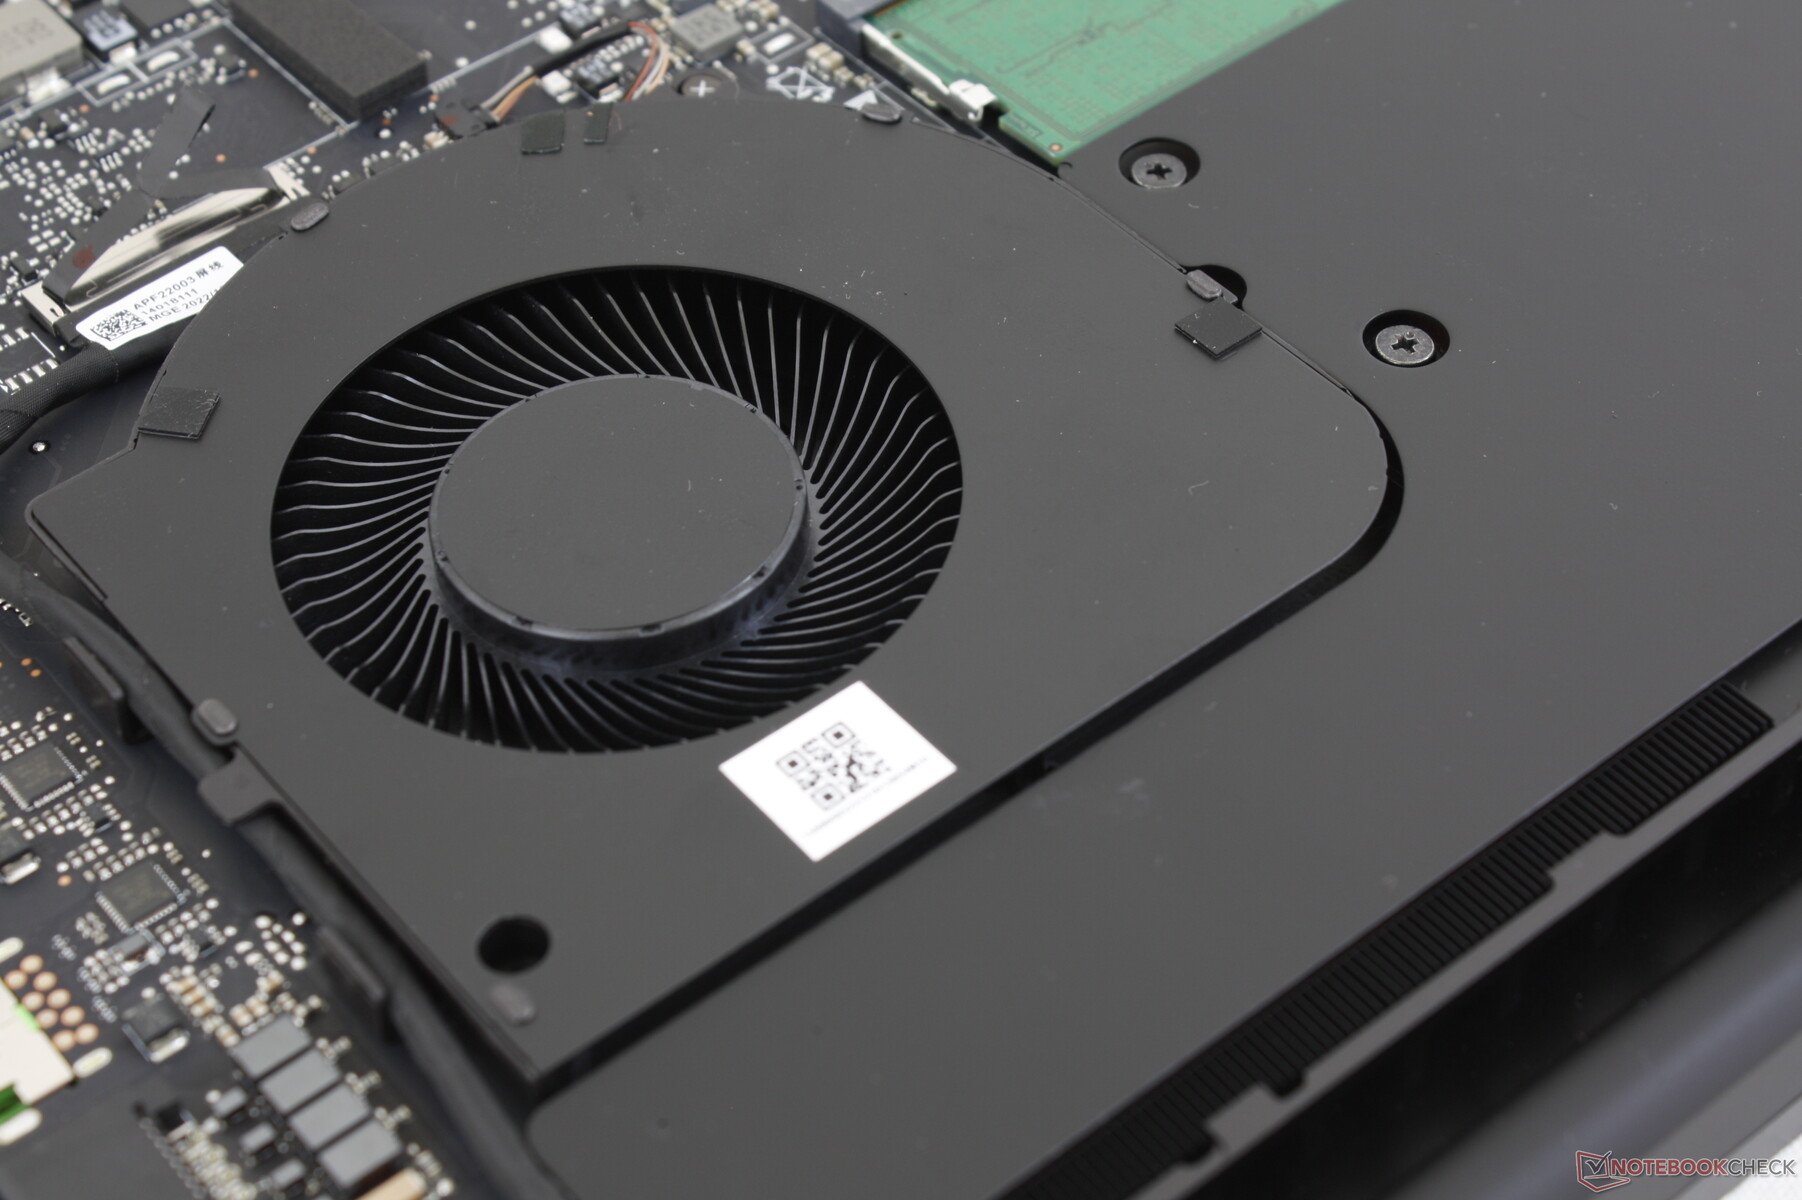
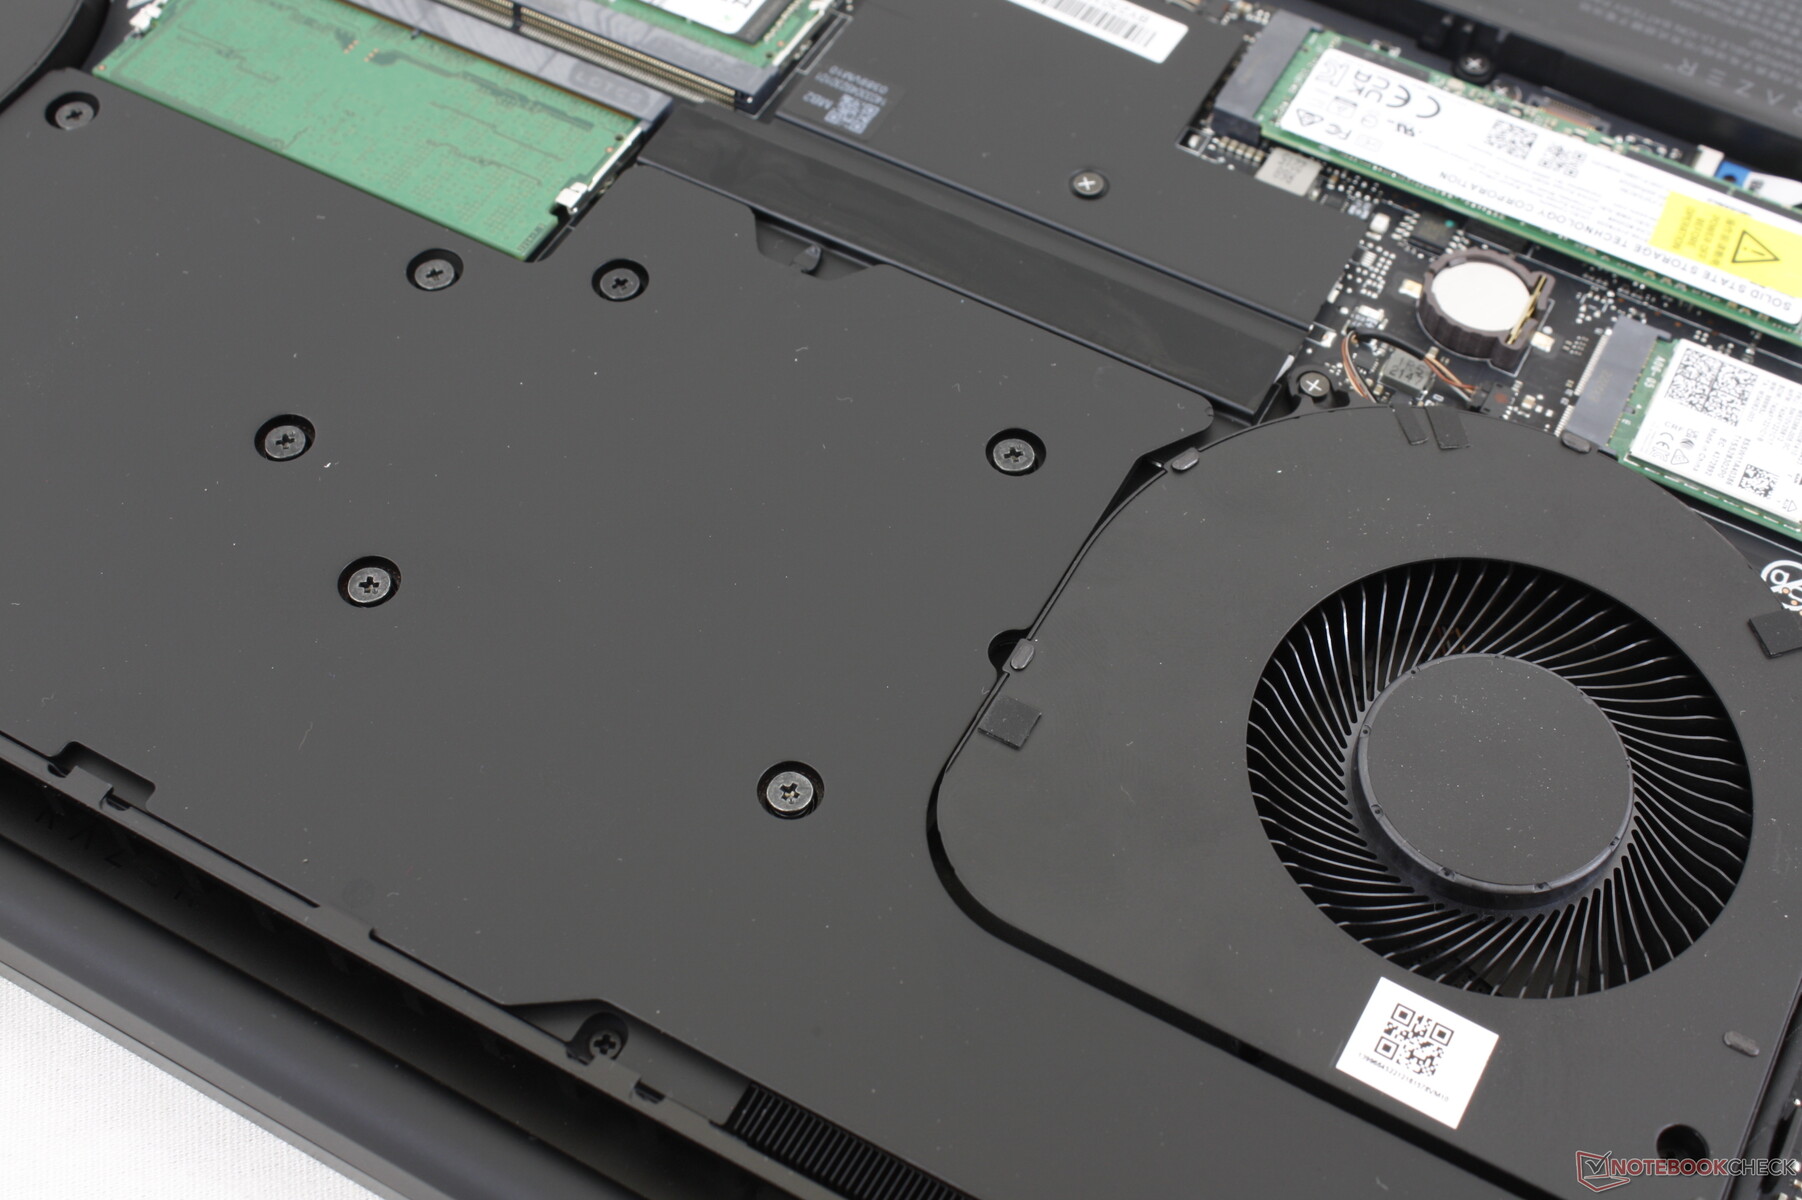
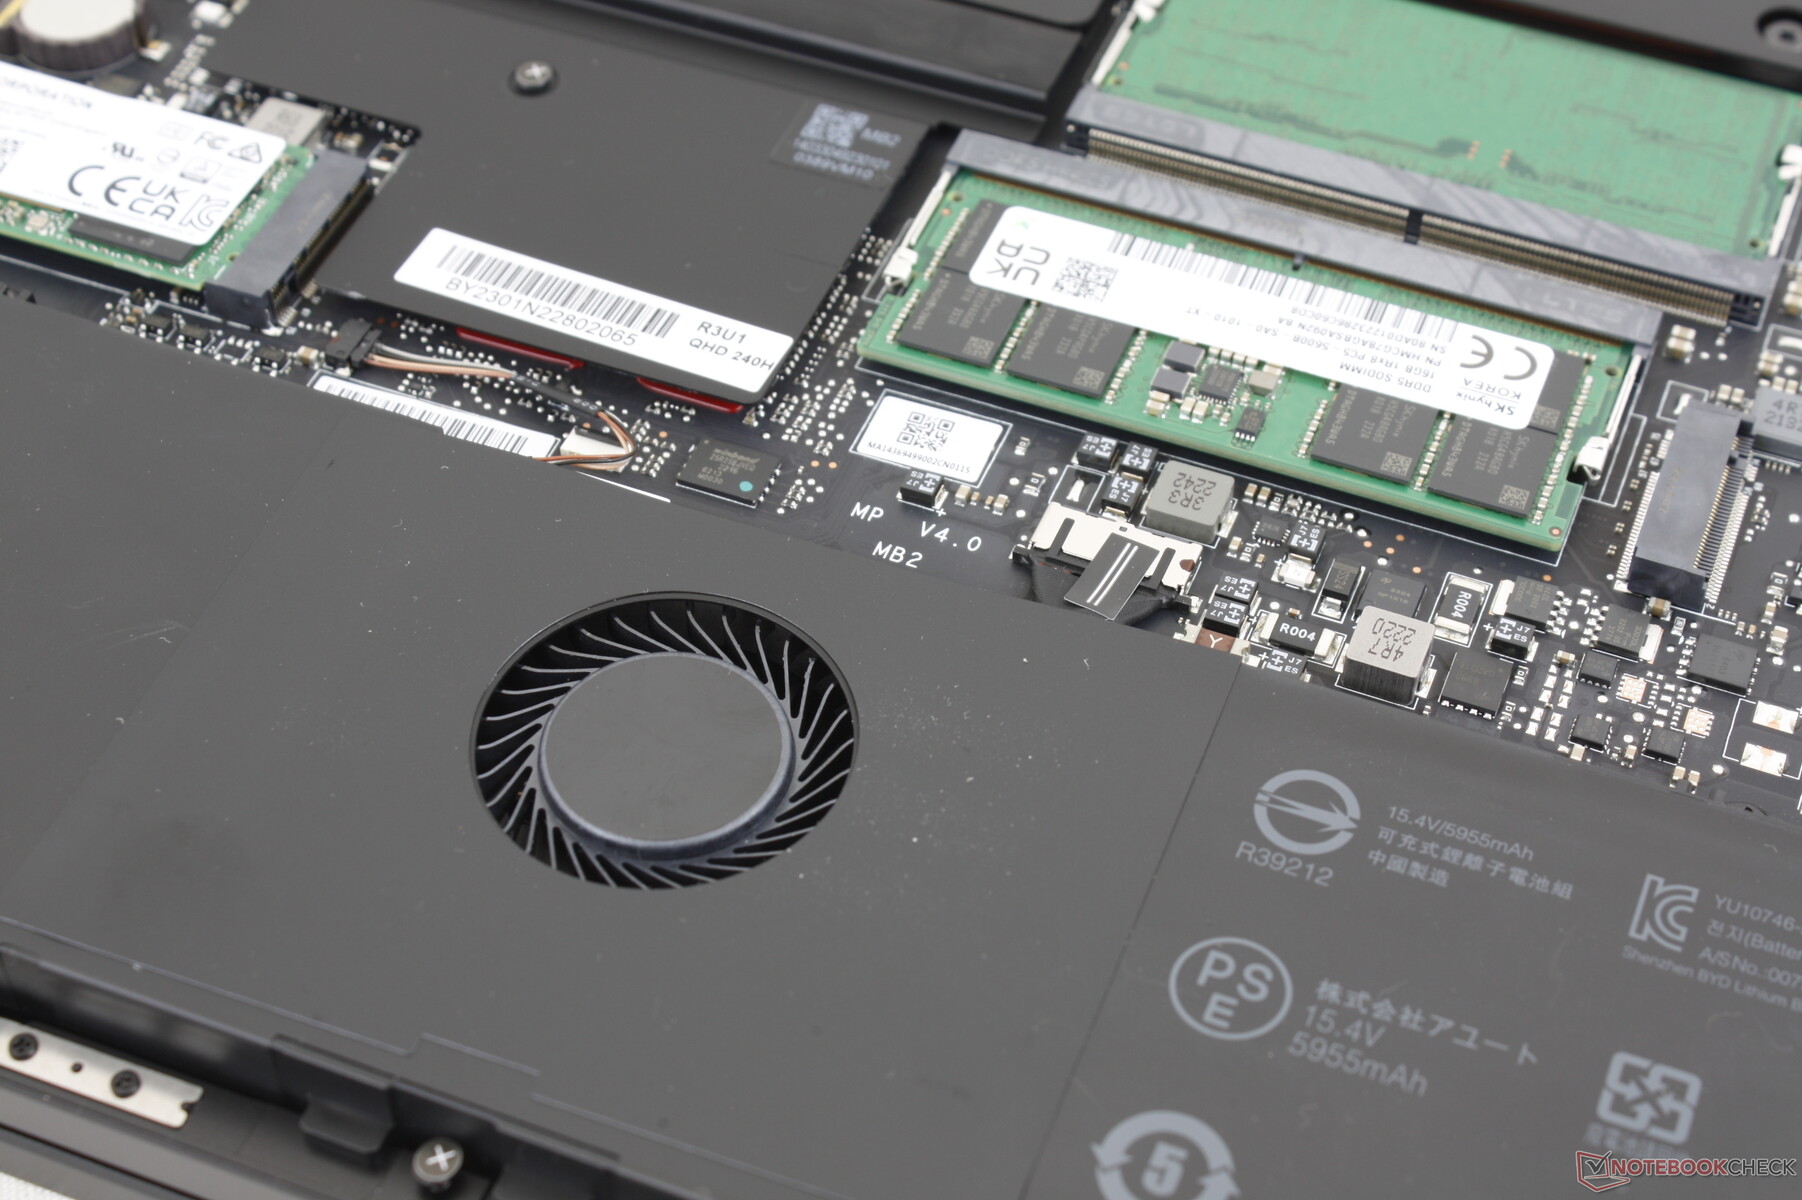
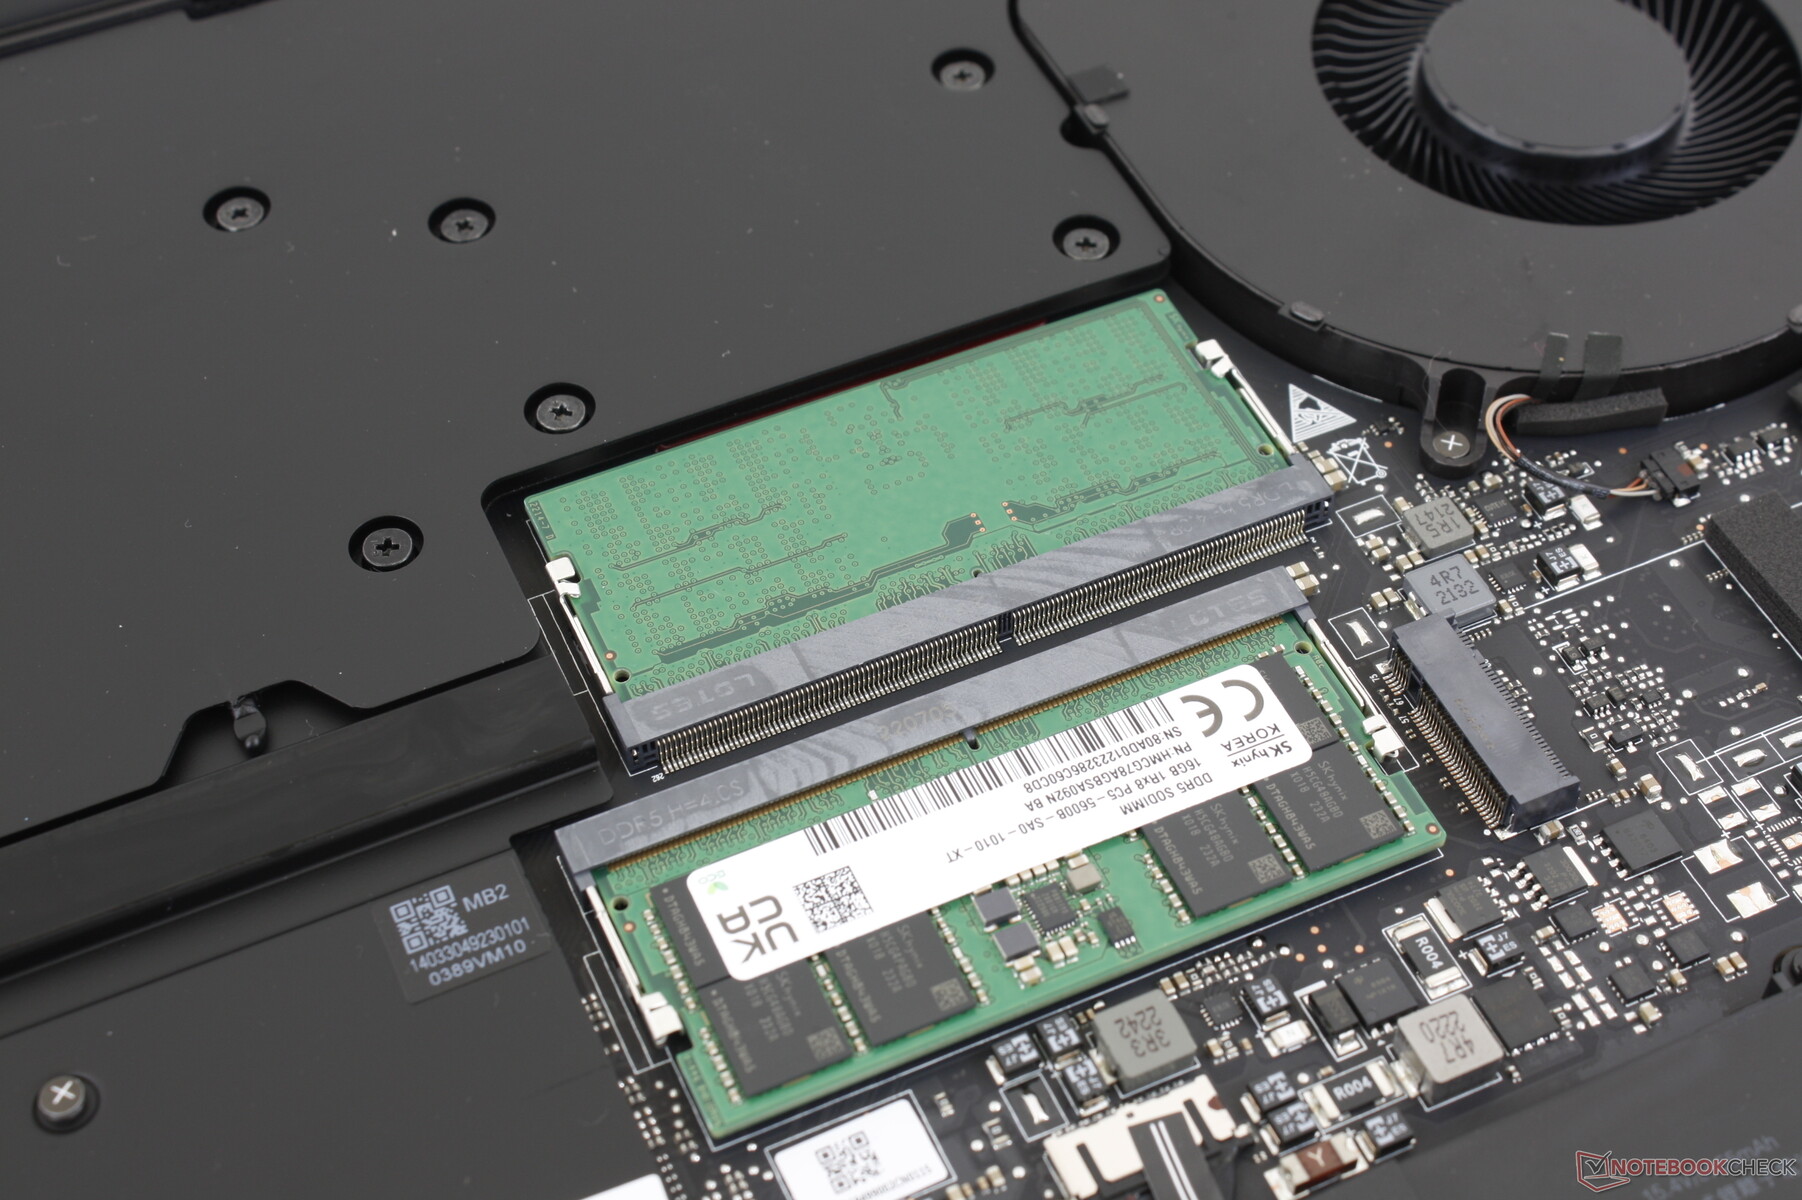
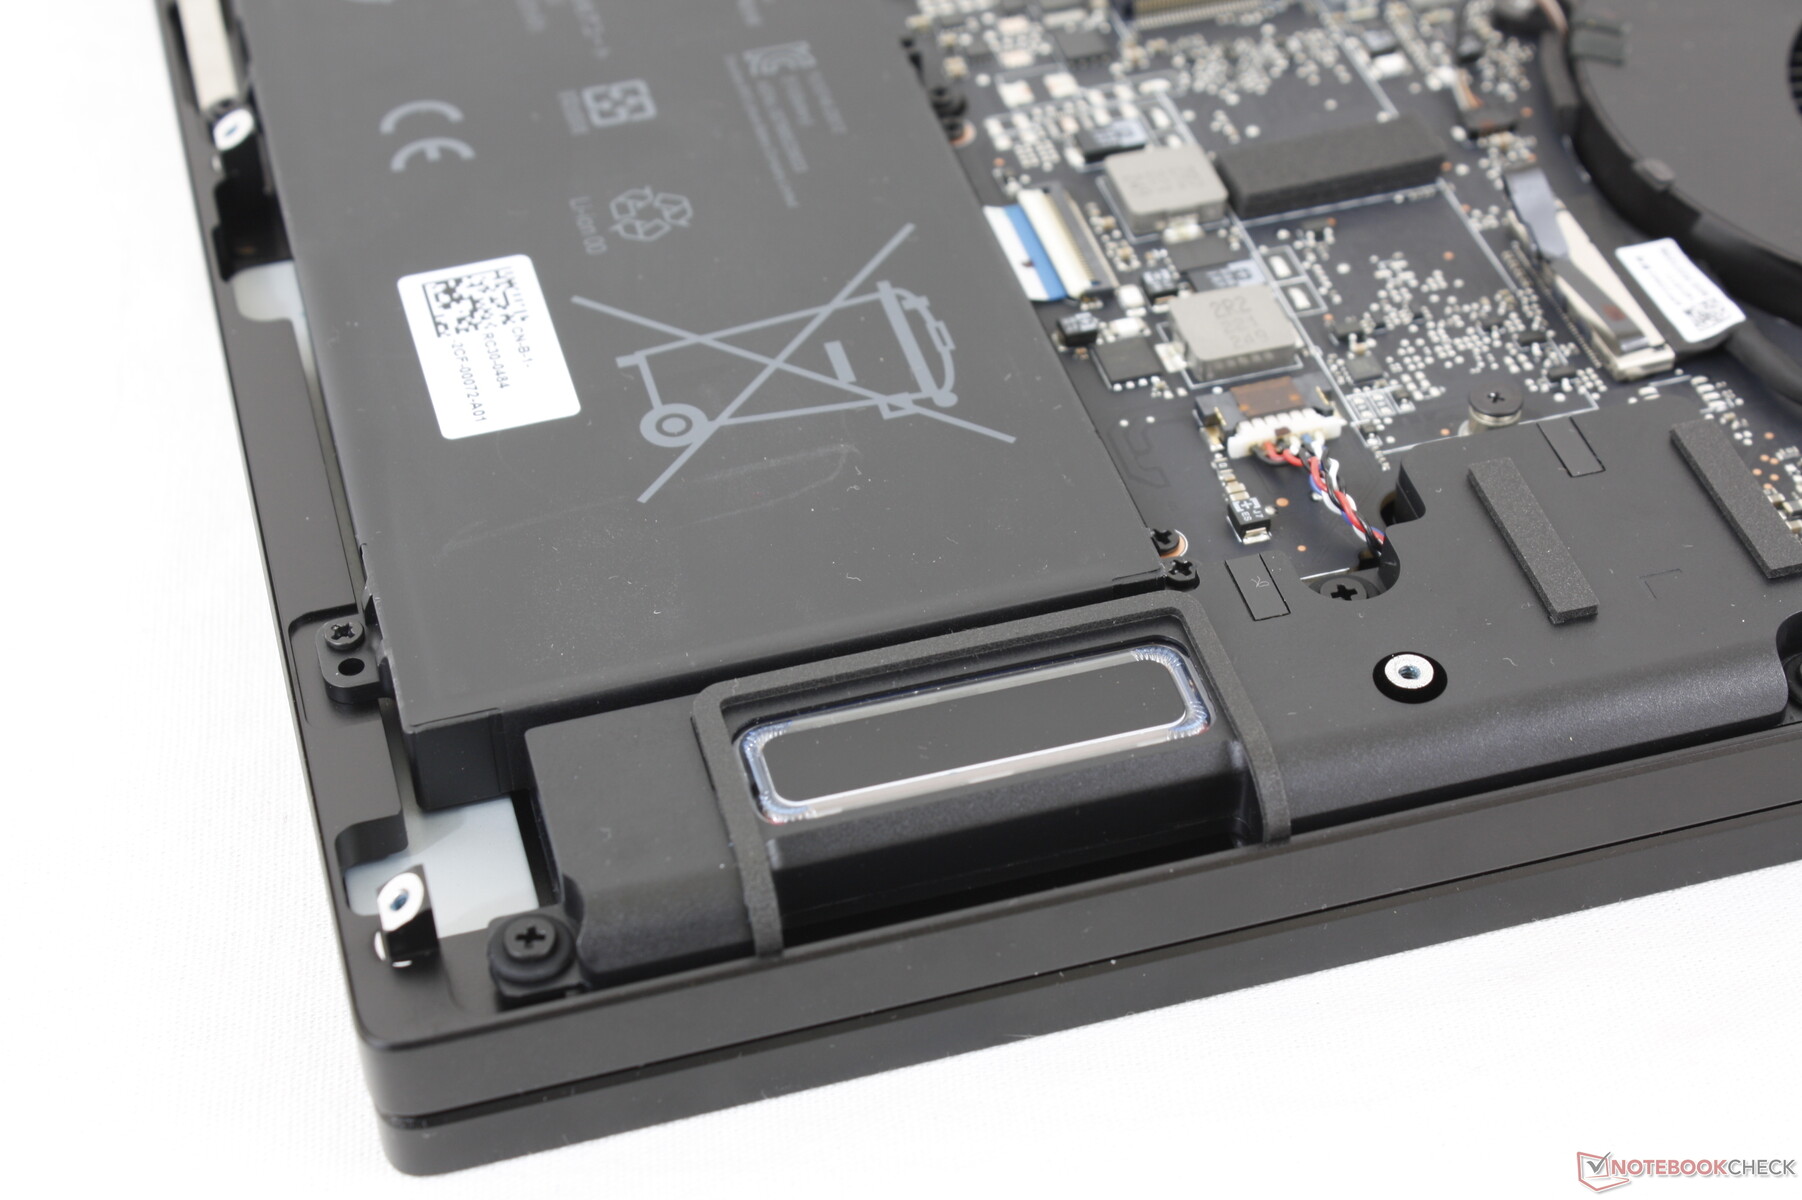
Manutenzione
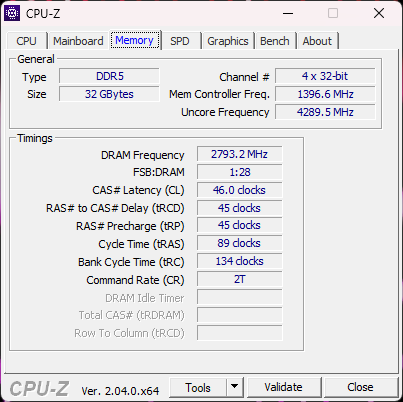
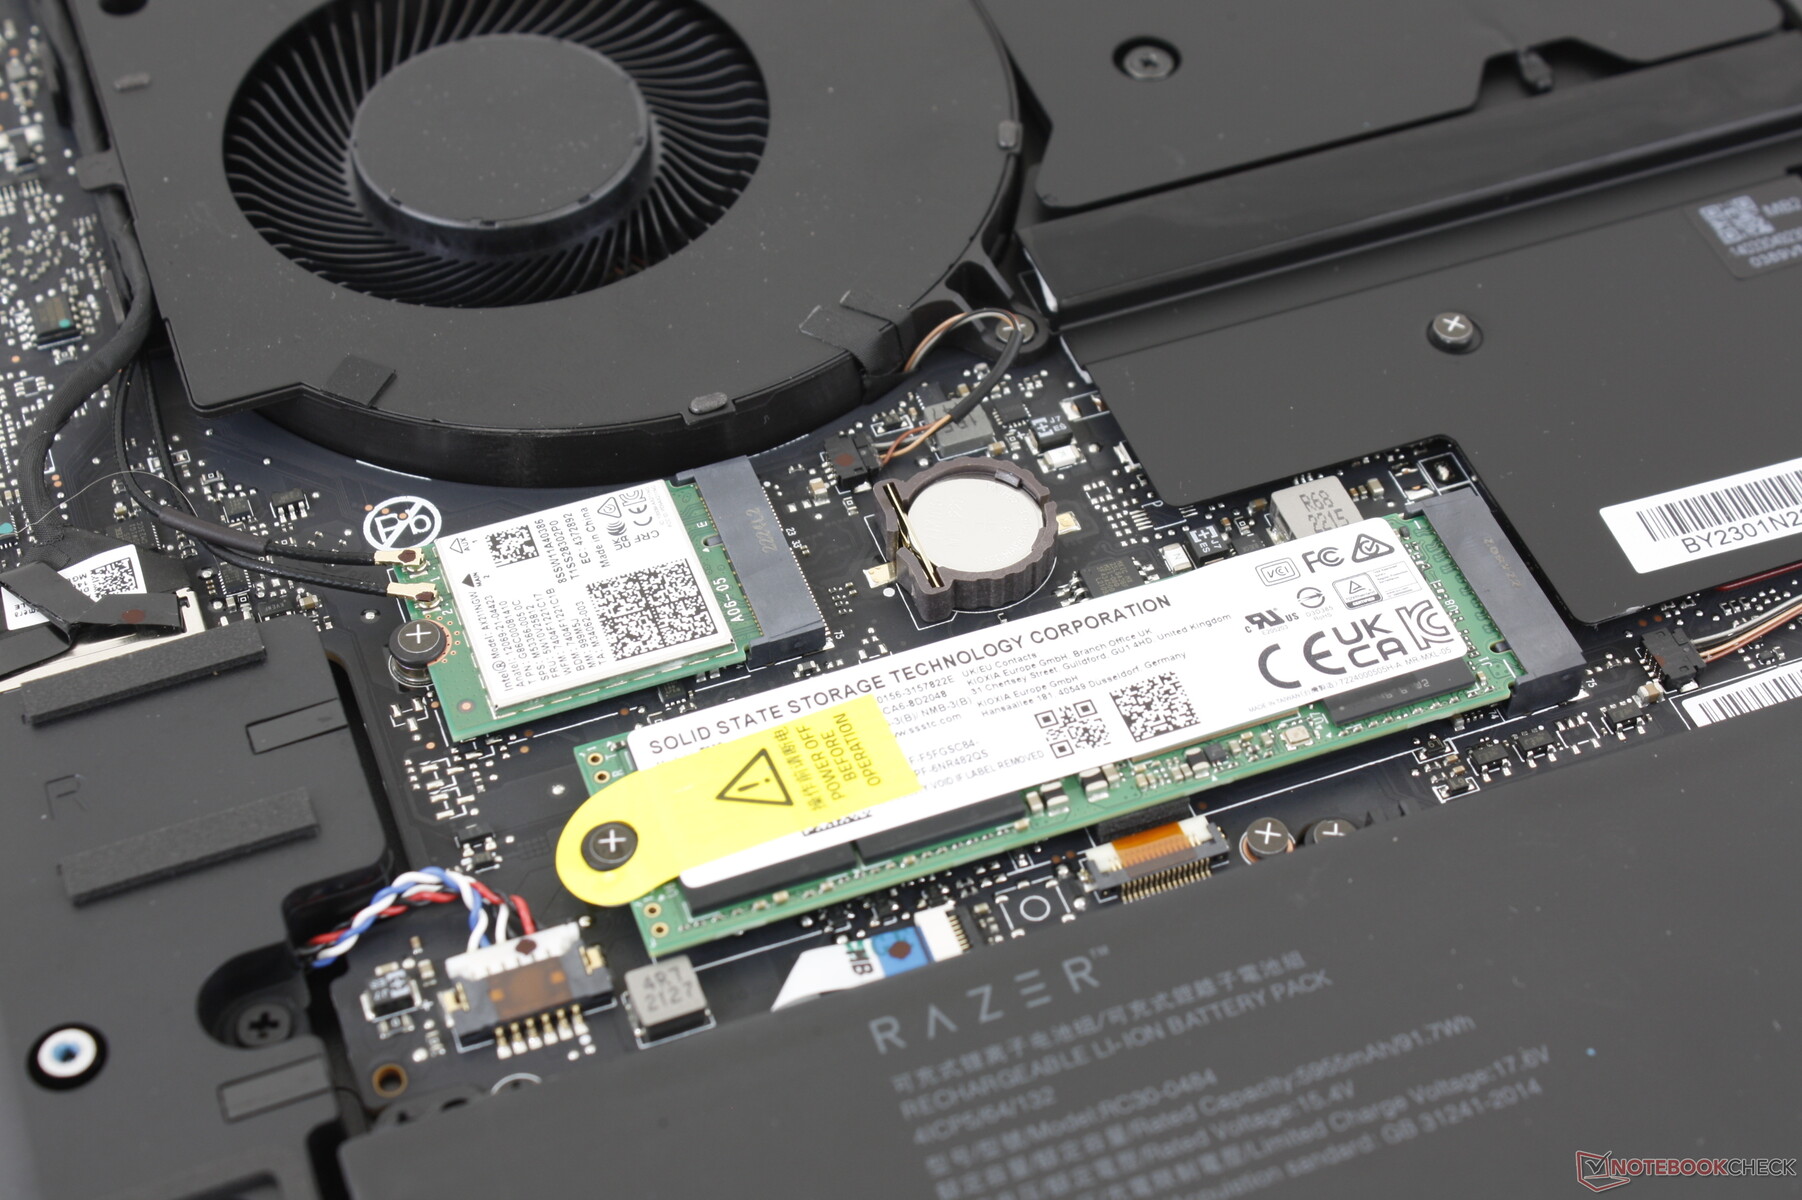
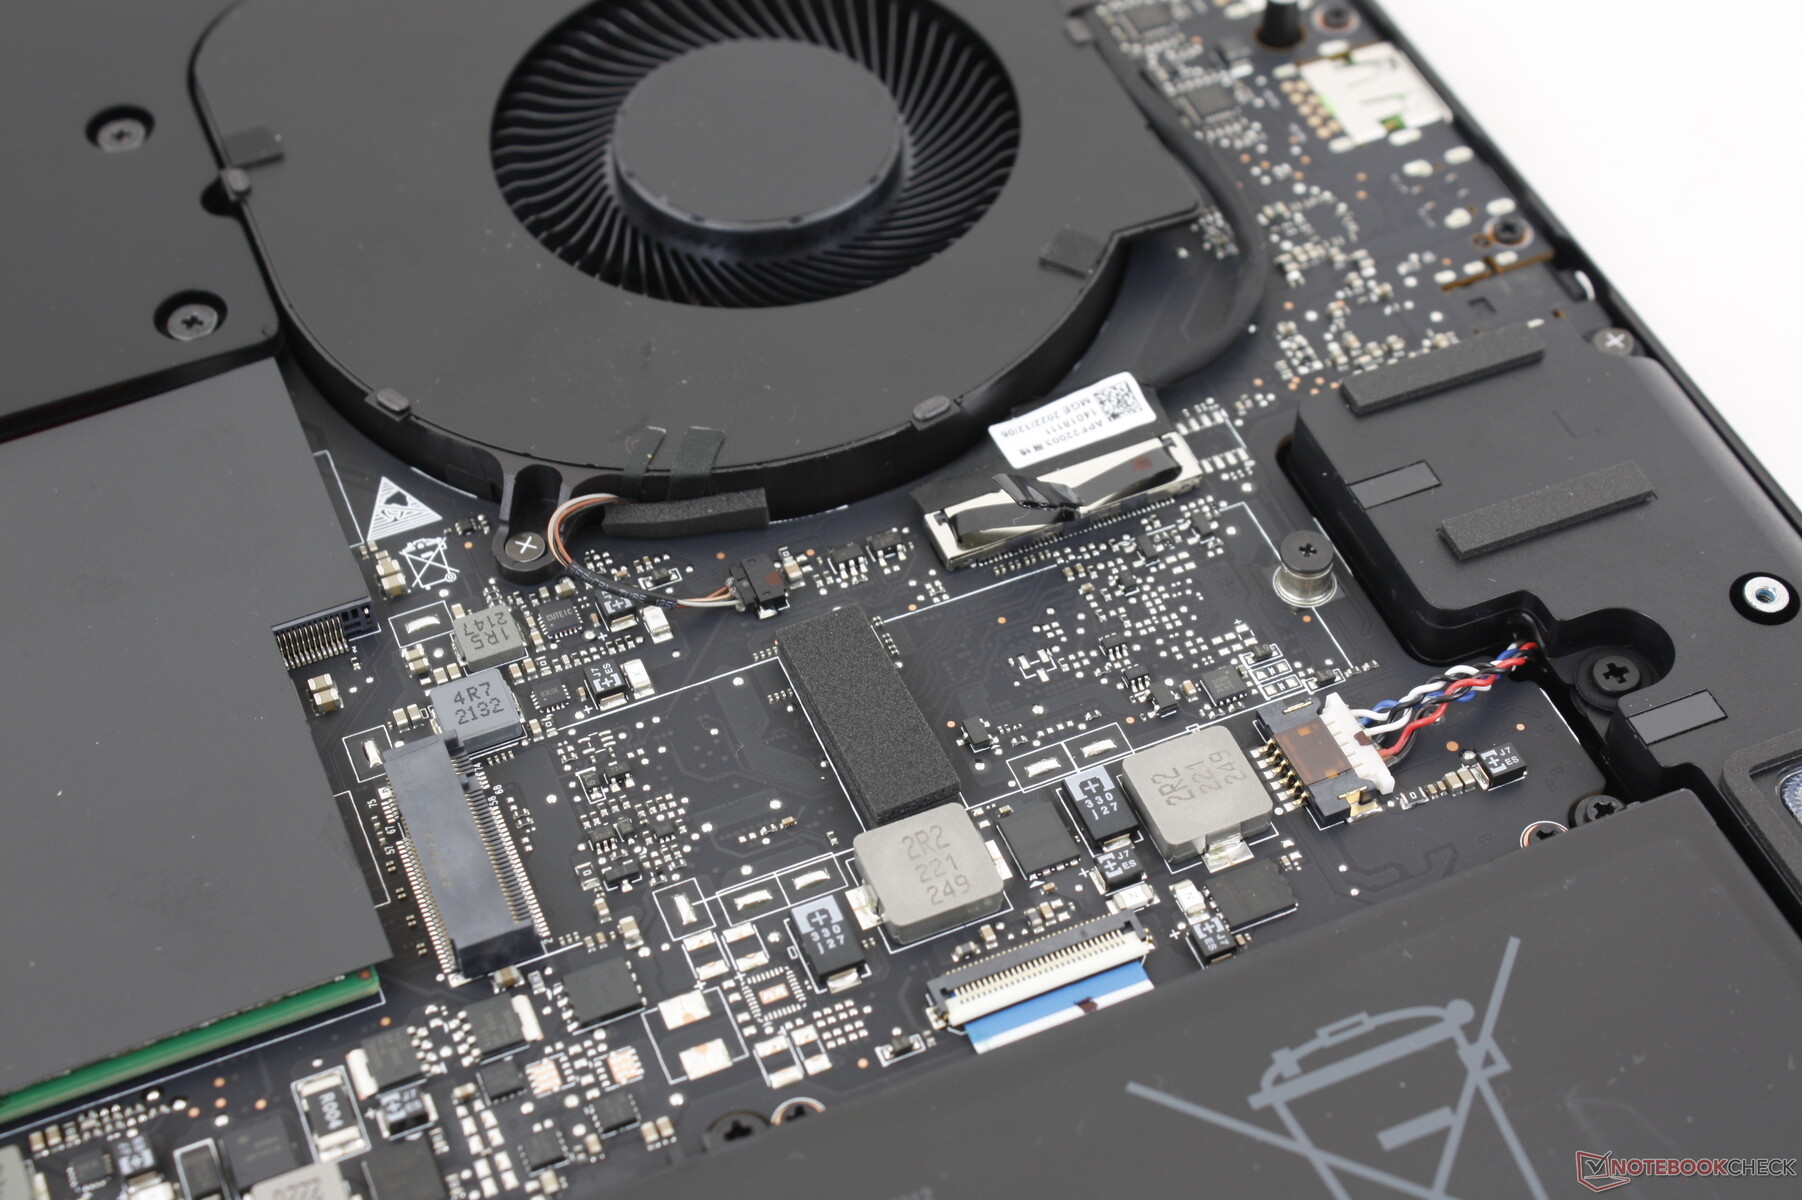
Il pannello inferiore è fissato da dieci viti T5 Torx per facilitare la manutenzione. Gli utenti hanno accesso diretto a due slot per SSD M.2 2280, due slot SODIMM per un massimo di 32 GB DDR5-5600 o 64 GB DDR5-5200 e il modulo WLAN rimovibile. L'aspetto più significativo è che l'attuale design del Blade 18 incorpora una ventola aggiuntiva direttamente sotto il clickpad, simile a quella dei vecchi design del Blade 17.
Accessori e garanzia
Non ci sono extra nella scatola di vendita. La garanzia limitata del produttore è di un anno, mentre la batteria interna ha una garanzia separata di due anni se acquistata negli Stati Uniti.
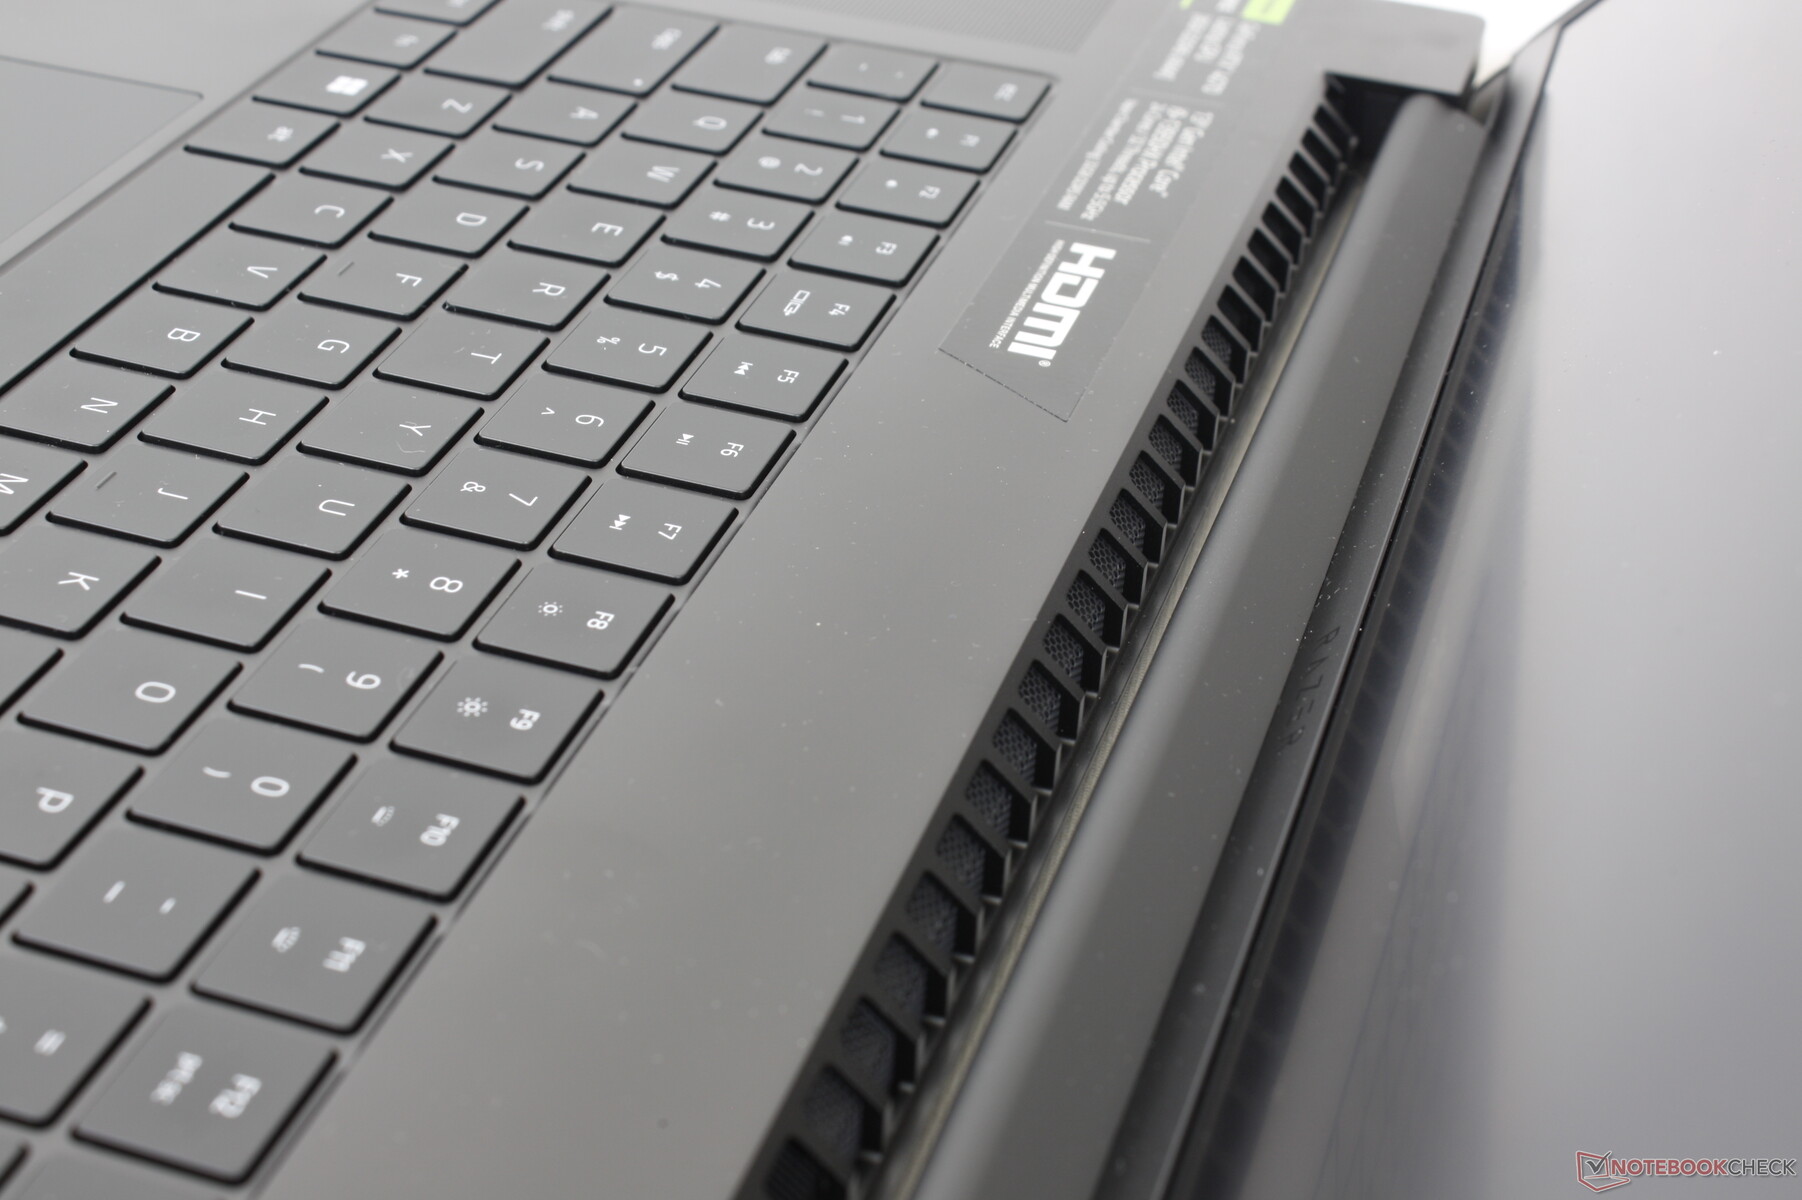
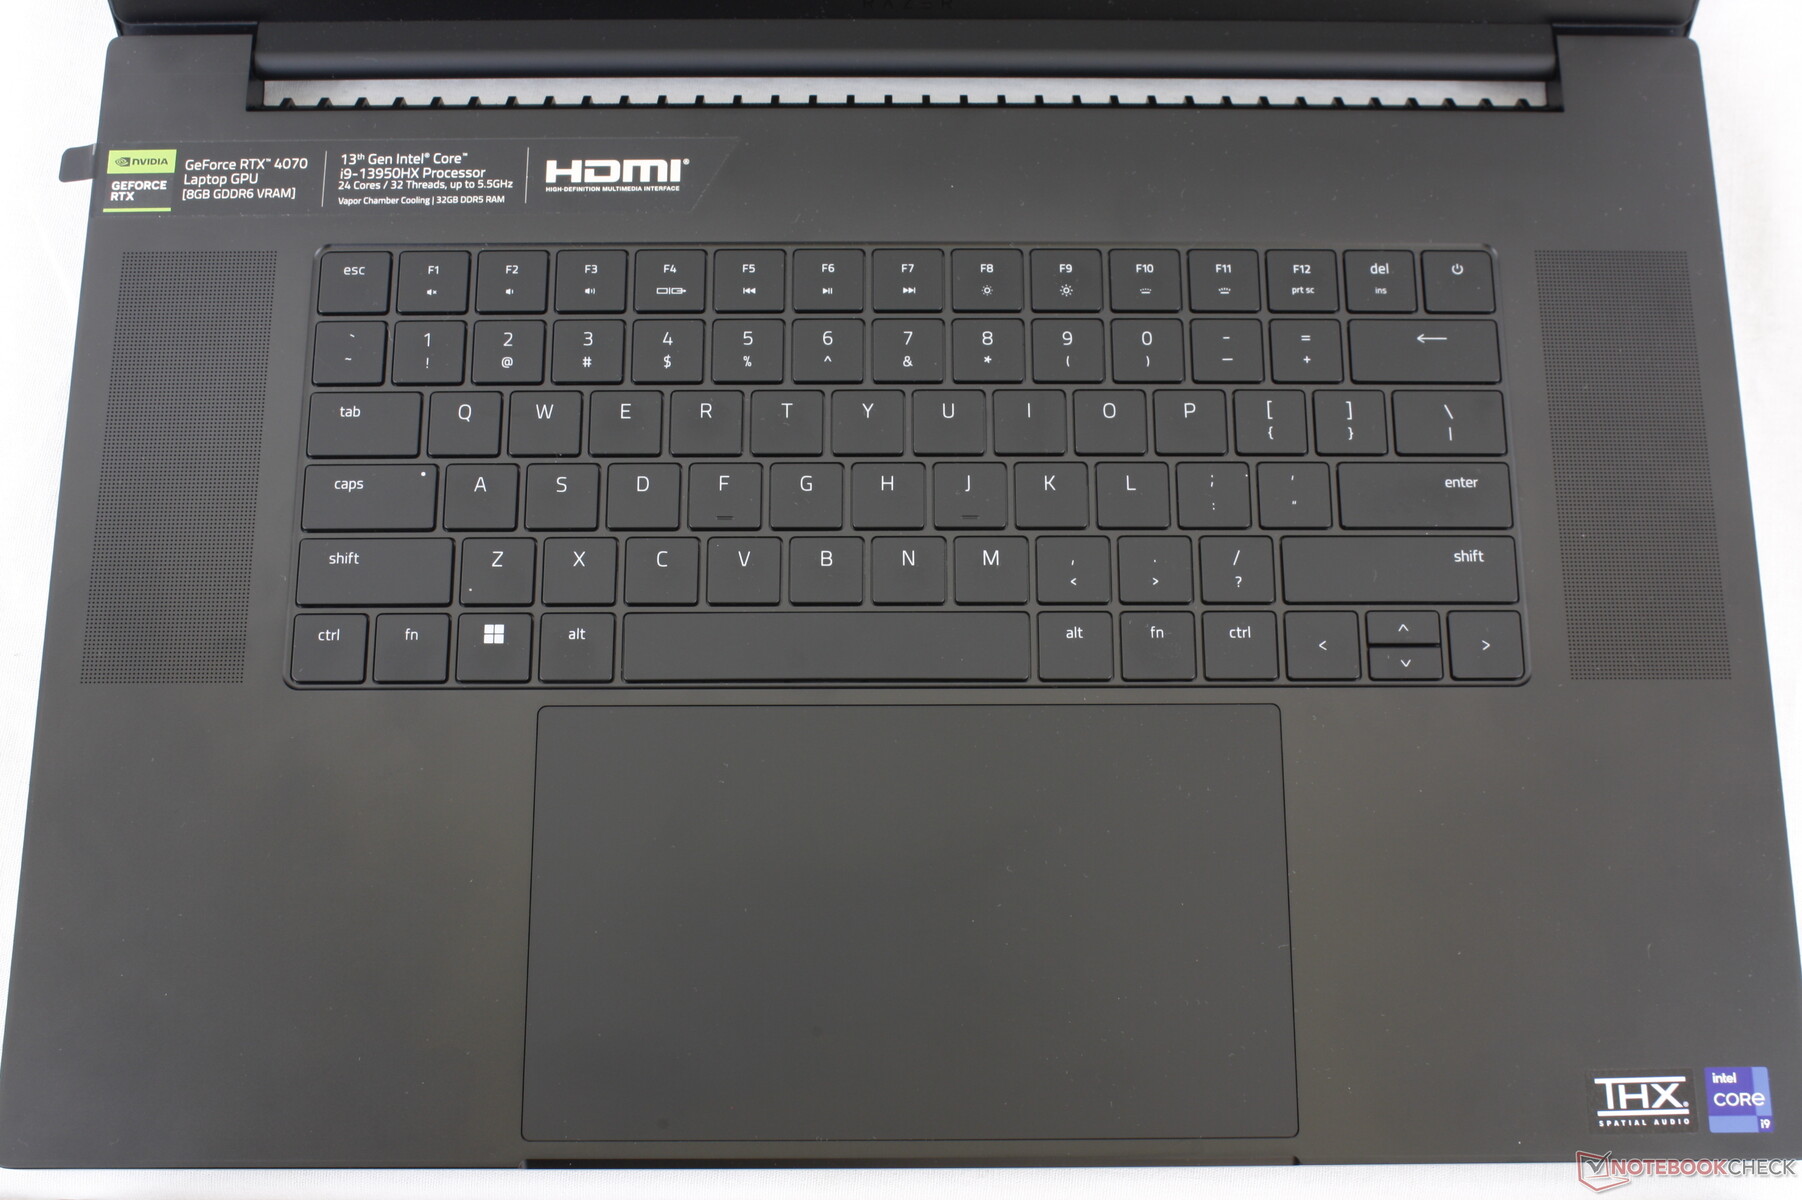
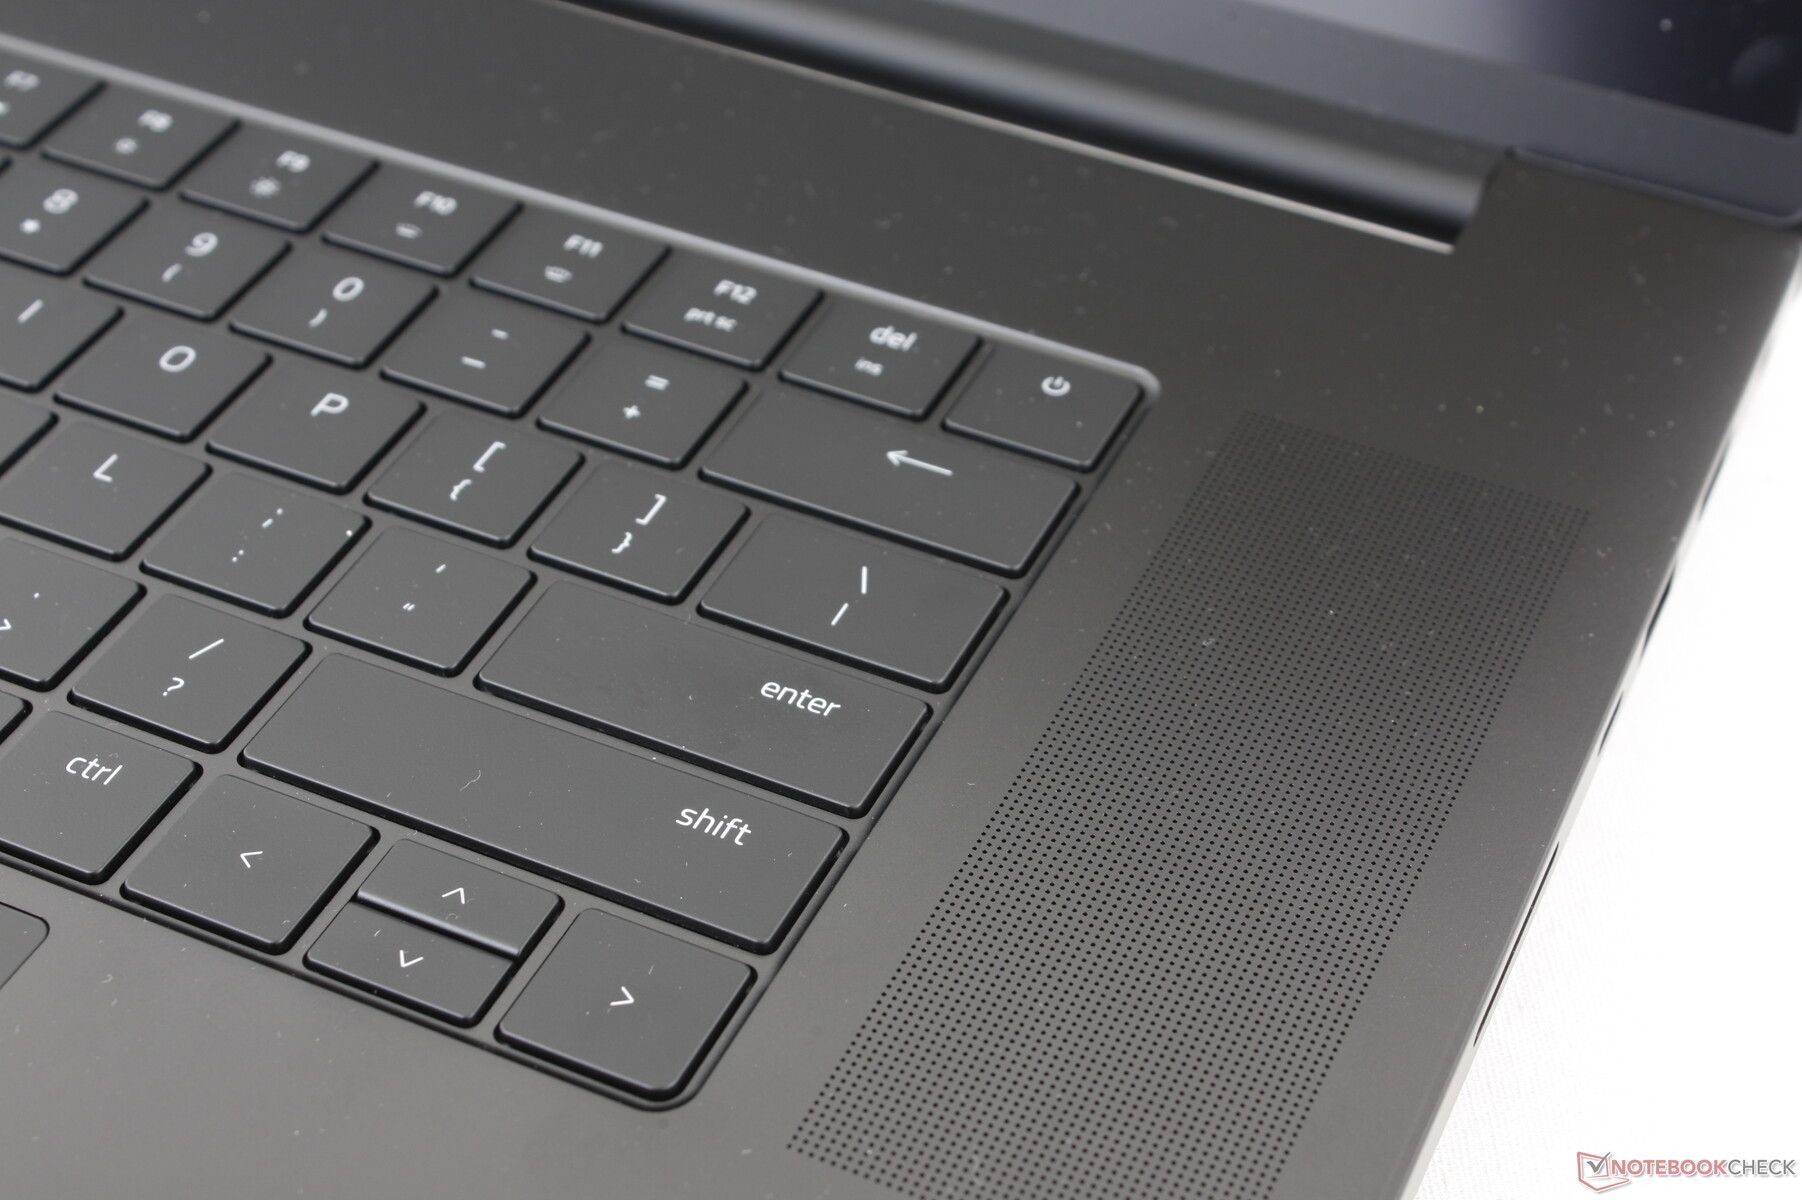
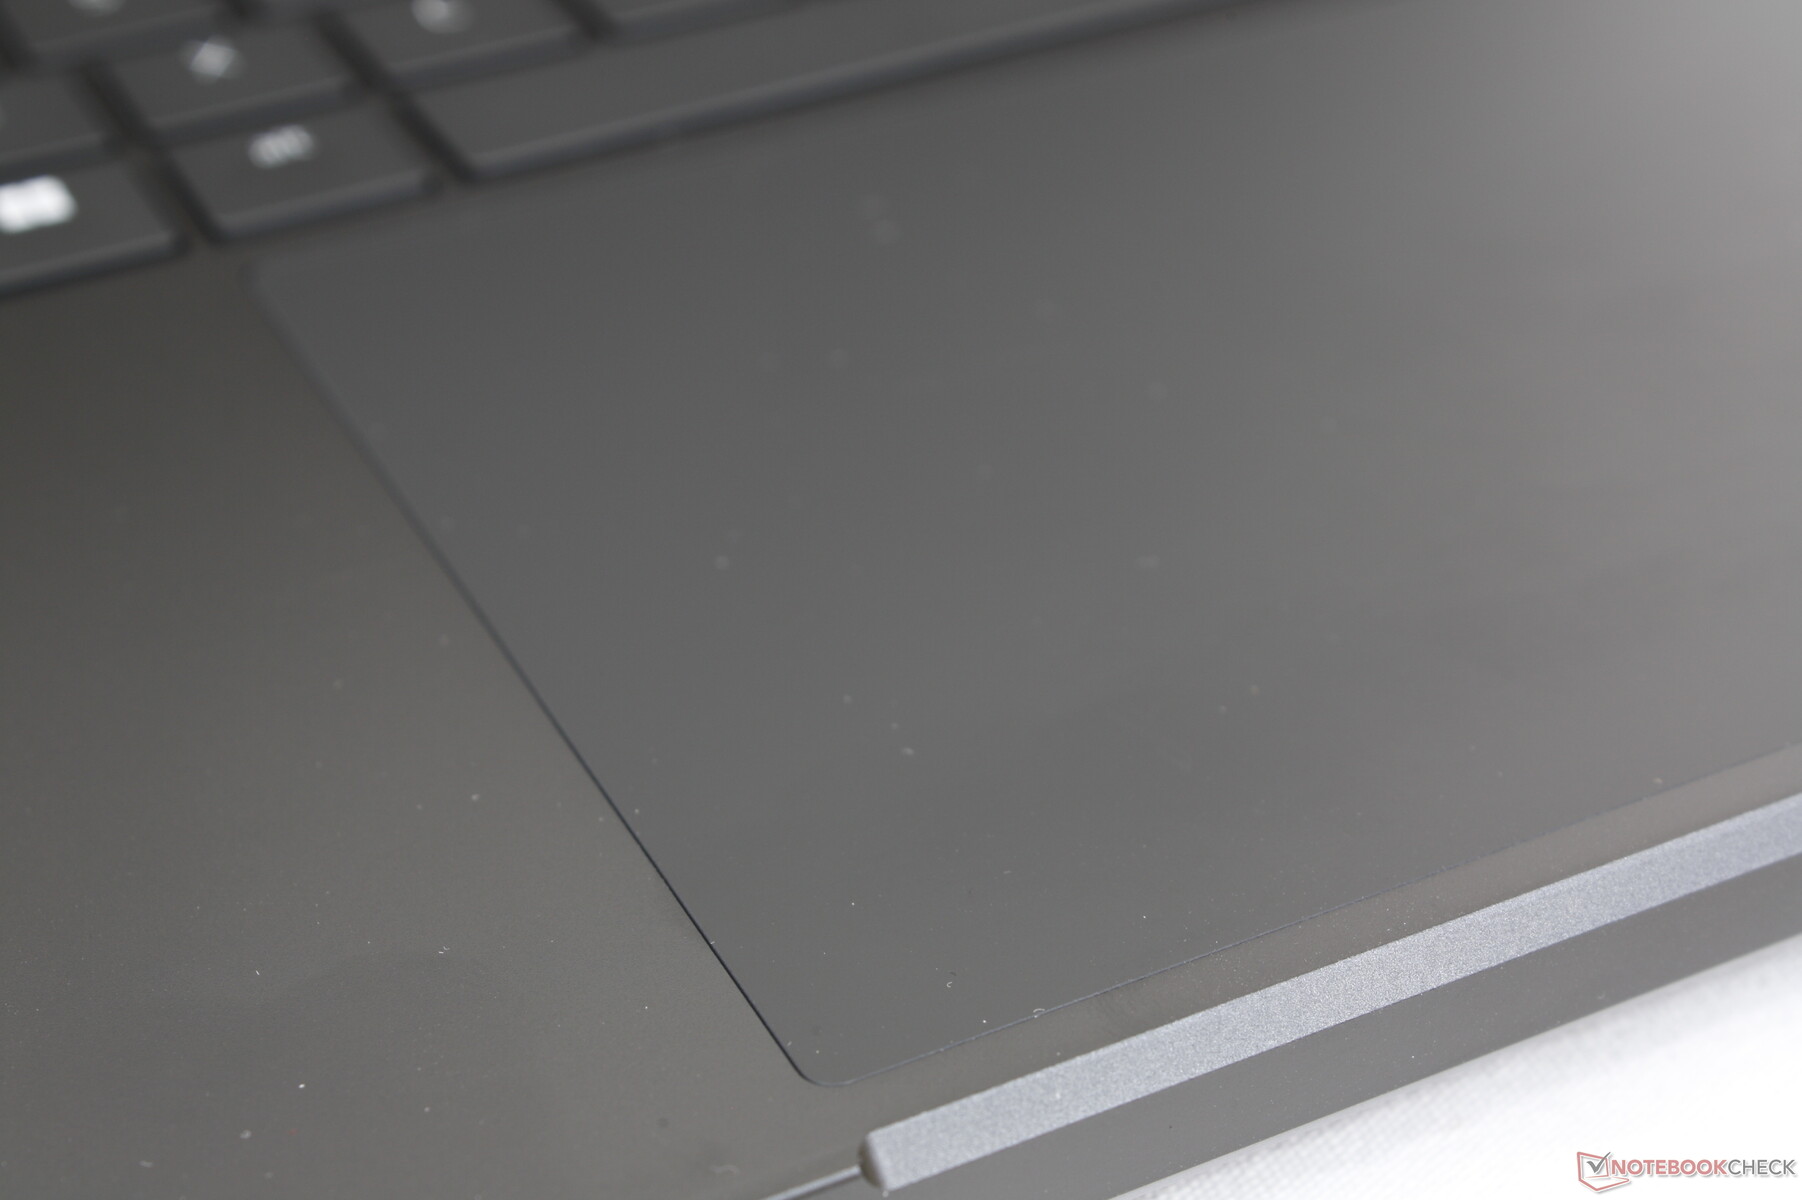
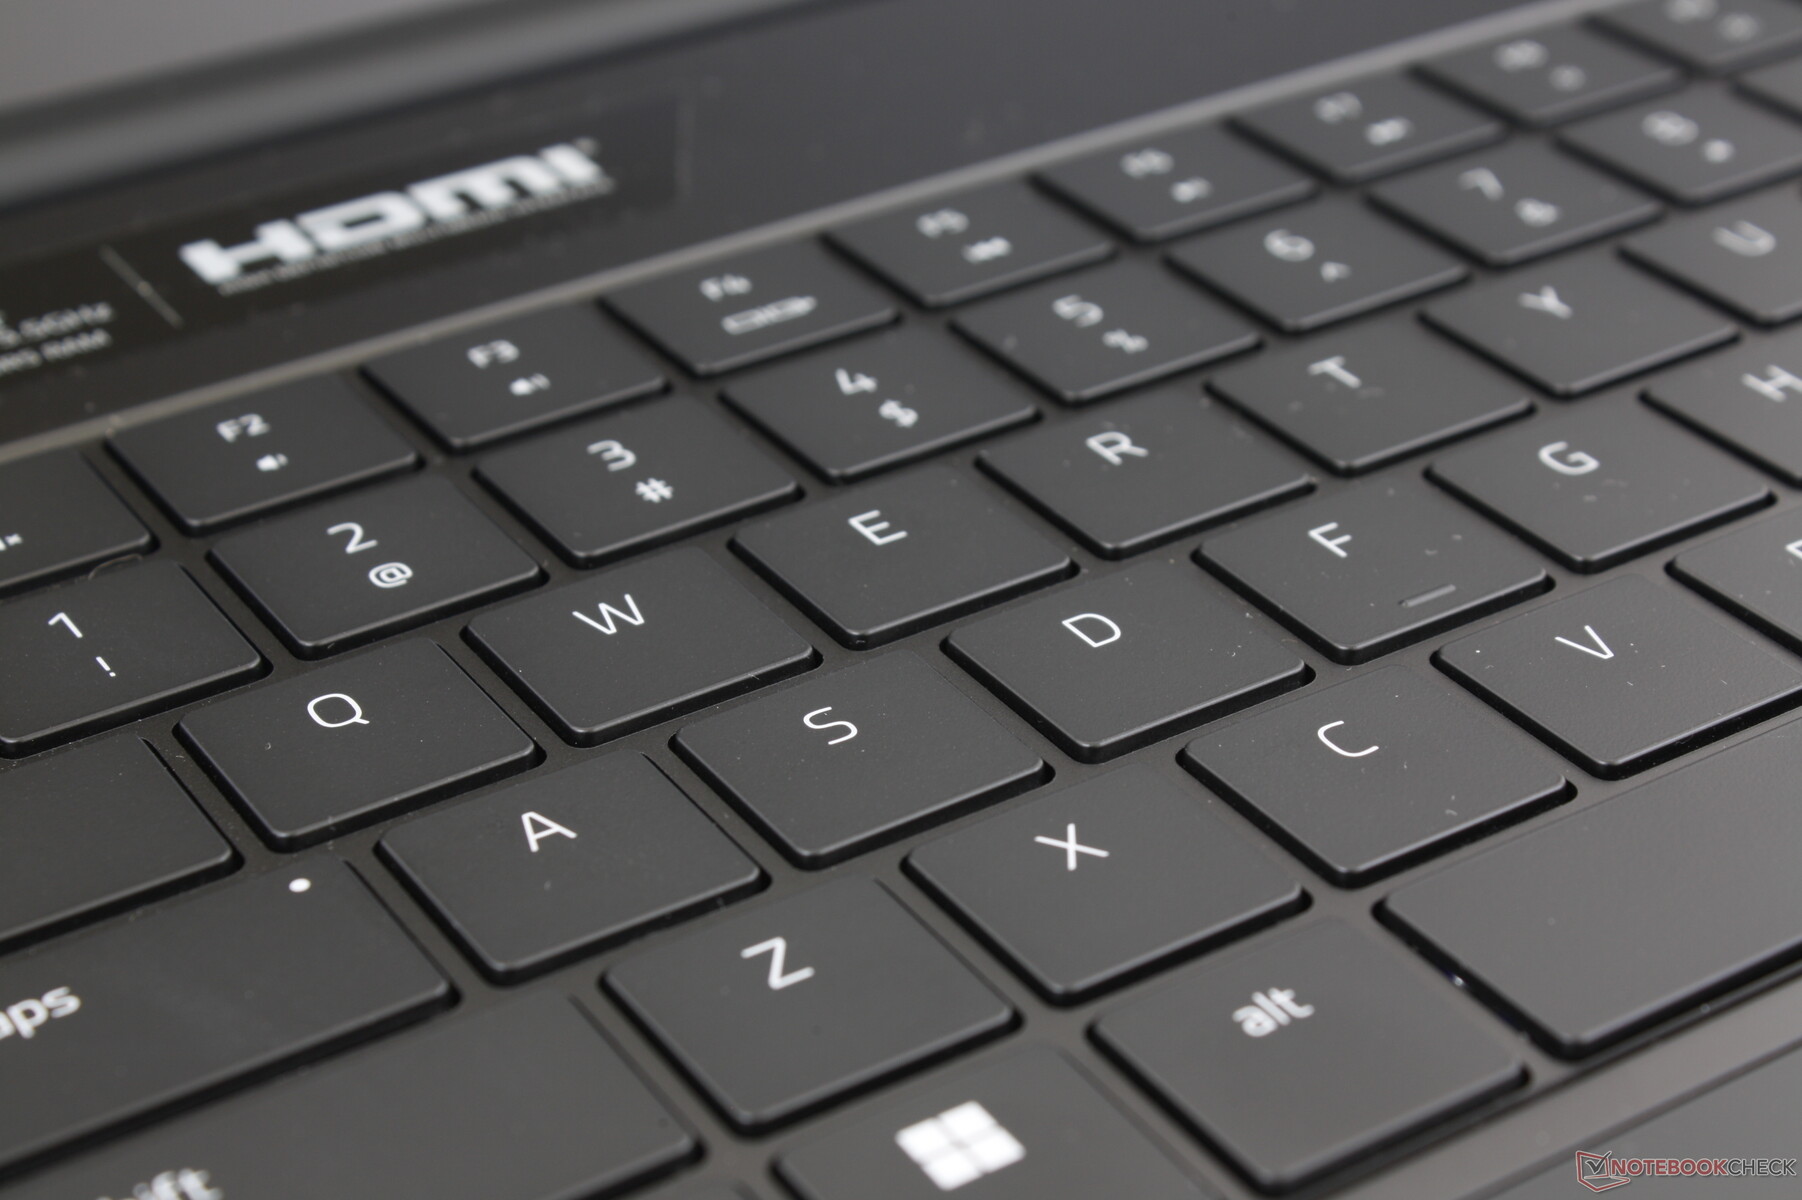
Dispositivi di input - Identici a quelli del Blade 16
Tastiera e touchpad
Sia la tastiera che il clickpad sono gli stessi del Blade 16, nonostante le differenze di dimensioni dello schermo tra i due modelli. Anche le dimensioni del clickpad (17 x 9,7 cm) e della tastiera non sono cambiate e quindi le nostre commenti esistenti sull'esperienza di digitazione del Blade 16 si applicano anche al Blade 18. È un peccato che Razer non abbia utilizzato la superficie extra per tasti freccia più grandi o per un eventuale tastierino numerico.
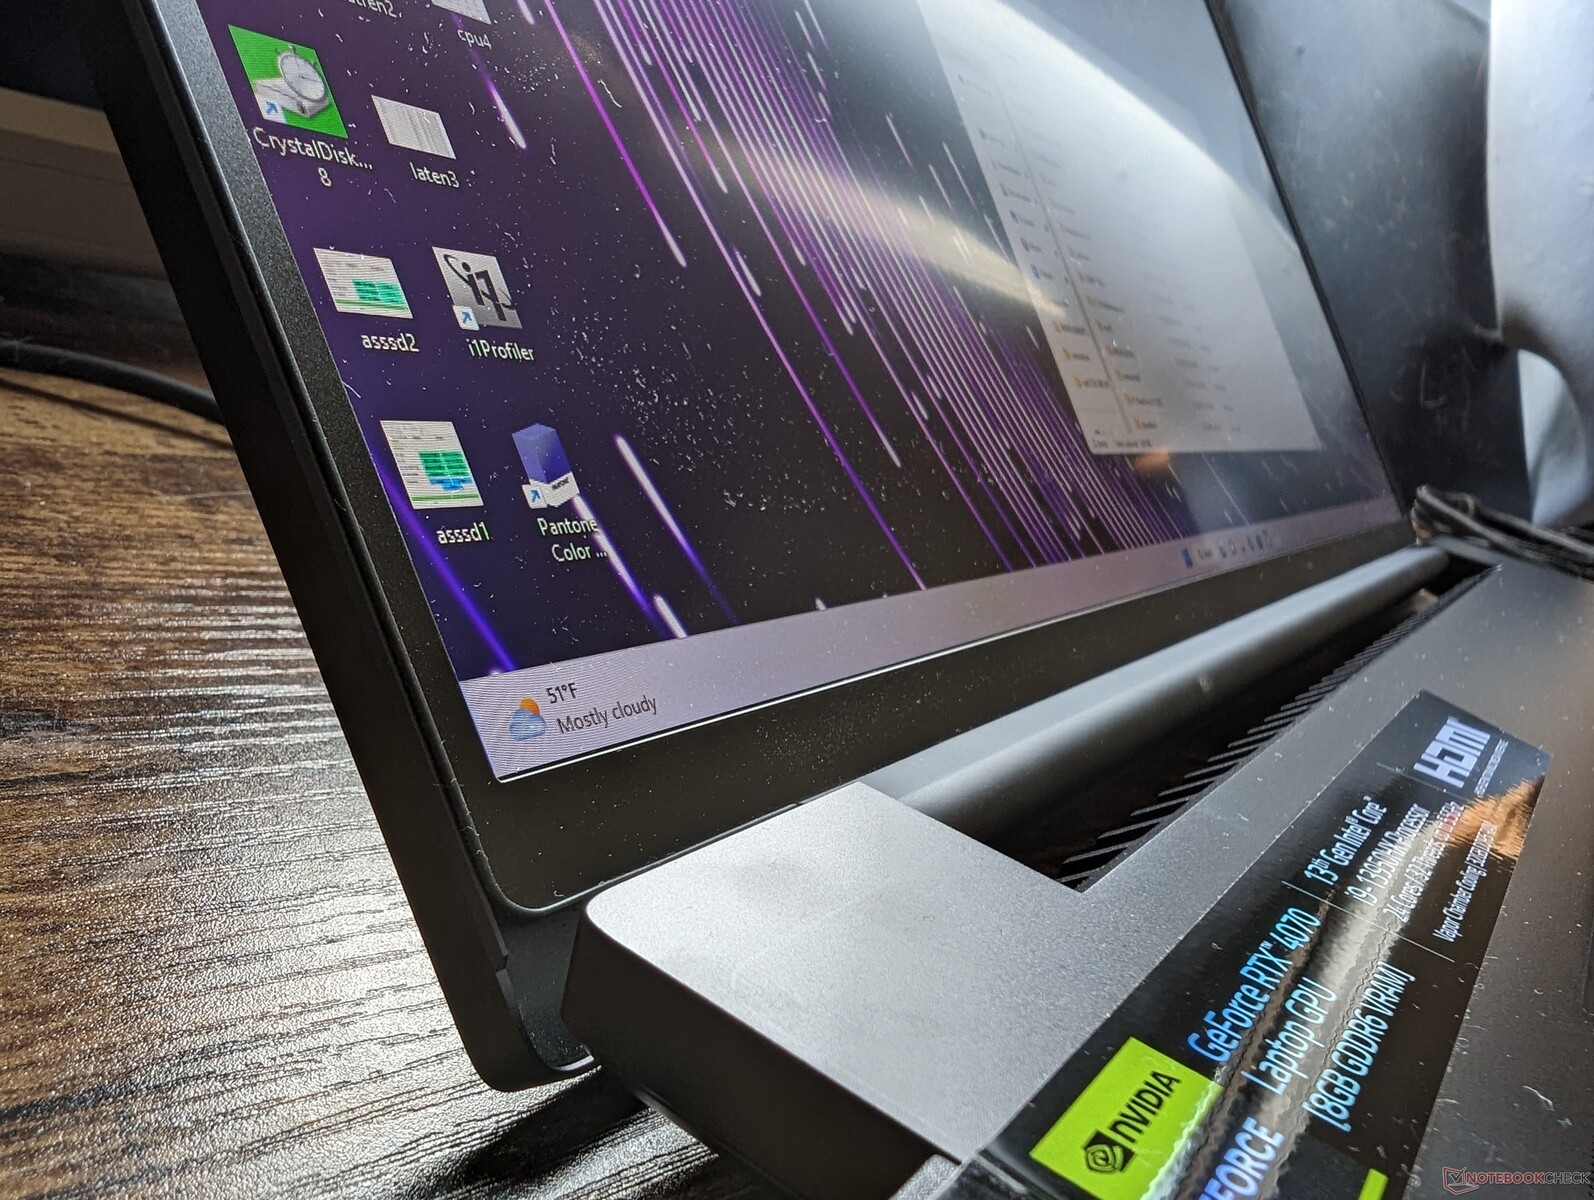
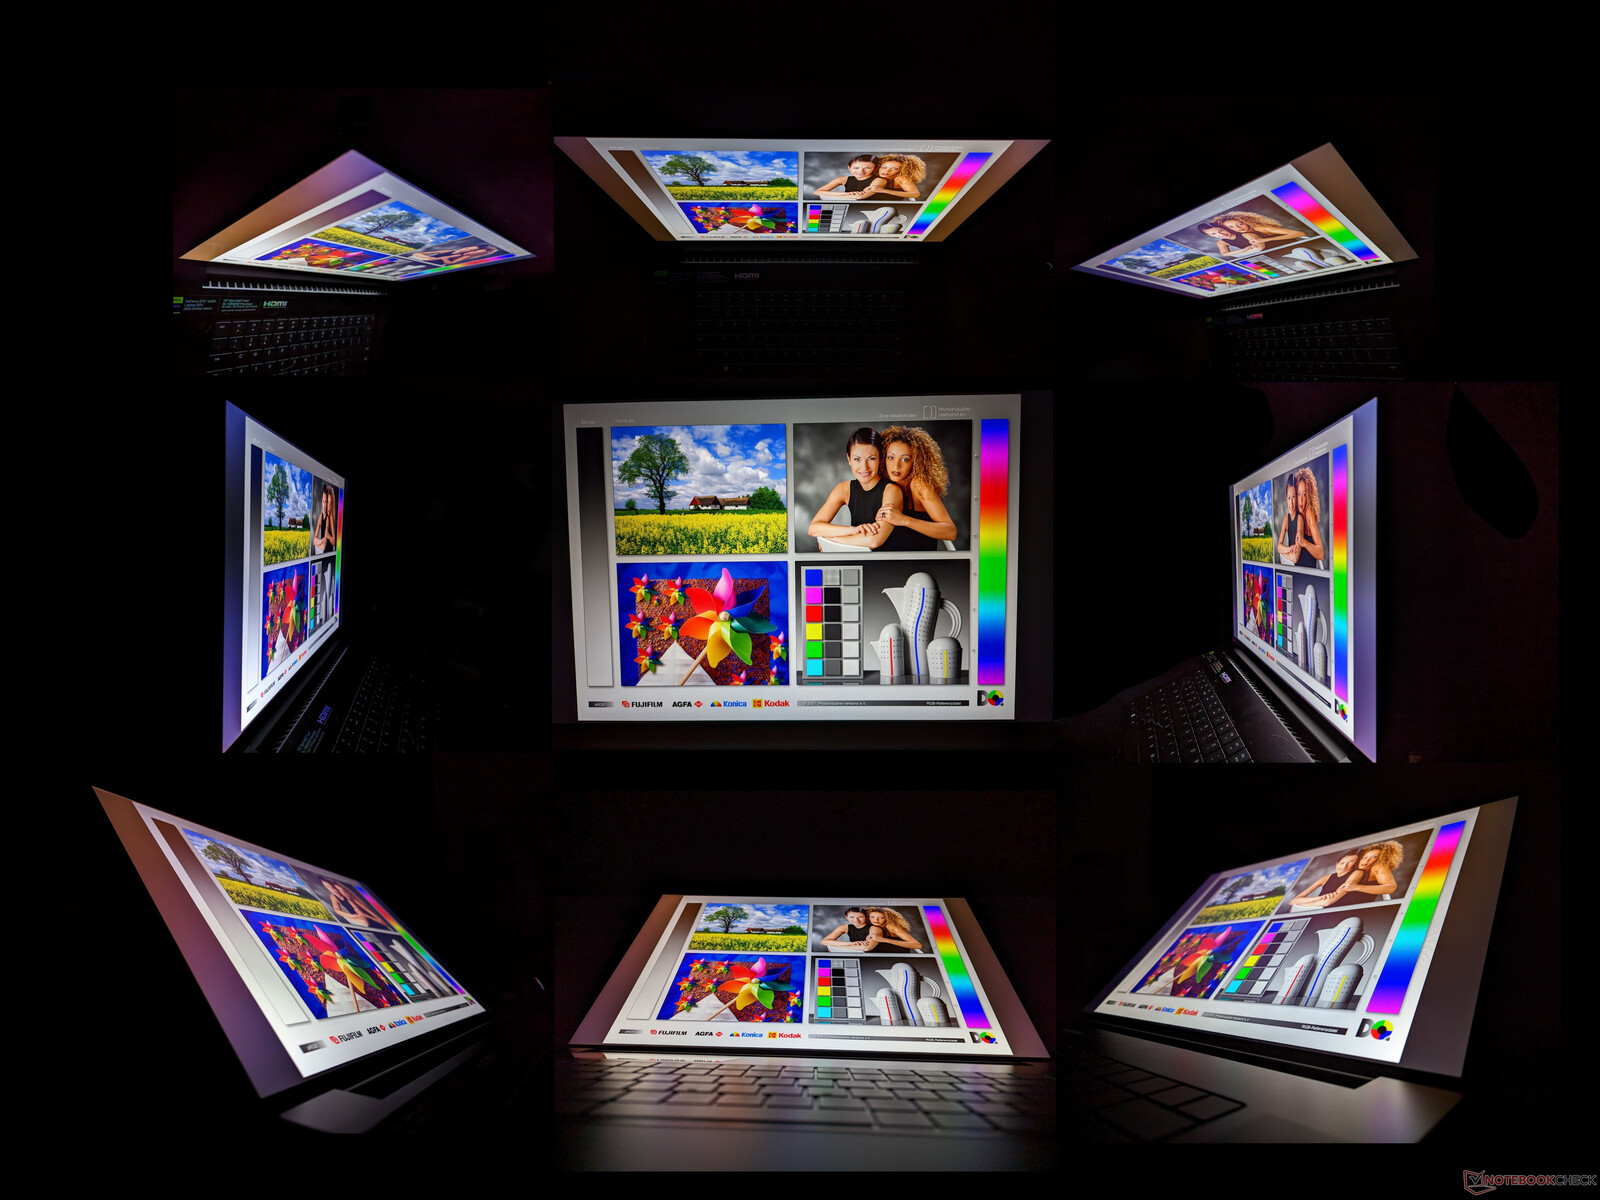
Display - Molto spazioso
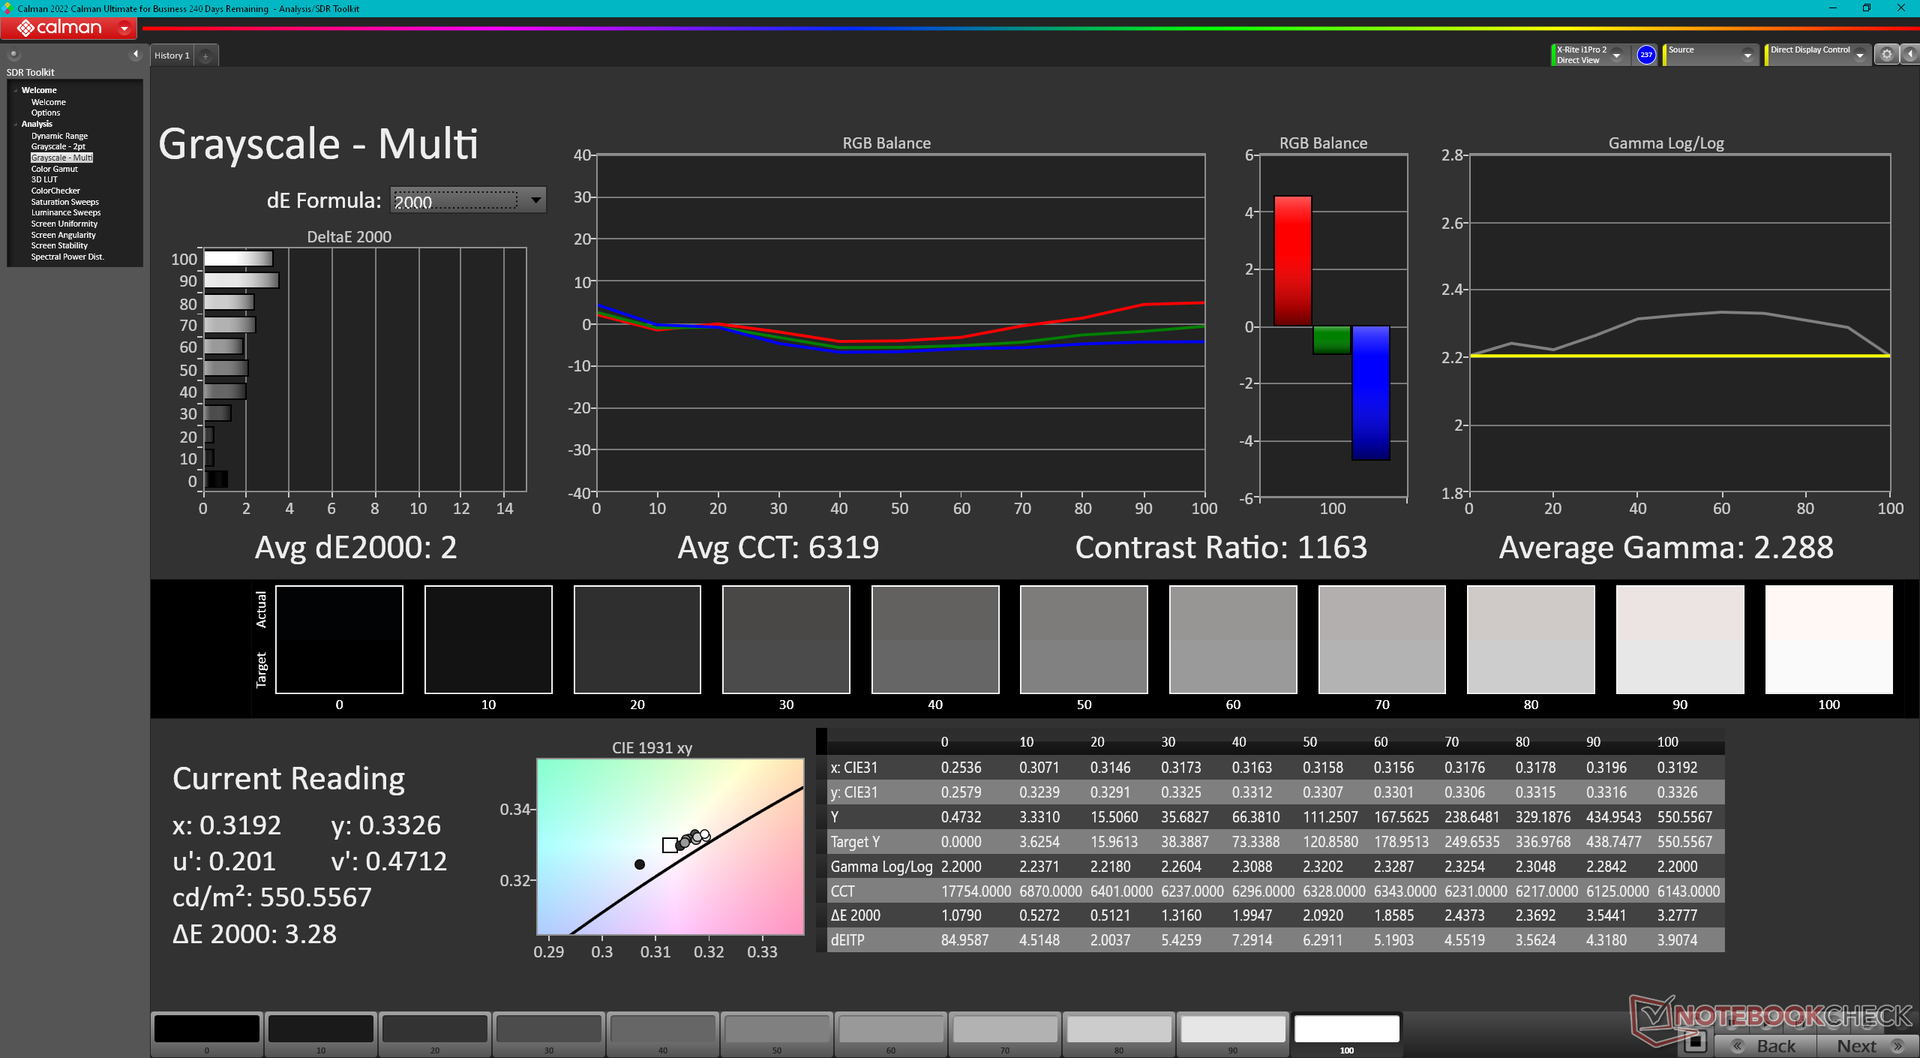
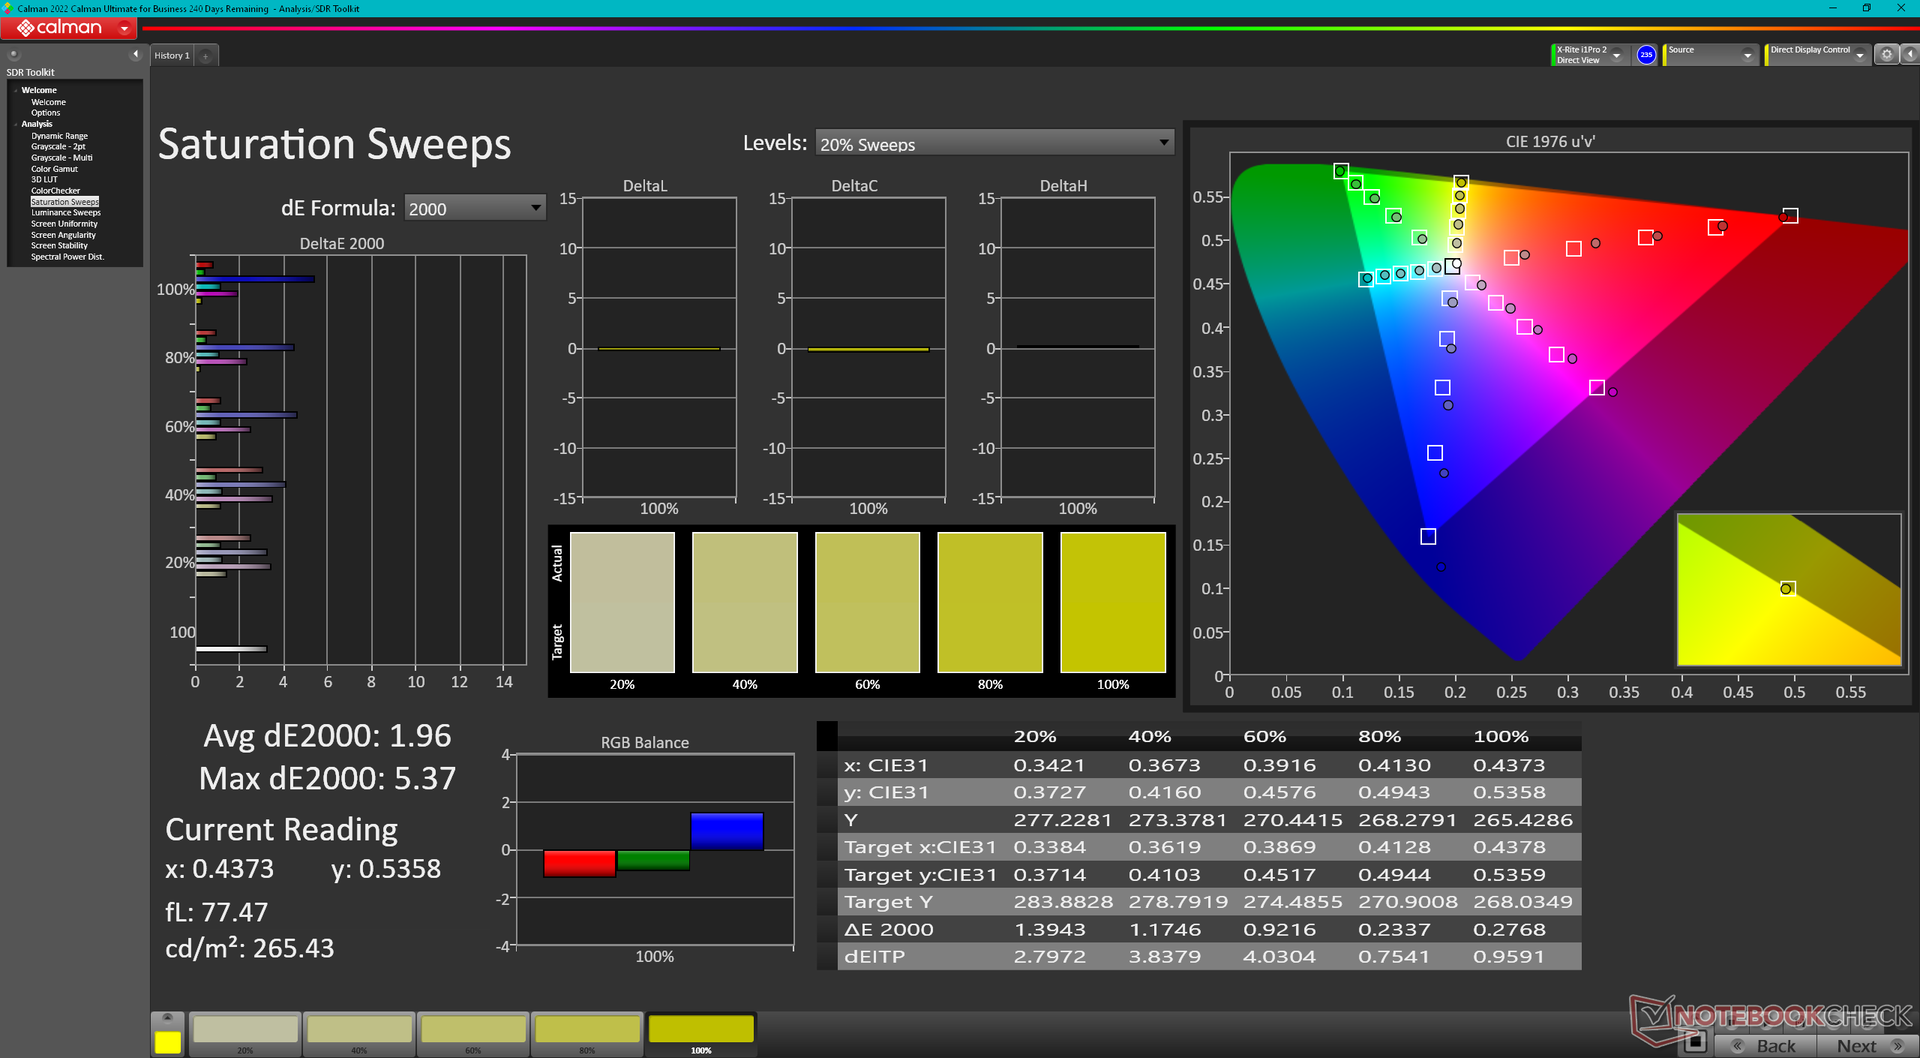
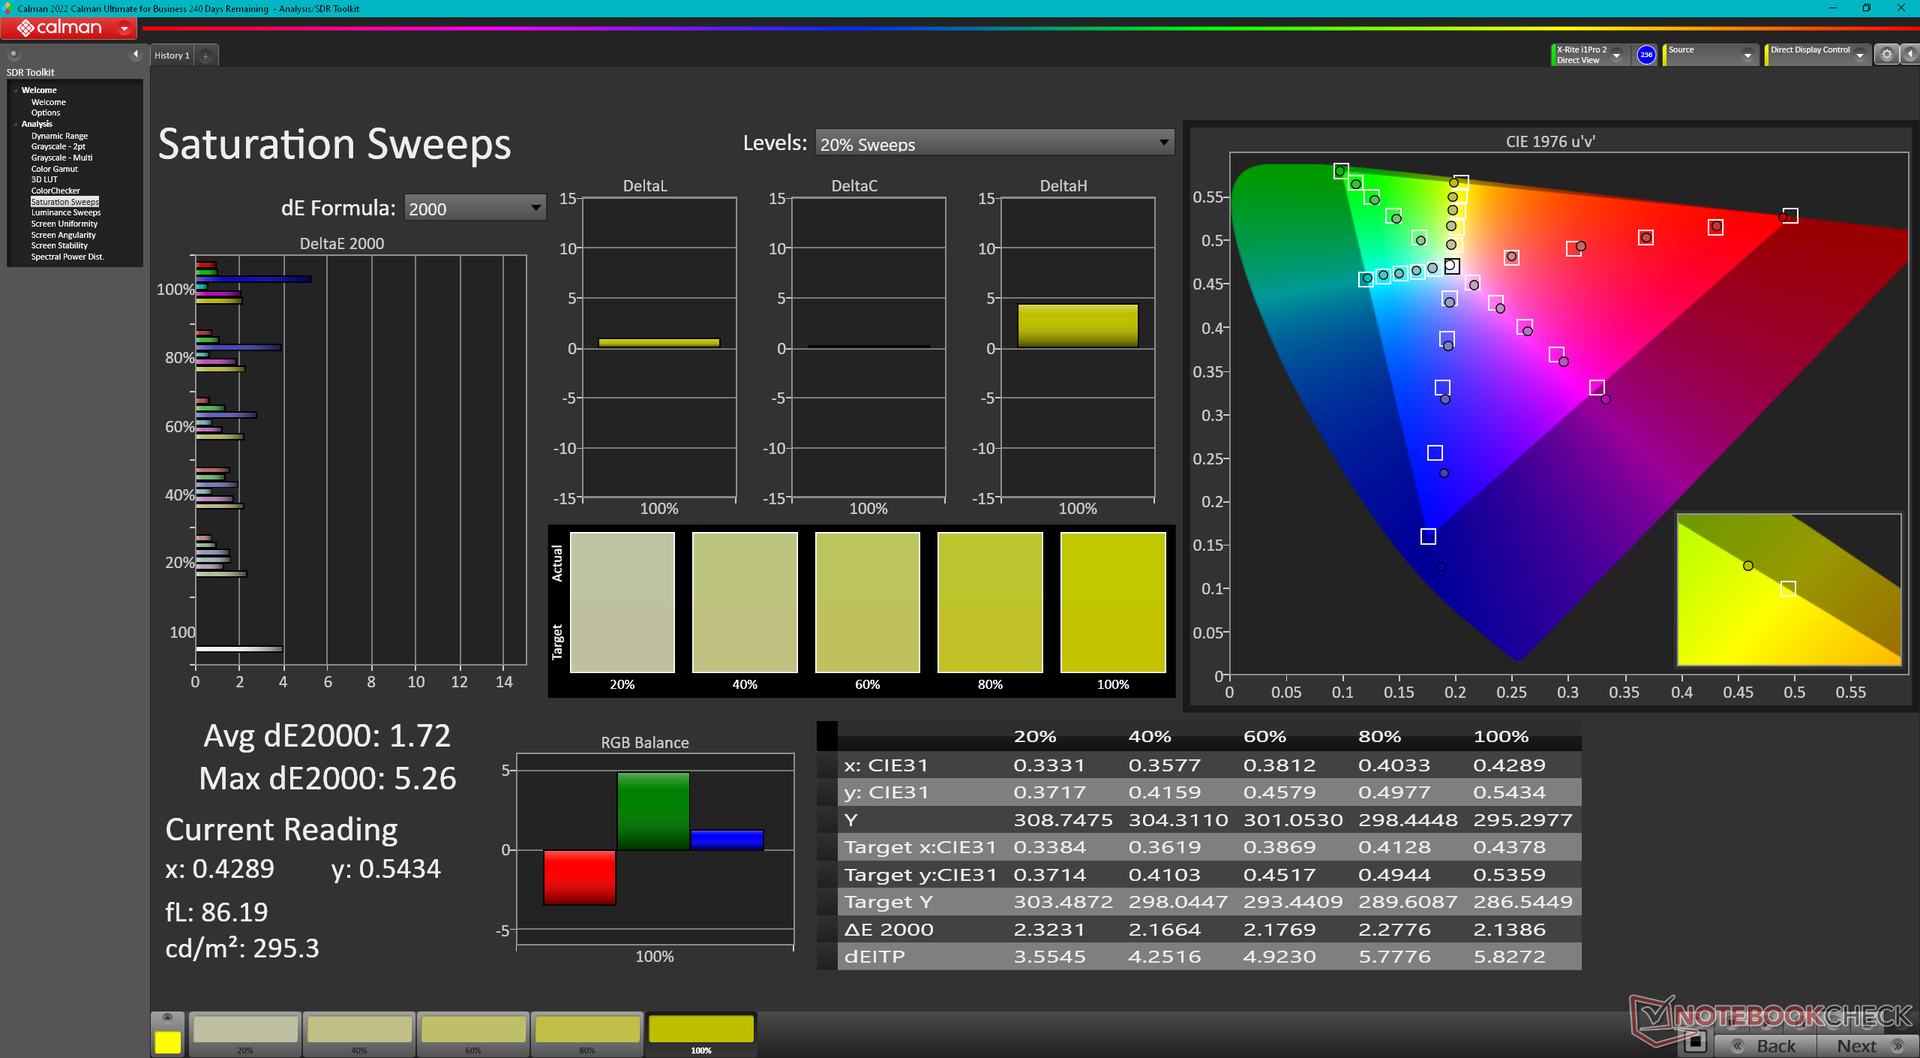
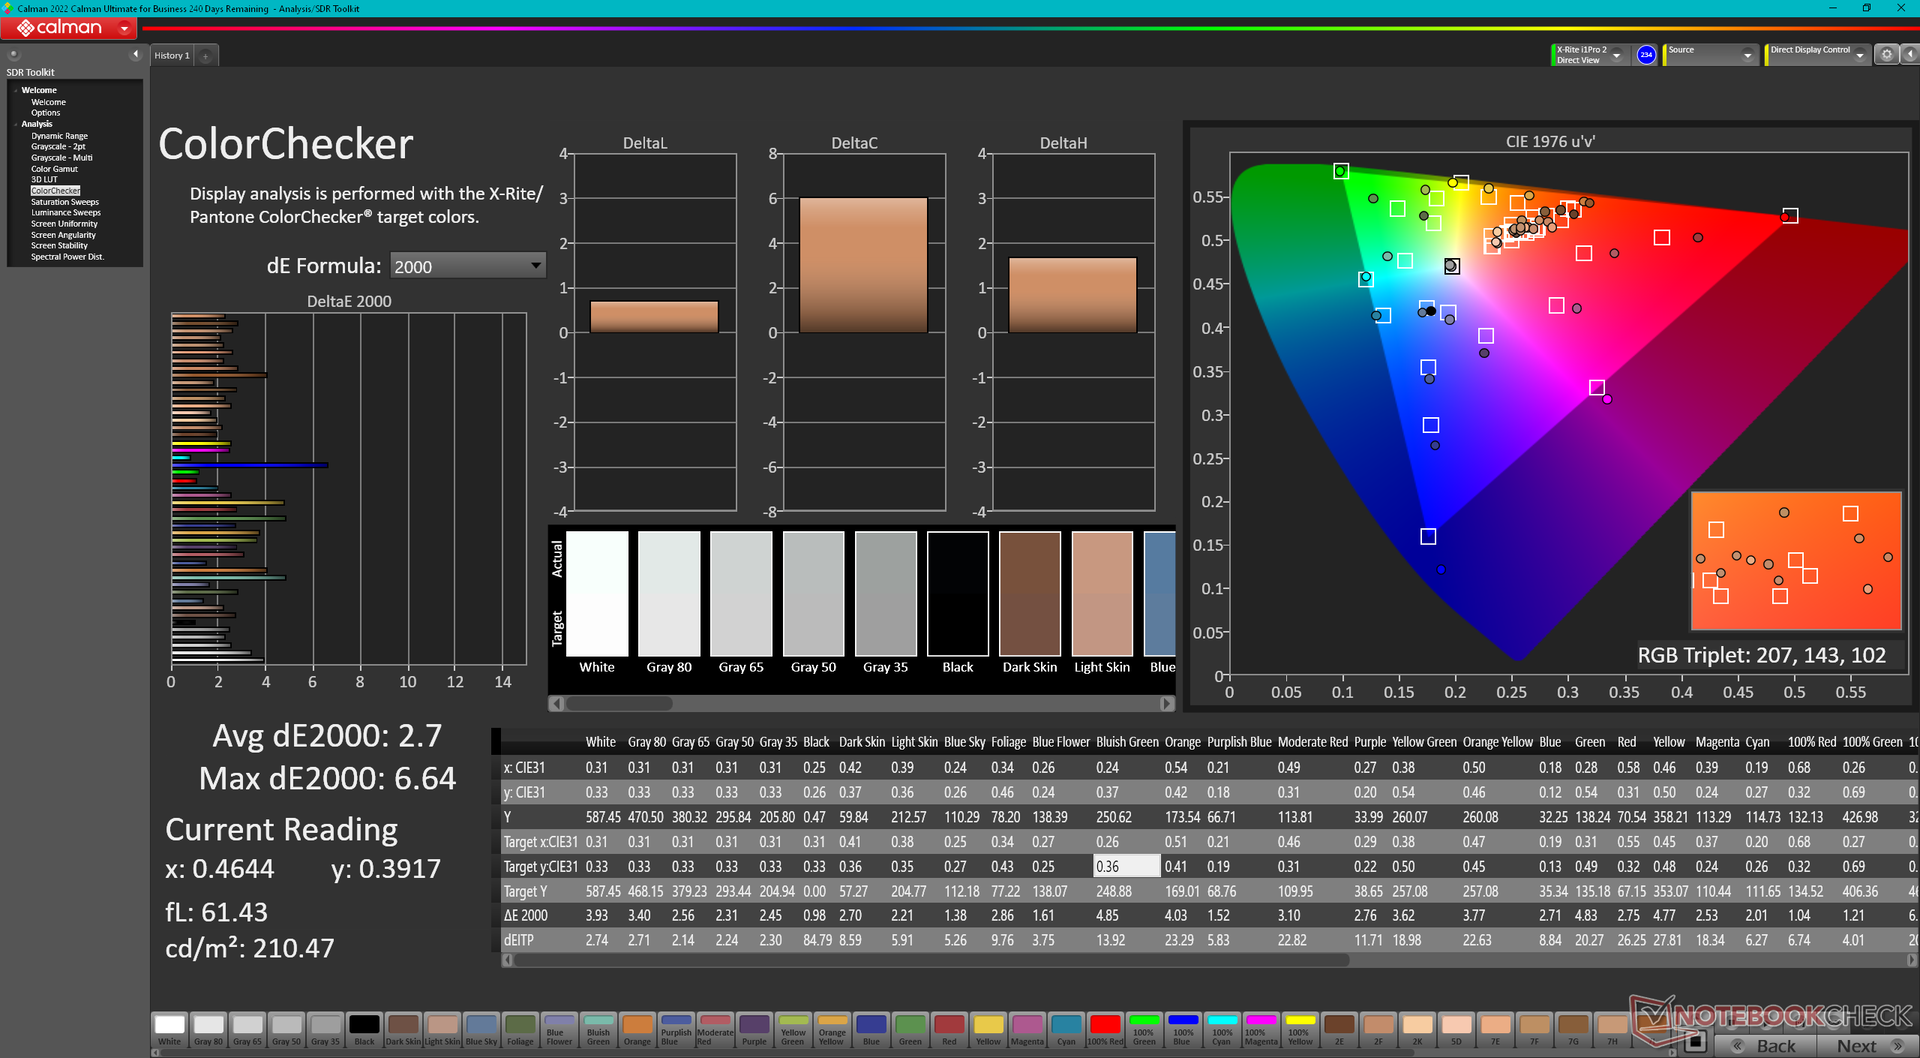
Al momento del lancio, il Blade 18 non dispone di un secondo pannello, probabilmente a causa di una fornitura limitata. Infatti, l'Asus ROG Strix Scar 18 da 18,0 pollici utilizzerà probabilmente lo stesso pannello IPS AU Optronics B180QAN01.0 presente sul Blade 18. Detto questo, si tratta comunque di un pannello di alta qualità con le solite caratteristiche comuni ai portatili da gioco di fascia alta, tra cui la veloce frequenza di aggiornamento nativa di 240 Hz, i rapidi tempi di risposta di 3 ms, la copertura completa dei colori DCI-P3, la luminosità di 500 nit e la calibrazione di fabbrica. Le nostre misurazioni indipendenti con un colorimetro e un oscilloscopio X-Rite hanno confermato queste affermazioni.
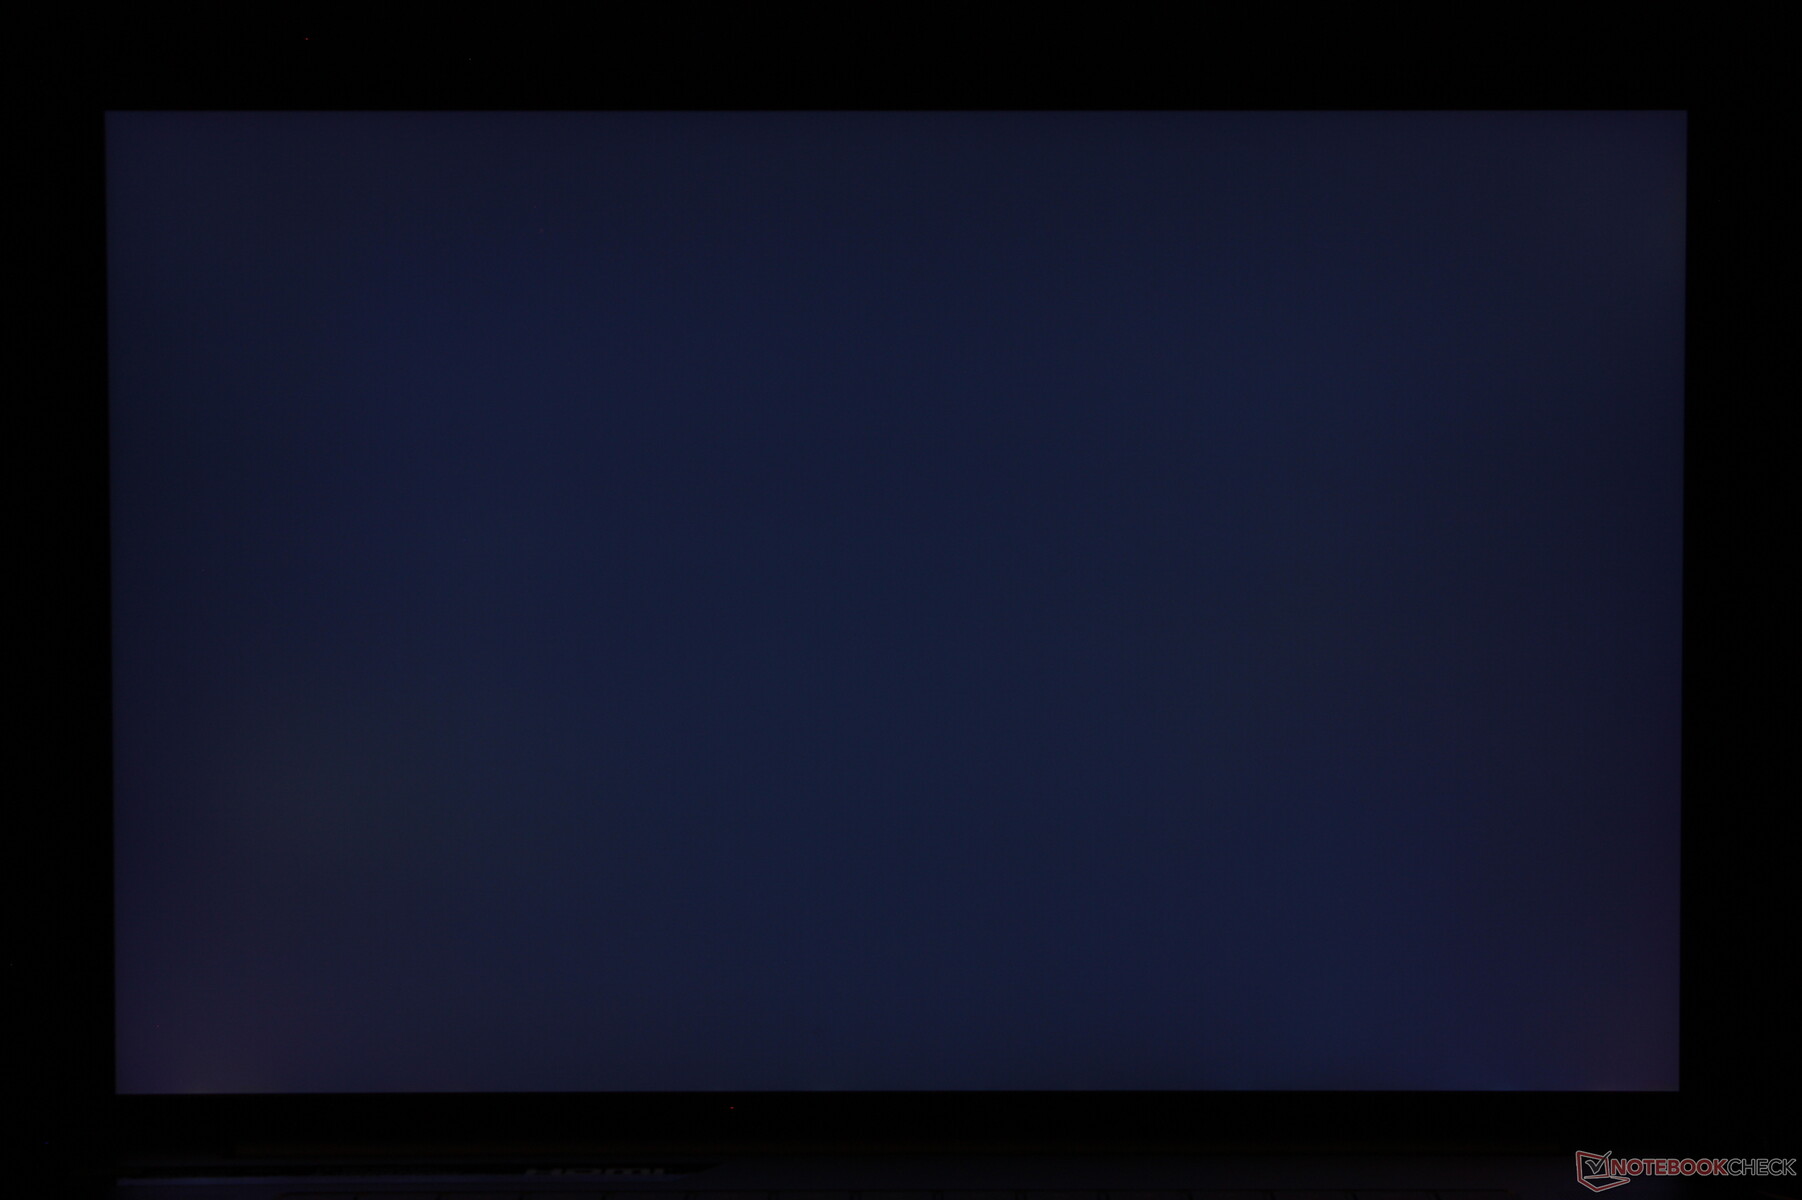
Sfortunatamente, il display della nostra unità di prova sfarfallava di tanto in tanto tra i diversi livelli di luminosità, apparentemente senza motivo. Lo sfarfallio non è correlato alla modulazione di larghezza di impulso, poiché il pannello non utilizza la PWM per il controllo della luminosità. Si tratta probabilmente di un difetto dello schermo, ma non possiamo ancora confermare se si tratta di un problema software o hardware. Secondo quanto riportato da , alcuni consumatori che hanno già acquistato il Blade 18 hanno riscontrato problemi simili di sfarfallio. Questa sezione verrà aggiornata non appena avremo una comunicazione ufficiale da parte di Razer.
| |||||||||||||||||||||||||
Distribuzione della luminosità: 89 %
Al centro con la batteria: 549.6 cd/m²
Contrasto: 1037:1 (Nero: 0.53 cd/m²)
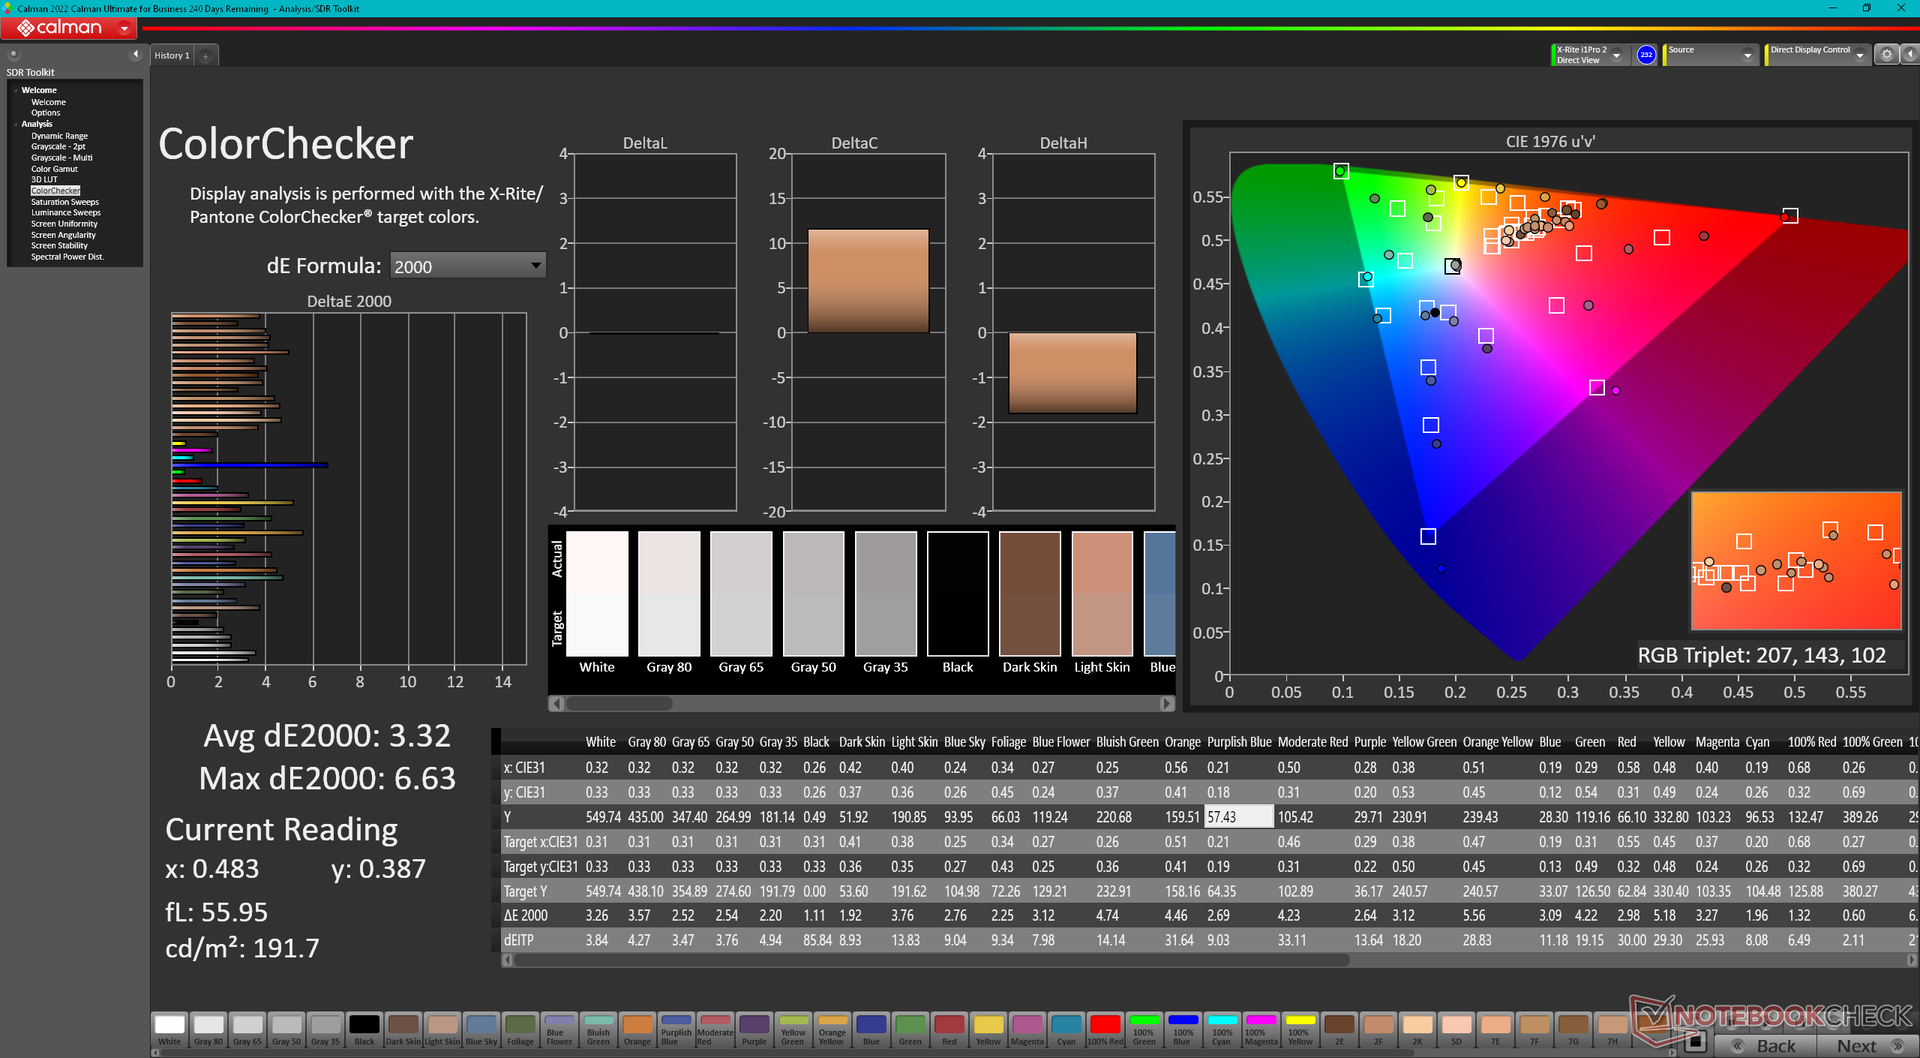
ΔE ColorChecker Calman: 3.32 | ∀{0.5-29.43 Ø4.71}
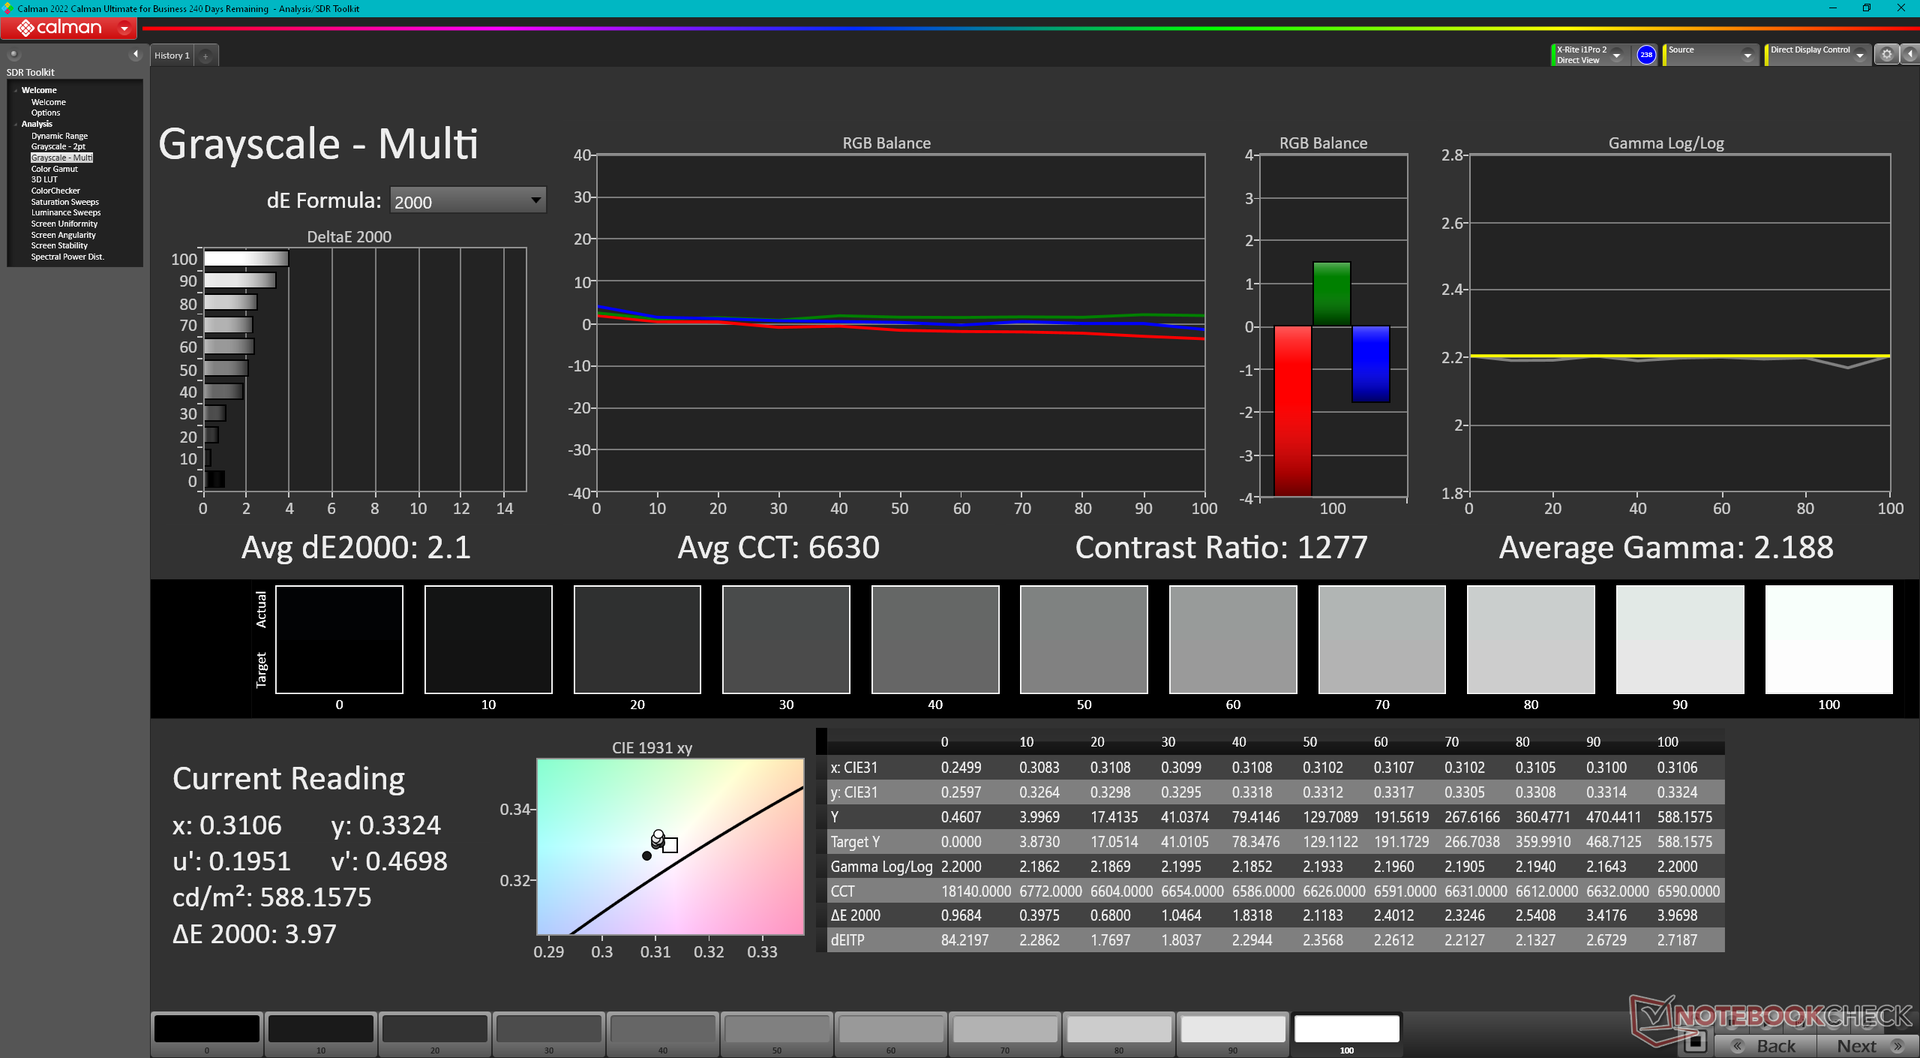
calibrated: 2.7
ΔE Greyscale Calman: 2 | ∀{0.09-98 Ø4.96}
85.3% AdobeRGB 1998 (Argyll 3D)
99.8% sRGB (Argyll 3D)
96.9% Display P3 (Argyll 3D)
Gamma: 2.29
CCT: 6319 K
| Razer Blade 18 RTX 4070 AU Optronics B180QAN01.0, IPS, 2560x1600, 18" | Razer Blade 17 Early 2022 AU Optronics B173ZAN06.9, IPS, 3840x2160, 17.3" | MSI Titan GT77 HX 13VI B173ZAN06.C, Mini-LED, 3840x2160, 17.3" | Gigabyte G7 KE AU Optronics B173HAN05.1, IPS, 1920x1080, 17.3" | Alienware m17 R5 (R9 6900HX, RX 6850M XT) AU Optronics AUODBA3, IPS, 3840x2160, 17" | Asus ROG Strix Scar 17 SE G733CX-LL014W NE173QHM-NZ2, IPS, 2560x1440, 17.3" | |
|---|---|---|---|---|---|---|
| Display | 2% | 2% | -14% | 1% | -0% | |
| Display P3 Coverage (%) | 96.9 | 99.4 3% | 94.9 -2% | 70.4 -27% | 97.2 0% | 97.1 0% |
| sRGB Coverage (%) | 99.8 | 100 0% | 99.9 0% | 99.8 0% | 99.6 0% | 99.9 0% |
| AdobeRGB 1998 Coverage (%) | 85.3 | 87.3 2% | 92.4 8% | 71.7 -16% | 88.4 4% | 84.8 -1% |
| Response Times | -25% | -524% | -12% | -168% | -31% | |
| Response Time Grey 50% / Grey 80% * (ms) | 4.2 ? | 7.5 ? -79% | 38.4 ? -814% | 5 ? -19% | 16.4 ? -290% | 5.7 ? -36% |
| Response Time Black / White * (ms) | 8 ? | 5.6 ? 30% | 26.6 ? -233% | 8.3 ? -4% | 11.6 ? -45% | 10.1 ? -26% |
| PWM Frequency (Hz) | 2380 ? | |||||
| Screen | 24% | 64905% | 19% | -40% | 16% | |
| Brightness middle (cd/m²) | 549.6 | 503 -8% | 606 10% | 307 -44% | 484 -12% | 320 -42% |
| Brightness (cd/m²) | 524 | 486 -7% | 602 15% | 301 -43% | 449 -14% | 303 -42% |
| Brightness Distribution (%) | 89 | 84 -6% | 93 4% | 93 4% | 87 -2% | 87 -2% |
| Black Level * (cd/m²) | 0.53 | 0.44 17% | 0.0001 100% | 0.2 62% | 0.55 -4% | 0.3 43% |
| Contrast (:1) | 1037 | 1143 10% | 6060000 584278% | 1535 48% | 880 -15% | 1067 3% |
| Colorchecker dE 2000 * | 3.32 | 1.08 67% | 4.8 -45% | 1.32 60% | 4.8 -45% | 1.1 67% |
| Colorchecker dE 2000 max. * | 6.63 | 4.54 32% | 8.2 -24% | 4.6 31% | 7.48 -13% | 2.7 59% |
| Colorchecker dE 2000 calibrated * | 2.7 | 0.6 78% | 1.8 33% | 1.03 62% | 4.74 -76% | |
| Greyscale dE 2000 * | 2 | 1.3 35% | 6.5 -225% | 2.1 -5% | 5.5 -175% | 1.1 45% |
| Gamma | 2.29 96% | 2.151 102% | 2.63 84% | 2.247 98% | 2.42 91% | 2.13 103% |
| CCT | 6319 103% | 6541 99% | 6596 99% | 6815 95% | 6148 106% | 6599 98% |
| Media totale (Programma / Settaggio) | 0% /
12% | 21461% /
41650% | -2% /
8% | -69% /
-49% | -5% /
5% |
* ... Meglio usare valori piccoli
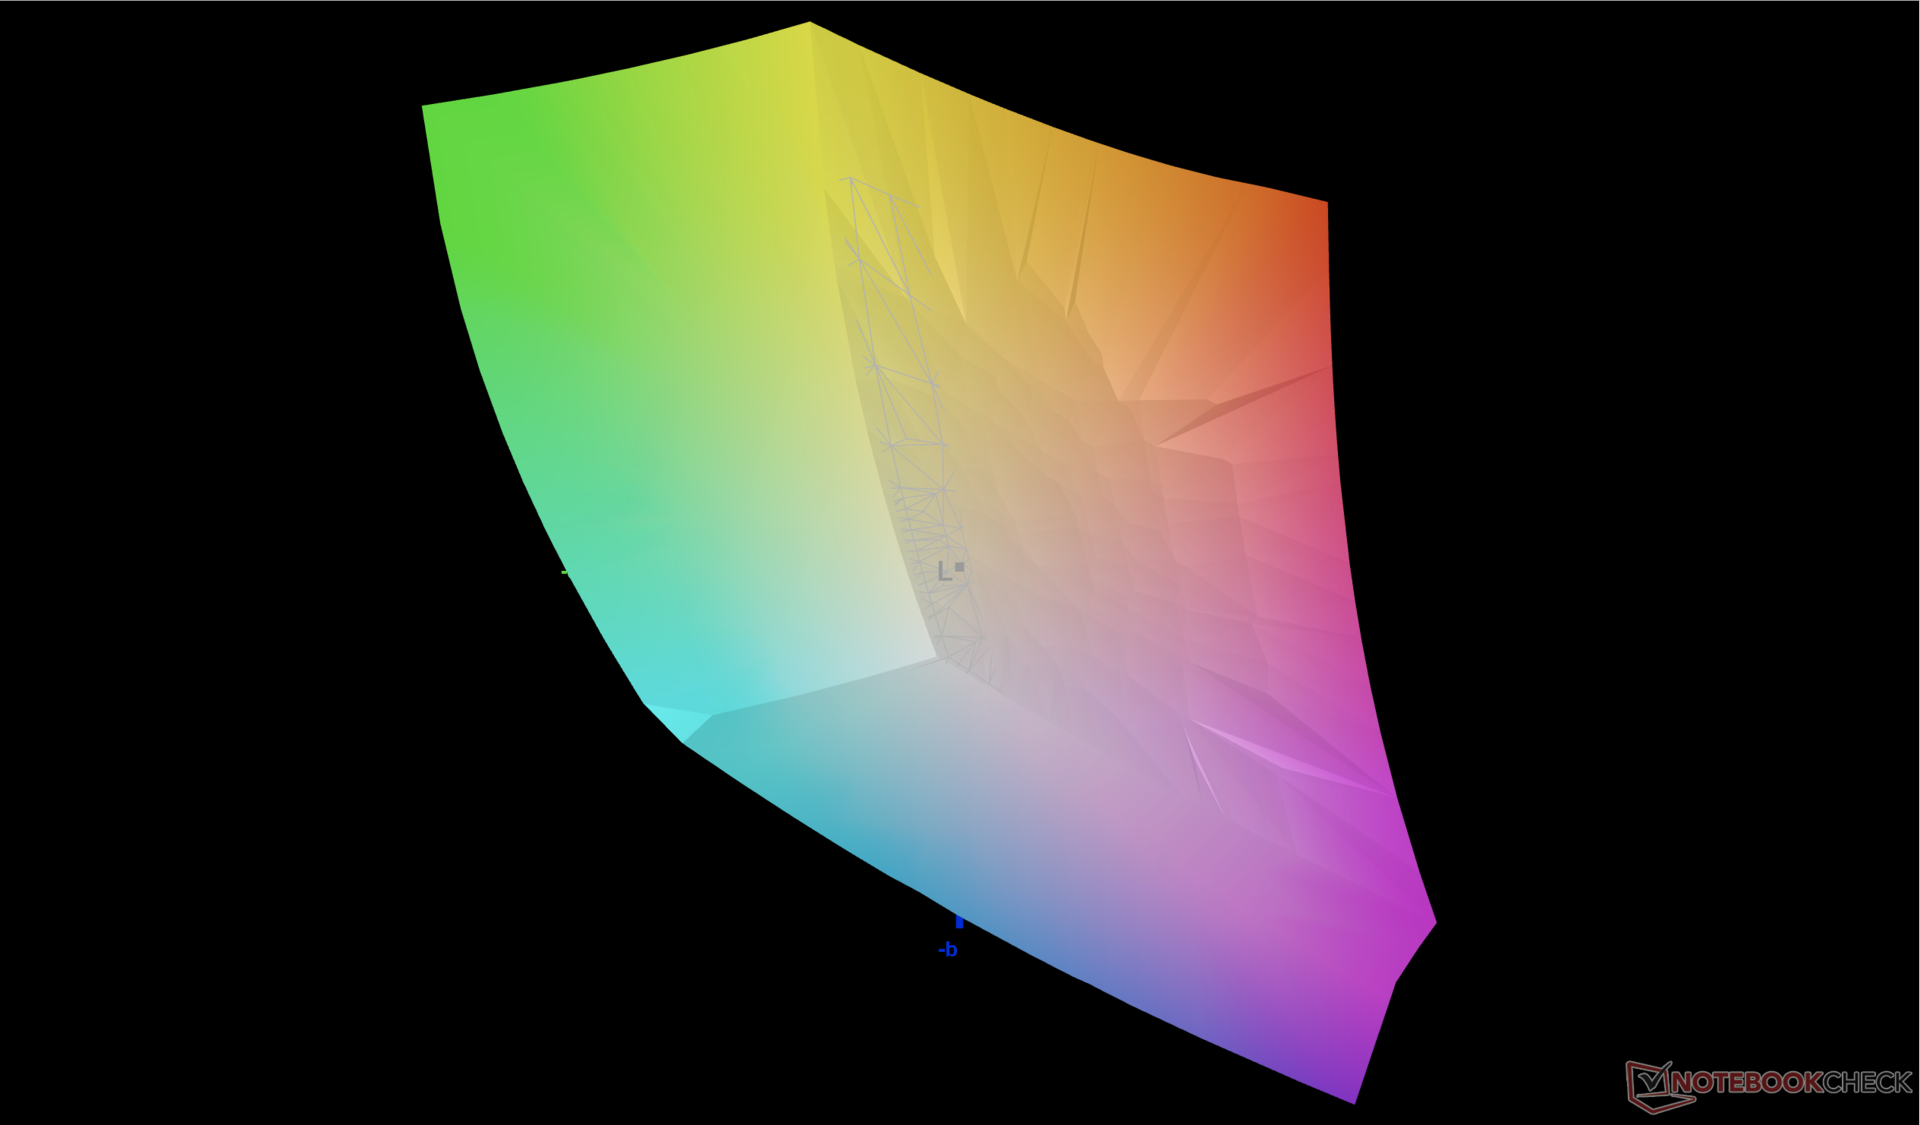
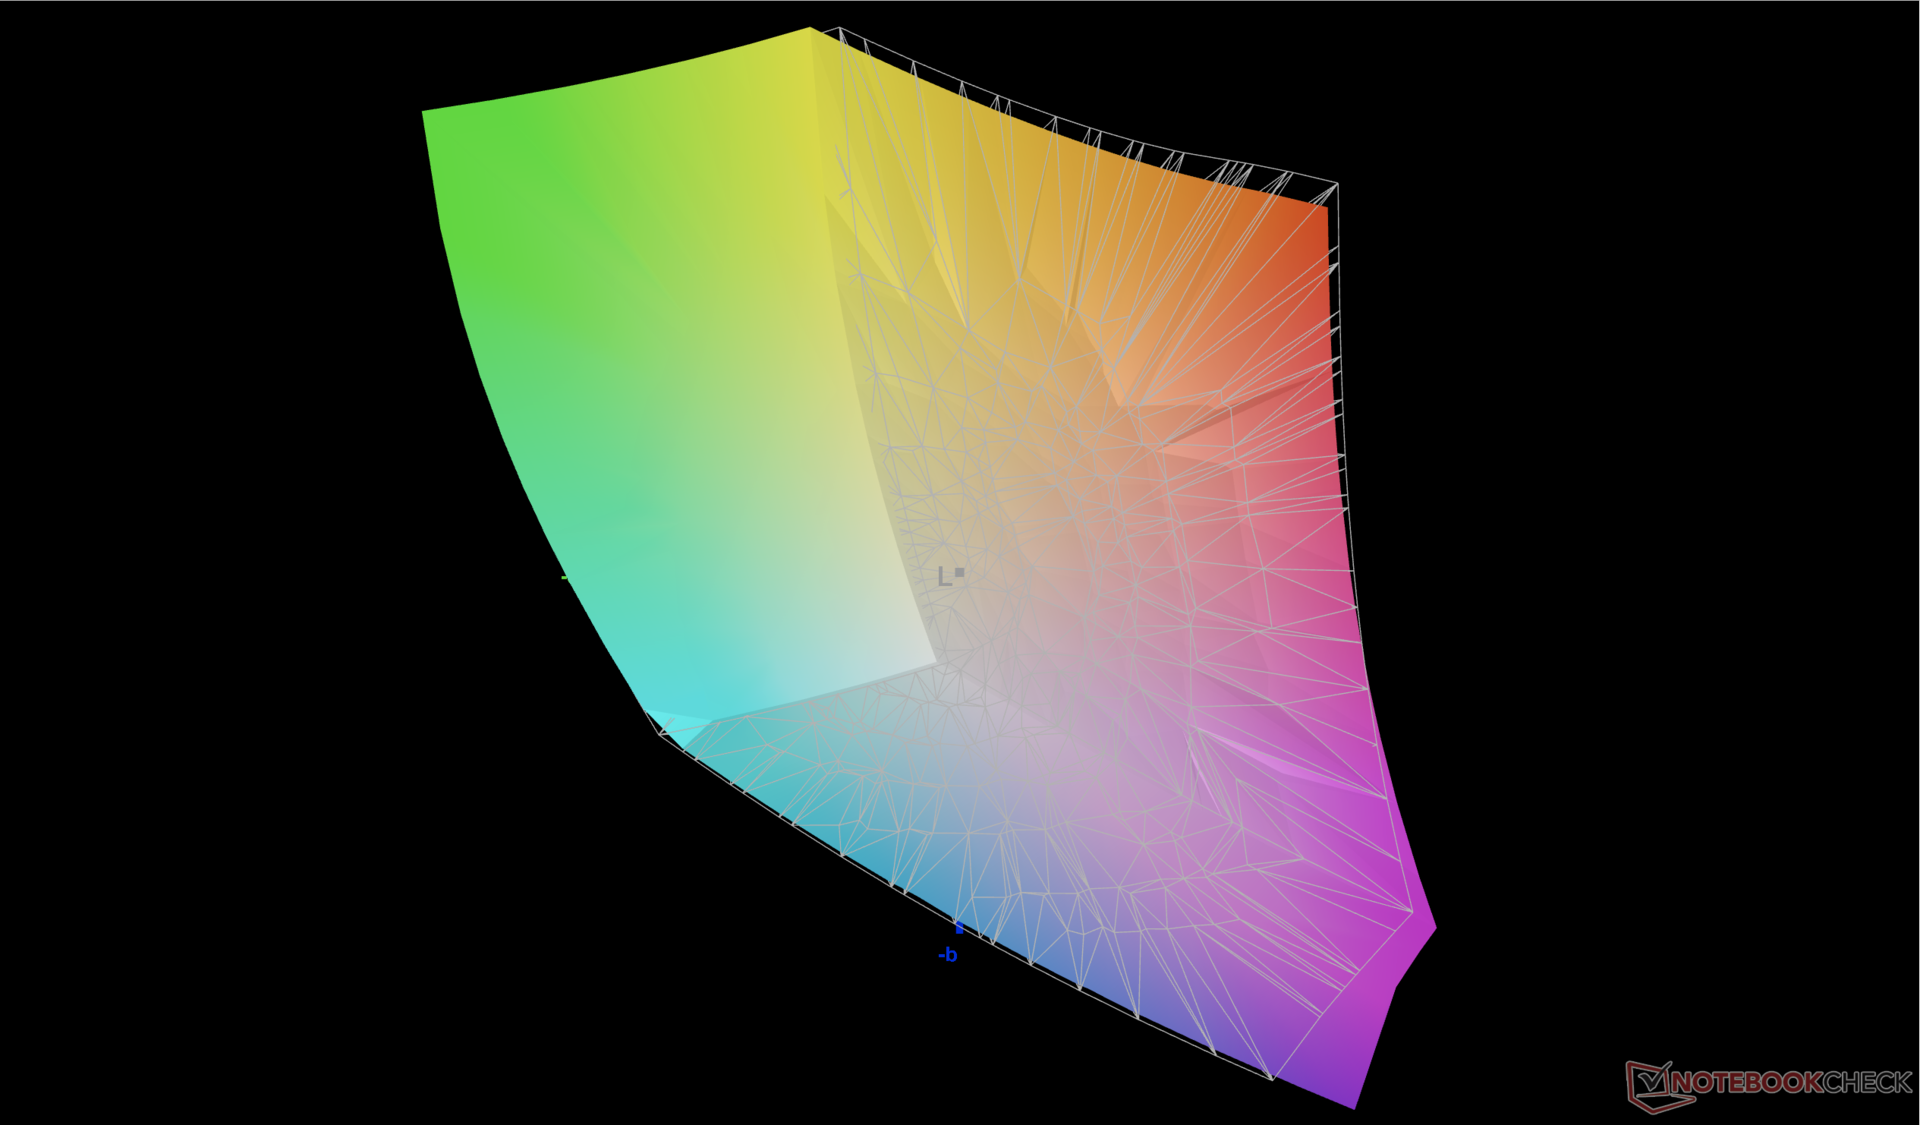
I valori medi deltaE della scala di grigi e del colore sono rispettivamente di soli 2,0 e 3,32, poiché il pannello viene fornito pre-calibrato rispetto allo standard P3. Il tentativo di calibrare ulteriormente il pannello non migliorerebbe i colori in modo significativo. Il blu, tuttavia, sembra essere rappresentato in modo più impreciso rispetto agli altri colori primari o secondari.
Tempi di risposta del Display
| ↔ Tempi di risposta dal Nero al Bianco | ||
|---|---|---|
| 8 ms ... aumenta ↗ e diminuisce ↘ combinato | ↗ 3.8 ms Incremento | 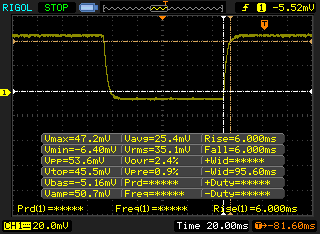 |
| ↘ 4.2 ms Calo | ||
| Lo schermo mostra veloci tempi di risposta durante i nostri tests e dovrebbe esere adatto al gaming In confronto, tutti i dispositivi di test variano da 0.1 (minimo) a 240 (massimo) ms. » 22 % di tutti i dispositivi è migliore. Questo significa che i tempi di risposta rilevati sono migliori rispettto alla media di tutti i dispositivi testati (19.8 ms). | ||
| ↔ Tempo di risposta dal 50% Grigio all'80% Grigio | ||
| 4.2 ms ... aumenta ↗ e diminuisce ↘ combinato | ↗ 2.1 ms Incremento | 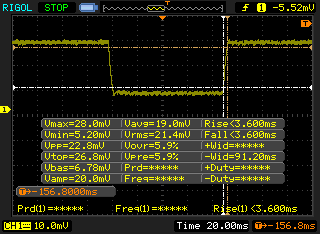 |
| ↘ 2.1 ms Calo | ||
| Lo schermo ha mostrato valori di risposta molto veloci nei nostri tests ed è molto adatto per i gaming veloce. In confronto, tutti i dispositivi di test variano da 0.165 (minimo) a 636 (massimo) ms. » 16 % di tutti i dispositivi è migliore. Questo significa che i tempi di risposta rilevati sono migliori rispettto alla media di tutti i dispositivi testati (31 ms). | ||
Sfarfallio dello schermo / PWM (Pulse-Width Modulation)
| flickering dello schermo / PWM non rilevato | 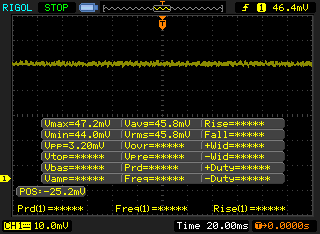 | ||
In confronto: 52 % di tutti i dispositivi testati non utilizza PWM per ridurre la luminosita' del display. Se è rilevato PWM, una media di 7757 (minimo: 5 - massimo: 343500) Hz è stata rilevata. | |||
La visibilità all'aperto è simile a quella del Blade 17, dato che i loro display hanno ciascuno un massimo di 500 nit. Si consiglia sempre l'ombra per ottenere colori ottimali e ridurre il più possibile i riflessi.
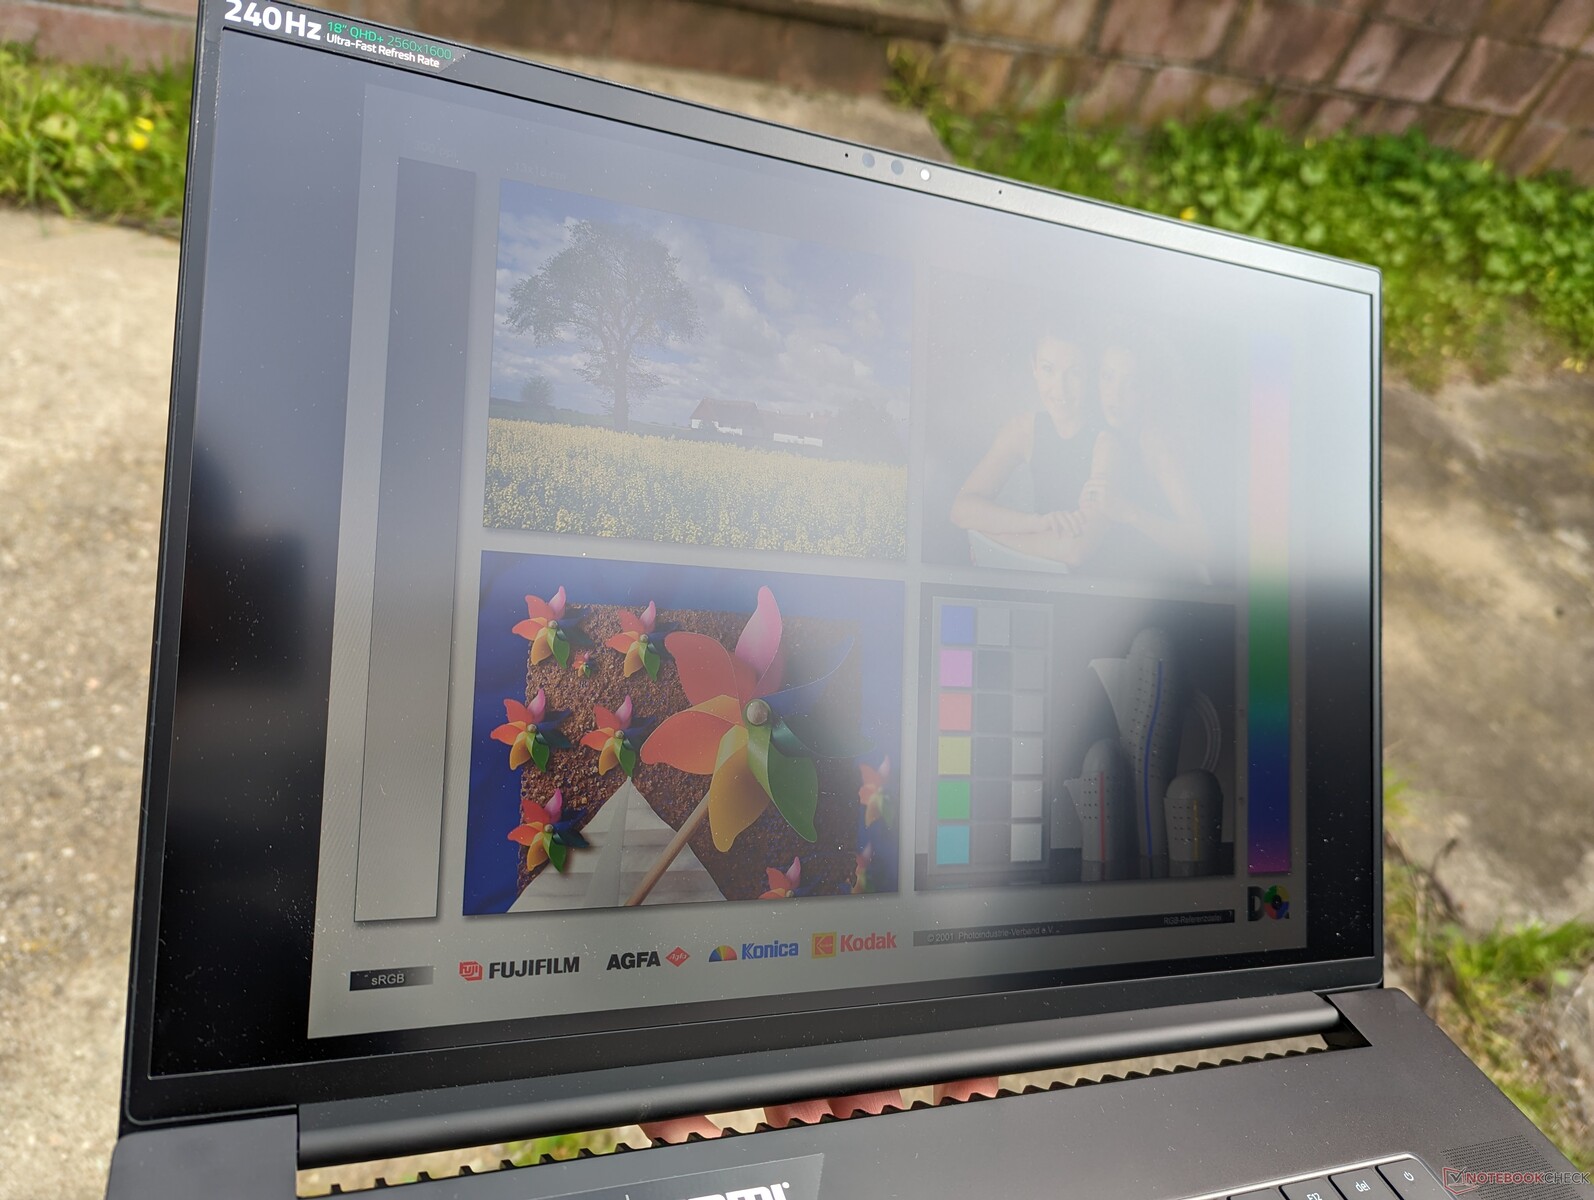
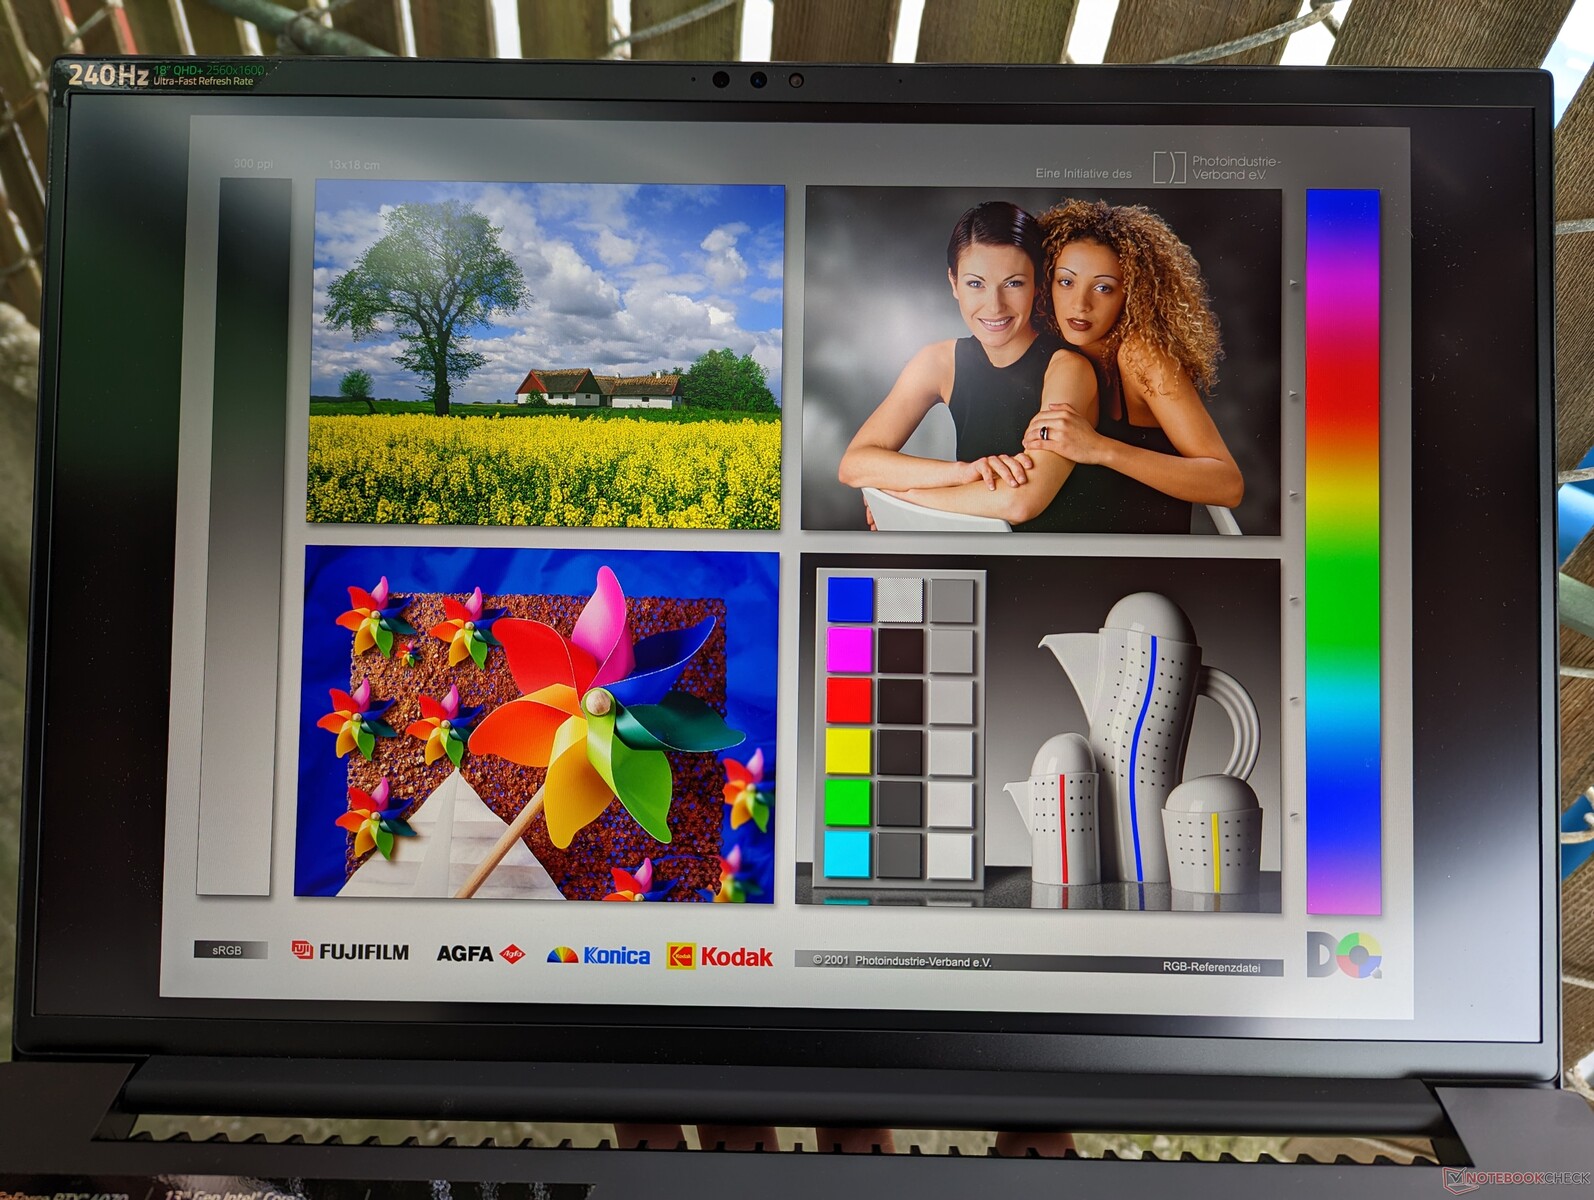
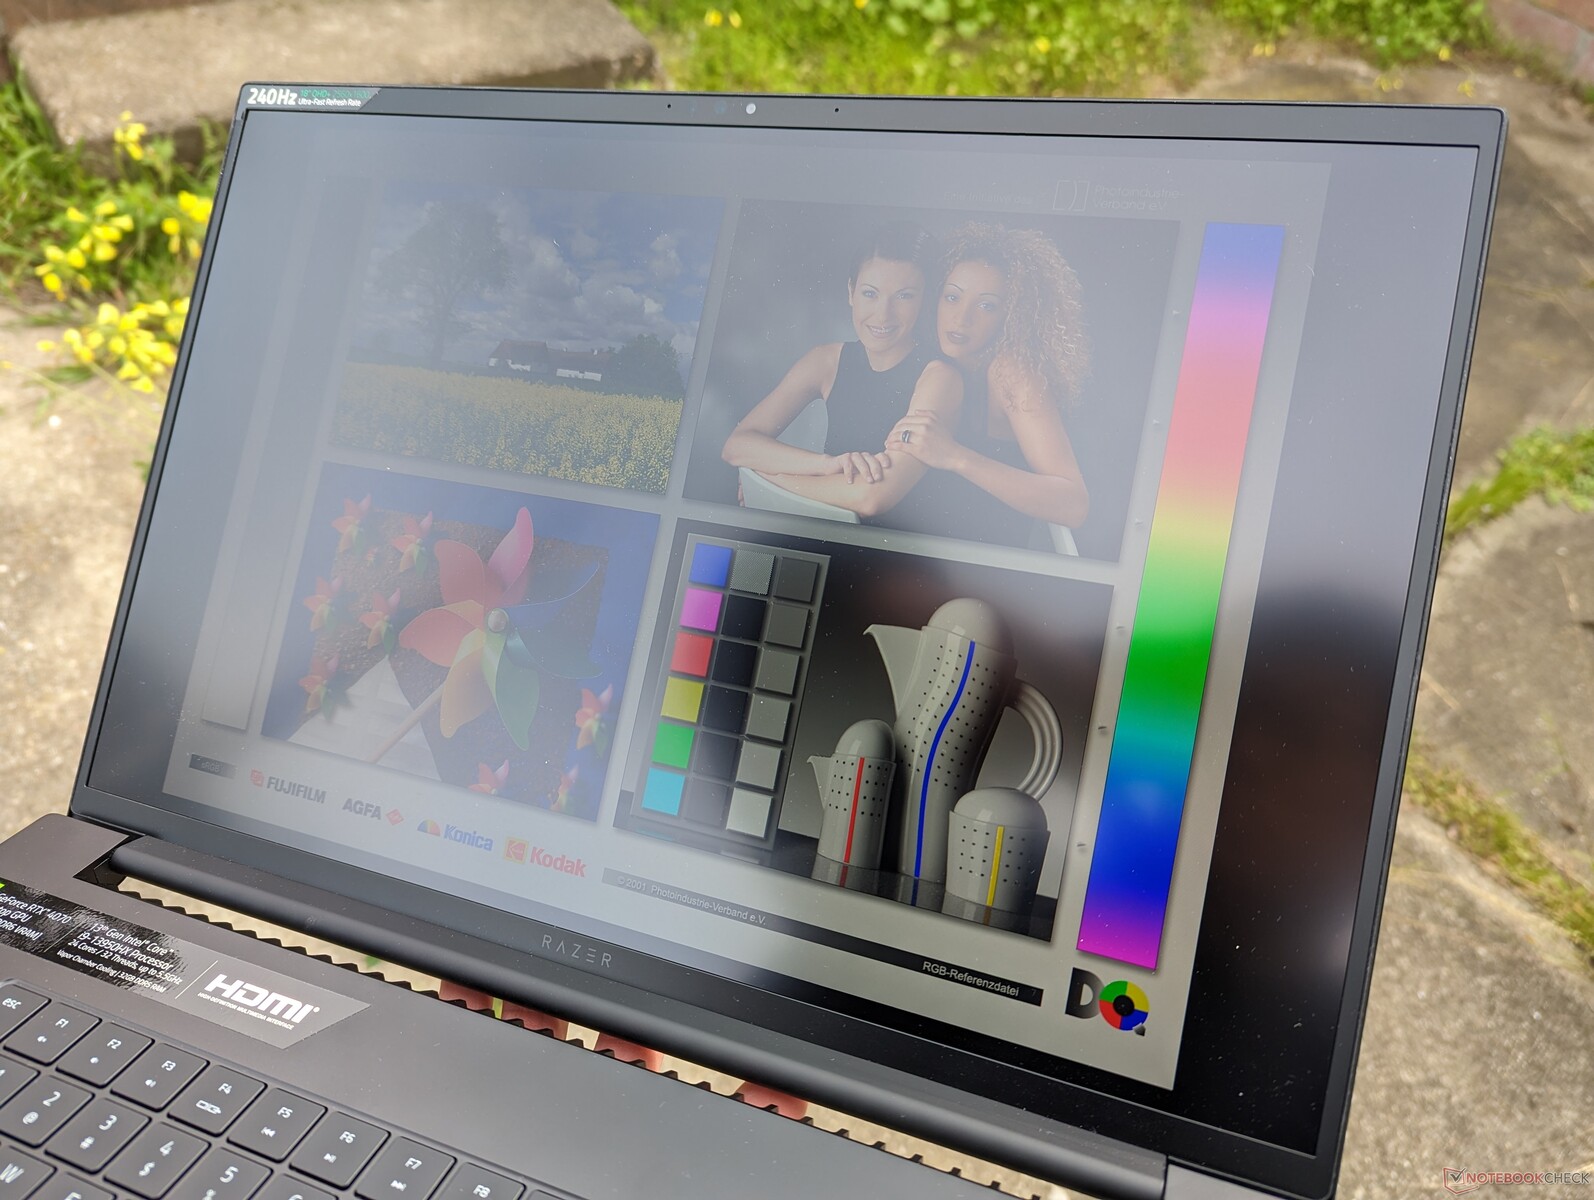
Gli angoli di visualizzazione sono ampi, come ci si aspetta da un pannello IPS. I colori e il contrasto si spostano solo se la visione avviene da angolazioni estreme.
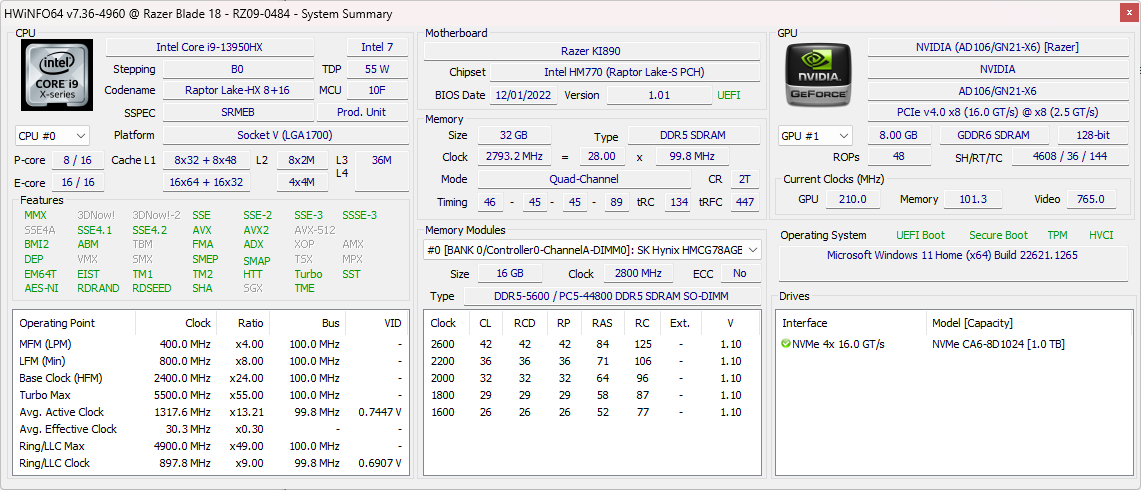
Prestazioni - Intel Raptor Lake + Nvidia Ada Lovelace
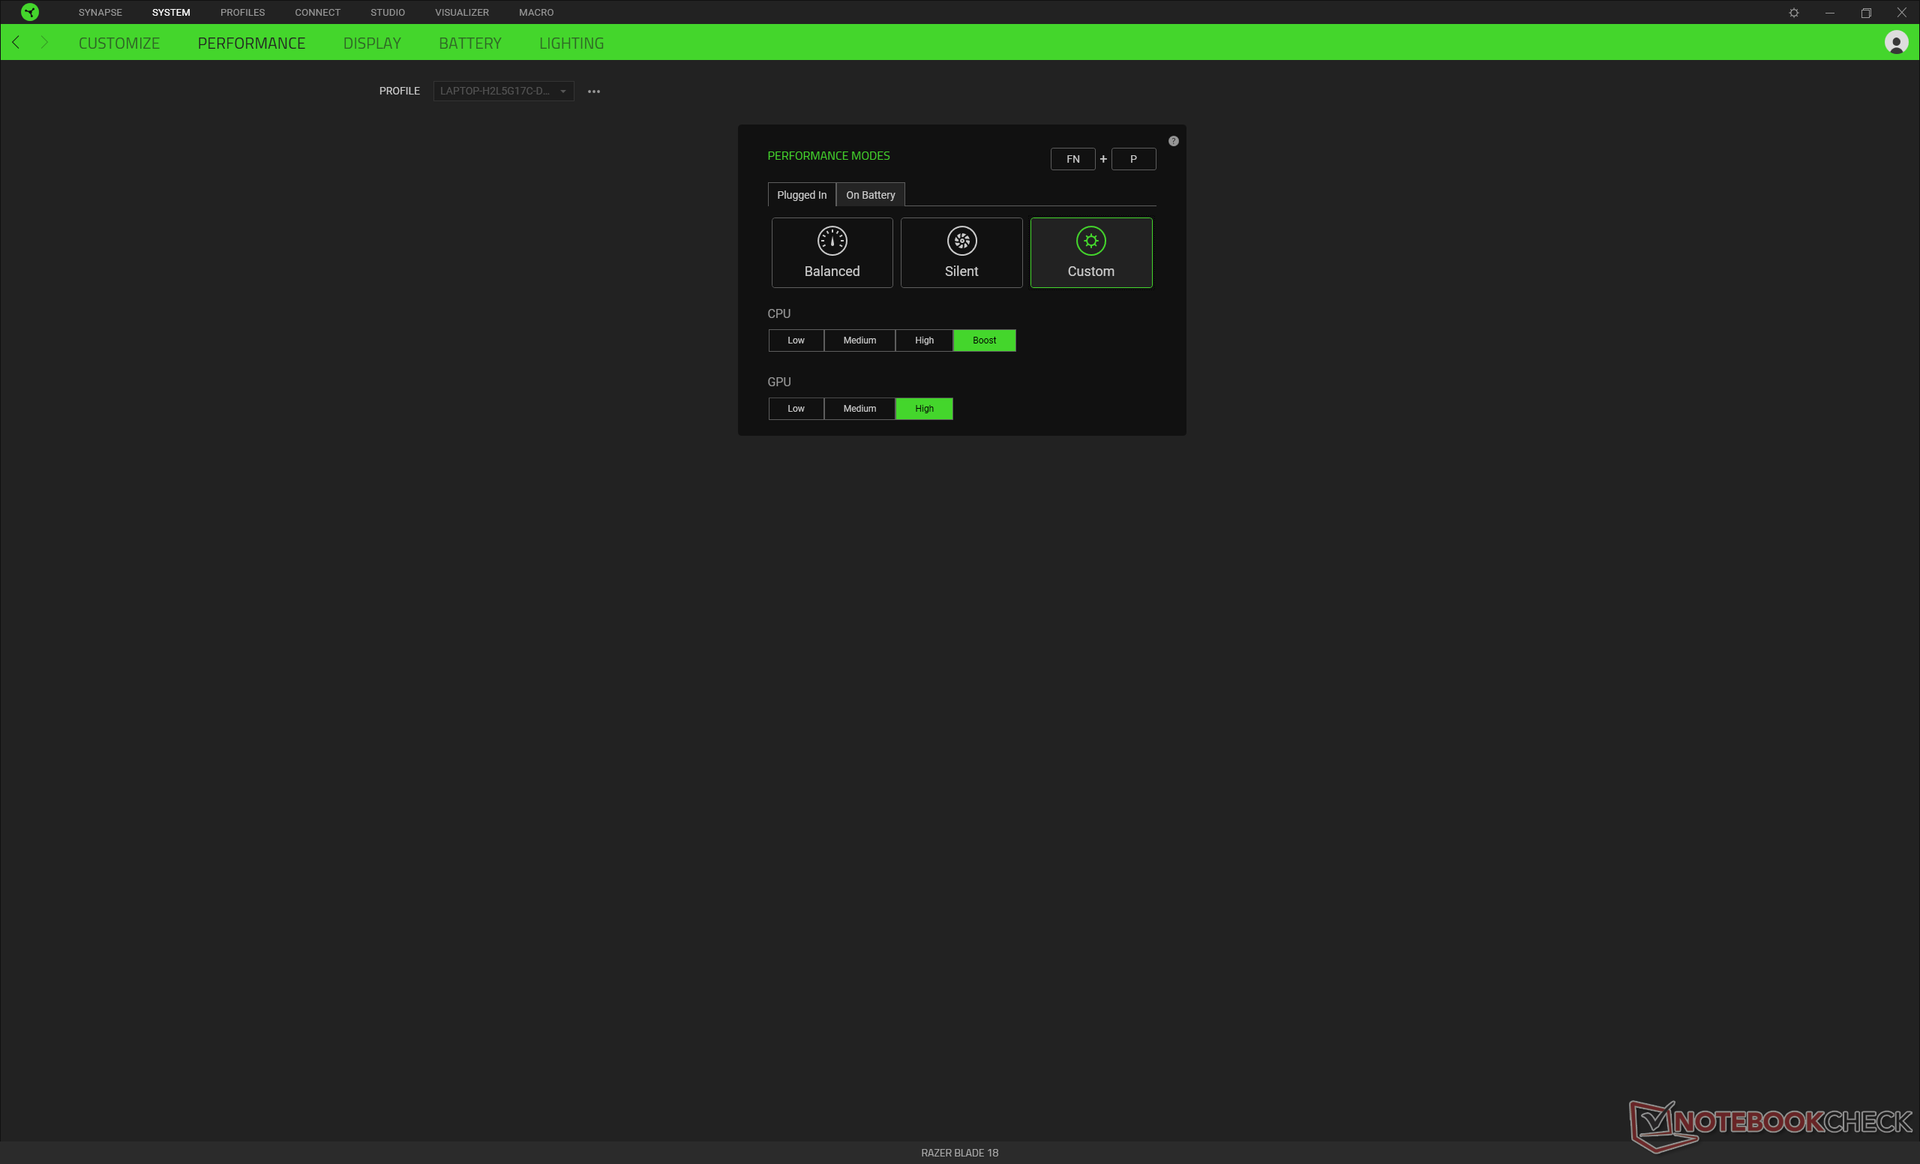
Condizioni di test
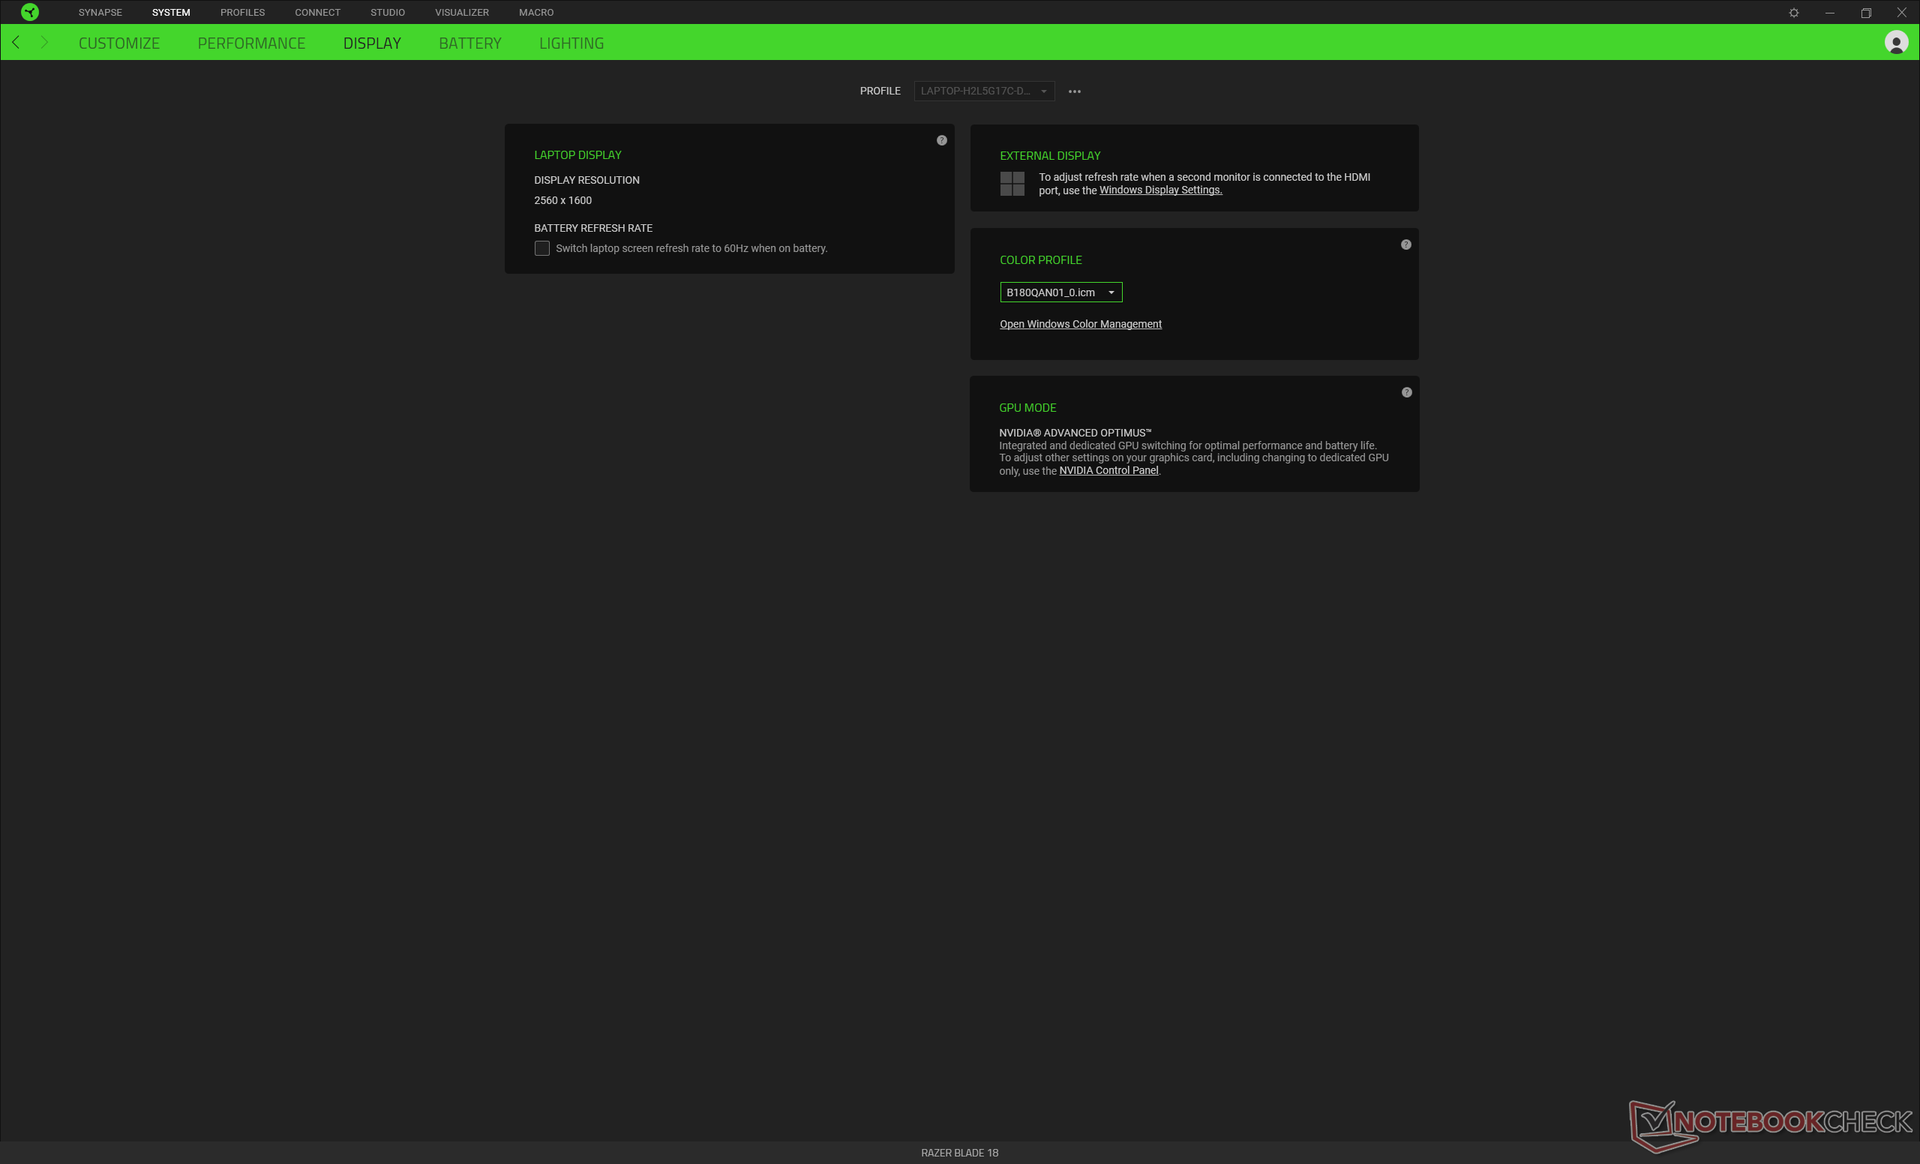
Abbiamo impostato la nostra unità in modalità Performance tramite Windows e la CPU e la GPU rispettivamente su Boost e High tramite il software Razer Synapse, come mostrato di seguito. Si raccomanda agli utenti di familiarizzare con Synapse, in quanto è l'hub per la regolazione degli effetti di illuminazione RGB, dei profili di prestazioni, delle macro e di altre funzioni ausiliarie. Purtroppo il software non è sempre affidabile, in quanto a volte non risponde o non si avvia affatto in assenza di connettività a Internet.
Il Blade 18 non supporta il MUX o l'Advanced Optimus, come invece il Blade 16. La nostra unità non supporta nemmeno il G-Sync, nonostante quanto pubblicizzato da Razer. Abbiamo contattato Razer in merito alla mancanza di G-Sync e aggiorneremo questa sezione quando sarà il caso.
Processore
Le prestazioni della CPU sono di pochi punti percentuali rispetto a quelle del Blade 16 o del GT77, dotati dello stesso processore Core i93950HX Core i9-13950HX core i9-13950HX. Pertanto, la CPU non sembra soffrire di alcun problema di throttling. Le prestazioni multi-thread sono più veloci di circa il 45% rispetto alla generazione precedente.Core i9-12950HX e sono pari a quelle di un processore desktop Core i9-12900K. Il salto di prestazioni da una generazione all'altra è significativo a questo proposito.
I risultati del nostro consueto test CineBench R15 xT non sono inclusi di seguito, poiché i punteggi sono insolitamente bassi e non rappresentativi delle prestazioni del processore. L'esecuzione di CineBench R15 attiva sia la CPU che la dGPU e quindi le prestazioni della CPU possono talvolta essere limitate dalla dGPU. Questo problema può essere osservato anche su alcuni altri portatili. CineBench R23 è un benchmark per la CPU pura che non attiva la dGPU e quindi i risultati sono riportati di seguito.
Cinebench R23 Multi Loop
Cinebench R23: Multi Core | Single Core
Cinebench R20: CPU (Multi Core) | CPU (Single Core)
Cinebench R15: CPU Multi 64Bit | CPU Single 64Bit
Blender: v2.79 BMW27 CPU
7-Zip 18.03: 7z b 4 | 7z b 4 -mmt1
Geekbench 5.5: Multi-Core | Single-Core
HWBOT x265 Benchmark v2.2: 4k Preset
LibreOffice : 20 Documents To PDF
R Benchmark 2.5: Overall mean
* ... Meglio usare valori piccoli
AIDA64: FP32 Ray-Trace | FPU Julia | CPU SHA3 | CPU Queen | FPU SinJulia | FPU Mandel | CPU AES | CPU ZLib | FP64 Ray-Trace | CPU PhotoWorxx
| Performance rating | |
| MSI Titan GT77 HX 13VI | |
| Razer Blade 18 RTX 4070 | |
| Media Intel Core i9-13950HX | |
| Asus ROG Strix Scar 17 SE G733CX-LL014W | |
| Alienware m17 R5 (R9 6900HX, RX 6850M XT) | |
| Gigabyte G7 KE | |
| Razer Blade 17 Early 2022 | |
| AIDA64 / FP32 Ray-Trace | |
| MSI Titan GT77 HX 13VI | |
| Razer Blade 18 RTX 4070 | |
| Media Intel Core i9-13950HX (17993 - 28957, n=9) | |
| Asus ROG Strix Scar 17 SE G733CX-LL014W | |
| Alienware m17 R5 (R9 6900HX, RX 6850M XT) | |
| Gigabyte G7 KE | |
| Razer Blade 17 Early 2022 | |
| AIDA64 / FPU Julia | |
| MSI Titan GT77 HX 13VI | |
| Razer Blade 18 RTX 4070 | |
| Media Intel Core i9-13950HX (89362 - 144303, n=9) | |
| Alienware m17 R5 (R9 6900HX, RX 6850M XT) | |
| Asus ROG Strix Scar 17 SE G733CX-LL014W | |
| Gigabyte G7 KE | |
| Razer Blade 17 Early 2022 | |
| AIDA64 / CPU SHA3 | |
| MSI Titan GT77 HX 13VI | |
| Razer Blade 18 RTX 4070 | |
| Media Intel Core i9-13950HX (4518 - 7093, n=9) | |
| Asus ROG Strix Scar 17 SE G733CX-LL014W | |
| Alienware m17 R5 (R9 6900HX, RX 6850M XT) | |
| Gigabyte G7 KE | |
| Razer Blade 17 Early 2022 | |
| AIDA64 / CPU Queen | |
| MSI Titan GT77 HX 13VI | |
| Razer Blade 18 RTX 4070 | |
| Media Intel Core i9-13950HX (131931 - 140103, n=8) | |
| Alienware m17 R5 (R9 6900HX, RX 6850M XT) | |
| Asus ROG Strix Scar 17 SE G733CX-LL014W | |
| Razer Blade 17 Early 2022 | |
| Gigabyte G7 KE | |
| AIDA64 / FPU SinJulia | |
| MSI Titan GT77 HX 13VI | |
| Razer Blade 18 RTX 4070 | |
| Media Intel Core i9-13950HX (12318 - 17057, n=9) | |
| Alienware m17 R5 (R9 6900HX, RX 6850M XT) | |
| Asus ROG Strix Scar 17 SE G733CX-LL014W | |
| Gigabyte G7 KE | |
| Razer Blade 17 Early 2022 | |
| AIDA64 / FPU Mandel | |
| MSI Titan GT77 HX 13VI | |
| Razer Blade 18 RTX 4070 | |
| Media Intel Core i9-13950HX (44372 - 71038, n=9) | |
| Alienware m17 R5 (R9 6900HX, RX 6850M XT) | |
| Asus ROG Strix Scar 17 SE G733CX-LL014W | |
| Gigabyte G7 KE | |
| Razer Blade 17 Early 2022 | |
| AIDA64 / CPU AES | |
| Asus ROG Strix Scar 17 SE G733CX-LL014W | |
| Media Intel Core i9-13950HX (99981 - 204491, n=9) | |
| MSI Titan GT77 HX 13VI | |
| Razer Blade 18 RTX 4070 | |
| Gigabyte G7 KE | |
| Alienware m17 R5 (R9 6900HX, RX 6850M XT) | |
| Razer Blade 17 Early 2022 | |
| AIDA64 / CPU ZLib | |
| MSI Titan GT77 HX 13VI | |
| Razer Blade 18 RTX 4070 | |
| Media Intel Core i9-13950HX (1263 - 2069, n=9) | |
| Asus ROG Strix Scar 17 SE G733CX-LL014W | |
| Gigabyte G7 KE | |
| Alienware m17 R5 (R9 6900HX, RX 6850M XT) | |
| Razer Blade 17 Early 2022 | |
| AIDA64 / FP64 Ray-Trace | |
| MSI Titan GT77 HX 13VI | |
| Razer Blade 18 RTX 4070 | |
| Media Intel Core i9-13950HX (9649 - 15573, n=9) | |
| Asus ROG Strix Scar 17 SE G733CX-LL014W | |
| Alienware m17 R5 (R9 6900HX, RX 6850M XT) | |
| Gigabyte G7 KE | |
| Razer Blade 17 Early 2022 | |
| AIDA64 / CPU PhotoWorxx | |
| Razer Blade 18 RTX 4070 | |
| Media Intel Core i9-13950HX (40233 - 50864, n=9) | |
| Asus ROG Strix Scar 17 SE G733CX-LL014W | |
| MSI Titan GT77 HX 13VI | |
| Razer Blade 17 Early 2022 | |
| Alienware m17 R5 (R9 6900HX, RX 6850M XT) | |
| Gigabyte G7 KE | |
Prestazioni del sistema
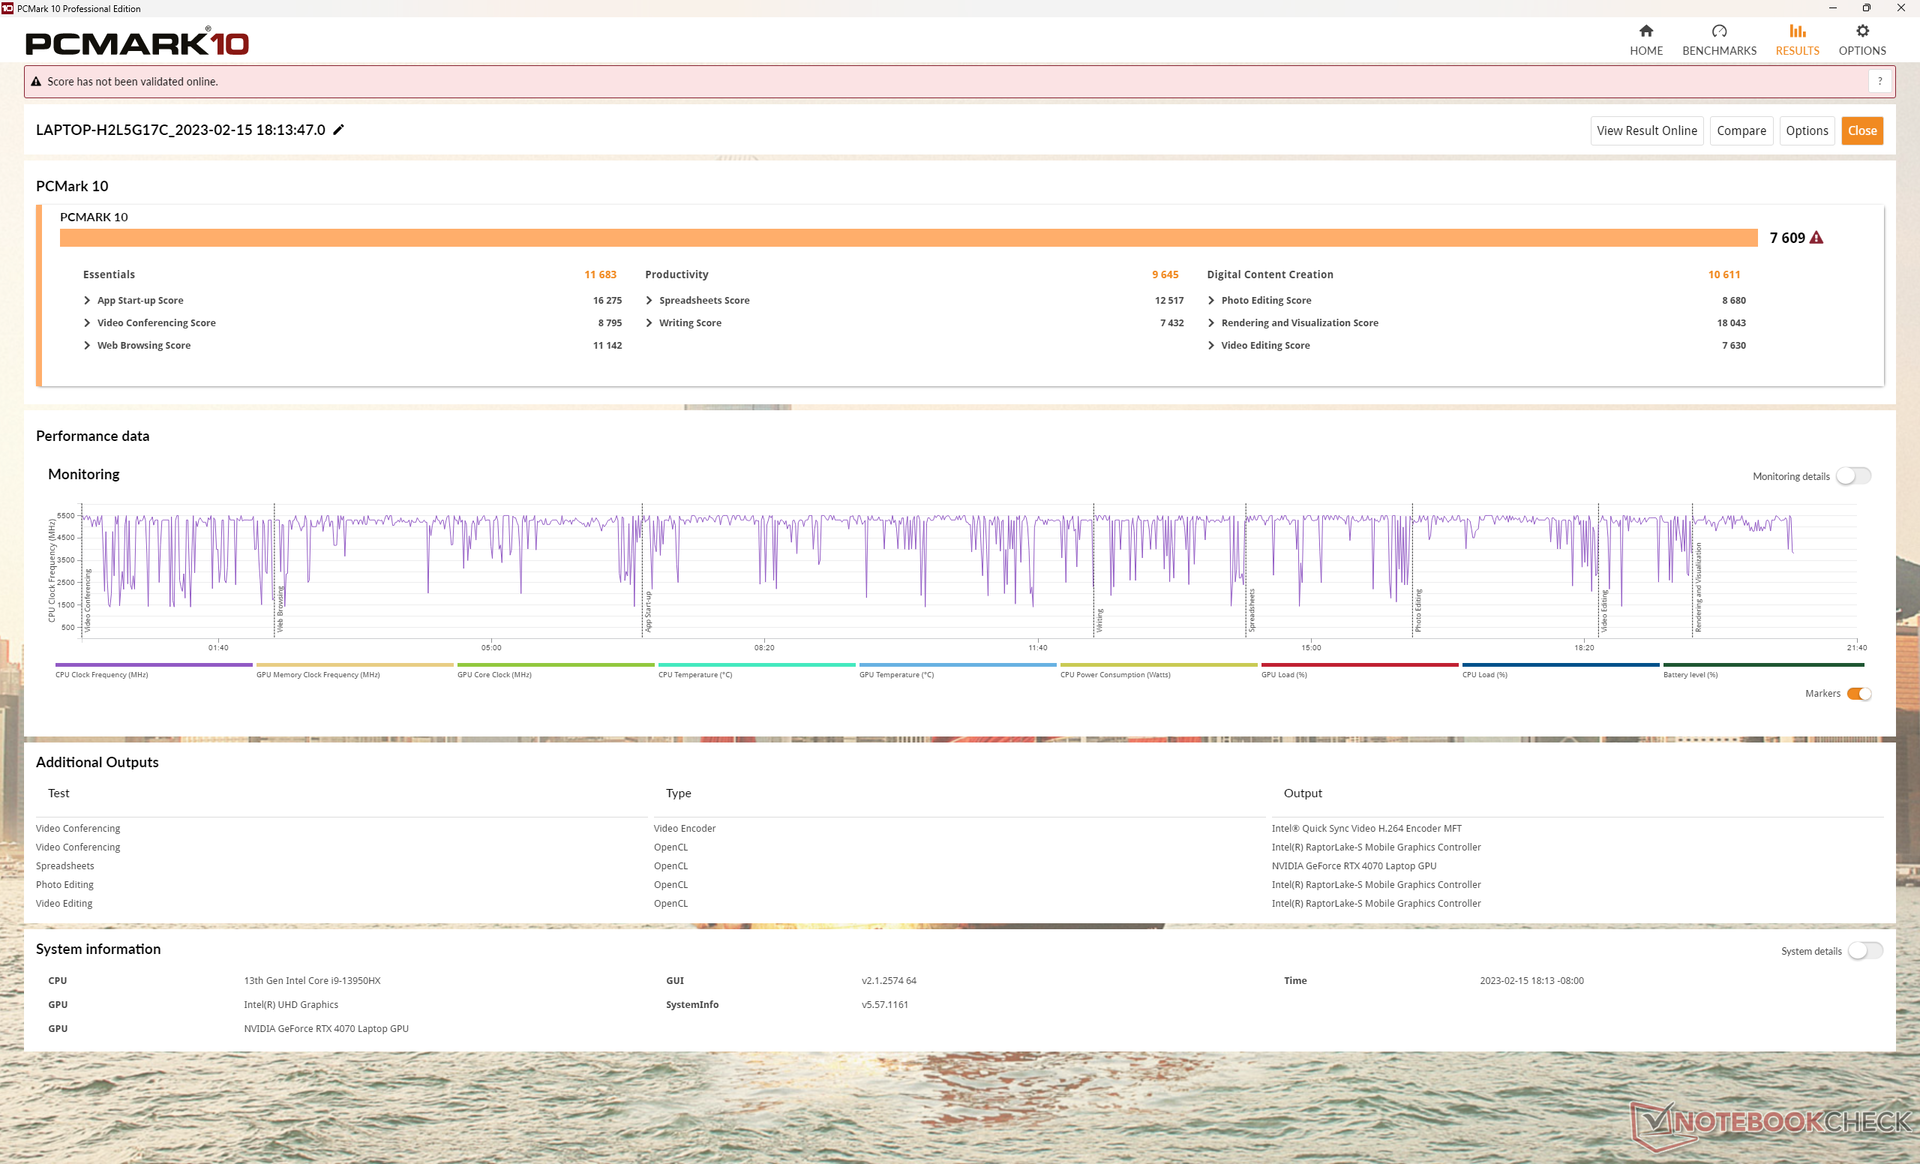
I punteggi di PCMark 10 sono costantemente superiori a quelli del 2022 Blade 17 anche se i margini sono minori. Il Blade 16 e MSI GT77 ottengono punteggi migliori, in quanto dispongono rispettivamente di GPU RTX 4080 e 4090 più veloci.
CrossMark: Overall | Productivity | Creativity | Responsiveness
| PCMark 10 / Score | |
| MSI Titan GT77 HX 13VI | |
| Razer Blade 18 RTX 4070 | |
| Media Intel Core i9-13950HX, NVIDIA GeForce RTX 4070 Laptop GPU (n=1) | |
| Alienware m17 R5 (R9 6900HX, RX 6850M XT) | |
| Asus ROG Strix Scar 17 SE G733CX-LL014W | |
| Razer Blade 17 Early 2022 | |
| Gigabyte G7 KE | |
| PCMark 10 / Essentials | |
| MSI Titan GT77 HX 13VI | |
| Razer Blade 18 RTX 4070 | |
| Media Intel Core i9-13950HX, NVIDIA GeForce RTX 4070 Laptop GPU (n=1) | |
| Asus ROG Strix Scar 17 SE G733CX-LL014W | |
| Gigabyte G7 KE | |
| Razer Blade 17 Early 2022 | |
| Alienware m17 R5 (R9 6900HX, RX 6850M XT) | |
| PCMark 10 / Productivity | |
| Asus ROG Strix Scar 17 SE G733CX-LL014W | |
| MSI Titan GT77 HX 13VI | |
| Razer Blade 18 RTX 4070 | |
| Media Intel Core i9-13950HX, NVIDIA GeForce RTX 4070 Laptop GPU (n=1) | |
| Razer Blade 17 Early 2022 | |
| Alienware m17 R5 (R9 6900HX, RX 6850M XT) | |
| Gigabyte G7 KE | |
| PCMark 10 / Digital Content Creation | |
| MSI Titan GT77 HX 13VI | |
| Alienware m17 R5 (R9 6900HX, RX 6850M XT) | |
| Razer Blade 18 RTX 4070 | |
| Media Intel Core i9-13950HX, NVIDIA GeForce RTX 4070 Laptop GPU (n=1) | |
| Razer Blade 17 Early 2022 | |
| Asus ROG Strix Scar 17 SE G733CX-LL014W | |
| Gigabyte G7 KE | |
| CrossMark / Overall | |
| MSI Titan GT77 HX 13VI | |
| Razer Blade 18 RTX 4070 | |
| Media Intel Core i9-13950HX, NVIDIA GeForce RTX 4070 Laptop GPU (n=1) | |
| Asus ROG Strix Scar 17 SE G733CX-LL014W | |
| Gigabyte G7 KE | |
| Razer Blade 17 Early 2022 | |
| Alienware m17 R5 (R9 6900HX, RX 6850M XT) | |
| CrossMark / Productivity | |
| MSI Titan GT77 HX 13VI | |
| Razer Blade 18 RTX 4070 | |
| Media Intel Core i9-13950HX, NVIDIA GeForce RTX 4070 Laptop GPU (n=1) | |
| Asus ROG Strix Scar 17 SE G733CX-LL014W | |
| Gigabyte G7 KE | |
| Razer Blade 17 Early 2022 | |
| Alienware m17 R5 (R9 6900HX, RX 6850M XT) | |
| CrossMark / Creativity | |
| MSI Titan GT77 HX 13VI | |
| Razer Blade 18 RTX 4070 | |
| Media Intel Core i9-13950HX, NVIDIA GeForce RTX 4070 Laptop GPU (n=1) | |
| Asus ROG Strix Scar 17 SE G733CX-LL014W | |
| Razer Blade 17 Early 2022 | |
| Gigabyte G7 KE | |
| Alienware m17 R5 (R9 6900HX, RX 6850M XT) | |
| CrossMark / Responsiveness | |
| Gigabyte G7 KE | |
| Asus ROG Strix Scar 17 SE G733CX-LL014W | |
| Razer Blade 18 RTX 4070 | |
| Media Intel Core i9-13950HX, NVIDIA GeForce RTX 4070 Laptop GPU (n=1) | |
| MSI Titan GT77 HX 13VI | |
| Razer Blade 17 Early 2022 | |
| Alienware m17 R5 (R9 6900HX, RX 6850M XT) | |
| PCMark 10 Score | 7609 punti | |
Aiuto | ||
| AIDA64 / Memory Copy | |
| Razer Blade 18 RTX 4070 | |
| Media Intel Core i9-13950HX (61938 - 78813, n=9) | |
| MSI Titan GT77 HX 13VI | |
| Asus ROG Strix Scar 17 SE G733CX-LL014W | |
| Razer Blade 17 Early 2022 | |
| Alienware m17 R5 (R9 6900HX, RX 6850M XT) | |
| Gigabyte G7 KE | |
| AIDA64 / Memory Read | |
| Razer Blade 18 RTX 4070 | |
| Media Intel Core i9-13950HX (62368 - 86831, n=9) | |
| Asus ROG Strix Scar 17 SE G733CX-LL014W | |
| MSI Titan GT77 HX 13VI | |
| Razer Blade 17 Early 2022 | |
| Alienware m17 R5 (R9 6900HX, RX 6850M XT) | |
| Gigabyte G7 KE | |
| AIDA64 / Memory Write | |
| Razer Blade 18 RTX 4070 | |
| Media Intel Core i9-13950HX (59501 - 80441, n=9) | |
| Asus ROG Strix Scar 17 SE G733CX-LL014W | |
| MSI Titan GT77 HX 13VI | |
| Razer Blade 17 Early 2022 | |
| Alienware m17 R5 (R9 6900HX, RX 6850M XT) | |
| Gigabyte G7 KE | |
| AIDA64 / Memory Latency | |
| Alienware m17 R5 (R9 6900HX, RX 6850M XT) | |
| MSI Titan GT77 HX 13VI | |
| Gigabyte G7 KE | |
| Media Intel Core i9-13950HX (84.4 - 99.5, n=9) | |
| Asus ROG Strix Scar 17 SE G733CX-LL014W | |
| Razer Blade 18 RTX 4070 | |
* ... Meglio usare valori piccoli
Latenza DPC
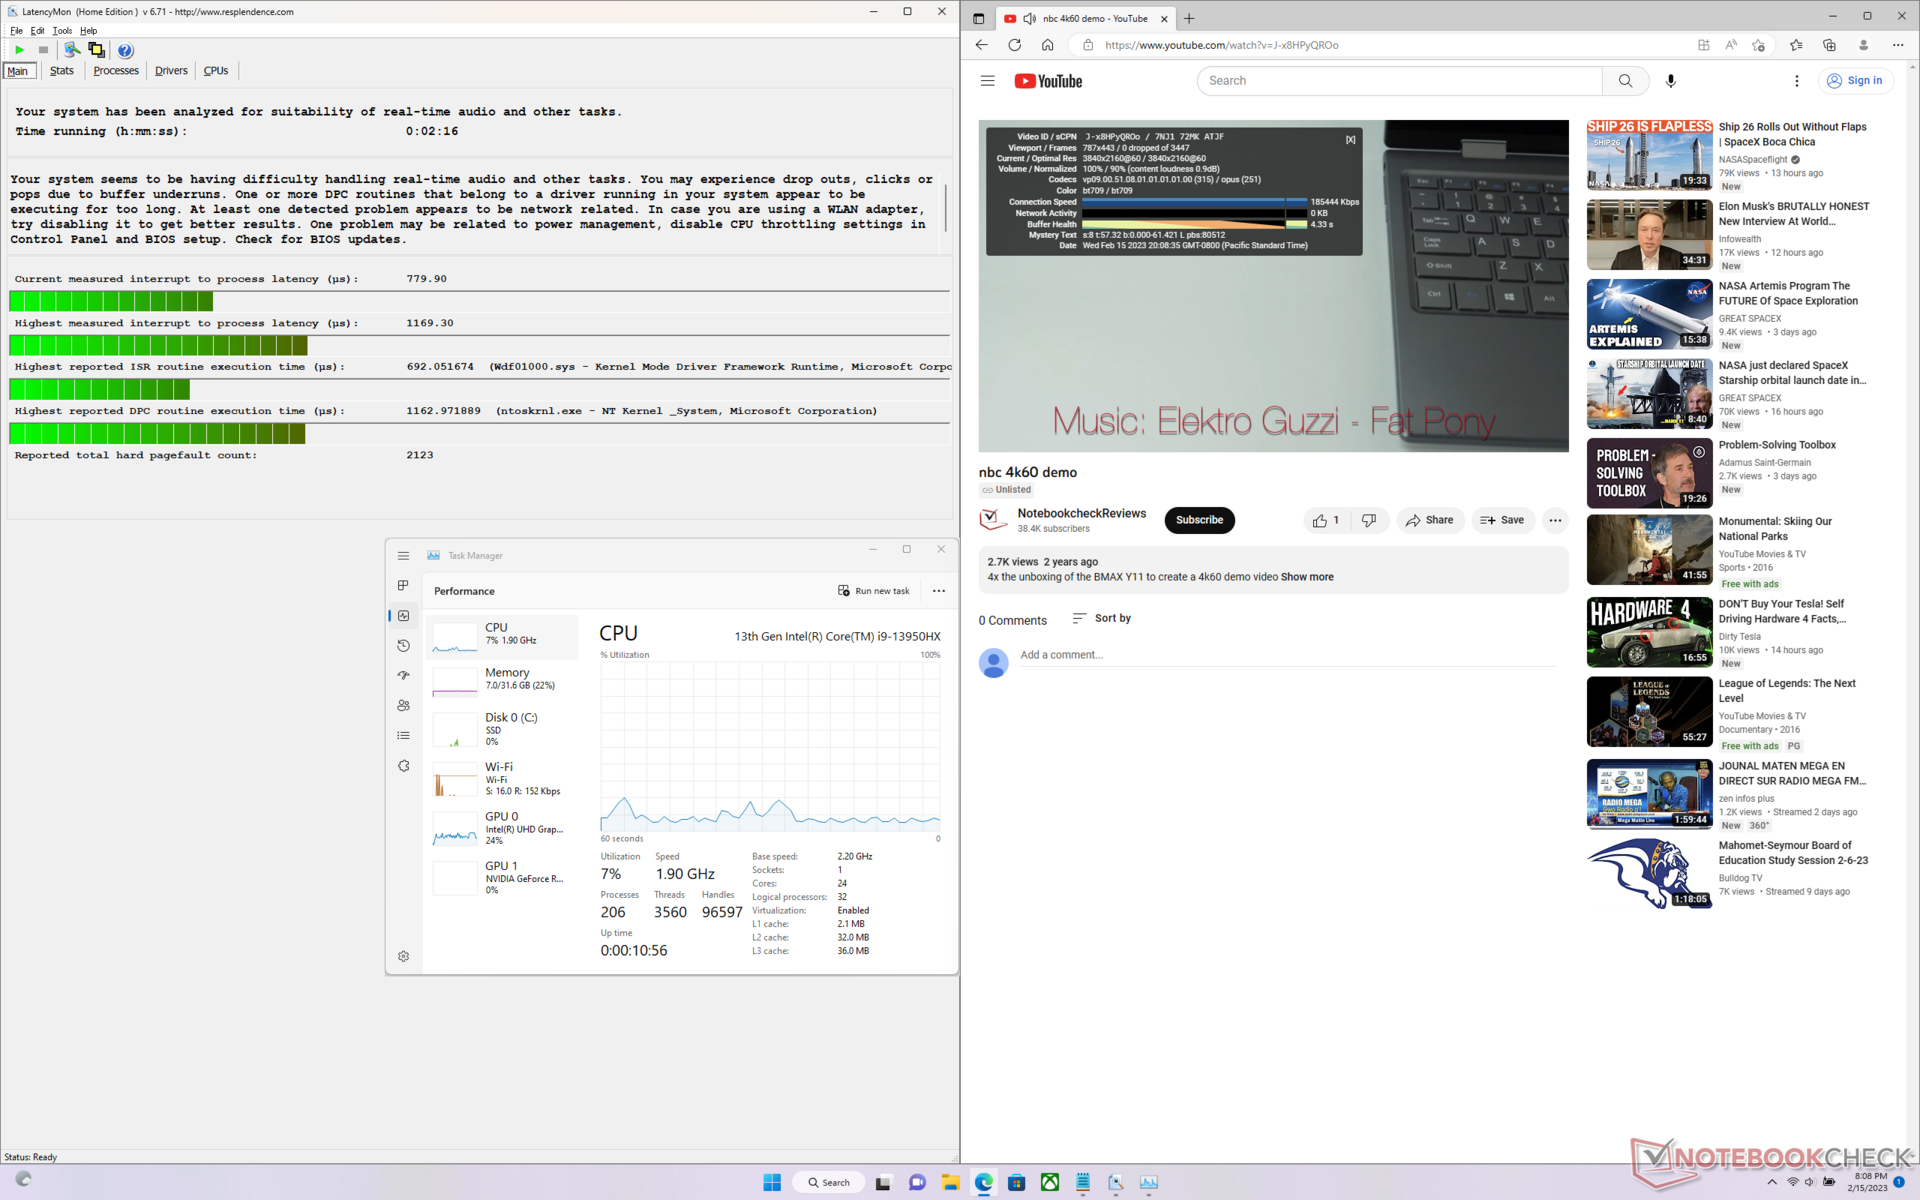
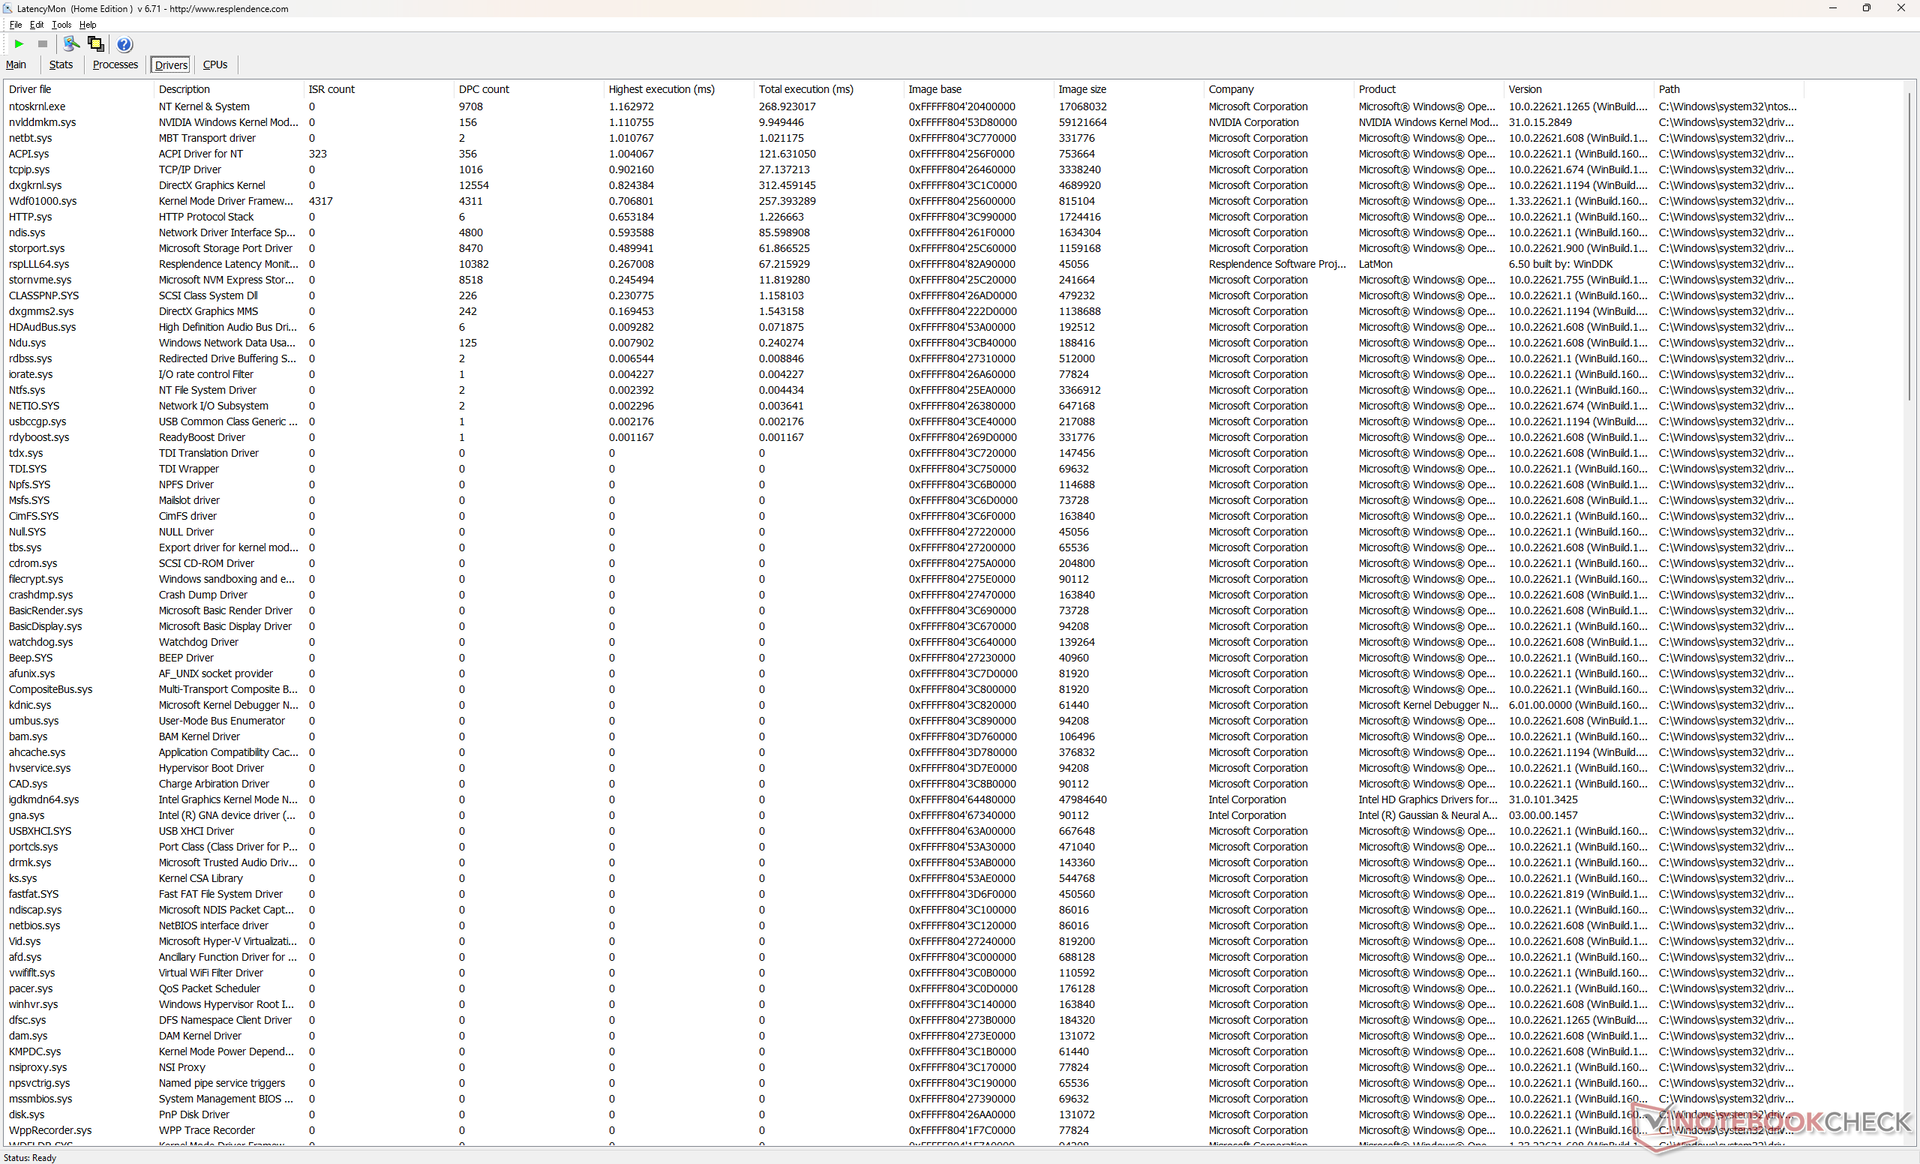
LatencyMon rivela lievi problemi di DPC quando si aprono più schede del browser della nostra homepage. la riproduzione di video 4K a 60 FPS è invece impeccabile, con un basso utilizzo della CPU e della GPU.
| DPC Latencies / LatencyMon - interrupt to process latency (max), Web, Youtube, Prime95 | |
| MSI Titan GT77 HX 13VI | |
| Asus ROG Strix Scar 17 SE G733CX-LL014W | |
| Gigabyte G7 KE | |
| Alienware m17 R5 (R9 6900HX, RX 6850M XT) | |
| Razer Blade 18 RTX 4070 | |
| Razer Blade 17 Early 2022 | |
* ... Meglio usare valori piccoli
Dispositivi di archiviazione - Fino a due unità SSD
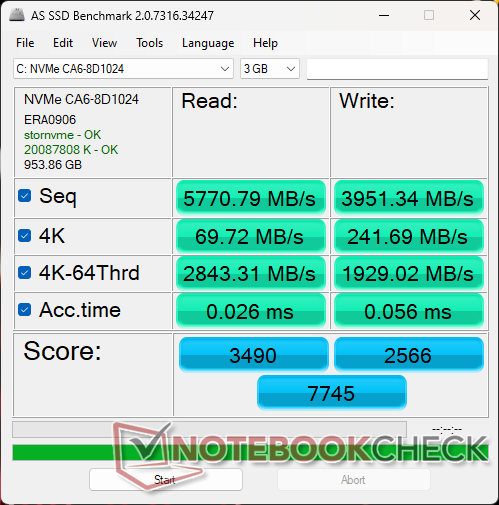
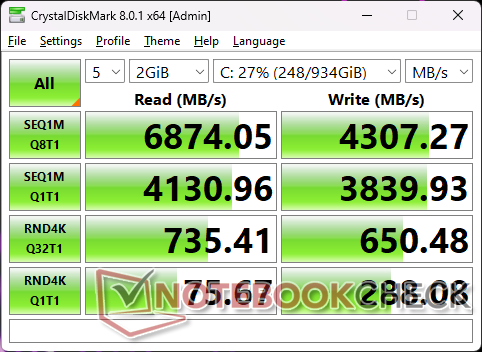
La nostra unità di prova viene fornita con lo stesso 1 TB SSSTC CA6-8D1024 PCIe4 x4 NVMe presente sul modello Alienware m17 R5. Le velocità di trasferimento sono paragonabili a quelle del popolare Samsung PM9A1, con velocità di lettura e scrittura sequenziali stabili che si avvicinano rispettivamente a 6900 MB/s e 4300 MB/s. Razer ha incluso un pad termico per ciascuno dei due slot SSD per dissipare il calore sul pannello inferiore in metallo.

| Drive Performance rating - Percent | |
| Asus ROG Strix Scar 17 SE G733CX-LL014W | |
| Gigabyte G7 KE | |
| Razer Blade 17 Early 2022 | |
| MSI Titan GT77 HX 13VI | |
| Razer Blade 18 RTX 4070 | |
| Alienware m17 R5 (R9 6900HX, RX 6850M XT) | |
* ... Meglio usare valori piccoli
Disk Throttling: DiskSpd Read Loop, Queue Depth 8
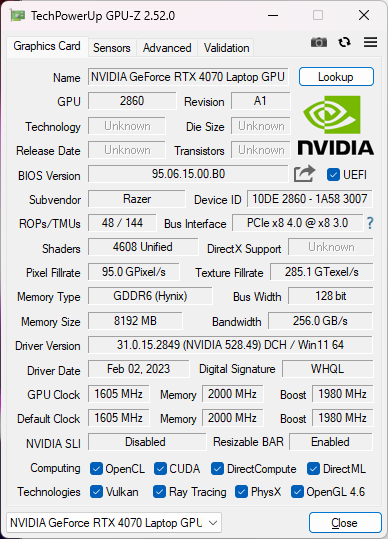
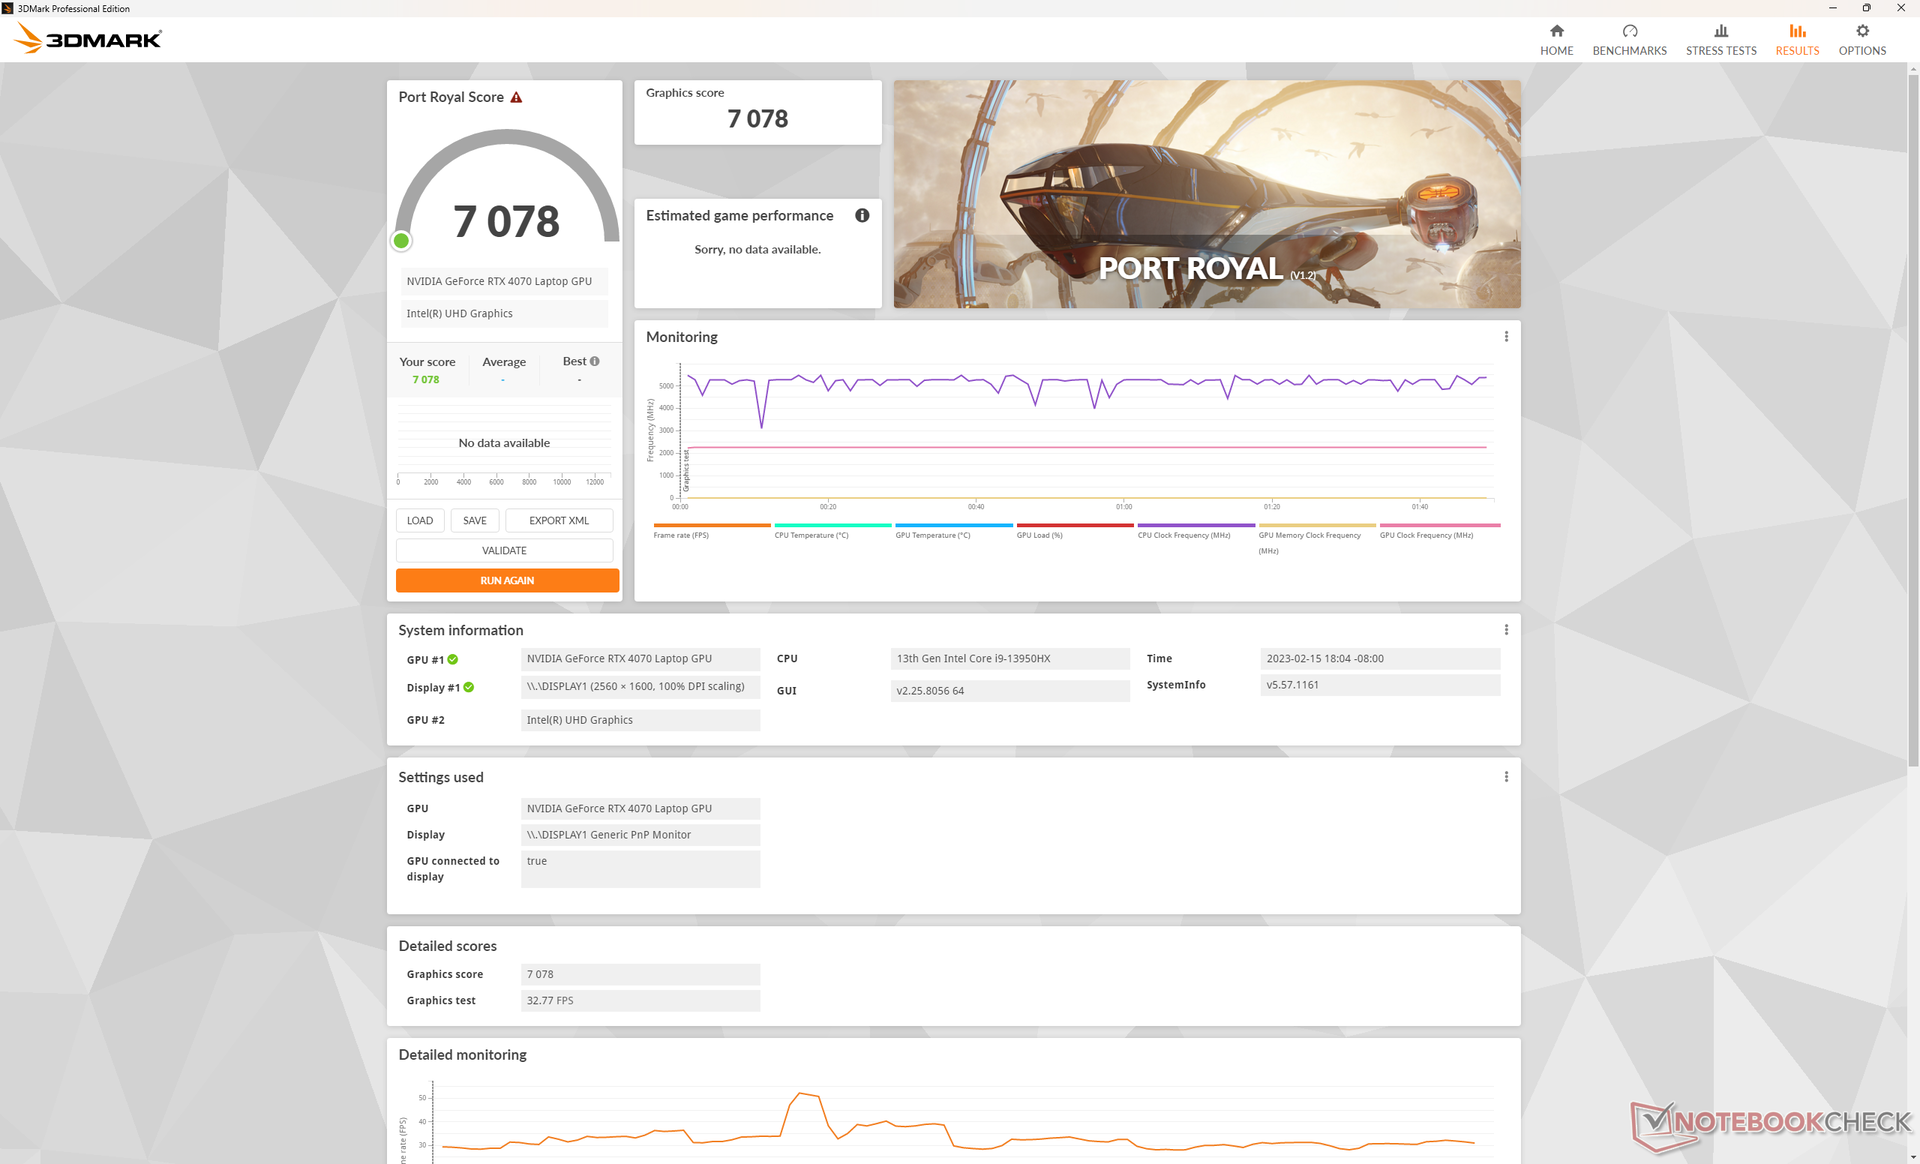
Prestazioni della GPU - Prestazioni simili a quelle di una RTX 3070 per desktop GeForce
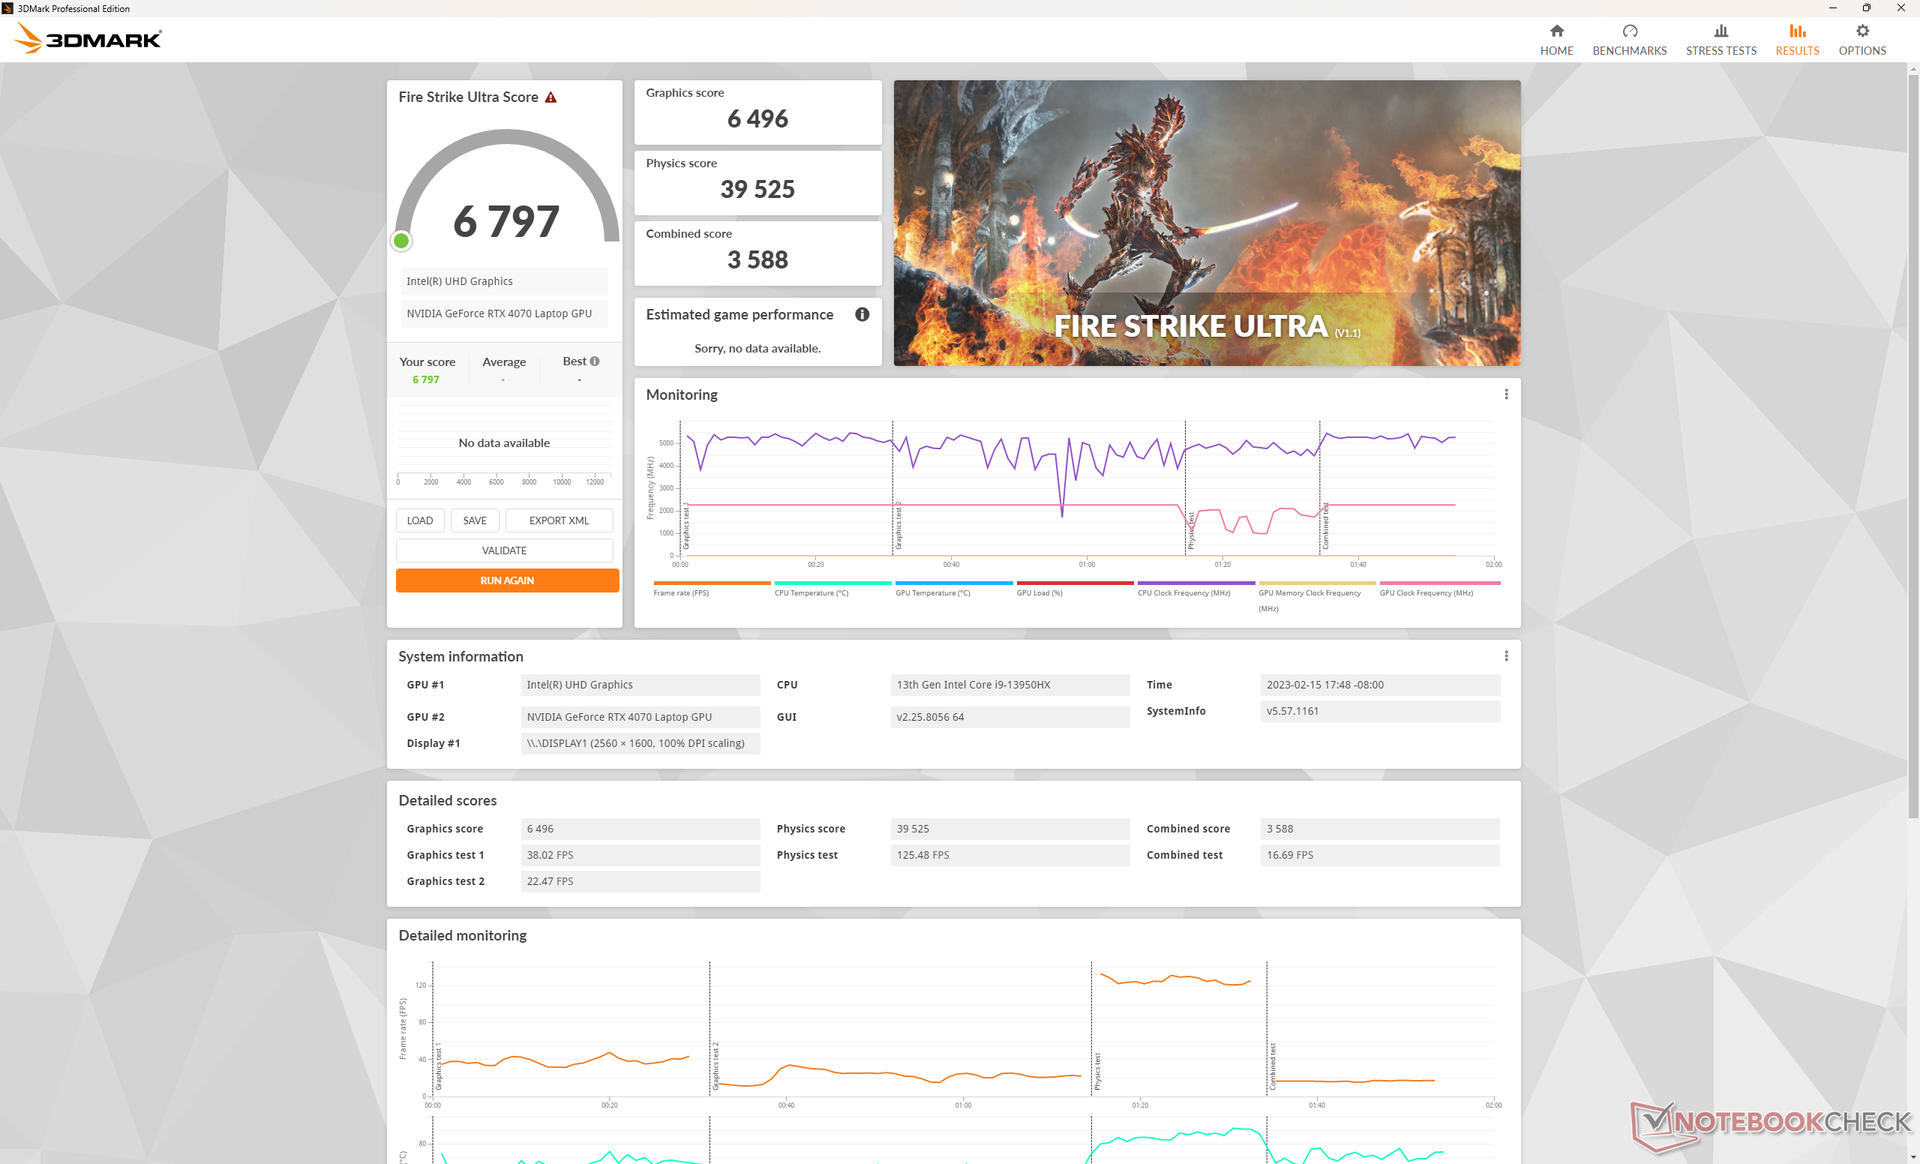
La RTX 4070 da 140 Wmobile GeForce RTX 4070 si colloca comodamente tra il modello rTX 3080 mobile erTX 3080 Ti mobile in termini di prestazioni grezze. È solo dal 10 al 20% più veloce della nuova rTX 3070 mobiletuttavia, il che è un po' deludente se si considera che la rTX 4080 mobile è più veloce del 40-50% rispetto alla rTX 3080 mobile. Ciò significa che il divario di prestazioni tra la RTX 4070 mobile e la RTX 4080 mobile è più significativo del 40-60%.
Rispetto alle GPU desktop, la RTX 4070 mobile è più lenta del 5-10% rispetto alla RTX 3070 desktop rTX 3070 per desktop lanciata tre anni fa.
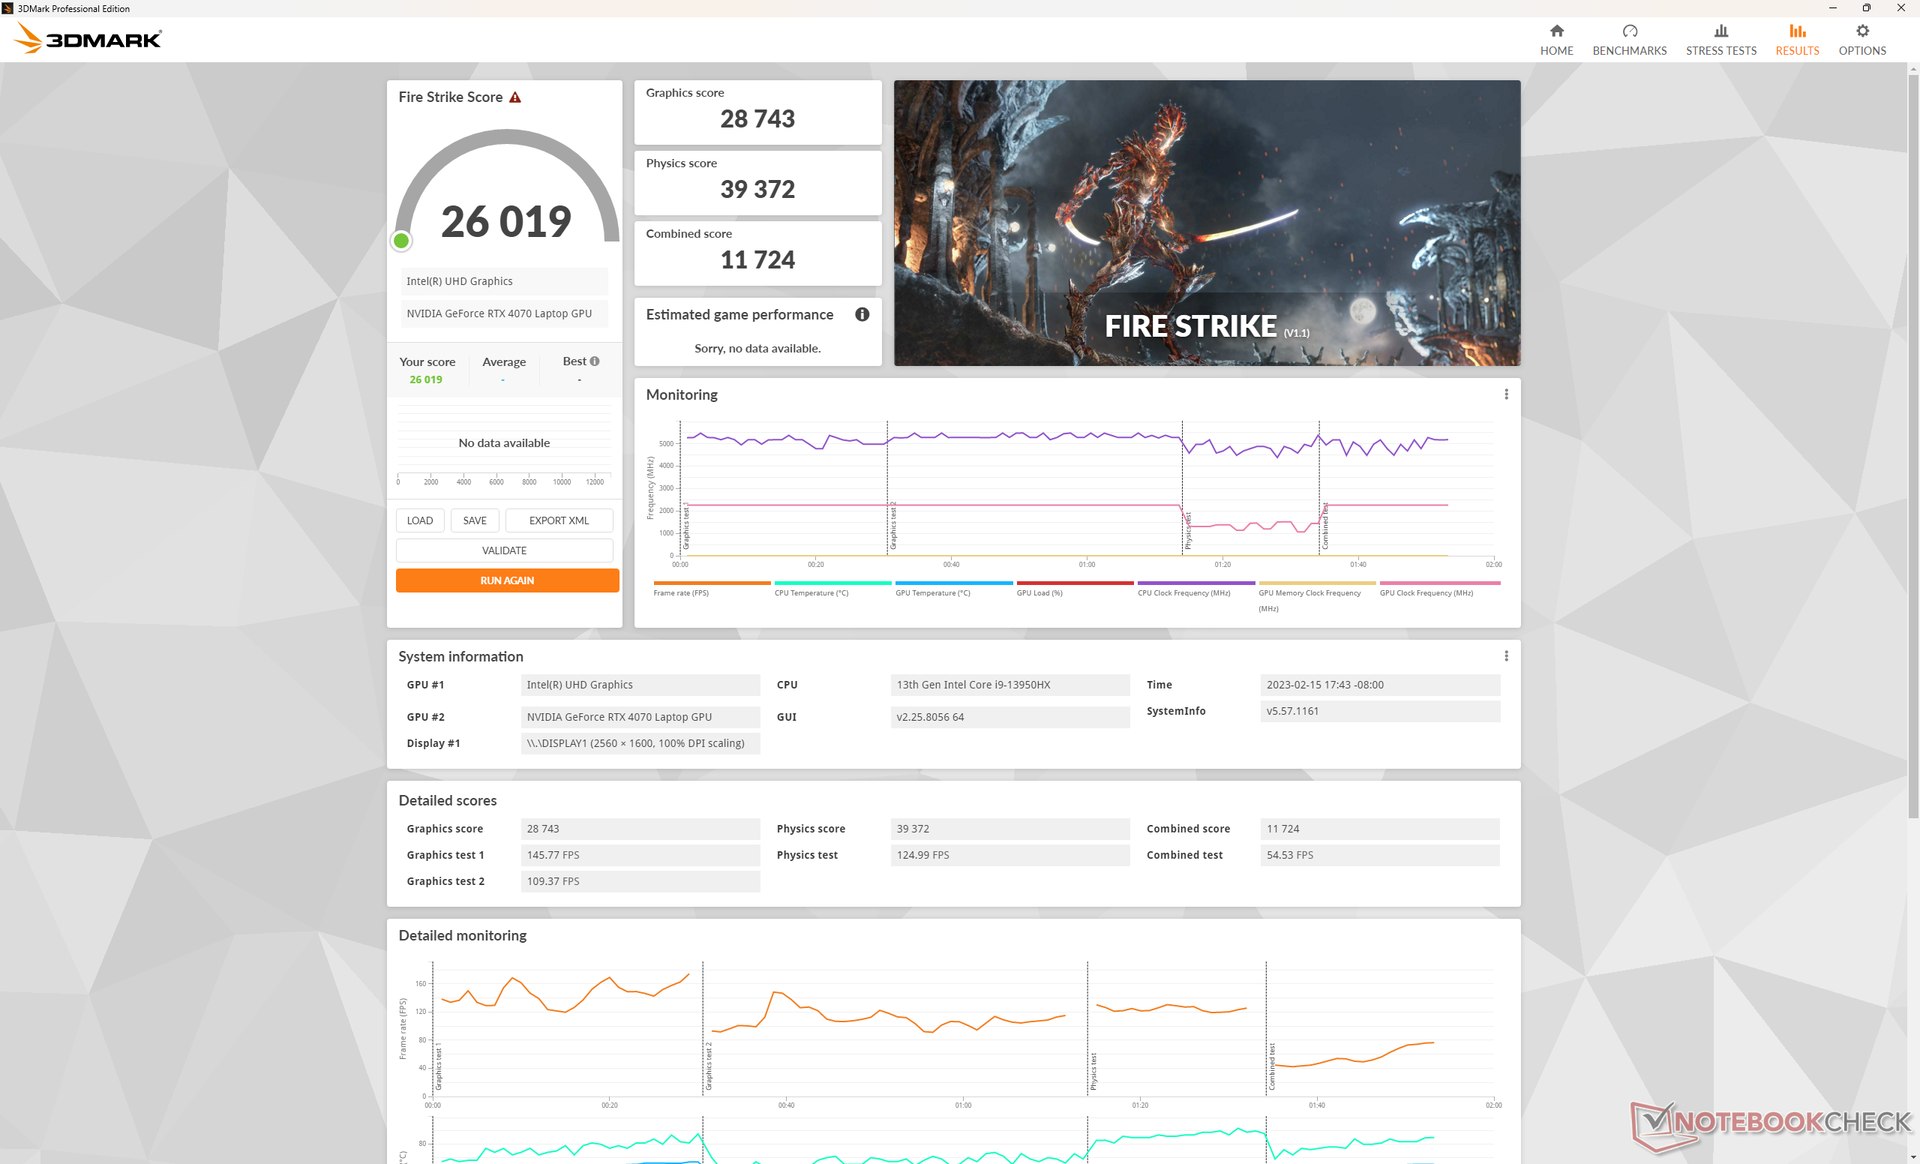
Un grande punto di forza delle GPU GeForce 40 è il supporto per la generazione di fotogrammi o DLSS 3. Sfortunatamente, la nostra unità di test Blade 18 RTX 4070 ha mostrato problemi durante l'esecuzione di giochi supportati con DLSS 3 abilitato su un monitor esterno HDMI o USB-C 4K. La frequenza dei fotogrammi scendeva a meno di 30 FPS su tutti i titoli testati, apparentemente senza motivo, mentre il Blade 16 RTX 4080 non presentava problemi di questo tipo. Stranamente, DLSS 3 è stato eseguito perfettamente sul display interno del Blade 18. Abbiamo contattato Razer per una potenziale soluzione e aggiorneremo questa sezione quando sarà il caso. Per il momento, tuttavia, è preferibile giocare sul display interno se DLSS 3 è abilitato.
Nei giorni a seguire verranno effettuati benchmark di altri giochi.
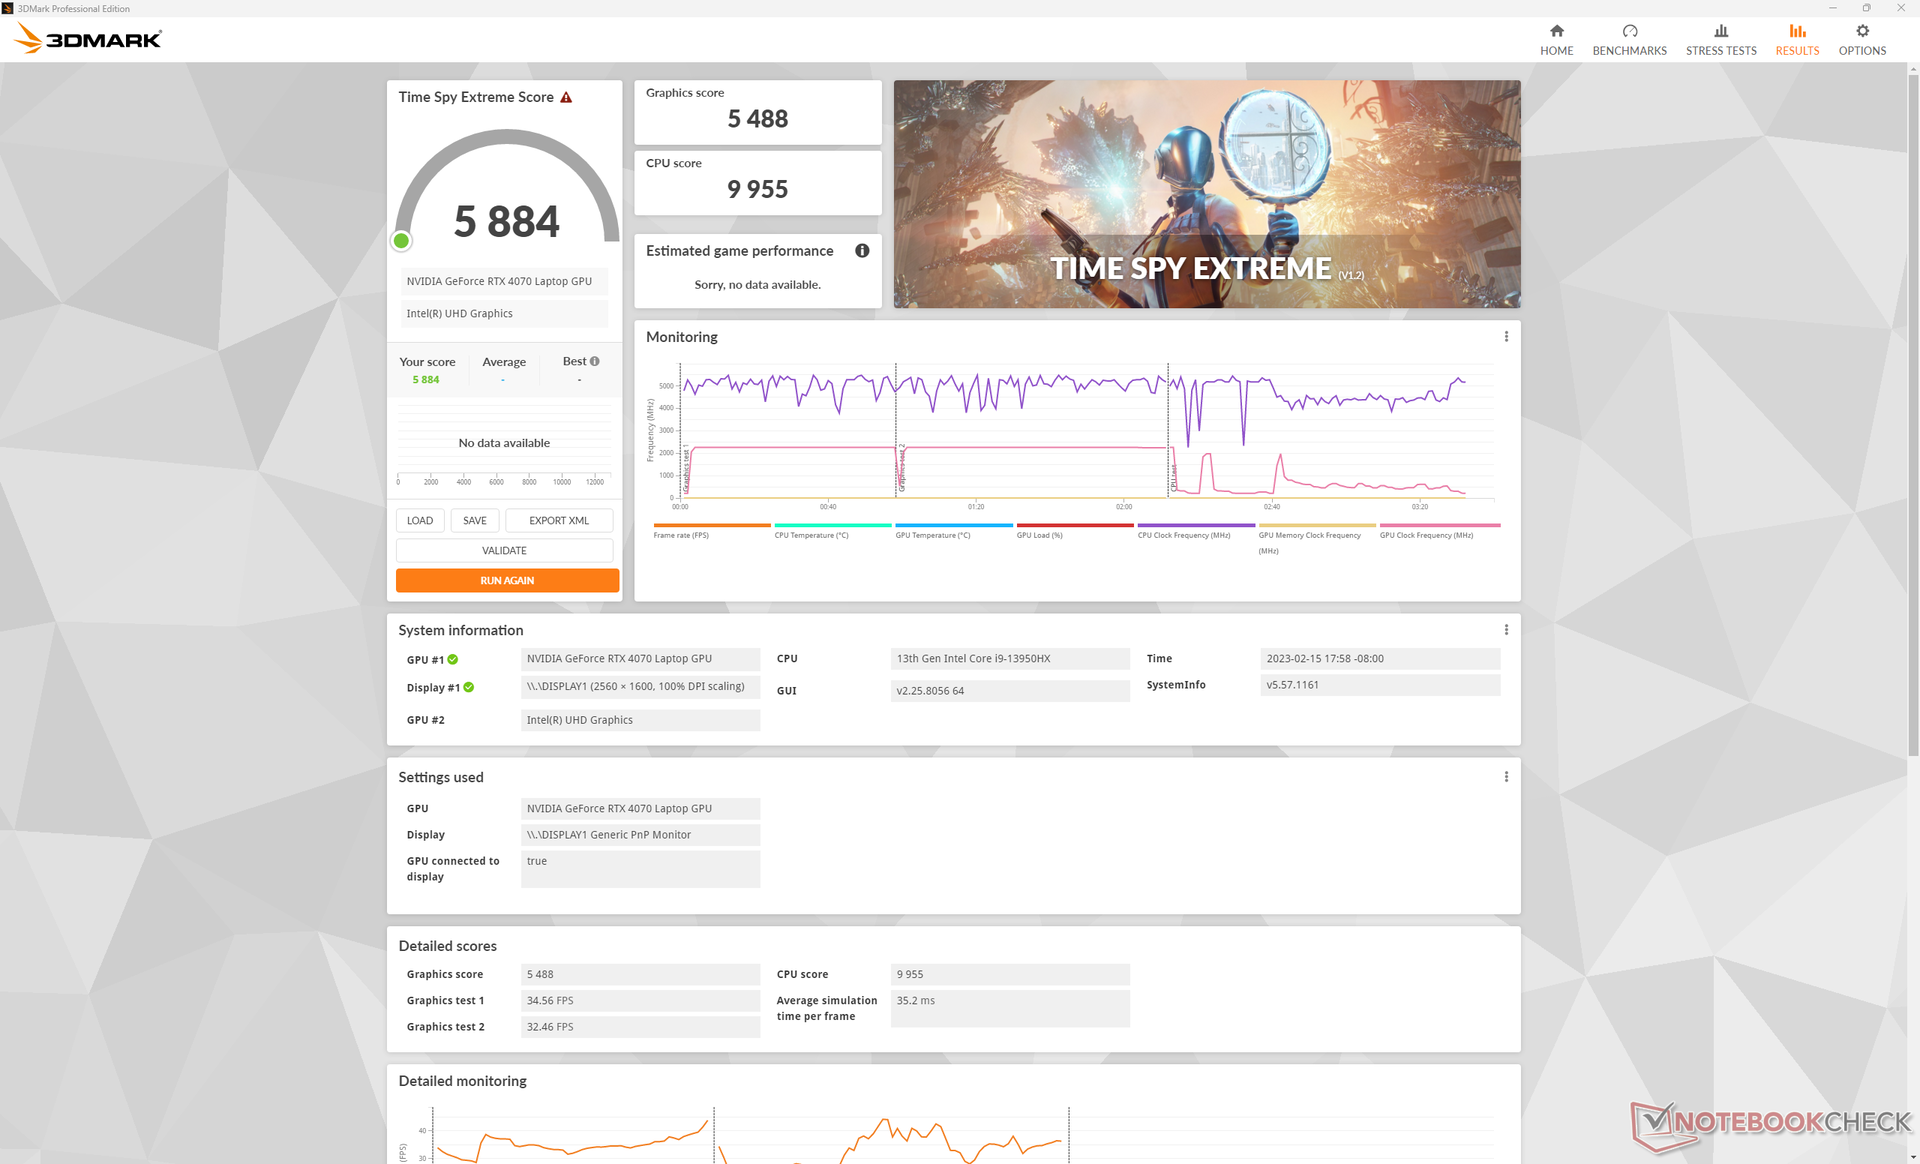
| 3DMark 11 Performance | 34754 punti | |
| 3DMark Fire Strike Score | 26019 punti | |
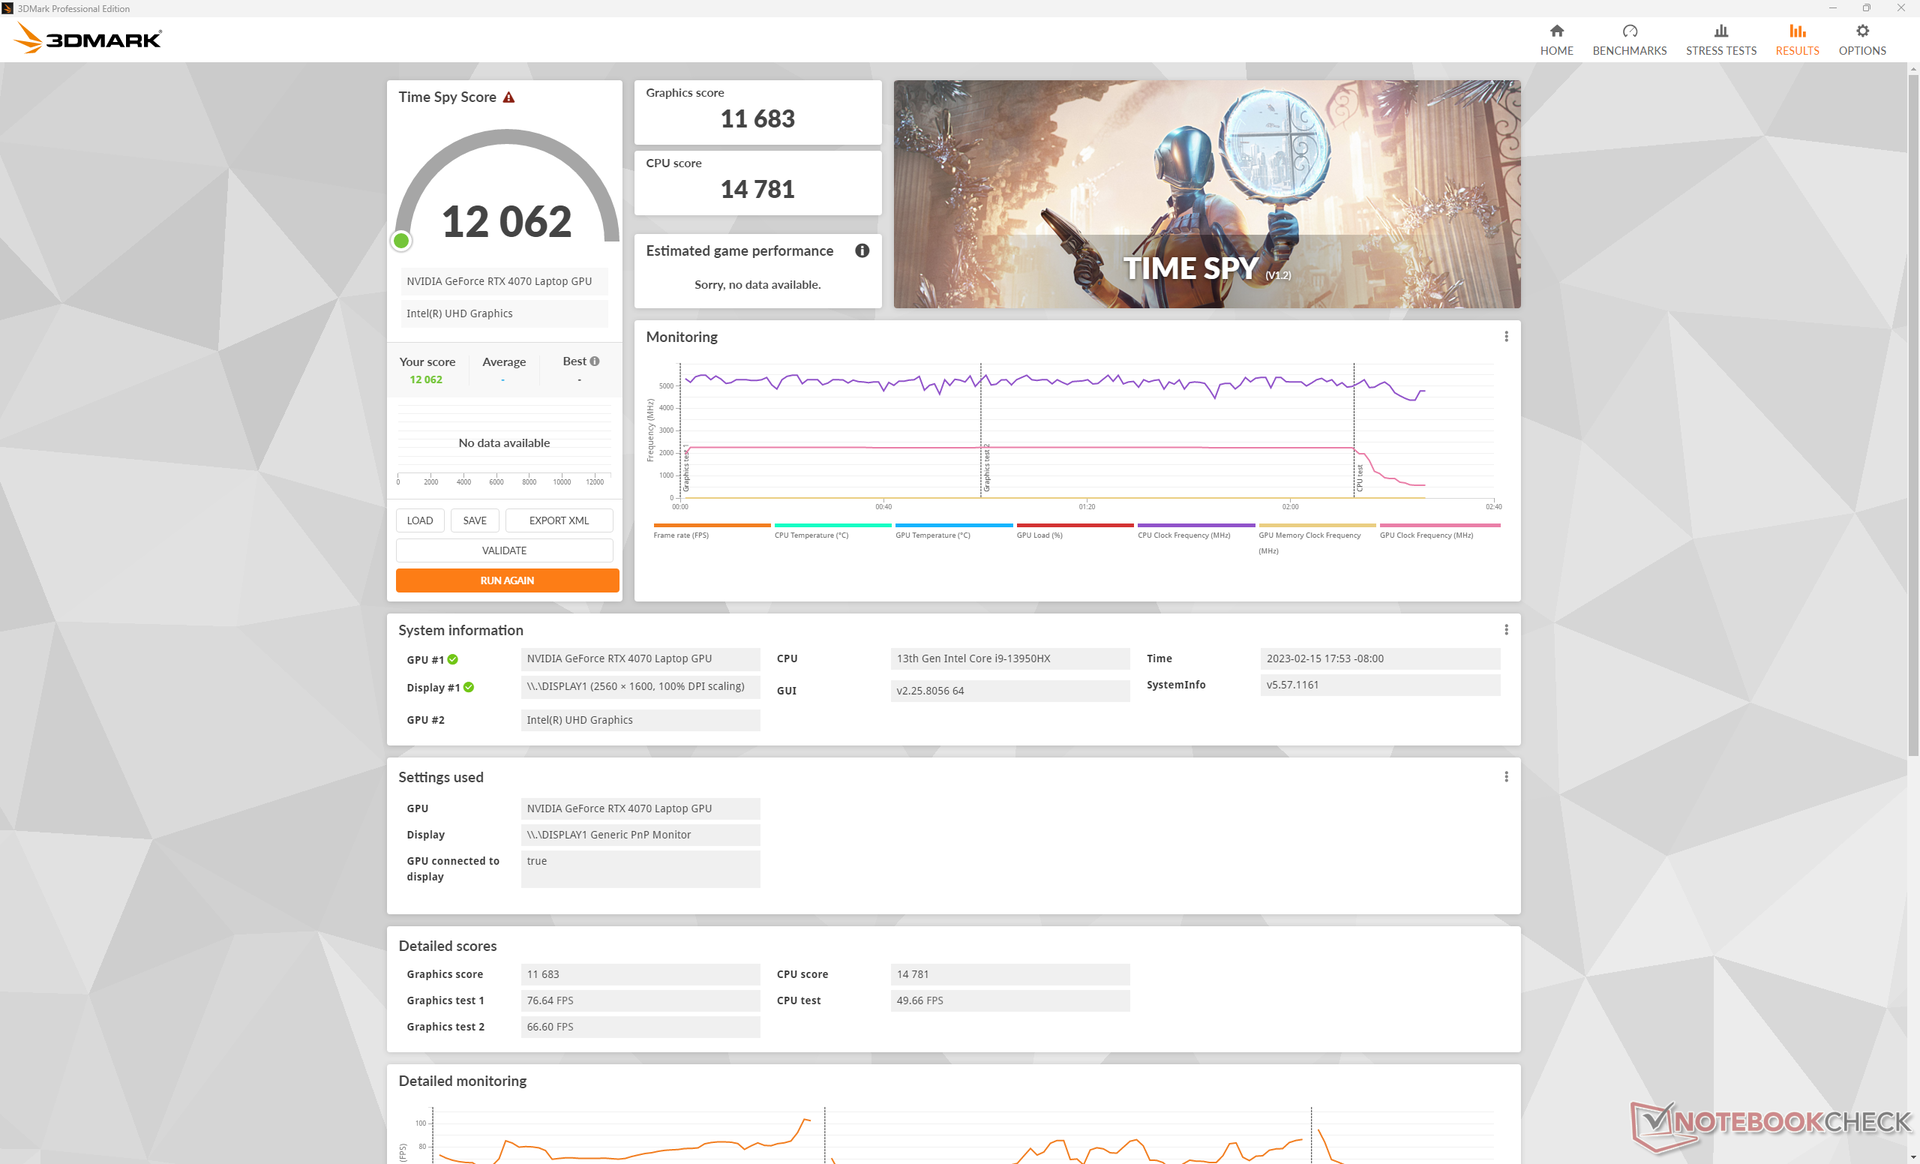
| 3DMark Time Spy Score | 12062 punti | |
Aiuto | ||
* ... Meglio usare valori piccoli
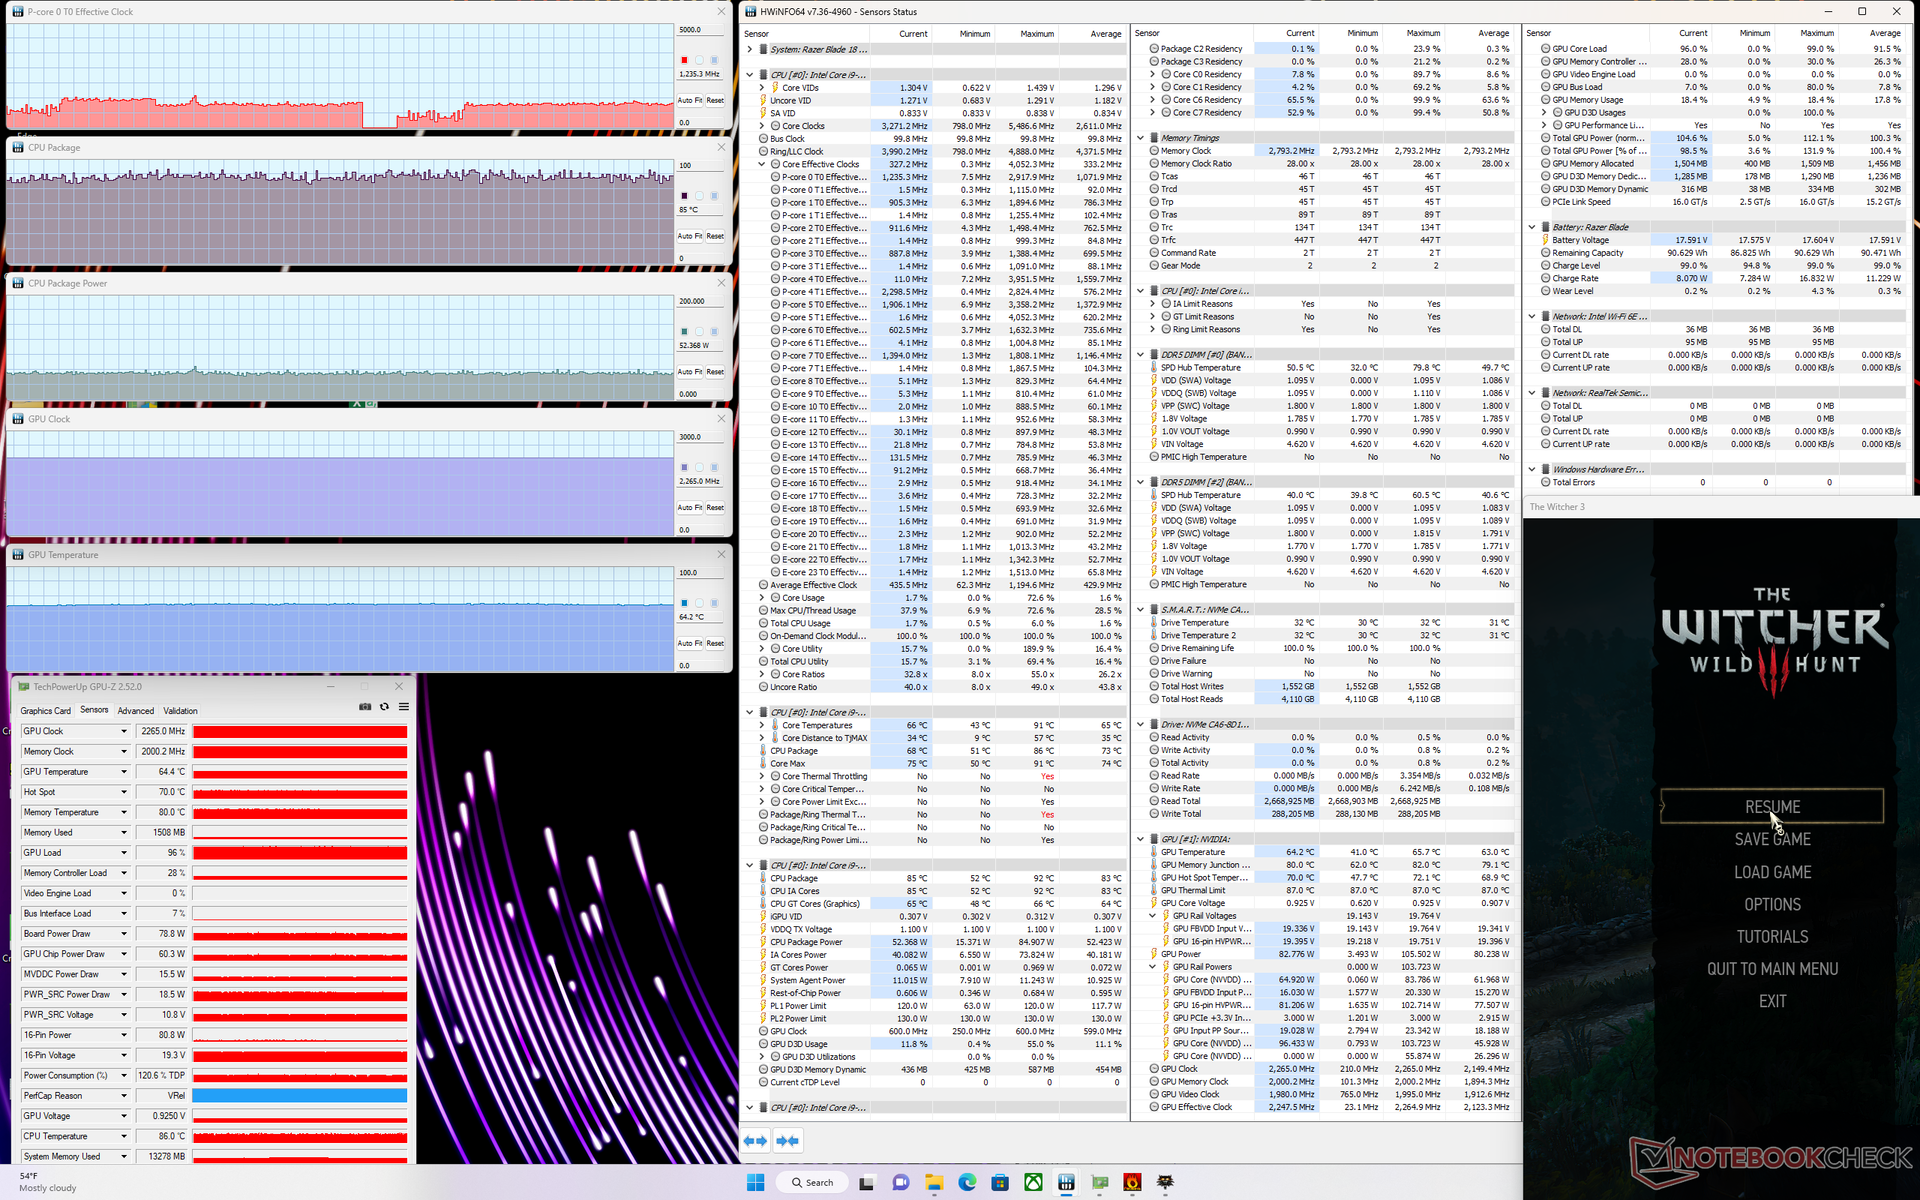
Il funzionamento al minimo per un'ora Witcher 3 per un'ora, restituisce una frequenza di fotogrammi stabile, senza cali ricorrenti delle prestazioni, il che suggerisce che non ci sia un'interruzione delle applicazioni in background o un forte throttling.
Witcher 3 FPS Chart
| basso | medio | alto | ultra | QHD | 4K | |
|---|---|---|---|---|---|---|
| GTA V (2015) | 186.1 | 184.7 | 181.6 | 121.4 | 87.6 | 88.5 |
| The Witcher 3 (2015) | 617 | 405.9 | 240.9 | 113.9 | 72.5 | |
| Dota 2 Reborn (2015) | 225 | 200 | 191 | 178.6 | 145.5 | |
| Final Fantasy XV Benchmark (2018) | 231 | 166.9 | 115.2 | 82 | 46.6 | |
| X-Plane 11.11 (2018) | 203 | 178.9 | 137.9 | 117.7 | ||
| Strange Brigade (2018) | 464 | 315 | 243 | 208 | 136.7 | 71.9 |
| Metro Exodus (2019) | 208.9 | 139.8 | 109.7 | 86.8 | 69 | 44 |
| Borderlands 3 (2019) | 258.5 | 200.1 | 131.8 | 100.3 | 68.7 | 35.7 |
| Hitman 3 (2021) | 294.3 | 234 | 208.4 | 197.4 | 129.9 | 68.5 |
| Cyberpunk 2077 1.6 (2022) | 147.8 | 125.7 | 111.5 | 92.1 | 54 | 23.3 |
Emissioni
Rumore del sistema: silenzioso quando non si gioca
Le ventole interne sono silenziose quando si eseguono carichi non impegnativi come lo streaming video o la navigazione web. Il rumore della ventola si aggira in genere sotto i 27 dB(A) a fronte di uno sfondo silenzioso di 23,5 dB(A), risultando sostanzialmente impercettibile nella maggior parte delle condizioni. È più silenzioso di quanto ci si aspettasse viste le dimensioni e la potenza sotto il legno.
L'esecuzione di carichi più elevati, come i giochi, aumenta il numero di giri della ventola in modo lento ma costante prima di stabilizzarsi a 48 dB(A). Se sollecitato al 100%, il rumore della ventola può raggiungere i 54 dB(A). La fascia bassa di 50 dB(A) è tipica della maggior parte dei portatili da gioco, compreso il modello GT77 o il Blade 17 di Razer. Nonostante le differenze di dimensioni, il Blade 18 è rumoroso quanto i suoi fratelli minori quando si gioca.
Rumorosità
| Idle |
| 23.8 / 23.8 / 26.8 dB(A) |
| Sotto carico |
| 37.3 / 53.5 dB(A) |
 | ||
30 dB silenzioso 40 dB(A) udibile 50 dB(A) rumoroso |
||
min: | ||
| Razer Blade 18 RTX 4070 GeForce RTX 4070 Laptop GPU, i9-13950HX, SSSTC CA6-8D1024 | Razer Blade 17 Early 2022 GeForce RTX 3080 Ti Laptop GPU, i9-12900H, Samsung PM9A1 MZVL21T0HCLR | MSI Titan GT77 HX 13VI GeForce RTX 4090 Laptop GPU, i9-13950HX, Samsung PM9A1 MZVL22T0HBLB | Gigabyte G7 KE GeForce RTX 3060 Laptop GPU, i5-12500H, Gigabyte AG470S1TB-SI B10 | Alienware m17 R5 (R9 6900HX, RX 6850M XT) Radeon RX 6850M XT, R9 6900HX, SSSTC CA6-8D1024 | Asus ROG Strix Scar 17 SE G733CX-LL014W GeForce RTX 3080 Ti Laptop GPU, i9-12950HX, Samsung PM9A1 MZVL22T0HBLB | |
|---|---|---|---|---|---|---|
| Noise | -12% | -17% | -26% | 0% | 5% | |
| off /ambiente * (dB) | 23.5 | 26 -11% | 24.6 -5% | 27 -15% | 23 2% | 23.9 -2% |
| Idle Minimum * (dB) | 23.8 | 26 -9% | 29.2 -23% | 27 -13% | 23 3% | 23.9 -0% |
| Idle Average * (dB) | 23.8 | 27 -13% | 29.2 -23% | 35 -47% | 28.11 -18% | 23.9 -0% |
| Idle Maximum * (dB) | 26.8 | 32 -19% | 29.2 -9% | 38 -42% | 28.11 -5% | 23.9 11% |
| Load Average * (dB) | 37.3 | 50 -34% | 50.7 -36% | 52 -39% | 30.62 18% | 34.3 8% |
| Witcher 3 ultra * (dB) | 48 | 51 -6% | 53.3 -11% | 56 -17% | 49.75 -4% | |
| Load Maximum * (dB) | 53.5 | 51 5% | 61 -14% | 59 -10% | 50.17 6% | 45.9 14% |
* ... Meglio usare valori piccoli
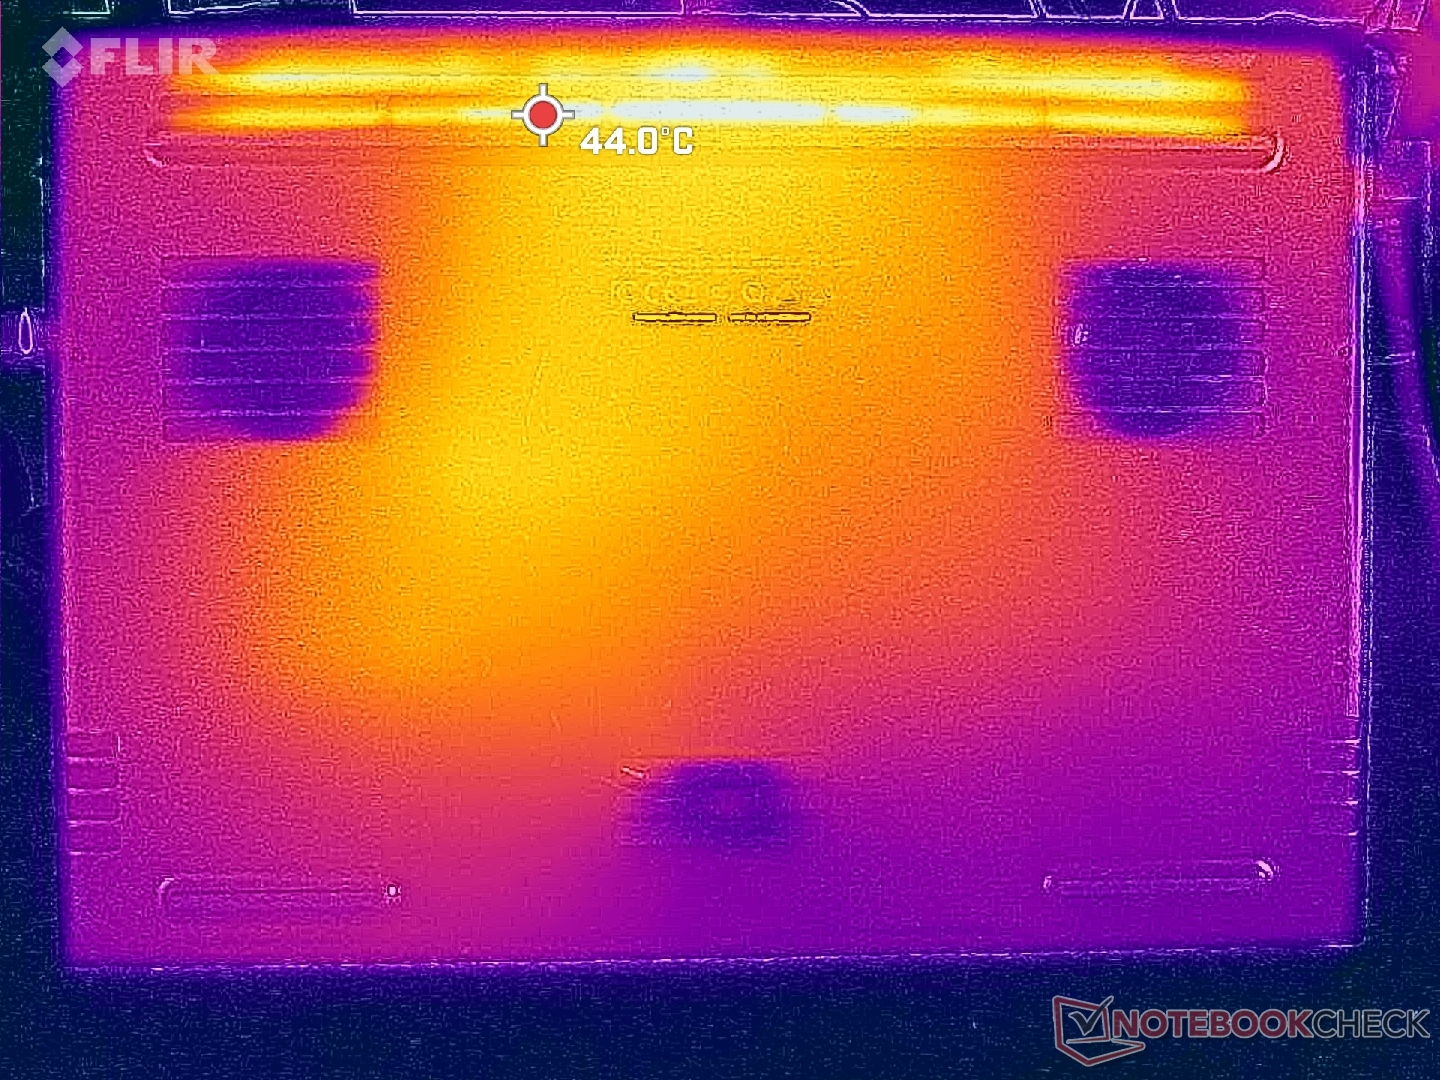
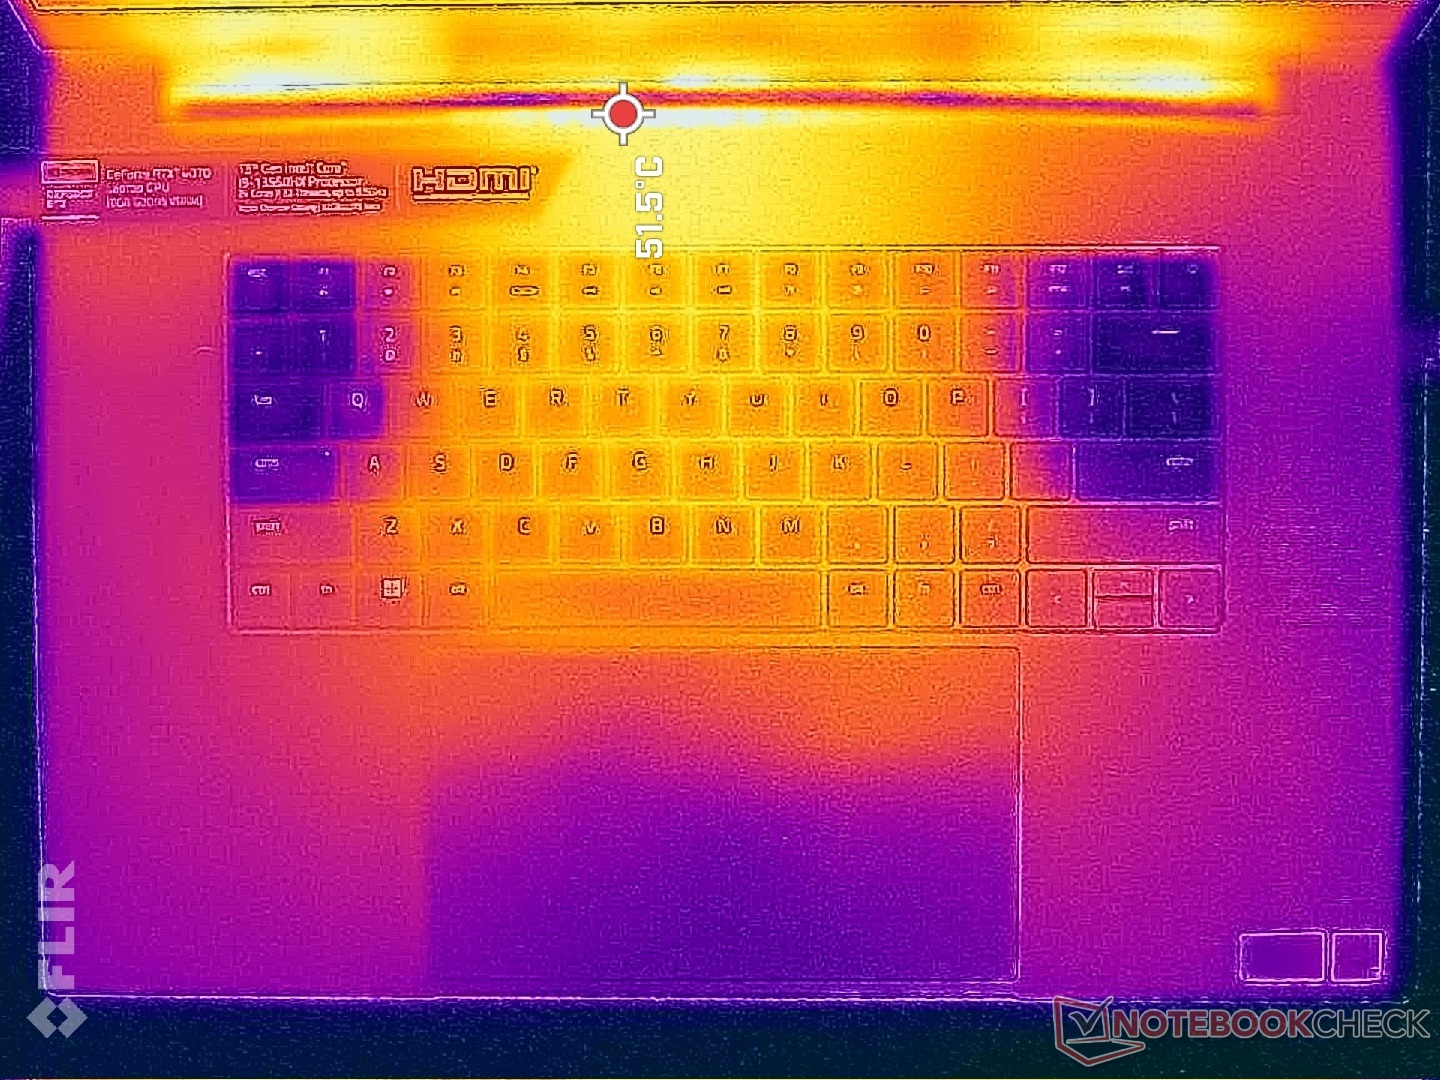
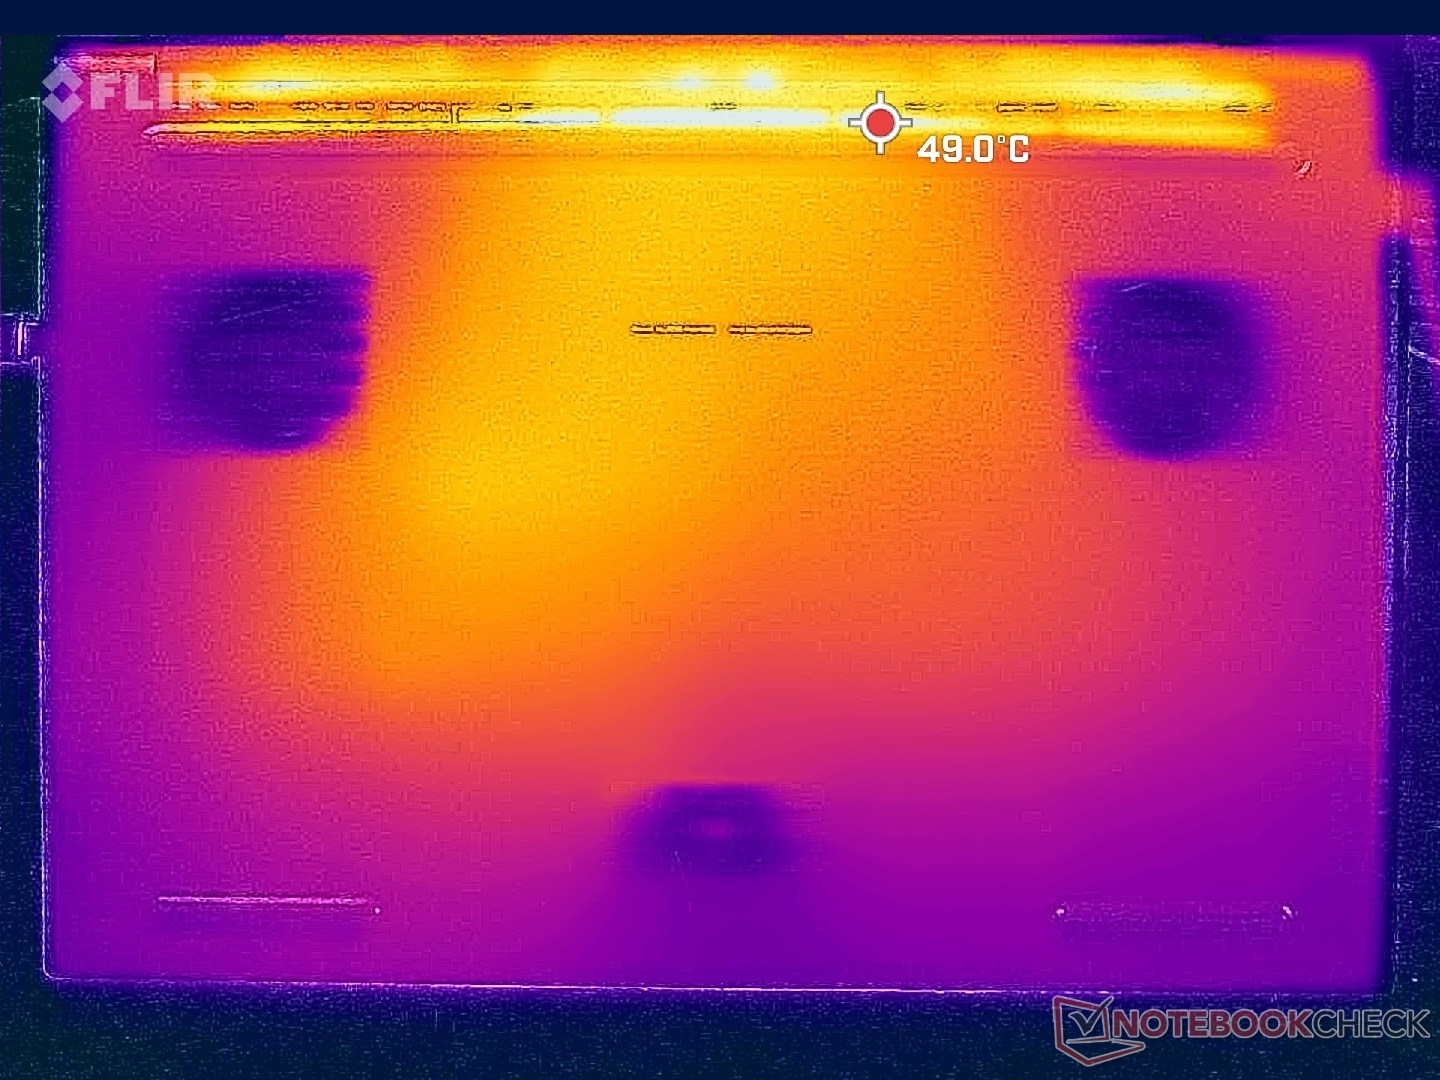
Temperatura
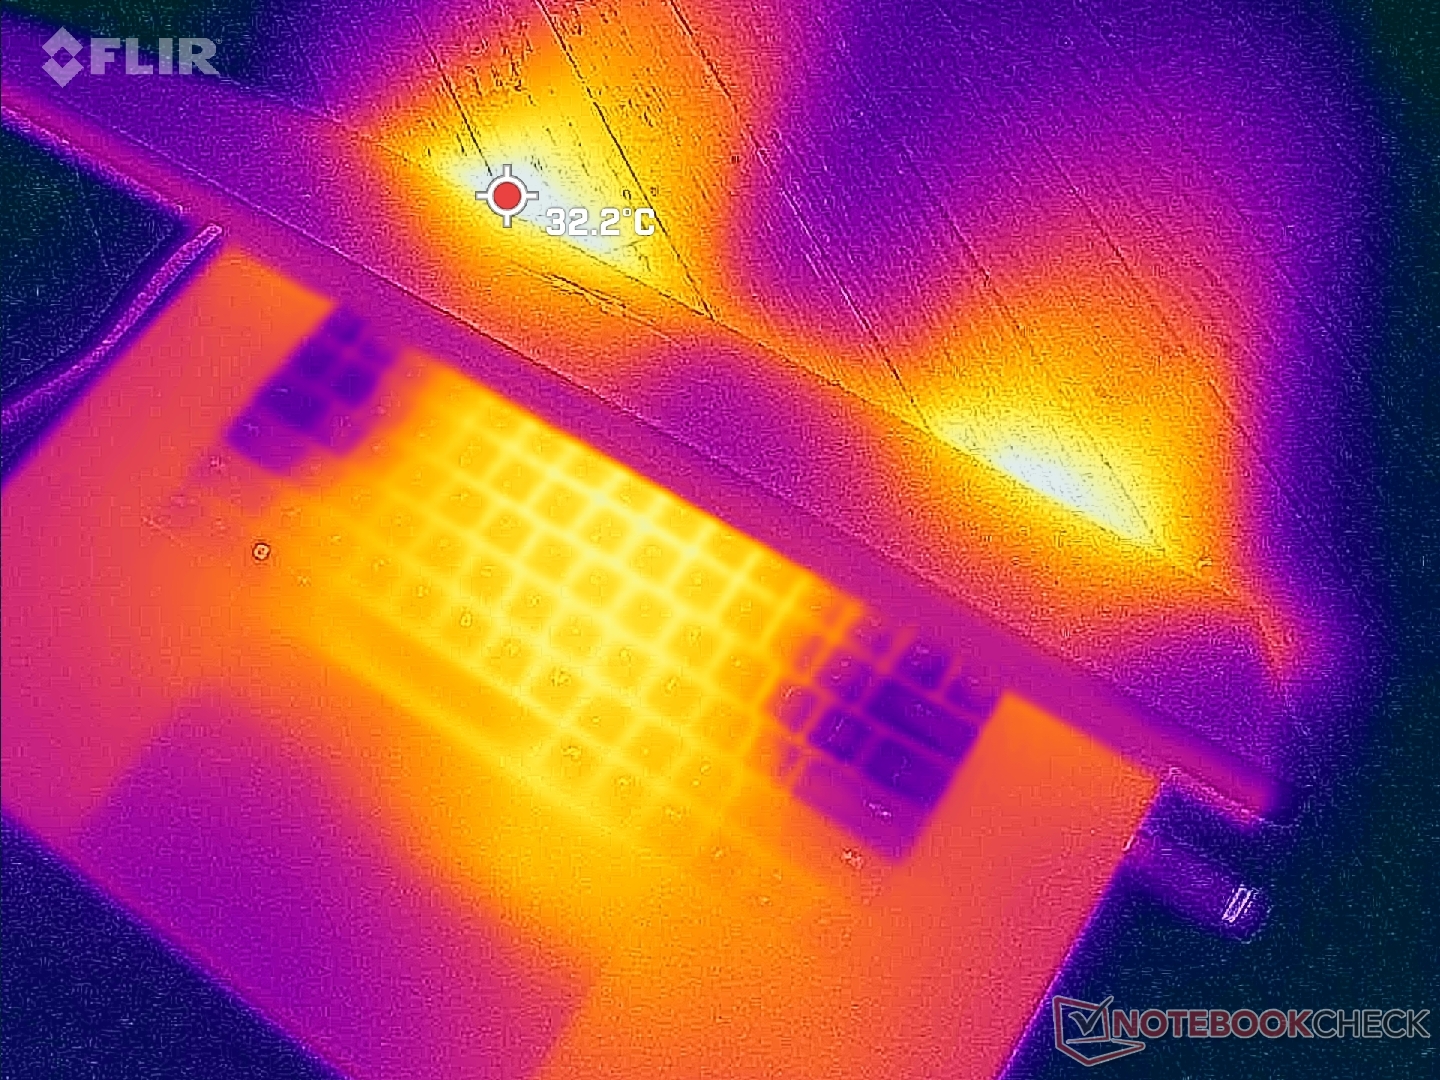
Le temperature di superficie sono relativamente fresche per un portatile da gioco, probabilmente grazie all'ampio fattore di forma da 18 pollici, al radiatore a camera di vapore con tre ventole e alla GPU TGP da 140 W. Le configurazioni RTX 4080 o 4090 più veloci saranno probabilmente più calde di quanto abbiamo registrato qui, dato che ciascuna ha un tetto massimo di 175 W.
I punti caldi durante il funzionamento Witcher 3 si attestano a soli 36 C nella parte superiore e 33 C in quella inferiore, rispetto ai 50 C-57 C dell'Alienware m17 R5 Alienware m17 R5. Il Blade 18 con RTX 4070 è uno dei portatili da gioco più freschi che abbiamo testato finora ed è chiaro che lo chassis è stato costruito per gestire opzioni più potenti della nostra configurazione RTX 4070.
Le temperature di superficie al minimo sono leggermente più calde del previsto, dato che le ventole tendono a girare al minimo durante i bassi carichi. Il Blade 18 non risulta mai fastidioso per la pelle, a patto che il bordo posteriore sia ben ventilato.
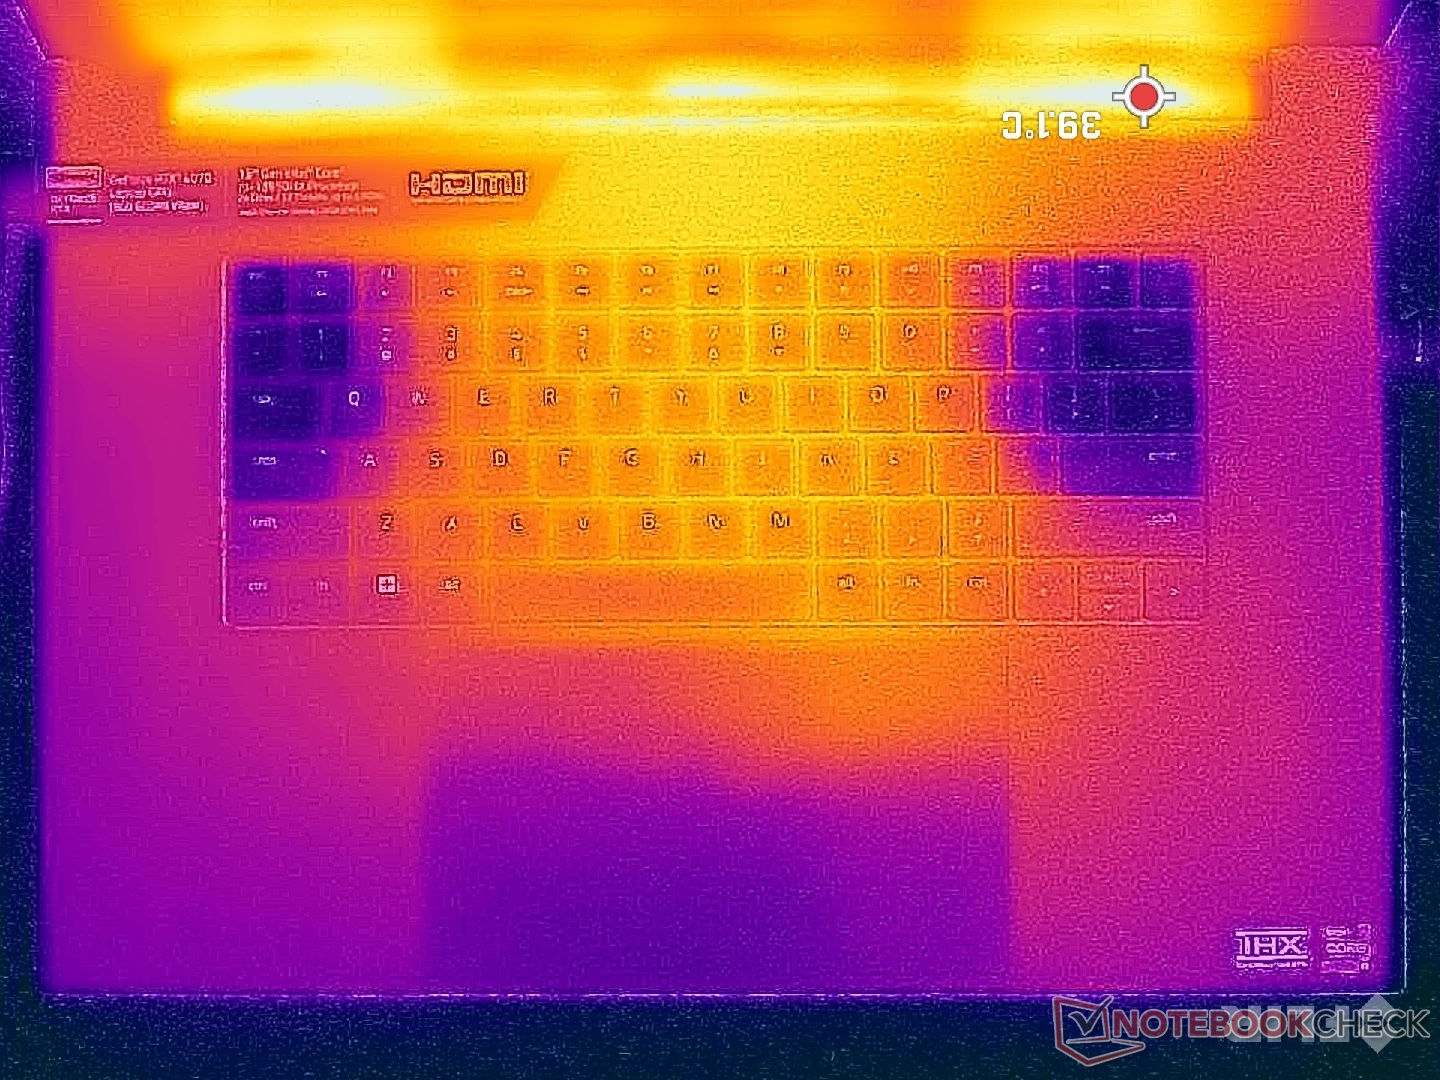
(+) La temperatura massima sul lato superiore è di 39.2 °C / 103 F, rispetto alla media di 40.4 °C / 105 F, che varia da 21.2 a 68.8 °C per questa classe Gaming.
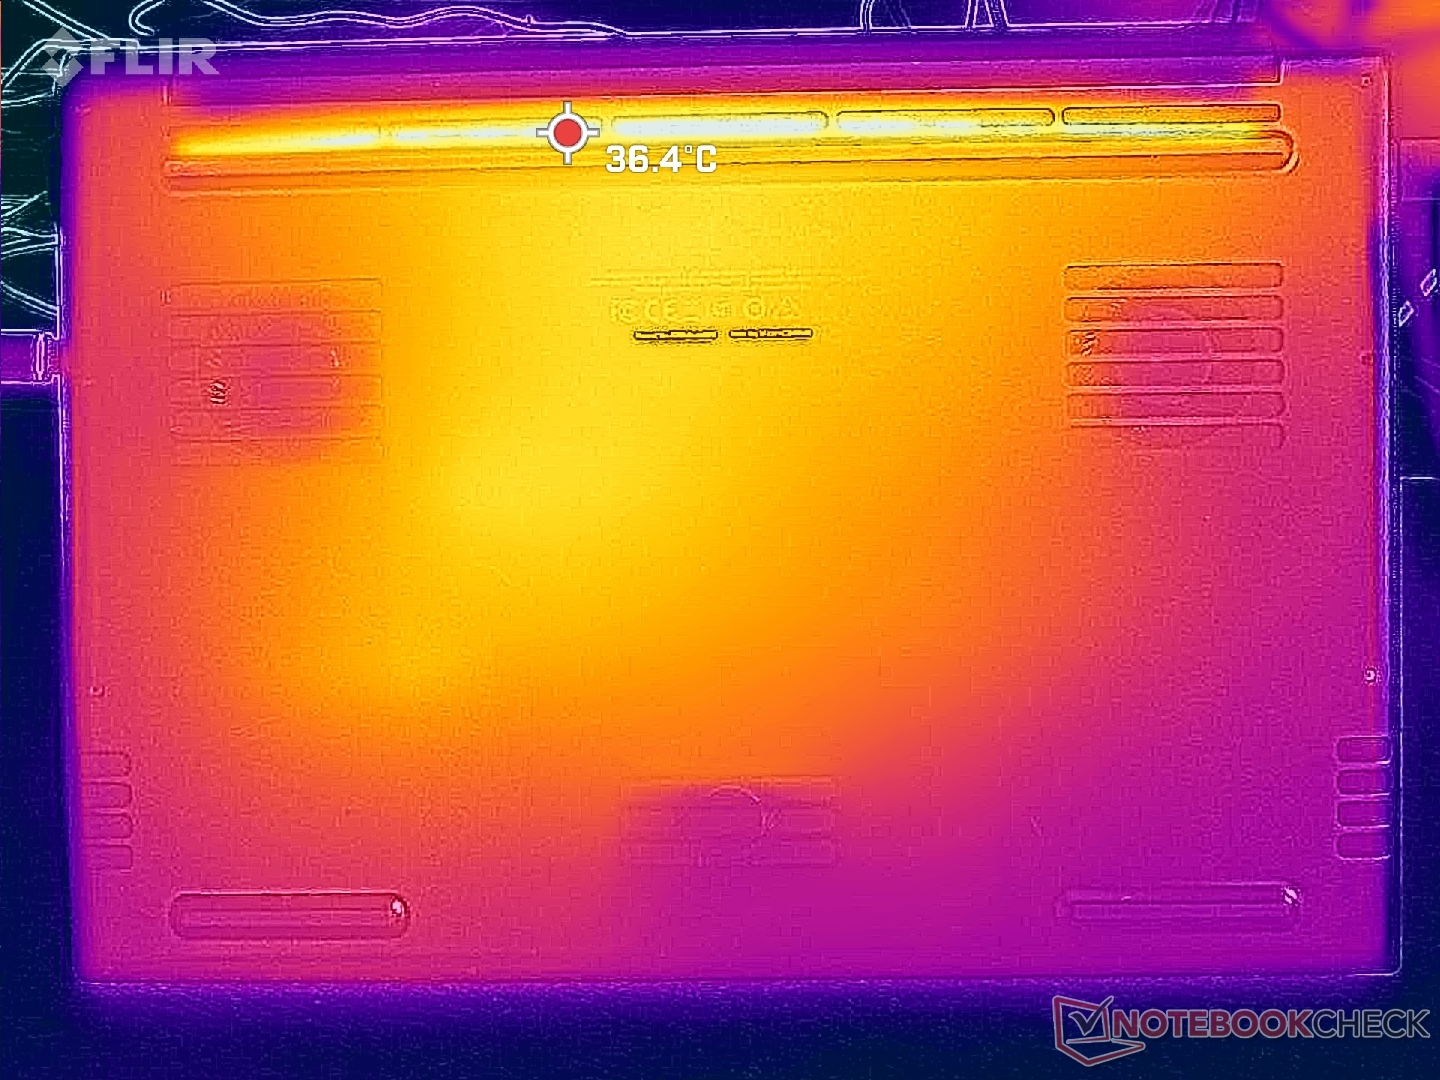
(+) Il lato inferiore si riscalda fino ad un massimo di 35.6 °C / 96 F, rispetto alla media di 43.2 °C / 110 F
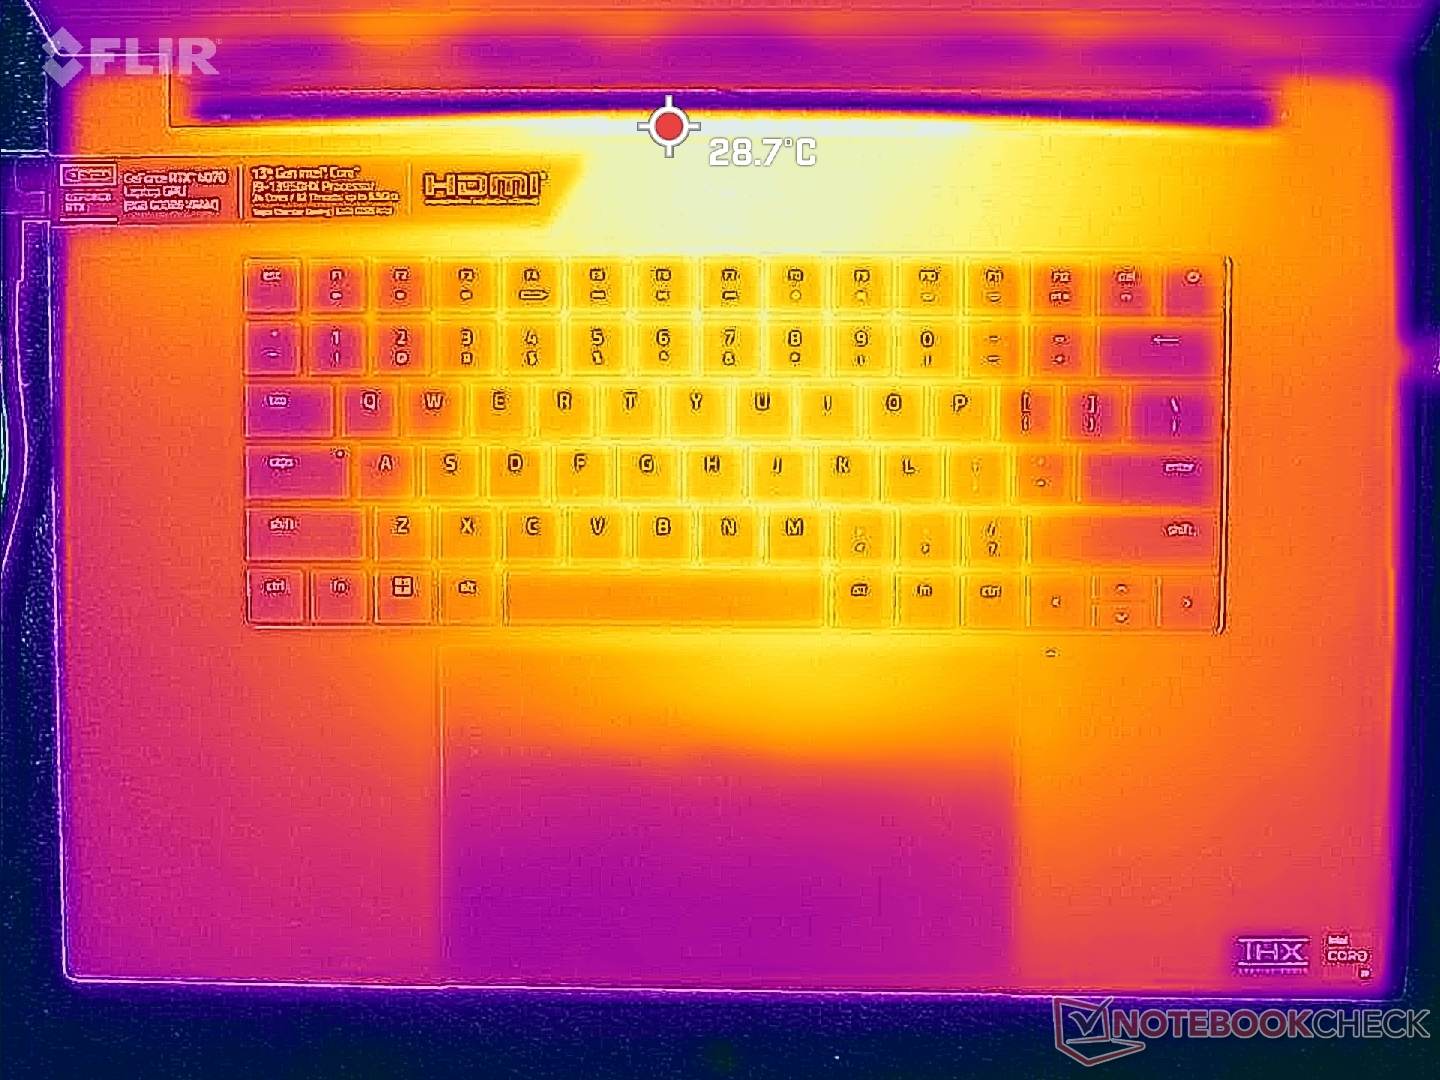
(+) In idle, la temperatura media del lato superiore è di 28.1 °C / 83 F, rispetto alla media deld ispositivo di 33.9 °C / 93 F.
(+) Riproducendo The Witcher 3, la temperatura media per il lato superiore e' di 28.9 °C / 84 F, rispetto alla media del dispositivo di 33.9 °C / 93 F.
(+) I poggiapolsi e il touchpad sono piu' freddi della temperatura della pelle con un massimo di 26 °C / 78.8 F e sono quindi freddi al tatto.
(+) La temperatura media della zona del palmo della mano di dispositivi simili e'stata di 28.8 °C / 83.8 F (+2.8 °C / 5 F).
| Razer Blade 18 RTX 4070 Intel Core i9-13950HX, NVIDIA GeForce RTX 4070 Laptop GPU | Razer Blade 17 Early 2022 Intel Core i9-12900H, NVIDIA GeForce RTX 3080 Ti Laptop GPU | MSI Titan GT77 HX 13VI Intel Core i9-13950HX, NVIDIA GeForce RTX 4090 Laptop GPU | Gigabyte G7 KE Intel Core i5-12500H, NVIDIA GeForce RTX 3060 Laptop GPU | Alienware m17 R5 (R9 6900HX, RX 6850M XT) AMD Ryzen 9 6900HX, AMD Radeon RX 6850M XT | Asus ROG Strix Scar 17 SE G733CX-LL014W Intel Core i9-12950HX, NVIDIA GeForce RTX 3080 Ti Laptop GPU | |
|---|---|---|---|---|---|---|
| Heat | -28% | 2% | -17% | -18% | -18% | |
| Maximum Upper Side * (°C) | 39.2 | 50 -28% | 40.6 -4% | 52 -33% | 53 -35% | 48.8 -24% |
| Maximum Bottom * (°C) | 35.6 | 56 -57% | 41.1 -15% | 54 -52% | 56 -57% | 52.4 -47% |
| Idle Upper Side * (°C) | 31.8 | 36 -13% | 26.2 18% | 28 12% | 30 6% | 30.4 4% |
| Idle Bottom * (°C) | 33.2 | 38 -14% | 30.3 9% | 32 4% | 29 13% | 34.1 -3% |
* ... Meglio usare valori piccoli
Stress test
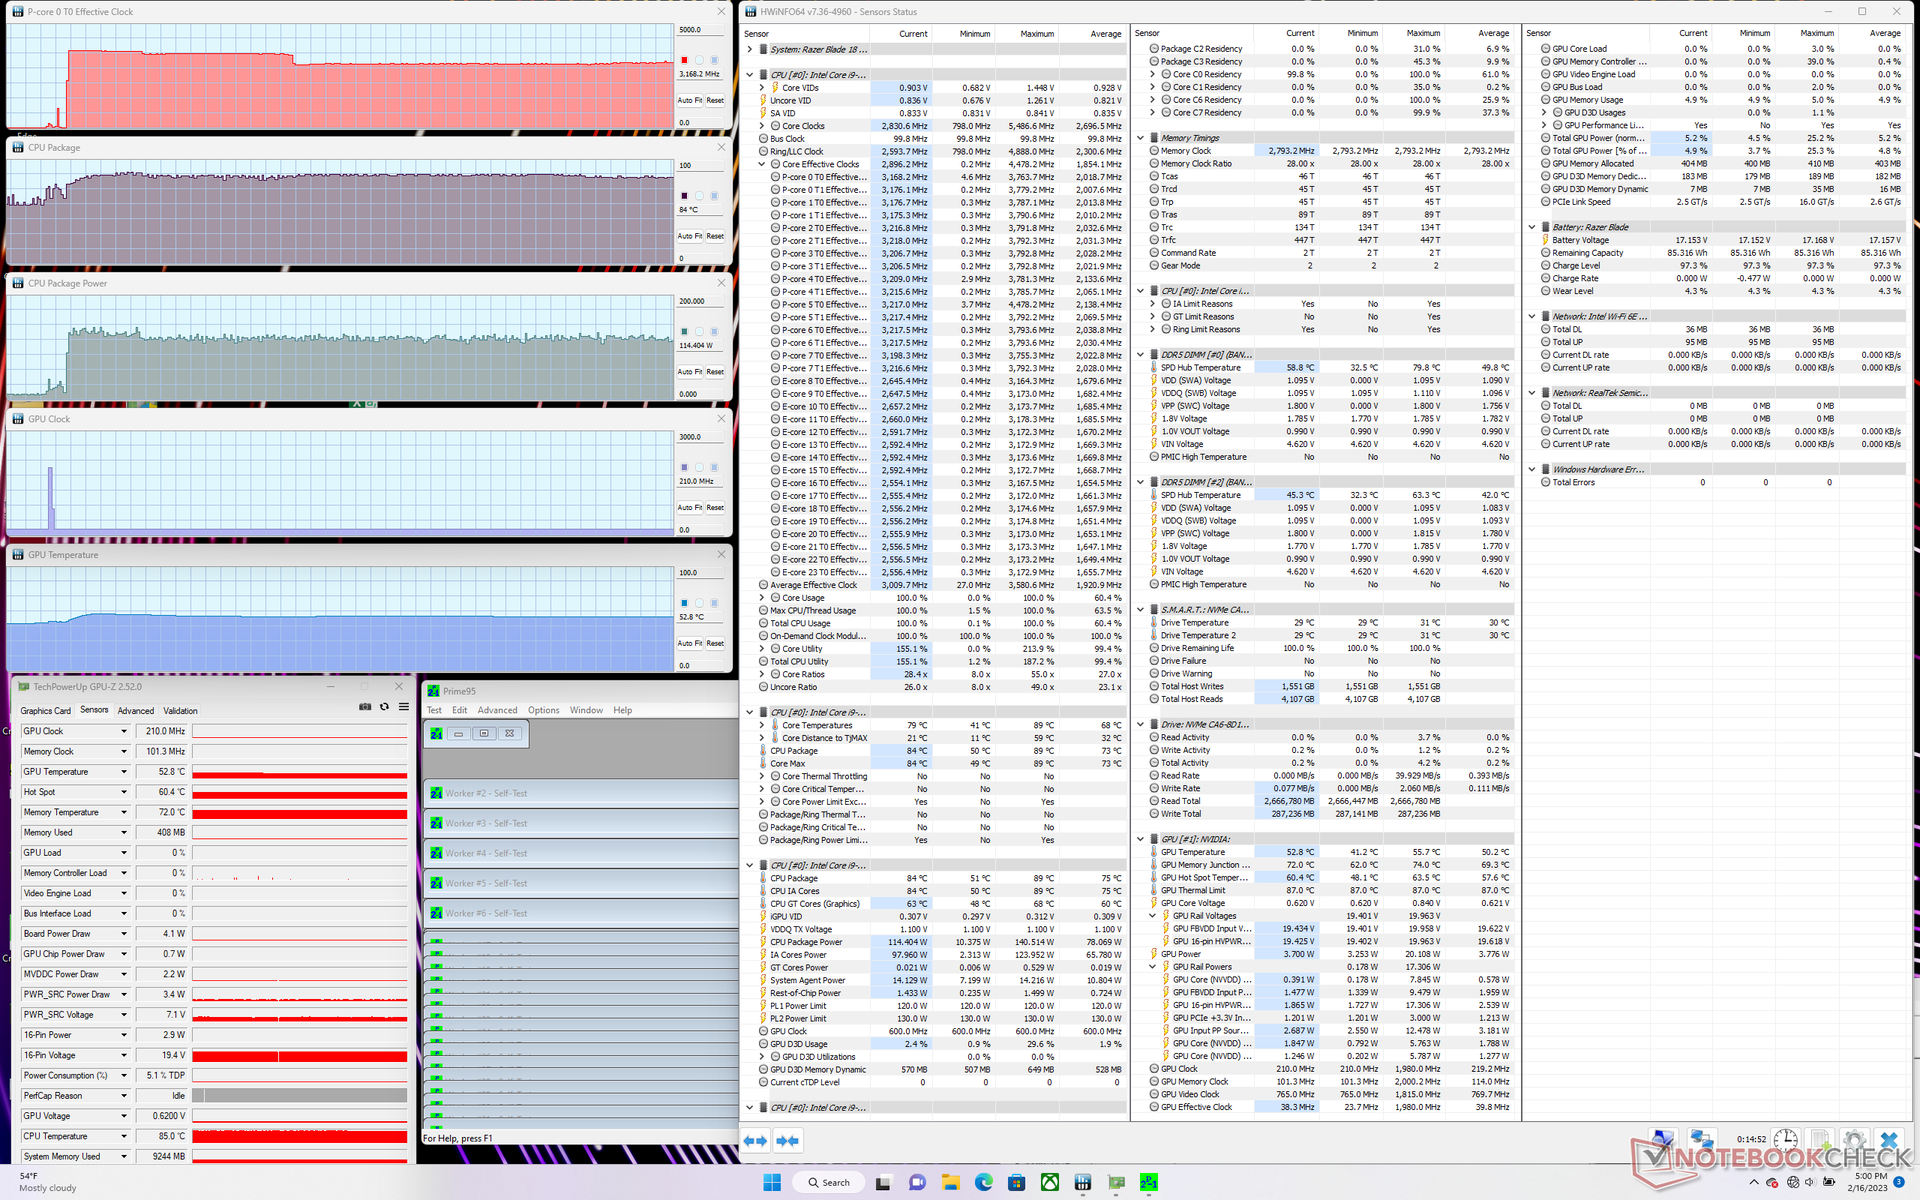
Quando si esegue Prime95 per stressare la CPU, la velocità di clock e l'assorbimento di potenza della scheda raggiungono rispettivamente 3,8 GHz e 140 W, prima di scendere a 3,1 GHz e a 110-120 W circa 70 secondi dopo. La temperatura del core si stabilizza a 87 C rispetto agli 82 C del Blade 16 dotato della stessa CPU.
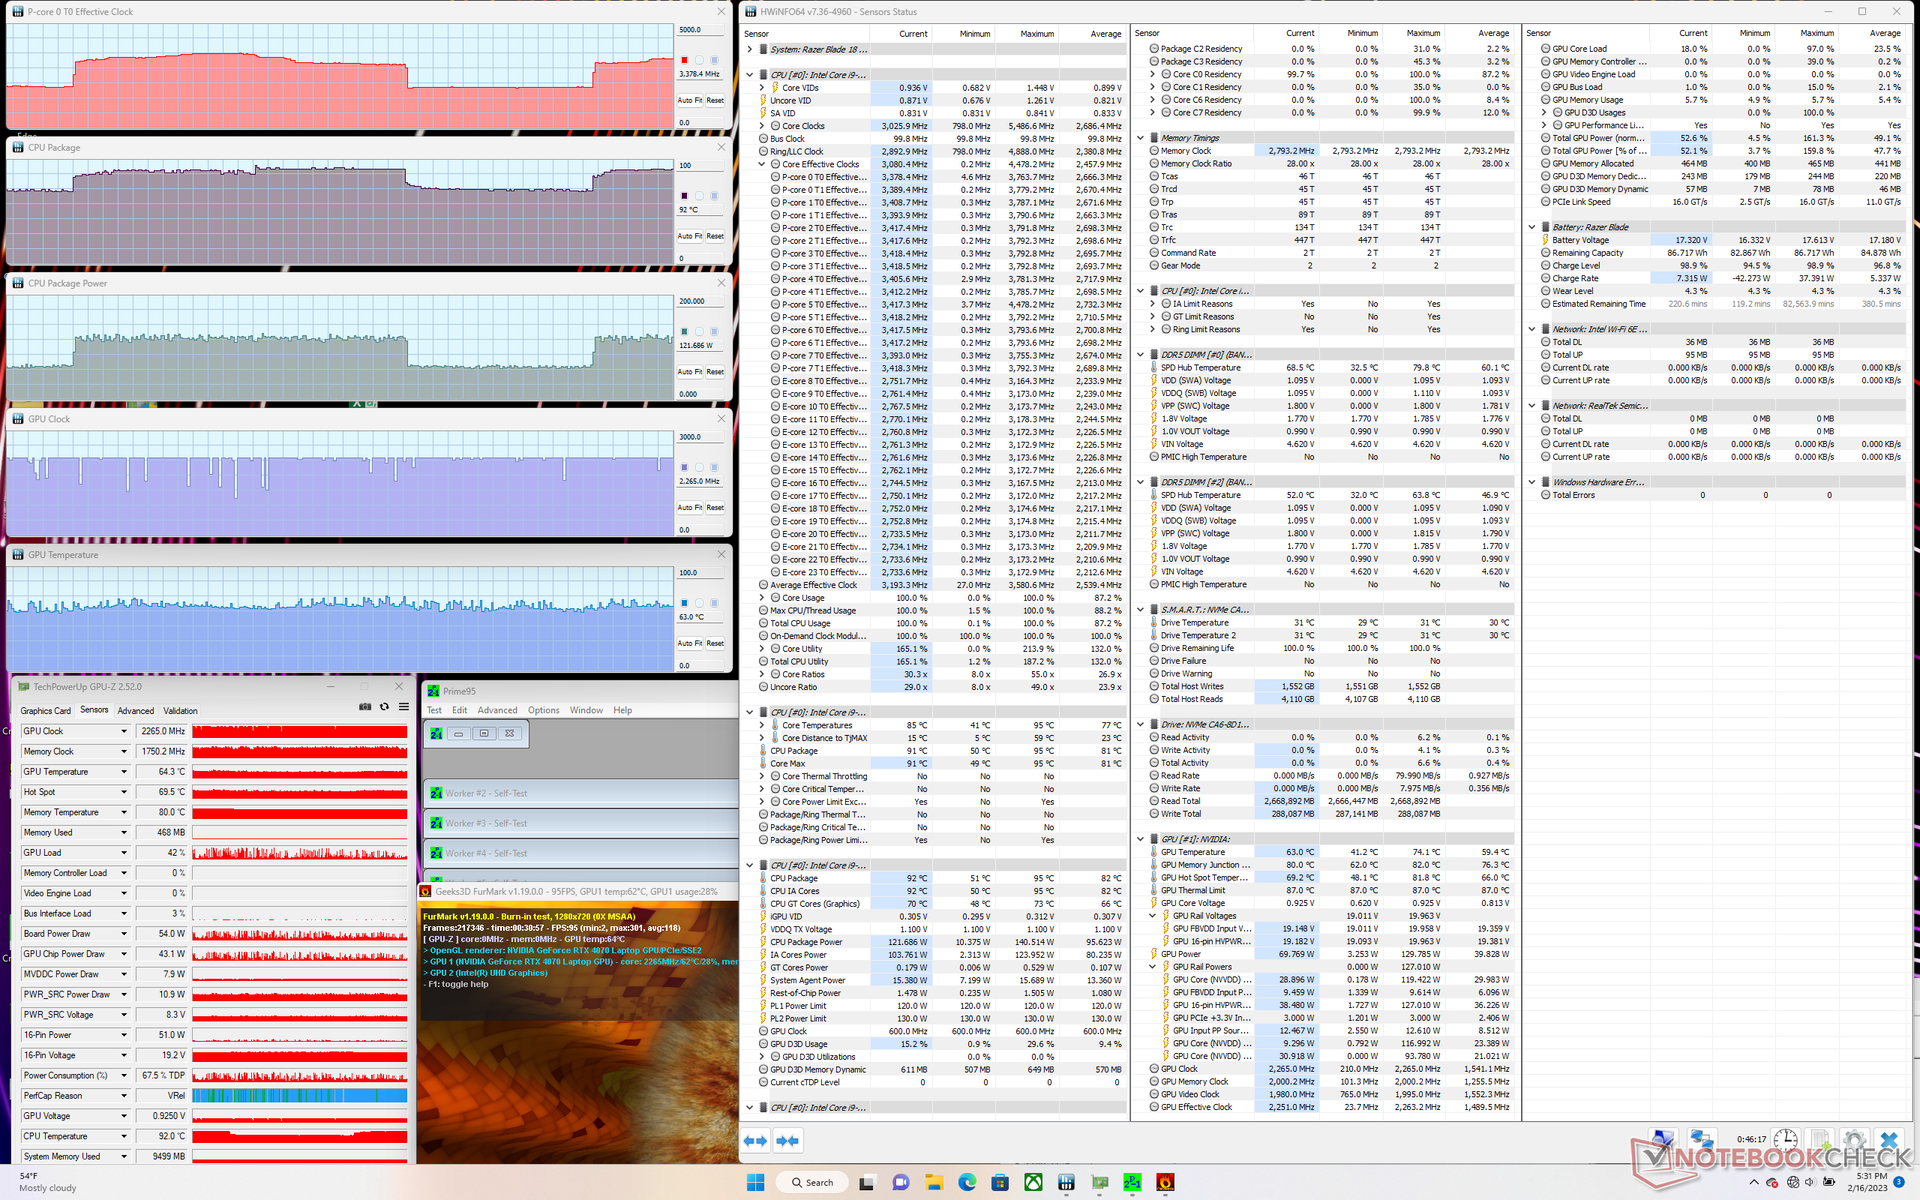
La frequenza di clock della GPU, la temperatura e l'assorbimento di potenza della scheda si stabilizzavano rispettivamente a 2265 MHz, 64 C e 80-90 W, quando si eseguiva Witcher 3. La GPU stessa è valutata per un TGP di 140 W e quindi il range di ~80 W è molto più basso del previsto, anche se impostato in modalità Performance. Siamo riusciti a raggiungere un picco di 100 W per la GPU solo quando si esegue un gioco più impegnativo come Cyberpunk 2077. In confronto, la GPU RTX 4080 del Blade 16 si stabilizza a ~160 W contro i 175 W del TGP quando si esegue lo stesso test Witcher 3 test.
Il funzionamento a batteria limita le prestazioni. Un test 3DMark 11 a batteria restituirebbe punteggi di Fisica e Grafica rispettivamente di 10336 e 18043 punti, rispetto a 25874 e 39733 punti con l'alimentazione di rete.
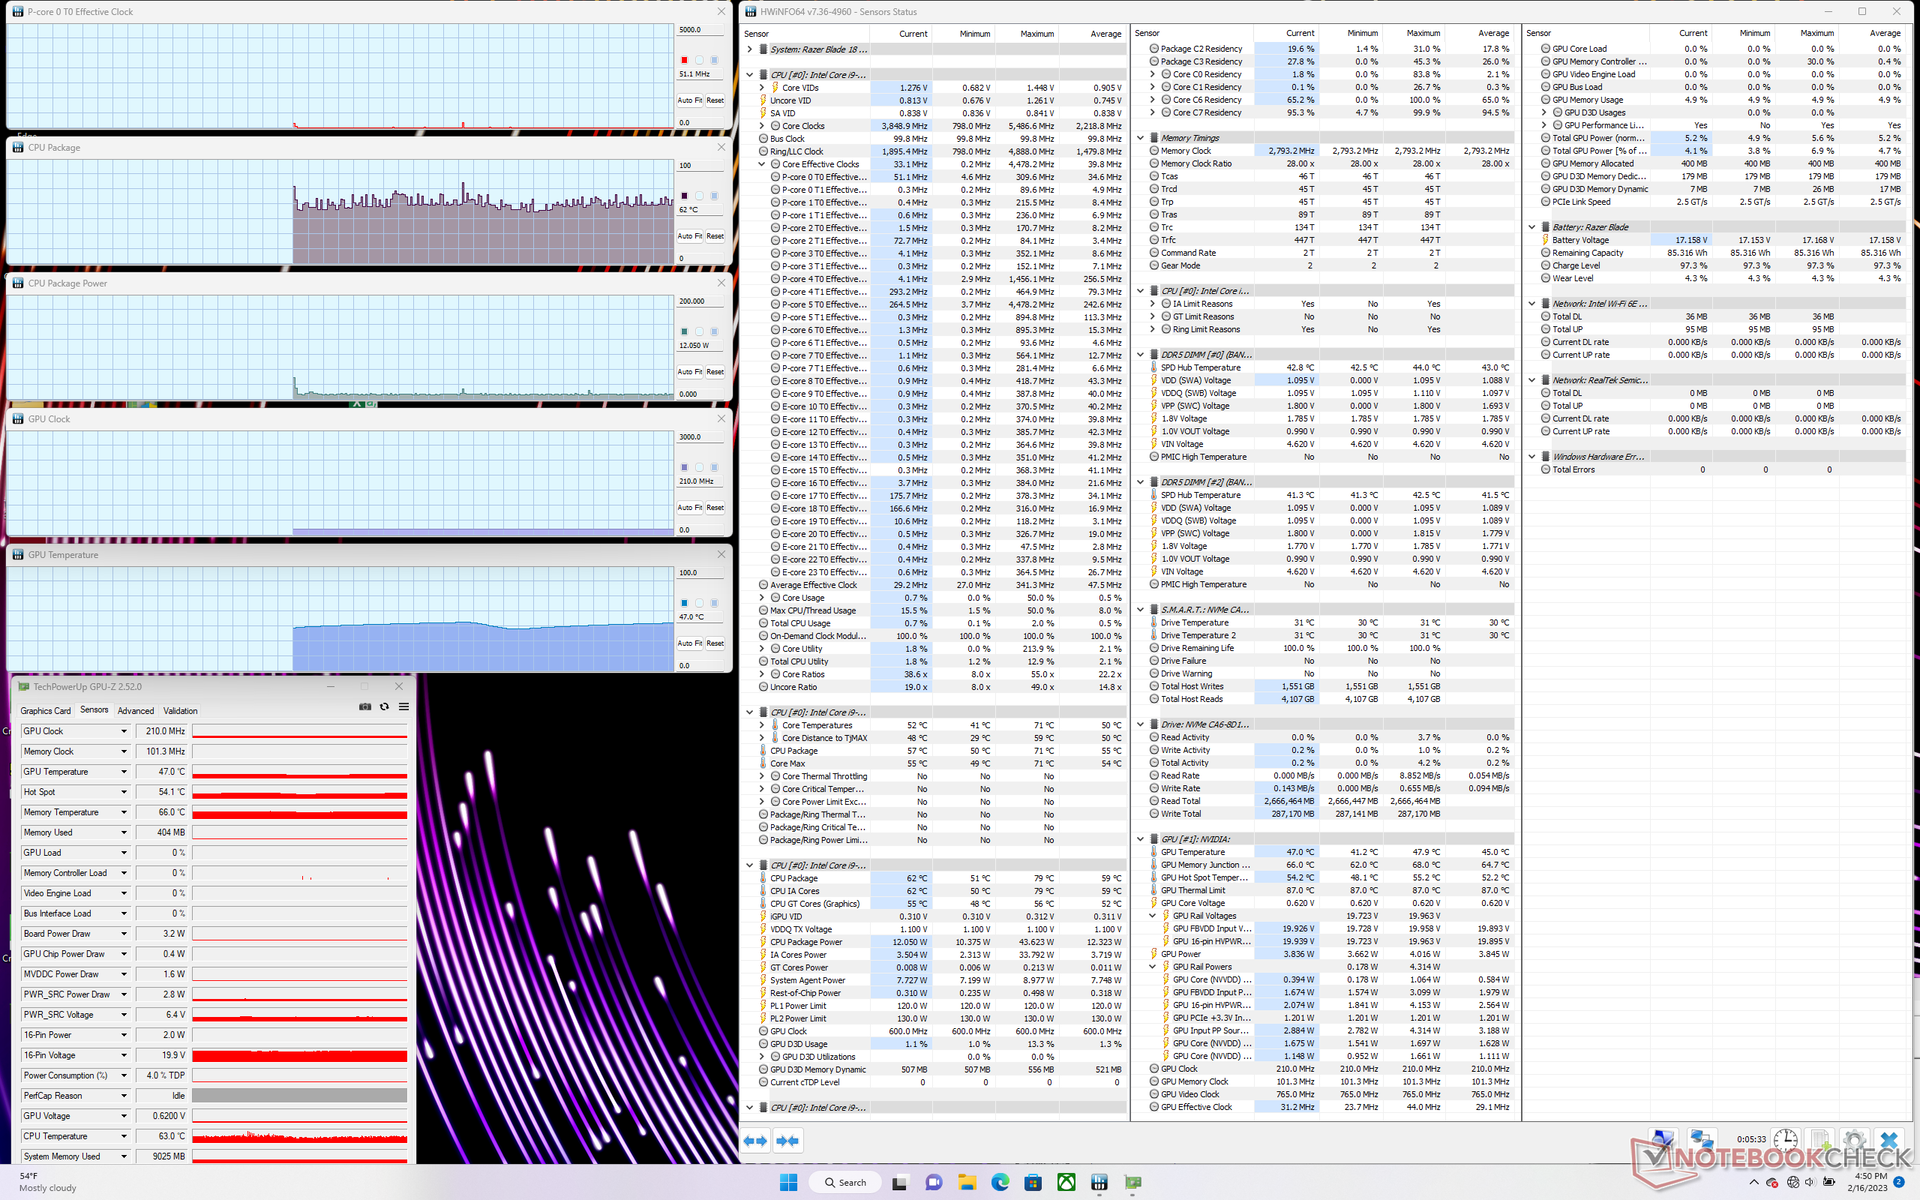
| Clock della CPU (GHz) | Clock della GPU (MHz) | Temperatura media della CPU (°C) | Temperatura media della GPU (°C) | |
| Sistema inattivo | -- | -- | 62 | 47 |
| Stress Prime95 | 3,2 | -- | 84 | 53 |
| Prime95 + FurMark Stress | 2,0 - 3,7 | 2265 | 70 - 91 | 63 |
| Witcher 3 Stress | ~1,2 | 2265 | 85 | 64 |
Altoparlanti
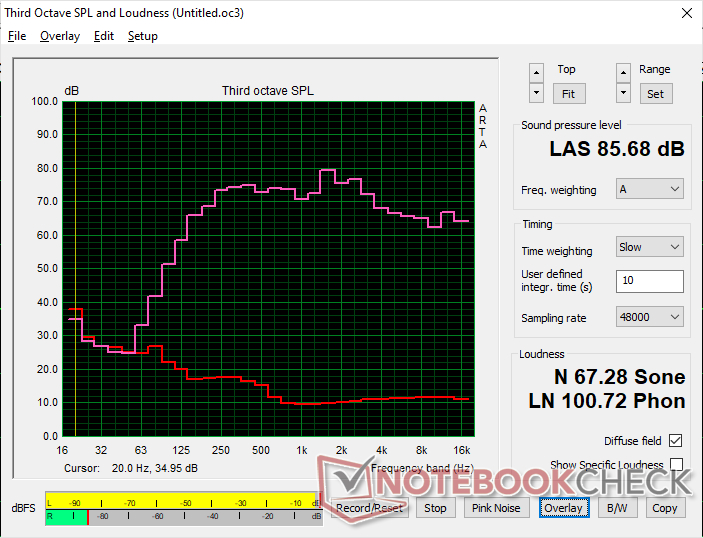
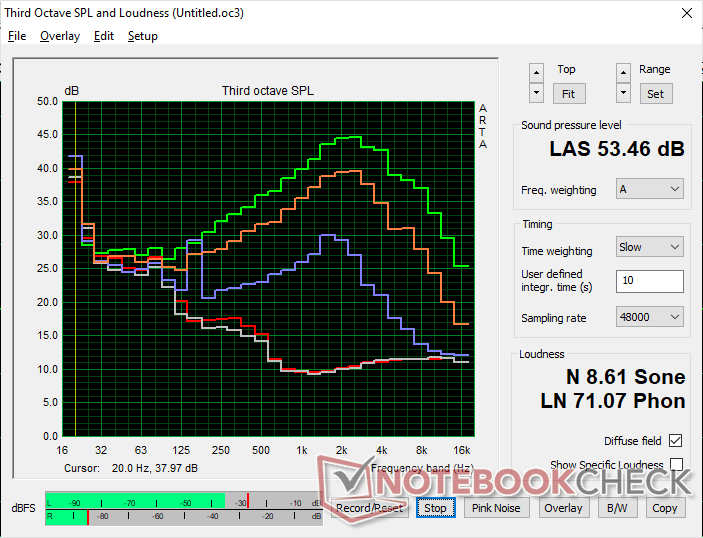
Razer Blade 18 RTX 4070 analisi audio
(+) | gli altoparlanti sono relativamente potenti (85.7 dB)
Bassi 100 - 315 Hz
(±) | bassi ridotti - in media 7.5% inferiori alla media
(±) | la linearità dei bassi è media (9.2% delta rispetto alla precedente frequenza)
Medi 400 - 2000 Hz
(+) | medi bilanciati - solo only 3.5% rispetto alla media
(+) | medi lineari (4.1% delta rispetto alla precedente frequenza)
Alti 2 - 16 kHz
(+) | Alti bilanciati - appena 4.8% dalla media
(+) | alti lineari (3.8% delta rispetto alla precedente frequenza)
Nel complesso 100 - 16.000 Hz
(+) | suono nel complesso lineare (9.2% differenza dalla media)
Rispetto alla stessa classe
» 3% di tutti i dispositivi testati in questa classe è stato migliore, 1% simile, 96% peggiore
» Il migliore ha avuto un delta di 6%, medio di 18%, peggiore di 132%
Rispetto a tutti i dispositivi testati
» 3% di tutti i dispositivi testati in questa classe è stato migliore, 1% similare, 96% peggiore
» Il migliore ha avuto un delta di 4%, medio di 23%, peggiore di 134%
Apple MacBook Pro 16 2021 M1 Pro analisi audio
(+) | gli altoparlanti sono relativamente potenti (84.7 dB)
Bassi 100 - 315 Hz
(+) | bassi buoni - solo 3.8% dalla media
(+) | bassi in lineaa (5.2% delta rispetto alla precedente frequenza)
Medi 400 - 2000 Hz
(+) | medi bilanciati - solo only 1.3% rispetto alla media
(+) | medi lineari (2.1% delta rispetto alla precedente frequenza)
Alti 2 - 16 kHz
(+) | Alti bilanciati - appena 1.9% dalla media
(+) | alti lineari (2.7% delta rispetto alla precedente frequenza)
Nel complesso 100 - 16.000 Hz
(+) | suono nel complesso lineare (4.6% differenza dalla media)
Rispetto alla stessa classe
» 0% di tutti i dispositivi testati in questa classe è stato migliore, 0% simile, 100% peggiore
» Il migliore ha avuto un delta di 5%, medio di 17%, peggiore di 45%
Rispetto a tutti i dispositivi testati
» 0% di tutti i dispositivi testati in questa classe è stato migliore, 0% similare, 100% peggiore
» Il migliore ha avuto un delta di 4%, medio di 23%, peggiore di 134%
Gestione dell'energia - Grandi display, grandi richieste di potenza
Consumo di energia
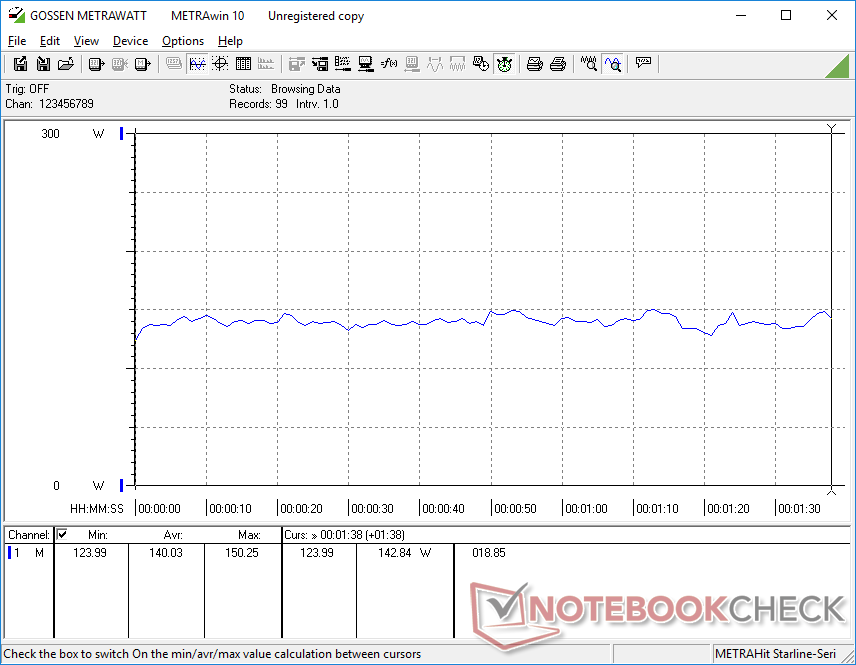
Il consumo di energia al minimo sul desktop varia tra i 24 W e i 48 W, a seconda dell'impostazione della luminosità e del profilo energetico. In effetti, la differenza tra le impostazioni di luminosità minima e massima è di ben 10 W. Questo intervallo è notevolmente superiore a quello della maggior parte dei portatili più piccoli, il che può spiegare i risultati non eccezionali della durata della batteria riportati nella sezione successiva.
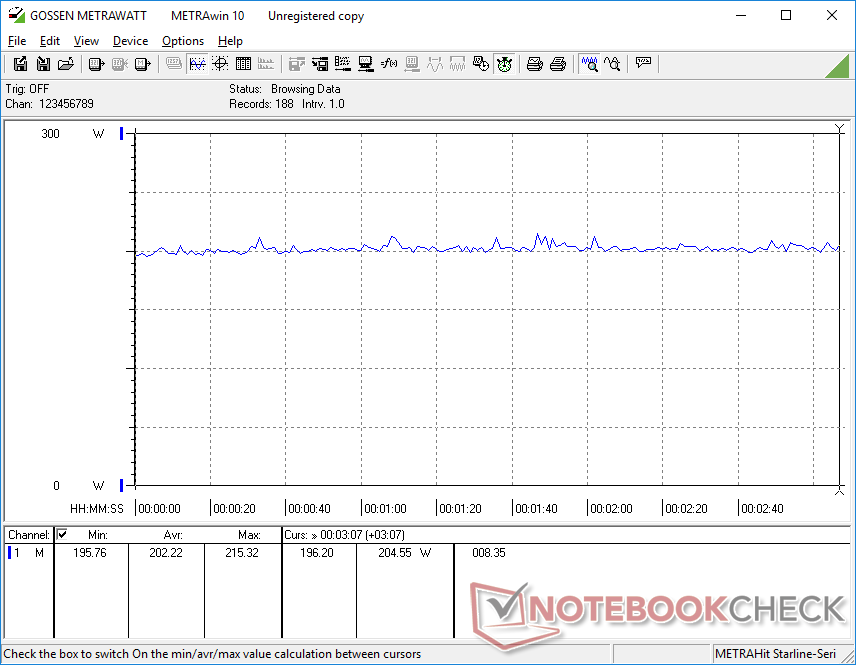
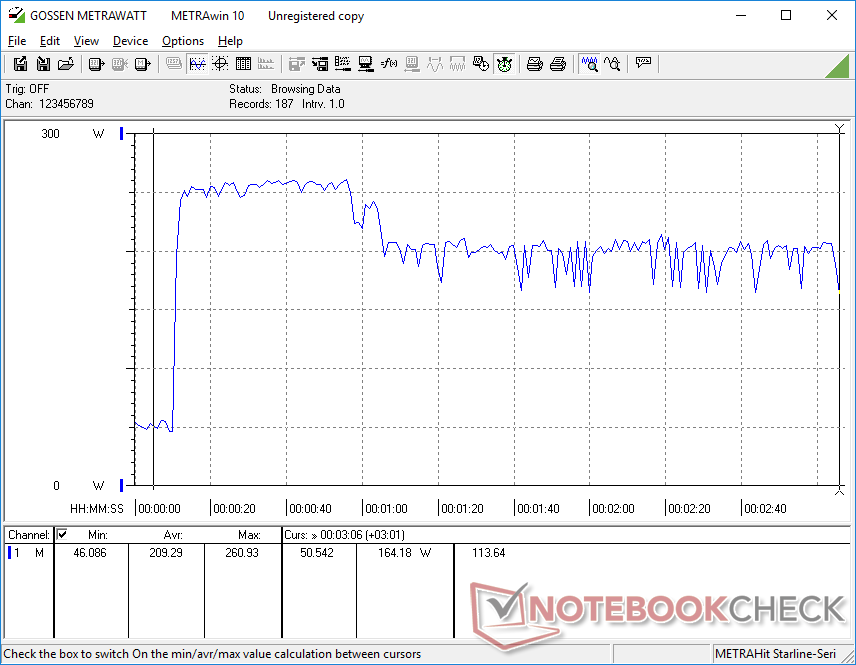
Quando si esegue Witcher 3 per rappresentare i carichi di gioco tipici, il sistema richiederebbe una media di 202 W rispetto ai 229 W o 225 W del Blade 17 con RTX 3080 Ti o dell'Asus ROG Strix Scar 17 SErispettivamente. Pertanto, il nostro sistema da 18 pollici con RTX 4070 assorbe circa il 10% di energia in meno pur offrendo quasi le stesse prestazioni grafiche della RTX 3080 Ti mobile di ultima generazione. L'aggiornamento alla configurazione RTX 4080 o RTX 4090 consumerà probabilmente da 40 a 50 W in più, come abbiamo osservato sul Blade 16.
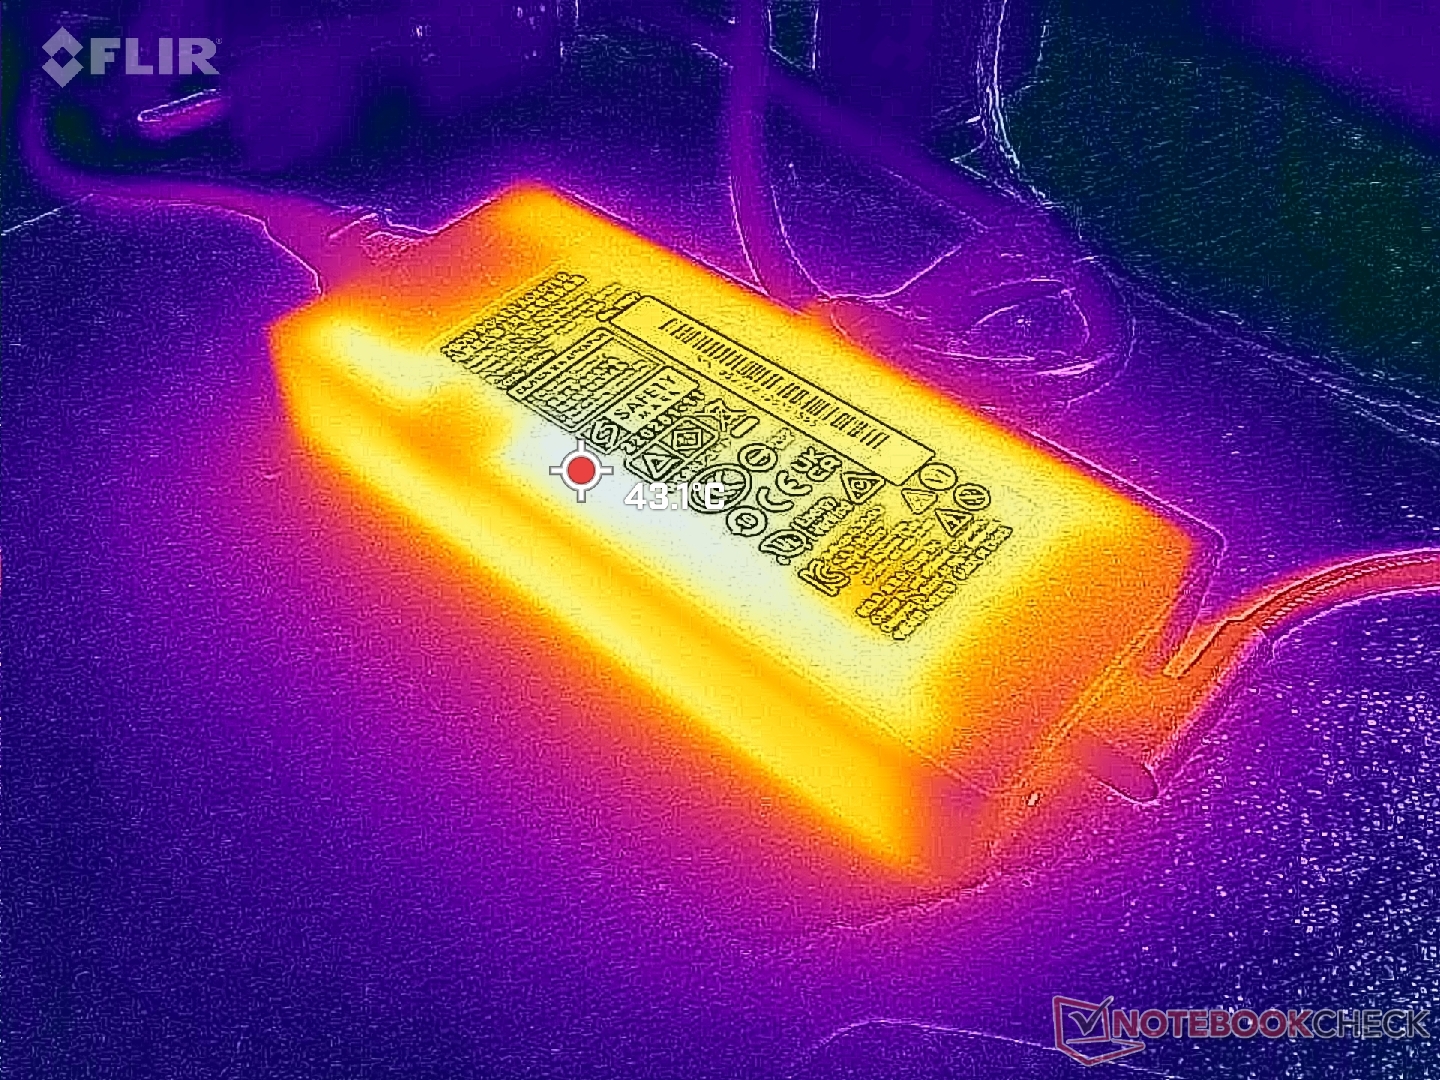
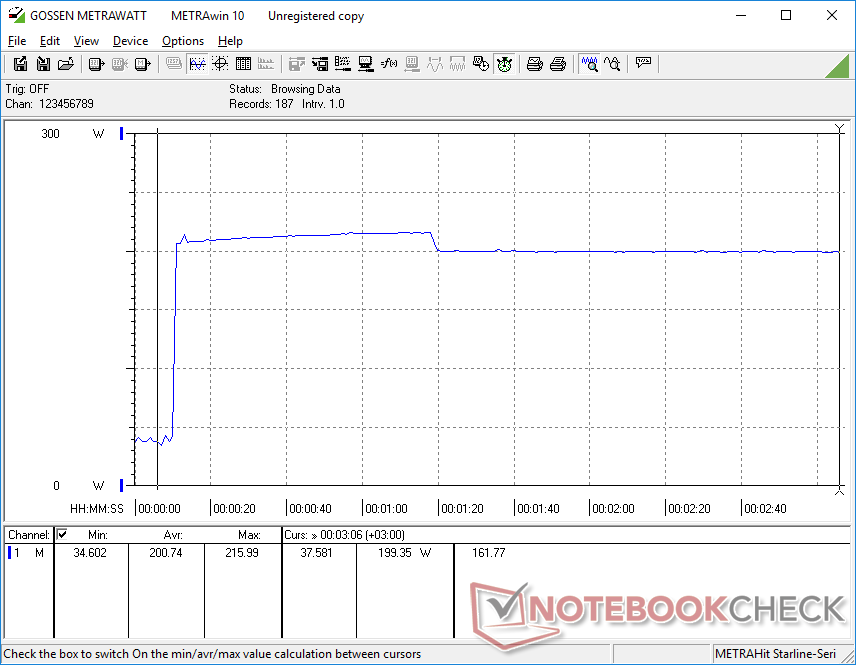
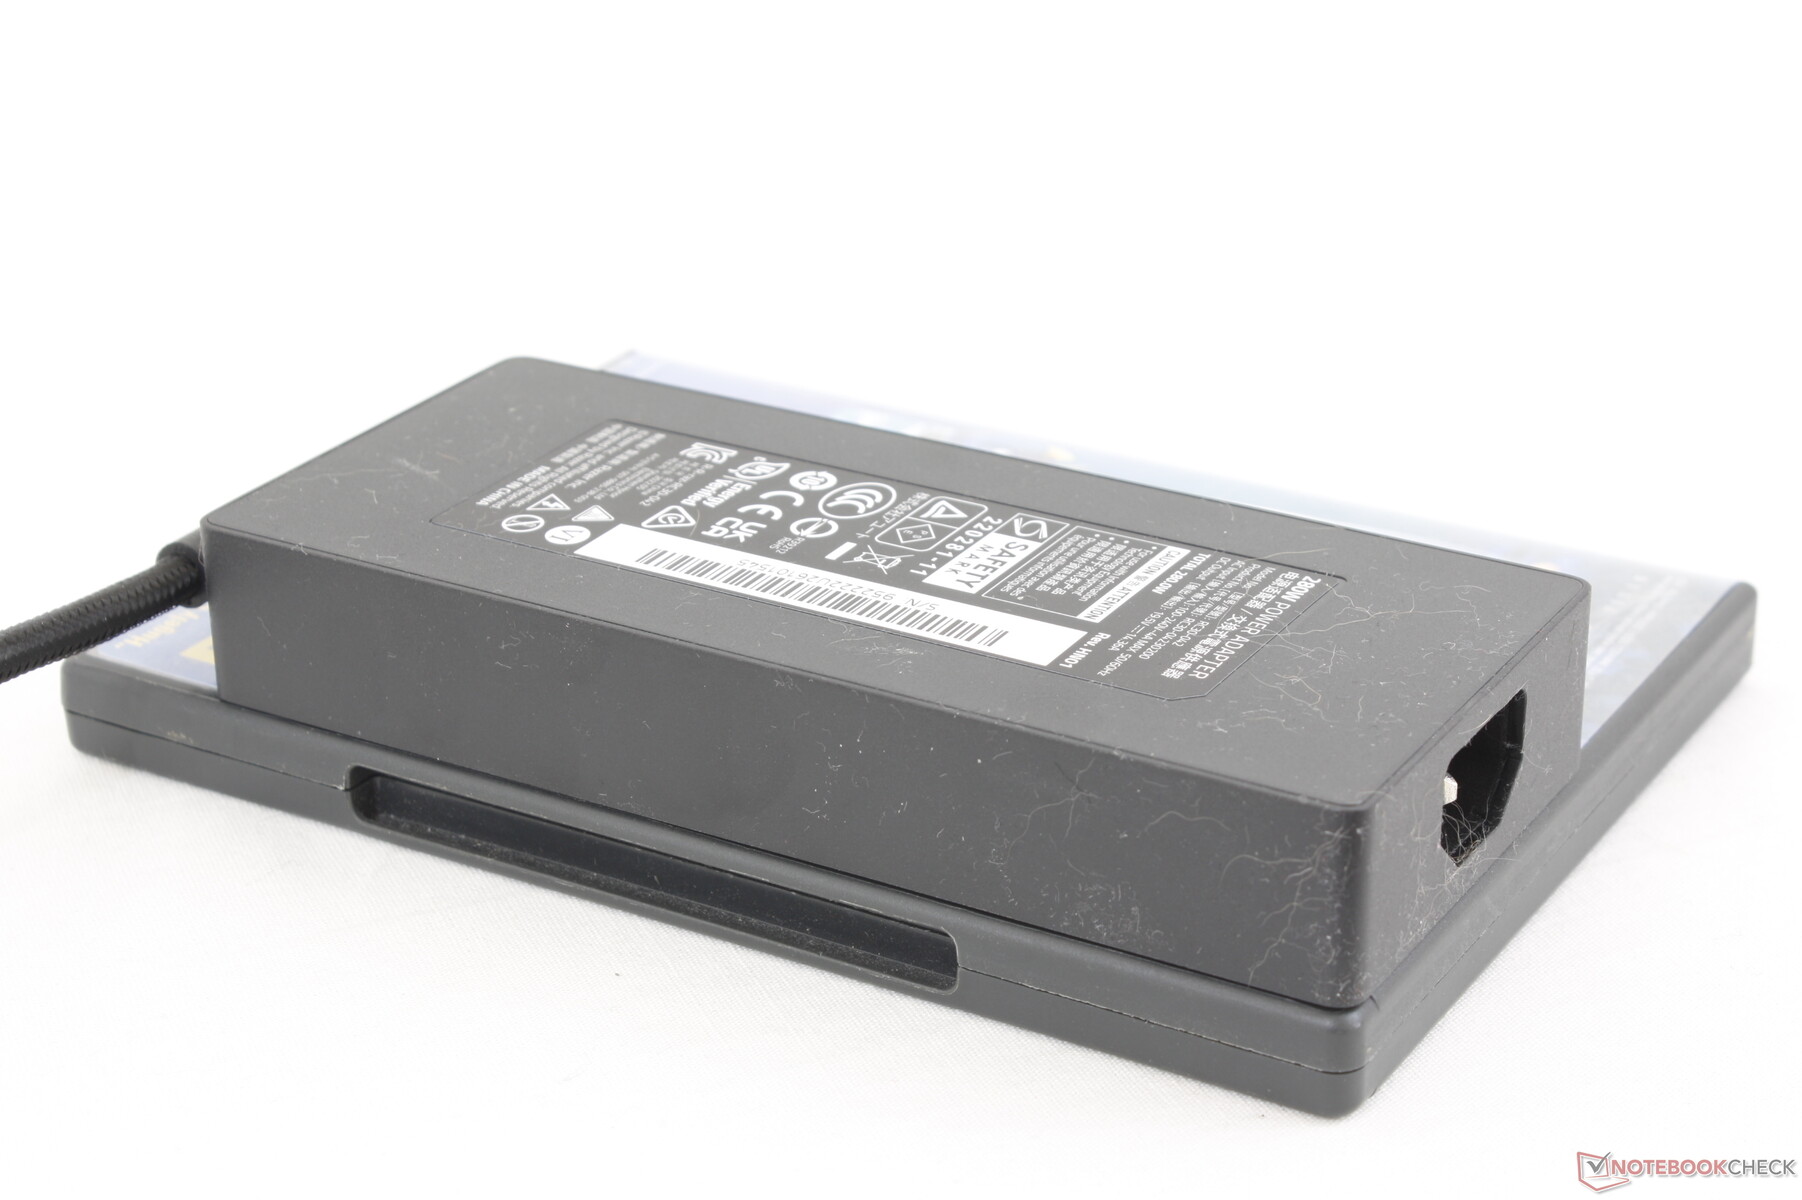
Siamo riusciti a registrare un consumo massimo temporaneo di 261 W dall'adattatore CA GaN da 280 W di dimensioni medio-piccole (~16,3 x 7 x 2,5 cm) durante l'esecuzione simultanea di Prime95 e FurMark. Tenete presente che esistono due diversi adattatori CA a seconda della configurazione: un adattatore più piccolo da 280 W per le SKU RTX 4060 e 4070 e un adattatore più grande da 330 W per le SKU RTX 4080 e 4090.
| Off / Standby | |
| Idle | |
| Sotto carico |
|
Leggenda:
min: | |
| Razer Blade 18 RTX 4070 i9-13950HX, GeForce RTX 4070 Laptop GPU, SSSTC CA6-8D1024, IPS, 2560x1600, 18" | Razer Blade 17 Early 2022 i9-12900H, GeForce RTX 3080 Ti Laptop GPU, Samsung PM9A1 MZVL21T0HCLR, IPS, 3840x2160, 17.3" | MSI Titan GT77 HX 13VI i9-13950HX, GeForce RTX 4090 Laptop GPU, Samsung PM9A1 MZVL22T0HBLB, Mini-LED, 3840x2160, 17.3" | Gigabyte G7 KE i5-12500H, GeForce RTX 3060 Laptop GPU, Gigabyte AG470S1TB-SI B10, IPS, 1920x1080, 17.3" | Alienware m17 R5 (R9 6900HX, RX 6850M XT) R9 6900HX, Radeon RX 6850M XT, SSSTC CA6-8D1024, IPS, 3840x2160, 17" | Asus ROG Strix Scar 17 SE G733CX-LL014W i9-12950HX, GeForce RTX 3080 Ti Laptop GPU, Samsung PM9A1 MZVL22T0HBLB, IPS, 2560x1440, 17.3" | |
|---|---|---|---|---|---|---|
| Power Consumption | 17% | 8% | 32% | 31% | 9% | |
| Idle Minimum * (Watt) | 24.5 | 17 31% | 14 43% | 15 39% | 13 47% | 19.3 21% |
| Idle Average * (Watt) | 34.1 | 23 33% | 21.6 37% | 17 50% | 16.5 52% | 26.5 22% |
| Idle Maximum * (Watt) | 47.7 | 34 29% | 24.8 48% | 24 50% | 17 64% | 27.1 43% |
| Load Average * (Watt) | 140 | 120 14% | 122.5 12% | 111 21% | 93 34% | 141 -1% |
| Witcher 3 ultra * (Watt) | 202 | 229 -13% | 265 -31% | 174.1 14% | 239 -18% | 225 -11% |
| Load Maximum * (Watt) | 261 | 243 7% | 418 -60% | 208 20% | 251 4% | 307.9 -18% |
* ... Meglio usare valori piccoli
Power Consumption Witcher 3 / Stresstest
Power Consumption external Monitor
Durata della batteria
Non è una coincidenza che il modello Blade più grande abbia anche la batteria più capiente della famiglia, con 91,7 Wh. Tuttavia, la durata della batteria non è necessariamente più lunga, anzi, in molti casi potrebbe addirittura essere più breve. Siamo riusciti a navigare sul web con il profilo di alimentazione bilanciato per 4 ore prima di doverlo ricaricare, un tempo inferiore di quasi un'ora rispetto al Blade 15 dello scorso anno. Riducendo la frequenza di aggiornamento del display a 60 Hz invece che a 240 Hz, la durata della batteria può essere aumentata solo marginalmente.
La ricarica da vuoto a pieno richiede circa 90 minuti. Gli utenti possono anche caricare il sistema tramite USB-C, anche se a una velocità inferiore.
| Razer Blade 18 RTX 4070 i9-13950HX, GeForce RTX 4070 Laptop GPU, 91.7 Wh | Razer Blade 17 Early 2022 i9-12900H, GeForce RTX 3080 Ti Laptop GPU, 82 Wh | MSI Titan GT77 HX 13VI i9-13950HX, GeForce RTX 4090 Laptop GPU, 99.9 Wh | Gigabyte G7 KE i5-12500H, GeForce RTX 3060 Laptop GPU, 54 Wh | Alienware m17 R5 (R9 6900HX, RX 6850M XT) R9 6900HX, Radeon RX 6850M XT, 97 Wh | Asus ROG Strix Scar 17 SE G733CX-LL014W i9-12950HX, GeForce RTX 3080 Ti Laptop GPU, 90 Wh | |
|---|---|---|---|---|---|---|
| Autonomia della batteria | 9% | 21% | 11% | 29% | 5% | |
| Reader / Idle (h) | 7 | 7.1 1% | 7.1 1% | |||
| WiFi v1.3 (h) | 4 | 3.8 -5% | 5.3 33% | 5.3 33% | 4.8 20% | 4.2 5% |
| Load (h) | 1.3 | 1.7 31% | 1.4 8% | 1.3 0% | 1.8 38% | |
| H.264 (h) | 4.8 | 6 | 2.2 | 4.9 |
Pro
Contro
Verdetto - Adoro l'hardware, odio gli errori
Siamo andati via impressionati dal Blade 16ma lo stesso non si può dire per il Blade 18. La nostra unità presentava problemi importanti, tra cui prestazioni DLSS 3 difettose su un monitor esterno, la mancanza del supporto G-Sync quando G-Sync è apparentemente incluso e un display sfarfallante potenzialmente difettoso. Abbiamo pensato di non pubblicare questa recensione fino a quando questi problemi non fossero stati risolti, ma il Blade 18 è già stato spedito ai clienti e quindi abbiamo ritenuto giusto informare i nostri lettori che potrebbero essere sul mercato. Questa pagina verrà aggiornata con un punteggio finale non appena avremo una soluzione adeguata da parte del produttore.
Il Blade 18 ha il potenziale per essere un'altra eccellente aggiunta alla famiglia Blade, se si guarda al di là dei problemi di cui sopra. Il display da 18 pollici è splendido e massiccio rispetto all'ingombro e al peso. Il fatto che il sistema non sia molto più grande o più pesante del Blade 17 Recensione del Razer Blade 17 (inizio 2022): Elegante portatile gaming 4k con schermo luminoso dovrebbe renderlo molto interessante per gli utenti che potrebbero già prendere in considerazione un Blade 17 o un altro portatile da gioco da 17 pollici. L'adattatore CA GaN, di dimensioni relativamente ridotte, contribuisce ulteriormente a rendere il Blade 18 un ibrido portatile-DTR.
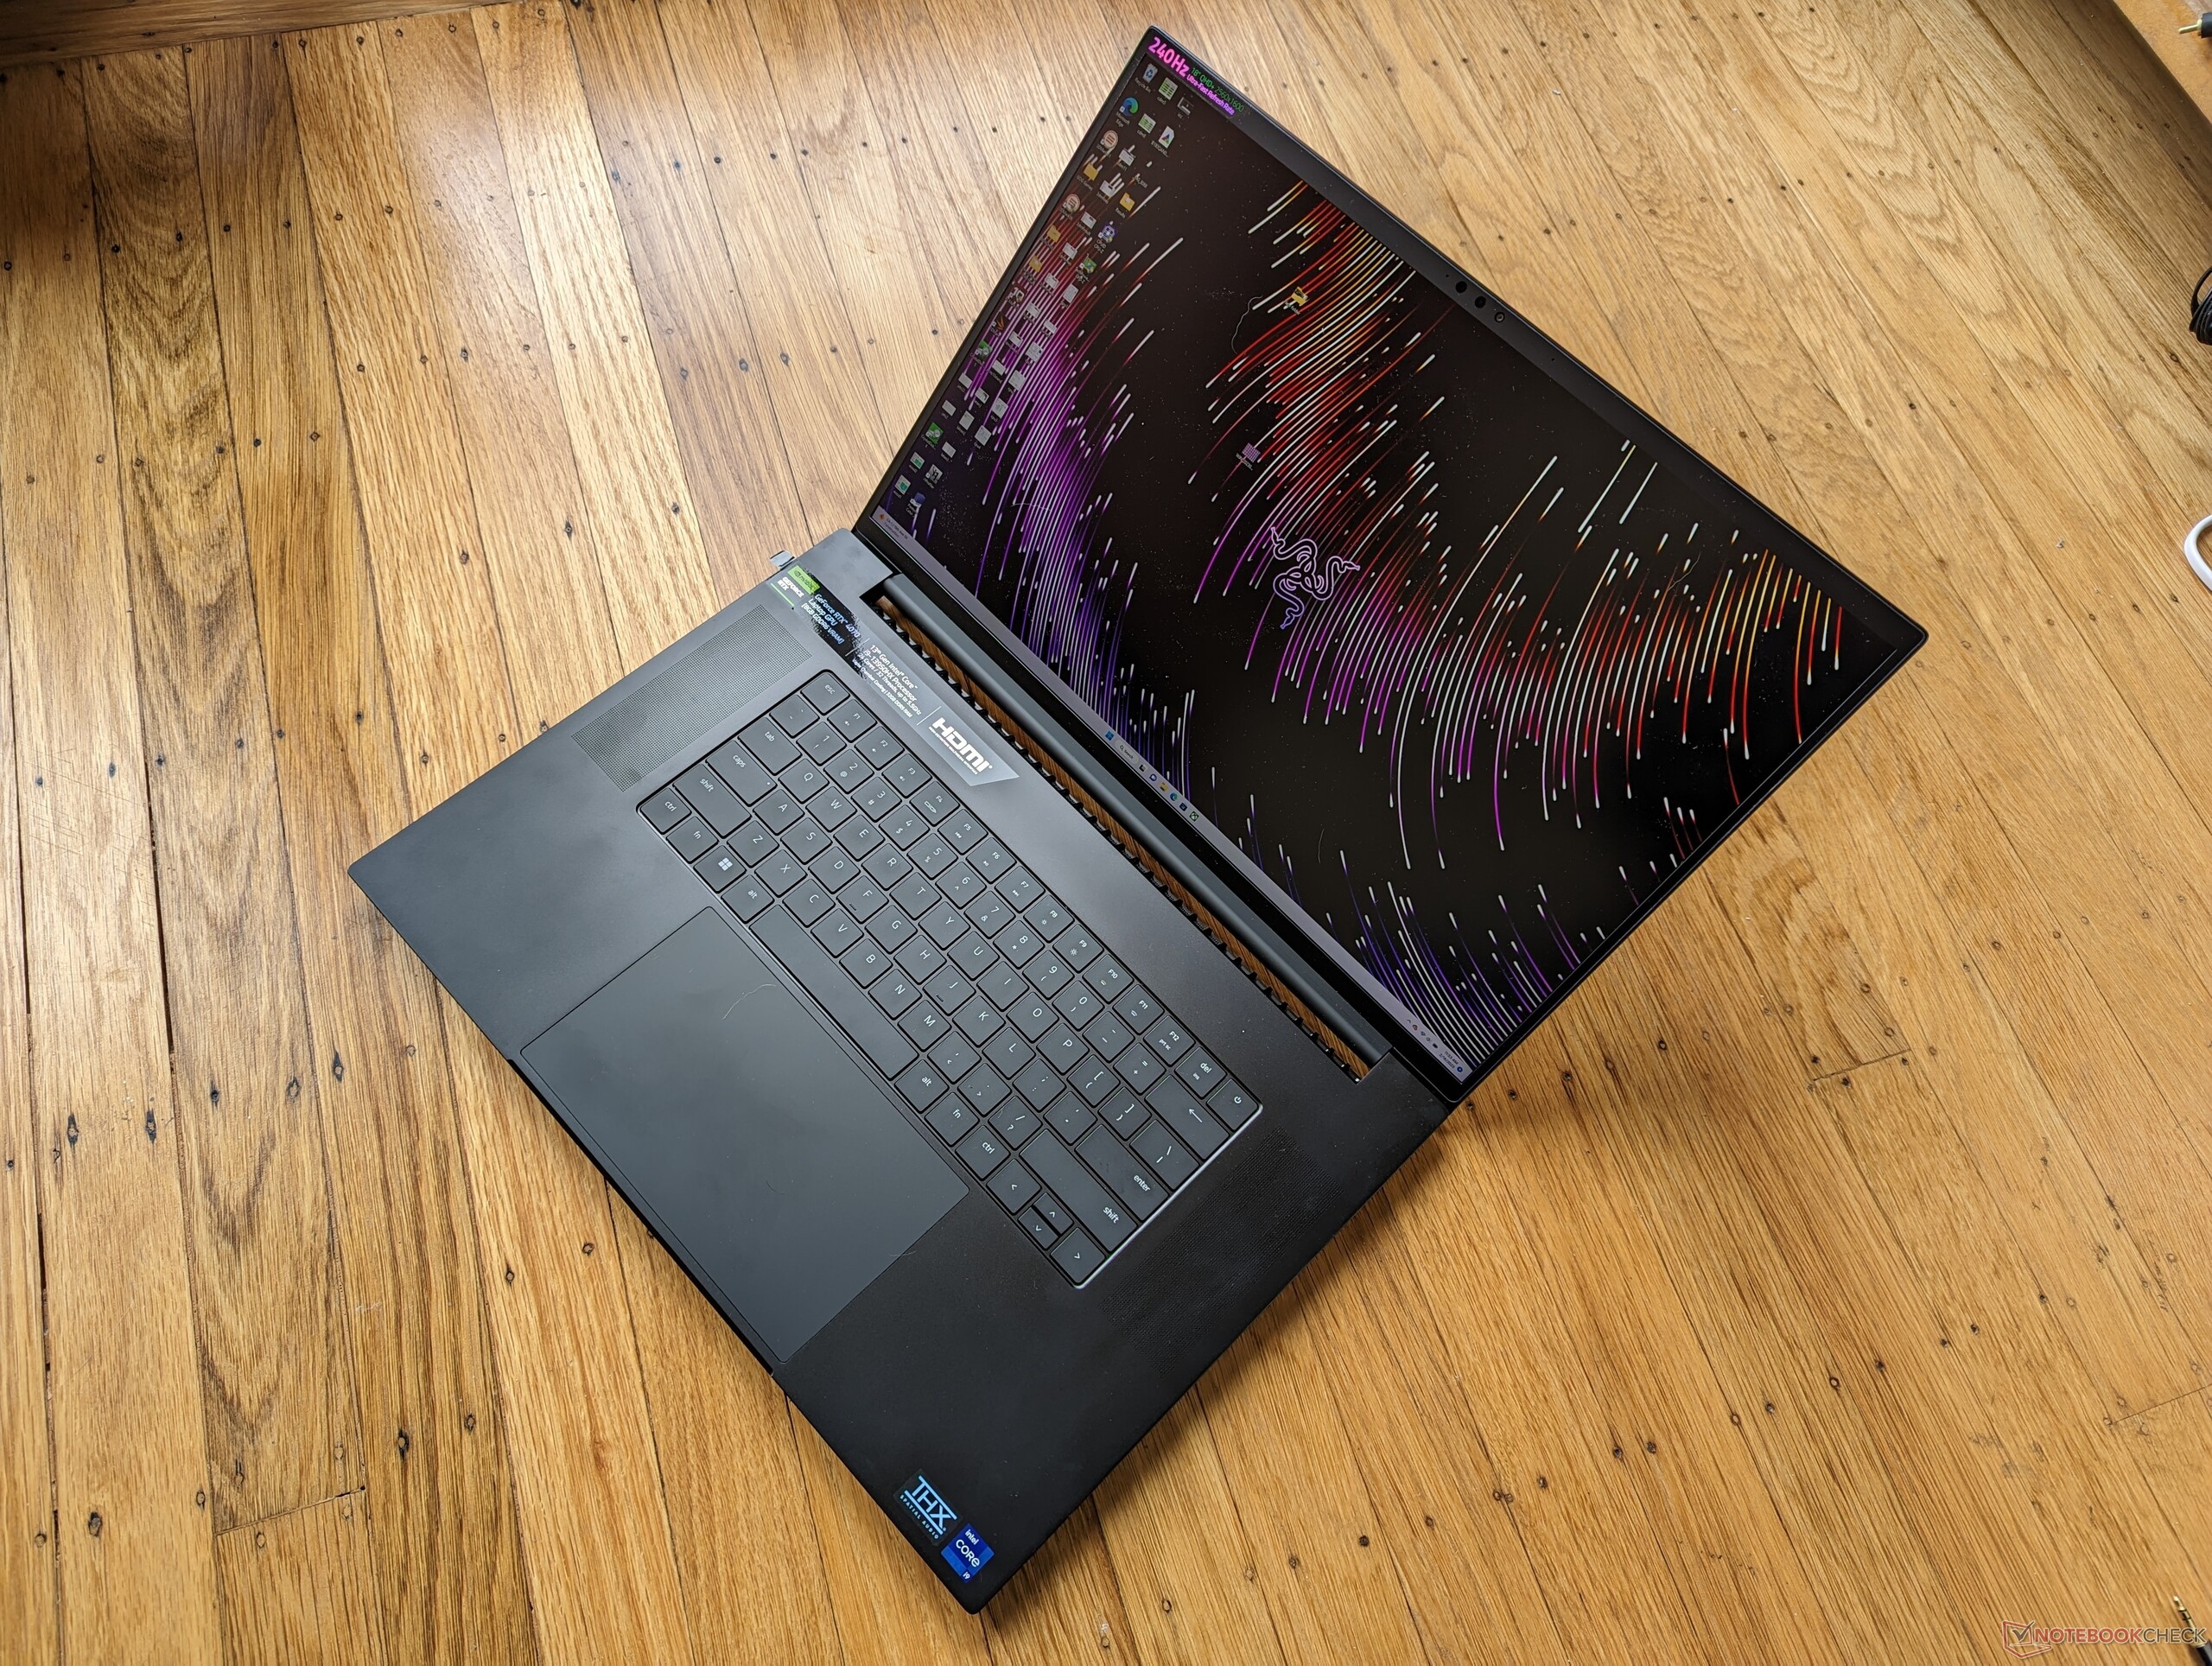
Il Blade 18 può sembrare enorme all'inizio, ma in realtà non è molto più grande del Blade 17 esistente. L'ampio schermo e l'elevato rapporto schermo/corpo sono impressionanti.
Per quanto riguarda la RTX 4070 mobile, le sue prestazioni possono essere insoddisfacenti a seconda del gioco. I titoli che supportano DLSS 3 girano come il burro sulla RTX 4070 mobile. Altrimenti, le prestazioni sono simili a quelle della RTX 3080 mobile dello scorso anno o di una RTX 3070 desktop. Fortunatamente, l'elenco dei titoli che supportano il DLSS 3 è in continua espansione.
Si tratta di un inizio complessivamente forte per la serie Blade da 18 pollici, ma con alcuni problemi di lancio. Gli imminenti Asus ROG Strix Scar 18 e Dell Alienware m18 potrebbero mettere in difficoltà il Blade 18 se non vengono risolti alcuni problemi chiave.
Prezzo e disponibilità
Il Blade 18 è ora in spedizione presso i principali canali, tra cui Amazon, , Newegg e Best Buye Best Buy. L'acquisto direttamente da Razer offre le opzioni più configurabili. La nostra configurazione è disponibile a 3.200 dollari.
Transparency
La selezione dei dispositivi da recensire viene effettuata dalla nostra redazione. Il campione di prova è stato fornito all'autore come prestito dal produttore o dal rivenditore ai fini di questa recensione. L'istituto di credito non ha avuto alcuna influenza su questa recensione, né il produttore ne ha ricevuto una copia prima della pubblicazione. Non vi era alcun obbligo di pubblicare questa recensione. In quanto società mediatica indipendente, Notebookcheck non è soggetta all'autorità di produttori, rivenditori o editori.
Ecco come Notebookcheck esegue i test
Ogni anno, Notebookcheck esamina in modo indipendente centinaia di laptop e smartphone utilizzando procedure standardizzate per garantire che tutti i risultati siano comparabili. Da circa 20 anni sviluppiamo continuamente i nostri metodi di prova e nel frattempo stabiliamo gli standard di settore. Nei nostri laboratori di prova, tecnici ed editori esperti utilizzano apparecchiature di misurazione di alta qualità. Questi test comportano un processo di validazione in più fasi. Il nostro complesso sistema di valutazione si basa su centinaia di misurazioni e parametri di riferimento ben fondati, che mantengono l'obiettività.Price comparison

