Recensione Intel Alder Lake-S: Intel ha di nuovo la CPU da gioco più veloce?
Intel ha molti piani conAlder Lake-S. Per anni, Intel è stata lo standard di riferimento per la CPU da gioco più veloce, fino a quando AMD ha accelerato le cose con il suo Ryzen 5000 e ha preso la corona. Per l'utente finale, questo gioco del gatto e del topo ha molti vantaggi, poiché aiuta a ottenere miglioramenti più rapidamente alle masse.
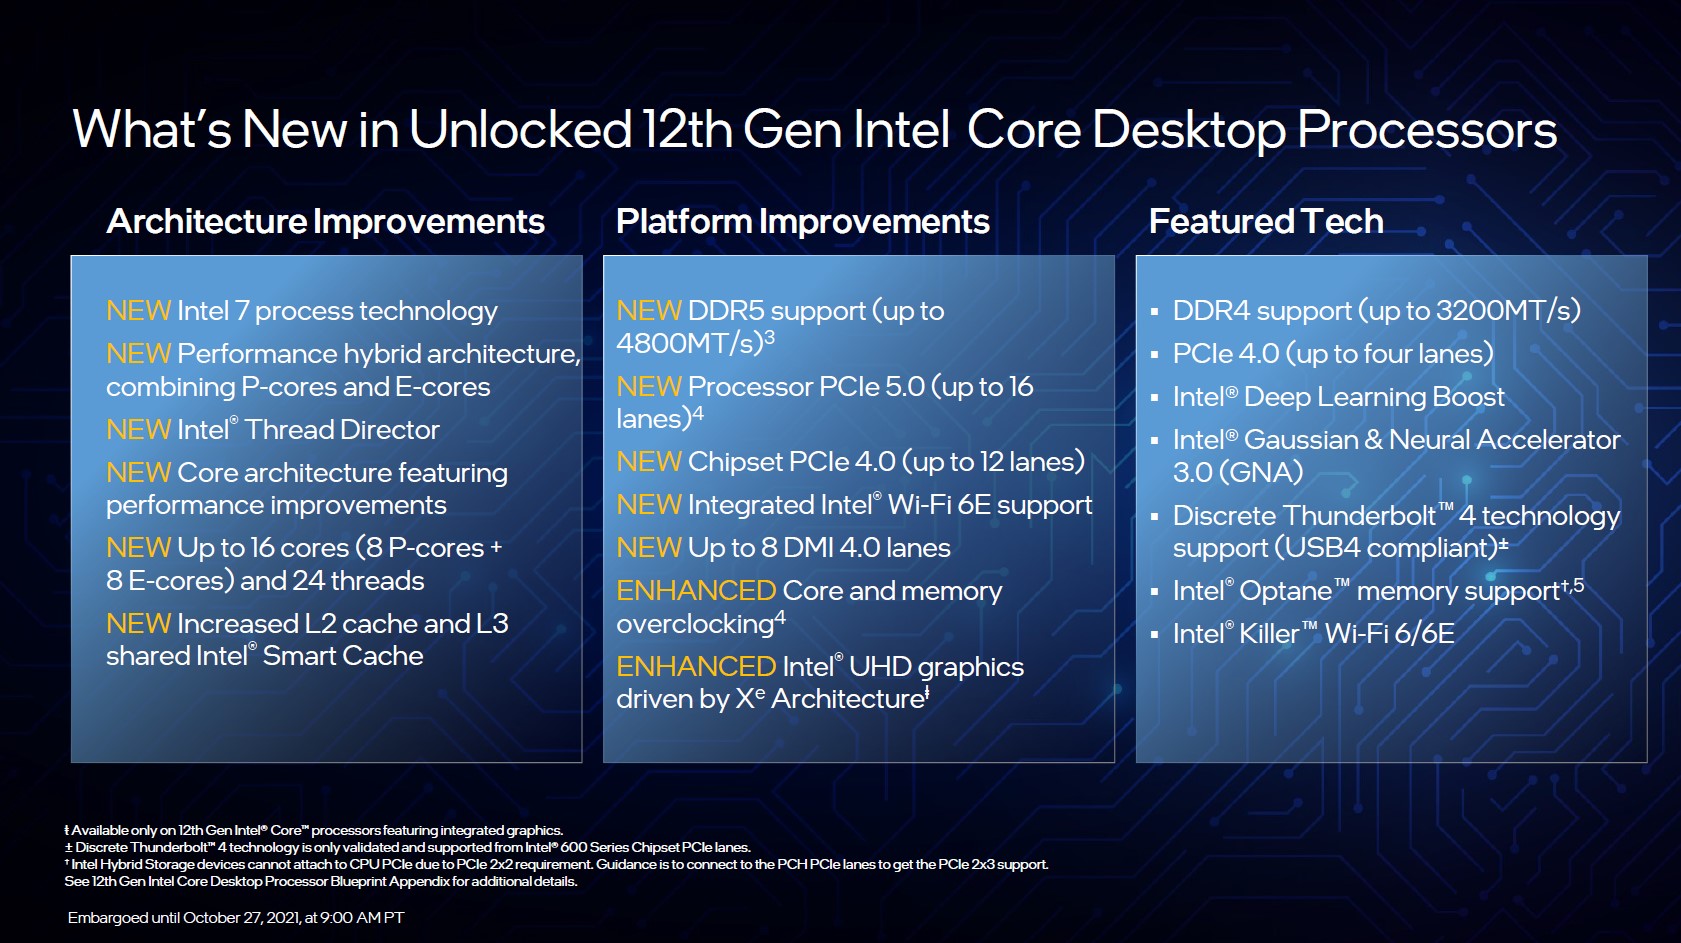
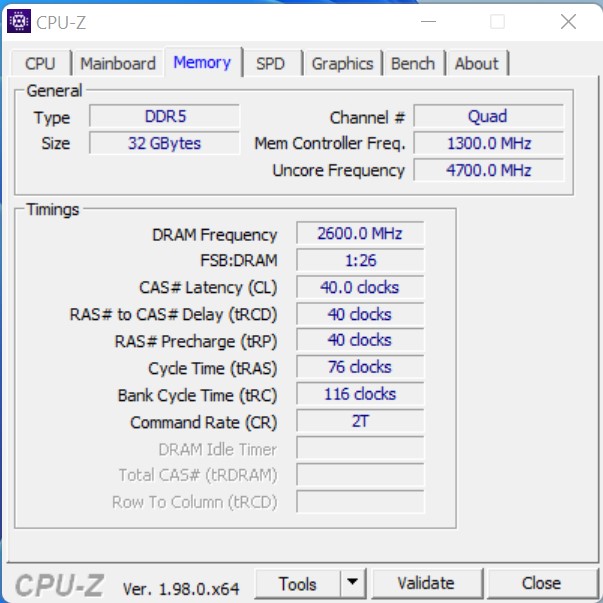
Con i nuovi processori per il segmento desktop e la dodicesima generazione della serie Core, Intel introduce nuovamente un cambio di piattaforma: dopo Comet Lake-S e Rocket Lack-S, LGA1200 è già storia, e il più grande socket LGA 1700 prende il sopravvento. I miglioramenti più noti sono il supporto DDR5 e PCIe 5.0. Tuttavia, a questo punto non ci sono ancora prodotti disponibili che possono utilizzare questa larghezza di banda completa. Questo rende l'investimento nella piattaforma un investimento che può essere utilizzato solo in futuro. Le cose sembrano un po' meglio nella memoria di lavoro. Coloro che vogliono unirsi alla nuova tendenza e ottenere le migliori prestazioni non potranno aggirare la nuova memoria di lavoro DDR5. Ma i processori Intel Alder Lake-S supportano anche la RAM DDR4. Puoi trovare le schede corrispondenti in vendita anche con il nuovo chipset Z690 di fascia alta.
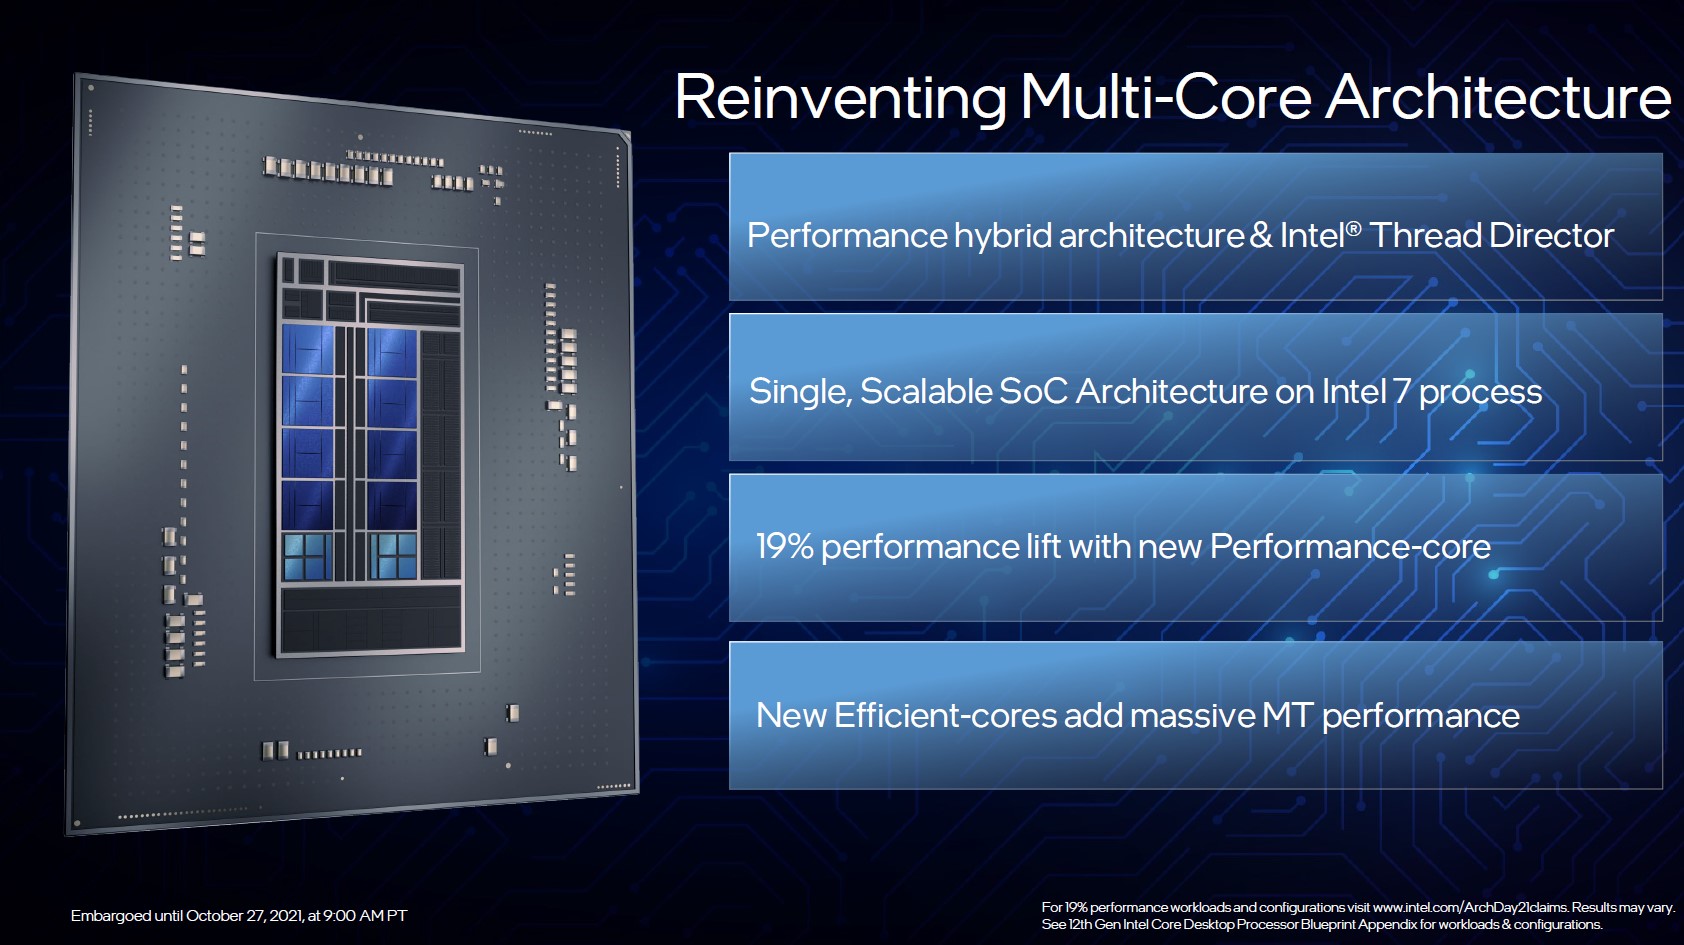
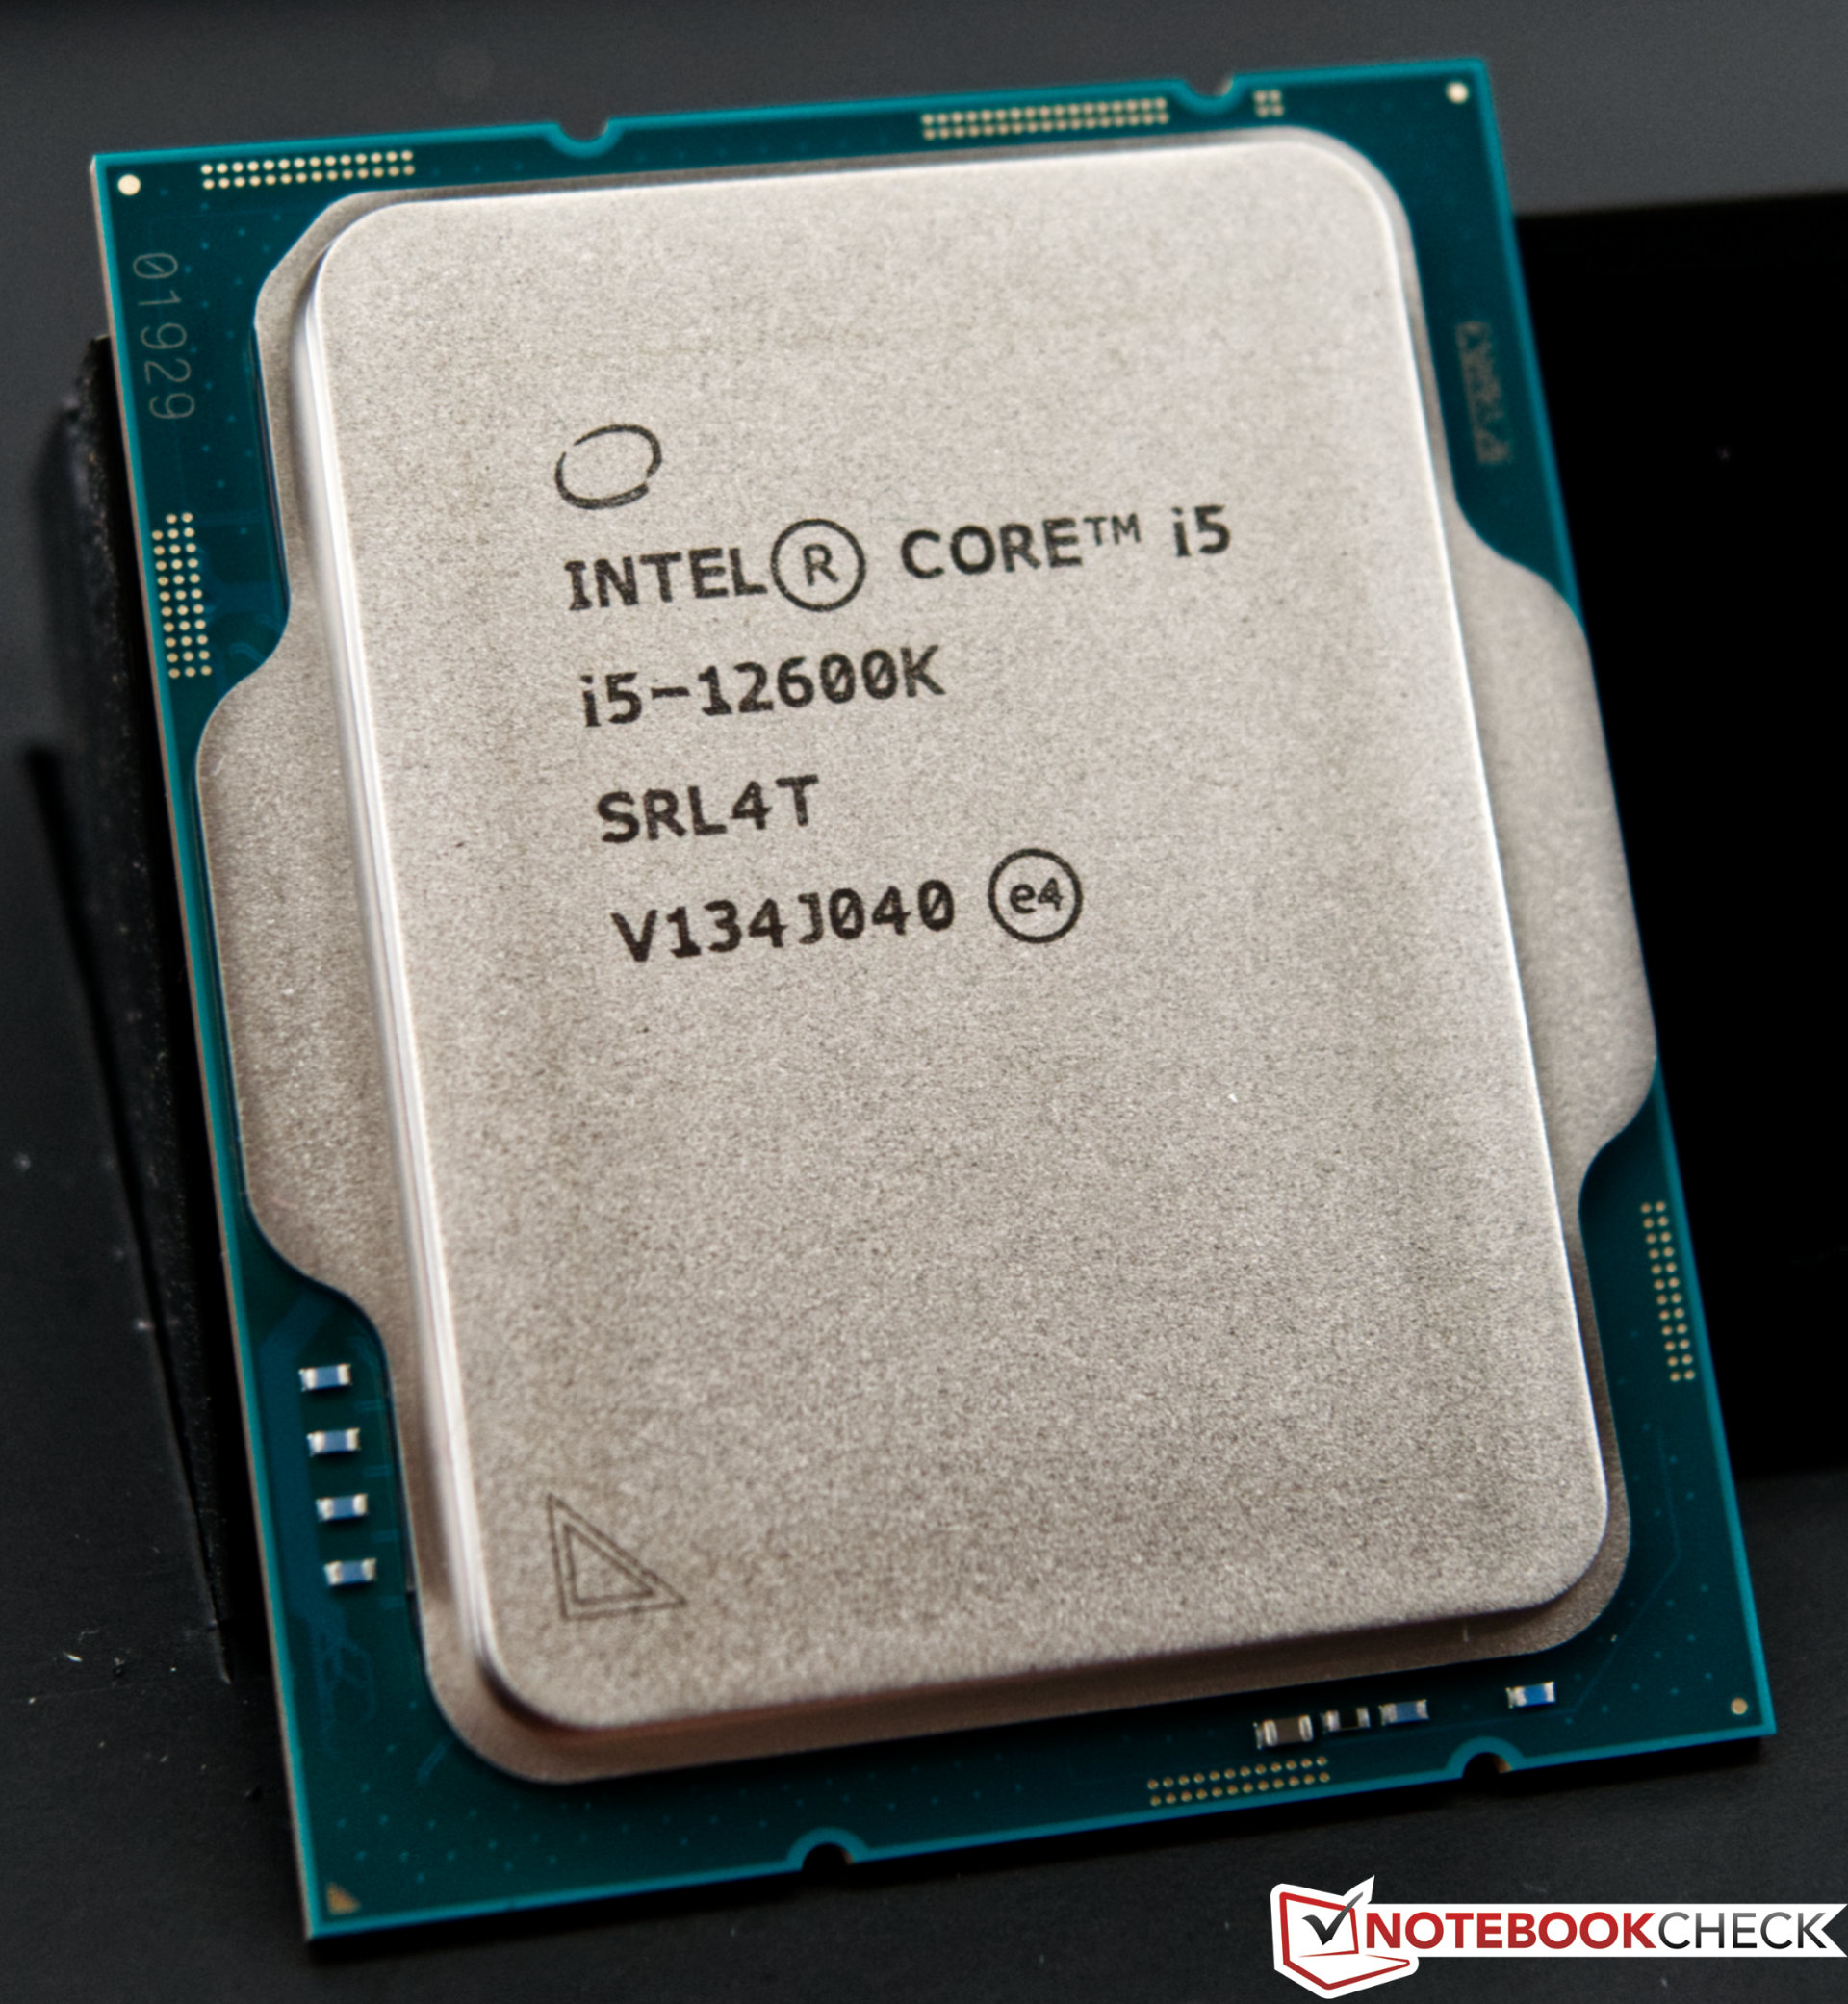
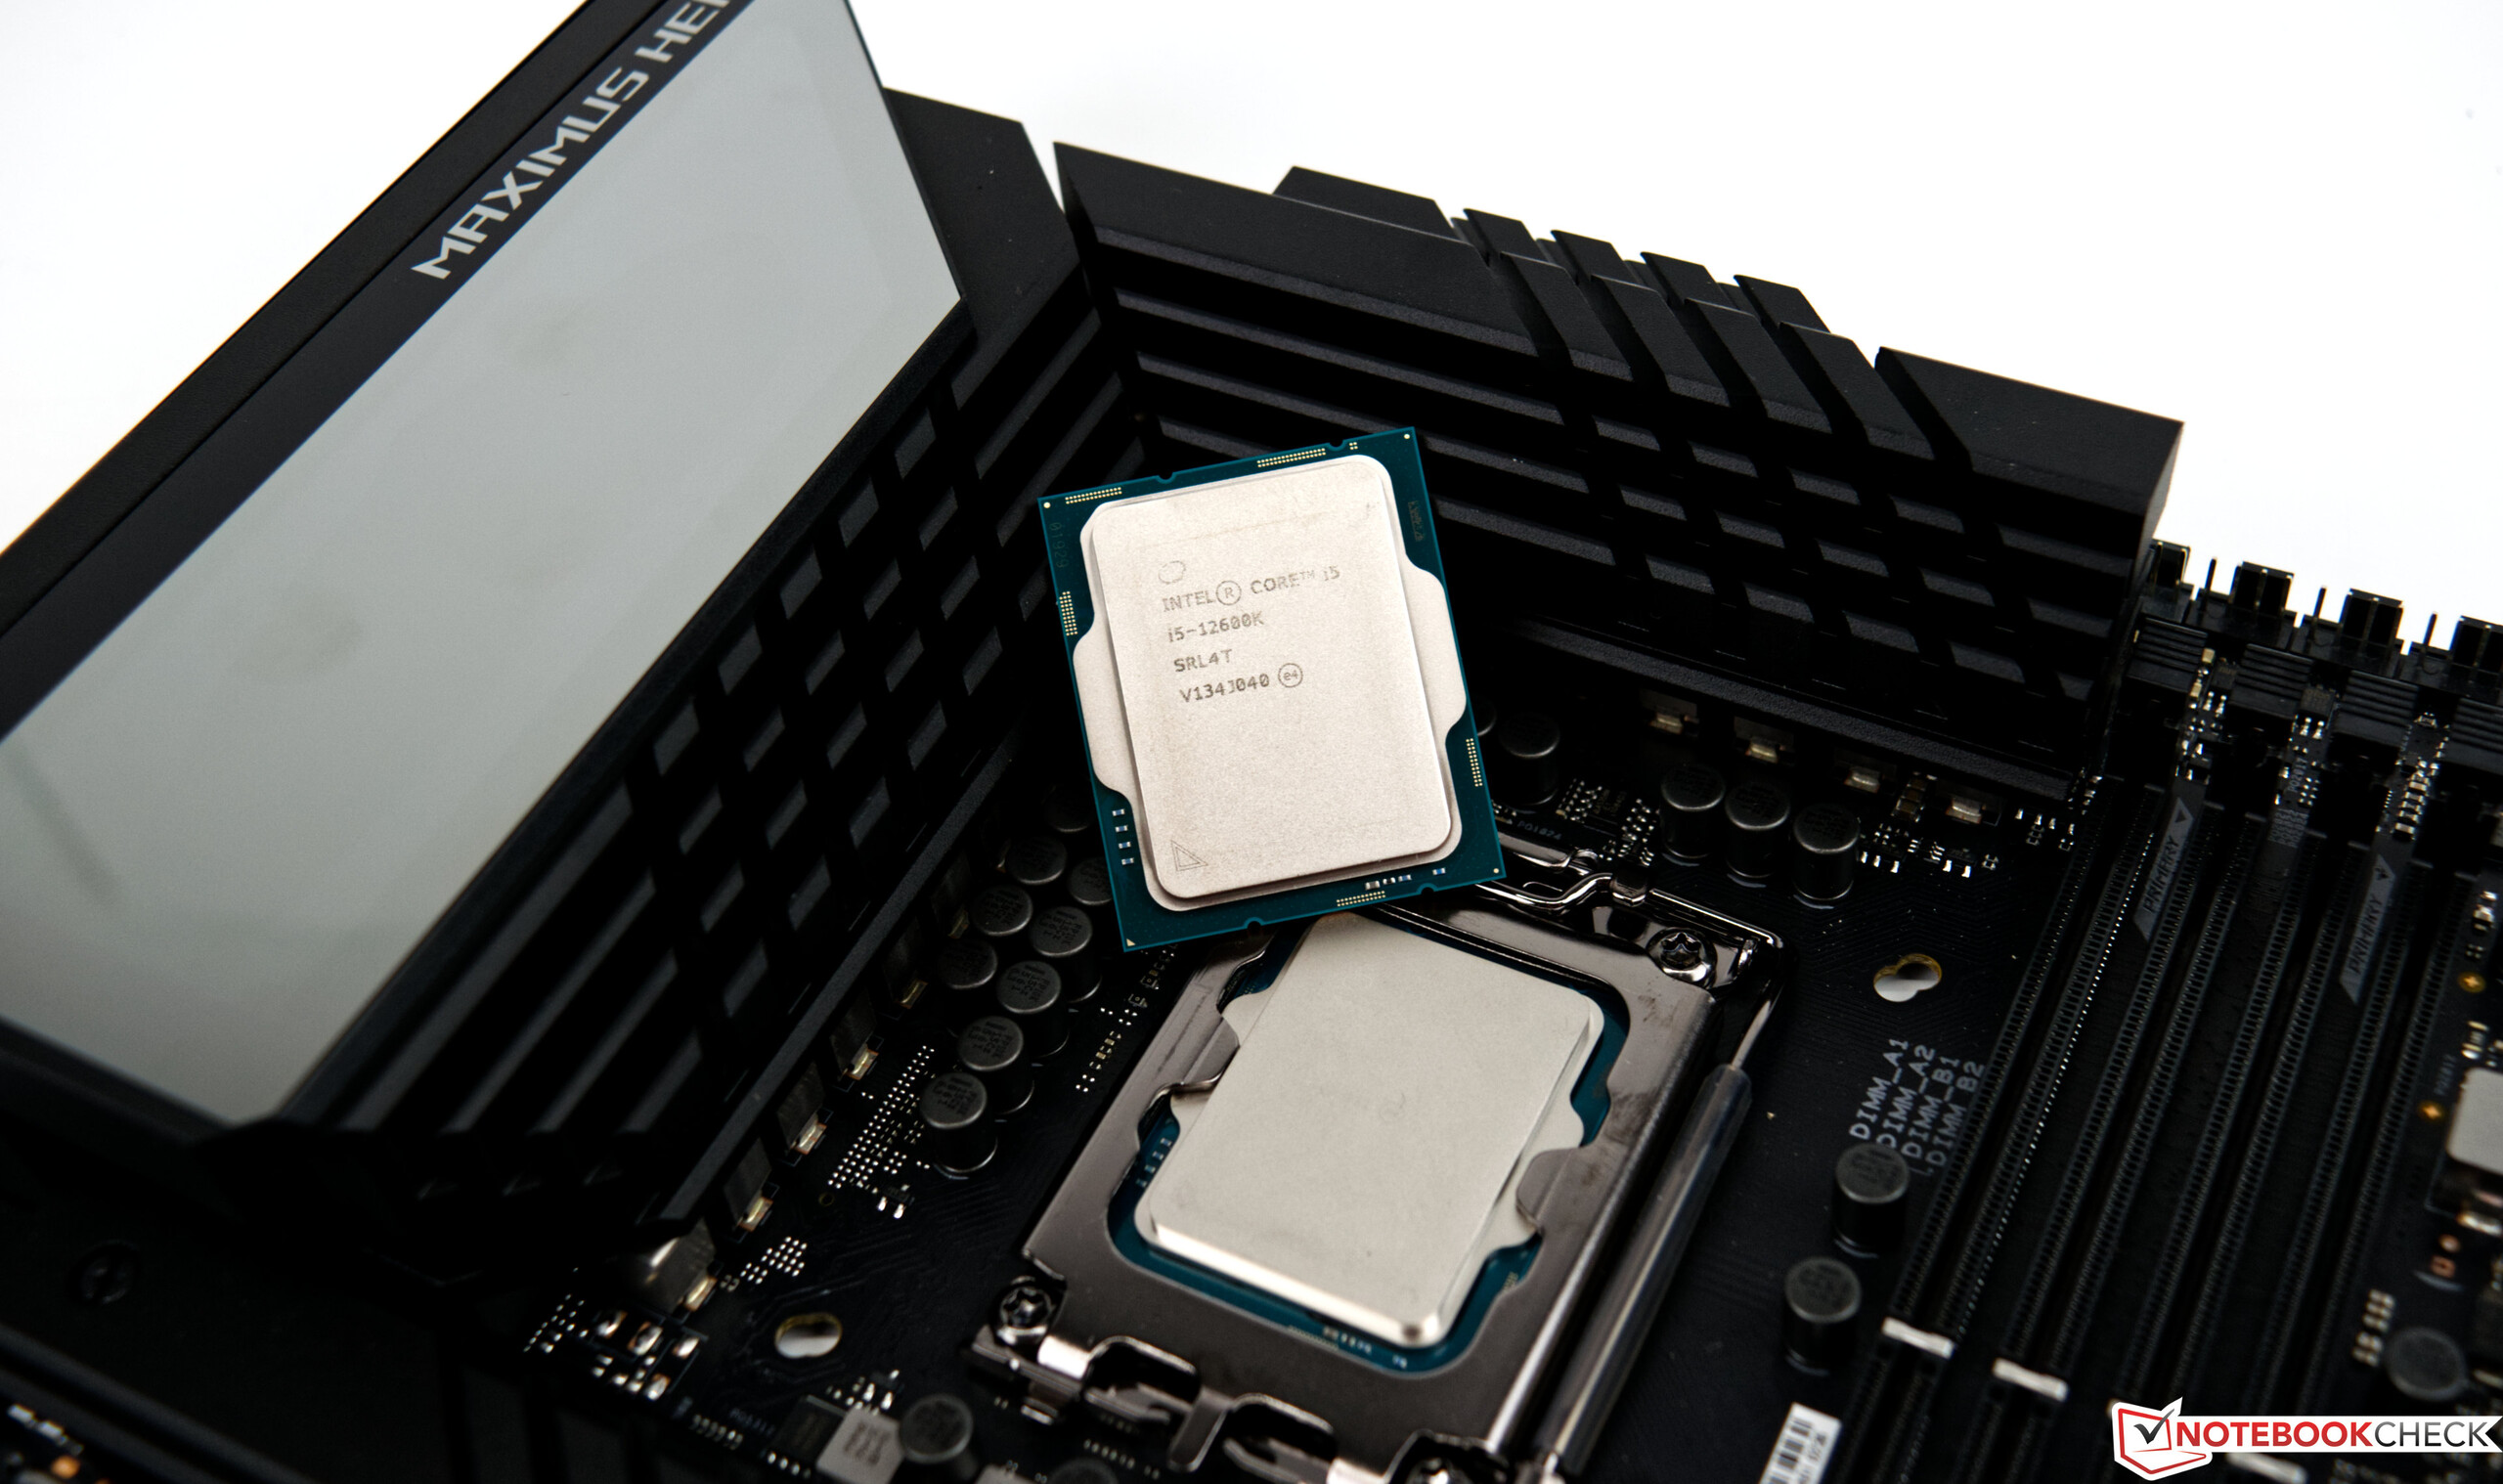
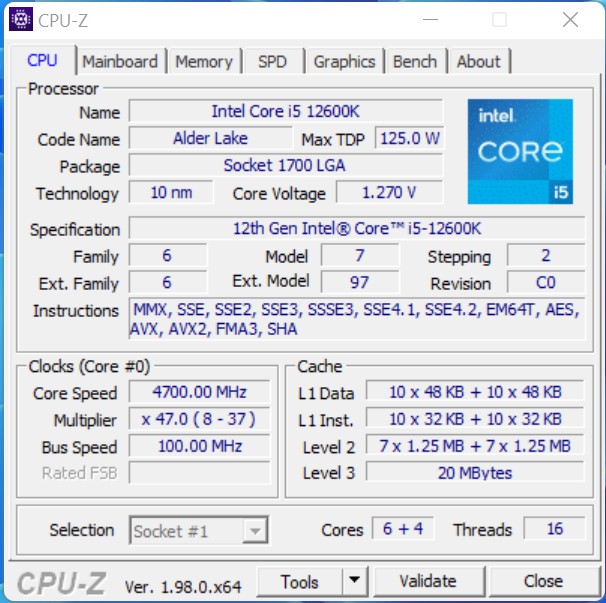
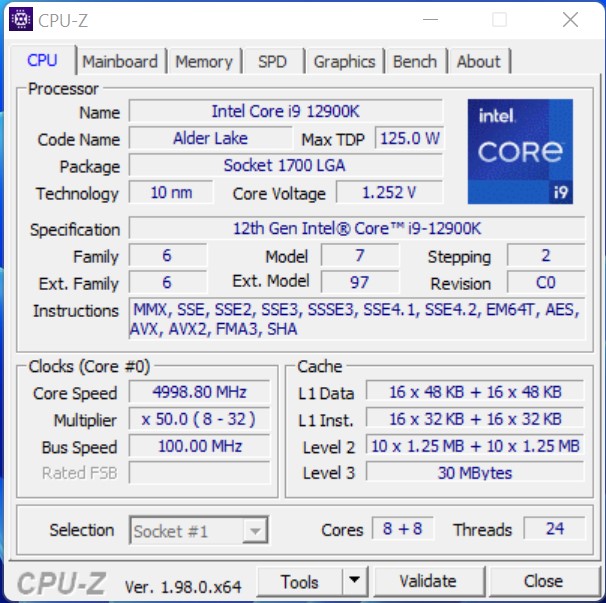
Con Alder Lake-S, Intel fa un grande passo avanti che non è solo un piccolo refresh di Rocket Lake-S. Il nuovo design è diviso in core di prestazioni, i cosiddetti core P, e core ad alta efficienza energetica, i core E. Questo permette al modello di punta di gestire 24 threads, risultanti da 8 P-cores incluso hyperthreading (HT) e 8 E-cores senza HT. Nel più piccolo Intel Core i5-12600K, che stiamo anche esaminando in questa recensione, sono 6 P-cores e 4 E-cores, risultanti in 16 threads. I nuovi E-cores dovrebbero togliere un po' di carico dai P-cores, liberandoli per offrire prestazioni di calcolo sufficienti per applicazioni esigenti mentre gli E-cores gestiscono i processi in background. Ma gli E-cores non sono affatto unità di calcolo lente, e le loro prestazioni sono al livello di Skylake. La gestione ottimale dei core è gestita dall'Intel Thread Director. Windows 11 come sistema operativo è un requisito per un utilizzo ottimale.
Abbiamo raccolto i più importanti rappresentanti della nuova famiglia Alder Lake-S per voi nella lista qui sotto
I processori Core della serie Alder Lake-S in sintesi
| Modello | Core / Threads |
Velocità di clock P-Core / Turbo | Turbo 3.0 | Velocità di clock E-Core / Turbo | Cache L2 + L3 | Grafica | PBP | MTB | Prezzo (SRP) |
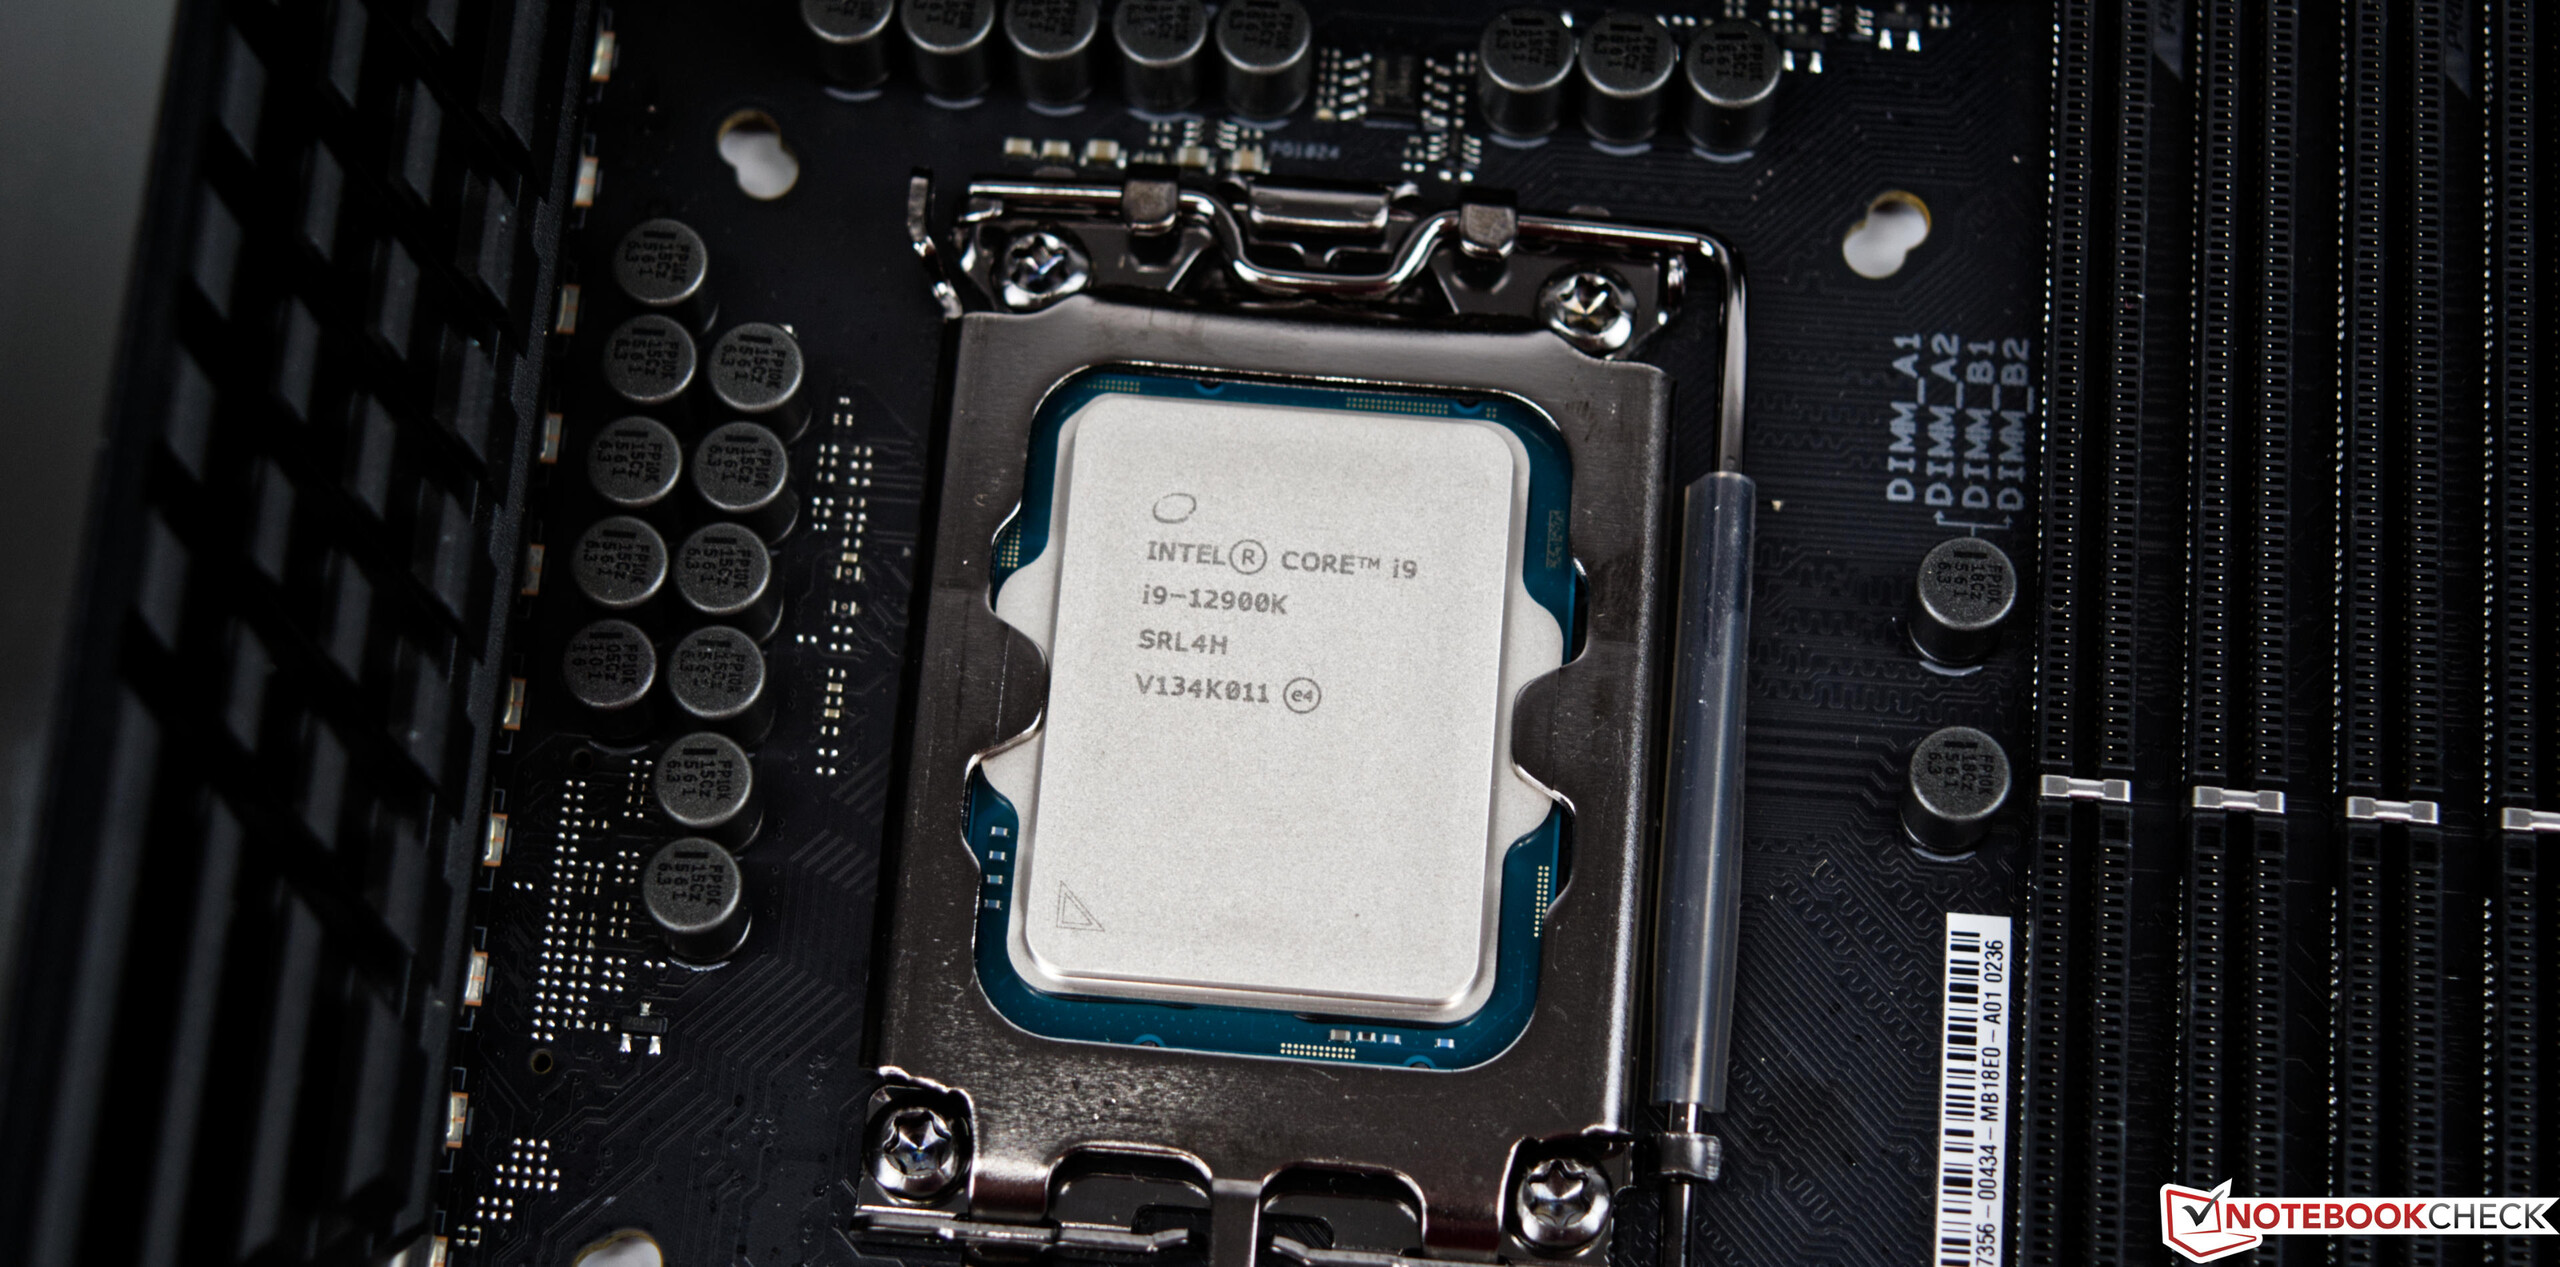
| Core i9-12900K | 16(8P + 8E) /24 | 3.2 GHz / 5.1 GHz | 5.2 GHz | 2.4 GHz / 3.9 GHz | 14+ 30 MB | UHD770 | 125Watt | 241Watt | $ 589 |
| Core i9-12900KF | 16 (8P + 8E) /24 | 3.2 GHz / 5.1 GHz | 5.2 GHz | 2.4 GHz / 3.9 GHz | 14 + 30 MB | - | 125 Watt | 241 Watt | $ 564 |
| Core i7-12700K | 12 (8P + 4E) /20 | 3.6 GHz / 4.9 GHz | 5.0 GHz | 2.7 GHz / 3.8 GHz | 12 + 25 MB | UHD 770 | 125 Watt | 190 Watt | $ 409 |
| Core i7-12700KF | 12 (8P + 4E) /20 | 3.6 GHz / 4.9 GHz | 5.0 GHz | 2.7 GHz / 3.8 GHz | 12 + 25 MB | - | 125 Watt | 190 Watt | $ 384 |
| Core i5-12600K | 10(6P + 4E) /16 | 3.7 GHz / 4.9 GHz | - | 2.8 GHz / 3.6 GHz | 9.5 + 20 MB | UHD770 | 125Watt | 150Watt | $ 289 |
| Core i5-12600KF | 10 (6P + 4E) /16 | 3,7 GHz / 4,9 GHz | - | 2,8 GHz / 3,6 GHz | 9,5 + 20 MB | - | 125 Watt | 150 Watt | $ 264 |
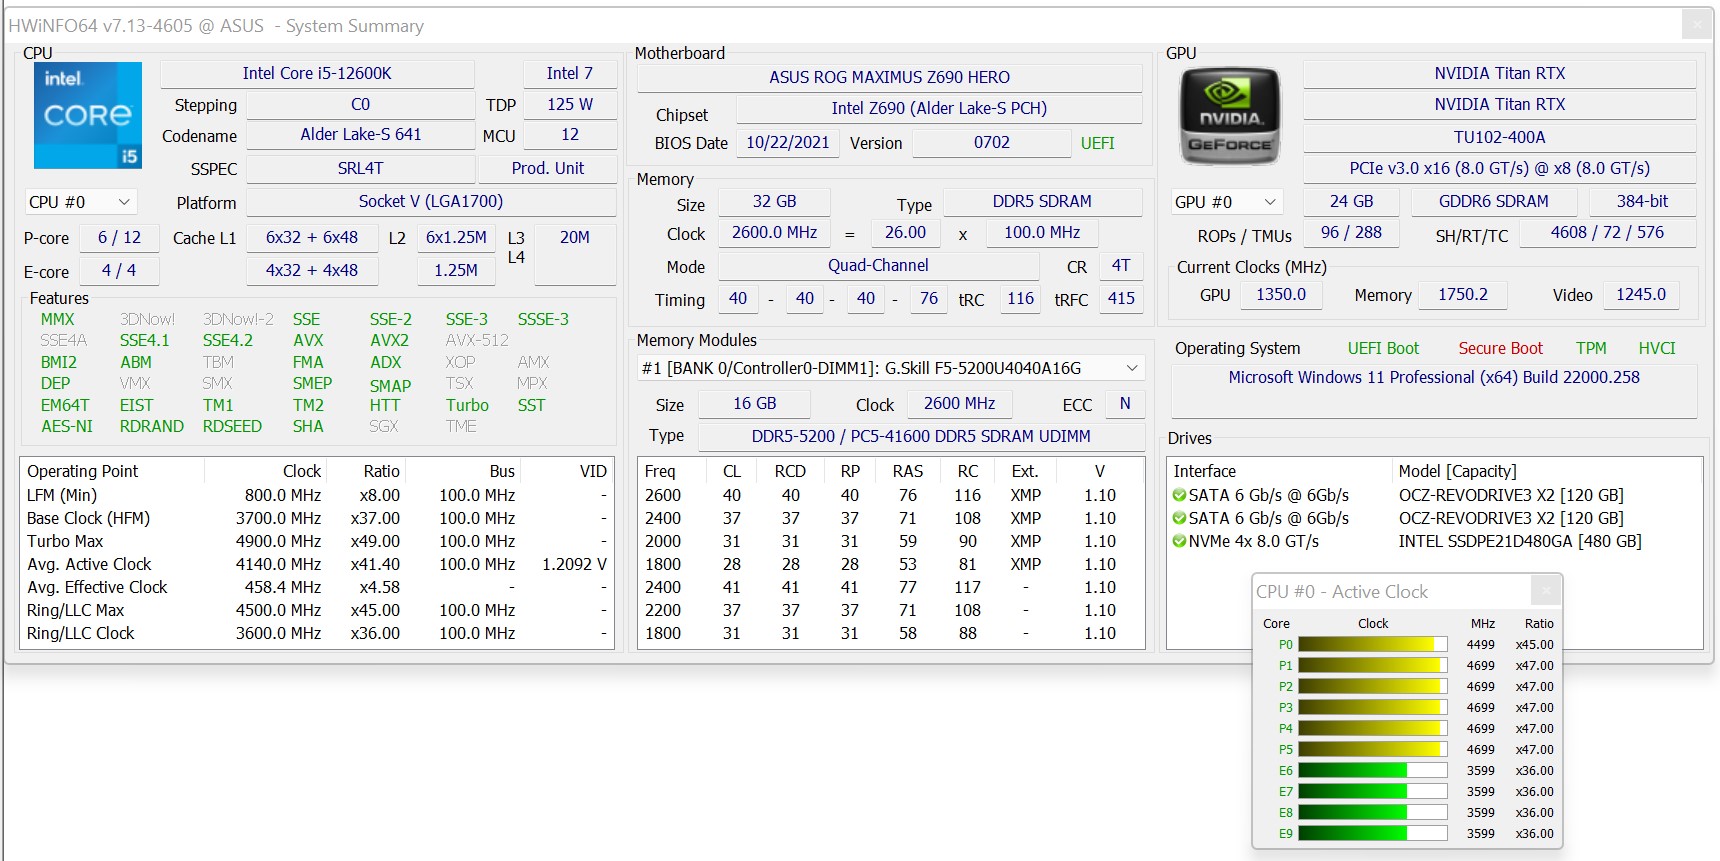
Dettagli del nostro sistema di test
Usiamo il seguente sistema per i nostri benchmark e test qui sotto:
- Banchi di prova Raijintek Pean
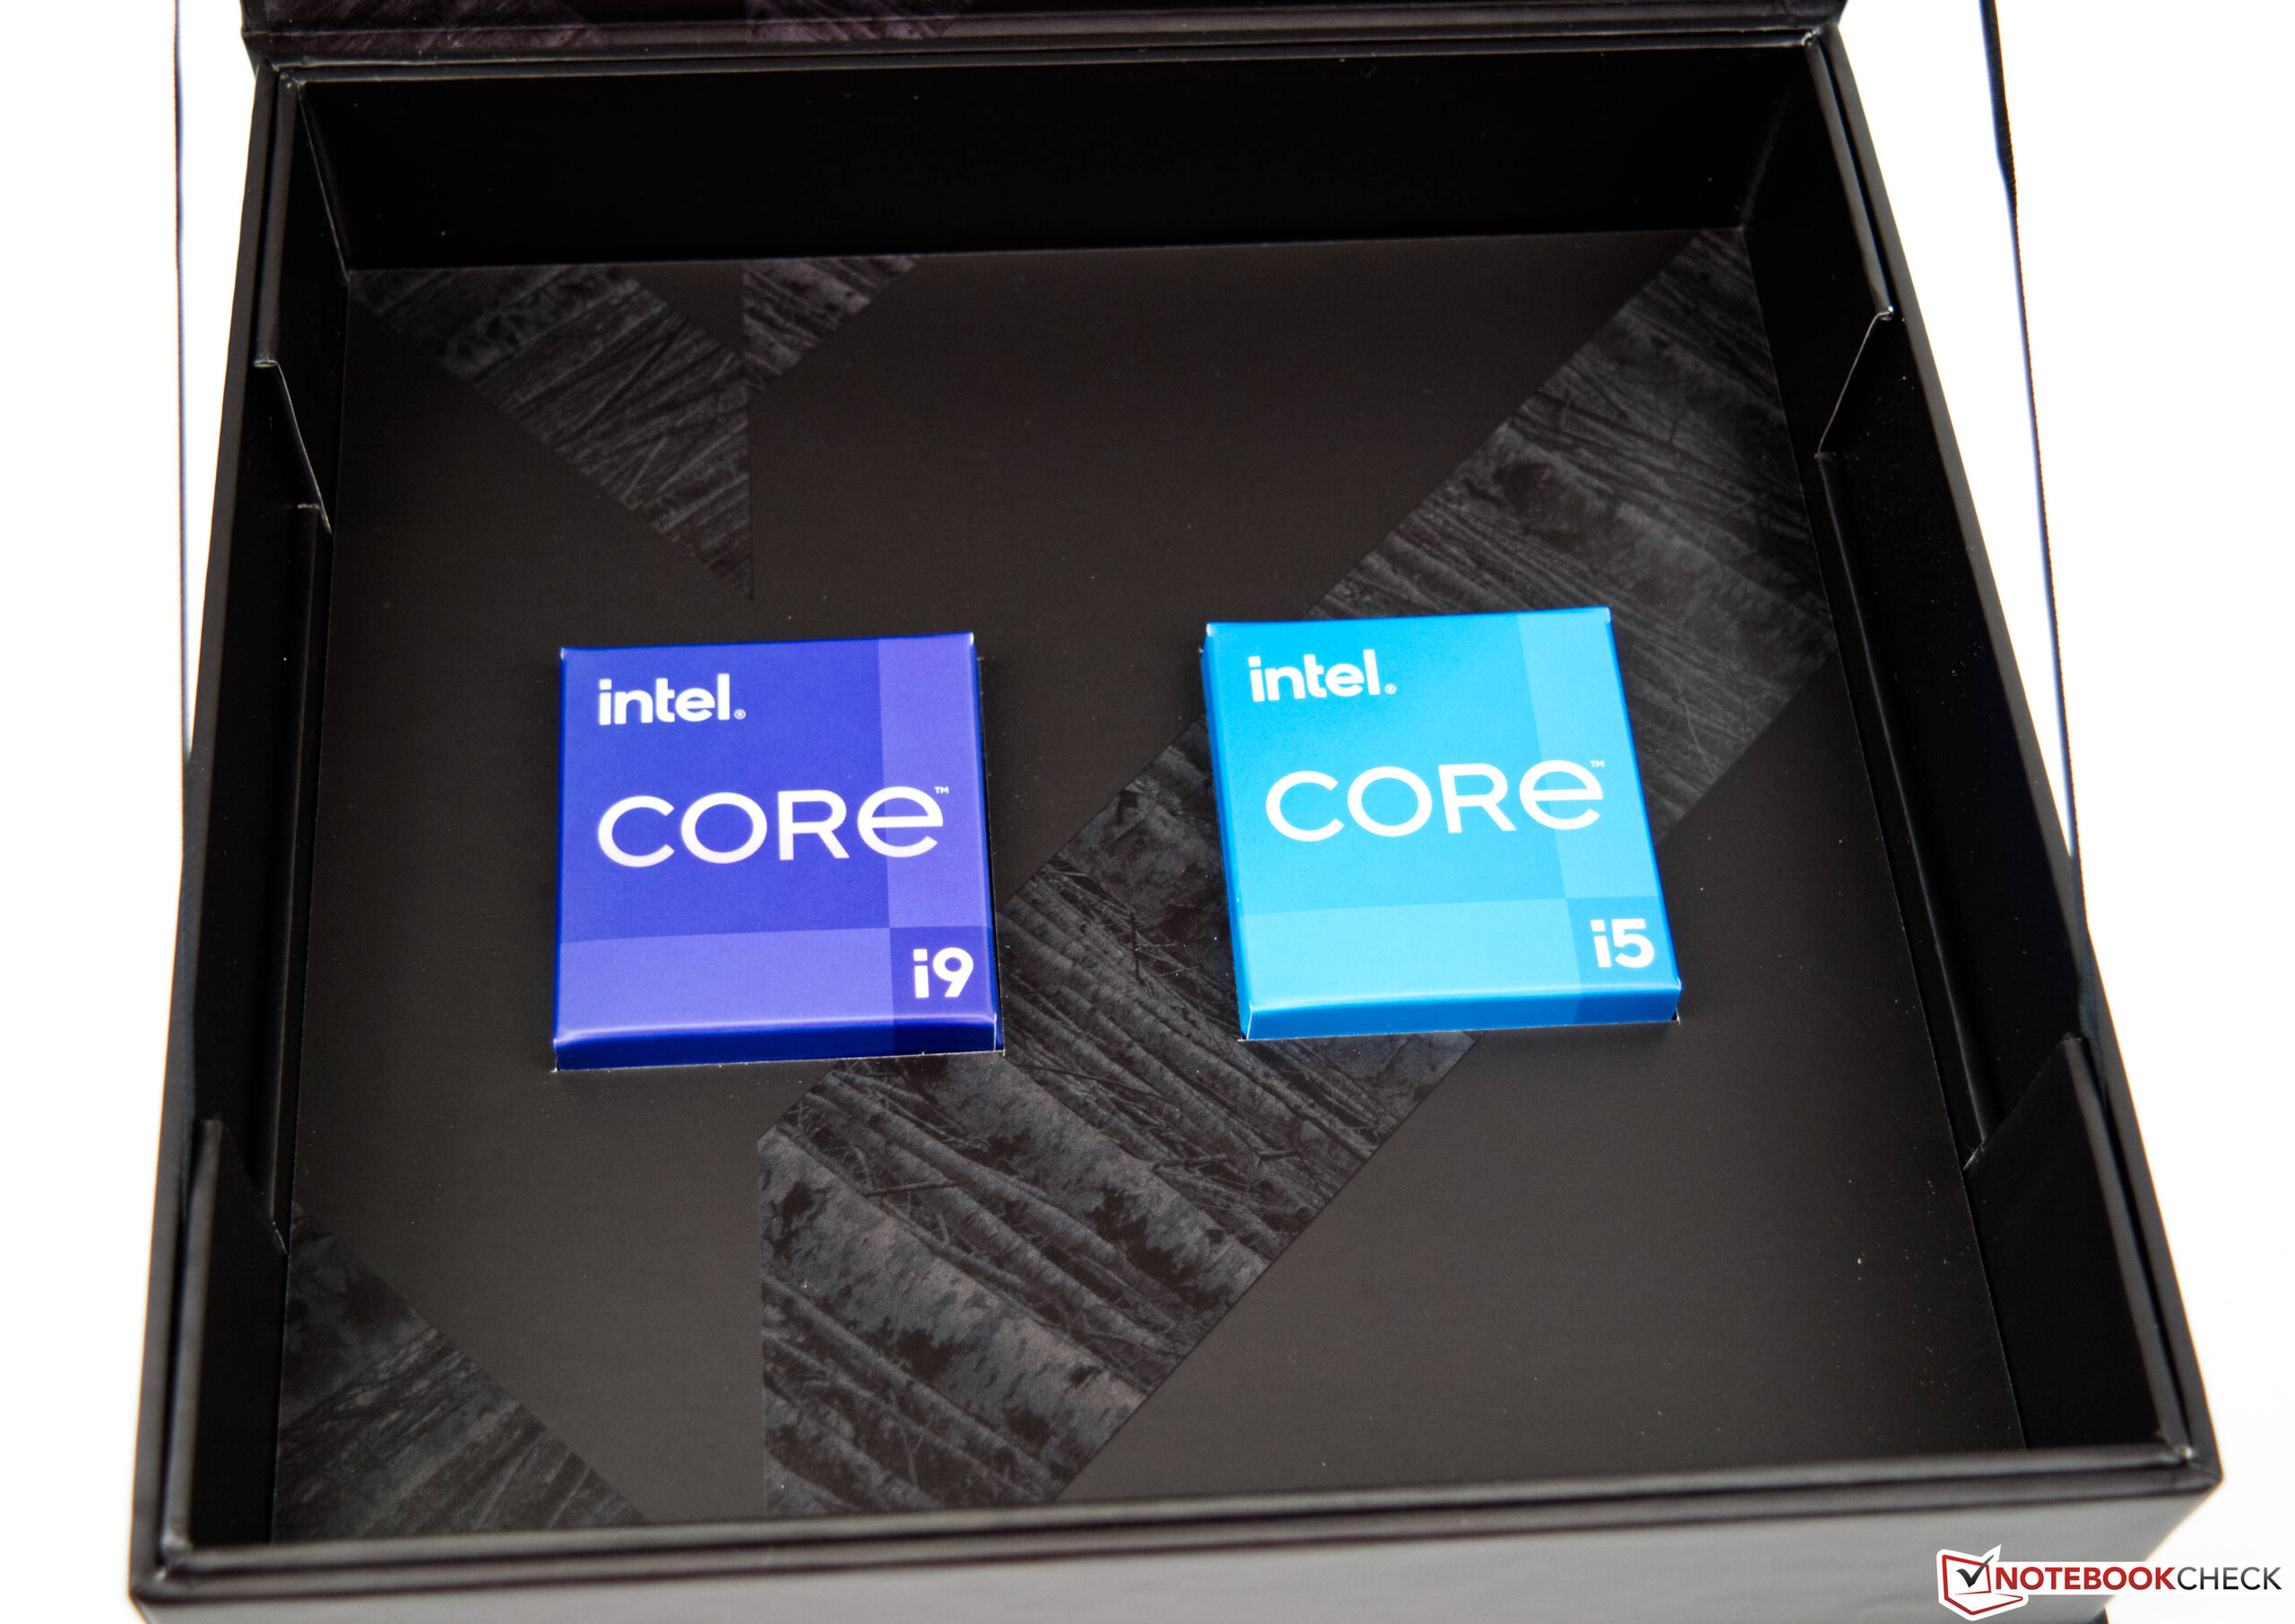
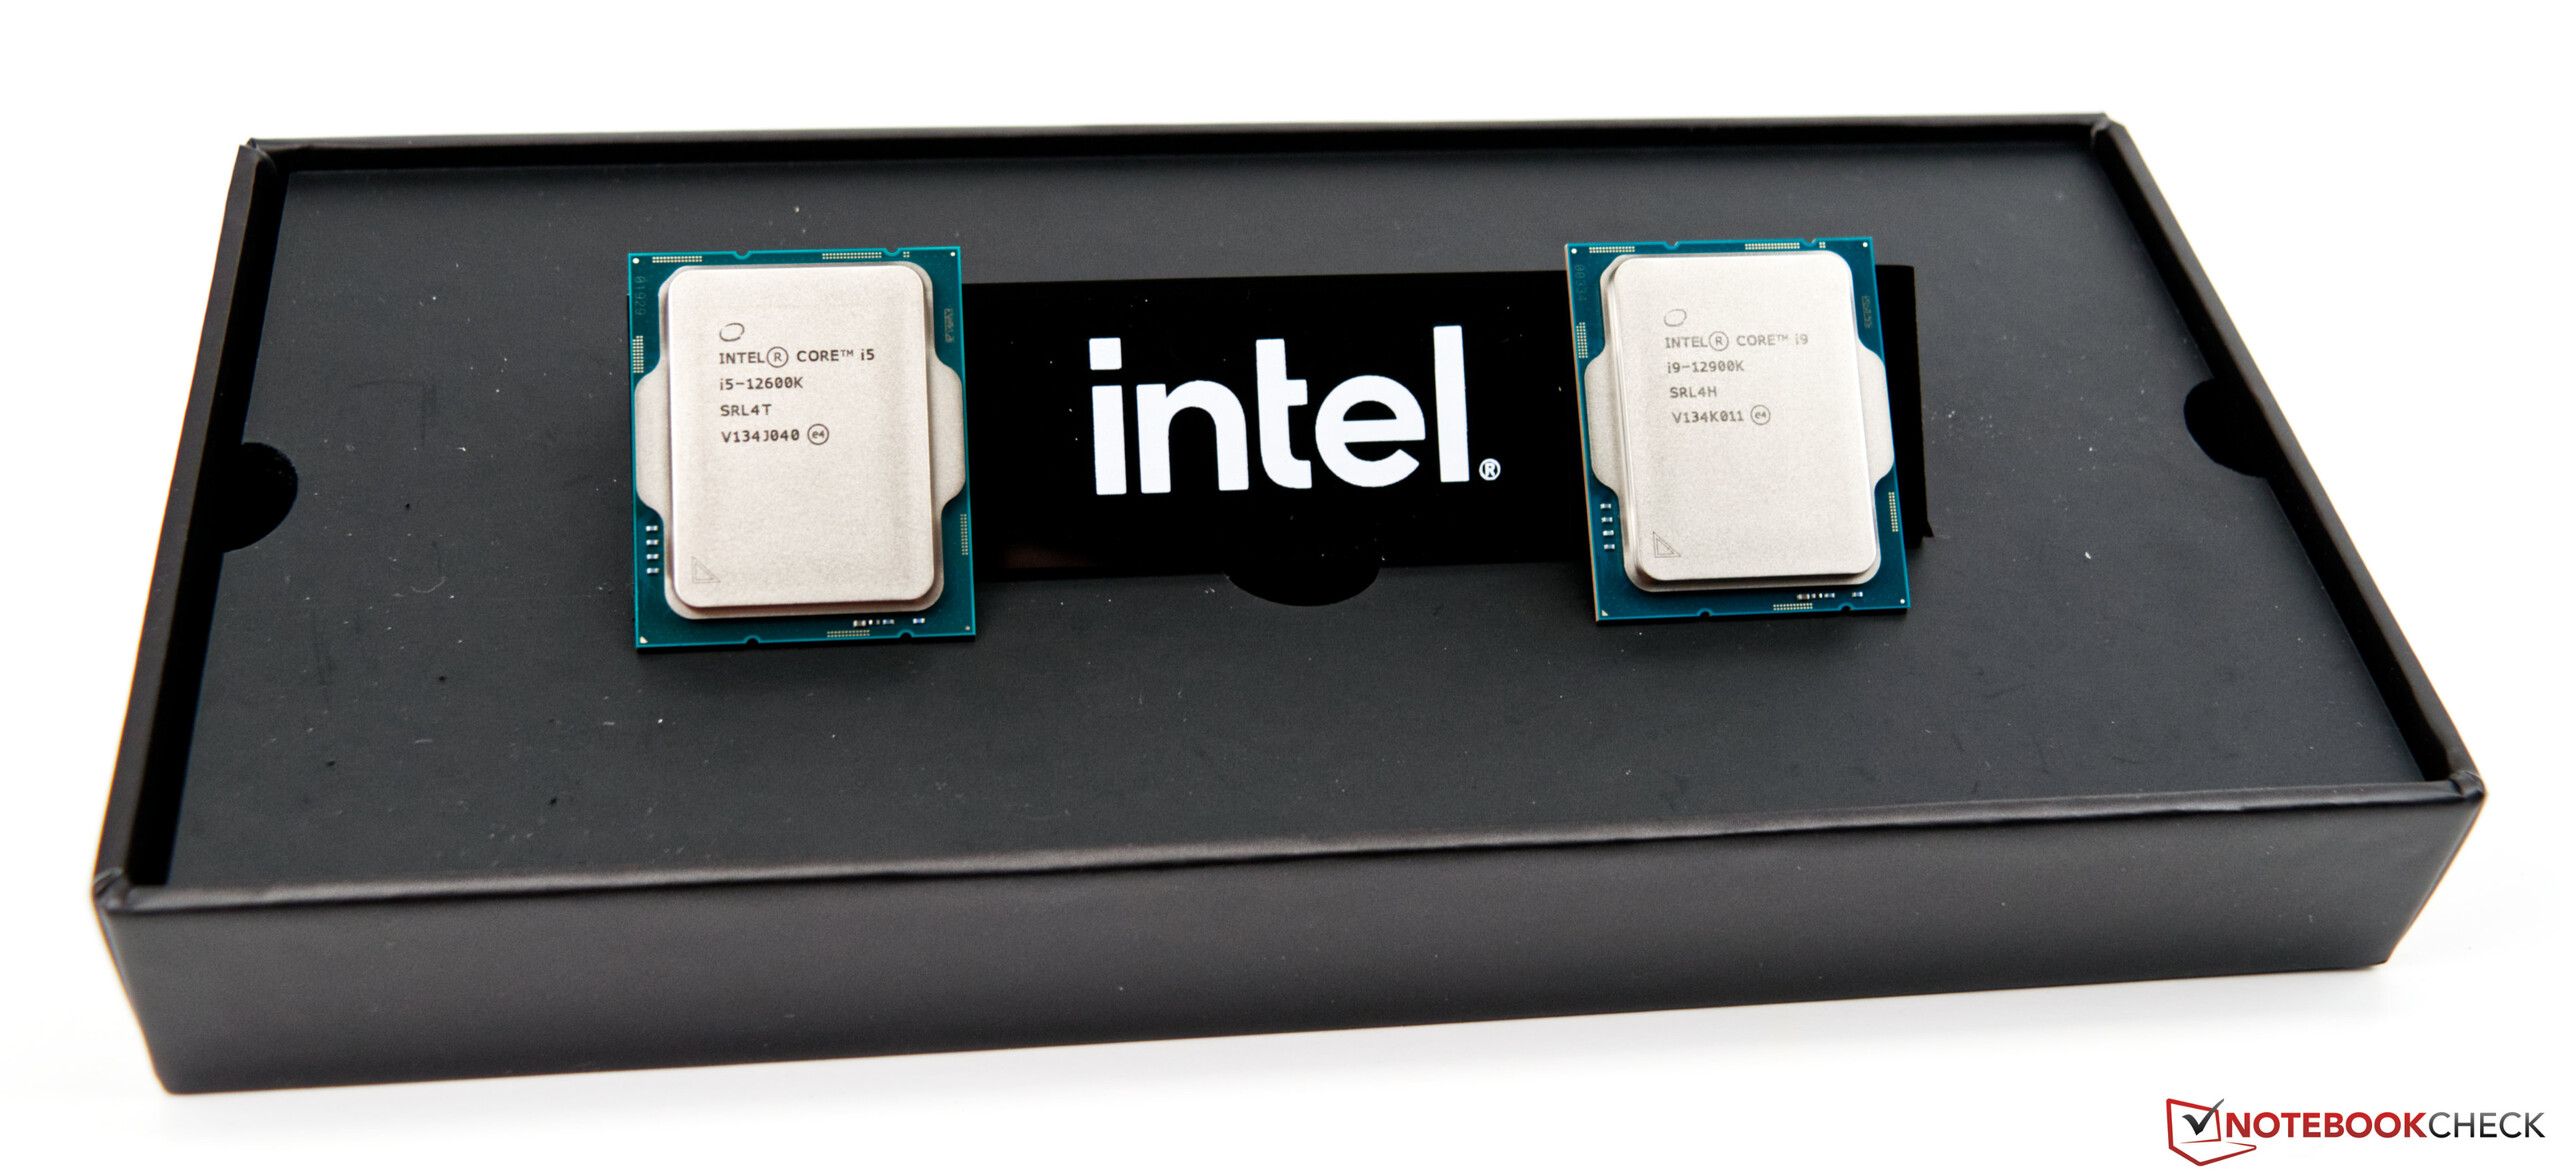
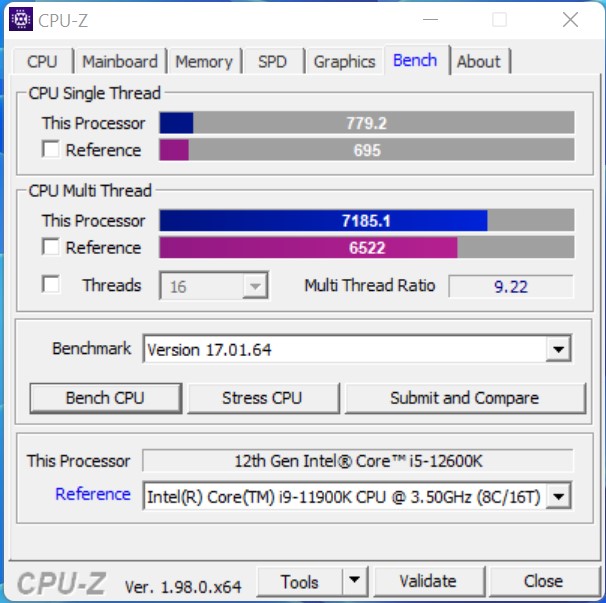
- Intel Core i9-12900K, Intel Core i5-12600K
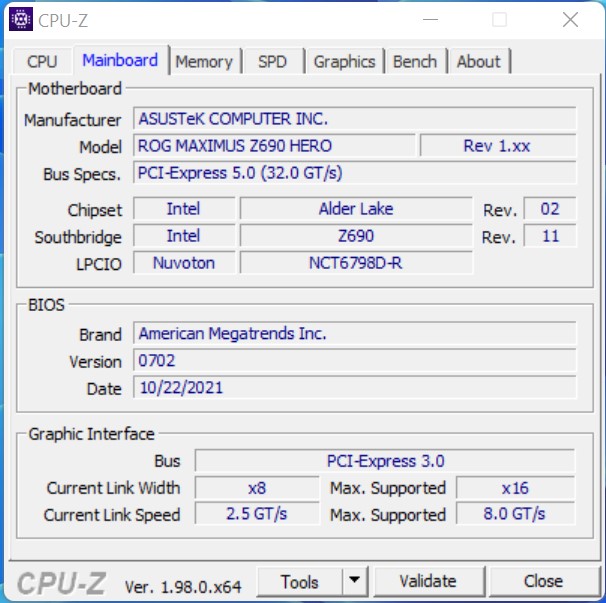
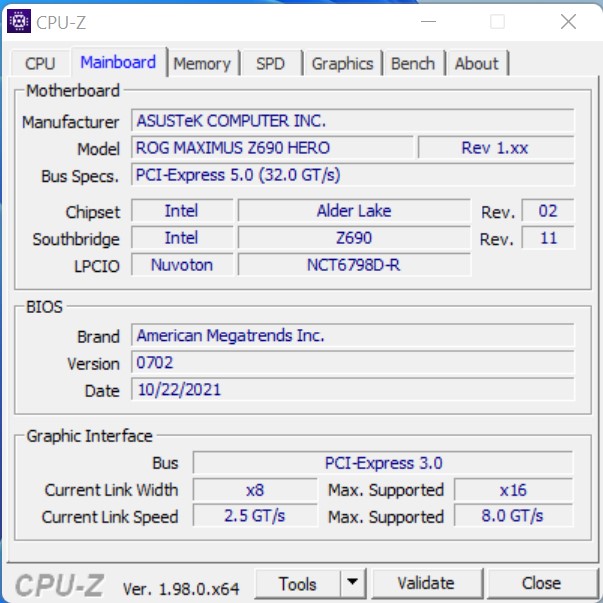
- Asus ROG Maximus Z690 Hero
- Alphacool Eisbear Aurora 280 AiO
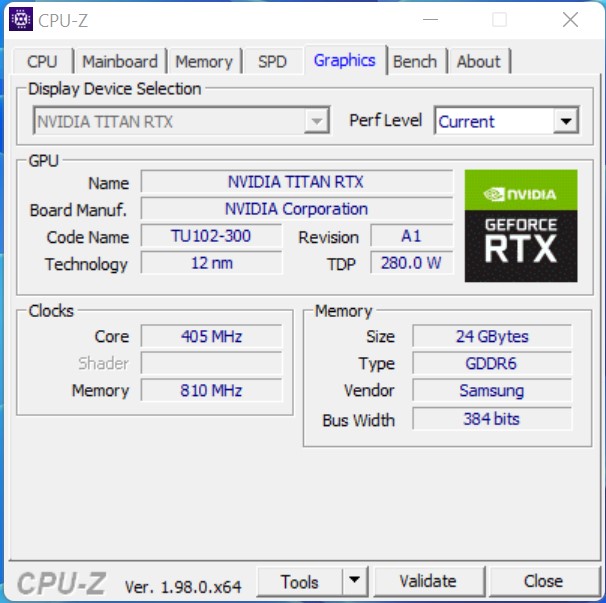
- Nvidia Titan RTX
- Alimentatore Corsair HX 1200X
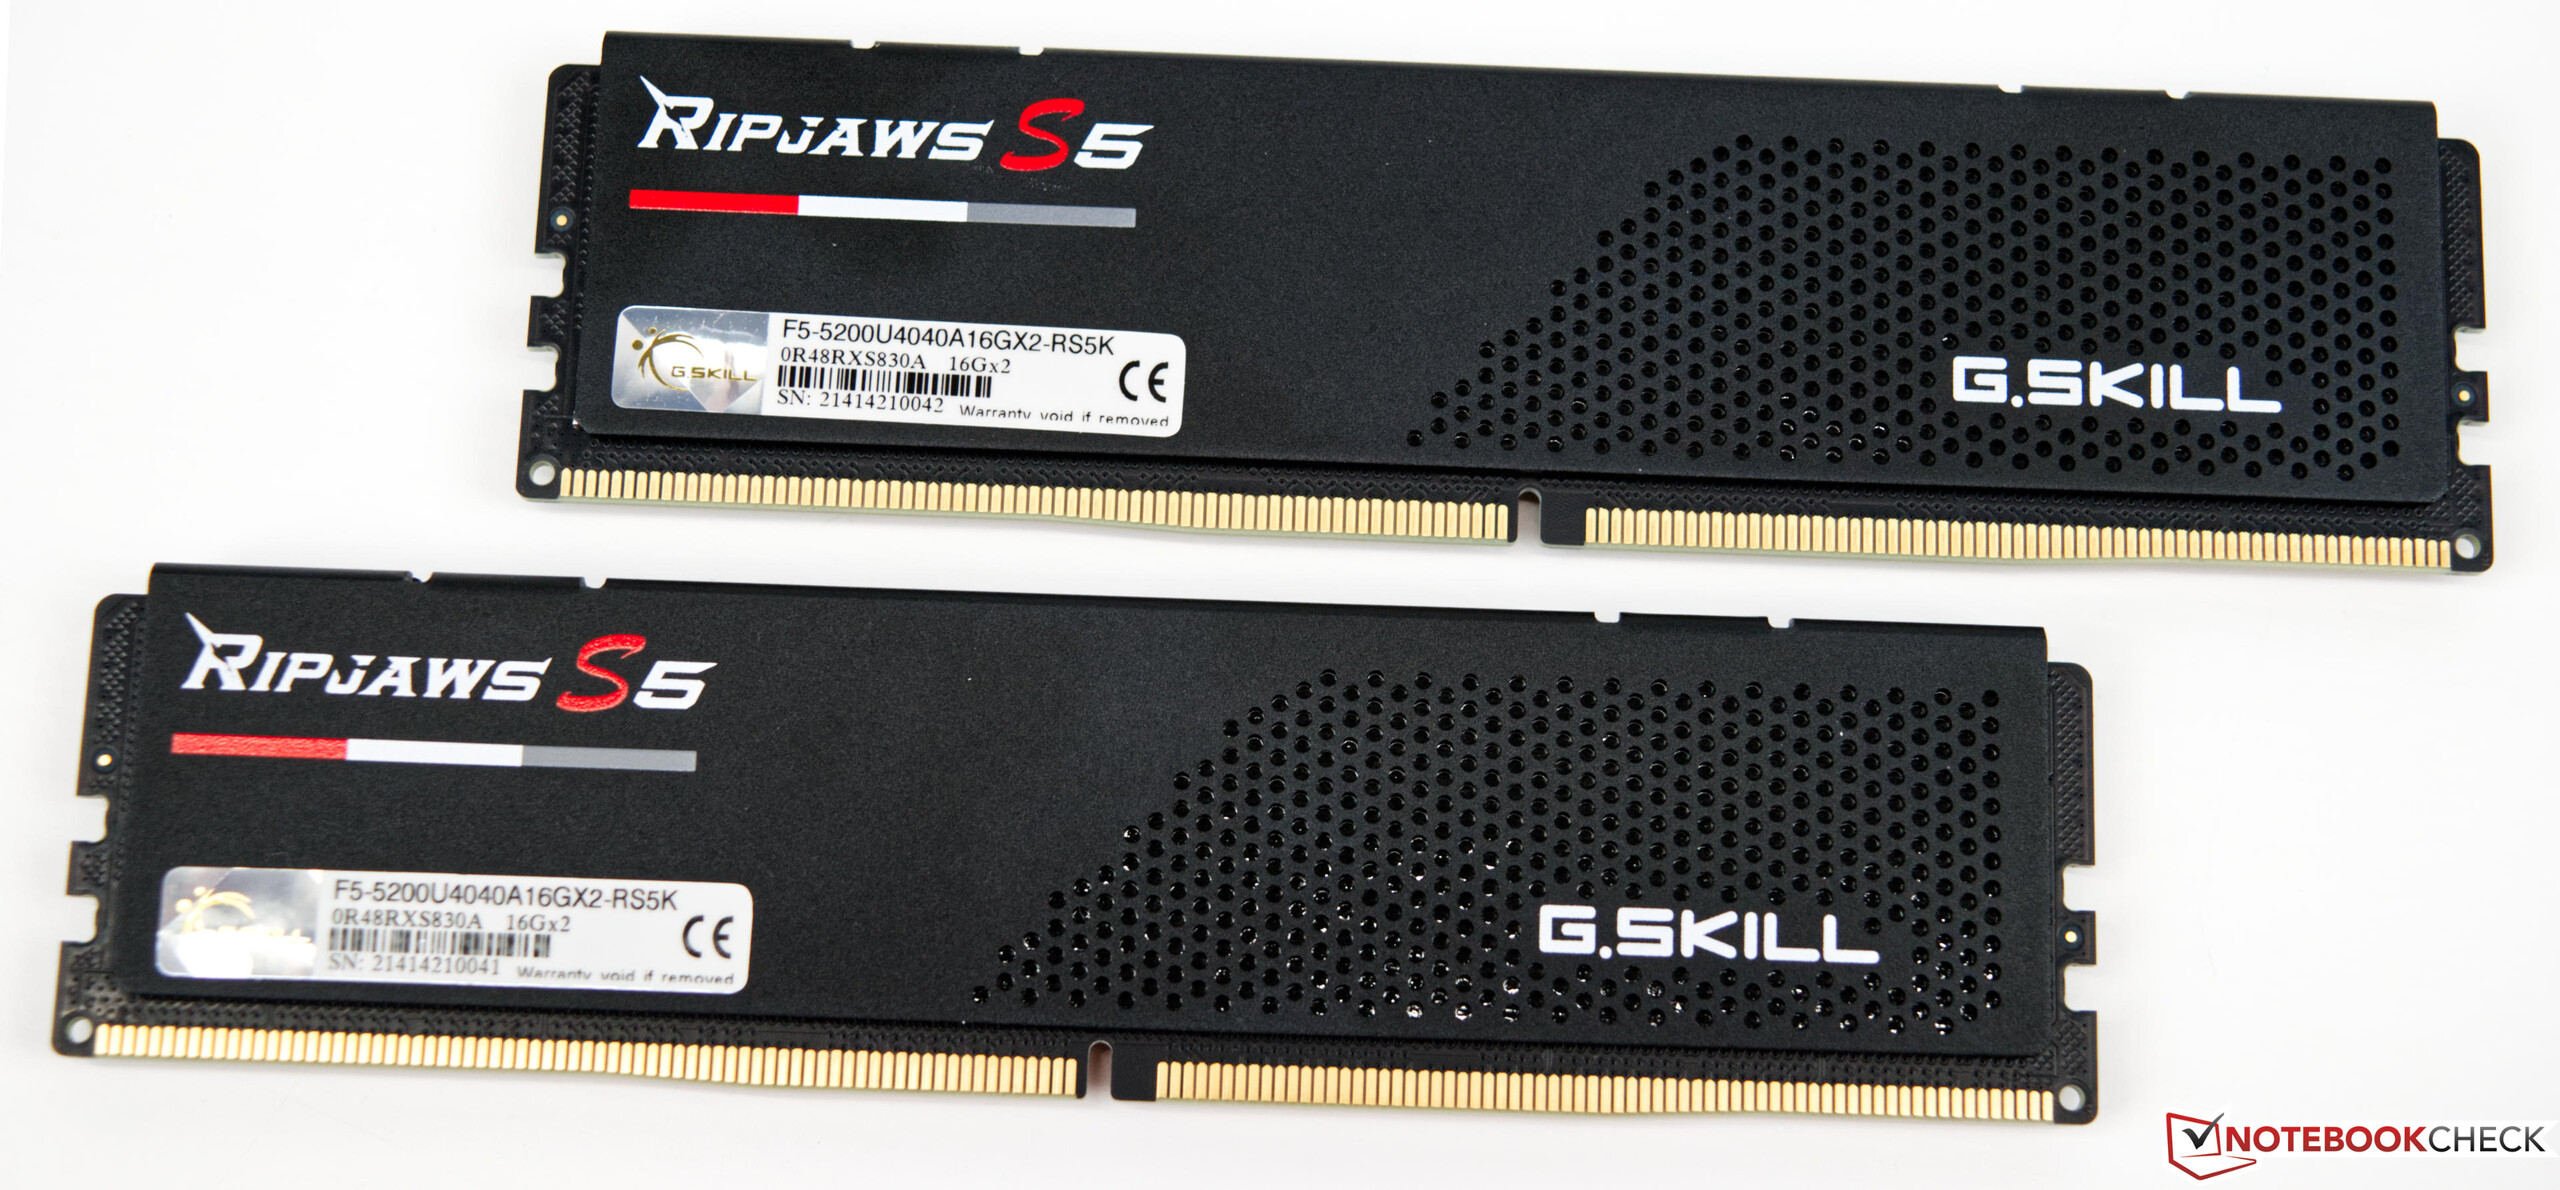
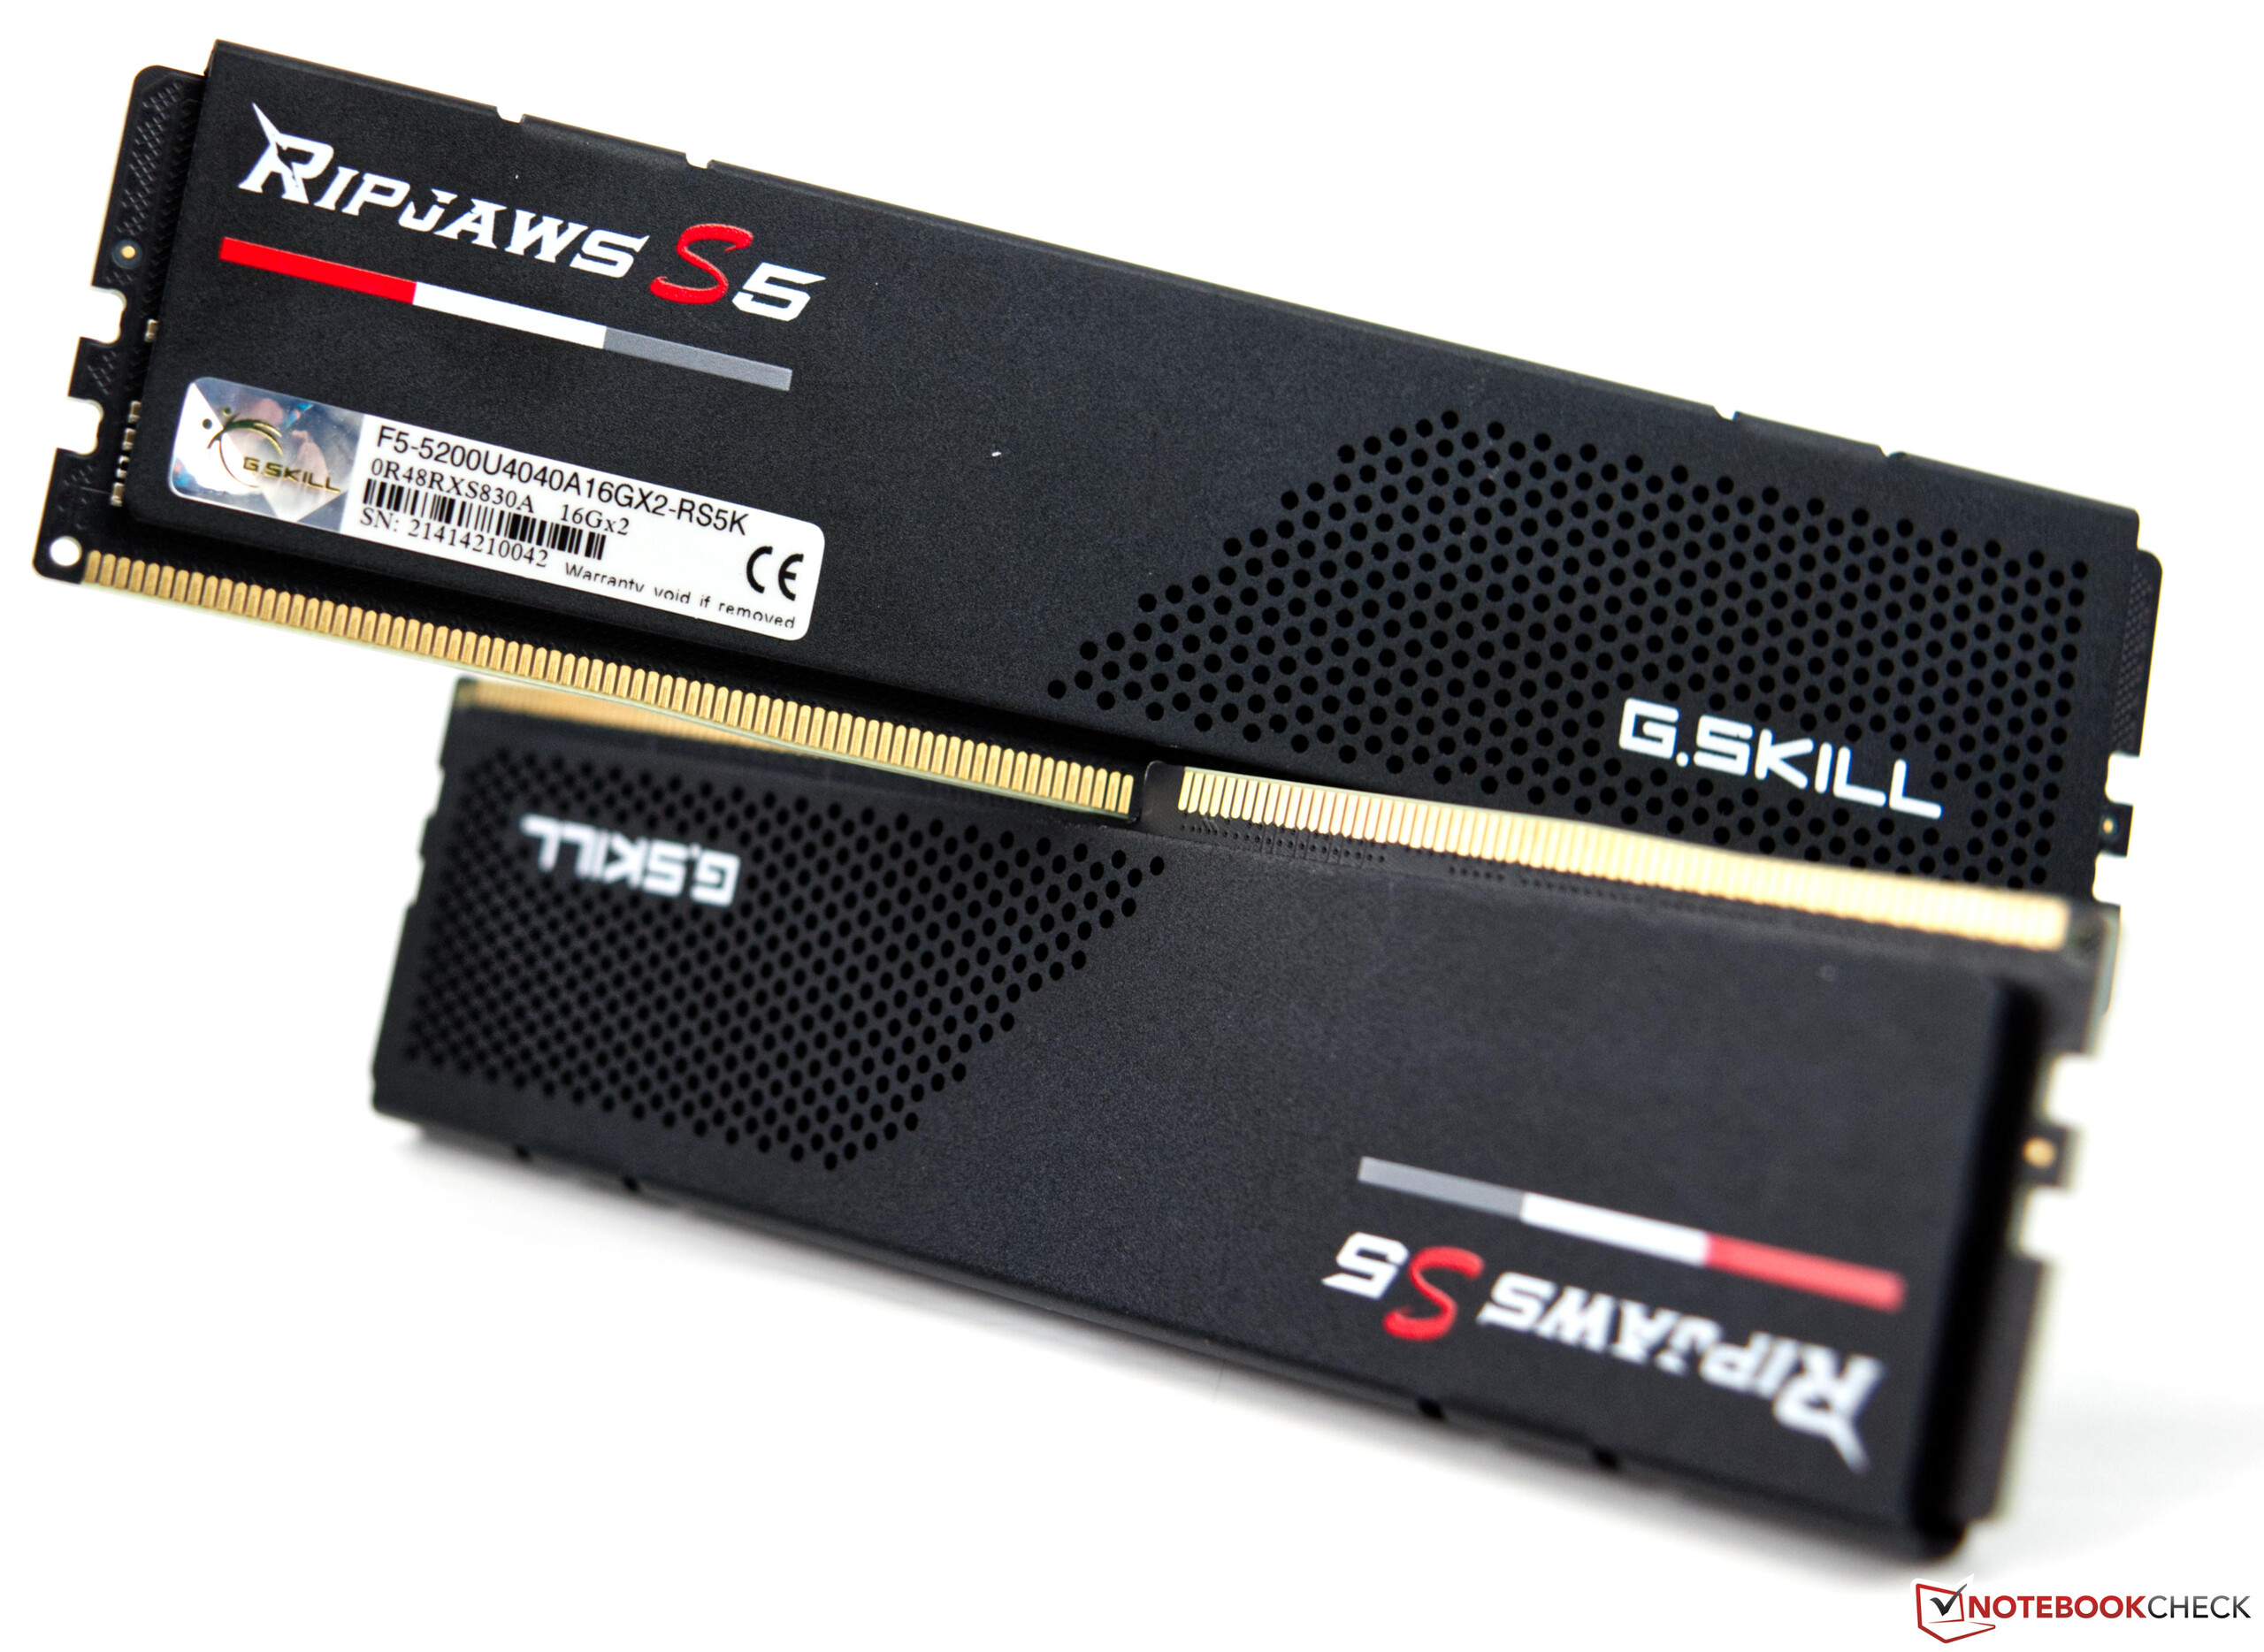
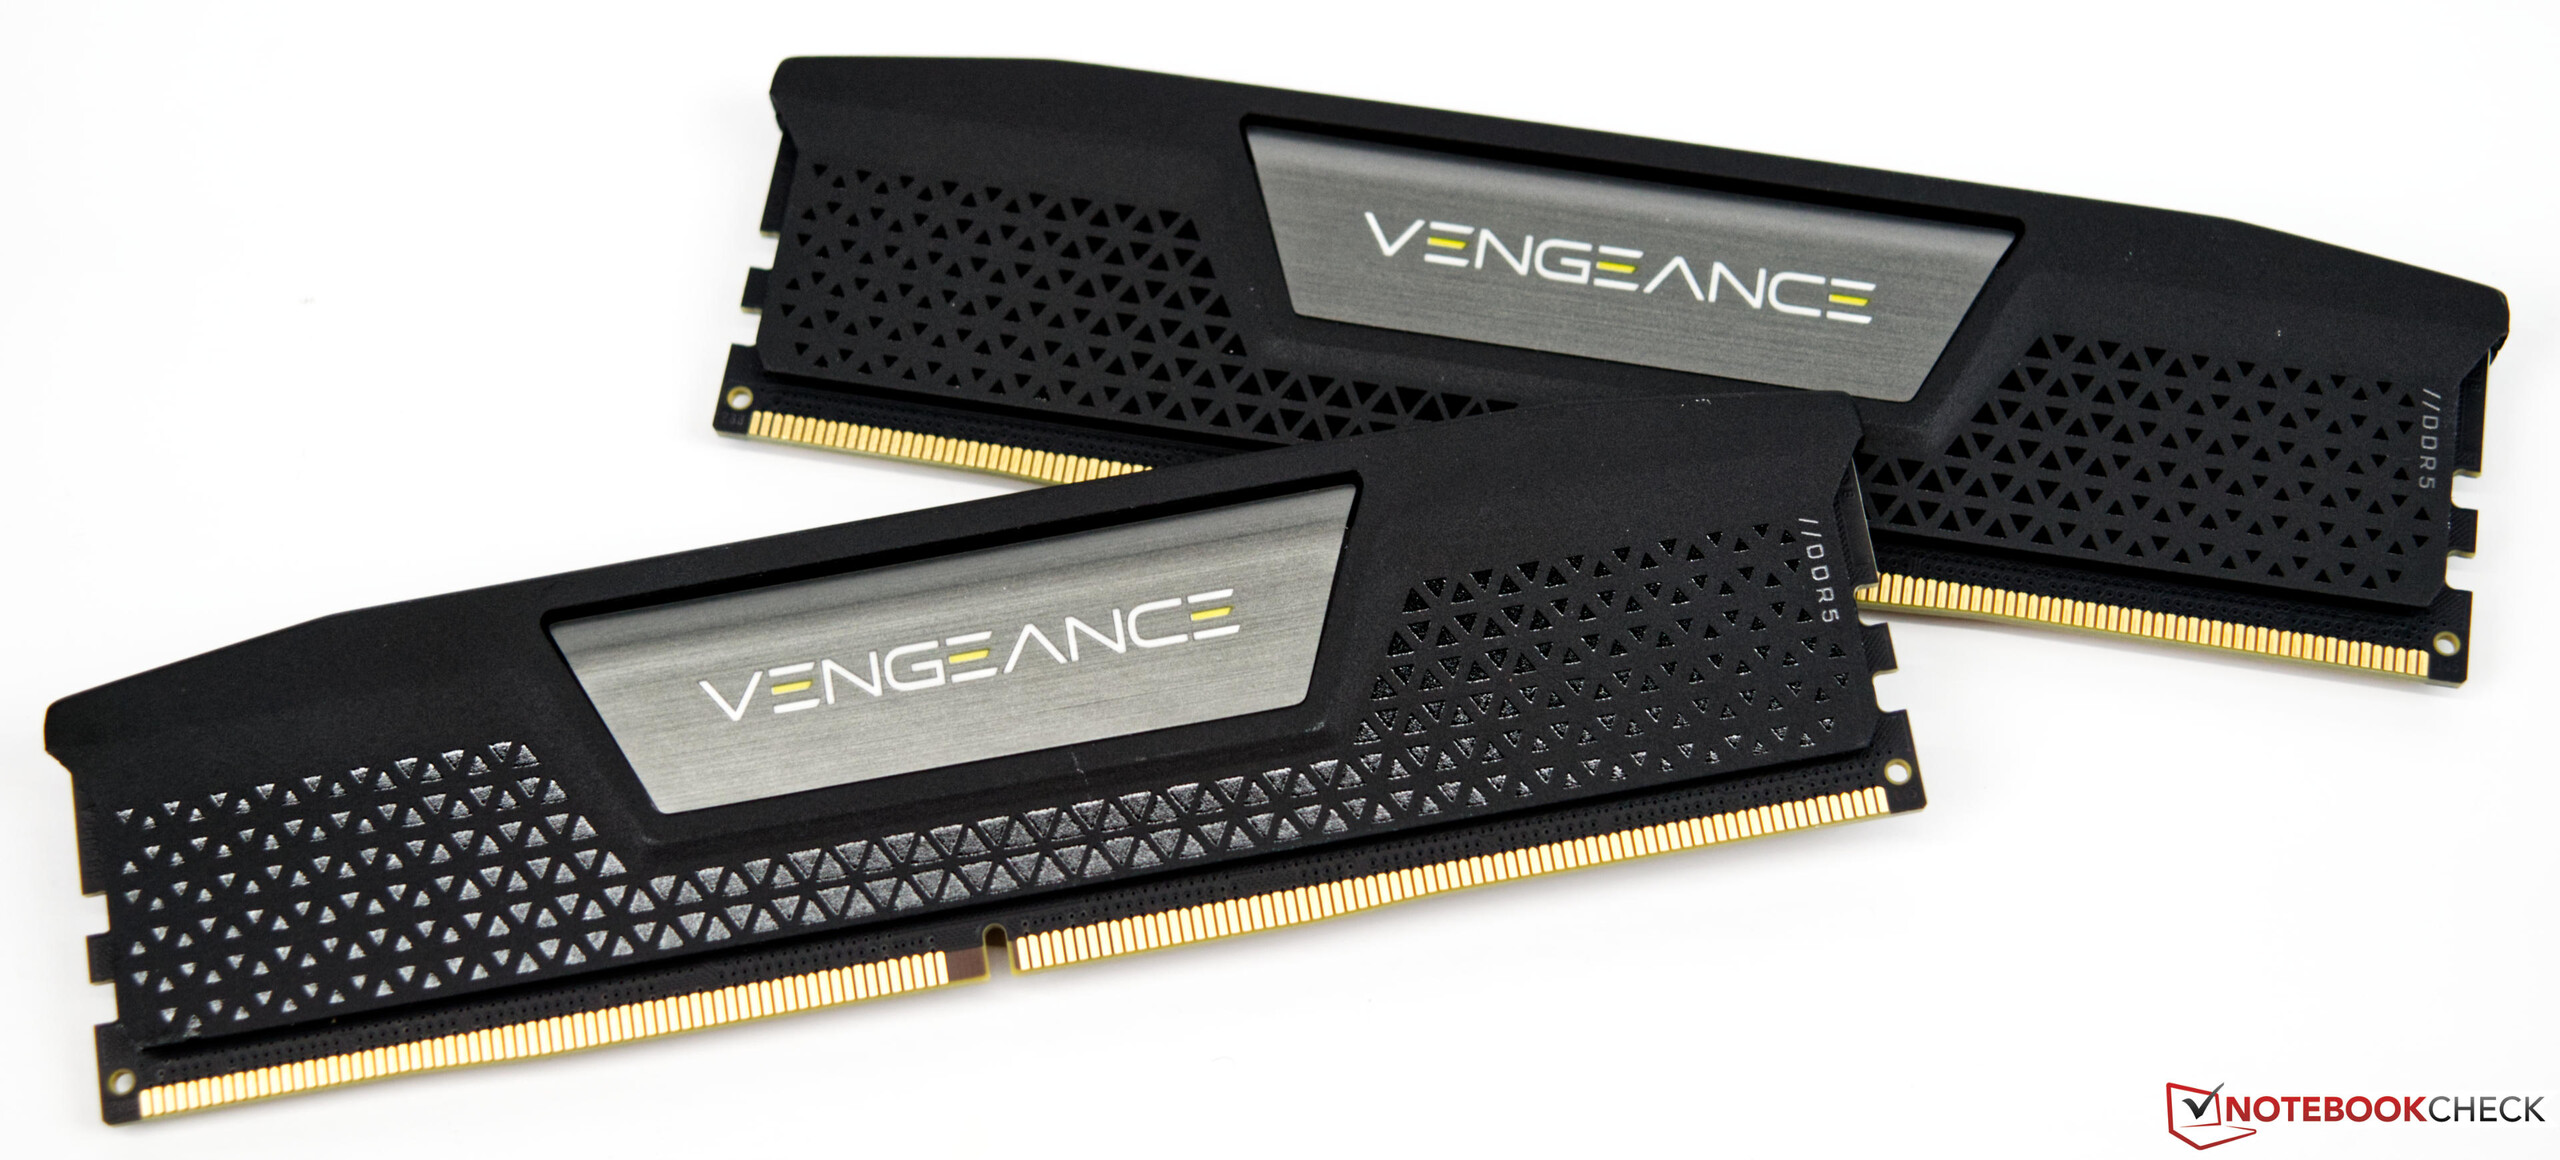
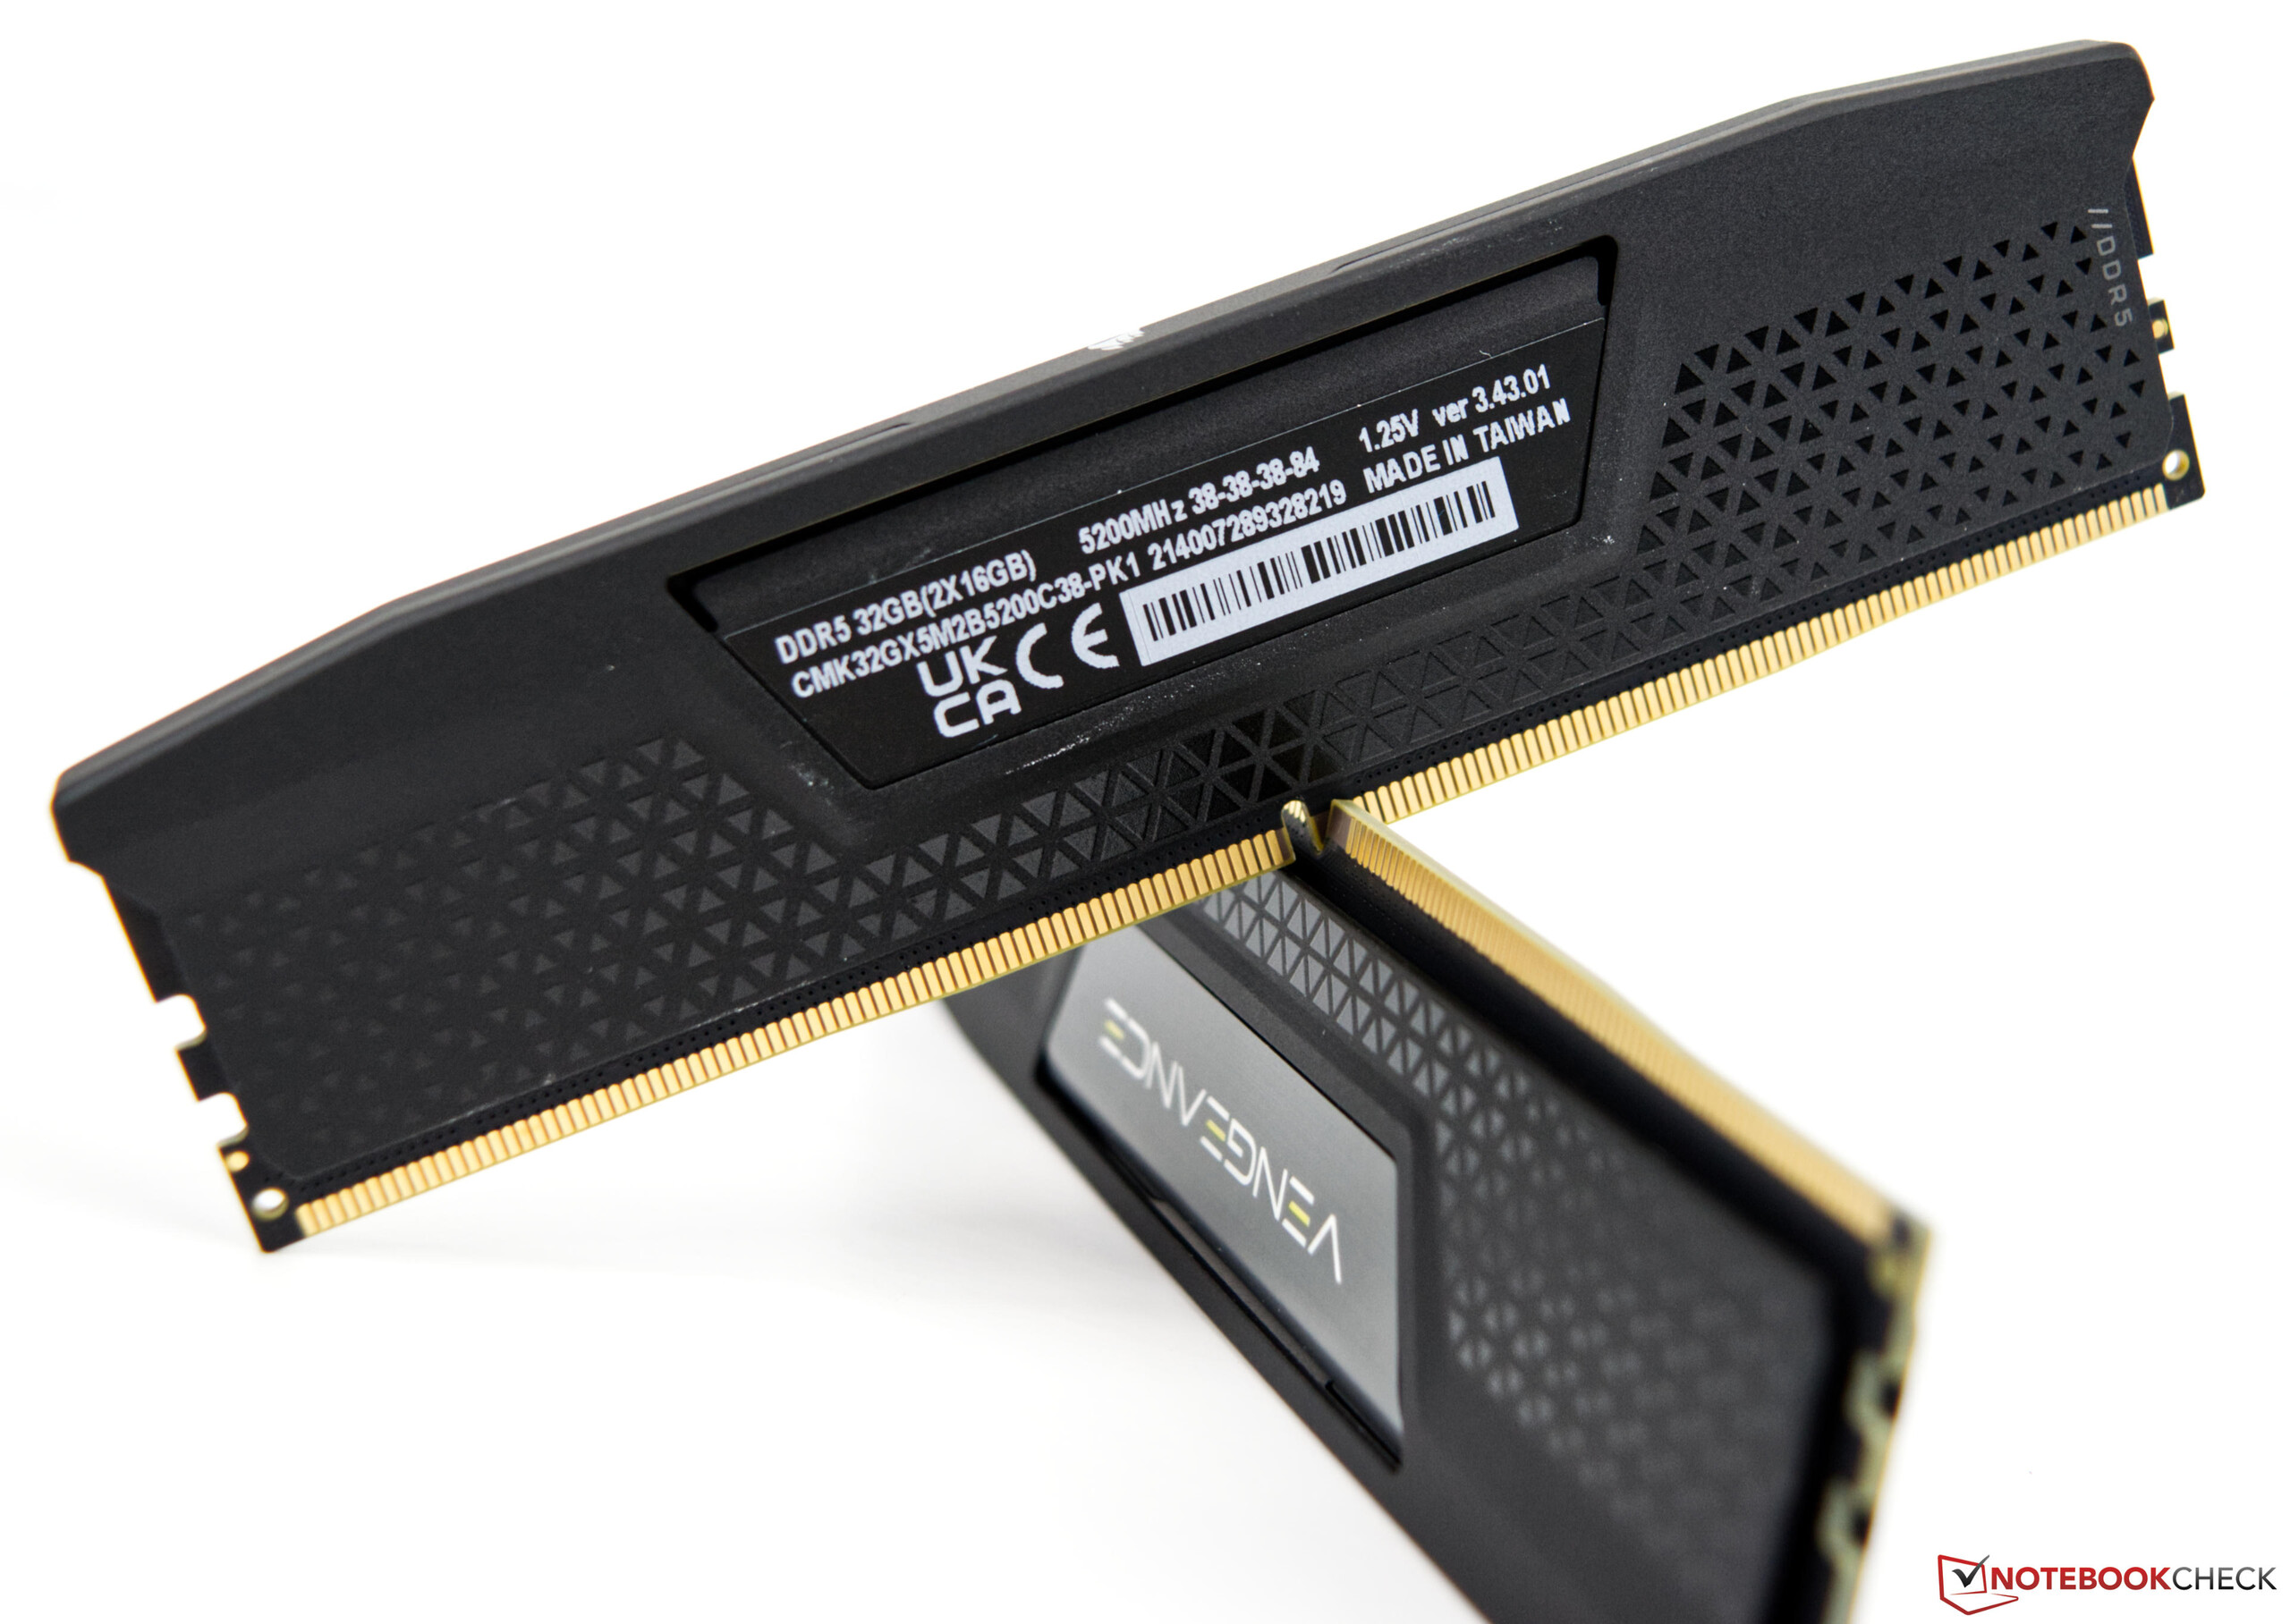
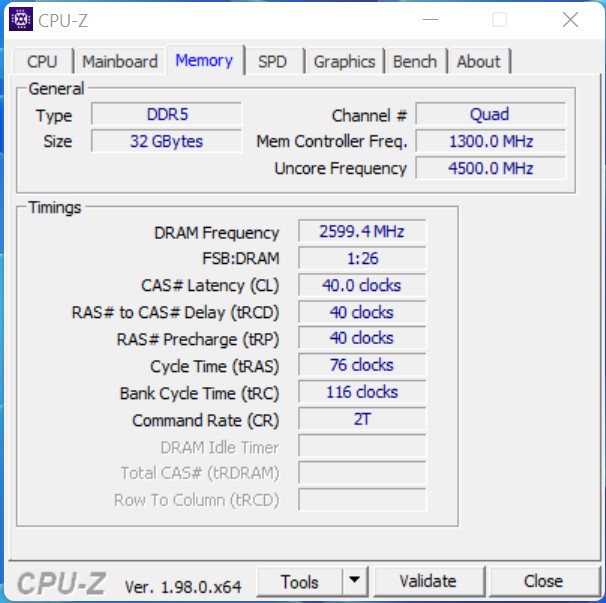
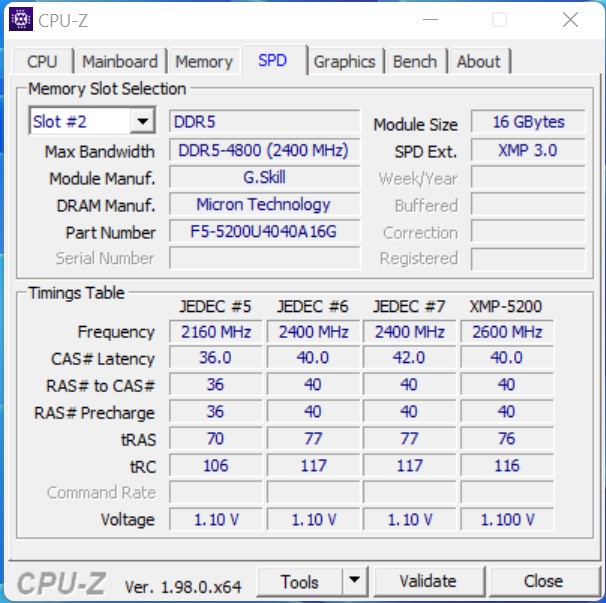
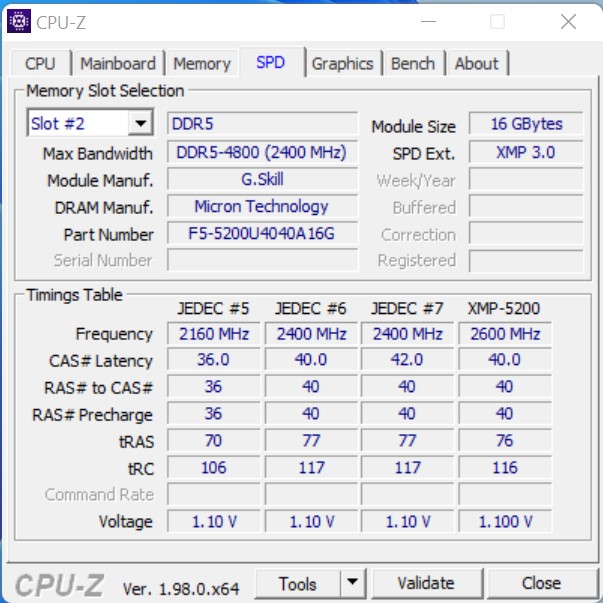
- G.Skill Ripjaws S5 (2x 16GB - DDR5-5200) / Corsair Vengeance (2x 16GB - DDR5-5200)
- Intel Optane 905p (480 GB di sistema + benchmark)
- OCZ Revodrive (480 GB per i giochi)
- Microsoft Windows 11 Professional 64-Bit (versione 21H2)
I due processori provengono direttamente da Intel. G.Skill e anche Corsair hanno fornito la nuovissima memoria DDR5 di lavoro per noi, e la nuova scheda madre Z690viene direttamente da Asus. Caseking ci supporta con il Raijintek Pean Showcase, e come raffreddamento usiamo il Alphacool Eisbear Aurora 280 AiOche ci è stato messo a disposizione da Alphacool.
Nota importante
Tutti i benchmark sono stati eseguiti su un sistema Windows 11 appena installato. La versione Bios più recente ci è stata fornita da Asus. Ciò che è importante sapere è che con le impostazioni standard PL1 e PL2 sono uguali, il che significa che la CPU può sempre prendere le massime prestazioni senza alcuna limitazione. Abbiamo usato le impostazioni standard per questa recensione.

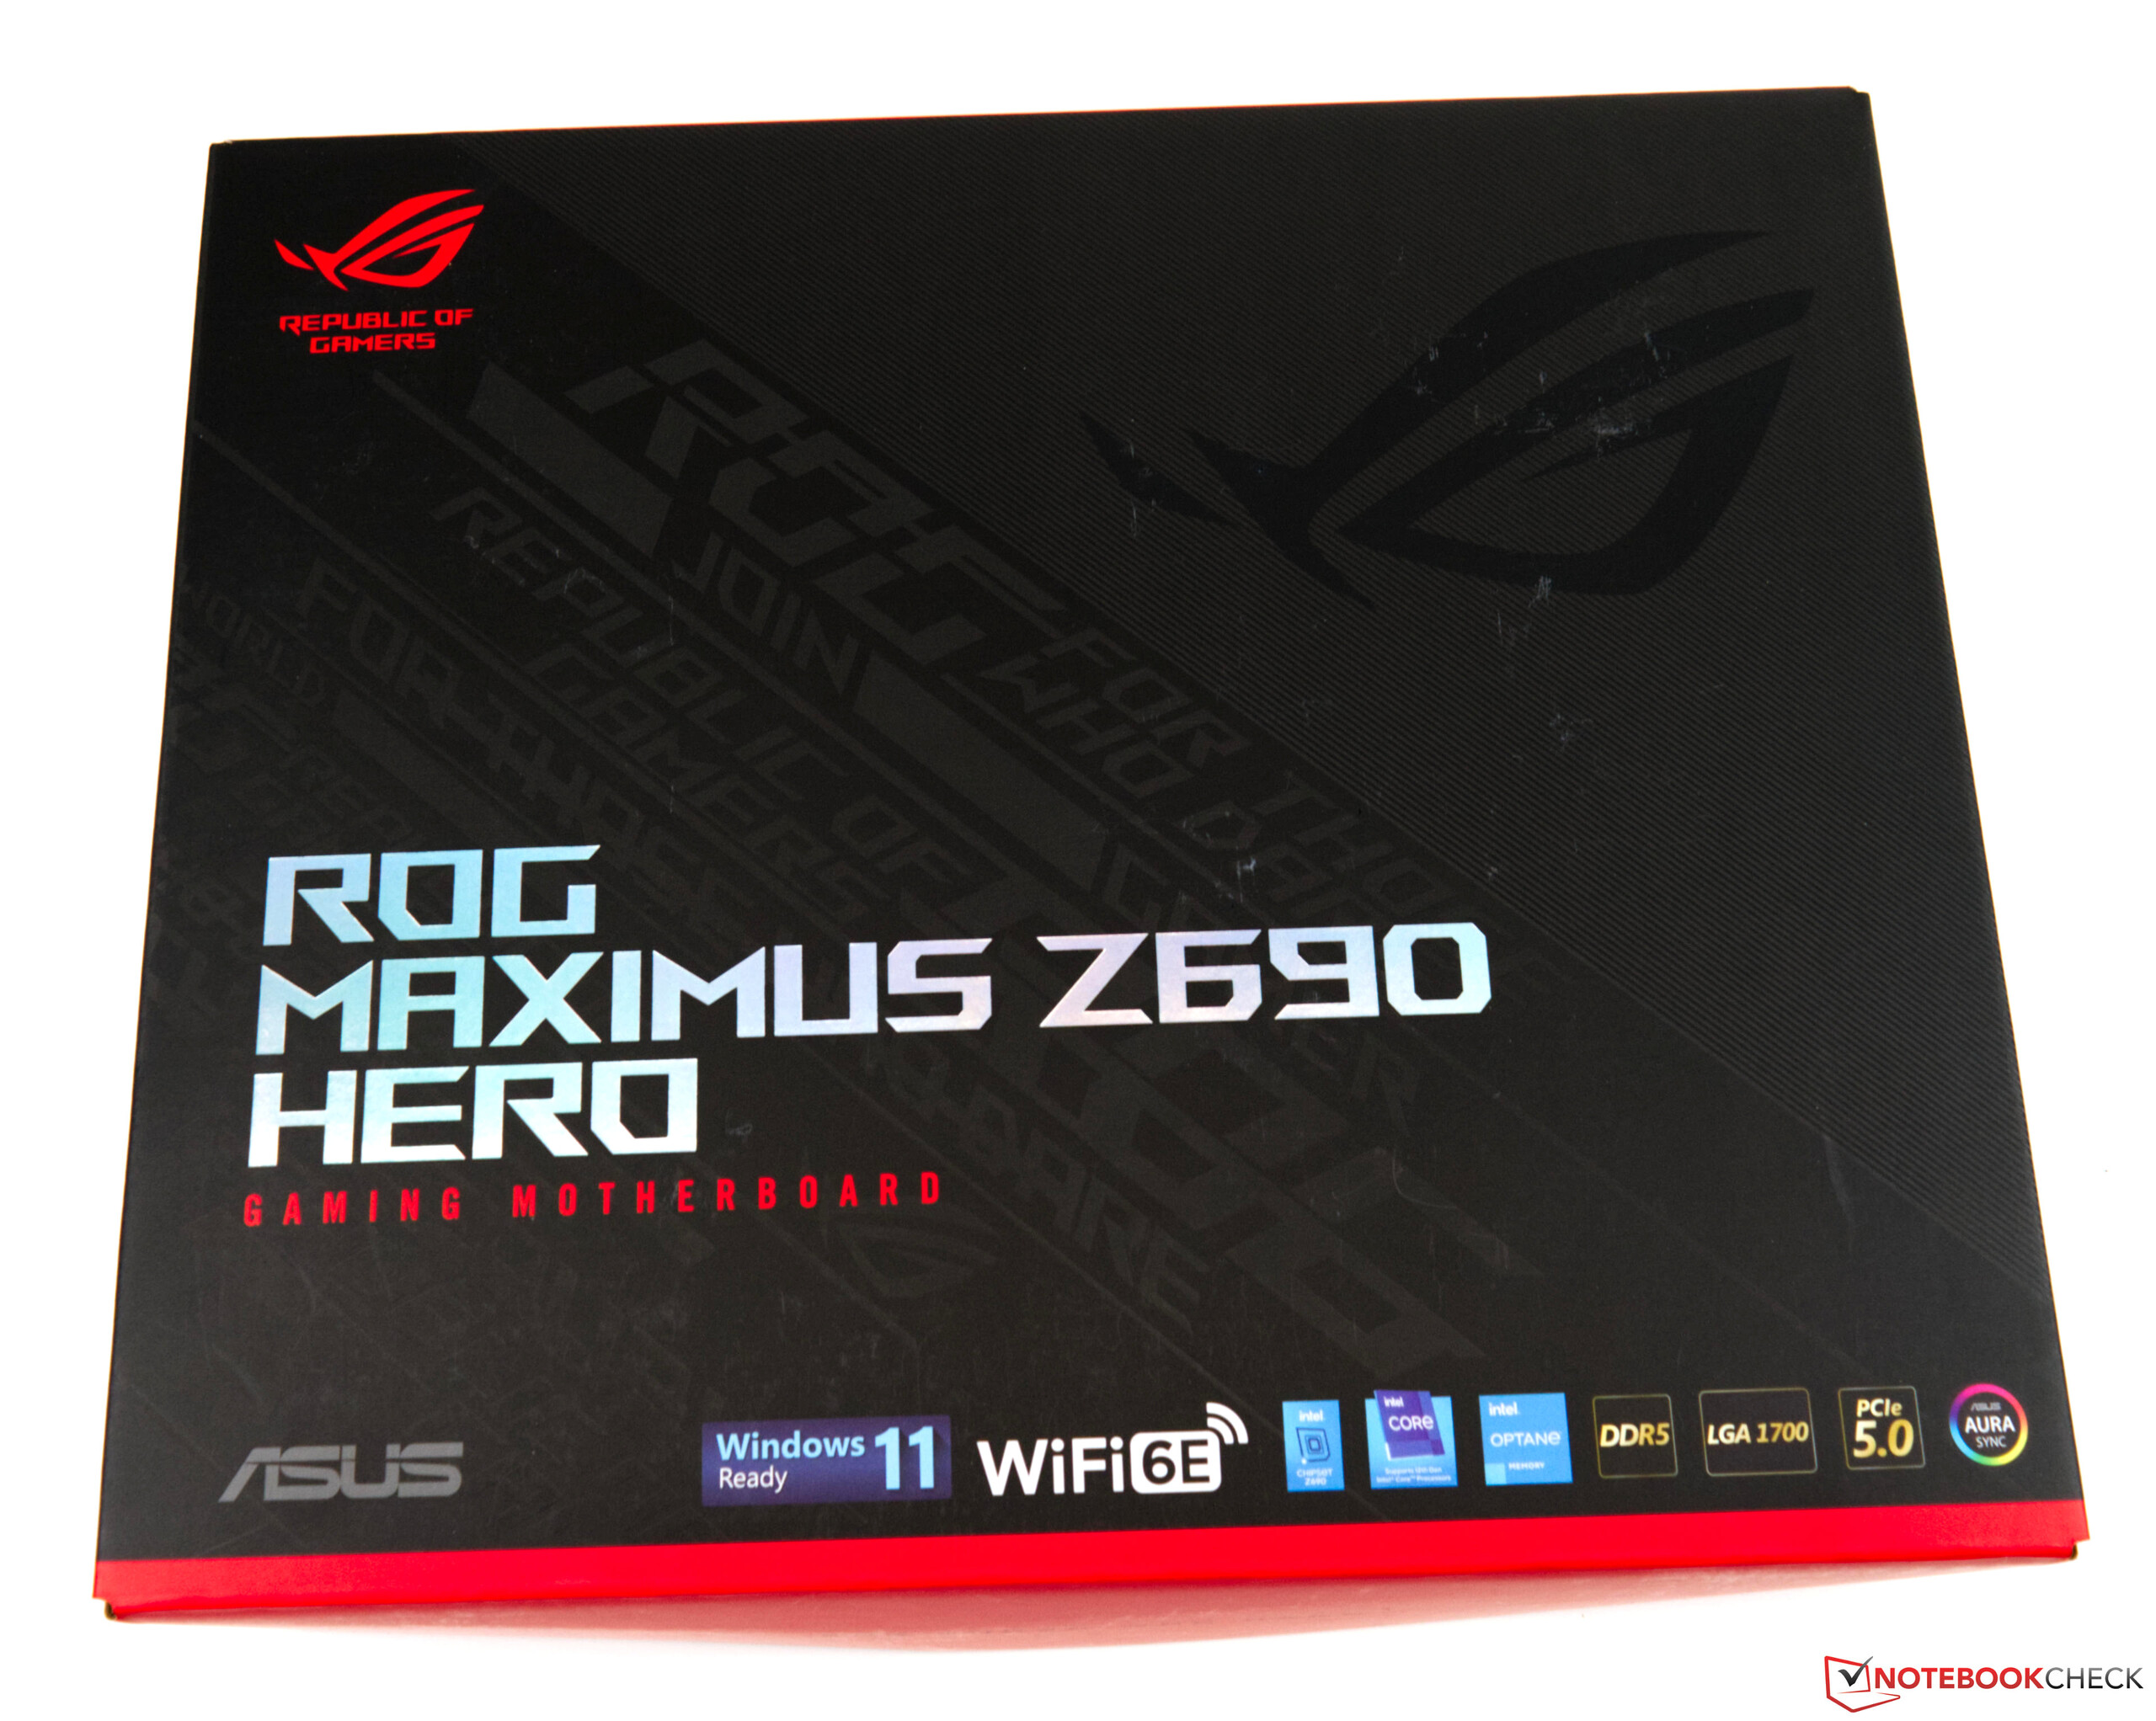
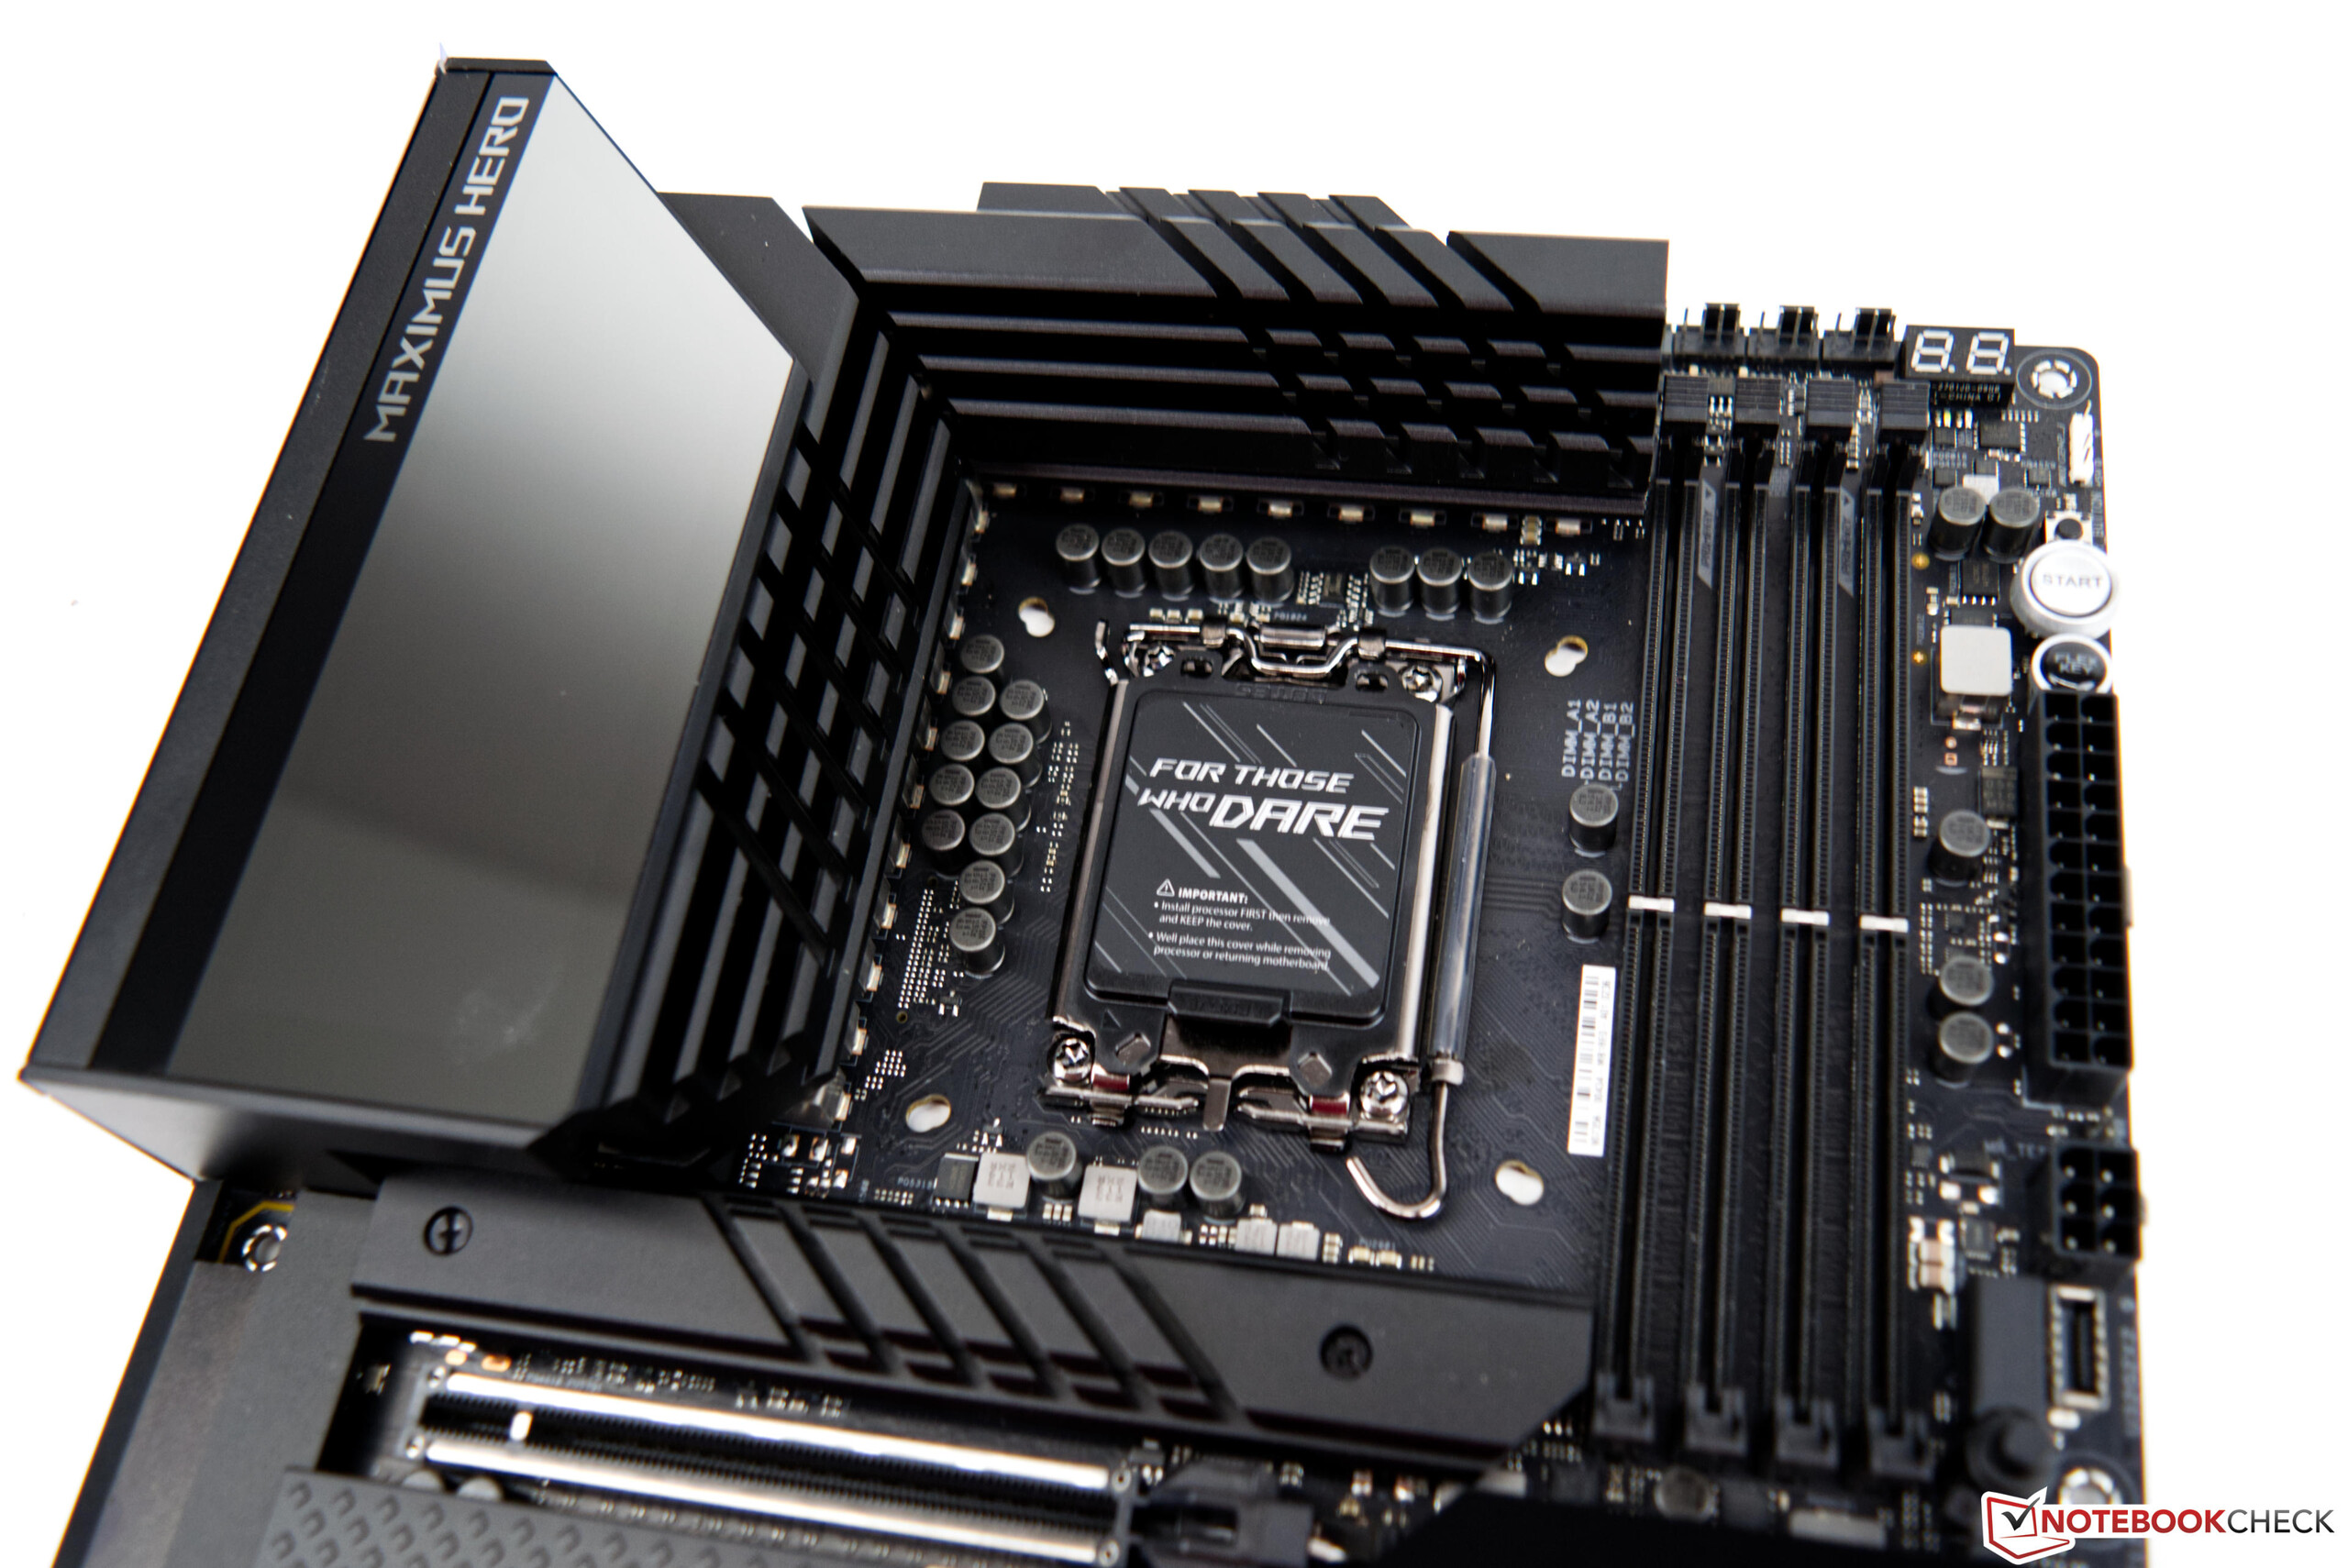
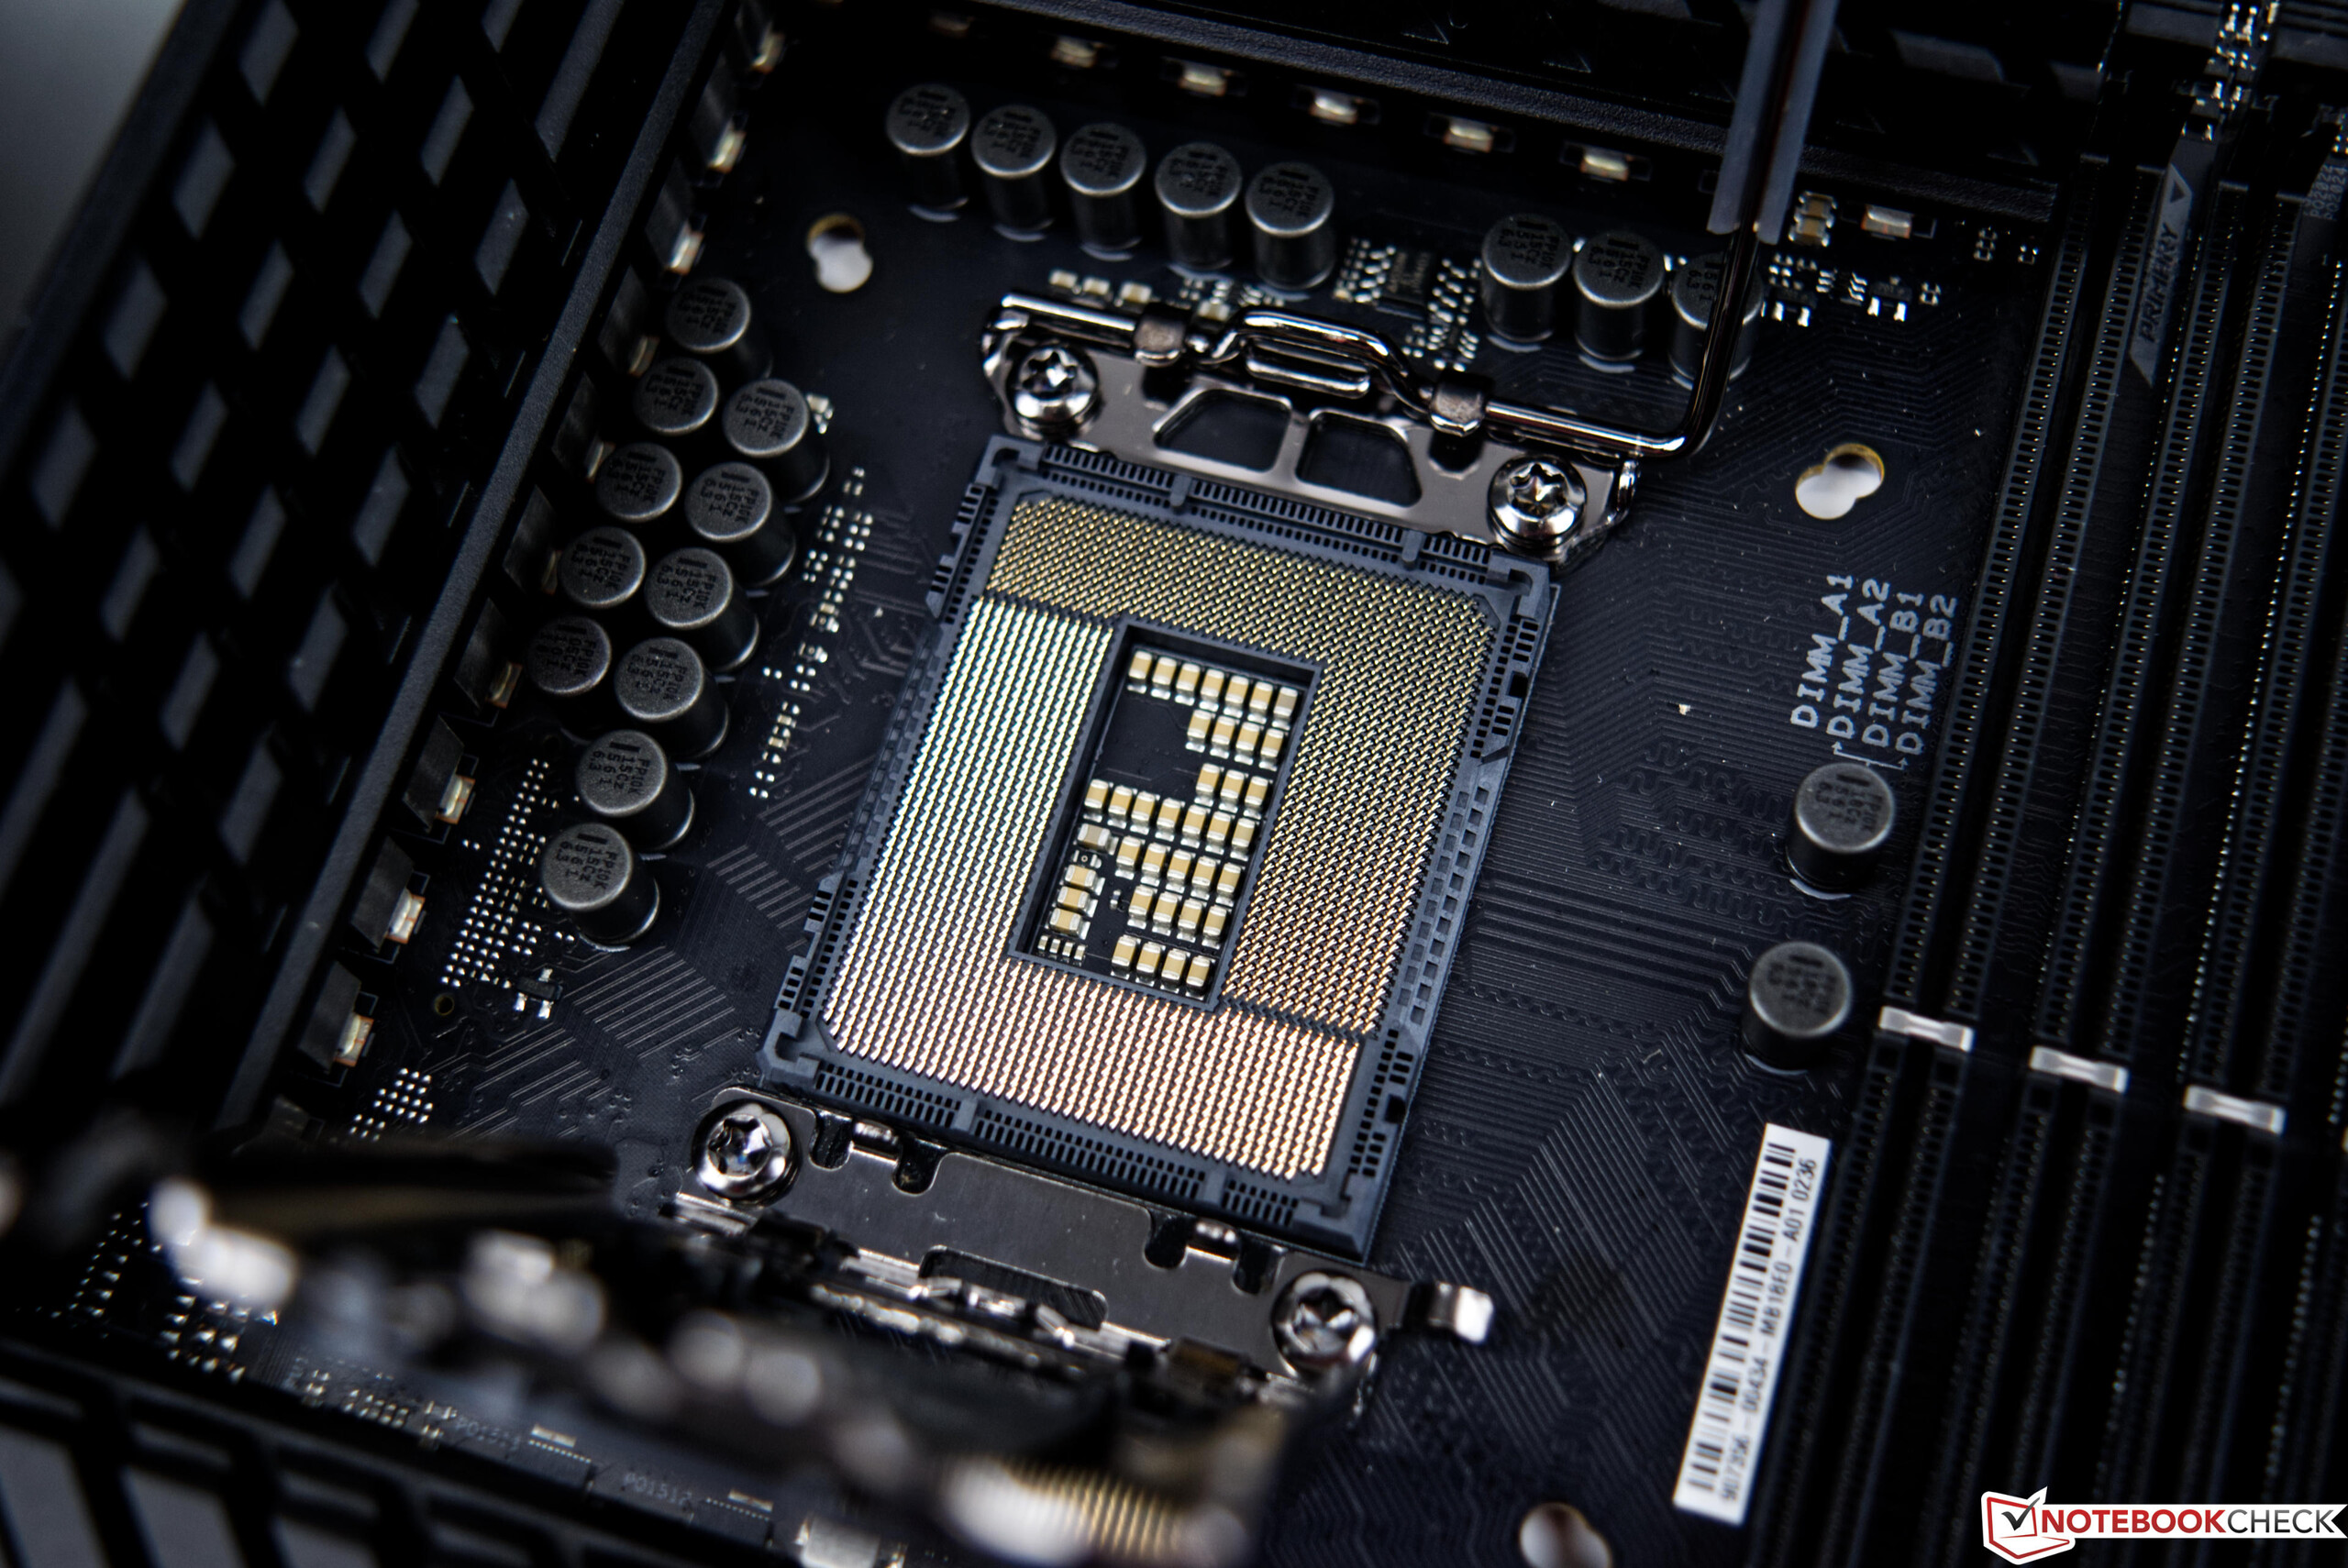
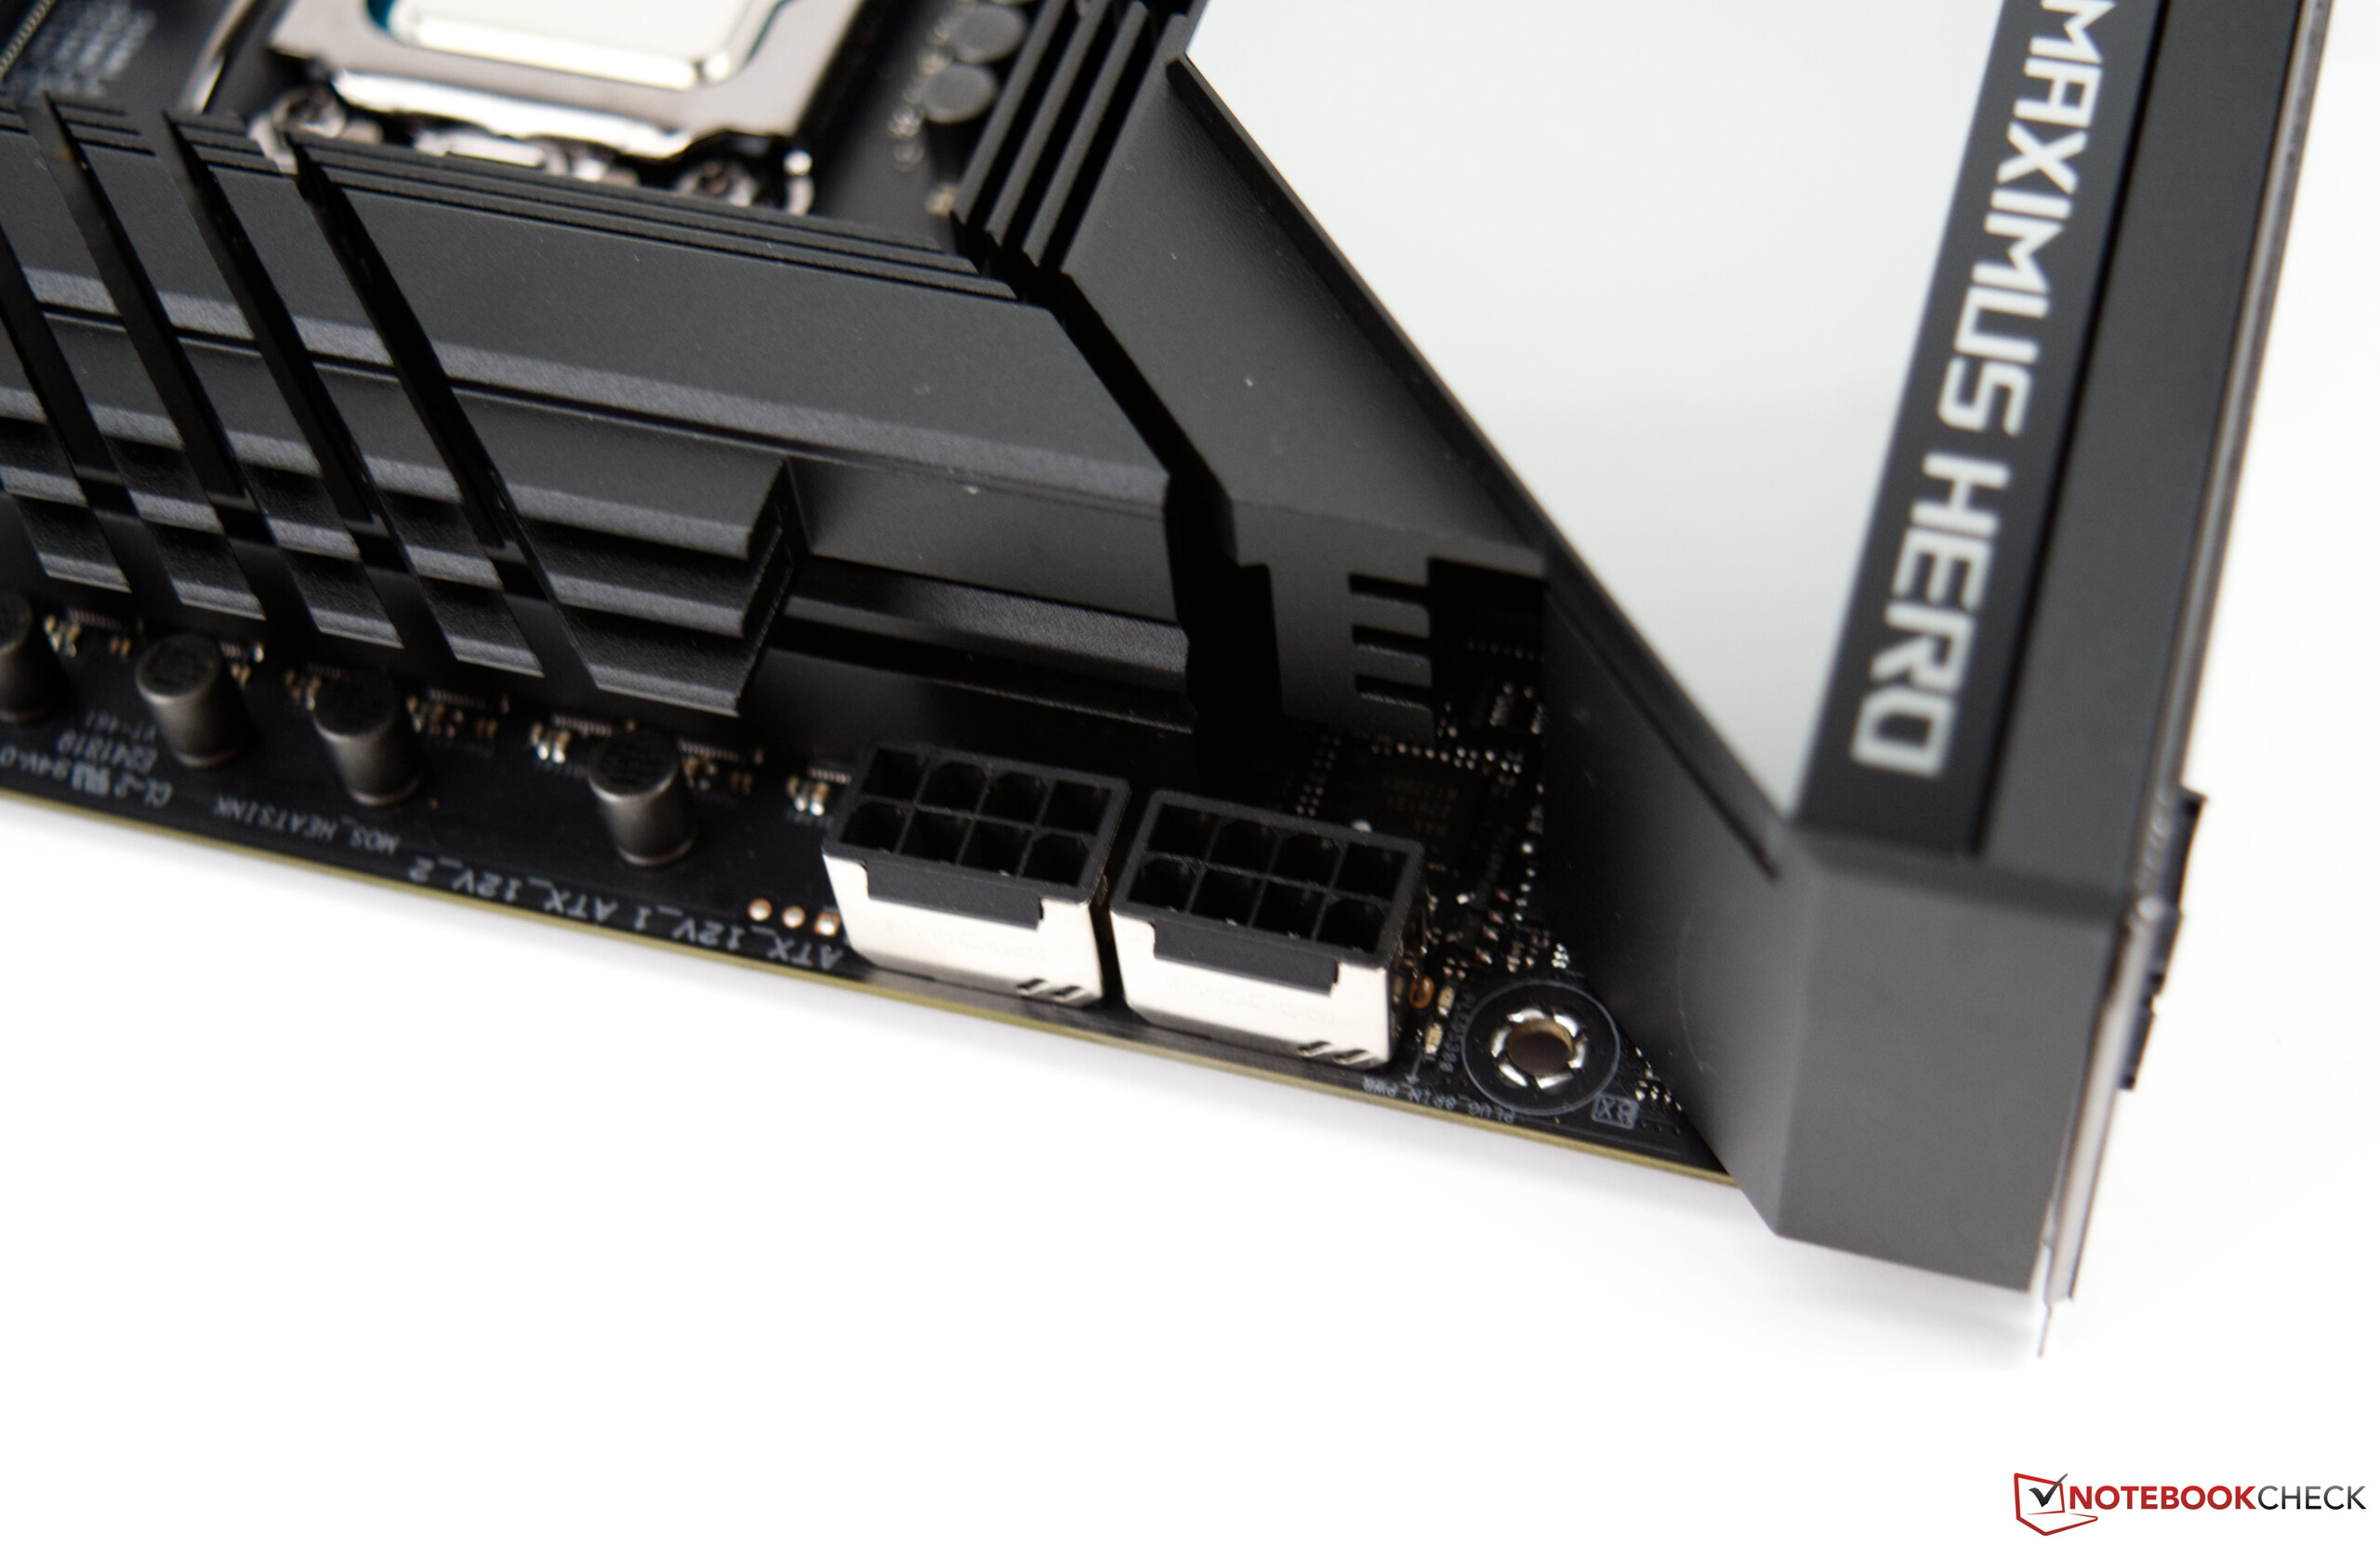
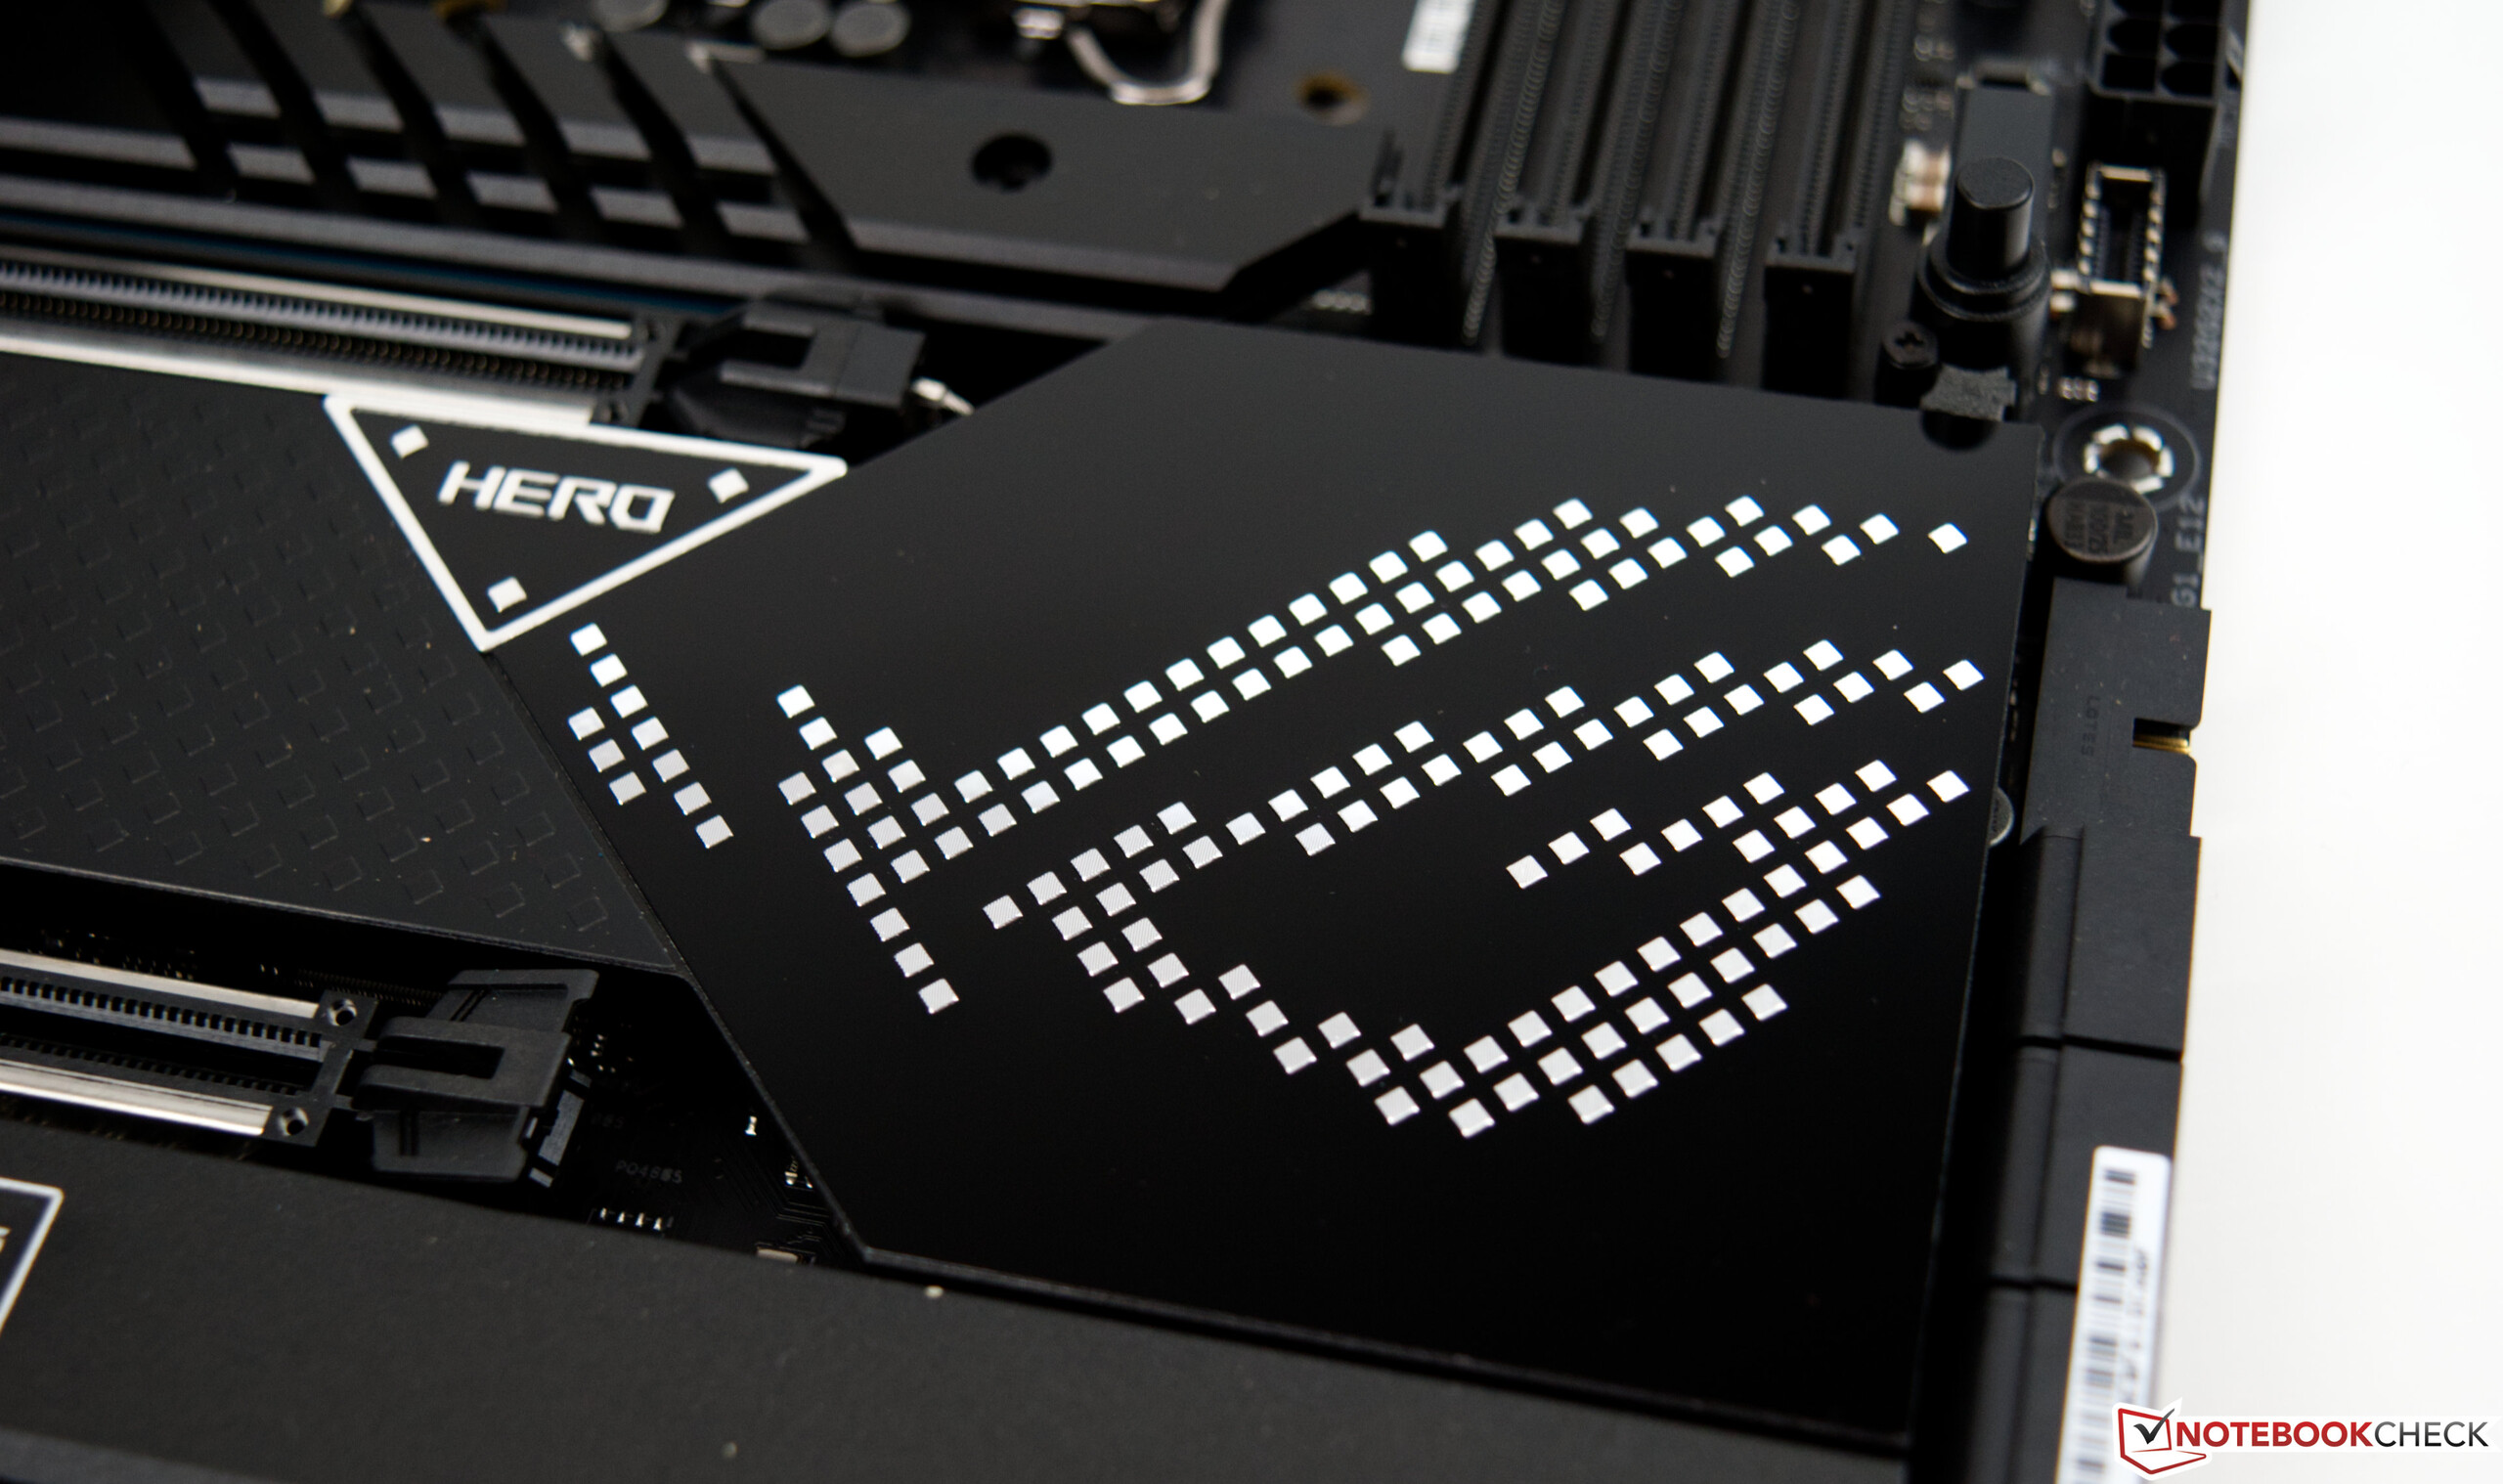
L'Asus ROG Maximus Z690 Hero in dettaglio
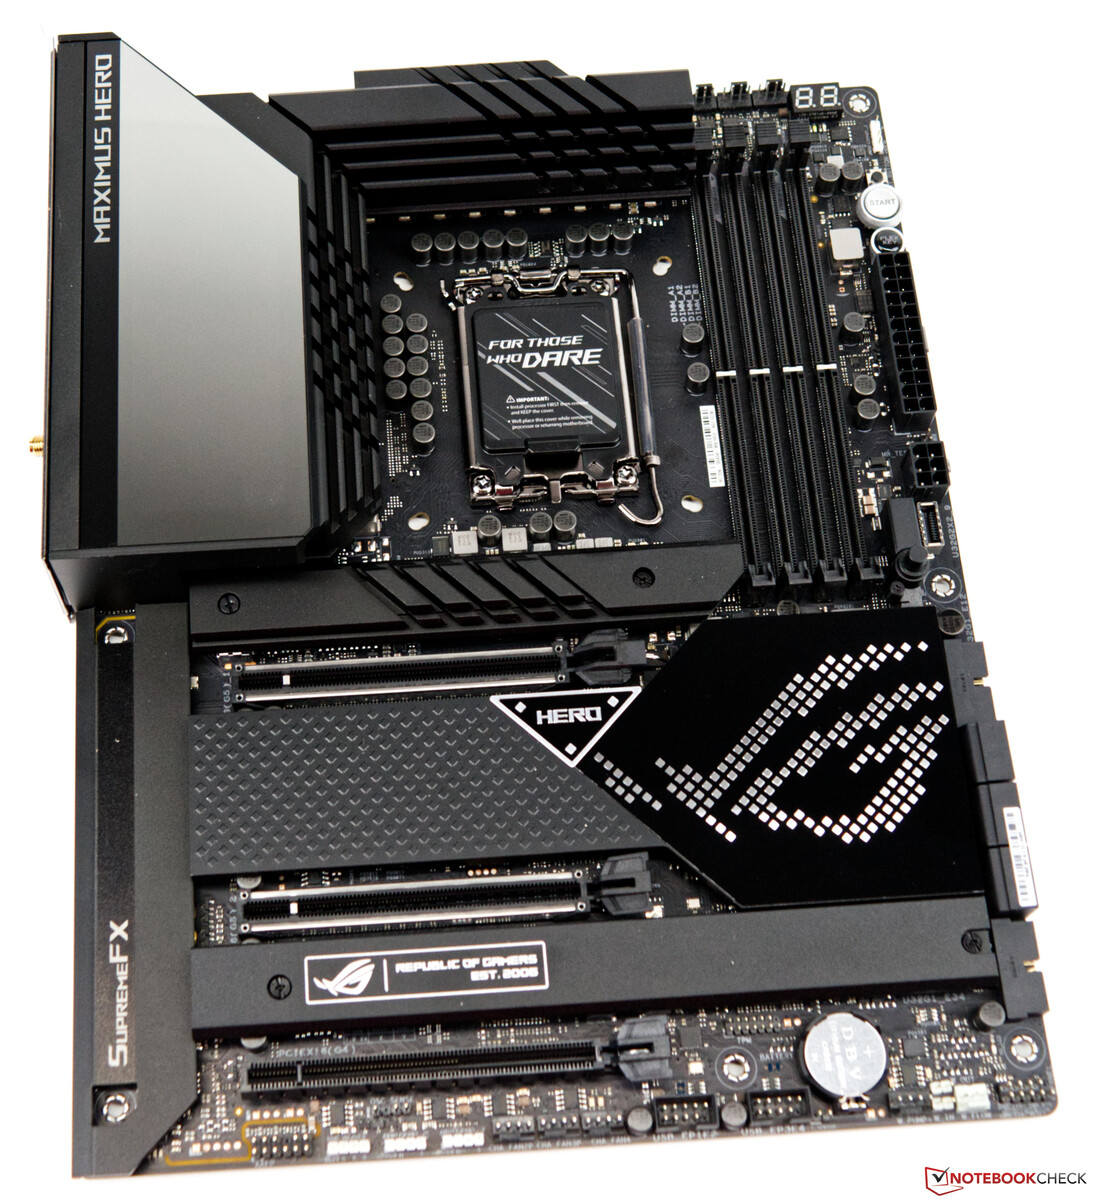
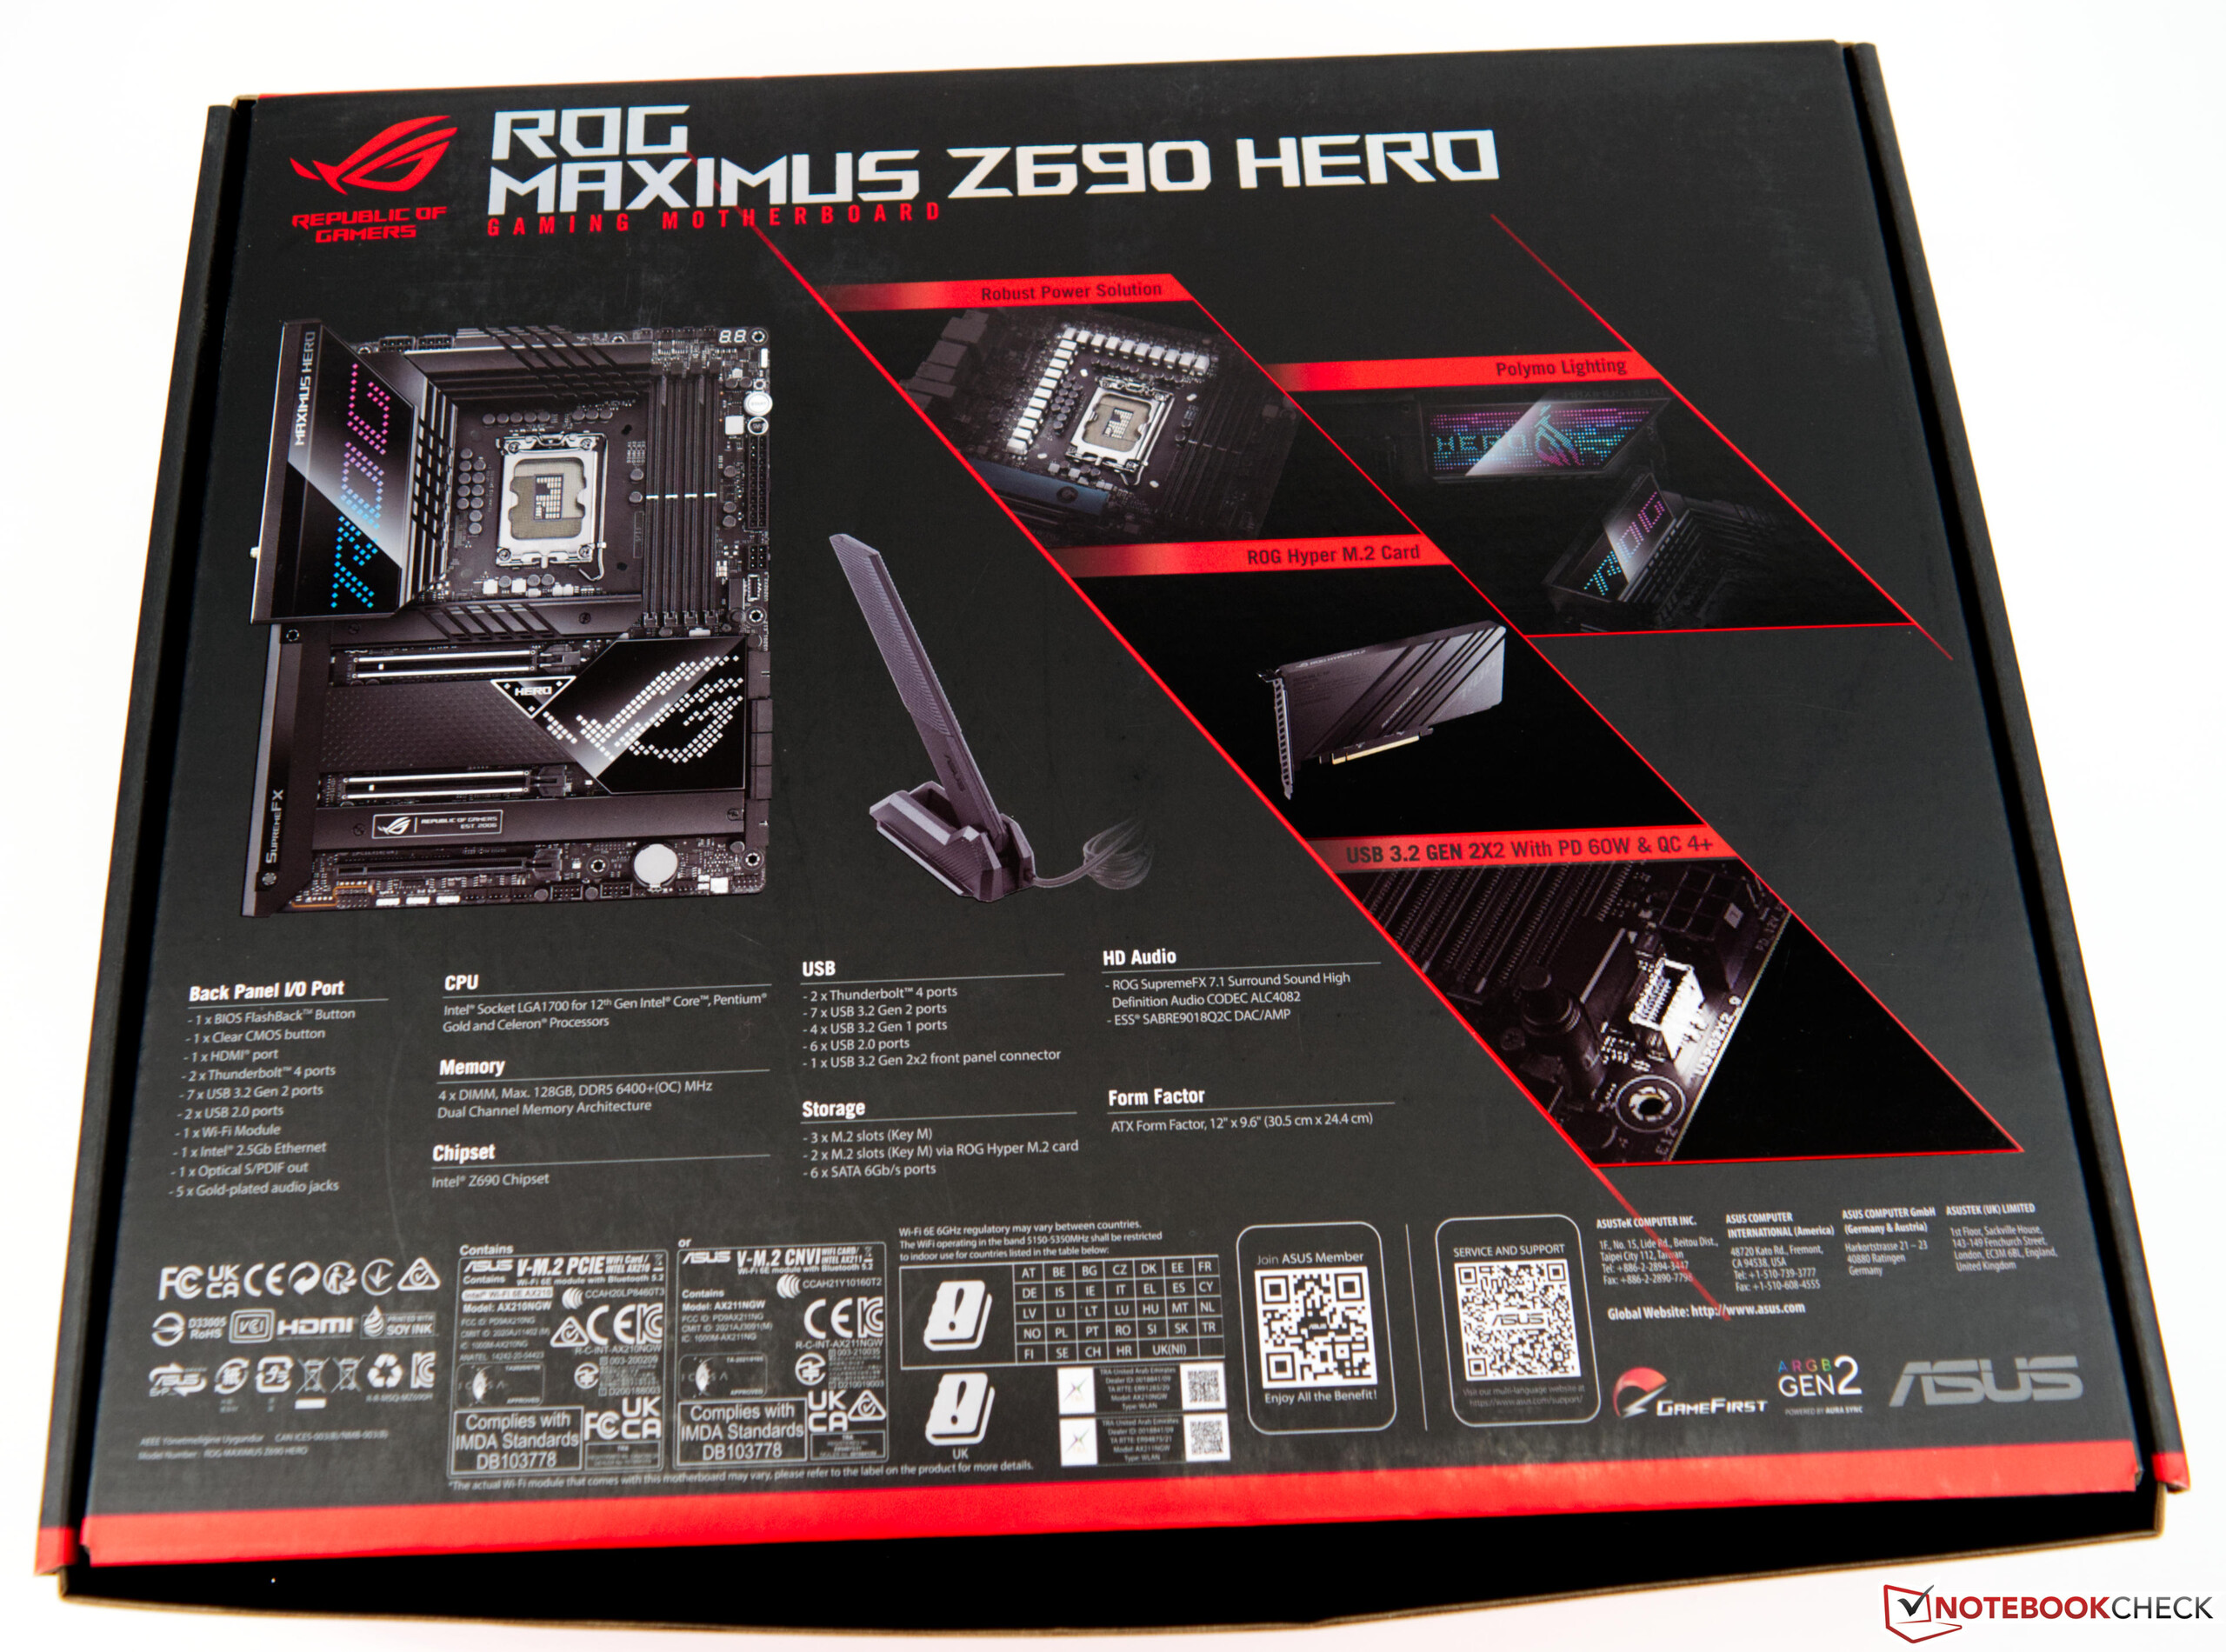
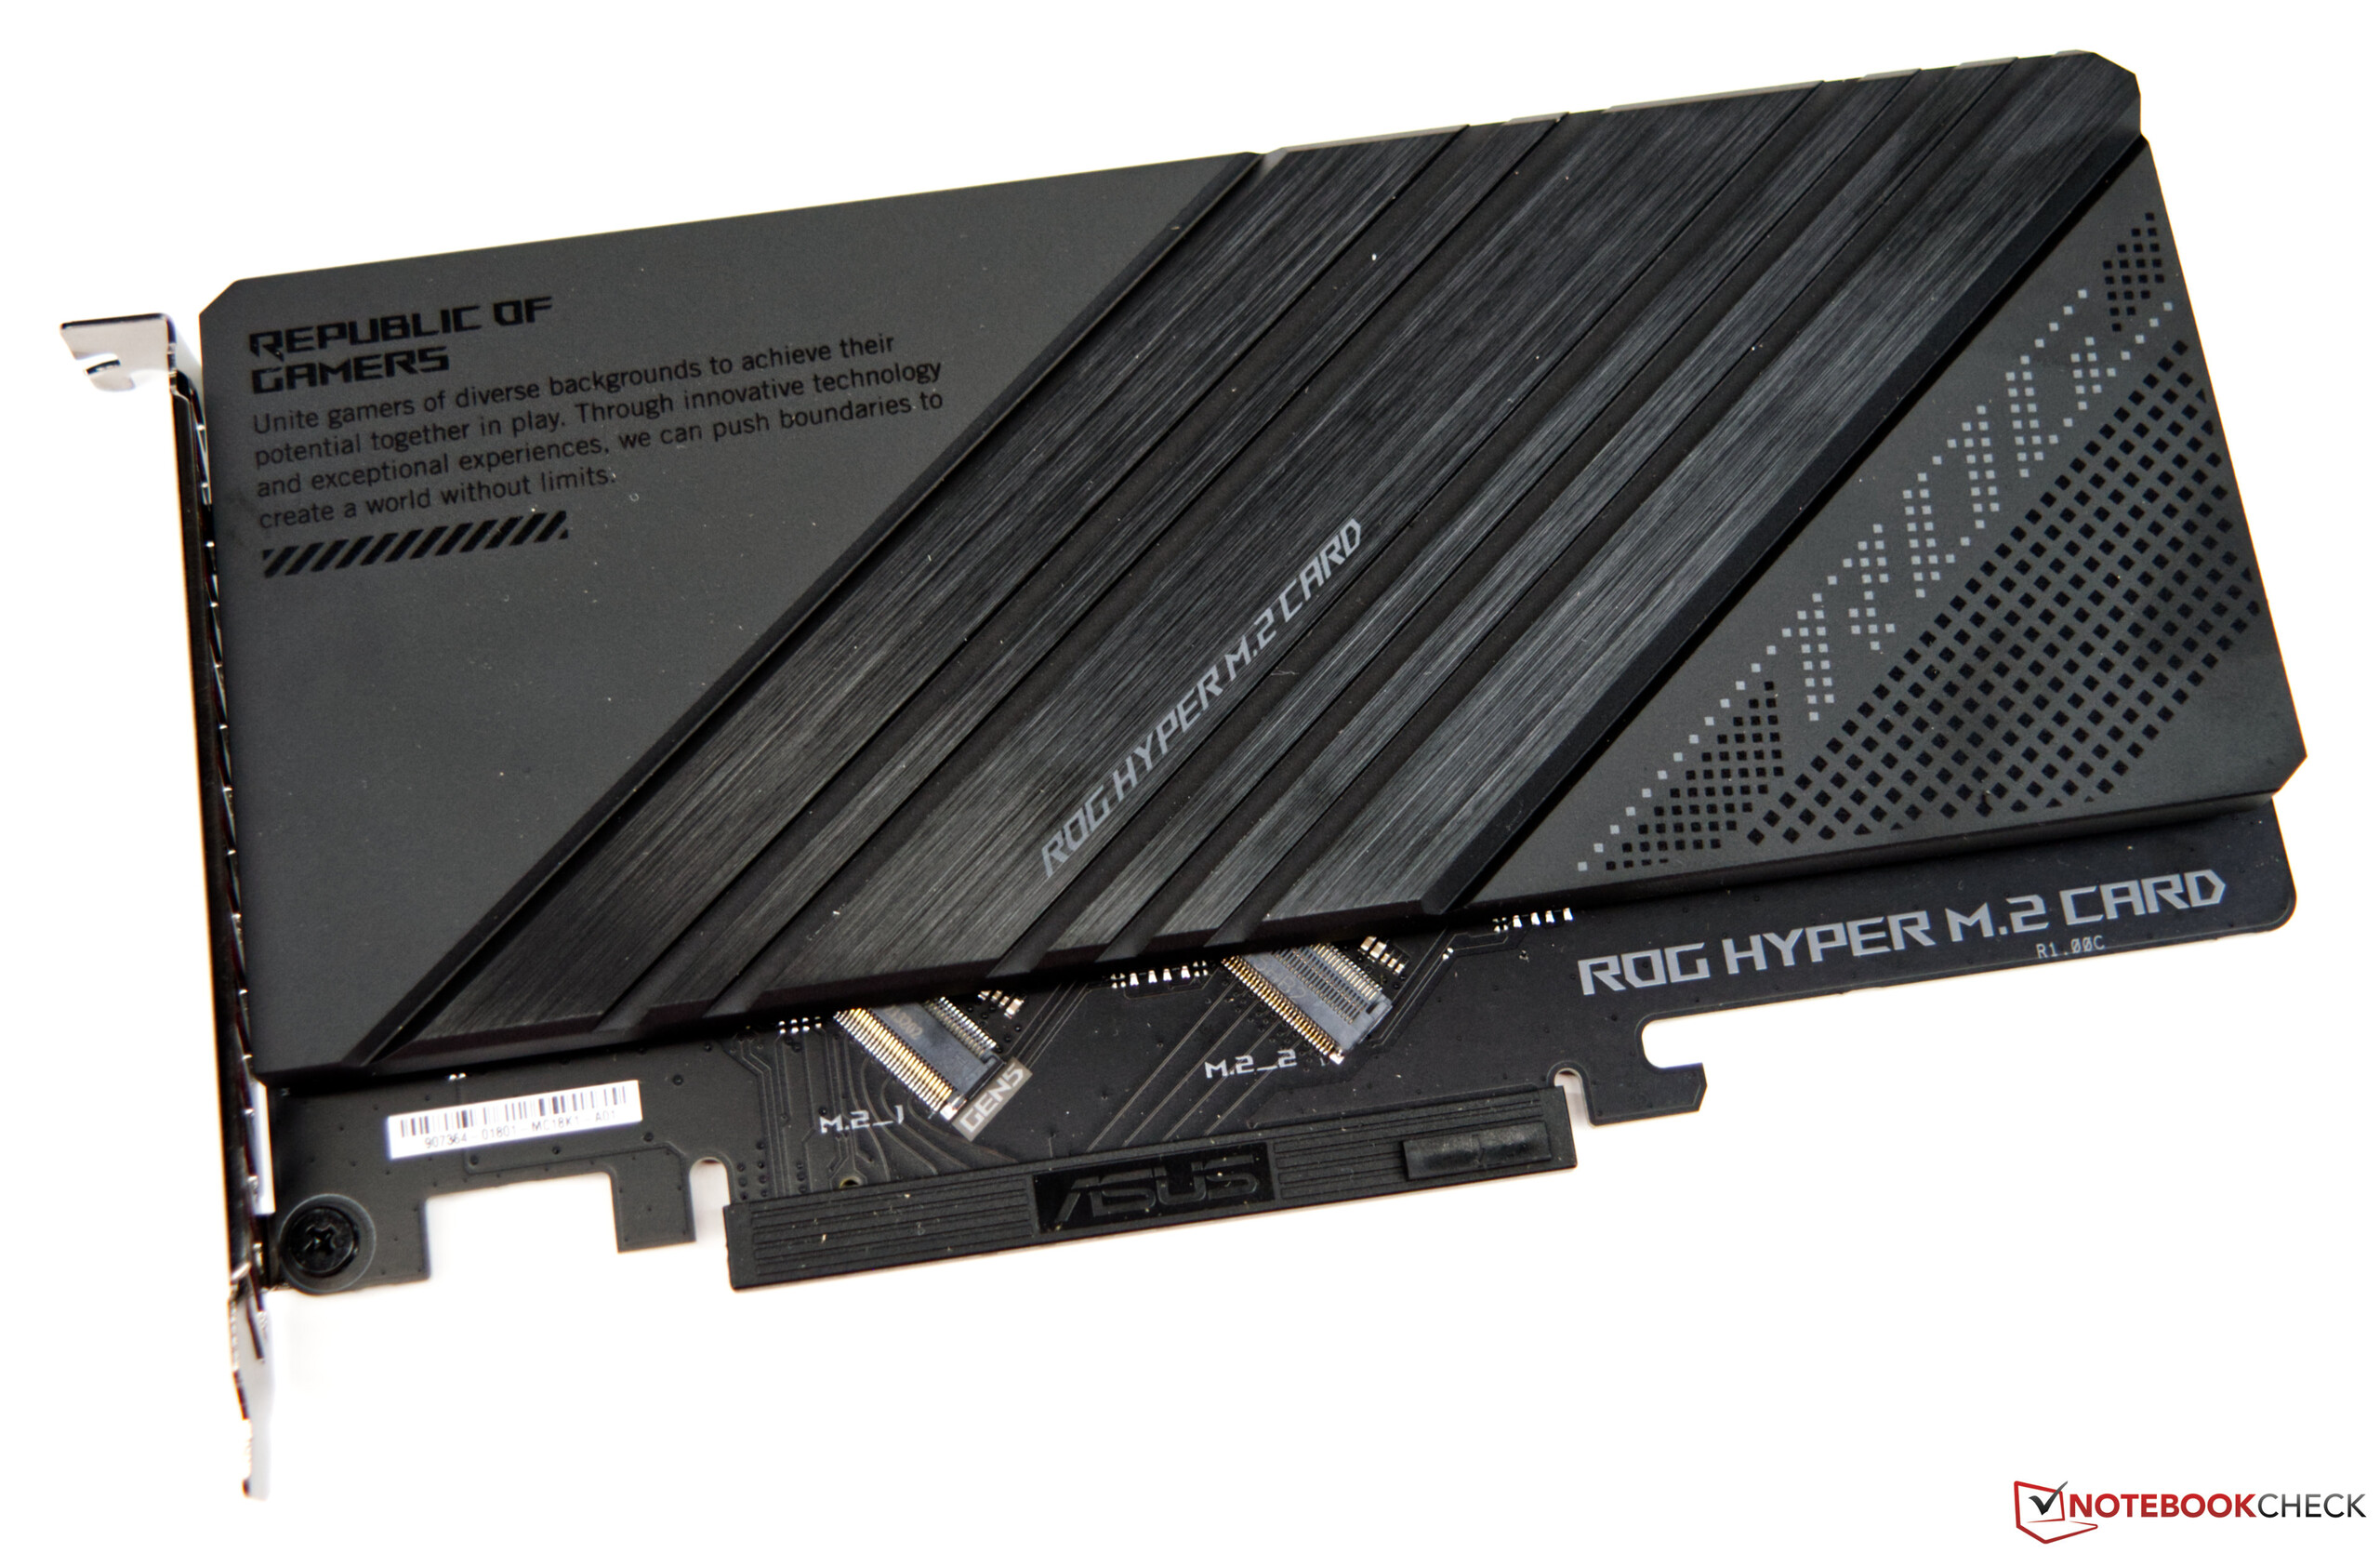
Asus ci ha fornito in tempo il ROG Maximus Z690 HeroRingraziamo Asus Germania per questo prestito. L'Asus ROG Maximus Z690 Hero sembra molto massiccio, il che può essere ricondotto al grande sistema di raffreddamento. In totale, è possibile inserire fino a cinque SSD M.2 sulla scheda madre, ma poi bisogna installare due dei cinque SSD su una scheda Hyper M.2 separata. Questa sarà in grado di utilizzare l'intera larghezza di banda del supporto Gen 5 ed è inclusa come accessorio nella confezione. Il nuovo socket LGA 1700 si distingue per il design leggermente allungato. Molti sistemi di raffreddamento LGA 1200 sono compatibili anche con il nuovo socket LGA 1700, ma dovresti assicurarti di chiedere direttamente al produttore. A volte vengono offerte altre staffe di montaggio per il LGA 1700 al fine di garantire una pressione di contatto ottimale sulla CPU.
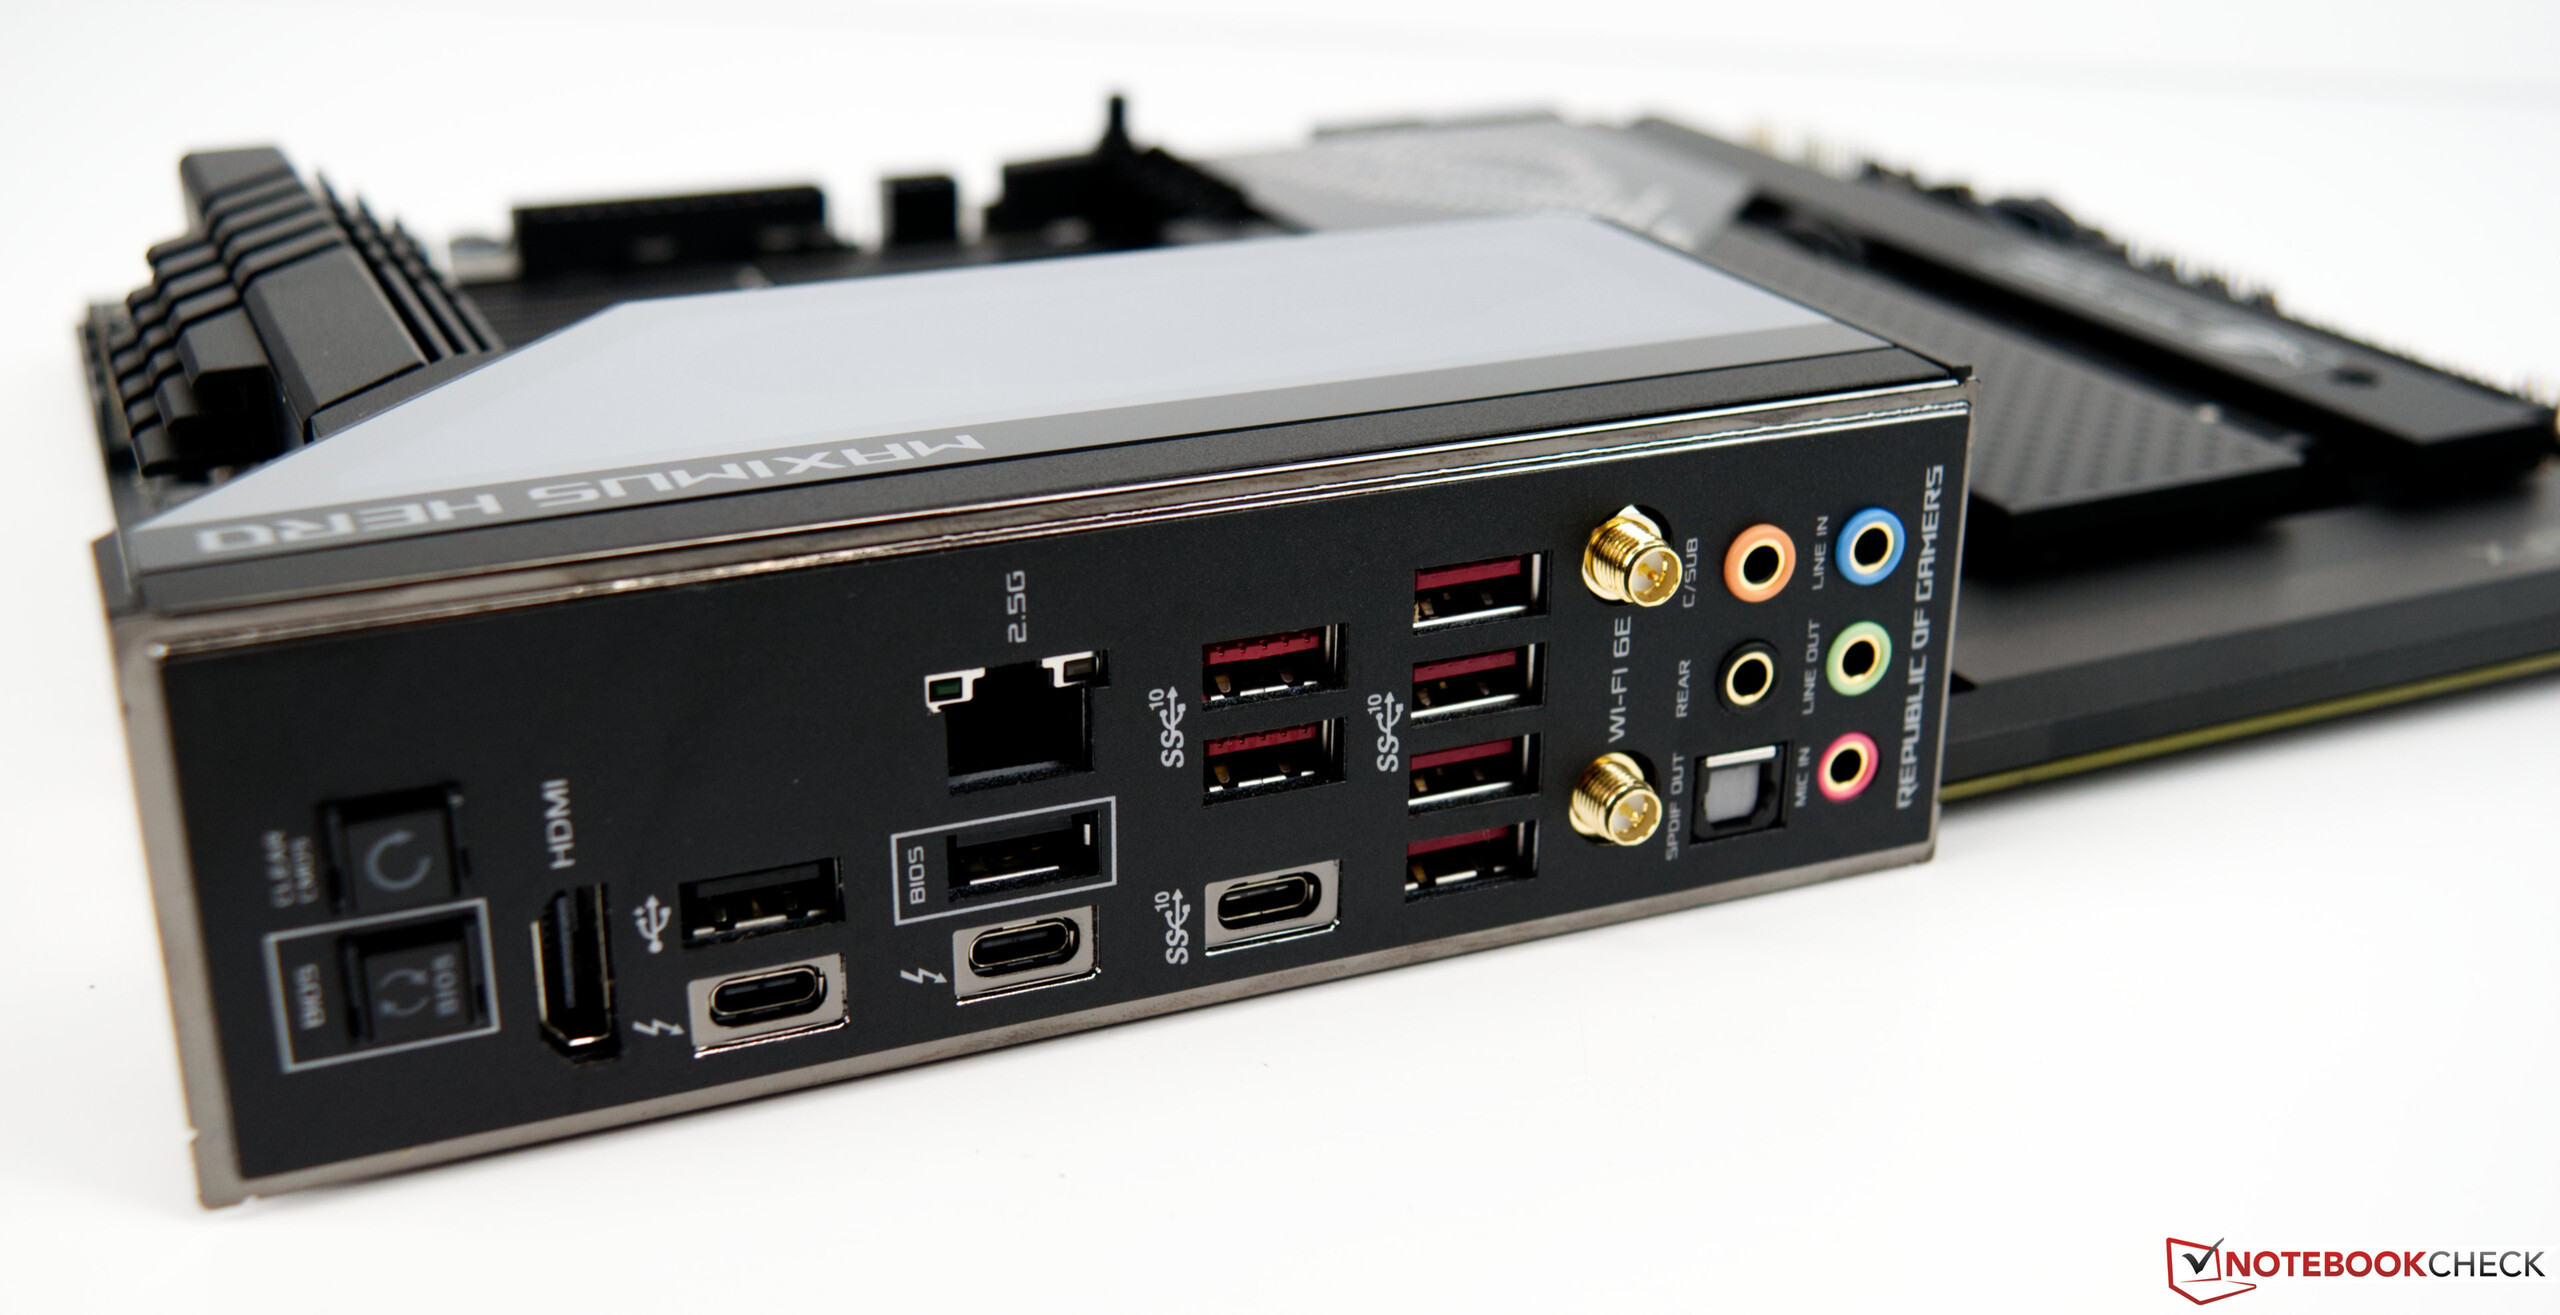
È possibile installare fino a 128 GB della nuova memoria di lavoro DDR5. WiFi, 2.5 Gbit LAN, e un totale di 20 porte USB assicurano una connettività sufficiente.
Due connettori di alimentazione a 8 pin non lontano dal socket forniscono l'alimentazione alla CPU. I trasformatori di tensione sono coperti da un blocco di raffreddamento molto massiccio che include un tubo di calore. Inoltre c'è un attraente pannello Polymo lightning sopra l'I/O Shield, che è un bel vedere.
Benchmark del processore
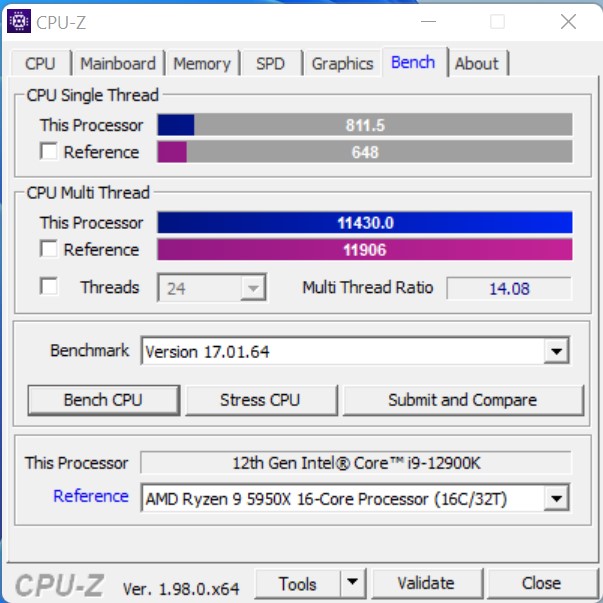
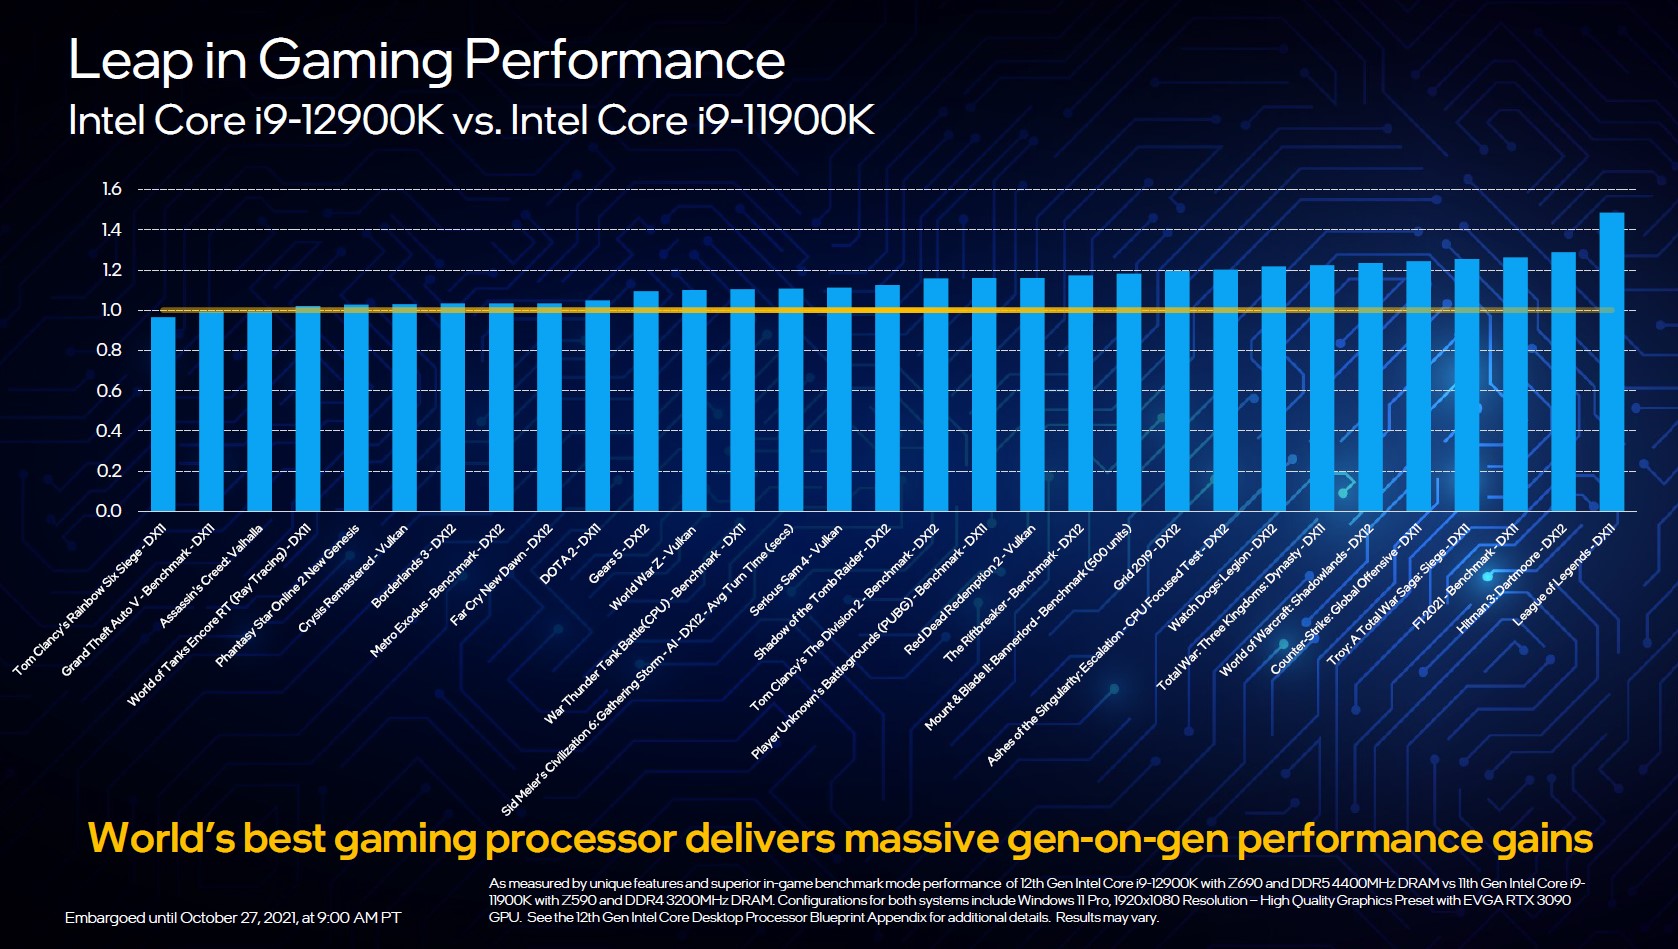
Intel è in grado di mantenere la promessa di un aumento significativo delle prestazionirispetto ai processori Rocket Lake-S. Nella valutazione delle prestazioni, che riflette la differenza di prestazioni su tutti i benchmark elencati, l'Intel Core i9-12900K è in grado di posizionarsi chiaramente in cima. Rispetto alAMD Ryzen 9 5900Xche offre anche 24 threads in totale, la nuova nave ammiraglia di Intel è in vantaggio di 13 punti percentuali. Se prendiamo lIntel Core i9-11900K come riferimento, il Core i9-12900K è più veloce del 23%. Mentre le differenze variano leggermente nei benchmark separati, questo è dovuto alla corrispondente architettura della CPU.
Vediamo un quadro simile con il più piccolo Intel Core i5-12600K. Se usiamo il AMD Ryzen 7 5800X come concorrente, dato che ha la stessa quantità di thread, entrambi i concorrenti si comportano allo stesso livello nei risultati cumulativi dei benchmark. D'altra parte, il processore Zen3 ha difficoltà a competere con le potenti prestazioni single-core di Intel. Ma non si dovrebbe ancora cancellare AMD, dato che le CPU Zen3 sono già sul mercato da un anno e secondo alcune voci, il successore è già ai blocchi di partenza. Quando sarà disponibile, i dadi saranno gettati di nuovo e Rocket Lake-S dovrà dimostrare ancora una volta il suo valore.
A causa della discussione PL1 = PL2, abbiamo preso Cinebench R23 ed eseguito un'altra corsa con un valore PL1 limitato a 125 watt. Non ci sono stati cambiamenti nel risultato degni di nota. Le differenze erano minime e possono essere considerate all'interno delle tolleranze di misurazione.
Era chiaro che Intel avrebbe fatto un salto significativo con il nuovo design dei core P ed E. Con questo, Intel è anche in grado di chiudere il gap con i processori a 12 e 16 core di AMD, cosa che non era possibile con il Core i9-11900K.
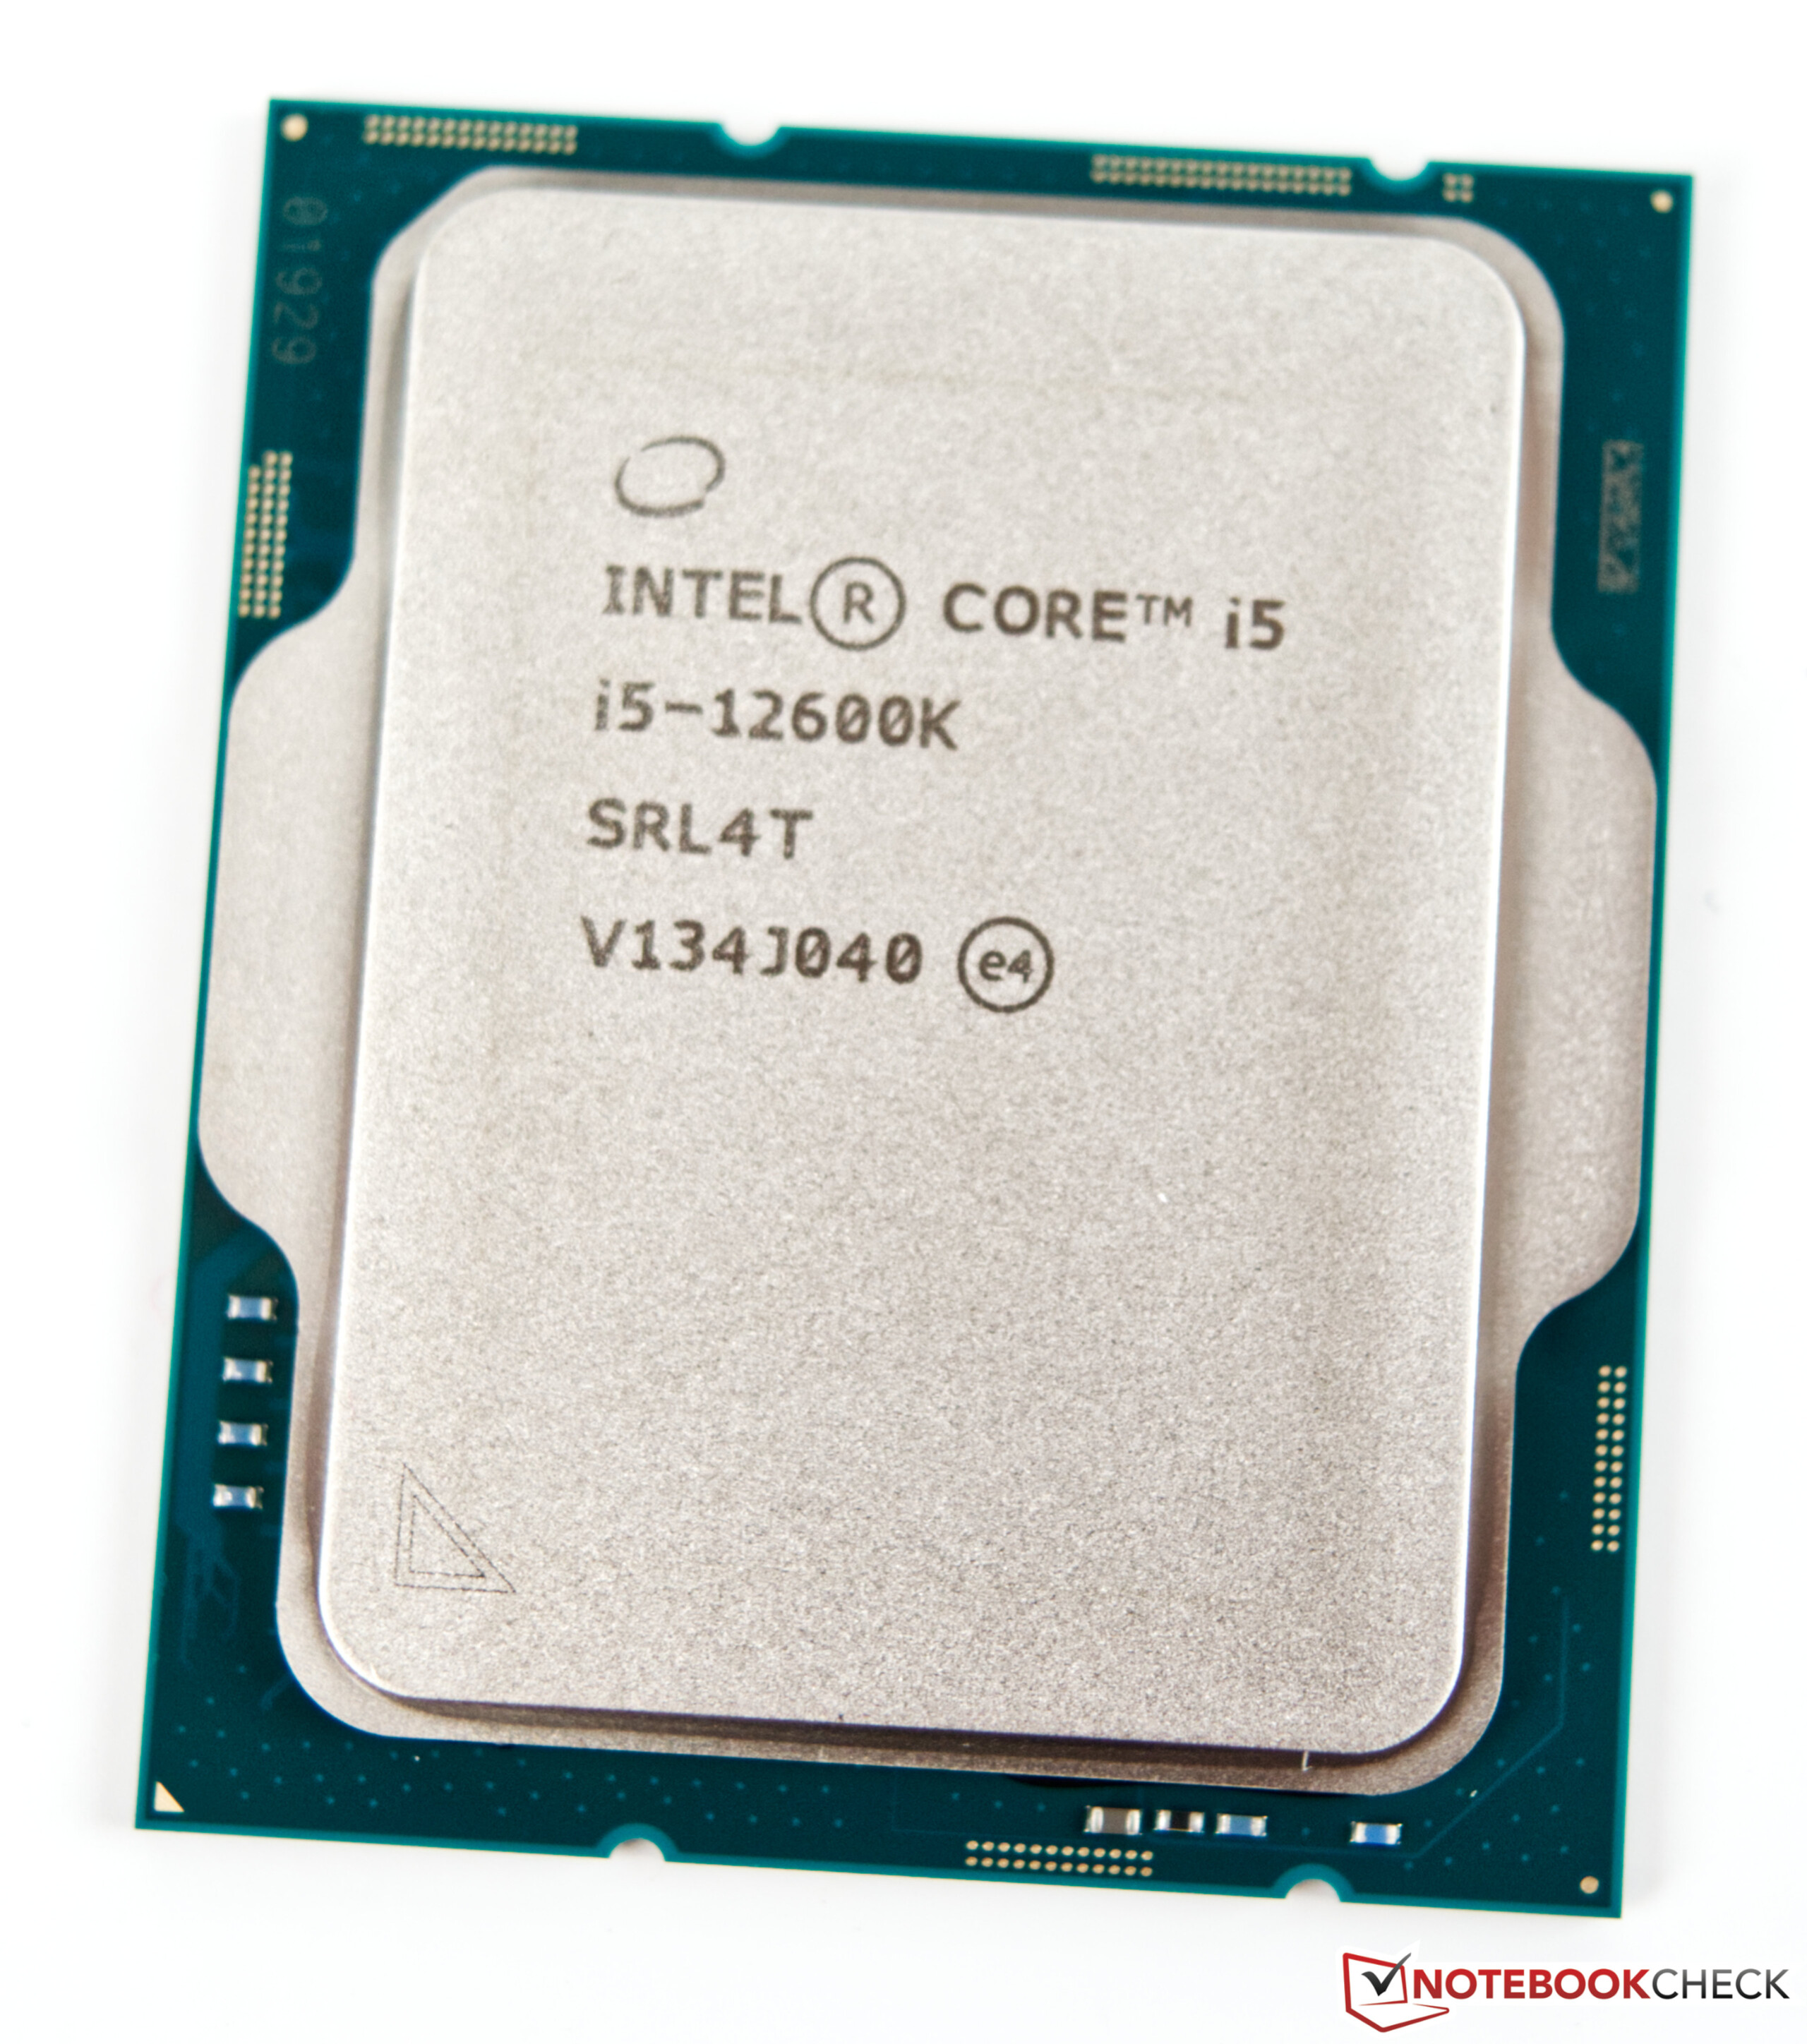
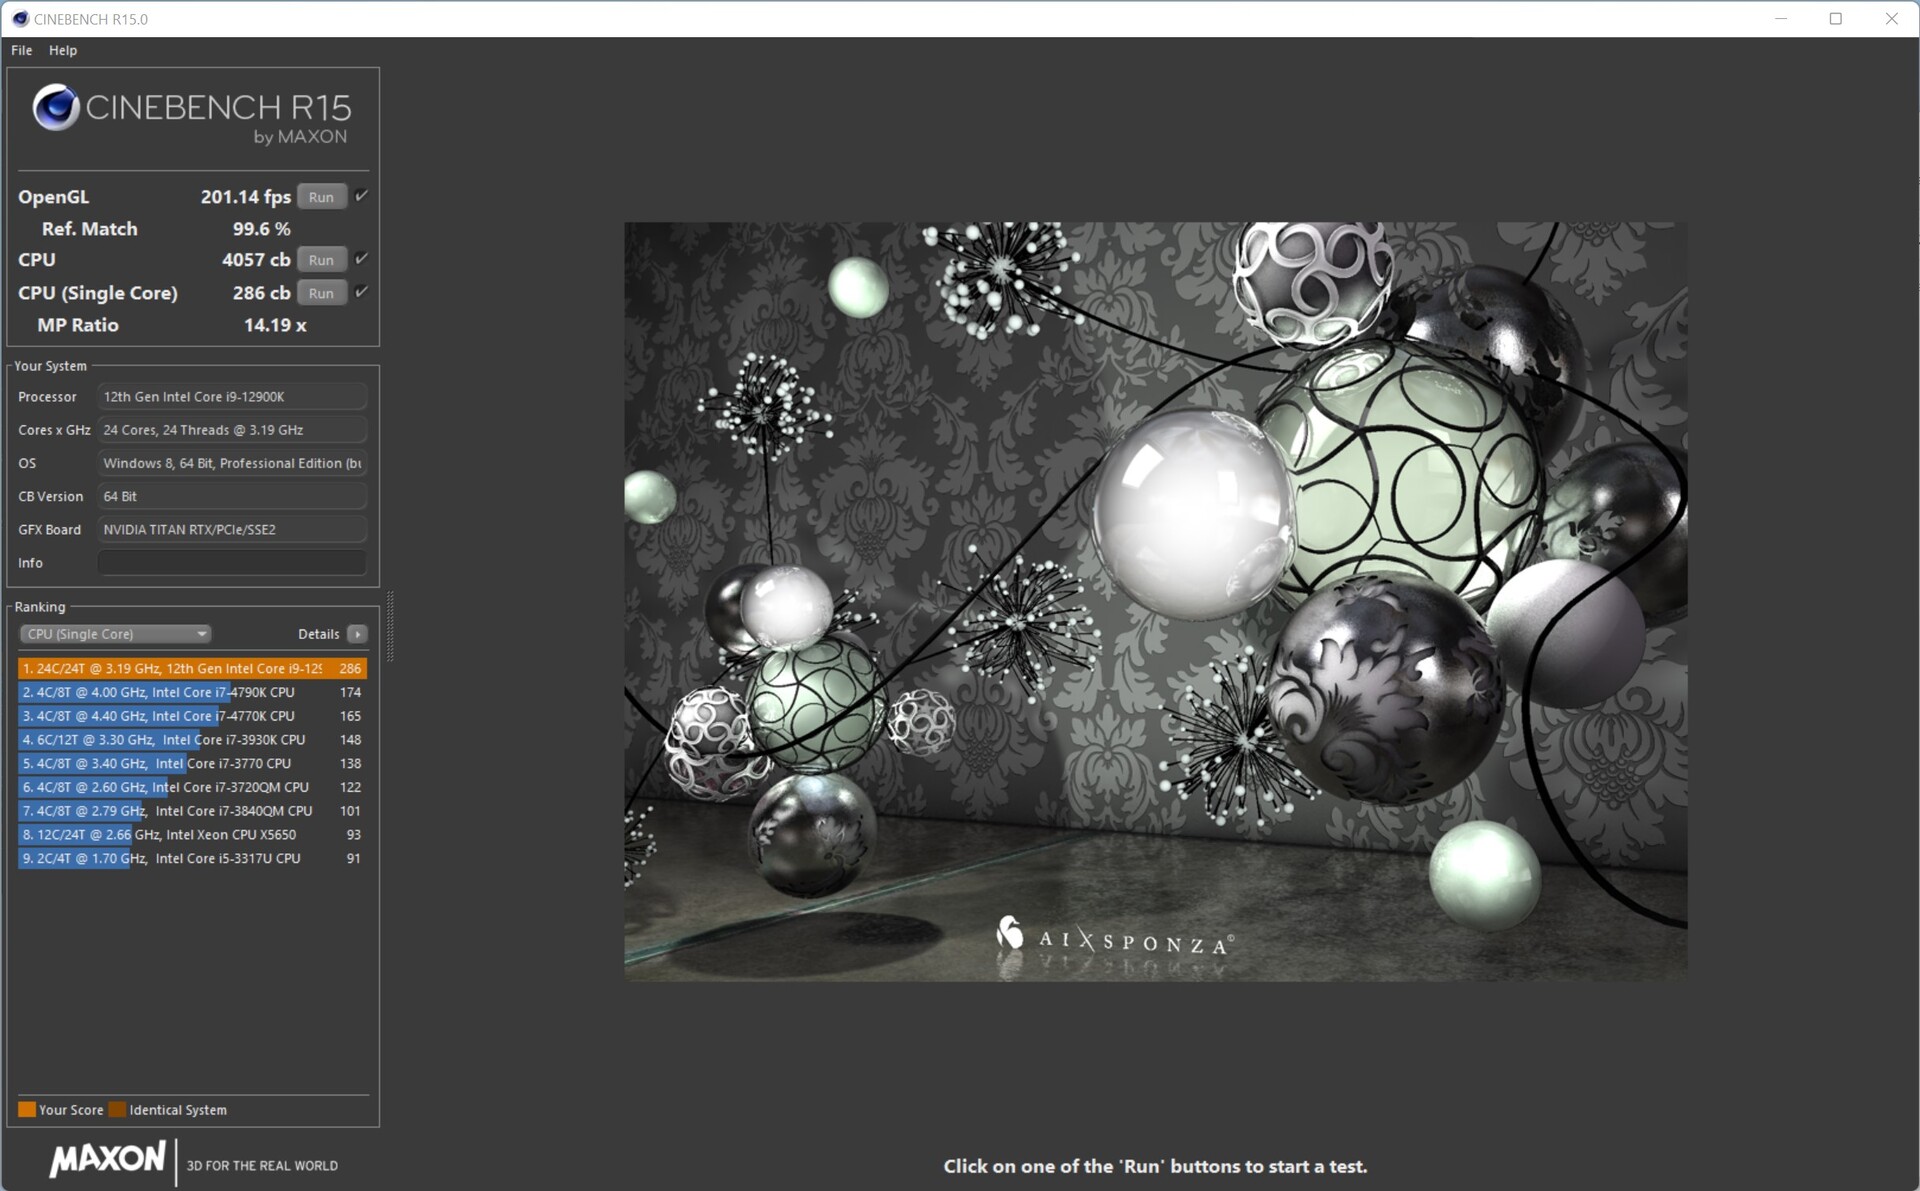
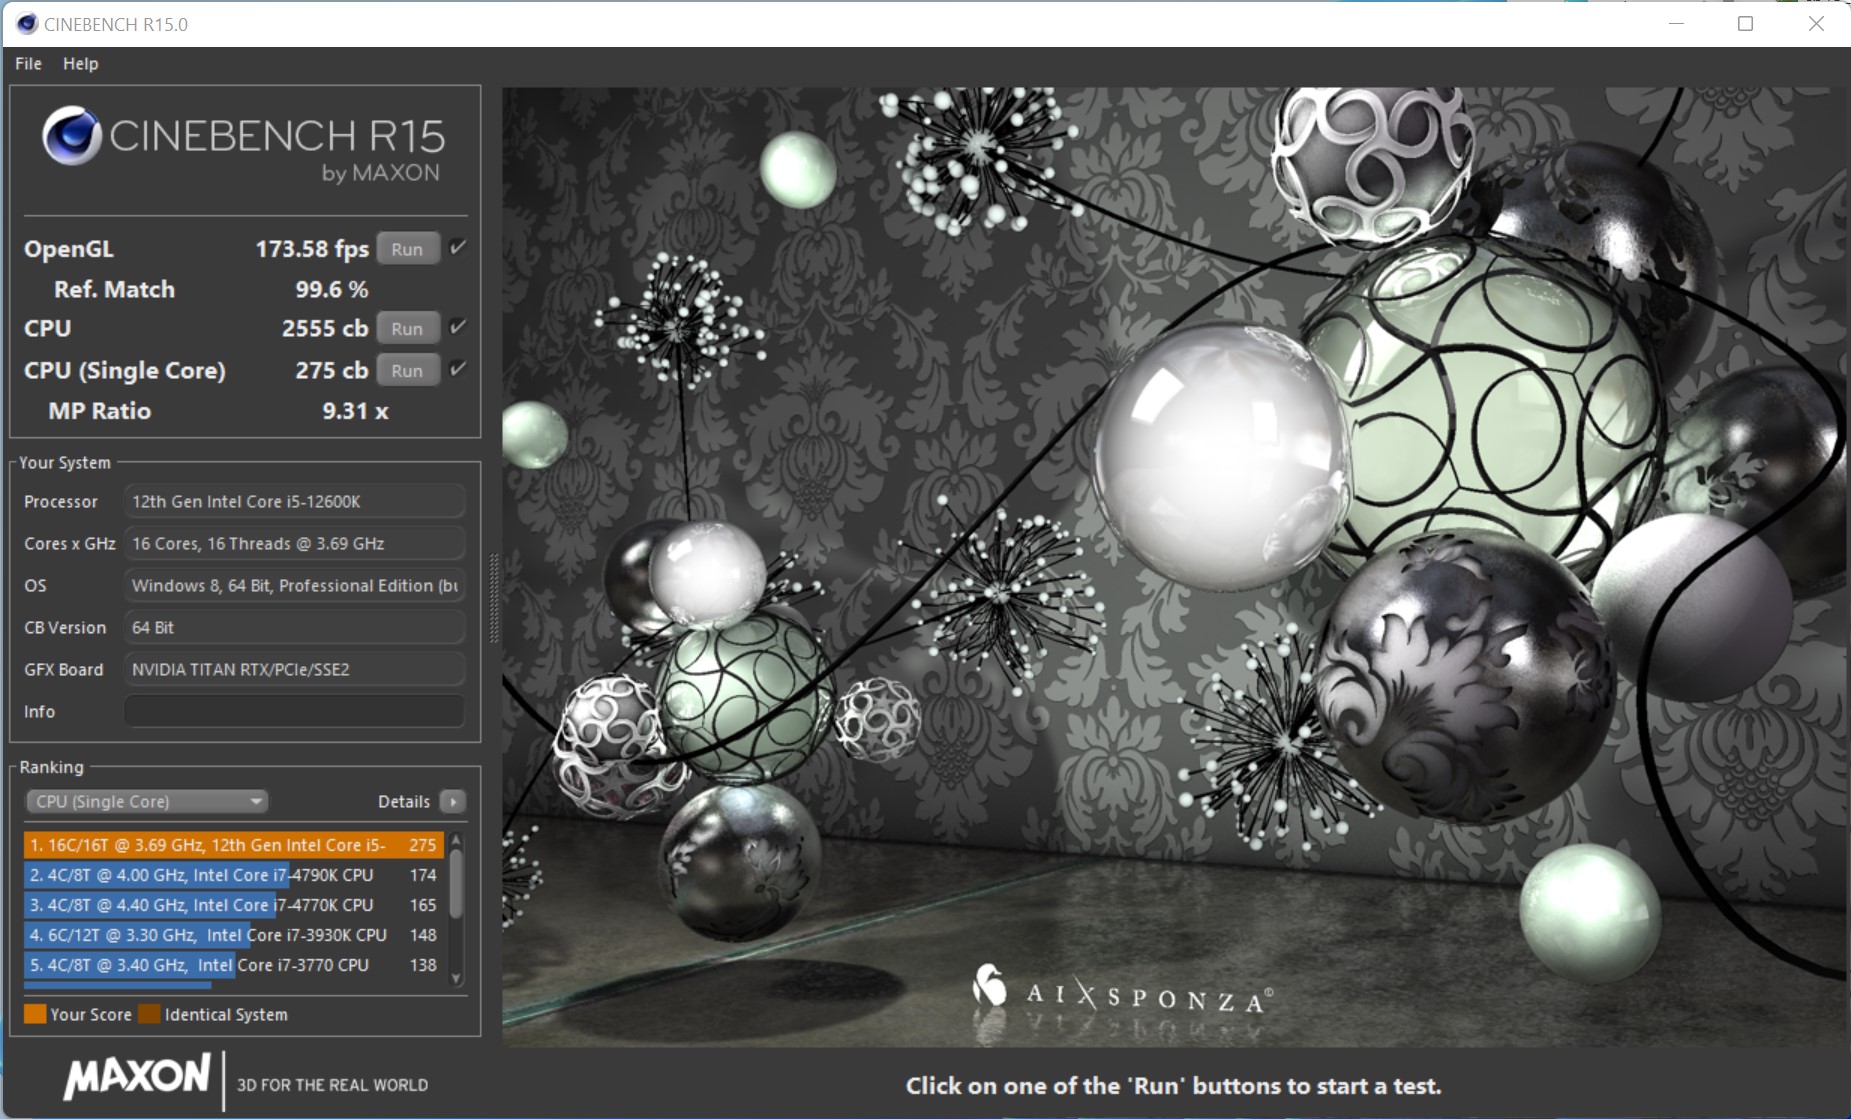
Intel Core i5-12600K
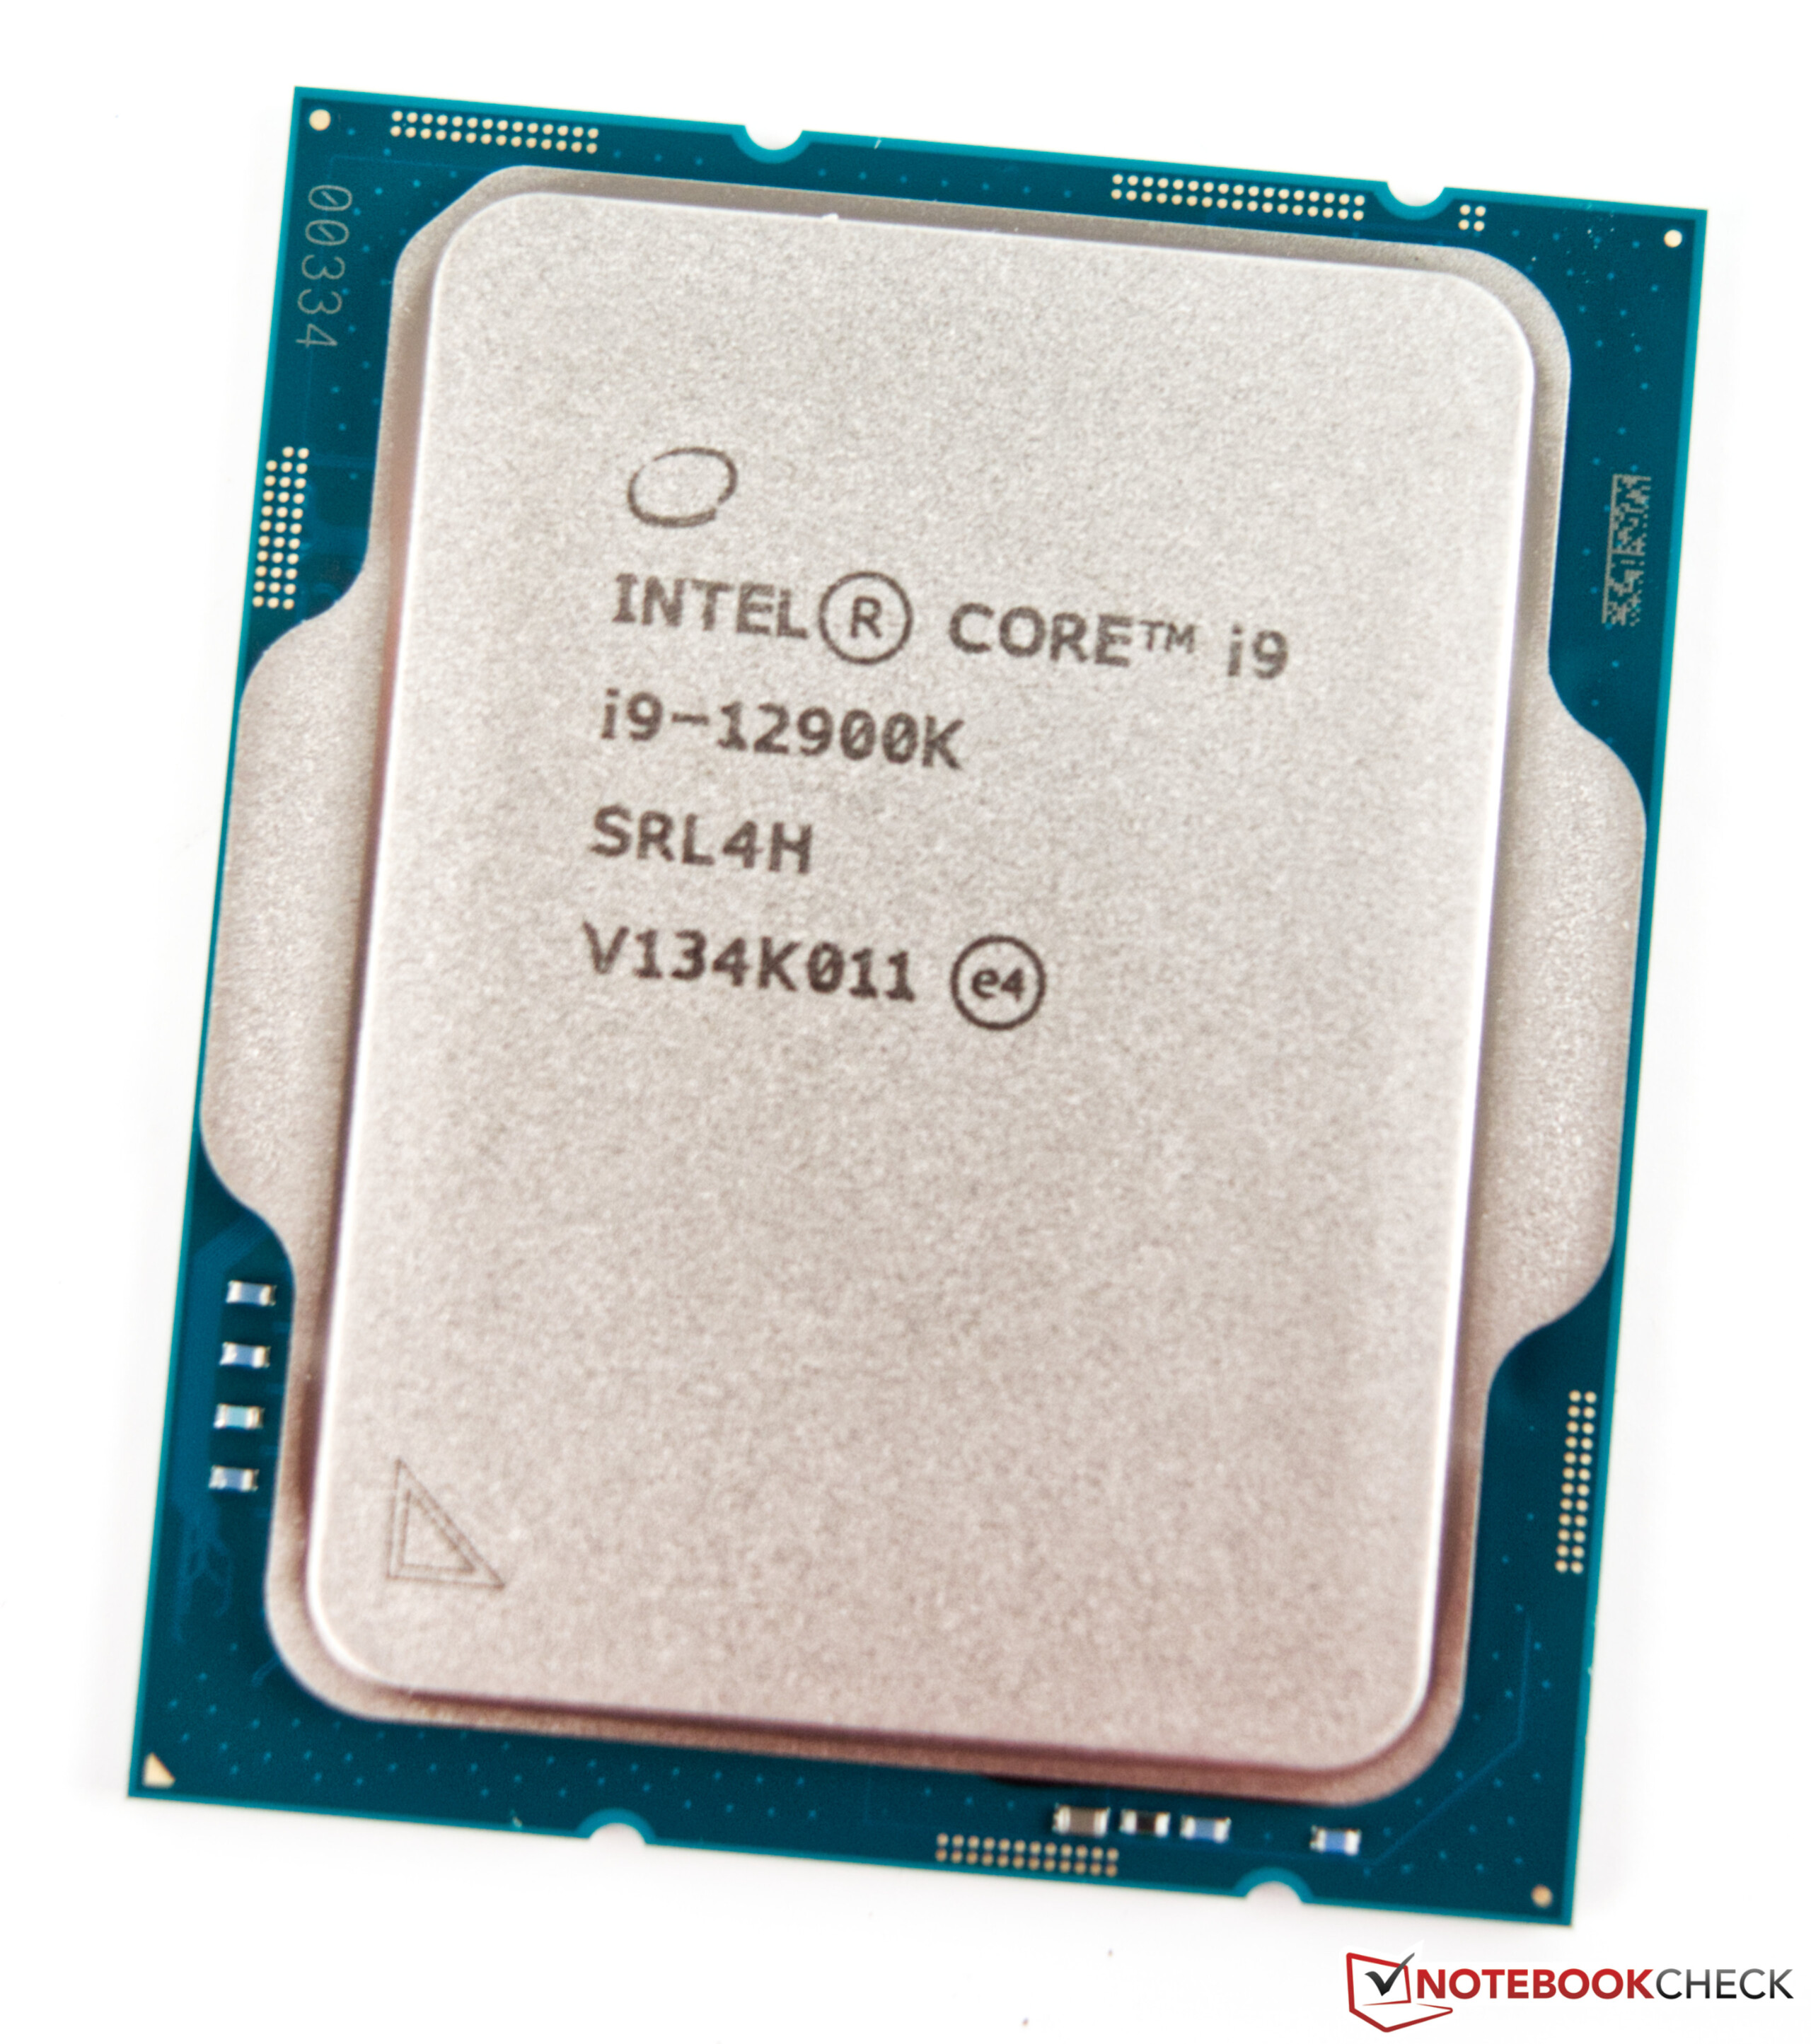
Intel Core i9-12900K

| Performance rating - Percent | |
| Intel Core i9-12900K | |
| AMD Ryzen 9 5950X | |
| Intel Core i5-12600K | |
| AMD Ryzen 9 5900X -2! | |
| AMD Ryzen 7 5800X | |
| Intel Core i9-11900K | |
| Intel Core i9-10900K | |
| AMD Ryzen 5 5600X | |
| Intel Core i5-11600K | |
| Intel Core i5-10600K | |
| Cinebench R15 | |
| CPU Single 64Bit | |
| Intel Core i9-12900K | |
| Intel Core i5-12600K | |
| AMD Ryzen 9 5950X | |
| AMD Ryzen 9 5900X | |
| AMD Ryzen 7 5800X | |
| Intel Core i9-11900K | |
| AMD Ryzen 5 5600X | |
| Intel Core i5-11600K | |
| Intel Core i9-10900K | |
| Intel Core i5-10600K | |
| CPU Multi 64Bit | |
| AMD Ryzen 9 5950X | |
| Intel Core i9-12900K | |
| AMD Ryzen 9 5900X | |
| Intel Core i9-10900K | |
| AMD Ryzen 7 5800X | |
| Intel Core i5-12600K | |
| Intel Core i9-11900K | |
| AMD Ryzen 5 5600X | |
| Intel Core i5-11600K | |
| Intel Core i5-10600K | |
| Cinebench R20 | |
| CPU (Single Core) | |
| Intel Core i9-12900K | |
| Intel Core i5-12600K | |
| Intel Core i9-11900K | |
| AMD Ryzen 9 5950X | |
| AMD Ryzen 9 5900X | |
| AMD Ryzen 7 5800X | |
| AMD Ryzen 5 5600X | |
| Intel Core i5-11600K | |
| Intel Core i9-10900K | |
| Intel Core i5-10600K | |
| CPU (Multi Core) | |
| AMD Ryzen 9 5950X | |
| Intel Core i9-12900K | |
| AMD Ryzen 9 5900X | |
| Intel Core i5-12600K | |
| Intel Core i9-10900K | |
| AMD Ryzen 7 5800X | |
| Intel Core i9-11900K | |
| AMD Ryzen 5 5600X | |
| Intel Core i5-11600K | |
| Intel Core i5-10600K | |
| Cinebench R23 | |
| Single Core | |
| Intel Core i9-12900K | |
| Intel Core i5-12600K | |
| Intel Core i9-11900K | |
| AMD Ryzen 9 5950X | |
| AMD Ryzen 9 5900X | |
| Intel Core i5-11600K | |
| AMD Ryzen 7 5800X | |
| AMD Ryzen 5 5600X | |
| Intel Core i5-10600K | |
| Intel Core i9-10900K | |
| Multi Core | |
| AMD Ryzen 9 5950X | |
| Intel Core i9-12900K | |
| AMD Ryzen 9 5900X | |
| Intel Core i5-12600K | |
| Intel Core i9-10900K | |
| Intel Core i9-11900K | |
| AMD Ryzen 7 5800X | |
| AMD Ryzen 5 5600X | |
| Intel Core i5-11600K | |
| Intel Core i5-10600K | |
| Cinebench R11.5 | |
| CPU Single 64Bit | |
| Intel Core i9-12900K | |
| Intel Core i5-12600K | |
| AMD Ryzen 9 5900X | |
| AMD Ryzen 9 5950X | |
| Intel Core i9-11900K | |
| AMD Ryzen 7 5800X | |
| AMD Ryzen 5 5600X | |
| Intel Core i5-11600K | |
| Intel Core i9-10900K | |
| Intel Core i5-10600K | |
| CPU Multi 64Bit | |
| AMD Ryzen 9 5950X | |
| Intel Core i9-12900K | |
| AMD Ryzen 9 5900X | |
| Intel Core i5-12600K | |
| AMD Ryzen 7 5800X | |
| Intel Core i9-10900K | |
| Intel Core i9-11900K | |
| AMD Ryzen 5 5600X | |
| Intel Core i5-11600K | |
| Intel Core i5-10600K | |
| Cinebench R10 | |
| Rendering Single CPUs 64Bit | |
| Intel Core i9-12900K | |
| Intel Core i5-12600K | |
| Intel Core i9-11900K | |
| AMD Ryzen 9 5950X | |
| AMD Ryzen 7 5800X | |
| Intel Core i5-11600K | |
| AMD Ryzen 9 5900X | |
| AMD Ryzen 5 5600X | |
| Intel Core i9-10900K | |
| Intel Core i5-10600K | |
| Rendering Multiple CPUs 64Bit | |
| Intel Core i9-12900K | |
| AMD Ryzen 9 5950X | |
| AMD Ryzen 9 5900X | |
| Intel Core i5-12600K | |
| AMD Ryzen 7 5800X | |
| Intel Core i9-11900K | |
| Intel Core i9-10900K | |
| AMD Ryzen 5 5600X | |
| Intel Core i5-11600K | |
| Intel Core i5-10600K | |
| Blender - v2.79 BMW27 CPU | |
| Intel Core i5-10600K | |
| Intel Core i5-11600K | |
| AMD Ryzen 5 5600X | |
| AMD Ryzen 7 5800X | |
| Intel Core i9-11900K | |
| Intel Core i5-12600K | |
| Intel Core i9-10900K | |
| AMD Ryzen 9 5900X | |
| Intel Core i9-12900K | |
| AMD Ryzen 9 5950X | |
| wPrime 2.10 | |
| 32m | |
| Intel Core i9-12900K | |
| Intel Core i5-11600K | |
| Intel Core i5-12600K | |
| Intel Core i5-10600K | |
| Intel Core i9-11900K | |
| AMD Ryzen 5 5600X | |
| Intel Core i9-10900K | |
| AMD Ryzen 7 5800X | |
| AMD Ryzen 9 5950X | |
| 1024m | |
| Intel Core i5-12600K | |
| Intel Core i9-12900K | |
| AMD Ryzen 5 5600X | |
| Intel Core i5-10600K | |
| Intel Core i5-11600K | |
| AMD Ryzen 7 5800X | |
| Intel Core i9-11900K | |
| Intel Core i9-10900K | |
| AMD Ryzen 9 5950X | |
| X264 HD Benchmark 4.0 | |
| Pass 1 | |
| Intel Core i9-12900K | |
| AMD Ryzen 7 5800X | |
| AMD Ryzen 9 5950X | |
| AMD Ryzen 9 5900X | |
| Intel Core i5-12600K | |
| AMD Ryzen 5 5600X | |
| Intel Core i9-11900K | |
| Intel Core i5-11600K | |
| Intel Core i9-10900K | |
| Intel Core i5-10600K | |
| Pass 2 | |
| AMD Ryzen 9 5950X | |
| Intel Core i9-12900K | |
| AMD Ryzen 9 5900X | |
| AMD Ryzen 7 5800X | |
| Intel Core i9-10900K | |
| Intel Core i5-12600K | |
| Intel Core i9-11900K | |
| AMD Ryzen 5 5600X | |
| Intel Core i5-11600K | |
| Intel Core i5-10600K | |
| WinRAR - Result | |
| AMD Ryzen 7 5800X | |
| AMD Ryzen 9 5900X | |
| AMD Ryzen 5 5600X | |
| AMD Ryzen 9 5950X | |
| Intel Core i9-12900K | |
| Intel Core i9-10900K | |
| Intel Core i9-11900K | |
| Intel Core i5-11600K | |
| Intel Core i5-10600K | |
| Intel Core i5-12600K | |
| TrueCrypt | |
| AES Mean 100MB | |
| AMD Ryzen 9 5950X | |
| AMD Ryzen 9 5900X | |
| Intel Core i9-12900K | |
| AMD Ryzen 7 5800X | |
| Intel Core i9-10900K | |
| Intel Core i9-11900K | |
| Intel Core i5-12600K | |
| AMD Ryzen 5 5600X | |
| Intel Core i5-11600K | |
| Intel Core i5-10600K | |
| Twofish Mean 100MB | |
| AMD Ryzen 9 5950X | |
| Intel Core i9-12900K | |
| AMD Ryzen 9 5900X | |
| Intel Core i9-10900K | |
| Intel Core i5-12600K | |
| AMD Ryzen 7 5800X | |
| Intel Core i9-11900K | |
| AMD Ryzen 5 5600X | |
| Intel Core i5-11600K | |
| Intel Core i5-10600K | |
| Serpent Mean 100MB | |
| AMD Ryzen 9 5950X | |
| Intel Core i9-12900K | |
| AMD Ryzen 9 5900X | |
| Intel Core i9-10900K | |
| AMD Ryzen 7 5800X | |
| Intel Core i5-12600K | |
| Intel Core i9-11900K | |
| AMD Ryzen 5 5600X | |
| Intel Core i5-11600K | |
| Intel Core i5-10600K | |
| Geekbench 5.5 | |
| Multi-Core | |
| Intel Core i9-12900K | |
| AMD Ryzen 9 5950X | |
| AMD Ryzen 9 5900X | |
| Intel Core i5-12600K | |
| Intel Core i9-10900K | |
| AMD Ryzen 7 5800X | |
| Intel Core i9-11900K | |
| AMD Ryzen 5 5600X | |
| Intel Core i5-11600K | |
| Intel Core i5-10600K | |
| Single-Core | |
| Intel Core i9-12900K | |
| Intel Core i5-12600K | |
| Intel Core i9-11900K | |
| Intel Core i5-11600K | |
| AMD Ryzen 9 5950X | |
| AMD Ryzen 9 5900X | |
| AMD Ryzen 7 5800X | |
| AMD Ryzen 5 5600X | |
| Intel Core i9-10900K | |
| Intel Core i5-10600K | |
| Geekbench 5.0 | |
| 5.0 Multi-Core | |
| Intel Core i9-12900K | |
| AMD Ryzen 9 5950X | |
| AMD Ryzen 9 5900X | |
| Intel Core i5-12600K | |
| Intel Core i9-10900K | |
| AMD Ryzen 7 5800X | |
| Intel Core i9-11900K | |
| AMD Ryzen 5 5600X | |
| Intel Core i5-11600K | |
| Intel Core i5-10600K | |
| 5.0 Single-Core | |
| Intel Core i9-12900K | |
| Intel Core i9-11900K | |
| Intel Core i5-12600K | |
| Intel Core i5-11600K | |
| AMD Ryzen 9 5950X | |
| AMD Ryzen 7 5800X | |
| AMD Ryzen 9 5900X | |
| AMD Ryzen 5 5600X | |
| Intel Core i9-10900K | |
| Intel Core i5-10600K | |
| Geekbench 4.4 | |
| 64 Bit Single-Core Score | |
| Intel Core i9-12900K | |
| Intel Core i5-12600K | |
| Intel Core i9-11900K | |
| Intel Core i5-11600K | |
| AMD Ryzen 7 5800X | |
| AMD Ryzen 9 5900X | |
| AMD Ryzen 9 5950X | |
| AMD Ryzen 5 5600X | |
| Intel Core i9-10900K | |
| Intel Core i5-10600K | |
| 64 Bit Multi-Core Score | |
| Intel Core i9-12900K | |
| AMD Ryzen 9 5950X | |
| AMD Ryzen 9 5900X | |
| Intel Core i5-12600K | |
| AMD Ryzen 7 5800X | |
| Intel Core i9-10900K | |
| Intel Core i9-11900K | |
| AMD Ryzen 5 5600X | |
| Intel Core i5-11600K | |
| Intel Core i5-10600K | |
| 3DMark 11 - 1280x720 Performance Physics | |
| Intel Core i9-12900K | |
| AMD Ryzen 9 5950X | |
| Intel Core i5-12600K | |
| AMD Ryzen 9 5900X | |
| AMD Ryzen 7 5800X | |
| Intel Core i9-10900K | |
| Intel Core i9-11900K | |
| AMD Ryzen 5 5600X | |
| Intel Core i5-11600K | |
| Intel Core i5-10600K | |
| 7-Zip 18.03 | |
| 7z b 4 | |
| AMD Ryzen 9 5950X | |
| Intel Core i9-12900K | |
| AMD Ryzen 9 5900X | |
| AMD Ryzen 7 5800X | |
| Intel Core i9-10900K | |
| Intel Core i5-12600K | |
| Intel Core i9-11900K | |
| AMD Ryzen 5 5600X | |
| Intel Core i5-11600K | |
| Intel Core i5-10600K | |
| 7z b 4 -mmt1 | |
| AMD Ryzen 9 5950X | |
| AMD Ryzen 7 5800X | |
| AMD Ryzen 9 5900X | |
| Intel Core i9-11900K | |
| AMD Ryzen 5 5600X | |
| Intel Core i9-12900K | |
| Intel Core i5-11600K | |
| Intel Core i9-10900K | |
| Intel Core i5-12600K | |
| Intel Core i5-10600K | |
| HWBOT x265 Benchmark v2.2 - 4k Preset | |
| AMD Ryzen 9 5950X | |
| Intel Core i5-12600K | |
| Intel Core i9-12900K | |
| AMD Ryzen 9 5900X | |
| Intel Core i9-10900K | |
| AMD Ryzen 7 5800X | |
| Intel Core i9-11900K | |
| AMD Ryzen 5 5600X | |
| Intel Core i5-11600K | |
| Intel Core i5-10600K | |
| R Benchmark 2.5 - Overall mean | |
| Intel Core i5-10600K | |
| Intel Core i9-10900K | |
| Intel Core i5-11600K | |
| AMD Ryzen 5 5600X | |
| Intel Core i9-11900K | |
| AMD Ryzen 9 5950X | |
| AMD Ryzen 9 5900X | |
| AMD Ryzen 7 5800X | |
| Intel Core i5-12600K | |
| Intel Core i9-12900K | |
| LibreOffice - 20 Documents To PDF | |
| Intel Core i9-10900K | |
| Intel Core i9-11900K | |
| Intel Core i5-12600K | |
| AMD Ryzen 9 5900X | |
| Intel Core i5-10600K | |
| AMD Ryzen 9 5950X | |
| AMD Ryzen 5 5600X | |
| AMD Ryzen 7 5800X | |
| Intel Core i9-12900K | |
| Intel Core i5-11600K | |
| WebXPRT 3 - Overall | |
| Intel Core i9-12900K | |
| AMD Ryzen 7 5800X | |
| Intel Core i5-12600K | |
| AMD Ryzen 9 5950X | |
| AMD Ryzen 5 5600X | |
| AMD Ryzen 9 5900X | |
| Intel Core i5-11600K | |
| Intel Core i9-10900K | |
| Intel Core i5-10600K | |
| Intel Core i9-11900K | |
| Mozilla Kraken 1.1 - Total | |
| Intel Core i5-10600K | |
| Intel Core i9-10900K | |
| Intel Core i5-11600K | |
| AMD Ryzen 5 5600X | |
| AMD Ryzen 9 5900X | |
| AMD Ryzen 7 5800X | |
| AMD Ryzen 9 5950X | |
| Intel Core i9-11900K | |
| Intel Core i5-12600K | |
| Intel Core i9-12900K | |
| 3DMark | |
| 3840x2160 Fire Strike Ultra Physics | |
| Intel Core i9-12900K | |
| AMD Ryzen 9 5950X | |
| AMD Ryzen 9 5900X | |
| AMD Ryzen 7 5800X | |
| Intel Core i5-12600K | |
| Intel Core i9-10900K | |
| Intel Core i9-11900K | |
| AMD Ryzen 5 5600X | |
| Intel Core i5-11600K | |
| Intel Core i5-10600K | |
| 1920x1080 Fire Strike Physics | |
| AMD Ryzen 9 5950X | |
| Intel Core i9-12900K | |
| AMD Ryzen 9 5900X | |
| AMD Ryzen 7 5800X | |
| Intel Core i9-10900K | |
| Intel Core i5-12600K | |
| Intel Core i9-11900K | |
| AMD Ryzen 5 5600X | |
| Intel Core i5-11600K | |
| Intel Core i5-10600K | |
| 2560x1440 Time Spy CPU | |
| Intel Core i9-12900K | |
| Intel Core i9-10900K | |
| Intel Core i5-12600K | |
| AMD Ryzen 9 5950X | |
| Intel Core i9-11900K | |
| AMD Ryzen 9 5900X | |
| AMD Ryzen 7 5800X | |
| Intel Core i5-11600K | |
| AMD Ryzen 5 5600X | |
| Intel Core i5-10600K | |
* ... Meglio usare valori piccoli
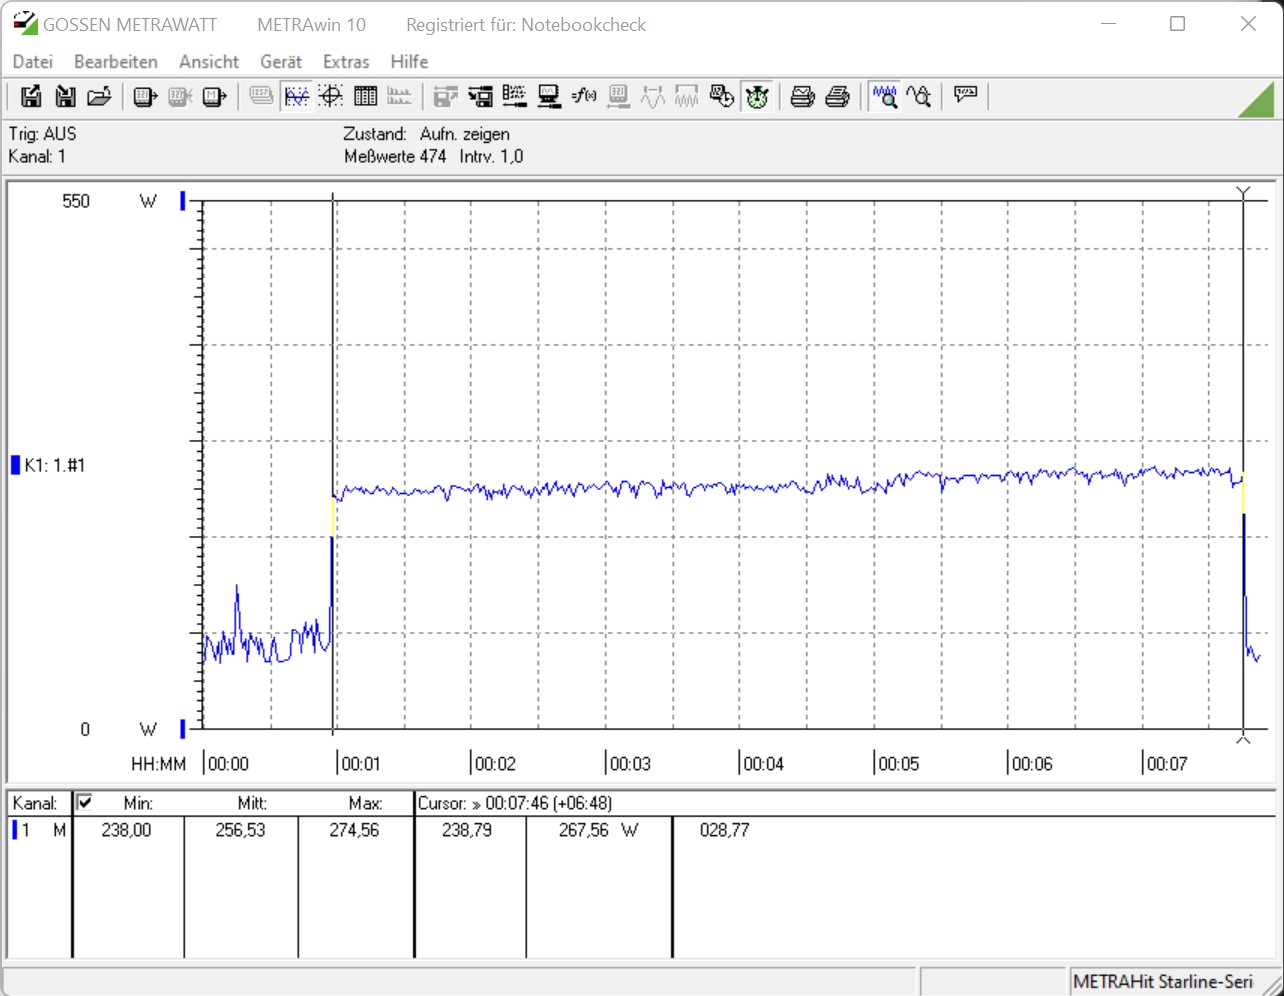
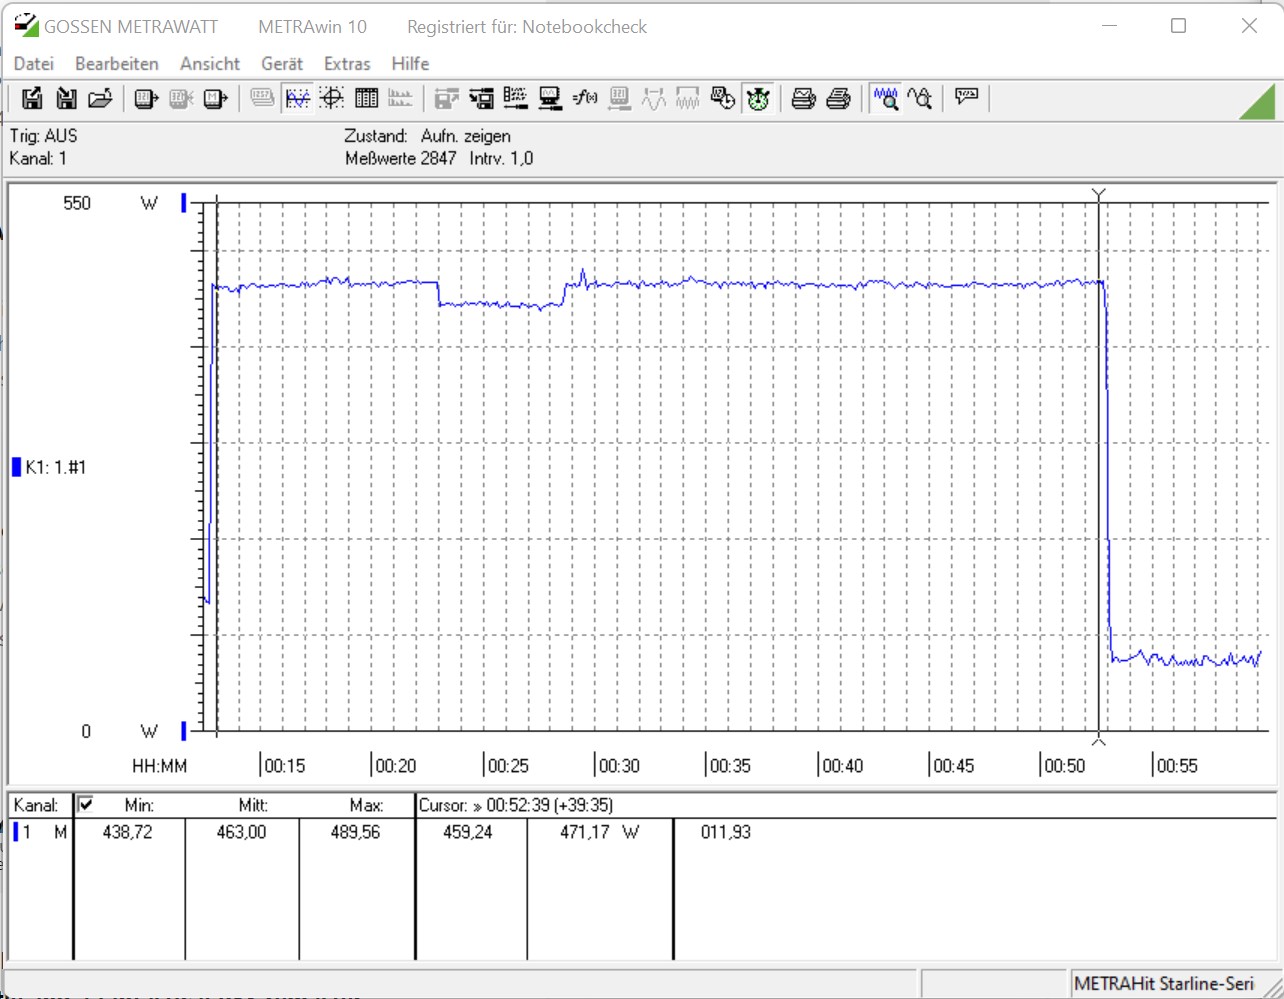
Alder Lake-S contro Cinebench R15 Multi Loop
Entrambe le nostre unità di prova mostrano una performance molto stabile nel test di carico. Rispetto alIntel Core i9-11900Kl'Intel Core i9-12900K è in grado di passare al primo posto continuamente e senza alcun calo di prestazioni con una media di 3987 punti. L'Intel Core i5-12600K è anche in grado di posizionarsi stabilmente davanti alpredecessoreIntel Core i5-11600KRocket Lake-S con un vantaggio significativo. Lamaggiore quantità di core di calcolo nativi assicura questa differenza di prestazioni nel complesso
Benchmark sintetici e prestazioni delle applicazioni
Nei benchmark sintetici, i nuovi processori Alder Lake-S sono in vantaggio. A parte poche eccezioni in cui AMD dovrebbe offrire la piattaforma migliore, l'Intel Core i9-12900K è in grado di ottenere un solido vantaggio. Non è sorprendente quindi che le due CPU Alder Lake-S condividano i due primi posti nei due risultati di benchmark cumulativi. Tuttavia, siamo ancora un po' sorpresi, poiché non ci aspettavamo il secondo posto per l'Intel Core i5-12600K nella classifica generale.
| Performance rating - Percent | |
| Intel Core i9-12900K | |
| Intel Core i5-12600K | |
| AMD Ryzen 7 5800X | |
| AMD Ryzen 9 5950X | |
| AMD Ryzen 5 5600X | |
| AMD Ryzen 9 5900X | |
| Intel Core i9-11900K | |
| Intel Core i9-10900K | |
| Intel Core i5-11600K | |
| Intel Core i7-10700K | |
| Intel Core i5-10600K | |
| 3DMark | |
| 1920x1080 Fire Strike Physics | |
| AMD Ryzen 9 5950X | |
| Intel Core i9-12900K | |
| AMD Ryzen 9 5900X | |
| AMD Ryzen 7 5800X | |
| Intel Core i9-10900K | |
| Intel Core i5-12600K | |
| Intel Core i9-11900K | |
| AMD Ryzen 5 5600X | |
| Intel Core i7-10700K | |
| Intel Core i5-11600K | |
| Intel Core i5-10600K | |
| 1920x1080 Fire Strike Graphics | |
| Intel Core i5-12600K | |
| Intel Core i9-12900K | |
| Intel Core i7-10700K | |
| Intel Core i5-11600K | |
| AMD Ryzen 7 5800X | |
| Intel Core i9-10900K | |
| Intel Core i9-11900K | |
| AMD Ryzen 9 5950X | |
| AMD Ryzen 5 5600X | |
| Intel Core i5-10600K | |
| AMD Ryzen 9 5900X | |
| Fire Strike Extreme Graphics | |
| Intel Core i5-12600K | |
| Intel Core i9-12900K | |
| Intel Core i5-11600K | |
| AMD Ryzen 5 5600X | |
| Intel Core i7-10700K | |
| Intel Core i9-11900K | |
| AMD Ryzen 9 5950X | |
| AMD Ryzen 7 5800X | |
| Intel Core i9-10900K | |
| AMD Ryzen 9 5900X | |
| Intel Core i5-10600K | |
| 3840x2160 Fire Strike Ultra Graphics | |
| Intel Core i5-12600K | |
| Intel Core i9-12900K | |
| Intel Core i5-11600K | |
| Intel Core i9-11900K | |
| AMD Ryzen 7 5800X | |
| AMD Ryzen 5 5600X | |
| Intel Core i7-10700K | |
| AMD Ryzen 9 5950X | |
| Intel Core i9-10900K | |
| AMD Ryzen 9 5900X | |
| Intel Core i5-10600K | |
| 3DMark 11 | |
| 1280x720 Performance GPU | |
| Intel Core i7-10700K | |
| Intel Core i5-12600K | |
| Intel Core i9-10900K | |
| AMD Ryzen 9 5950X | |
| AMD Ryzen 7 5800X | |
| Intel Core i9-12900K | |
| AMD Ryzen 5 5600X | |
| Intel Core i9-11900K | |
| Intel Core i5-10600K | |
| Intel Core i5-11600K | |
| AMD Ryzen 9 5900X | |
| 1280x720 Performance Physics | |
| Intel Core i9-12900K | |
| AMD Ryzen 9 5950X | |
| Intel Core i5-12600K | |
| AMD Ryzen 9 5900X | |
| AMD Ryzen 7 5800X | |
| Intel Core i9-10900K | |
| Intel Core i9-11900K | |
| AMD Ryzen 5 5600X | |
| Intel Core i7-10700K | |
| Intel Core i5-11600K | |
| Intel Core i5-10600K | |
| PCMark 10 - Score | |
| AMD Ryzen 9 5950X | |
| Intel Core i9-12900K | |
| AMD Ryzen 9 5900X | |
| AMD Ryzen 5 5600X | |
| Intel Core i5-12600K | |
| AMD Ryzen 7 5800X | |
| Intel Core i9-11900K | |
| Intel Core i5-11600K | |
| Intel Core i9-10900K | |
| Intel Core i7-10700K | |
| Intel Core i5-10600K | |
Parametri di gioco
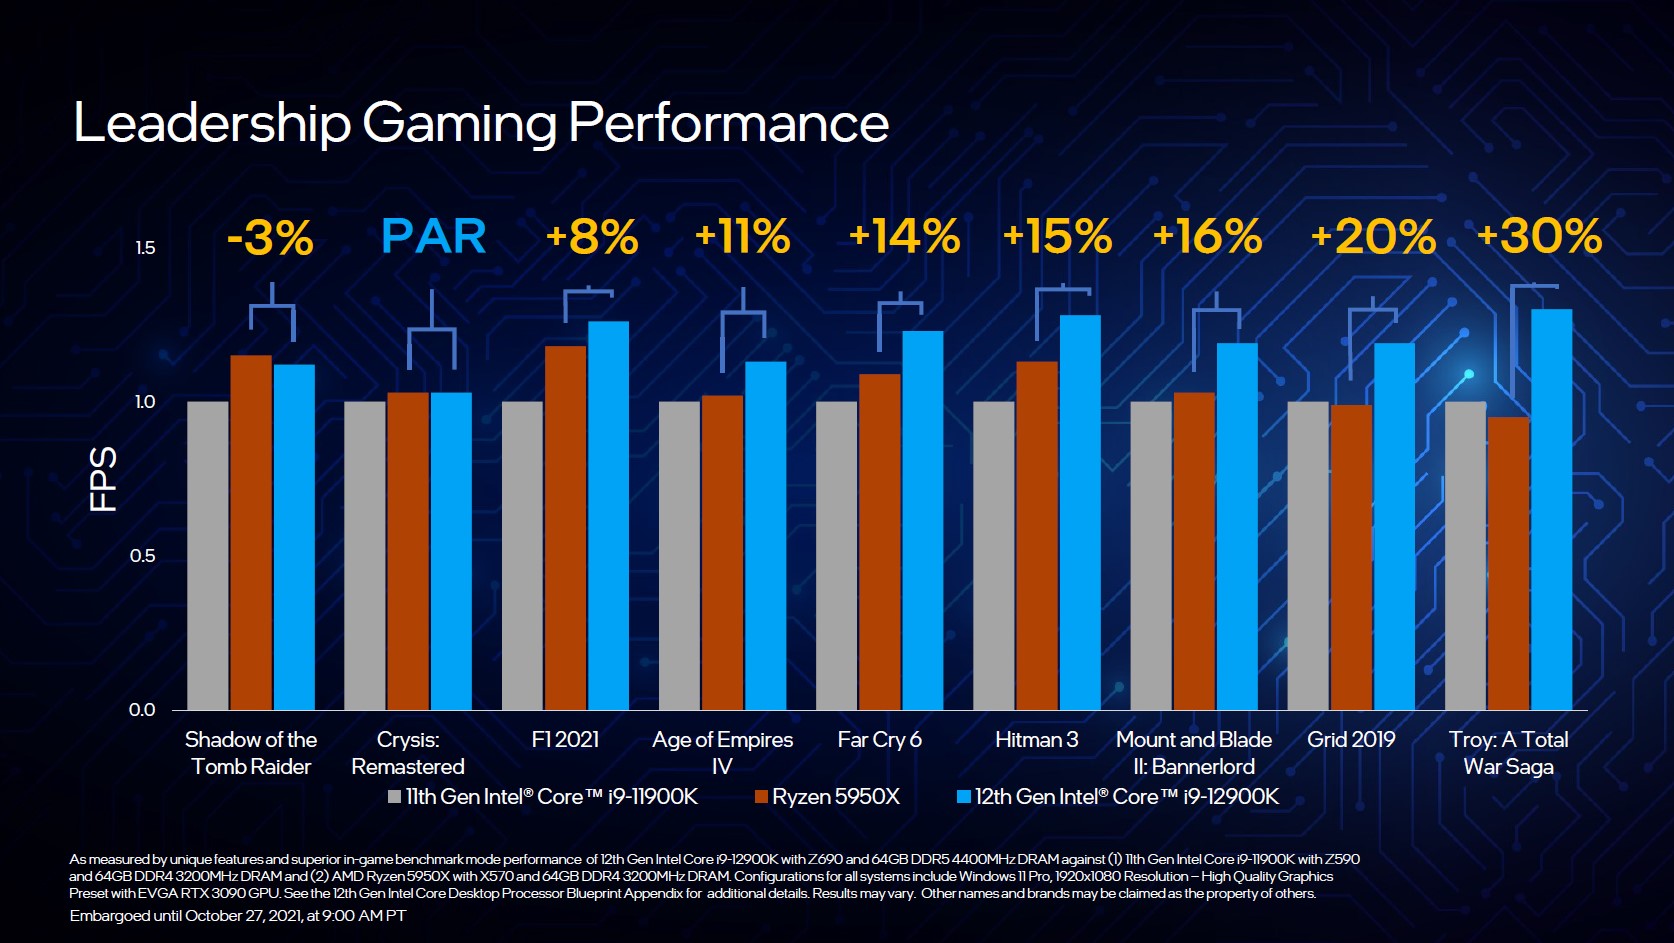
Ora stiamo arrivando ai benchmark più interessanti e alla disciplina in cui i nuovi processori Intel Alder Lake-S possono davvero mostrare le loro capacità. Rispetto a Rocket Lake-S, i nuovi processori sono in grado di aumentare le loro prestazioni in modo significativo, come si può vedere nei benchmark di gioco. Nel confronto cumulativo dei nove giochi, l'Intel Core i9-12900K è in grado di passare appena davanti all AMD Ryzen 9 5900X. Devi anche sapere qui che ci sono alcuni giochi che si armonizzano meglio con i processori Intel e altri che offrono prestazioni migliori con i processori AMD. Nella competizione interna dei due processori Alder Lake-S, l'Intel Core i5-12600K perde di 8 punti percentuali contro l'ammiraglia, finendo appena davanti al Intel Core i5-11600Kcon questo.
Tuttavia, entrambi i processori offrono prestazioni di gioco molto buone. A causa dei molti cambiamenti nella piattaforma e nel sistema operativo, potremmo anche essere in grado di aspettarci qualche altro miglioramento delle prestazioni sotto forma di aggiornamenti in futuro. Ma non c'è alcuna garanzia per questo. Le prestazioni nel puro limite della CPU sono molto alte e a seconda del gioco anche significativamente avanti rispetto ai concorrenti. Tuttavia, dobbiamo ancora notare che anche se Intel ha la CPU da gioco più veloce nel suo portafoglio qui, la distanza dal processore Zen3 non può essere chiamata eccezionale. Inoltre, tutti i concorrenti si avvicinano con l'aumentare della risoluzione, in modo che la CPU gioca solo il secondo violino dietro la GPU come fattore determinante per l'aumento degli FPS. Coloro che trasmettono contenuti in streaming oltre al gioco vero e proprio trarranno vantaggio dalla maggiore quantità di thread, il che renderà i nuovi modelli molto interessanti anche per i creatori di contenuti.
| Performance rating - Percent | |
| Intel Core i9-12900K | |
| AMD Ryzen 9 5900X -2! | |
| AMD Ryzen 7 5800X -2! | |
| AMD Ryzen 9 5950X -2! | |
| AMD Ryzen 5 5600X -2! | |
| Intel Core i9-11900K | |
| Intel Core i5-12600K | |
| Intel Core i5-11600K | |
| Intel Core i9-10900K | |
| Intel Core i7-10700K -4! | |
| Intel Core i5-10600K | |
| Borderlands 3 | |
| 1280x720 Very Low Overall Quality (DX11) | |
| AMD Ryzen 9 5900X | |
| AMD Ryzen 7 5800X | |
| AMD Ryzen 9 5950X | |
| AMD Ryzen 5 5600X | |
| Intel Core i9-12900K | |
| Intel Core i9-11900K | |
| Intel Core i9-10900K | |
| Intel Core i5-11600K | |
| Intel Core i7-10700K | |
| Intel Core i5-12600K | |
| Intel Core i5-10600K | |
| 1920x1080 Badass Overall Quality (DX11) | |
| Intel Core i9-12900K | |
| Intel Core i5-12600K | |
| AMD Ryzen 9 5900X | |
| Intel Core i9-11900K | |
| Intel Core i9-10900K | |
| Intel Core i7-10700K | |
| AMD Ryzen 9 5950X | |
| Intel Core i5-11600K | |
| AMD Ryzen 7 5800X | |
| AMD Ryzen 5 5600X | |
| Intel Core i5-10600K | |
| Far Cry New Dawn | |
| 1280x720 Low Preset | |
| Intel Core i9-12900K | |
| Intel Core i9-11900K | |
| AMD Ryzen 9 5900X | |
| Intel Core i5-12600K | |
| Intel Core i5-11600K | |
| AMD Ryzen 7 5800X | |
| AMD Ryzen 9 5950X | |
| Intel Core i7-10700K | |
| AMD Ryzen 5 5600X | |
| Intel Core i9-10900K | |
| Intel Core i5-10600K | |
| 1920x1080 Ultra Preset | |
| Intel Core i9-12900K | |
| Intel Core i9-11900K | |
| AMD Ryzen 9 5900X | |
| Intel Core i5-11600K | |
| Intel Core i7-10700K | |
| Intel Core i5-12600K | |
| AMD Ryzen 7 5800X | |
| AMD Ryzen 9 5950X | |
| AMD Ryzen 5 5600X | |
| Intel Core i5-10600K | |
| Intel Core i9-10900K | |
| Forza Horizon 4 | |
| 1280x720 Very Low Preset | |
| Intel Core i9-12900K | |
| Intel Core i5-12600K | |
| Intel Core i9-11900K | |
| Intel Core i9-10900K | |
| Intel Core i5-11600K | |
| Intel Core i5-10600K | |
| 1920x1080 Ultra Preset AA:2xMS | |
| Intel Core i9-10900K | |
| Intel Core i9-11900K | |
| Intel Core i5-11600K | |
| Intel Core i5-10600K | |
| Intel Core i9-12900K | |
| Intel Core i5-12600K | |
| Far Cry 5 | |
| 1280x720 Low Preset AA:T | |
| Intel Core i9-12900K | |
| AMD Ryzen 9 5900X | |
| Intel Core i9-11900K | |
| AMD Ryzen 7 5800X | |
| AMD Ryzen 9 5950X | |
| AMD Ryzen 5 5600X | |
| Intel Core i5-12600K | |
| Intel Core i5-11600K | |
| Intel Core i9-10900K | |
| Intel Core i7-10700K | |
| Intel Core i5-10600K | |
| 1920x1080 Ultra Preset AA:T | |
| Intel Core i9-12900K | |
| Intel Core i9-11900K | |
| AMD Ryzen 9 5900X | |
| AMD Ryzen 7 5800X | |
| Intel Core i5-11600K | |
| AMD Ryzen 9 5950X | |
| Intel Core i5-12600K | |
| AMD Ryzen 5 5600X | |
| Intel Core i7-10700K | |
| Intel Core i9-10900K | |
| Intel Core i5-10600K | |
| X-Plane 11.11 | |
| 1280x720 low (fps_test=1) | |
| Intel Core i9-12900K | |
| AMD Ryzen 7 5800X | |
| AMD Ryzen 9 5900X | |
| AMD Ryzen 5 5600X | |
| Intel Core i5-12600K | |
| Intel Core i9-11900K | |
| AMD Ryzen 9 5950X | |
| Intel Core i5-11600K | |
| Intel Core i9-10900K | |
| Intel Core i7-10700K | |
| Intel Core i5-10600K | |
| 1920x1080 high (fps_test=3) | |
| Intel Core i9-12900K | |
| AMD Ryzen 9 5900X | |
| AMD Ryzen 7 5800X | |
| Intel Core i9-11900K | |
| AMD Ryzen 5 5600X | |
| Intel Core i5-12600K | |
| AMD Ryzen 9 5950X | |
| Intel Core i5-11600K | |
| Intel Core i9-10900K | |
| Intel Core i7-10700K | |
| Intel Core i5-10600K | |
| Final Fantasy XV Benchmark | |
| 1280x720 Lite Quality | |
| Intel Core i9-12900K | |
| AMD Ryzen 9 5900X | |
| AMD Ryzen 7 5800X | |
| AMD Ryzen 9 5950X | |
| AMD Ryzen 5 5600X | |
| Intel Core i9-10900K | |
| Intel Core i9-11900K | |
| Intel Core i5-12600K | |
| Intel Core i5-11600K | |
| Intel Core i5-10600K | |
| Intel Core i7-10700K | |
| 1920x1080 High Quality | |
| Intel Core i9-12900K | |
| Intel Core i9-11900K | |
| Intel Core i9-10900K | |
| AMD Ryzen 9 5950X | |
| Intel Core i5-11600K | |
| Intel Core i5-12600K | |
| Intel Core i5-10600K | |
| AMD Ryzen 7 5800X | |
| AMD Ryzen 9 5900X | |
| AMD Ryzen 5 5600X | |
| Intel Core i7-10700K | |
| Dota 2 Reborn | |
| 1280x720 min (0/3) fastest | |
| AMD Ryzen 7 5800X | |
| AMD Ryzen 9 5900X | |
| AMD Ryzen 5 5600X | |
| AMD Ryzen 9 5950X | |
| Intel Core i9-12900K | |
| Intel Core i9-10900K | |
| Intel Core i9-11900K | |
| Intel Core i7-10700K | |
| Intel Core i5-11600K | |
| Intel Core i5-12600K | |
| Intel Core i5-10600K | |
| 1920x1080 ultra (3/3) best looking | |
| Intel Core i9-12900K | |
| AMD Ryzen 7 5800X | |
| AMD Ryzen 9 5900X | |
| AMD Ryzen 5 5600X | |
| AMD Ryzen 9 5950X | |
| Intel Core i5-12600K | |
| Intel Core i9-10900K | |
| Intel Core i9-11900K | |
| Intel Core i5-11600K | |
| Intel Core i7-10700K | |
| Intel Core i5-10600K | |
| The Witcher 3 | |
| 1024x768 Low Graphics & Postprocessing | |
| AMD Ryzen 9 5900X | |
| AMD Ryzen 7 5800X | |
| AMD Ryzen 9 5950X | |
| Intel Core i9-12900K | |
| AMD Ryzen 5 5600X | |
| Intel Core i9-10900K | |
| Intel Core i9-11900K | |
| Intel Core i5-12600K | |
| Intel Core i7-10700K | |
| Intel Core i5-11600K | |
| Intel Core i5-10600K | |
| 1920x1080 Ultra Graphics & Postprocessing (HBAO+) | |
| Intel Core i5-11600K | |
| Intel Core i5-12600K | |
| Intel Core i7-10700K | |
| AMD Ryzen 9 5900X | |
| AMD Ryzen 9 5950X | |
| Intel Core i5-10600K | |
| Intel Core i9-11900K | |
| Intel Core i9-10900K | |
| AMD Ryzen 7 5800X | |
| AMD Ryzen 5 5600X | |
| Intel Core i9-12900K | |
| Shadow of the Tomb Raider | |
| 1280x720 Lowest Preset | |
| AMD Ryzen 7 5800X | |
| AMD Ryzen 9 5950X | |
| AMD Ryzen 9 5900X | |
| Intel Core i9-12900K | |
| AMD Ryzen 5 5600X | |
| Intel Core i9-10900K | |
| Intel Core i9-11900K | |
| Intel Core i5-12600K | |
| Intel Core i5-11600K | |
| Intel Core i5-10600K | |
| 1920x1080 Highest Preset AA:T | |
| AMD Ryzen 7 5800X | |
| Intel Core i9-12900K | |
| Intel Core i9-11900K | |
| AMD Ryzen 9 5950X | |
| AMD Ryzen 9 5900X | |
| Intel Core i9-10900K | |
| AMD Ryzen 5 5600X | |
| Intel Core i5-12600K | |
| Intel Core i5-11600K | |
| Intel Core i5-10600K | |
Intel Core i9-12900K + Nvidia Titan RTX
| basso | medio | alto | ultra | QHD | 4K | |
|---|---|---|---|---|---|---|
| GTA V (2015) | 187 | 187 | 185 | 135 | 123 | 138 |
| The Witcher 3 (2015) | 589 | 422 | 271 | 139 | 103 | |
| Dota 2 Reborn (2015) | 203.5 | 208.7 | 201.7 | 189.7 | 178.9 | |
| Final Fantasy XV Benchmark (2018) | 227 | 195 | 144 | 108 | 64.1 | |
| X-Plane 11.11 (2018) | 200 | 176 | 137 | 117 | ||
| Far Cry 5 (2018) | 220 | 191 | 178 | 167 | 145 | 83 |
| Strange Brigade (2018) | 593 | 371 | 308 | 266 | 197 | 115 |
| Shadow of the Tomb Raider (2018) | 221 | 192 | 183 | 169 | 124 | 69.3 |
| Forza Horizon 4 (2018) | 293 | 227 | 216 | 178 | 153 | 111 |
| Far Cry New Dawn (2019) | 188 | 162 | 154 | 140 | 129 | 84 |
| Borderlands 3 (2019) | 202 | 172 | 147 | 124 | 89.9 | 49.2 |
| F1 2020 (2020) | 432 | 343 | 303 | 213 | 167 | 101 |
| F1 2021 (2021) | 491 | 383 | 307 | 160 | 121 | 71.9 |
| Far Cry 6 (2021) | 185 | 157 | 142 | 134 | 109 | 64 |
Intel Core i5-12600K + Nvidia Titan RTX
| basso | medio | alto | ultra | QHD | 4K | |
|---|---|---|---|---|---|---|
| GTA V (2015) | 186 | 185 | 181 | 124 | 115 | 136 |
| The Witcher 3 (2015) | 500 | 406 | 277 | 144 | 107 | |
| Dota 2 Reborn (2015) | 183.7 | 188 | 181.1 | 174.9 | 165.8 | |
| Final Fantasy XV Benchmark (2018) | 218 | 192 | 141 | 107 | 63.6 | |
| X-Plane 11.11 (2018) | 172 | 153 | 119 | 104 | ||
| Far Cry 5 (2018) | 200 | 174 | 165 | 154 | 140 | 81 |
| Strange Brigade (2018) | 489 | 352 | 301 | 262 | 196 | 114 |
| Shadow of the Tomb Raider (2018) | 195 | 176 | 172 | 163 | 124 | 70.1 |
| Forza Horizon 4 (2018) | 263 | 218 | 212 | 178 | 154 | 112 |
| Far Cry New Dawn (2019) | 171 | 147 | 141 | 126 | 121 | 84 |
| Metro Exodus (2019) | 227 | 174 | 135 | 108 | 87.7 | 56.6 |
| Borderlands 3 (2019) | 175 | 155 | 138 | 119 | 90.4 | 49.8 |
| F1 2020 (2020) | 340 | 291 | 288 | 216 | 168 | 103 |
| F1 2021 (2021) | 407 | 367 | 302 | 160 | 122 | 72.6 |
| Far Cry 6 (2021) | 164 | 136 | 129 | 124 | 105 | 64 |
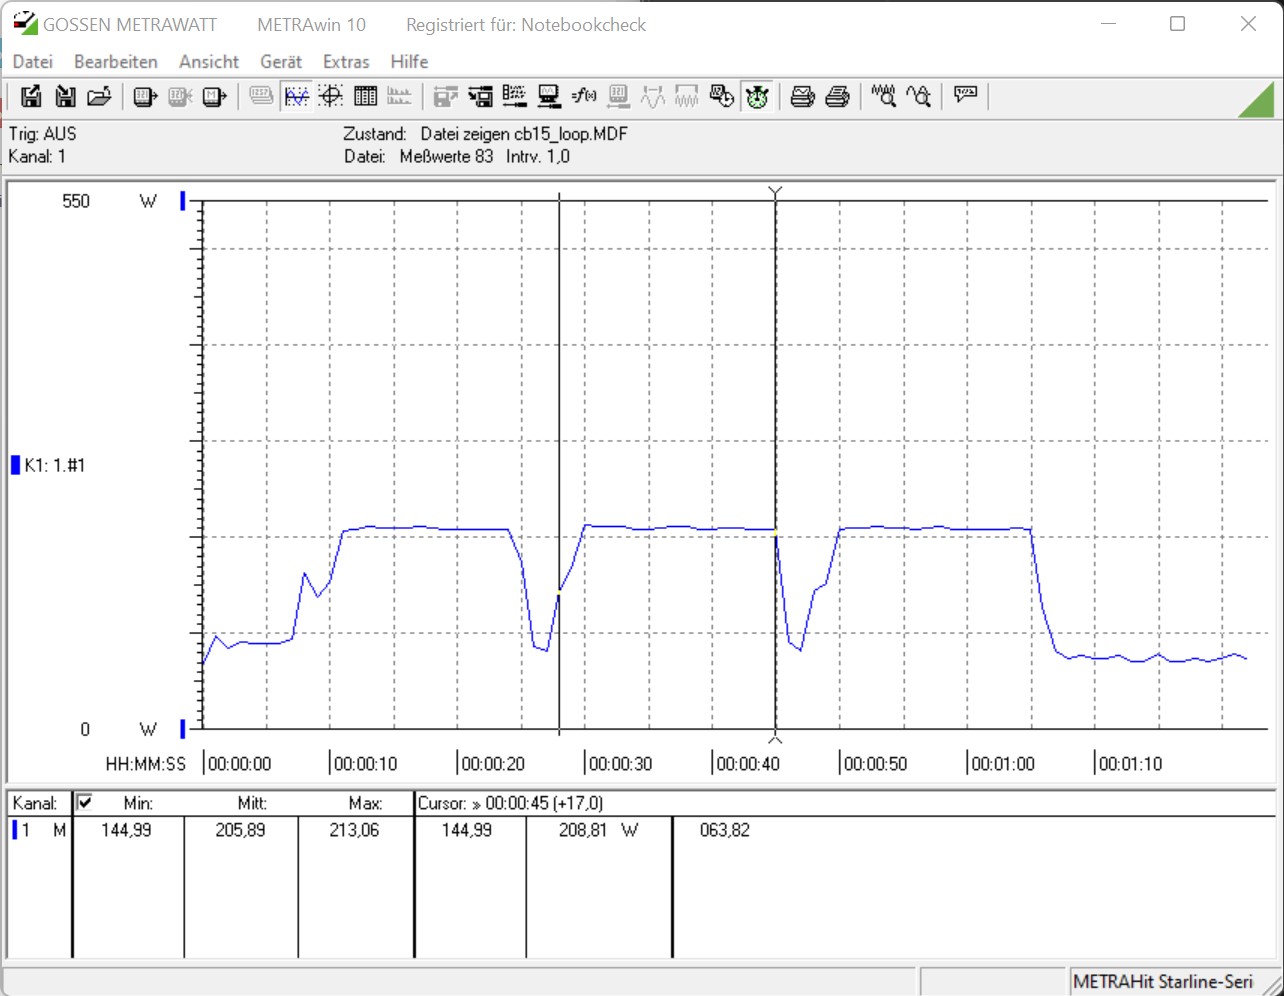
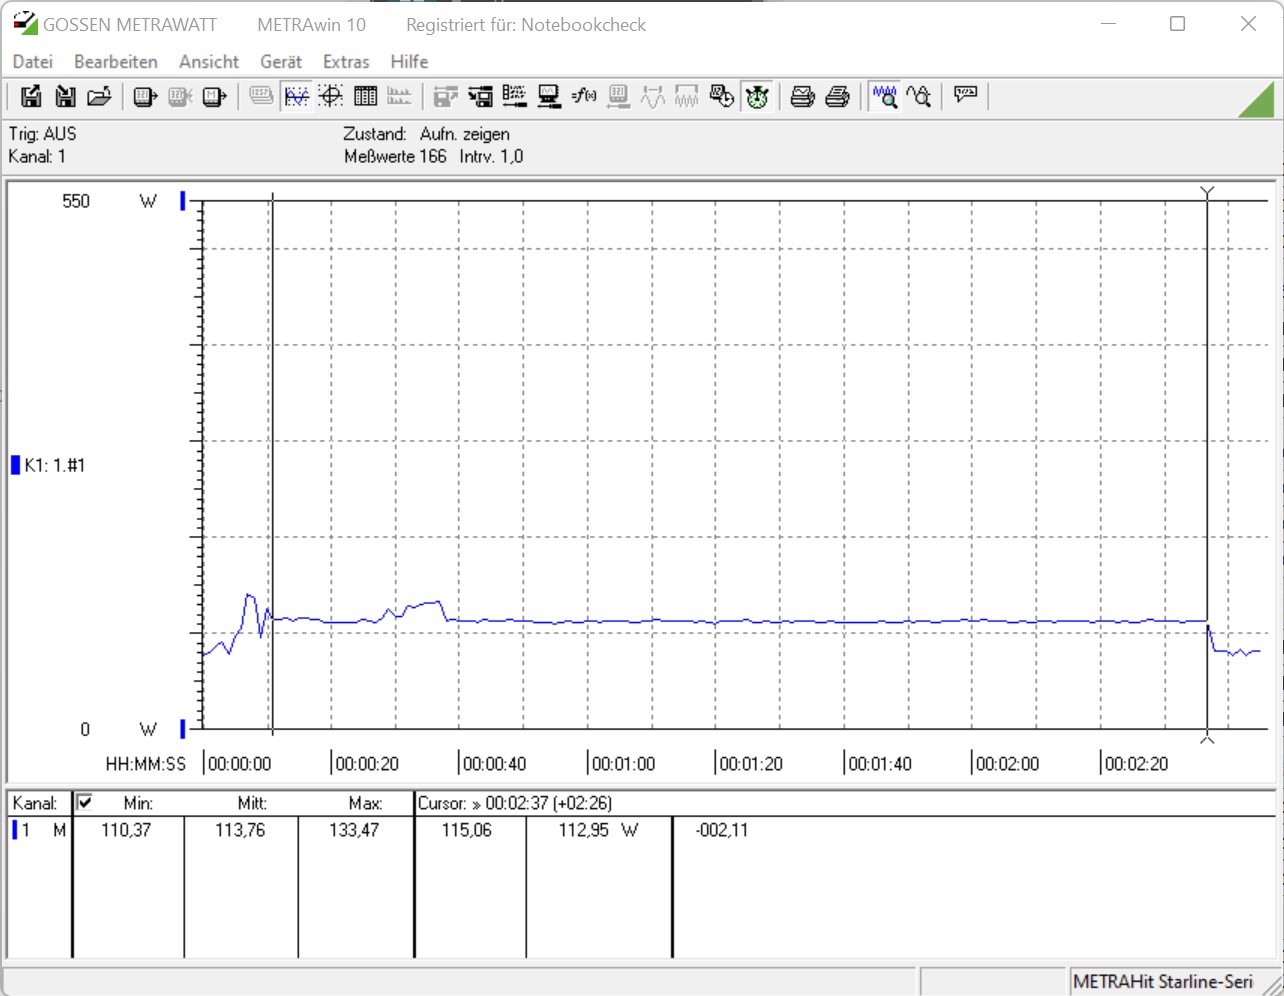
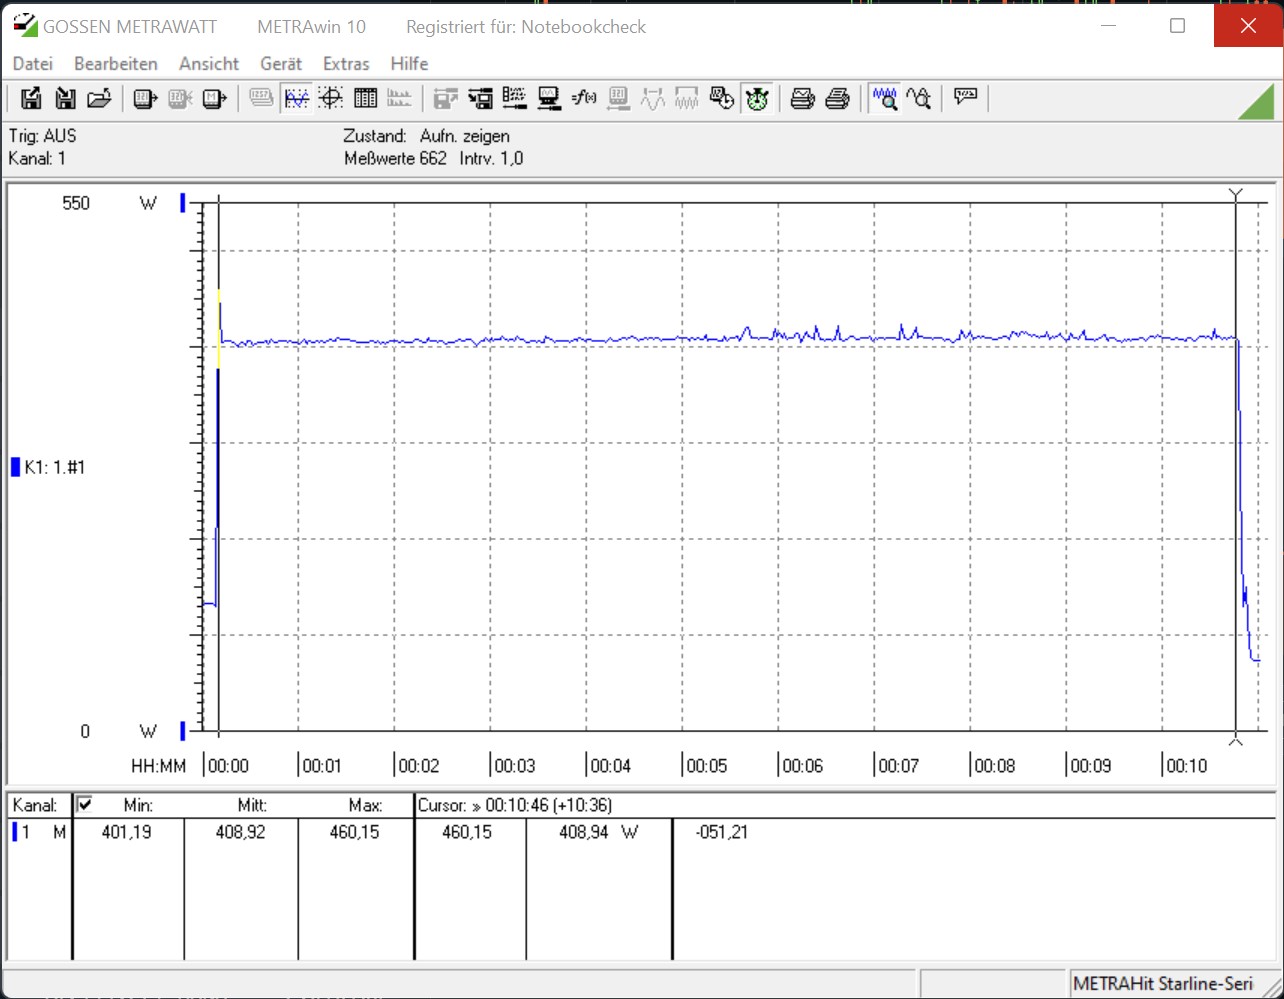
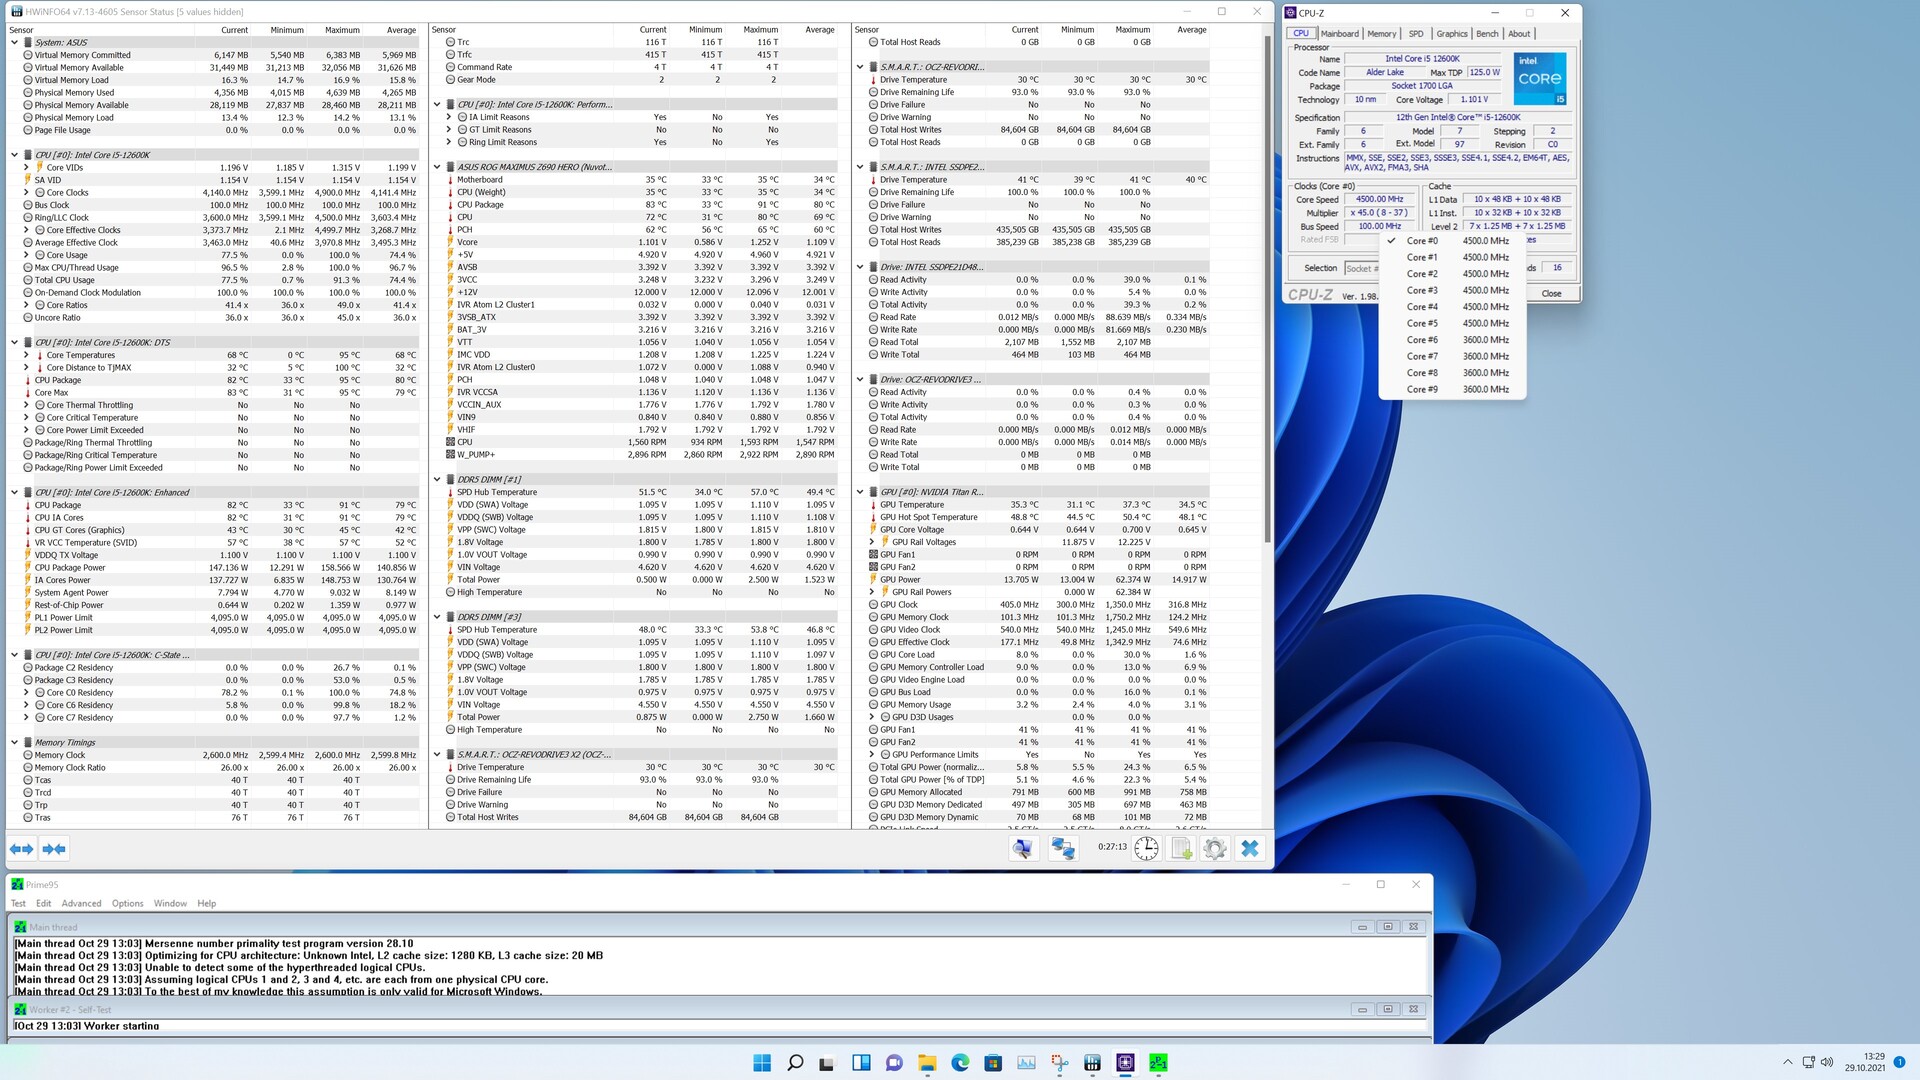
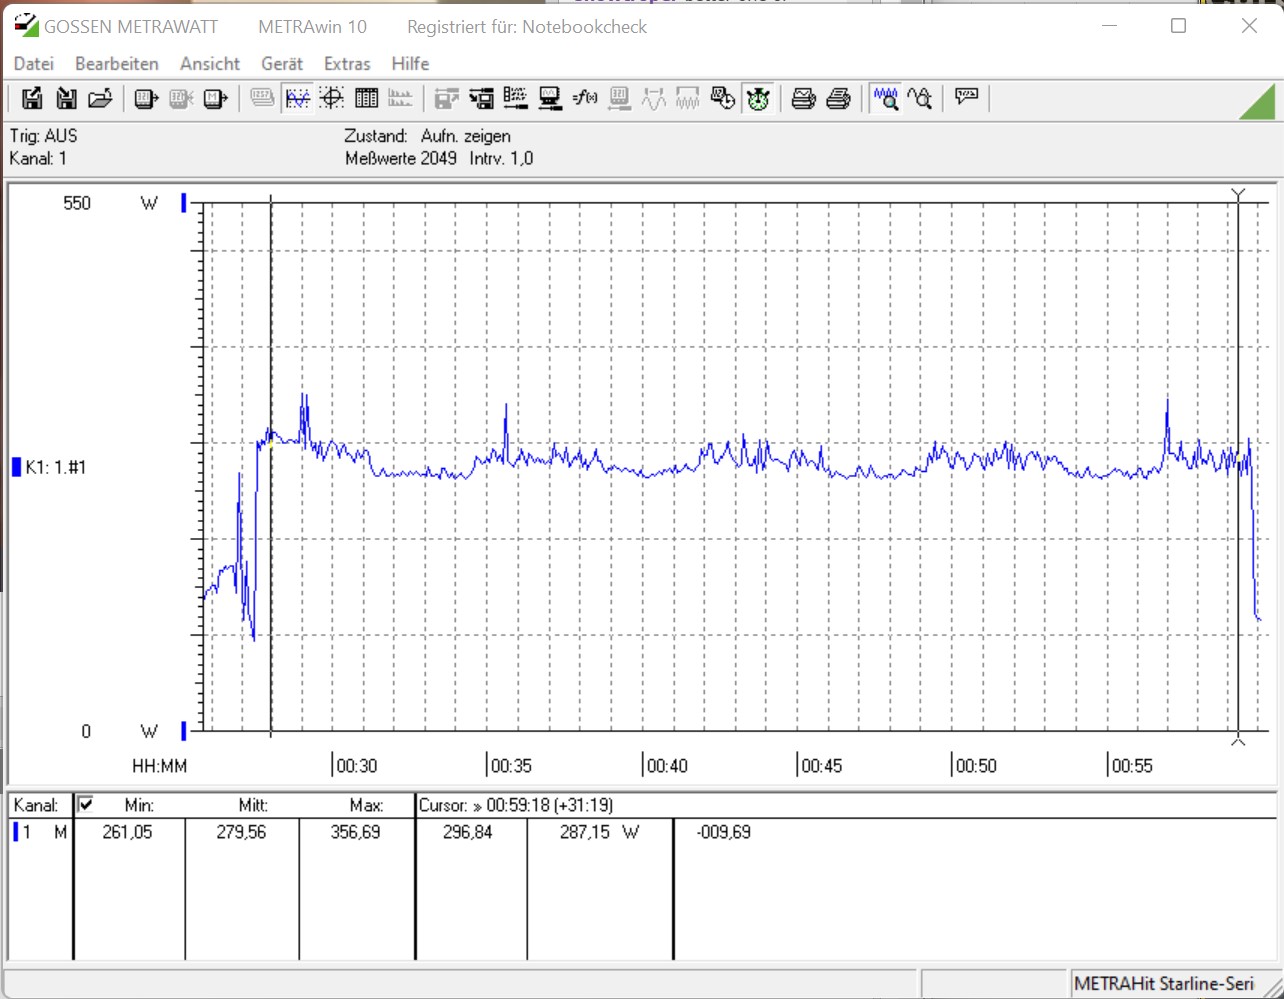
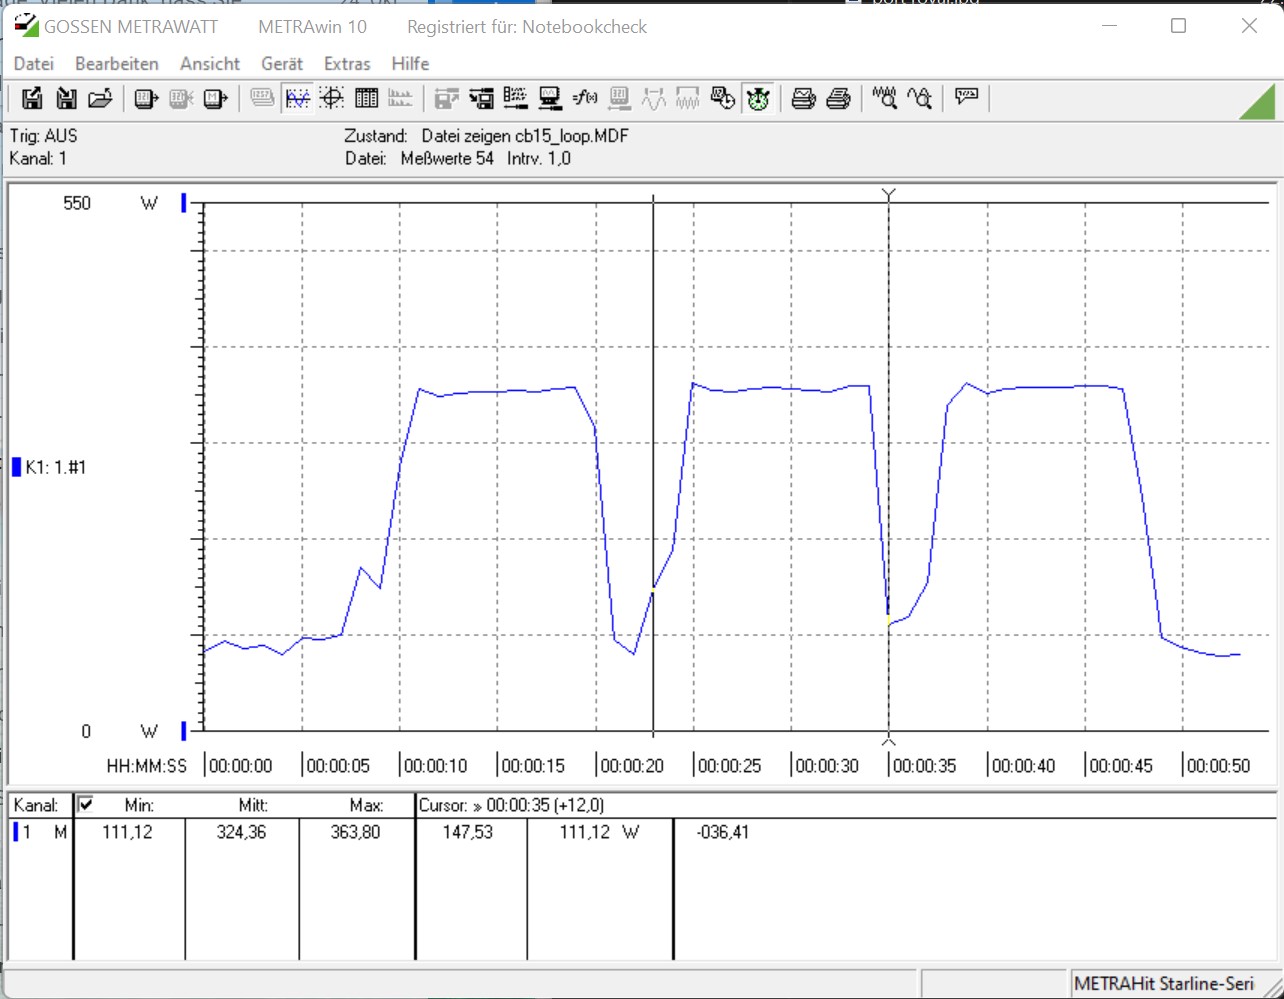
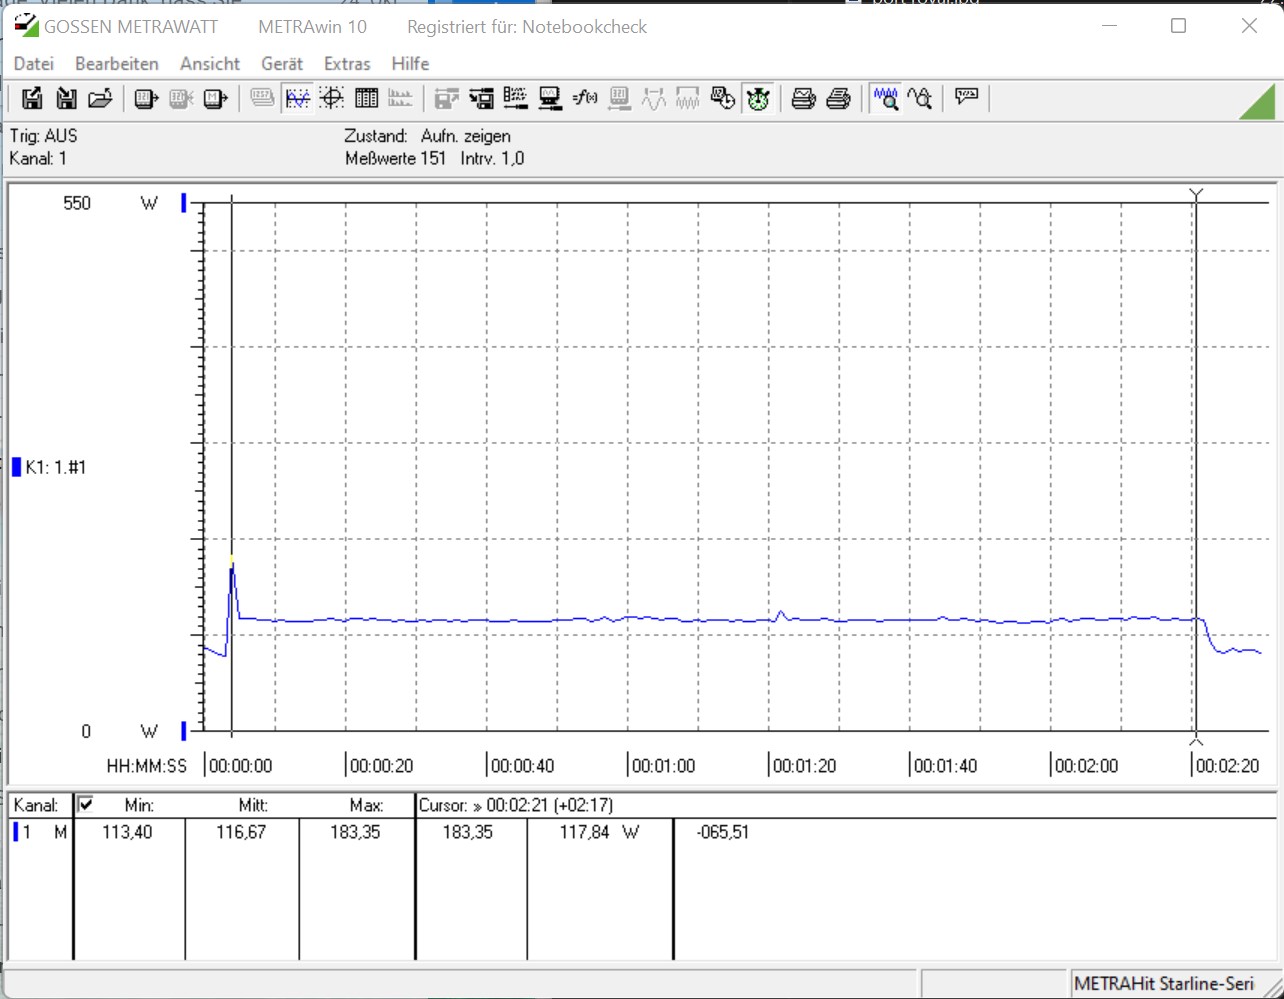
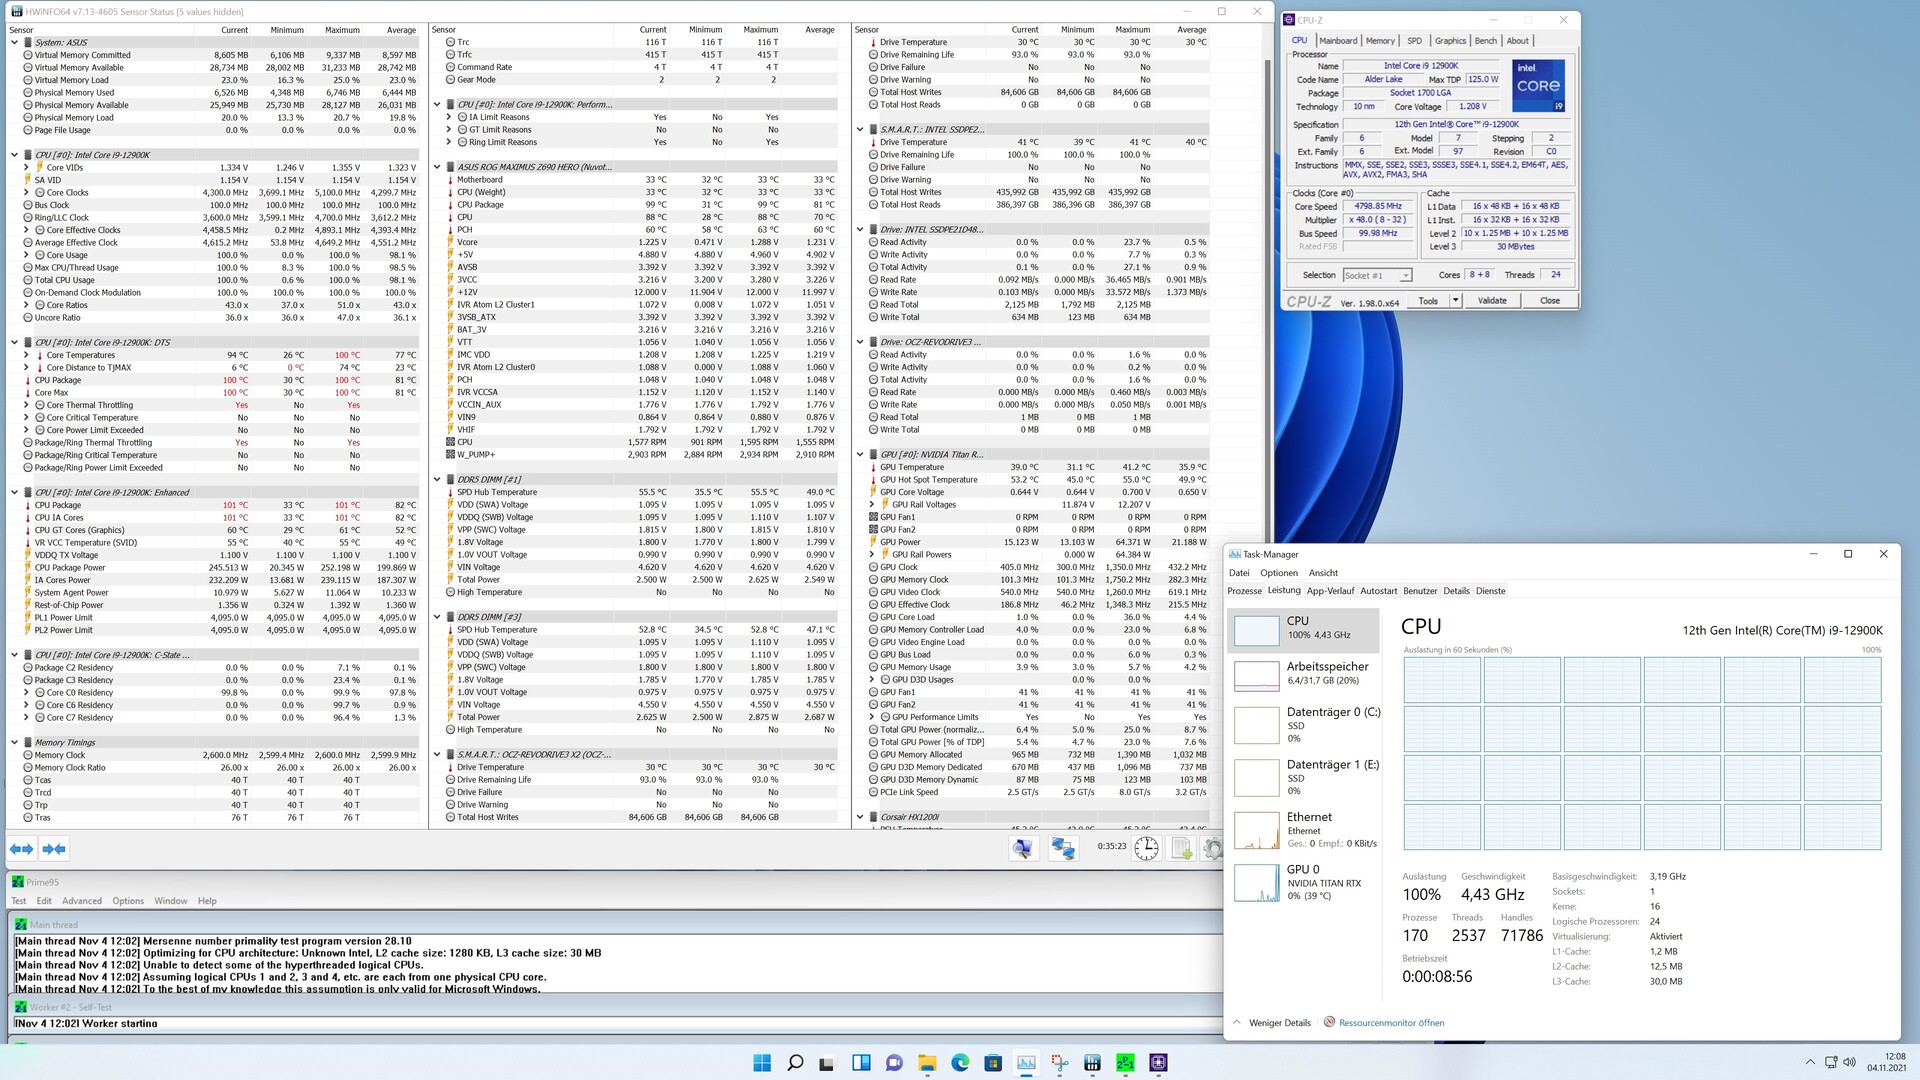
Consumo di energia e temperature
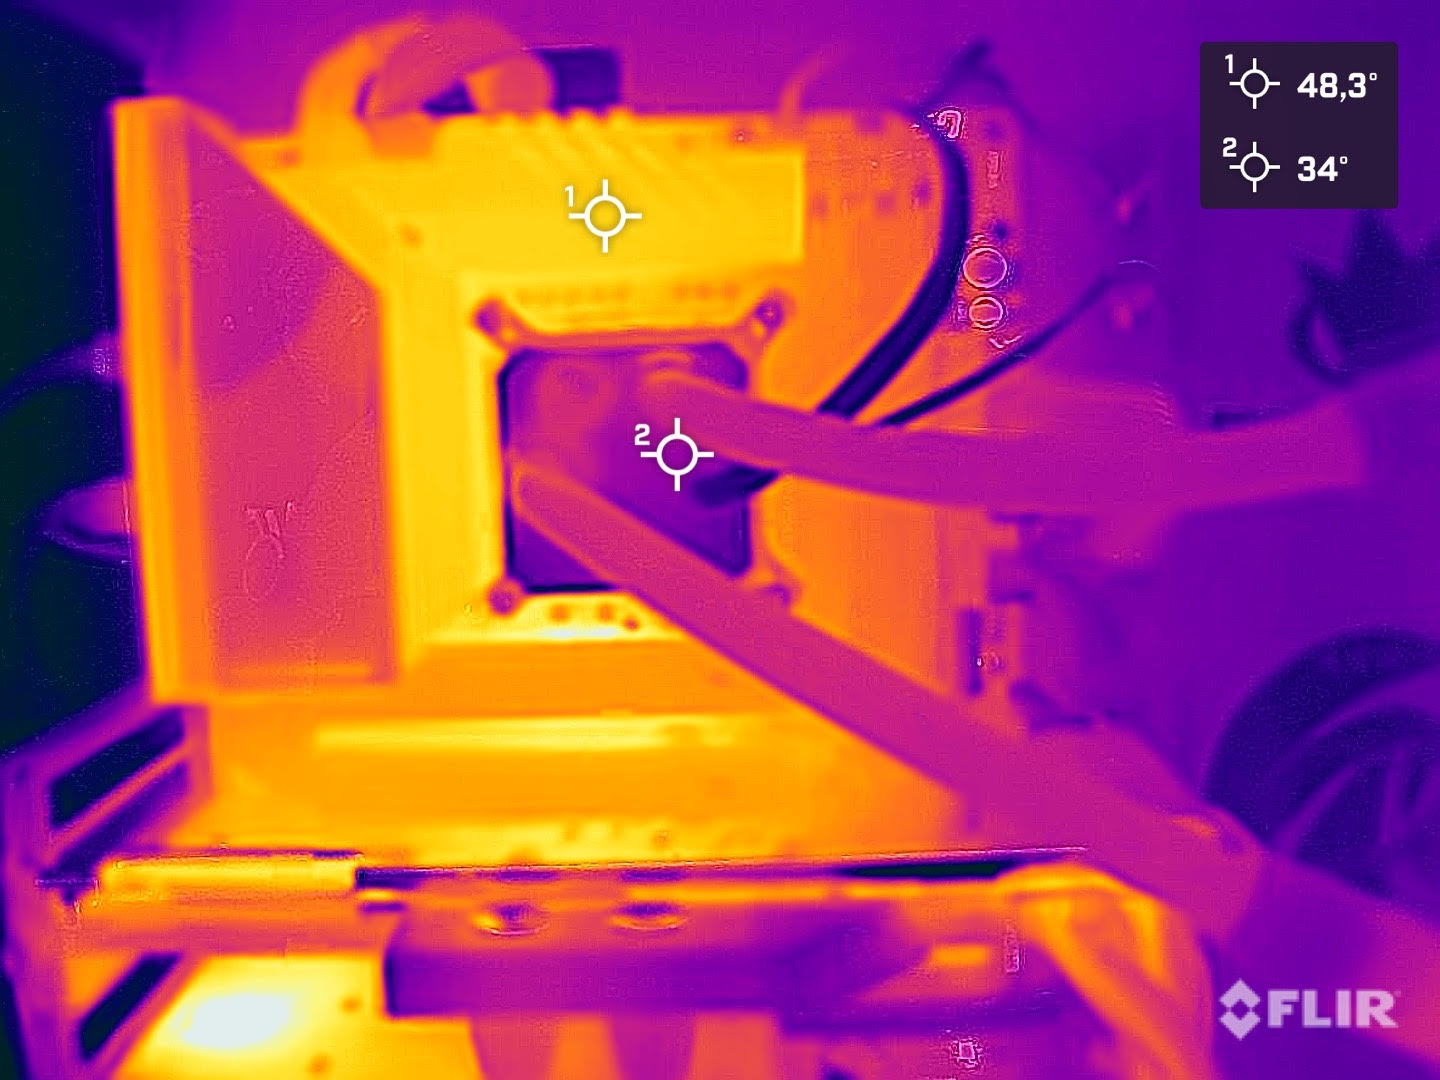
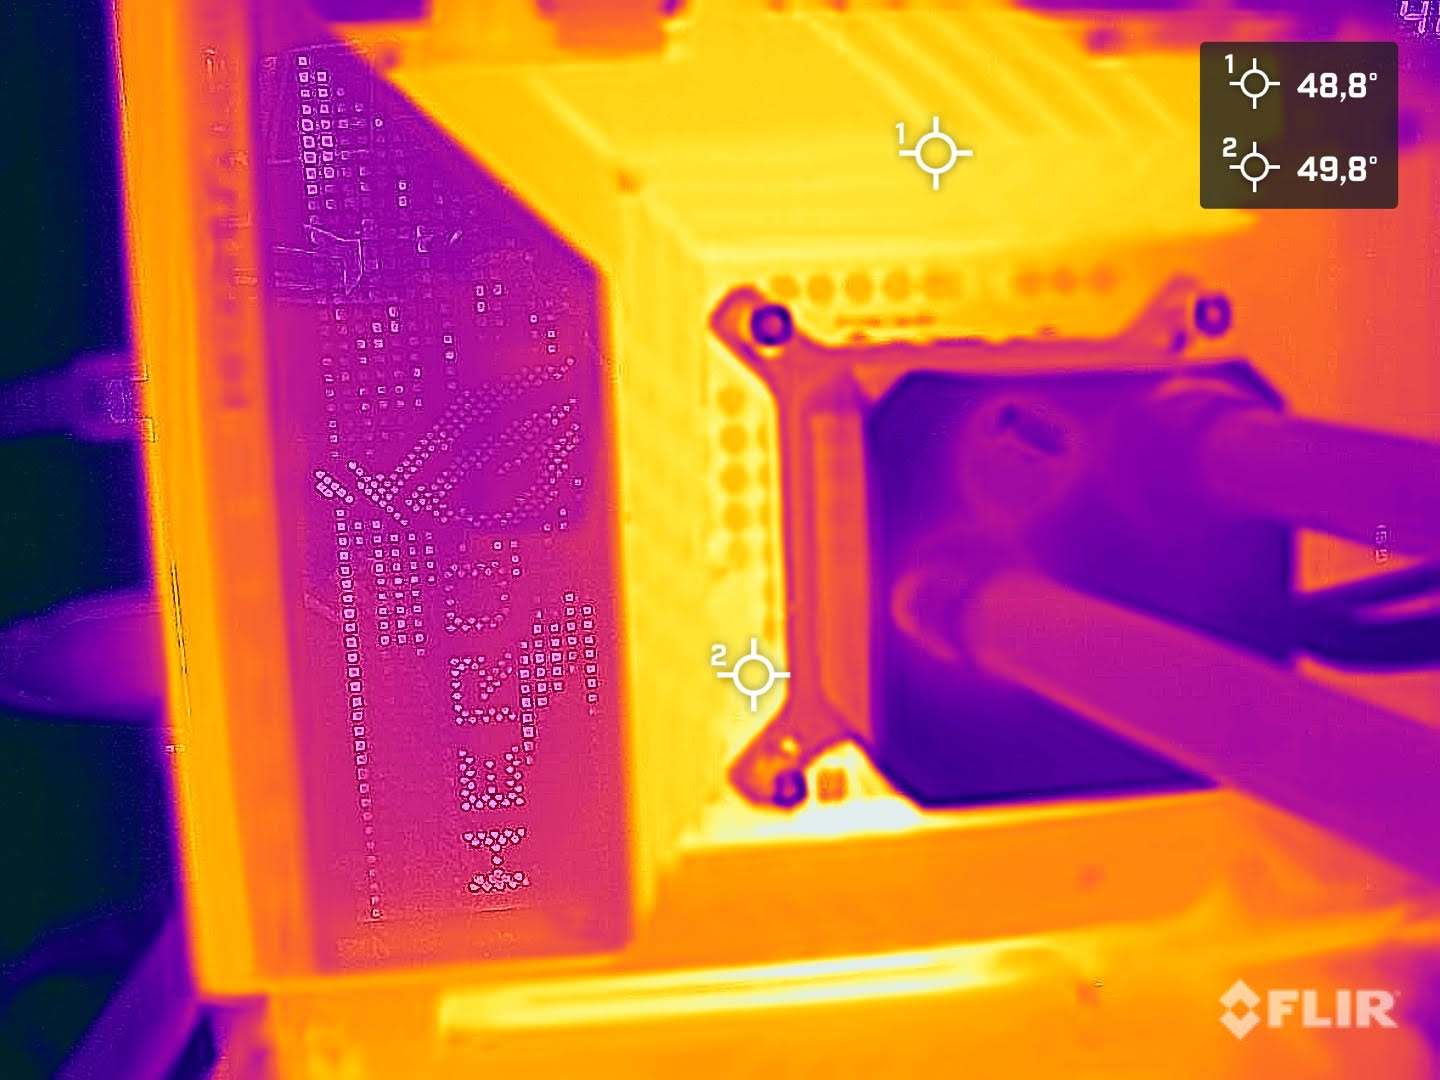
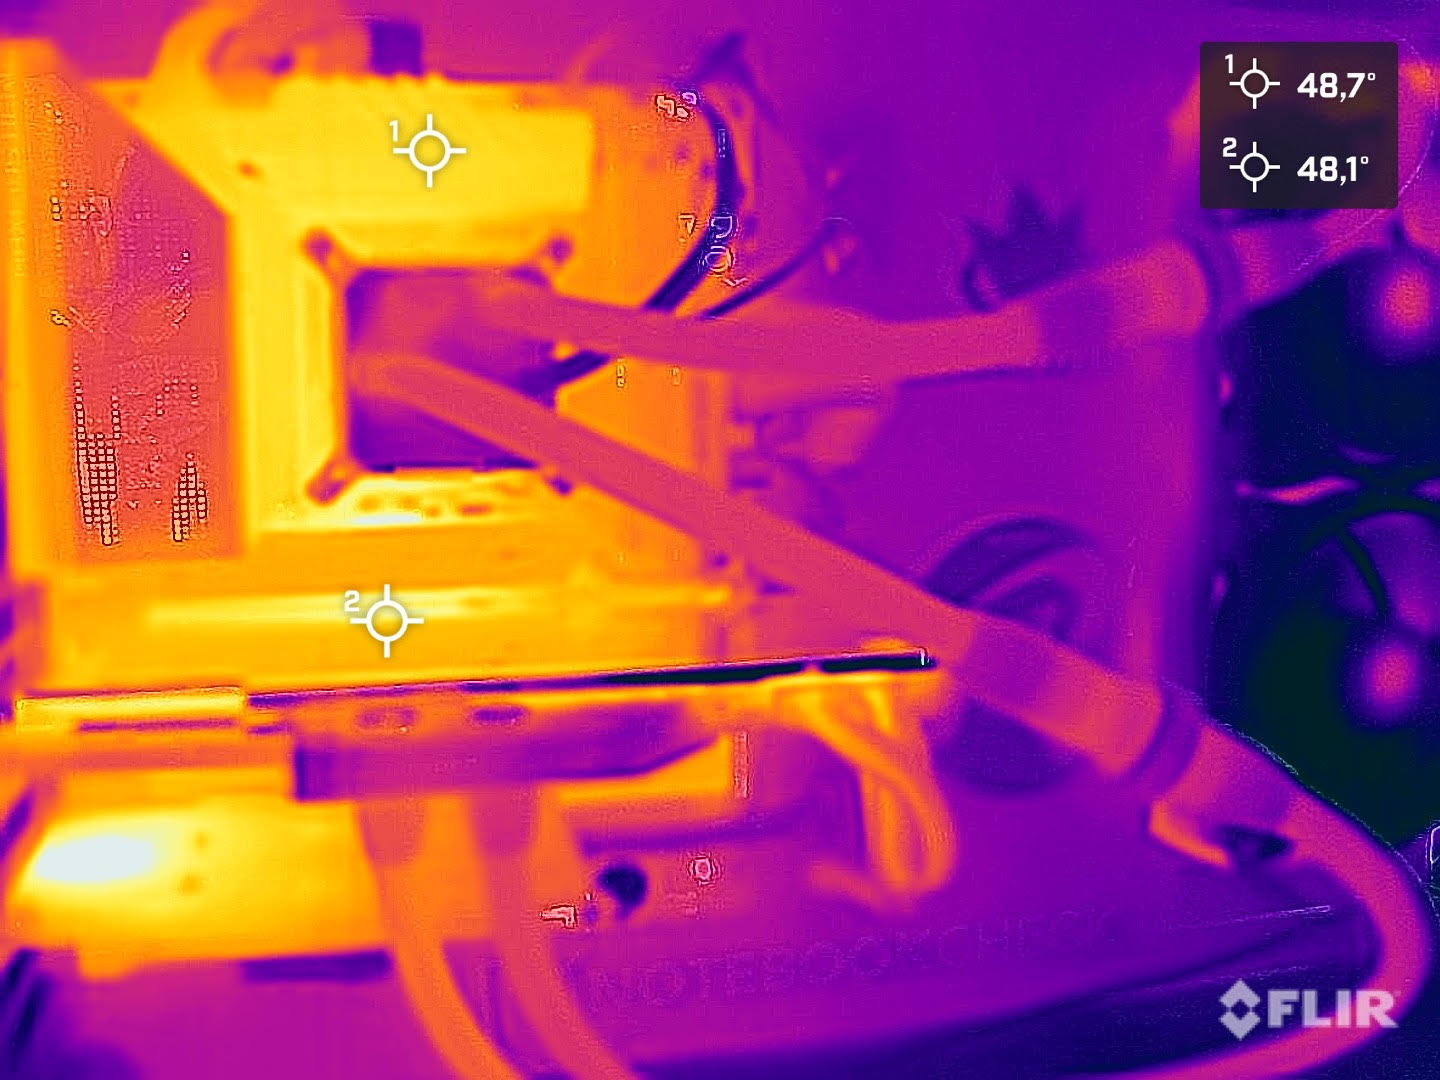
Secondo le specifiche tecniche, i processori offrono un TDP di 125 watt. Questo si riferisce al valore PL1. Il valore PL2 specifica la quantità di watt disponibili per il processore a pieno carico se tutti i requisiti sono soddisfatti. Con un massimo di 241 watt, l'Intel Core i9-12900K è leggermente più efficiente dell Intel Core i9-11900K. Nel nostro test, l'ammiraglia Alder Lake-S era effettivamente solo più efficientedel predecessore nel test di stress Prime95. Tuttavia, le nostre misurazioni hanno mostrato ancora poco meno di 280 watt per l'intero sistema. Nel test Cinebench R15 Multi, il nostro sistema di test ha consumato quasi il 25% in più di energia. Questo è un aumento che non può essere semplicemente scartato. Nell'Intel Core i5-12600K, il valore PL2 è limitato a 150 watt, che si riflette anche nei nostri risultati di misurazione. Rispetto all Intel Core i5-11600Kl'Intel Core i5-12600K è più efficiente del 7%. Tuttavia, l'immagine cambia nello stress test, e il Core i5-12600K assorbe il 13% in più di potenza dalla presa. I valori misurati durante il gioco sono ovviamente aumentati dalla Nvidia Titan RTX. Tuttavia, possiamo anche vedere qui che la piattaforma Alder Lake-S non invita al risparmio energetico.
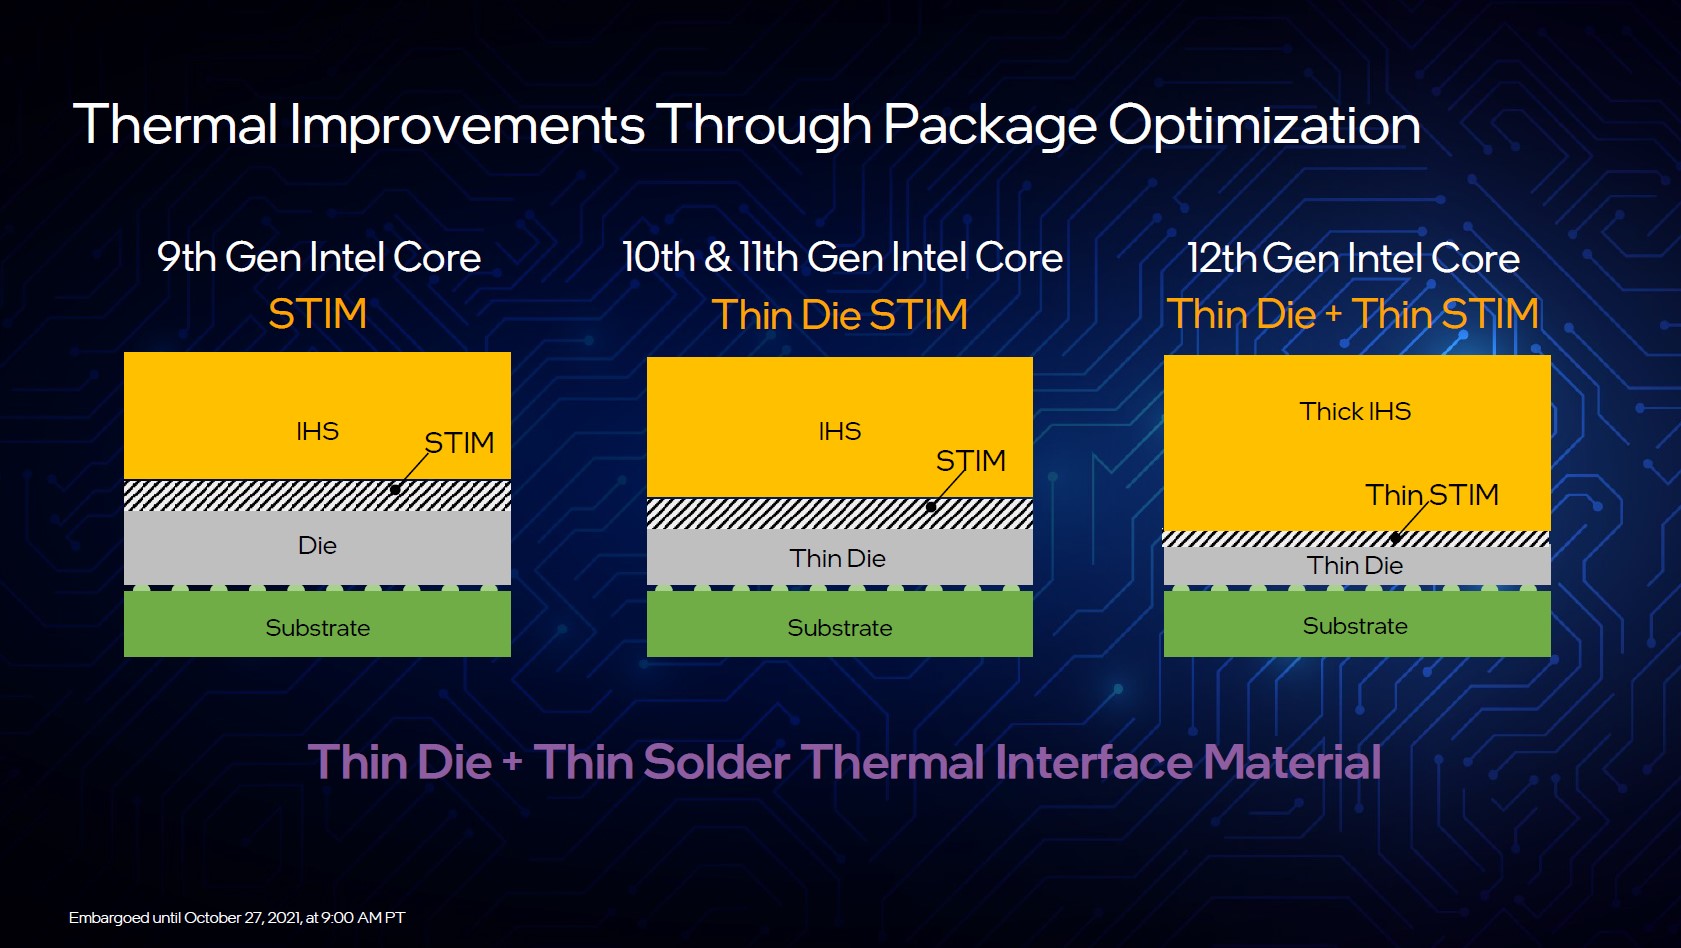
Le nostre temperature misurate hanno mostrato che l'Intel Core i9-12900K ha già raggiunto i 100 °C (212 °F ) diversi minuti dopo aver avviato il benchmark Prime95. Continuando lo stress test, la CPU ha dovuto essere strozzata per evitare di danneggiarla. Questo è lo svantaggio dell'impostazione PL1 = PL2 nel Bios. Tuttavia, non abbiamo notato alcun throttling sotto carico nel Cinebench R15 Multi loop. Per escludere una cattiva installazione del sistema di raffreddamento, lo abbiamo anche rimosso e poi reinstallato a un certo punto, ma il risultato dopo è stato lo stesso. Abbiamo anche contattato Alphacool per assicurarci che non ci sia incompatibilità del sistema di raffreddamento che abbiamo usato. Secondo il produttore, l'Alphacool Eisbear Aurora 280 AiO che abbiamo usato è compatibile con il socket LGA 1700. L'Intel Core i5-12600K è stato leggermente più facile da raffreddare sotto carico, ma abbiamo comunque notato una temperatura massima di 95 °C (203°F).
Quindi chi vuole usare un Intel Core i9-12900K dovrebbe anche ottenere un sistema di raffreddamento molto potente per ottenere il massimo dal processore.
| Power Consumption | |
| 1920x1080 The Witcher 3 ultra (external Monitor) | |
| Intel Core i9-12900K (Idle: 70.5 W) | |
| AMD Ryzen 9 5950X (Idle: 78 W) | |
| AMD Ryzen 9 5900X (Idle: 78.1 W) | |
| Intel Core i5-11600K (Idle: 69.49 W) | |
| AMD Ryzen 7 5800X (Idle: 77.5 W) | |
| AMD Ryzen 5 5600X (Idle: 79.23 W) | |
| Intel Core i5-12600K (Idle: 70.45 W) | |
| Intel Core i7-10700K (Idle: 67.7 W) | |
| Intel Core i9-10900K (Idle: 52.3 W) | |
| Intel Core i9-11900K (Idle: 57.3 W) | |
| Intel Core i5-10600K (Idle: 52.2 W) | |
| Prime95 V2810 Stress (external Monitor) | |
| Intel Core i9-11900K (Idle: 57.3 W) | |
| Intel Core i9-12900K (Idle: 70.5 W) | |
| Intel Core i9-10900K (Idle: 52.3 W) | |
| Intel Core i5-12600K (Idle: 70.45 W) | |
| AMD Ryzen 9 5950X (Idle: 78 W) | |
| AMD Ryzen 7 5800X (Idle: 77.5 W) | |
| AMD Ryzen 9 5900X (Idle: 78.1 W) | |
| Intel Core i5-11600K (Idle: 69.49 W) | |
| Intel Core i7-10700K (Idle: 67.7 W) | |
| Intel Core i5-10600K (Idle: 52.2 W) | |
| AMD Ryzen 5 5600X (Idle: 79.23 W) | |
| Cinebench R15 Multi (external Monitor) | |
| Intel Core i9-12900K (Idle: 70.5 W) | |
| Intel Core i9-10900K (Idle: 52.3 W) | |
| Intel Core i9-11900K (Idle: 57.3 W) | |
| AMD Ryzen 9 5900X (Idle: 78.1 W) | |
| AMD Ryzen 9 5950X (Idle: 78 W) | |
| AMD Ryzen 7 5800X (Idle: 77.5 W) | |
| Intel Core i5-11600K (Idle: 69.49 W) | |
| Intel Core i7-10700K (Idle: 67.7 W) | |
| Intel Core i5-12600K (Idle: 70.45 W) | |
| Intel Core i5-10600K (Idle: 52.2 W) | |
| AMD Ryzen 5 5600X (Idle: 79.23 W) | |
| Temperatures - CPU Temperature Prime95 | |
| Intel Core i9-11900K | |
| AMD Ryzen 7 5800X | |
| Intel Core i9-10900K | |
| Intel Core i5-11600K | |
| AMD Ryzen 9 5900X | |
| Intel Core i5-10600K | |
| AMD Ryzen 9 5950X | |
* ... Meglio usare valori piccoli
Pro
Contro
Verdetto - Torna in cima con un totale di 24 fili
Con Alder Lake-S, Intel riesce davvero ad avere la CPU da gioco più veloce, almeno per ora. Ma questo non è tutto. Alder Lake-S non è solo un processore di ultima generazione aggiornato, come abbiamo spesso visto prima. Non è questo il caso, poiché la nuova architettura include molti miglioramenti. Molti di questi li conosciamo già dal settore mobile, dato che gli smartphone e i tablet contengono già da anni processori con core performanti ed energeticamente efficienti. Intel fa anche uso di questo design nella sua attuale linea di desktop, aumentando le prestazioni multi-core in modo drammatico. In questo modo, l'Intel Core i9-12900K in grado di operare su un totale di 24 thread in parallelo. Inoltre, l'IPC è stato anche migliorato significativamente, che beneficia enormemente il gioco
La base sottostante è anche cambiata completamente e un semplice aggiornamento da Rocket Lake-S è impossibile senza sostituire la scheda madre. Dovete assolutamente includere questo nel vostro calcolo dei costi. A proposito di costi, il prezzo di acquisto consigliato è di 589 dollari ed è attualmente disponibile a partire da 659 euro (~$762) in alcuni posti. A seconda della disponibilità, ci potrebbe essere qualche aumento di prezzo qui, come per le schede grafiche. Il leggermente più debole ma ancora molto veloce Intel Core i5-12600K parte da un prezzo consigliato di 289 dollari secondo Intel. Secondo la nostra ricerca iniziale, il modello è già disponibile da 319 euro (~$369) in alcuni posti. Questo è un prezzo attraente che anche AMD attualmente non può battere. Il corrispondente AMD Ryzen 7 5800Xcosta 379 euro (~$438) a questo punto. Le cose sembrano un po' diverse qui con il modello superiore, dove l AMD Ryzen 9 5900Xè significativamente più conveniente a 519 euro (~$600).
L'Intel Core i9-12900K è una CPU da gioco molto buona con alcune riserve per il futuro. Con la CPU da gioco più veloce sul mercato, Intel può darsi una pacca sulla spalla per ora.
Tuttavia, per rendere l'Intel Core i9-12900K più competitivo, il prezzo dovrebbe scendere, dato che, come abbiamo già detto, dovrete sicuramente investire anche in una nuova scheda madre e in alcune circostanze anche in nuova memoria di lavoro se deve essere DDR5. Ma ci piace il fatto che avete anche la possibilità di continuare a usare le DDR4. I produttori di schede madri offrono alcuni modelli specifici con RAM DDR4 per questo. Tuttavia, se questi supporteranno poi anche Raptor Lake-S non è purtroppo ancora noto.
Siamo rimasti un po' delusi dal consumo energetico. Naturalmente le prestazioni sono state drasticamente migliorate e il corrispondente consumo energetico leggermente più alto rimane nei limiti. Ma sarebbe stato fantastico, se questo aumento di prestazioni potesse essere combinato con un consumo energetico notevolmente inferiore. Questo aiuterebbe anche a gestire meglio i problemi di raffreddamento.
Coloro che già vogliono prenderlo ora possono ottenere l'Intel Core i5-12600K daAmazon per ~$323 e l'Intel Core i9-12900K anche da Amazon per ~$1400. Mentre Newegg lo elenca per $649, è attualmente esaurito lì.

