Benchmarking Intel Comet Lake-S CPUs fino a 10 cores
Comet Lake-S è il nome dell'ultima generazione di processori Intel, rivelata per la prima volta il 30 aprile 2020. Si basa sul processo di produzione a 14 nm, che esiste ormai da anni. Qui, AMD è molto più avanti. Produce chip Ryzen 3000 utilizzando il nodo a 7 nm.
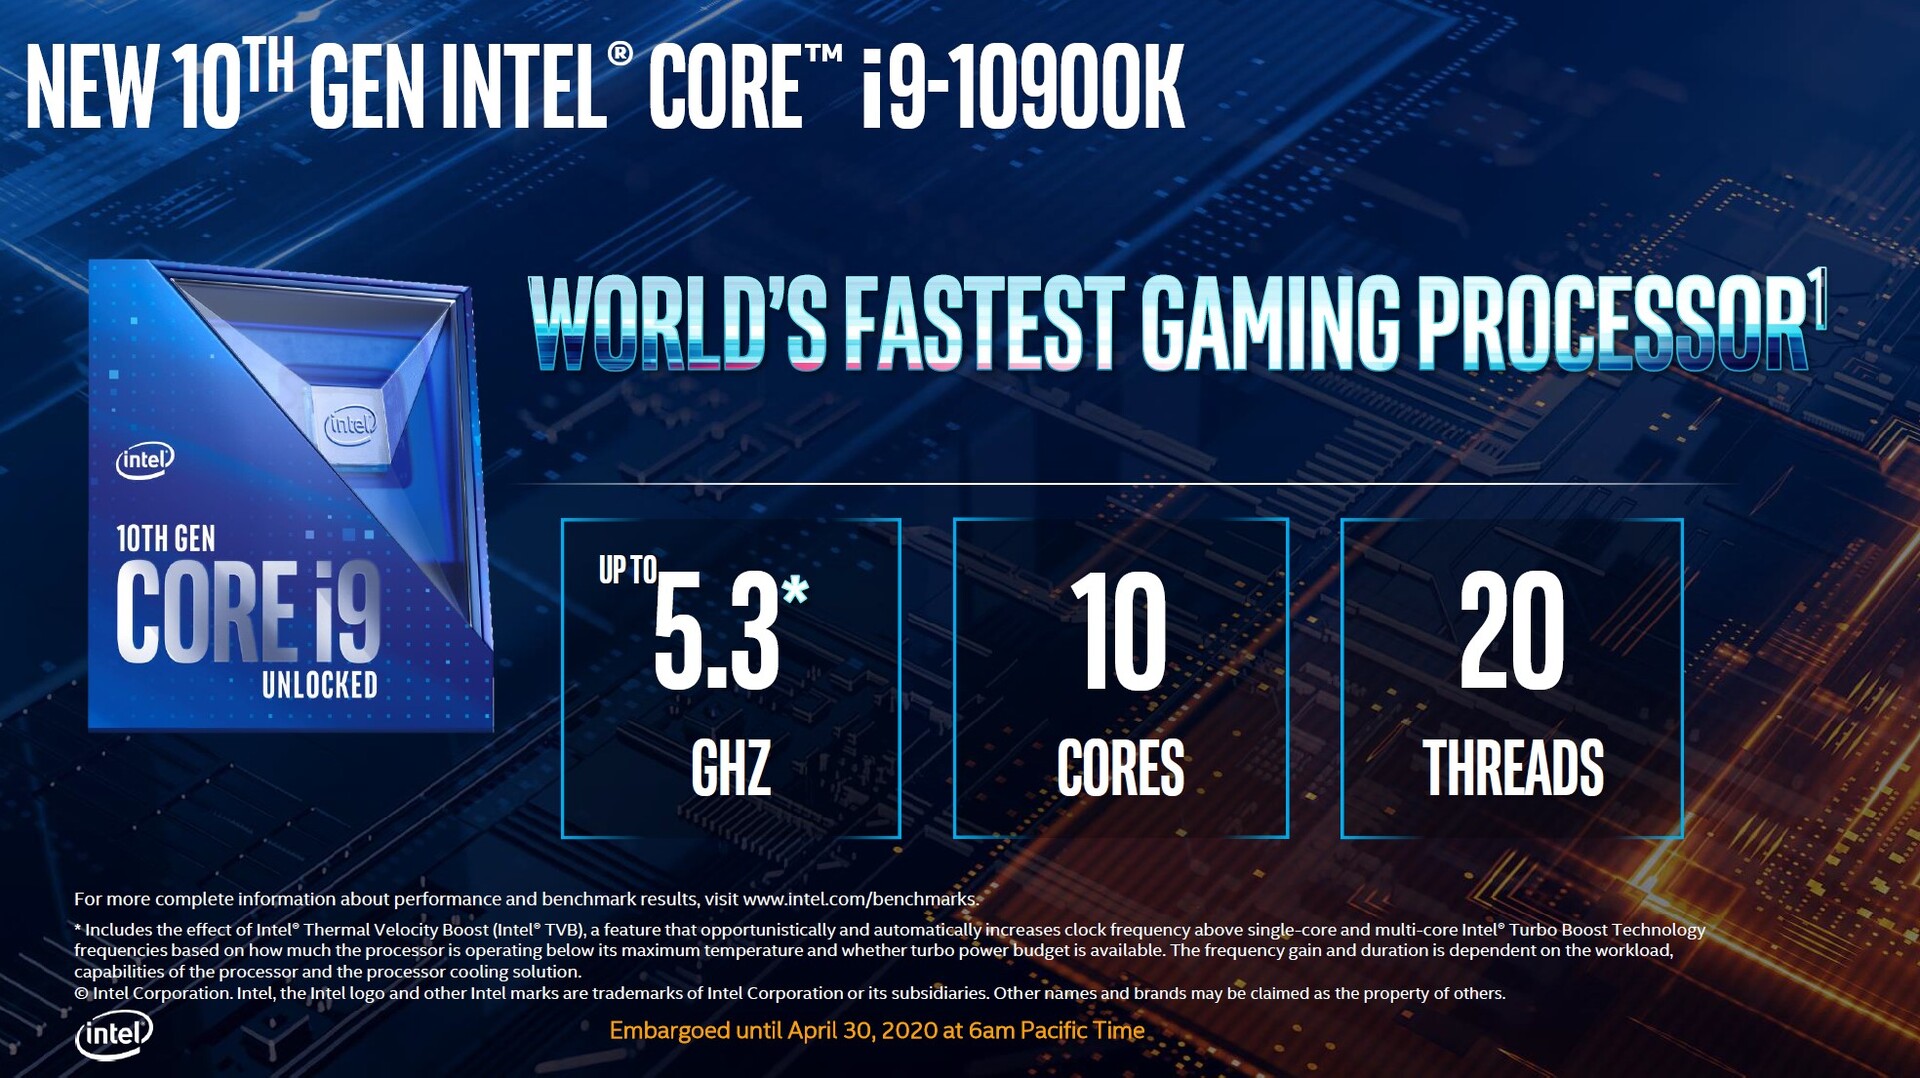
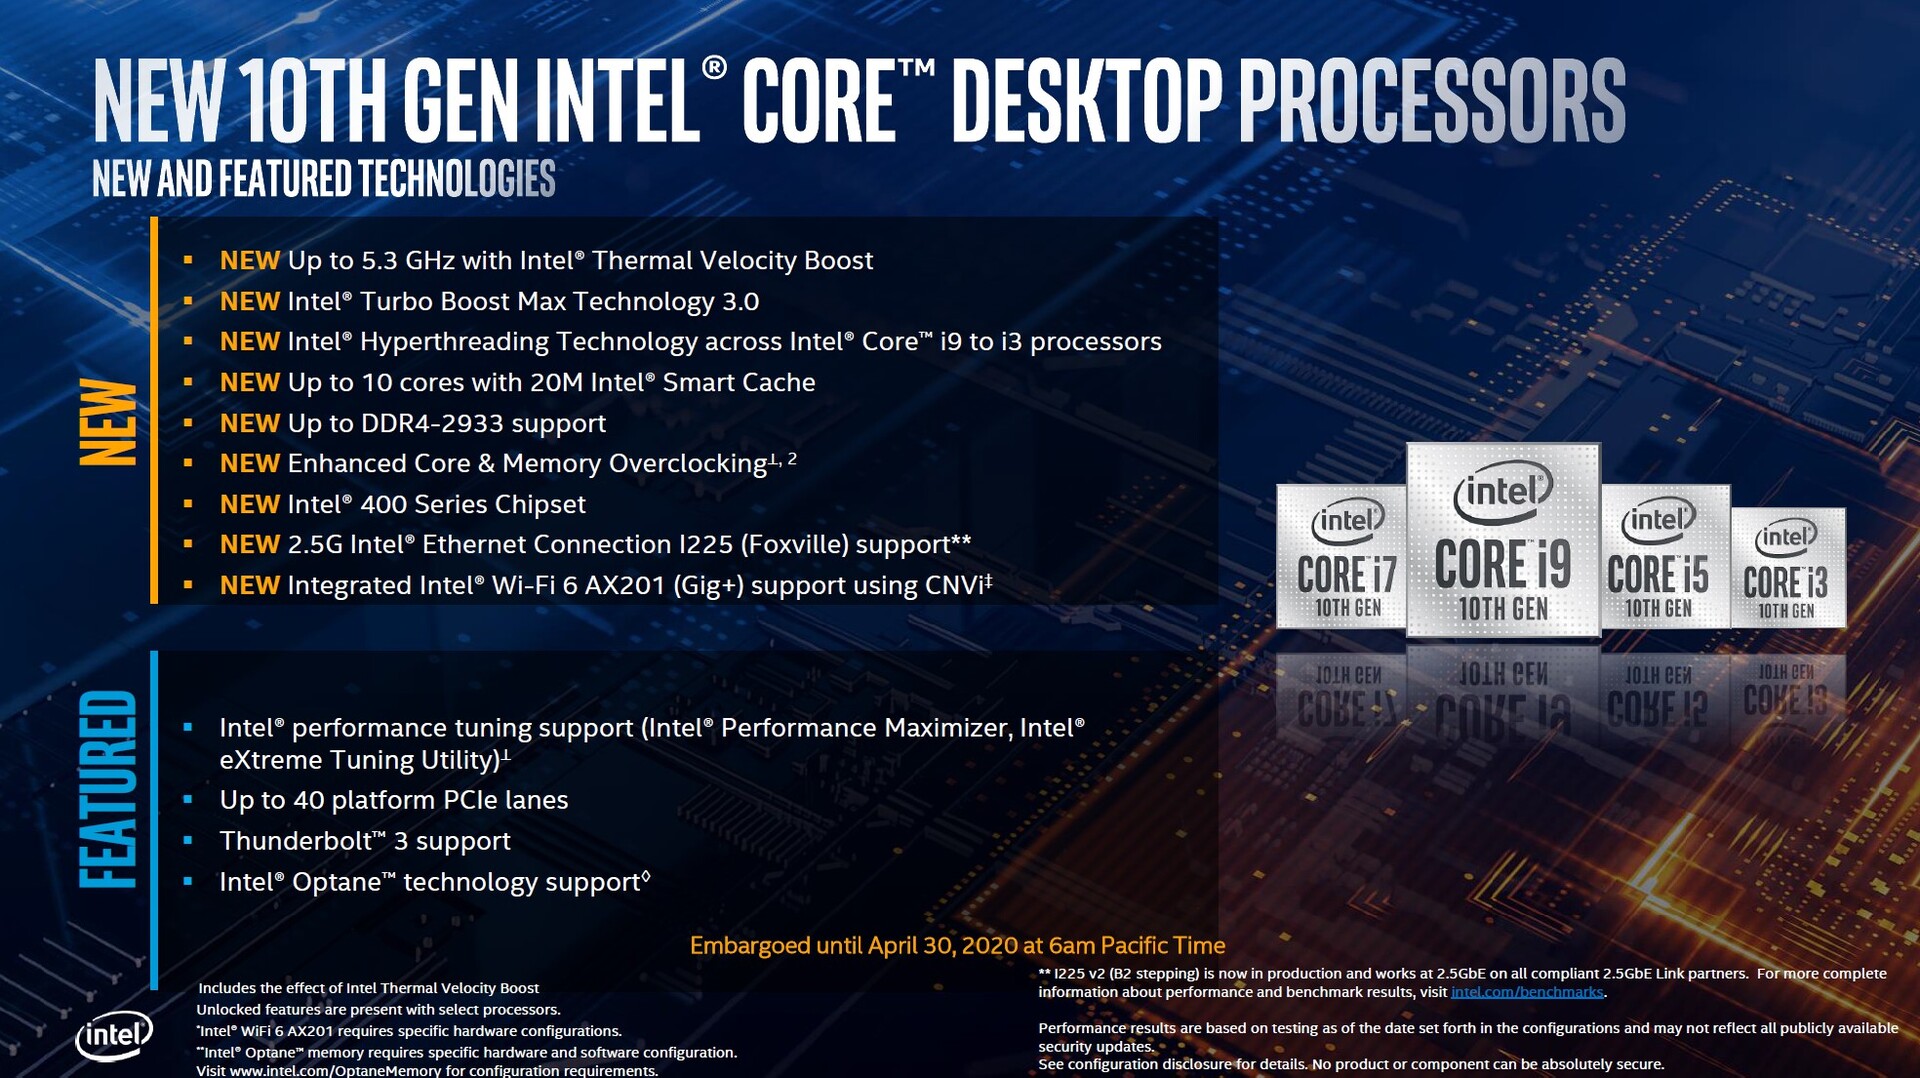
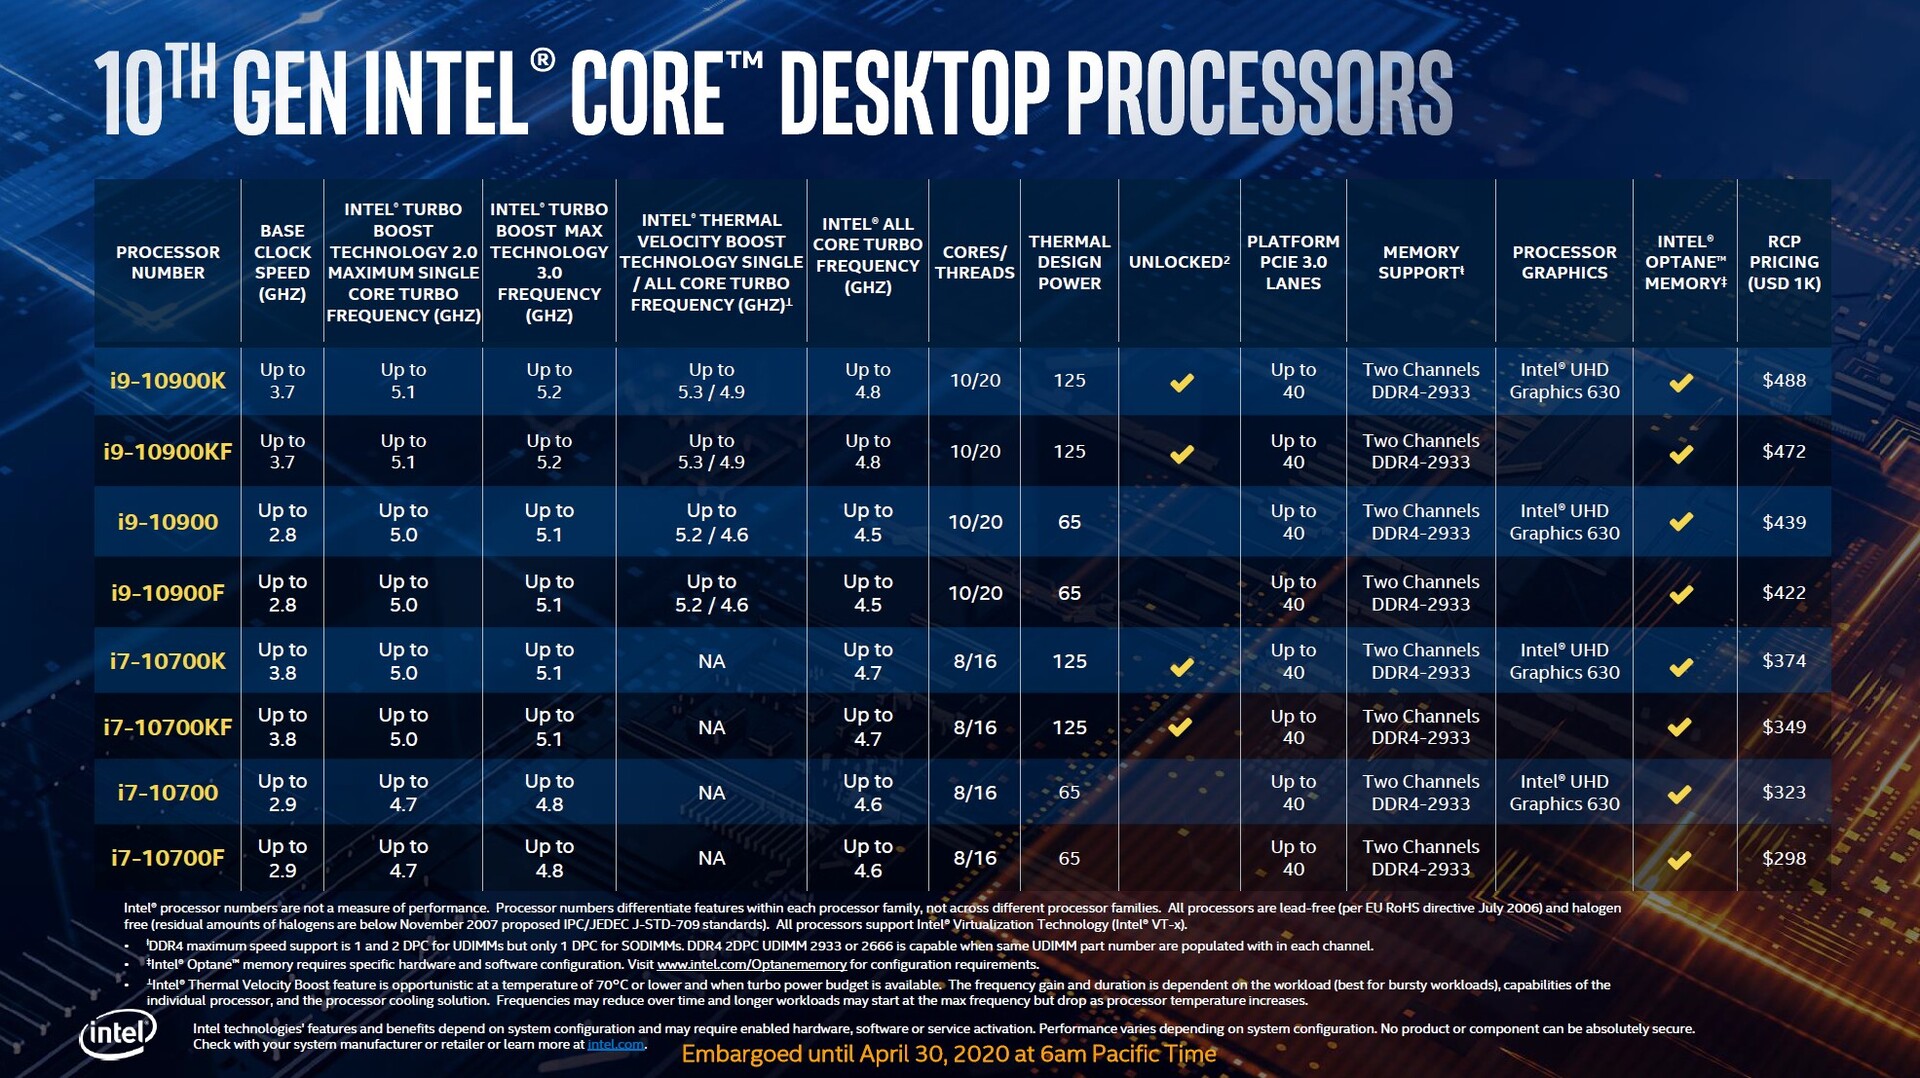
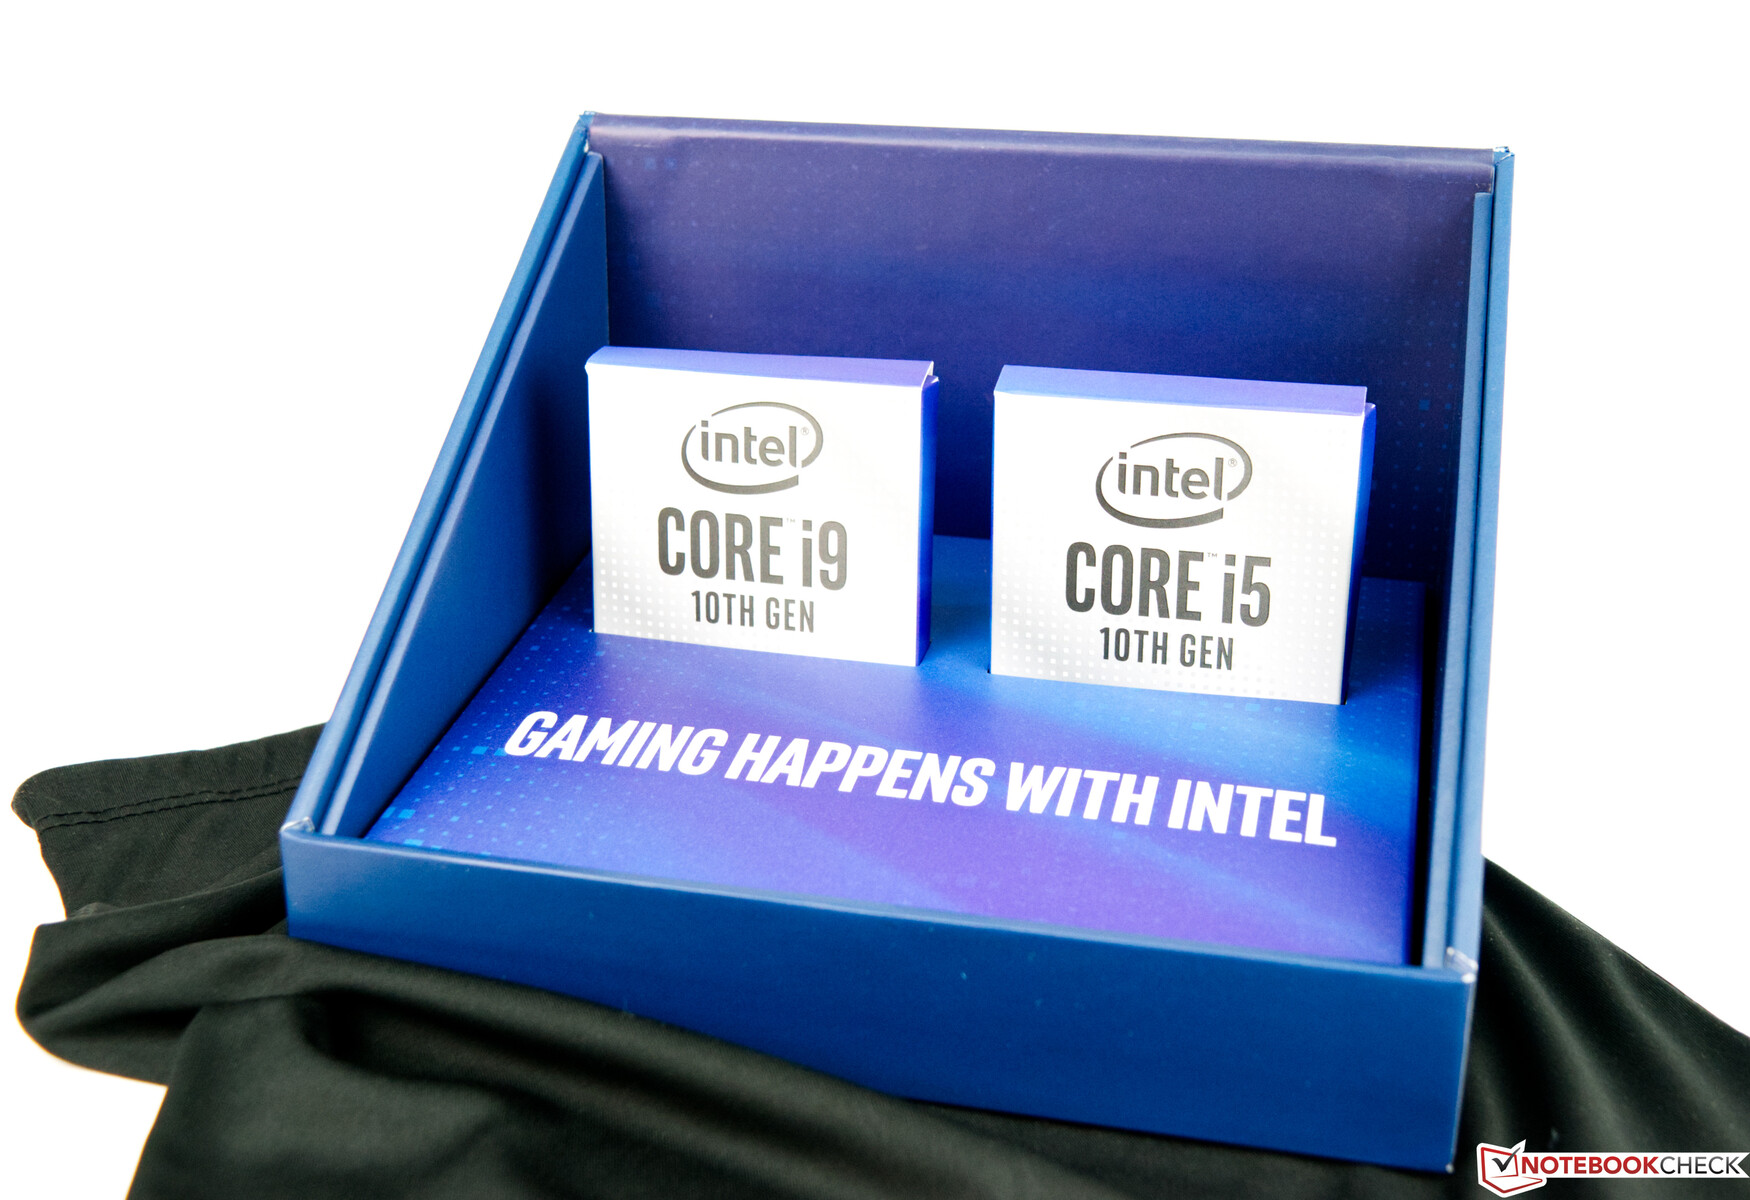
Rispetto alla nona generazione, il modello di fascia alta offre due cores in più. Questo è il primo chip consumer a 10 cores. Intel vende da anni chip a 10 cores per la sua piattaforma HEDT. Nel grafico sottostante, si possono vedere tutti i nuovi processori della popolare serie Core di Intel. Intel ha mantenuto le lettere alla fine dei nomi dei processori per aiutare a distinguere i diversi modelli. Per esempio, la lettera T alla fine del nome della CPU significa che la parte ha un TDP da 35 watt, e i nomi di tutte le CPU overclockabili terminano con la lettera K.
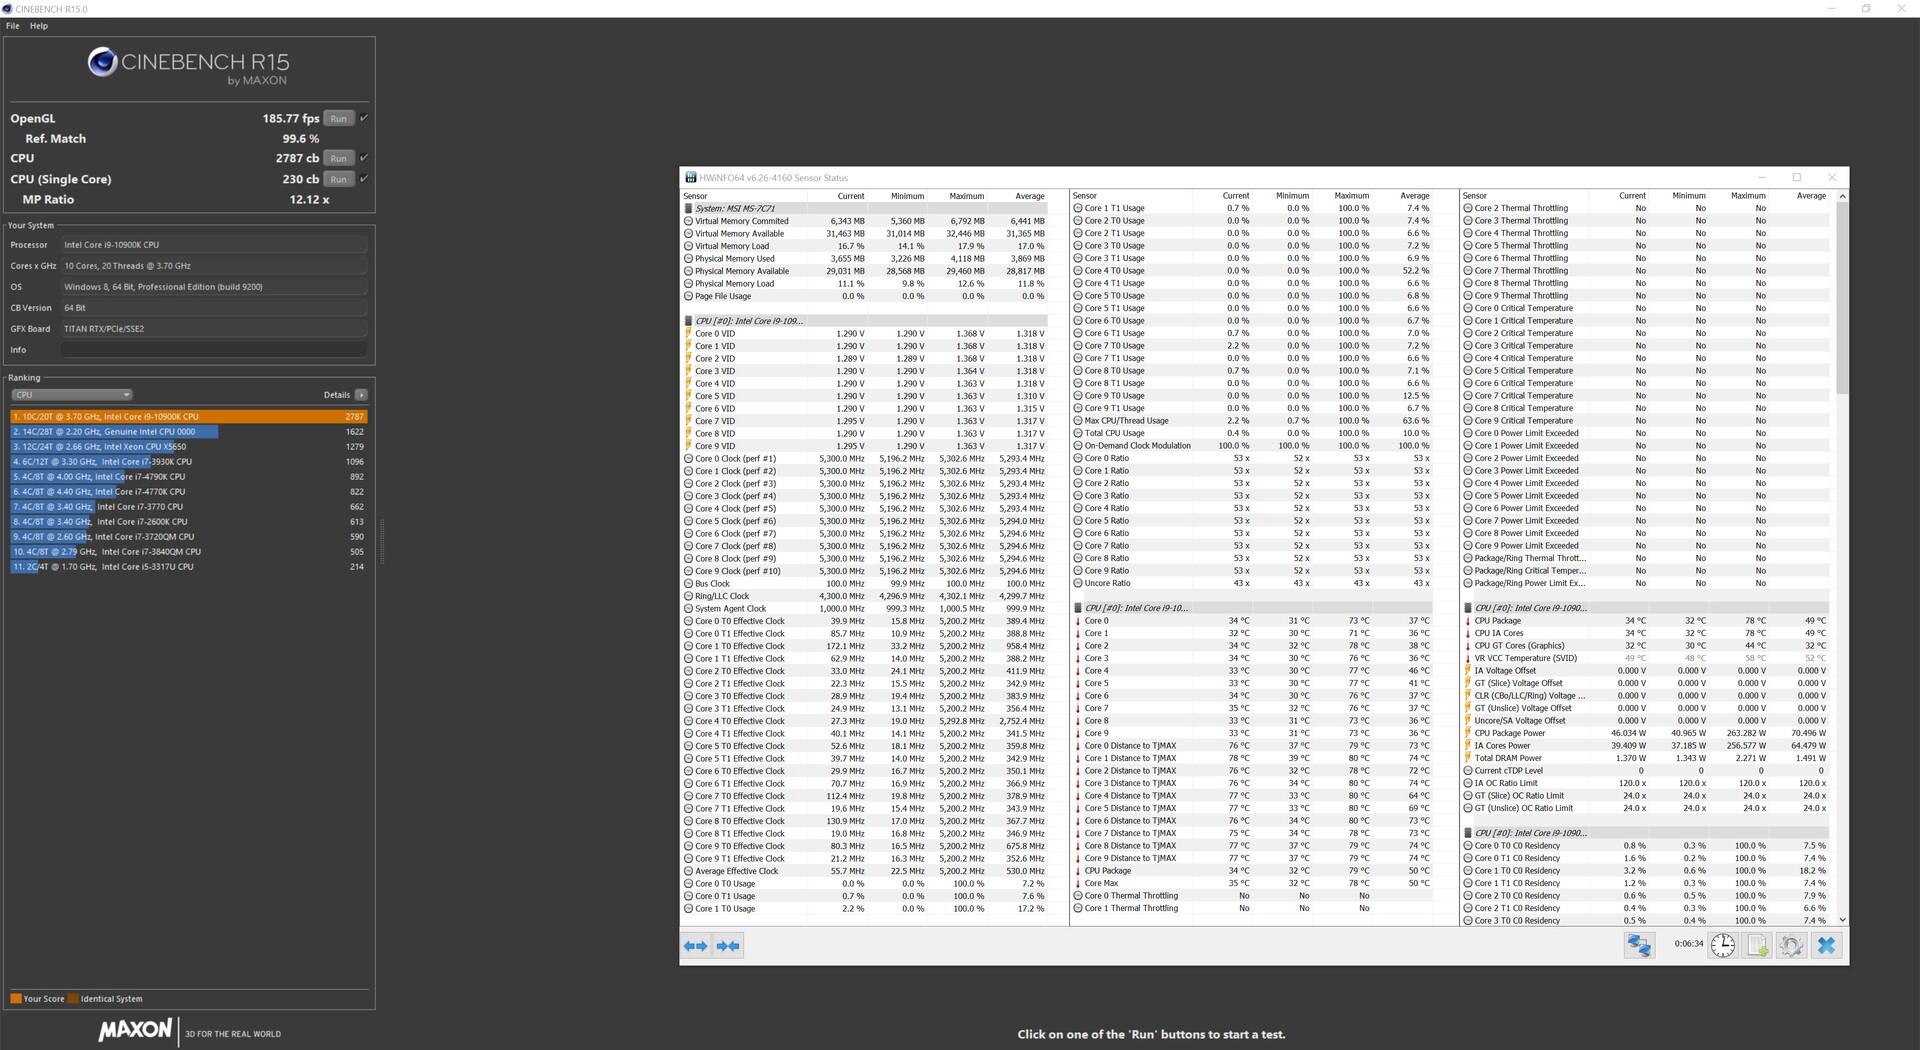
In termini di velocità di clock, Intel ha apportato alcune modifiche rispetto alla generazione precedente. Le parti più recenti sono dotate della tecnologia Turbo Boost Max Technology 3.0. Essa consente alla CPU di raggiungere frequenze di clock più elevate in determinate circostanze. Lo stesso si può dire anche della tecnologia Thermal Velocity Boost di Intel, che permette al Core i9-10900K di raggiungere i 5,3 GHz. Tuttavia, gli acquirenti devono fare attenzione perché tutte le specifiche del Boost sono frequenze teoriche più alte, che dipendono da tutta una serie di fattori come il tipo di carico di lavoro, il numero di cores utilizzati, l'assorbimento di potenza calcolato e la temperatura della CPU. Nella nostra recensione, siamo stati in grado di osservare il Core i9-10900K che ha raggiunto i 5,3 GHz in Cinebench R15. Tuttavia, la CPU non è stata in grado di mantenere una frequenza di clock così elevata per un periodo di tempo prolungato. Pertanto, non sarebbe realistico supporre che la CPU sia in grado di mantenere un clock boost a 5,3 GHz perun periodo prolungato senza alcun overclocking.
Rispetto alle CPU di 9a generazione, il TDP è aumentato in modo significativo. Anche la durata del Turbo Boost è stata aumentata, motivo per cui i nuovi chip hanno prestazioni significativamente migliori in molti benchmarks. Nel complesso, ci sono due stati di potenza: PL1 (Livello di potenza 1) e PL2 (Livello di potenza 2).
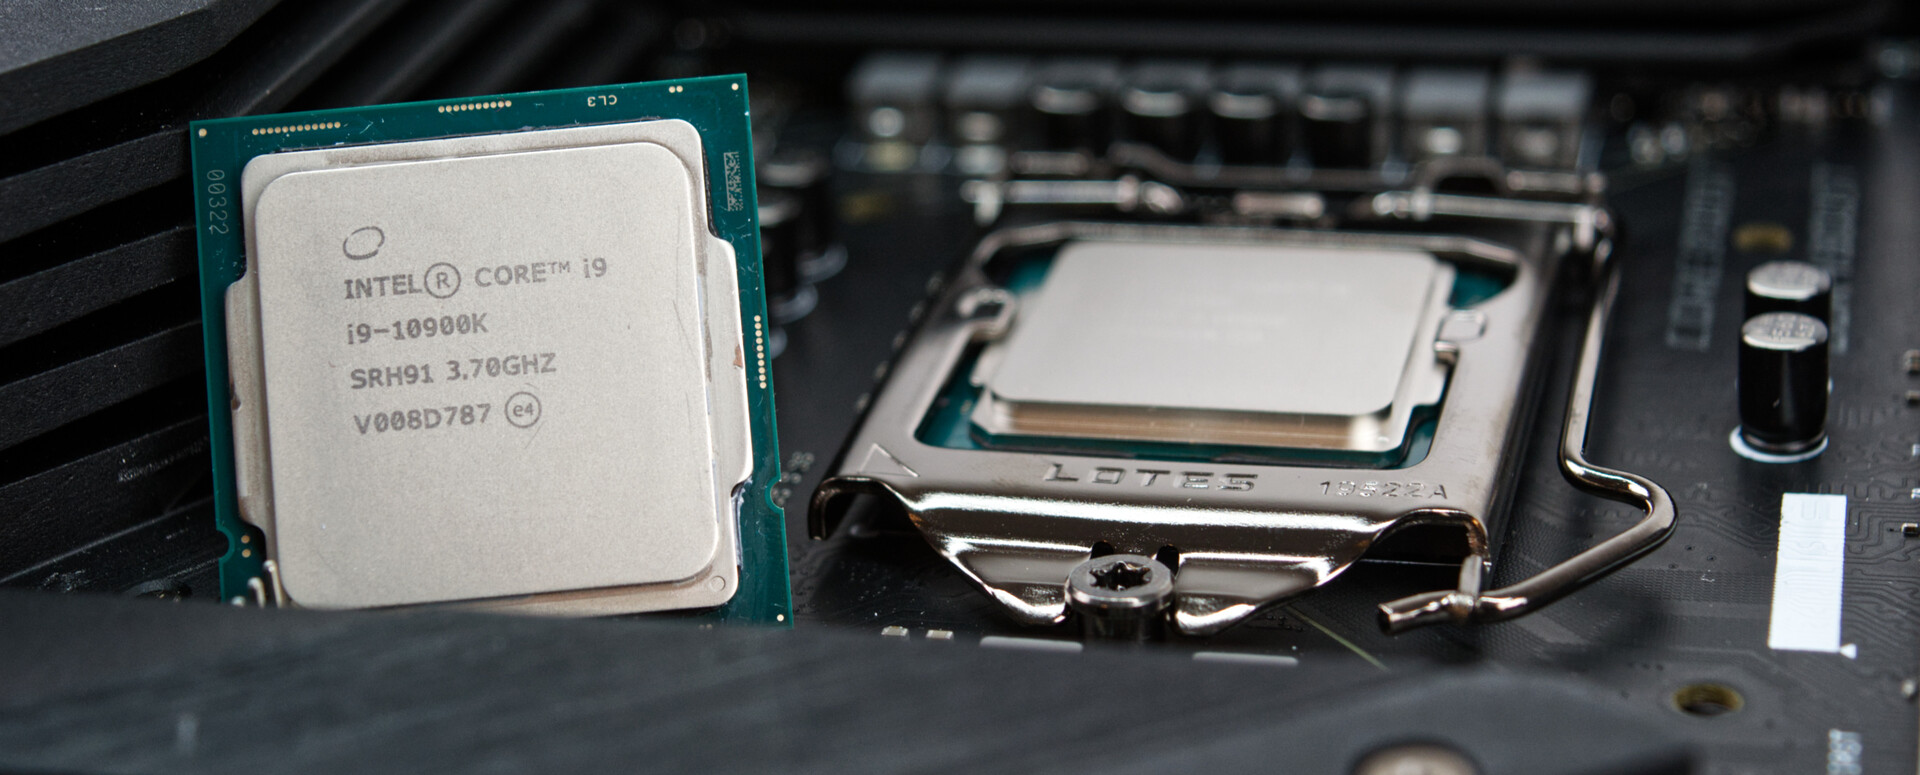
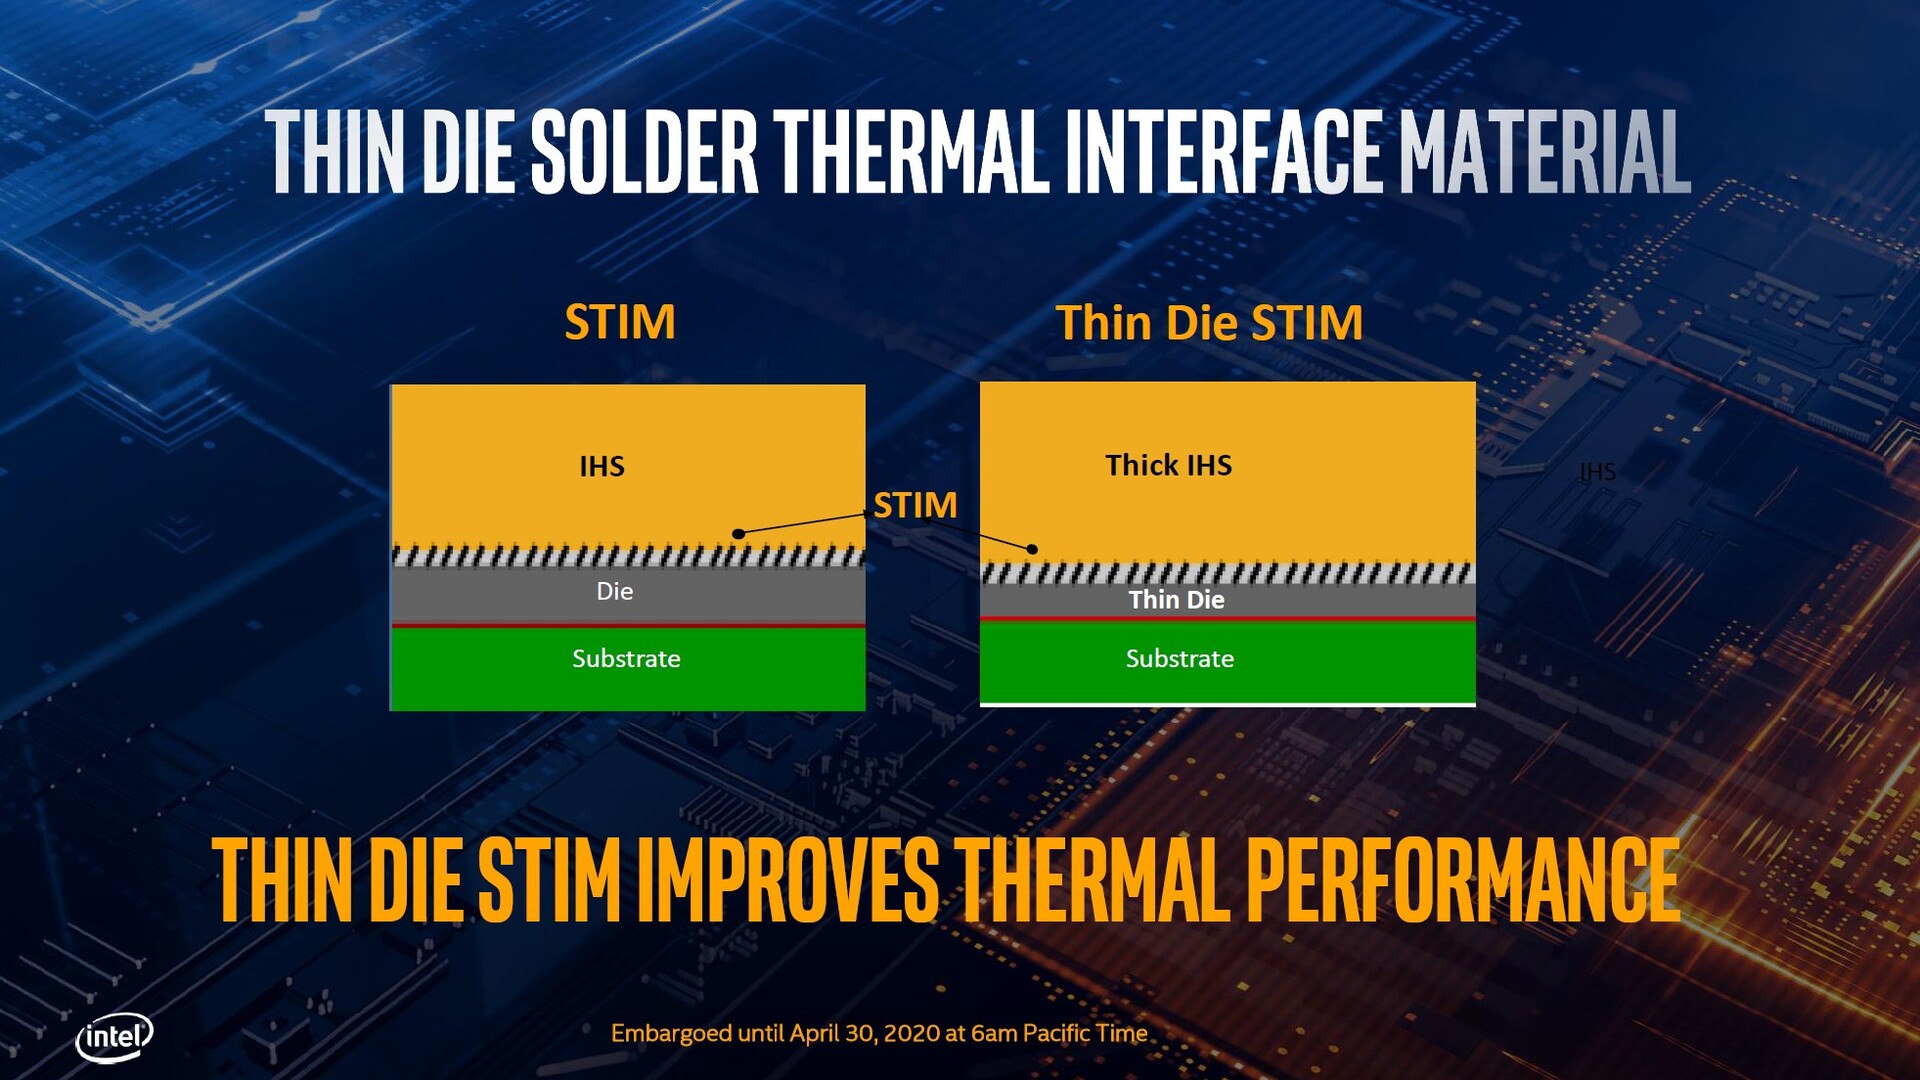
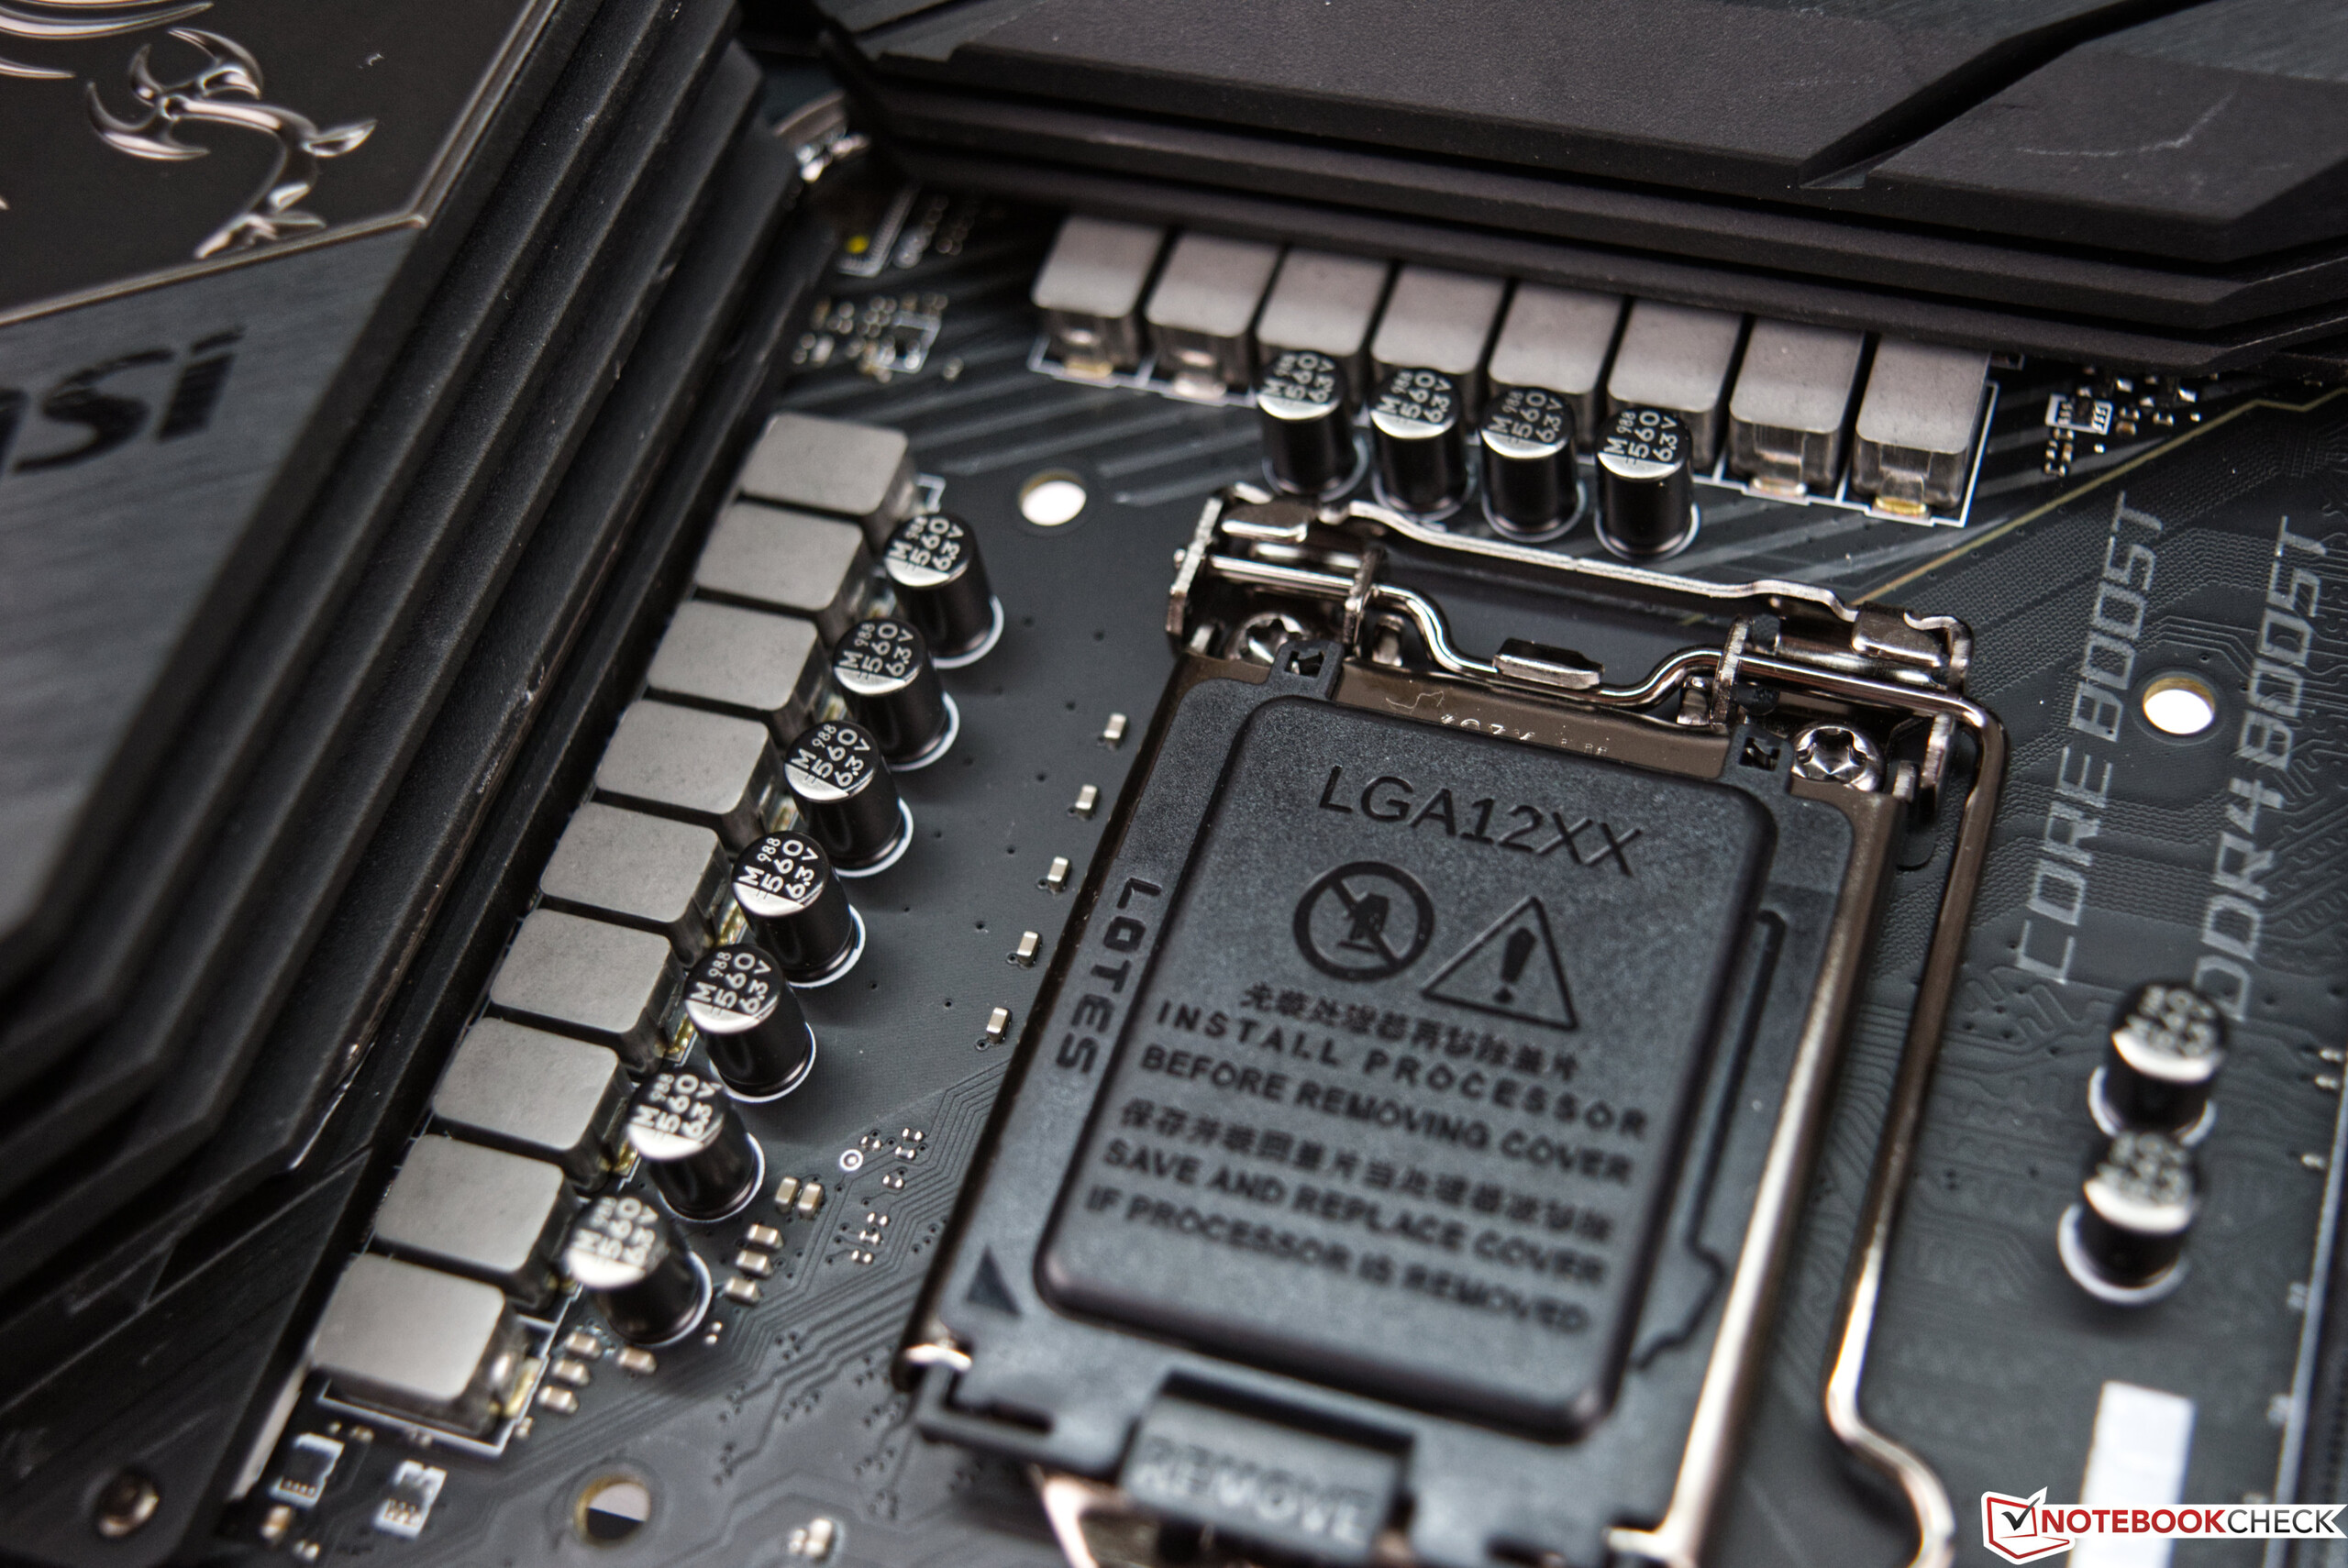
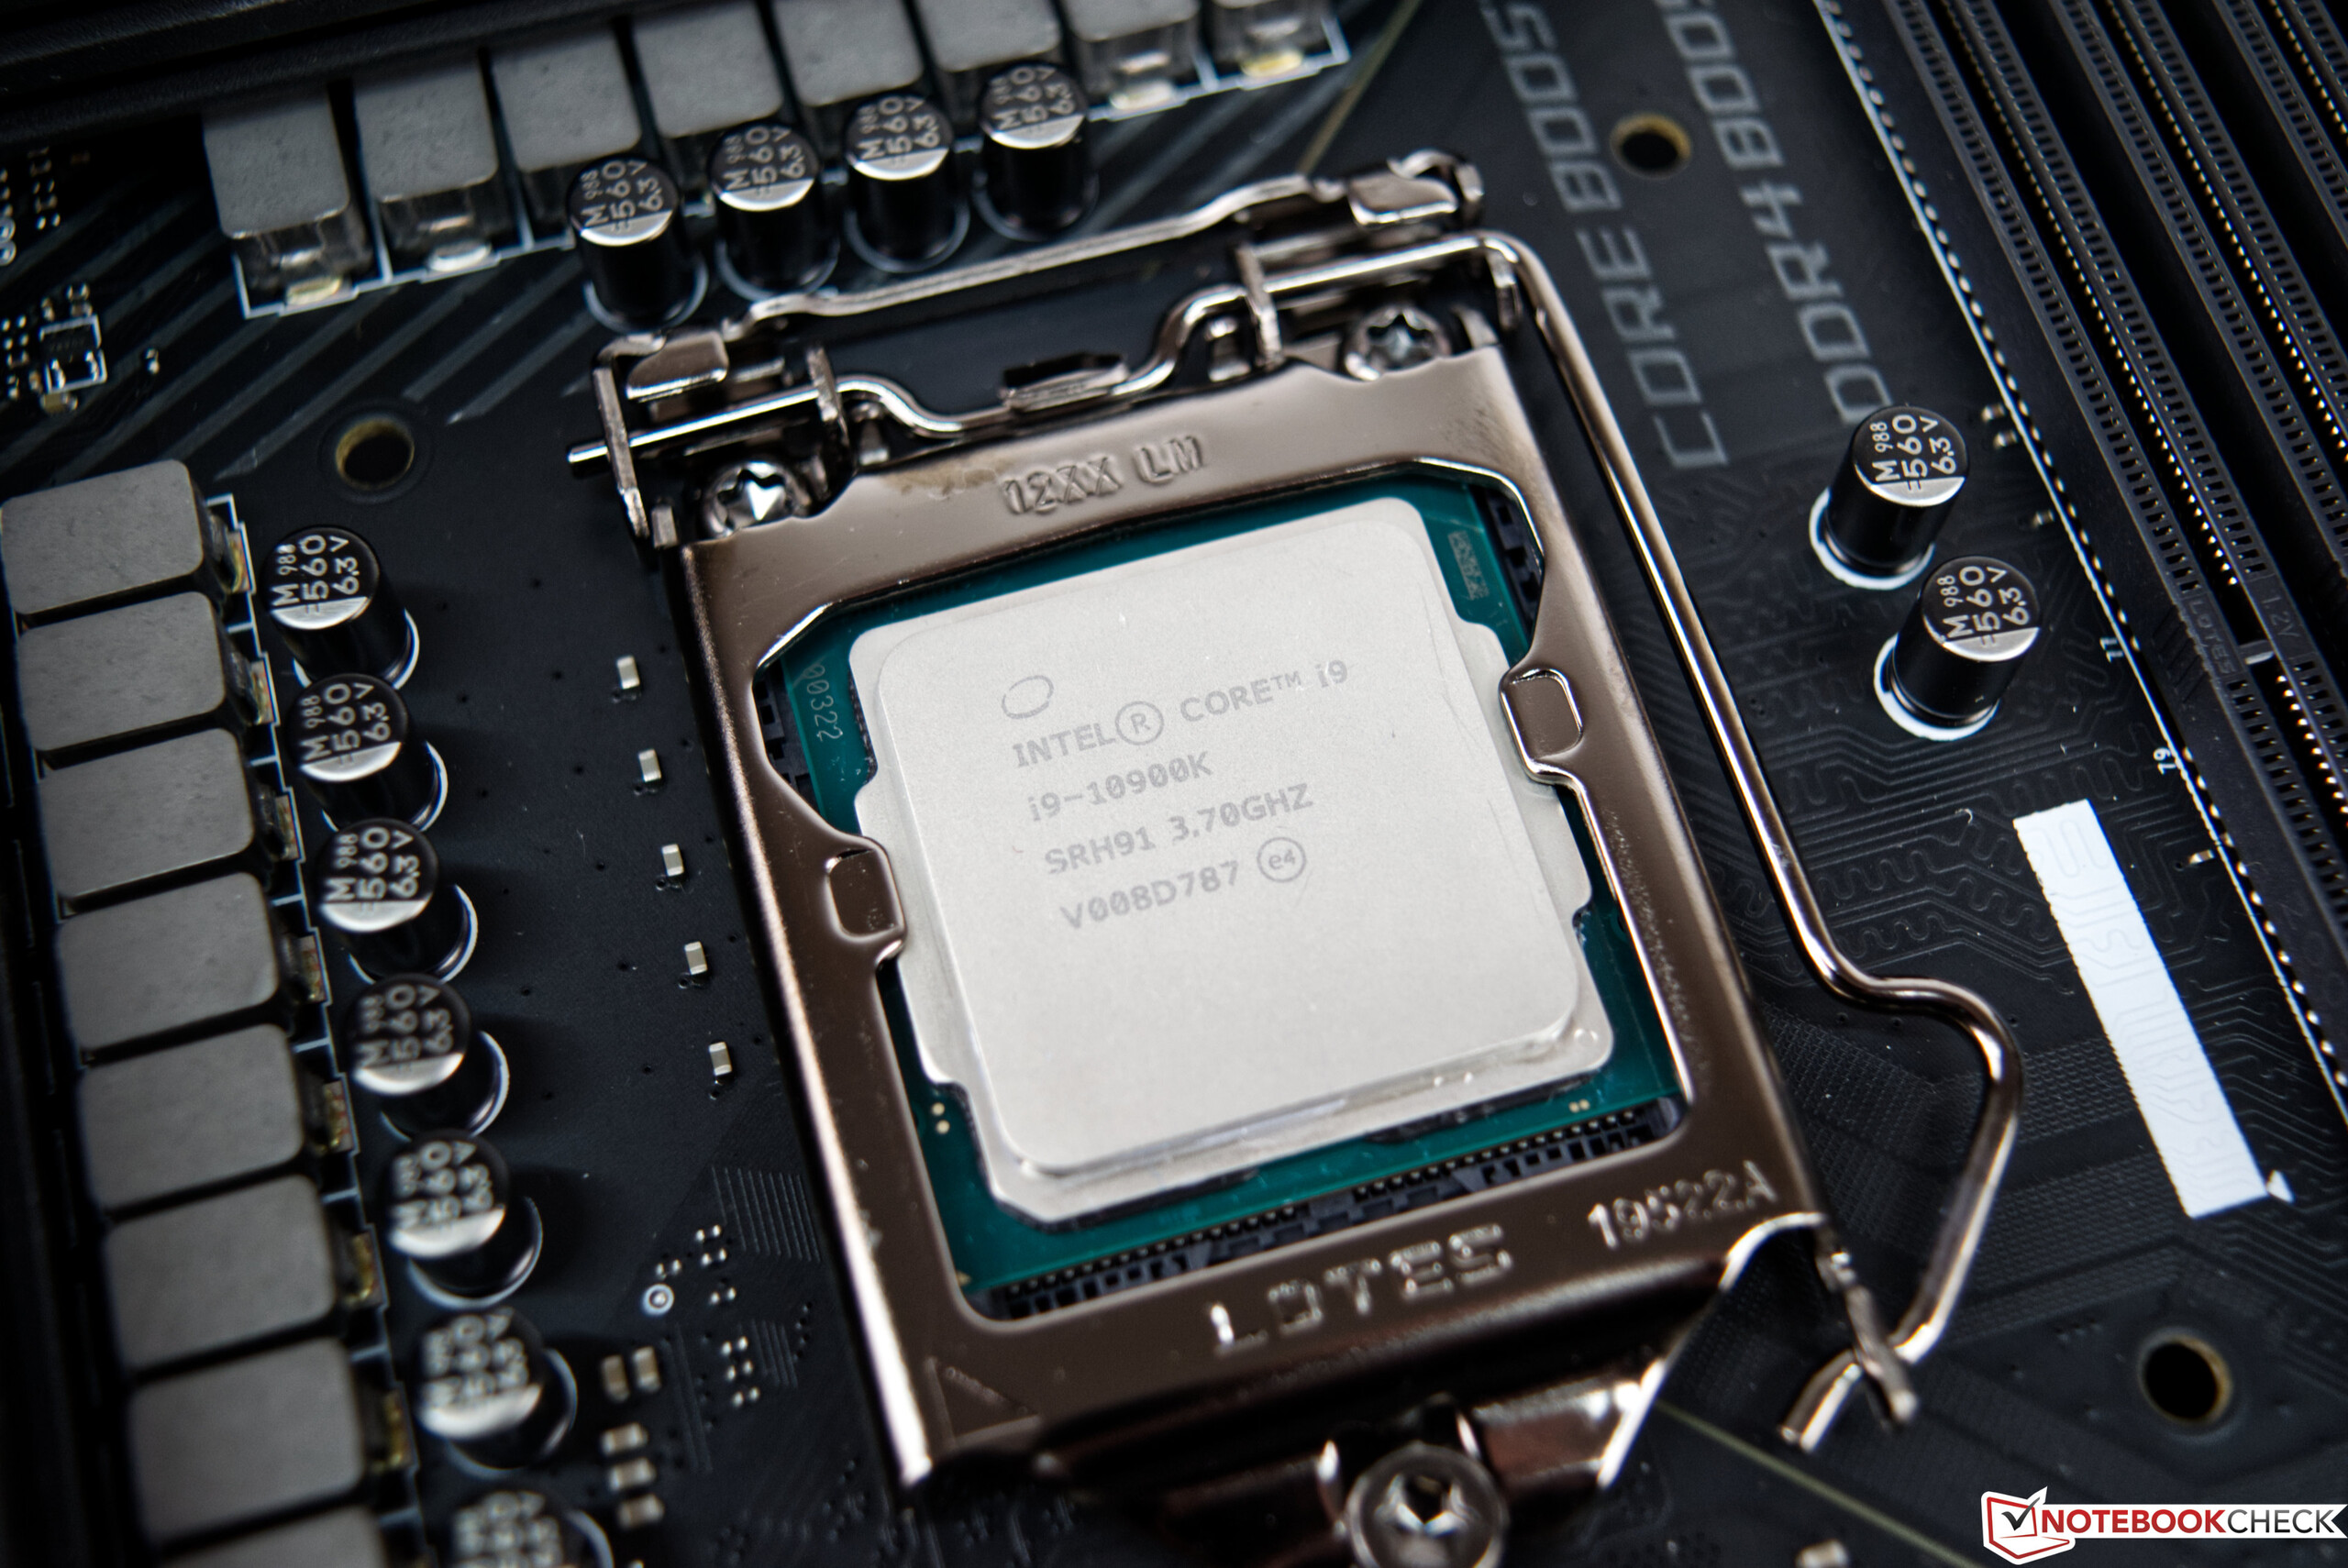
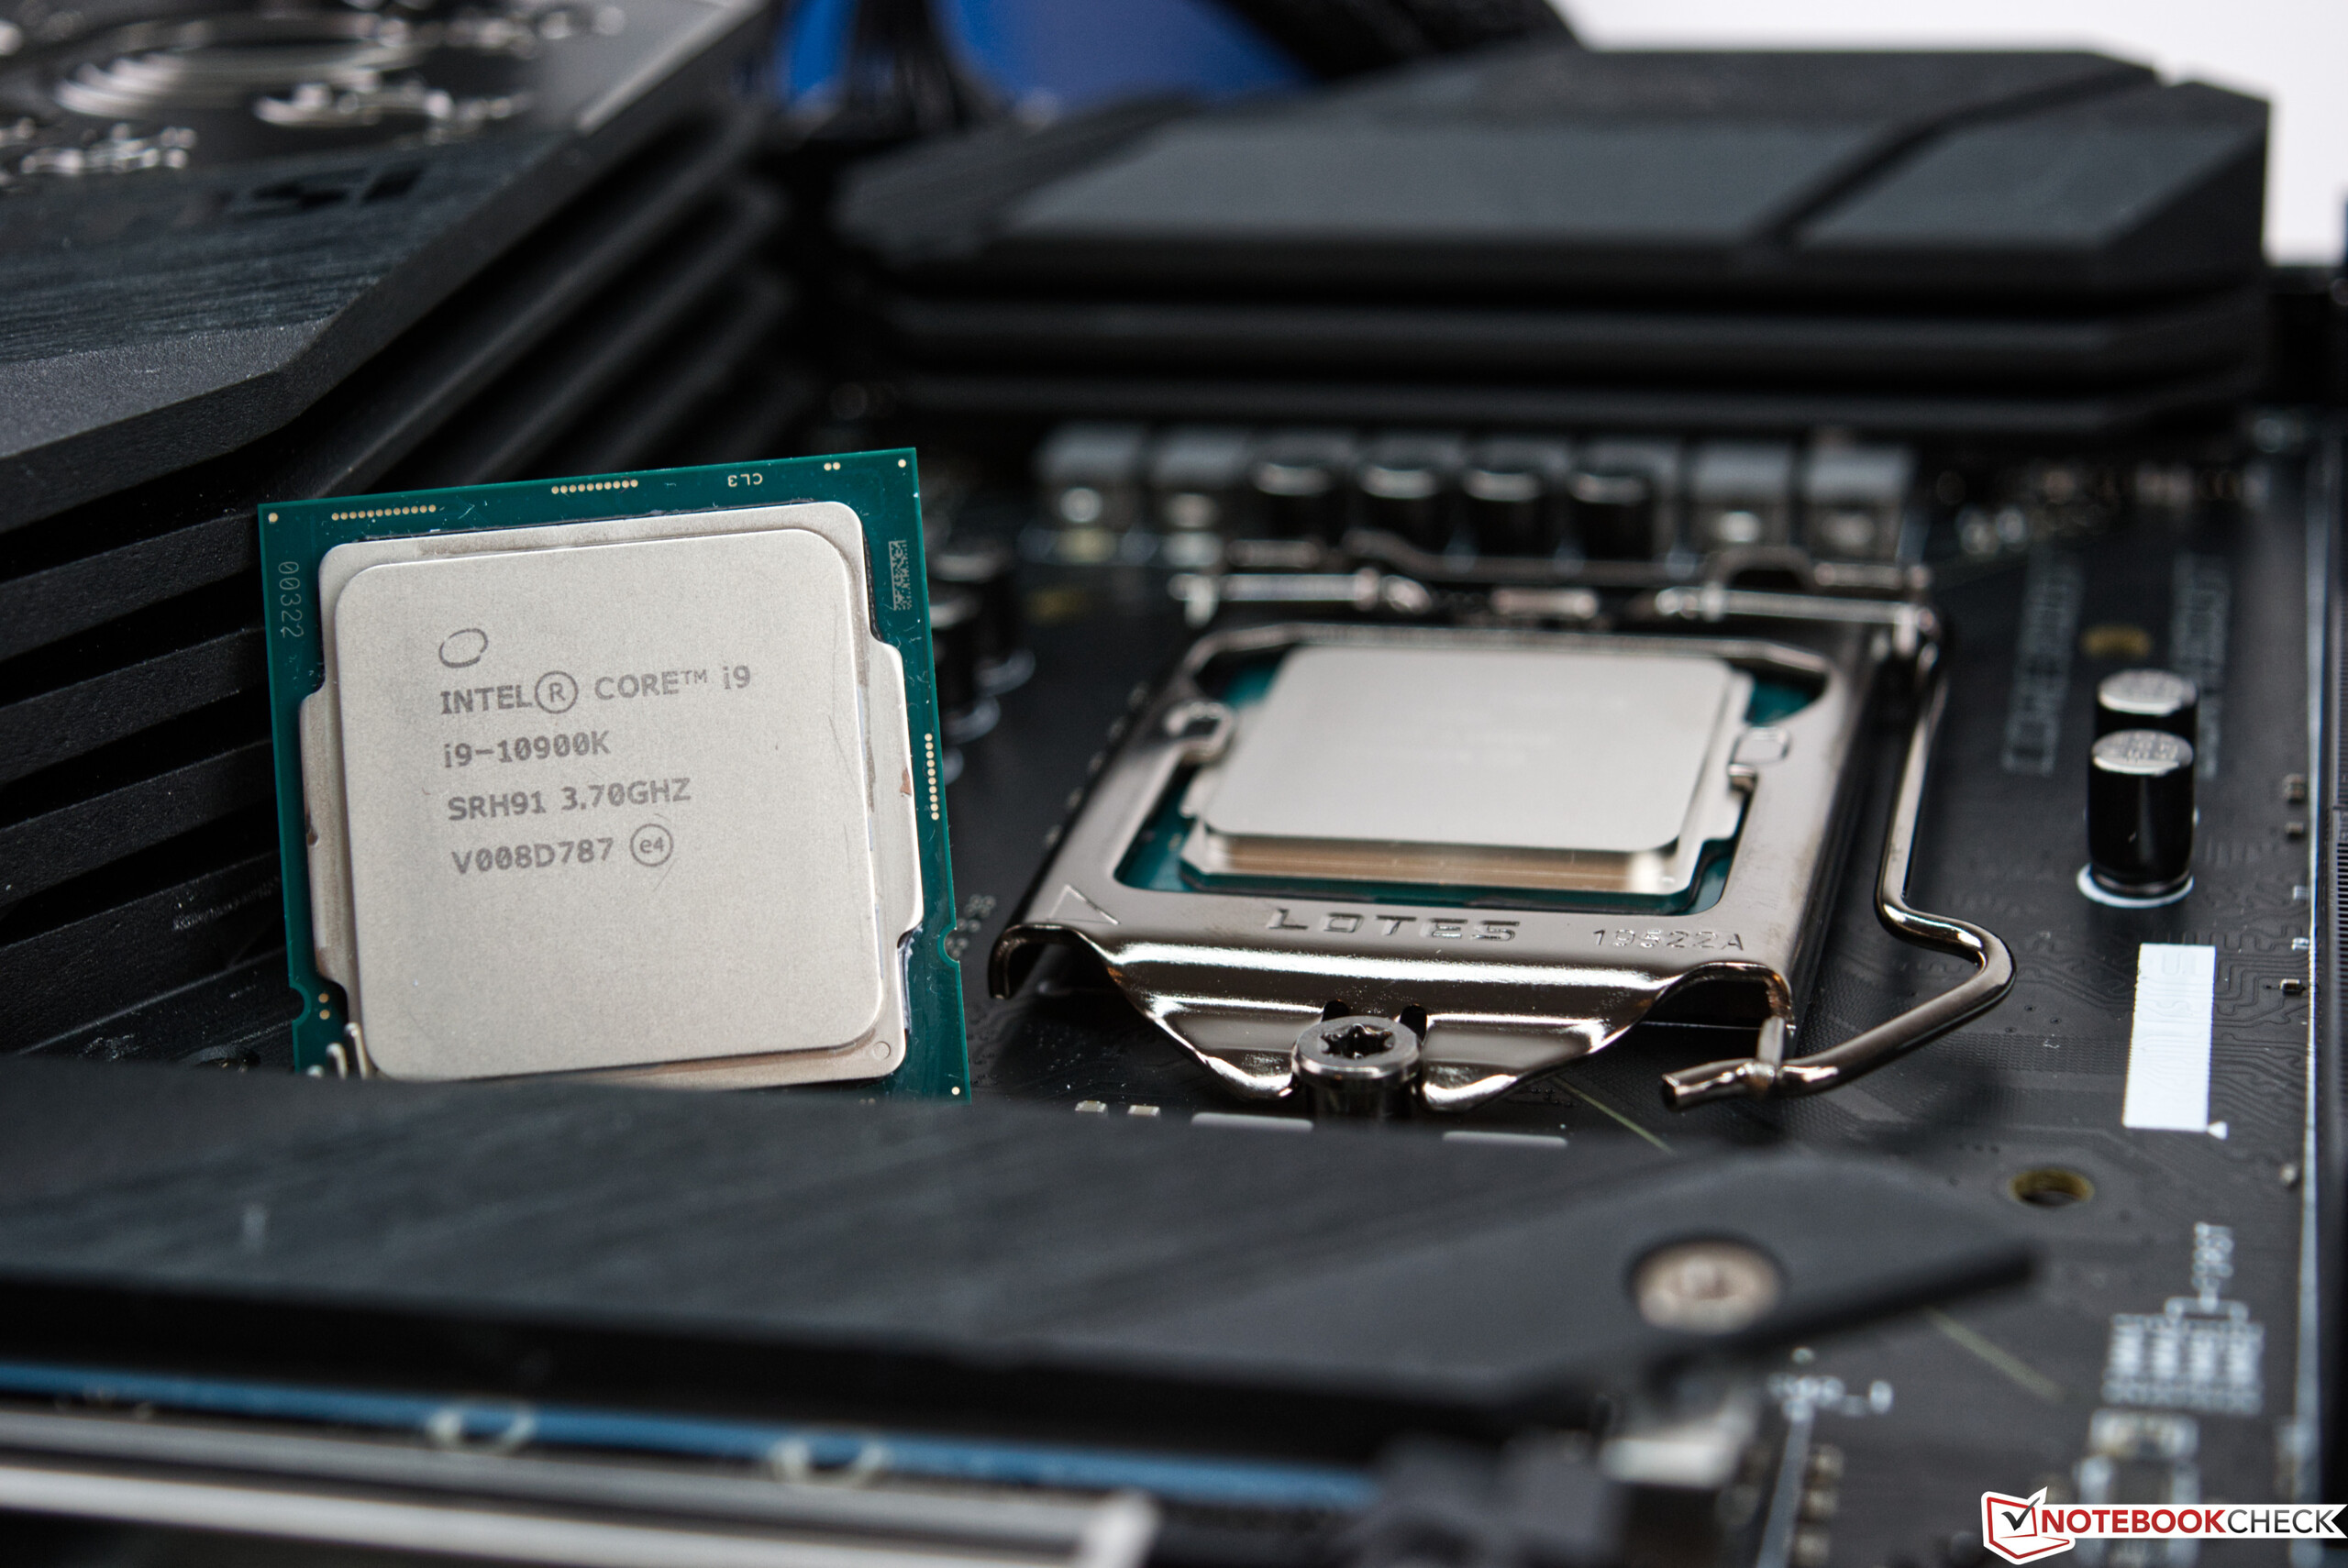
Intel ha sabbiato la die per ottenere migliori prestazioni termiche. Questo significa anche che il dissipatore di calore integrato è ora un po' più spesso perché il processore ha ancora le stesse dimensioni. Per questo motivo tutti i sùraffreddatori compatibili con il socket LGA 1151 sono compatibili anche con il nuovo socket. Intel ha detto che un nuovo socket era necessario a causa dei requisiti di potenza più elevati. Detto questo, i nuovi chipset (Z490, H470, B460, H410) non supportano il PCI Express 4.0 se utilizzati con i nuovi processori.
Panoramica dei principali componenti Comet Lake-S
| Modello | Cores / Threads |
Clock Base | Turbo 2.0 | Turbo 3.0 | TVB 1C/xC | All-core boost clock | Memoria | Graphics | TDP | Prezzo di lancio |
|---|---|---|---|---|---|---|---|---|---|---|
| Core i9-10900K | 10/20 | 3.7 GHz | 5.1 GHz | 5.2 GHz | 5.3 / 4.9 GHz | 4.8 GHz | DDR4-2933 | UHD 630 | 125 watts | 488 Dollari |
| Core i9-10900KF | 10/20 | 3.7 GHz | 5.1 GHz | 5.2 GHz | 5.3 / 4.9 GHz | 4.8 GHz | DDR4-2933 | - | 125 watts | 472 dollars |
| Core i9-10900 | 10/20 | 2.8 GHz | 5.0 GHz | 5.1 GHz | 5.2 / 4.6 GHz | 4.5 GHz | DDR4-2933 | UHD 630 | 65 watts | 439 Dollari |
| Core i9-10900F | 10/20 | 2.8 GHz | 5.0 GHz | 5.1 GHz | 5.2 / 4.6 GHz | 4.5 GHz | DDR4-2933 | - | 65 watts | 422 Dollari |
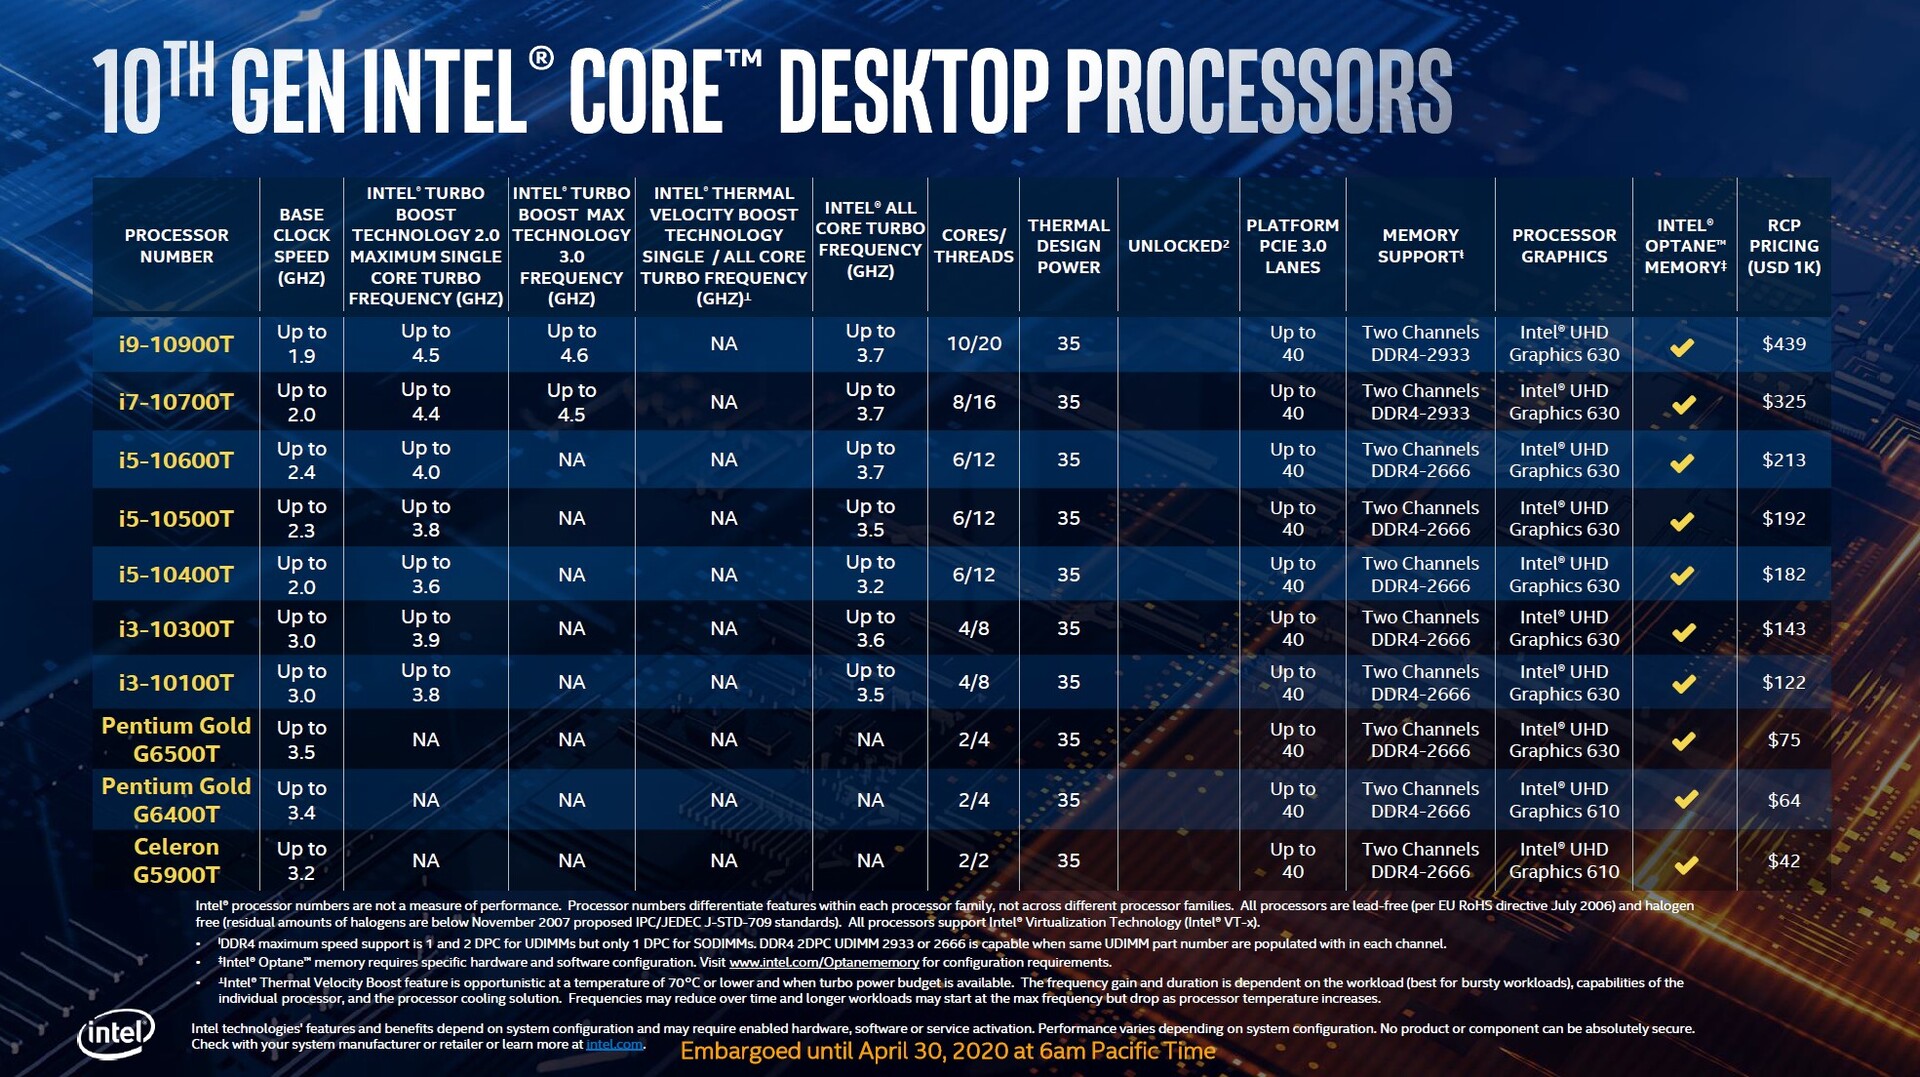
| Core i9-10900T | 10/20 | 1.9 GHz | 4.5 GHz | 4.6 GHz | - | 3.7 GHz | DDR4-2933 | UHD 630 | 35 watts | 439 Dollari |
| Core i7-10700K | 8/16 | 3.8 GHz | 5.0 GHz | 5.1 GHz | - | 4.7 GHz | DDR4-2933 | UHD 630 | 125 watts | 374 Dollari |
| Core i7-10700KF | 8/16 | 3.8 GHz | 5.0 GHz | 5.1 GHz | - | 4.7 GHz | DDR4-2933 | - | 125 watts | 349 Dollari |
| Core i7-10700 | 8/16 | 2.9 GHz | 4.7 GHz | 4.8 GHz | - | 4.6 GHz | DDR4-2933 | UHD 630 | 65 watts | 323 Dollari |
| Core i7-10700F | 8/16 | 2.9 GHz | 4.7 GHz | 4.8 GHz | - | 4.6 GHz | DDR4-2933 | - | 65 watts | 298 Dollari |
| Core i7-10700T | 8/16 | 2.0 GHz | 4.4 GHz | 4.5 GHz | - | 3.7 GHz | DDR4-2933 | UHD 630 | 35 watts | 325 Dollari |
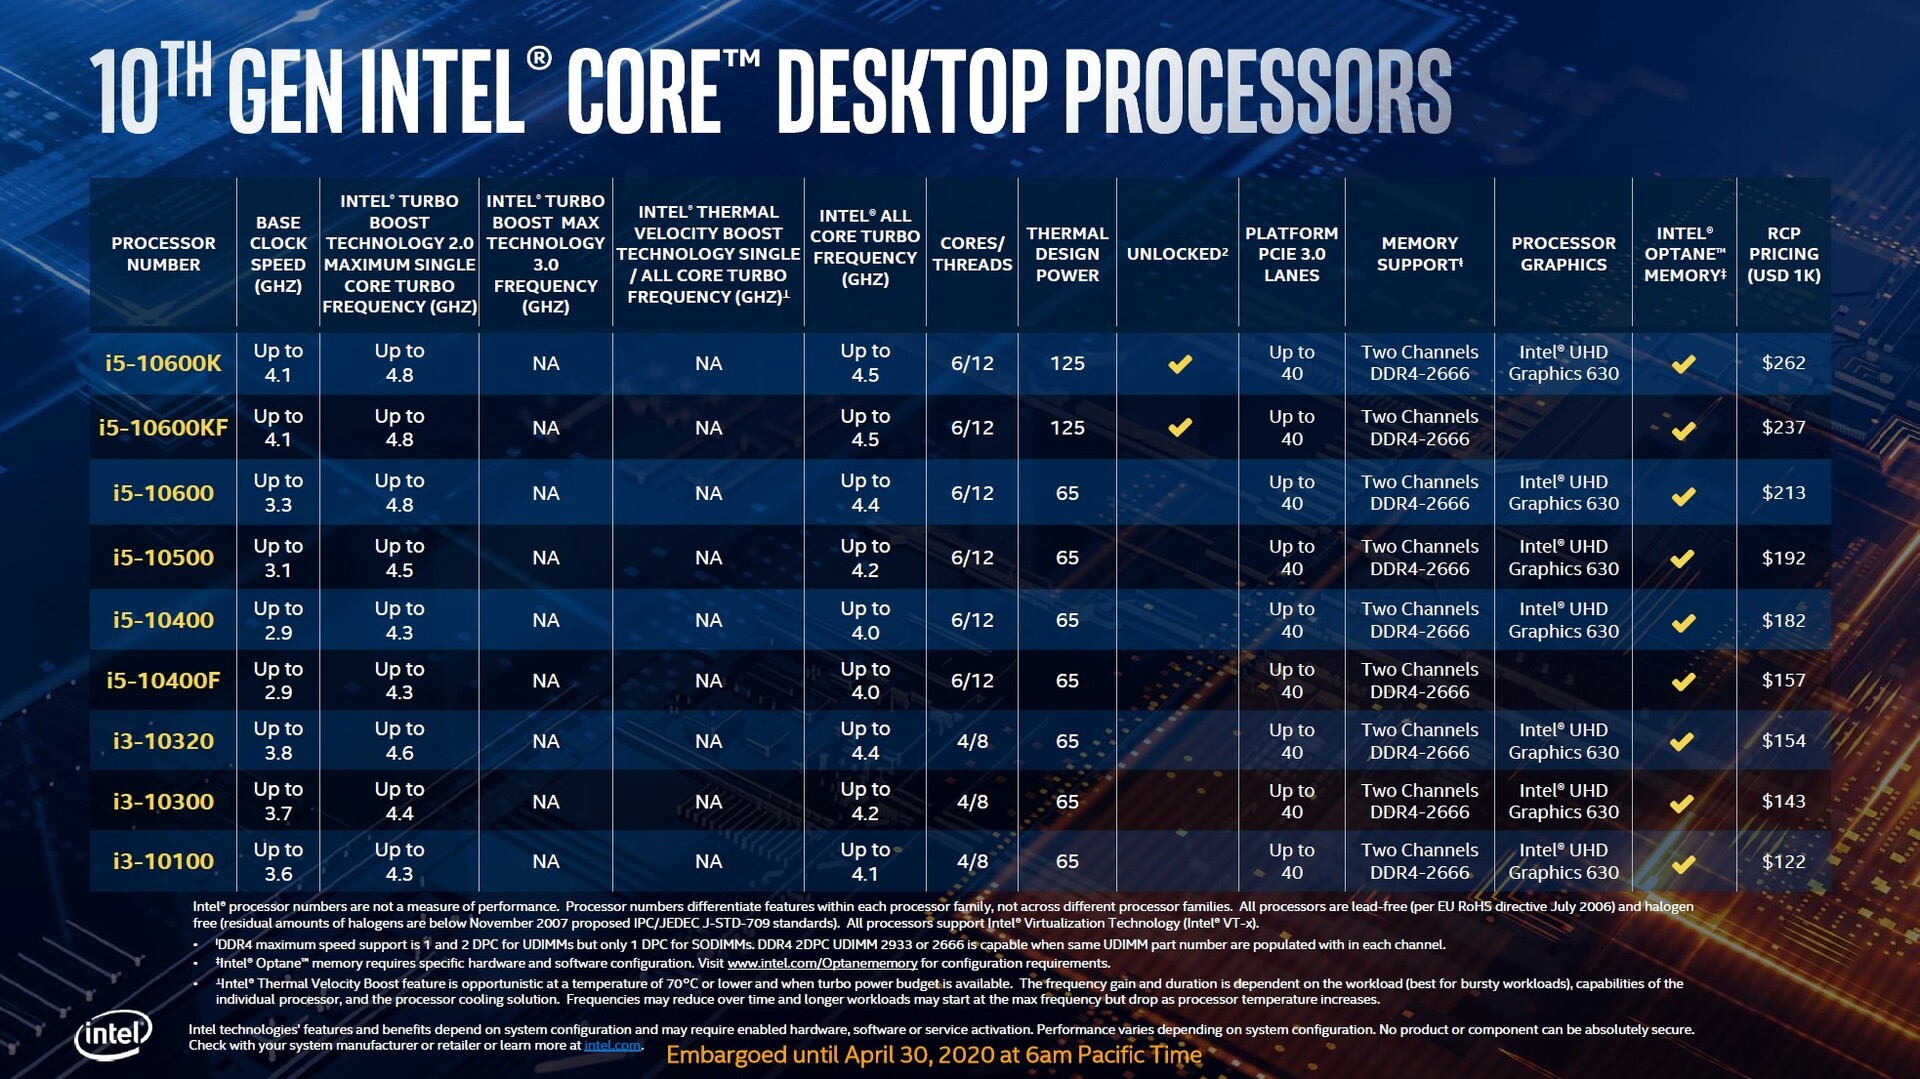
| Core i5-10600K | 6/12 | 4.1 GHz | 4.8 GHz | - | - | 4.5 GHz | DDR4-2666 | UHD 630 | 125 watts | 262 dollars |
| Core i5-10600KF | 6/12 | 4.1 GHz | 4.8 GHz | - | - | 4.5 GHz | DDR4-2666 | - | 125 watts | 237 Dollari |
| Core i5-10600 | 6/12 | 3.3 GHz | 4.8 GHz | - | - | 4.4 GHz | DDR4-2666 | UHD 630 | 65 watts | 213 Dollari |
| Core i5-10600T | 6/12 | 2.4 GHz | 4.0 GHz | - | - | 3.7 GHz | DDR4-2666 | UHD 630 | 35 watts | 213 Dollari |
| Core i5-10500 | 6/12 | 3.1 GHz | 4.5 GHz | - | - | 4.2 GHz | DDR4-2666 | UHD 630 | 65 watts | 192 Dollari |
| Core i5-10500T | 6/12 | 2.3 GHz | 3.8 GHz | - | - | 3.5 GHz | DDR4-2666 | UHD 630 | 35 watts | 192 Dollari |
| Core i5-10400 | 6/12 | 2.9 GHz | 4.3 GHz | - | - | 4.0 GHz | DDR4-2666 | UHD 630 | 65 watts | 182 Dollari |
| Core i5-10400F | 6/12 | 2.9 GHz | 4.3 GHz | - | - | 4.0 GHz | DDR4-2666 | - | 65 watts | 157 Dollari |
| Core i5-10400T | 6/12 | 2.0 GHz | 3.6 GHz | - | - | 3.2 GHz | DDR4-2666 | UHD 630 | 35 watts | 182 Dollari |
| Core i3-10320 | 4/8 | 3.8 GHz | 4.4 GHz | - | - | 4.4 GHz | DDR4-2666 | UHD 630 | 65 watts | 154 dollars |
| Core i3-10300 | 4/8 | 3.7 GHz | 4.4 GHz | - | - | 4.2 GHz | DDR4-2666 | UHD 630 | 65 watts | 143 dollars |
| Core i3-10300T | 4/8 | 3.0 GHz | 3.9 GHz | - | - | 3.6 GHz | DDR4-2666 | UHD 630 | 35 watts | 143 dollars |
| Core i3-10100 | 4/8 | 3.6 GHz | 4.3 GHz | - | - | 4.1 GHz | DDR4-2666 | UHD 630 | 65 watts | 122 dollars |
| Core i3-10100T | 4/8 | 3.0 GHz | 3.8 GHz | - | - | 3.5 GHz | DDR4-2666 | UHD 630 | 35 watts | 122 dollars |
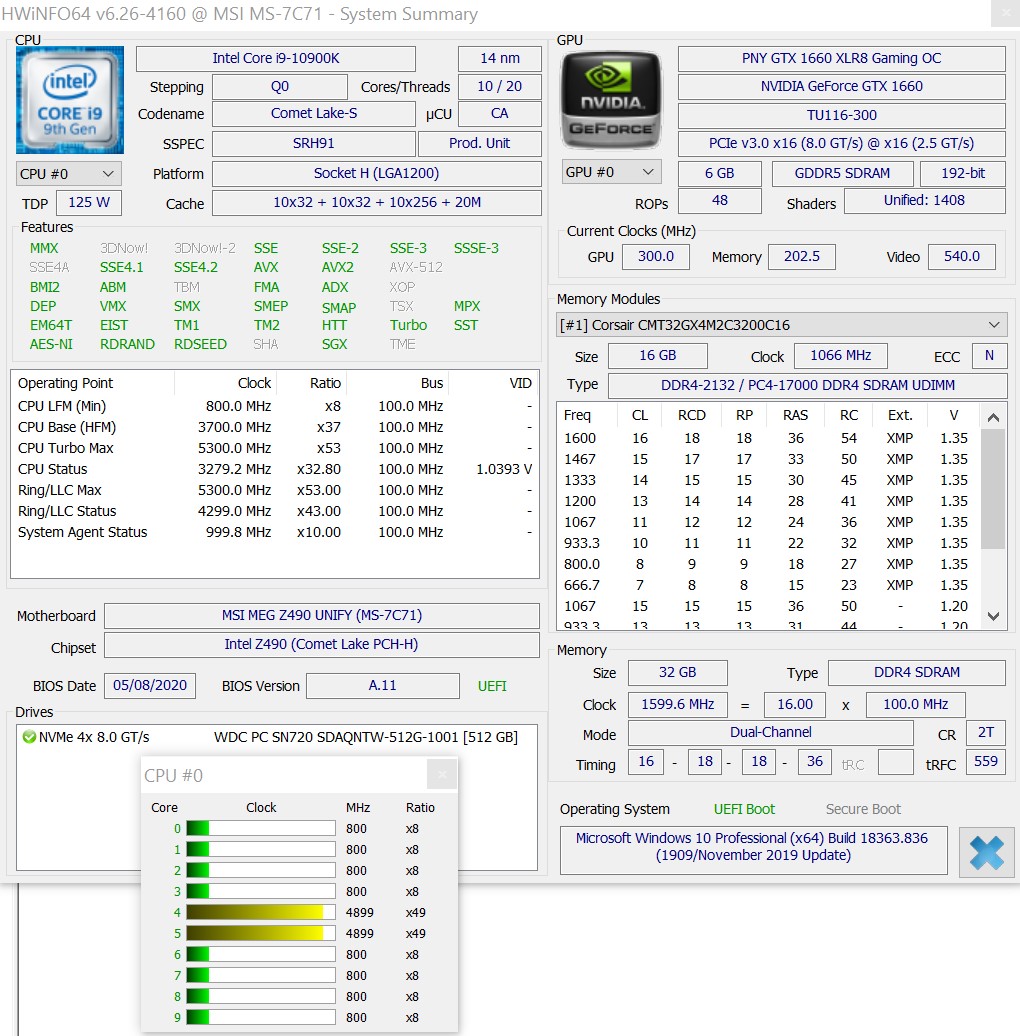
Test Bench
Per i nostri benchmarks abbiamo utilizzato il seguente sistema:
- Raijintek Paean Benchtable
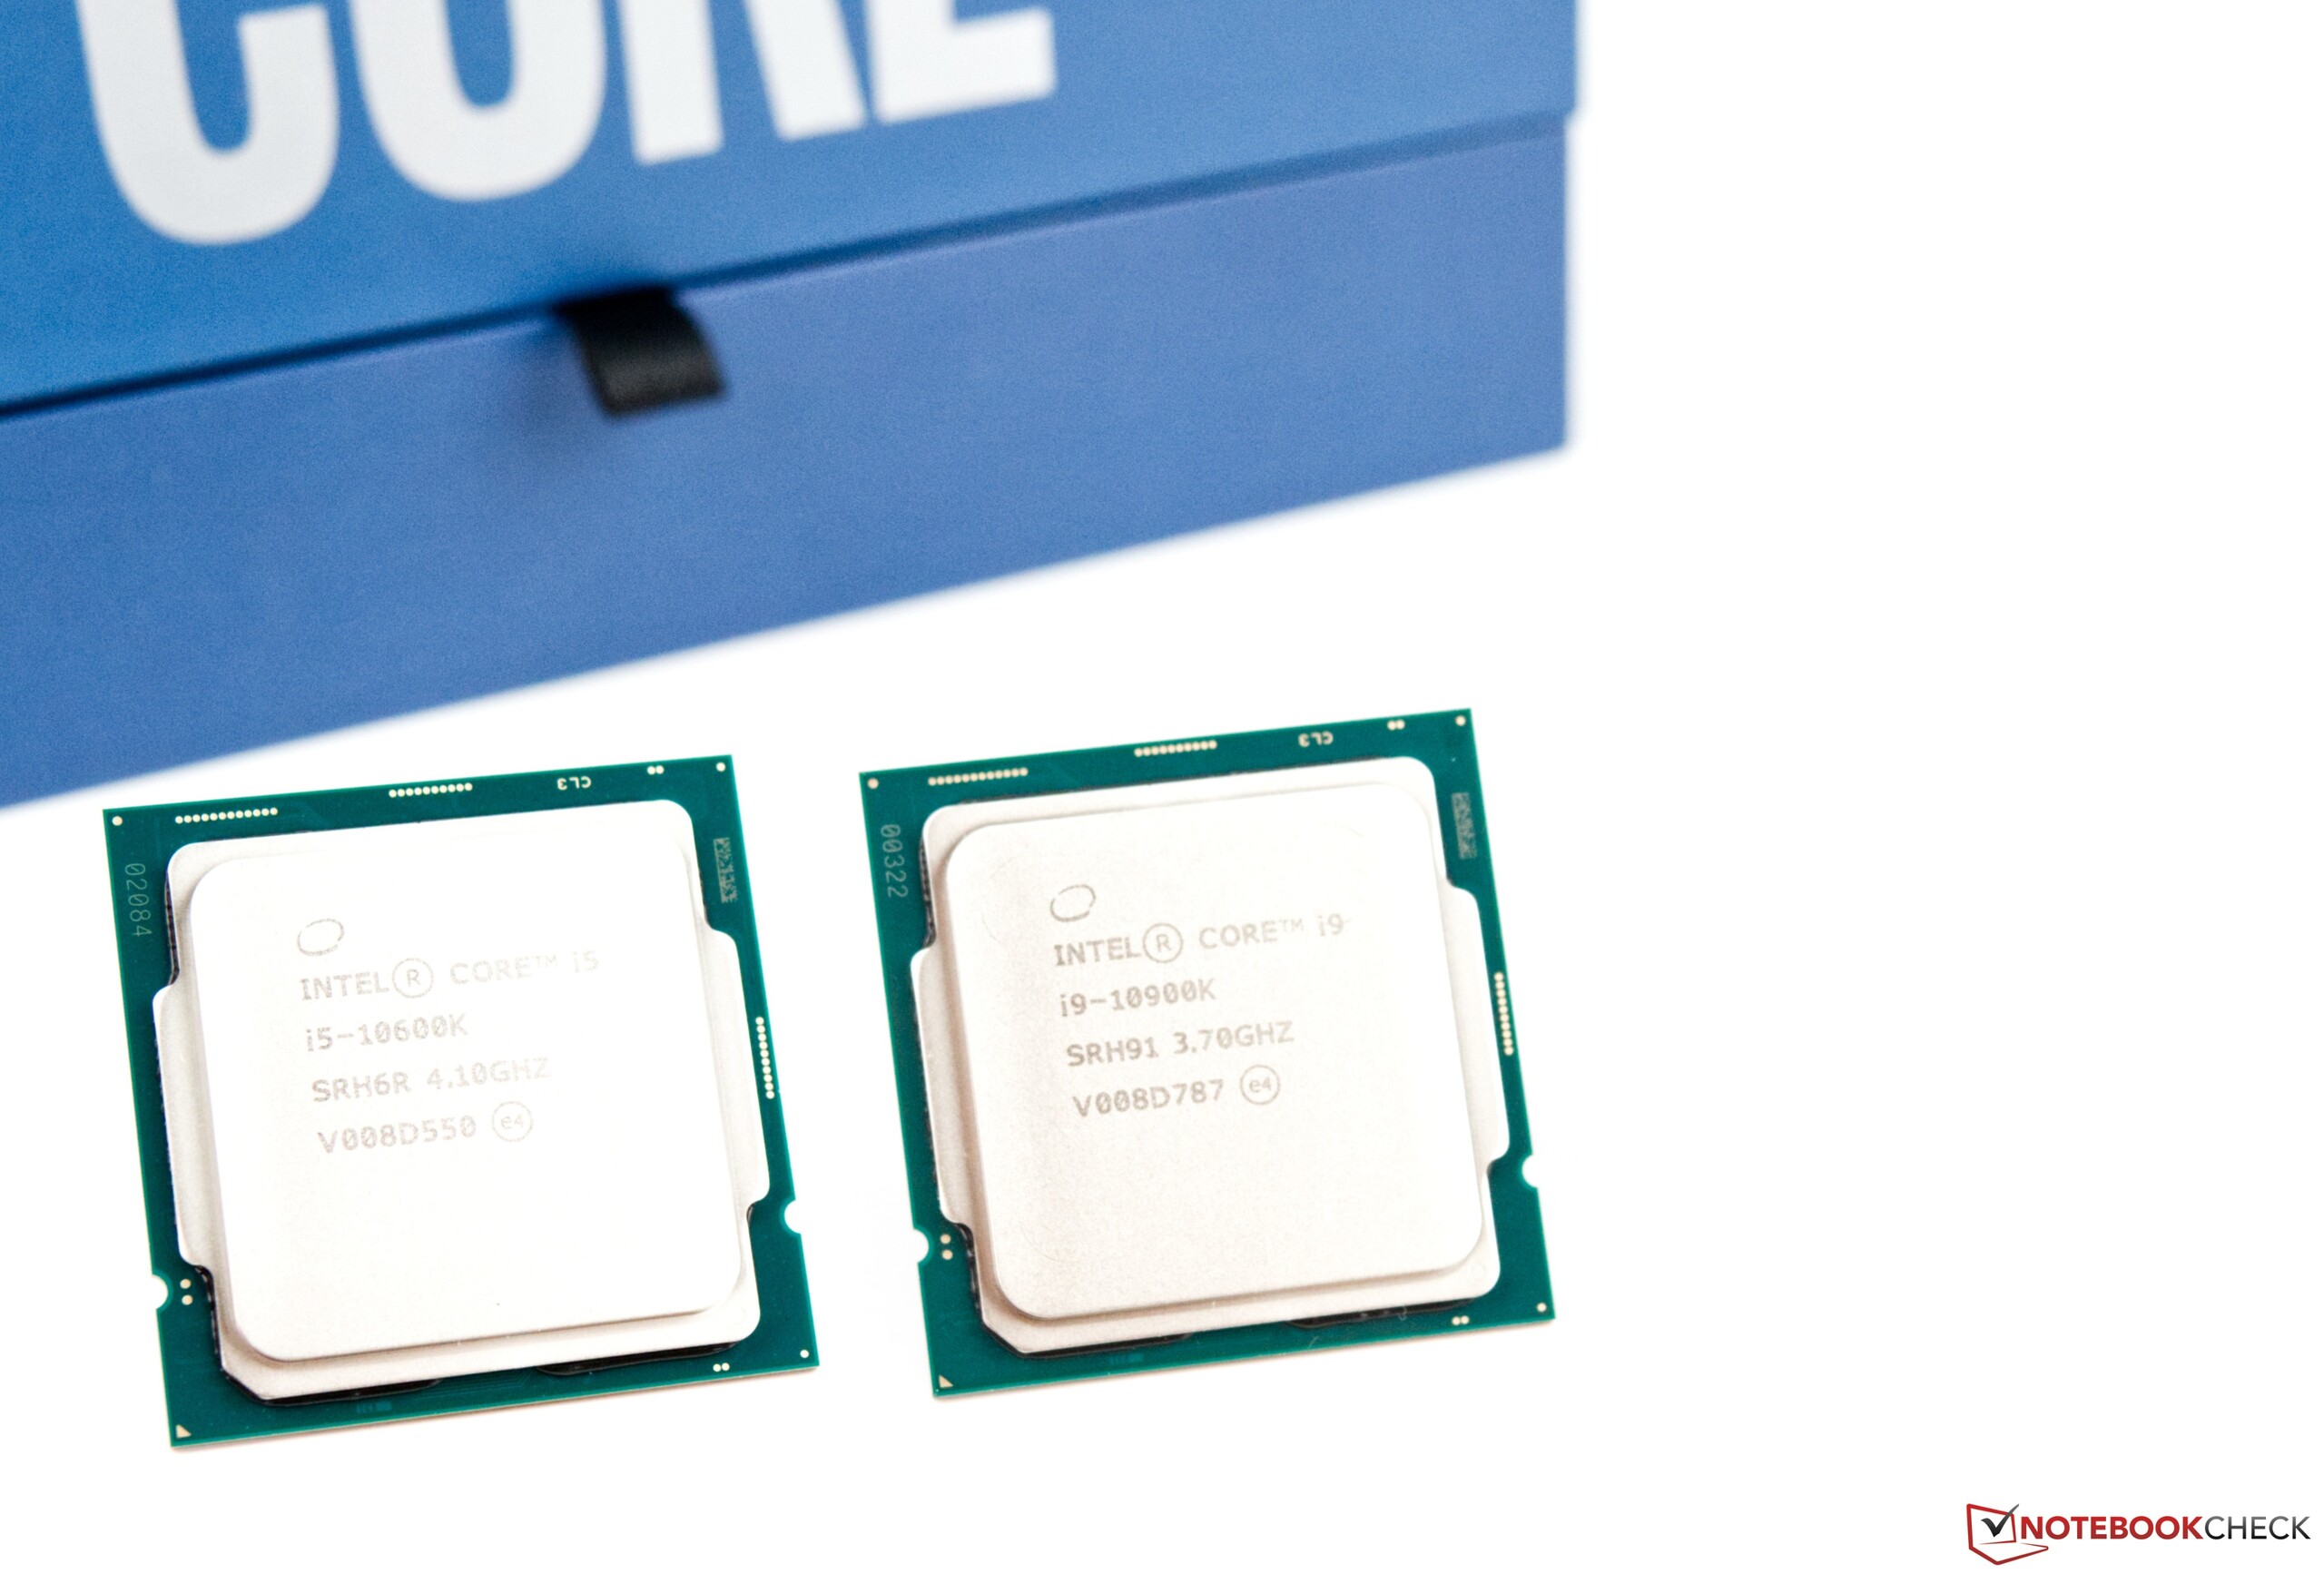
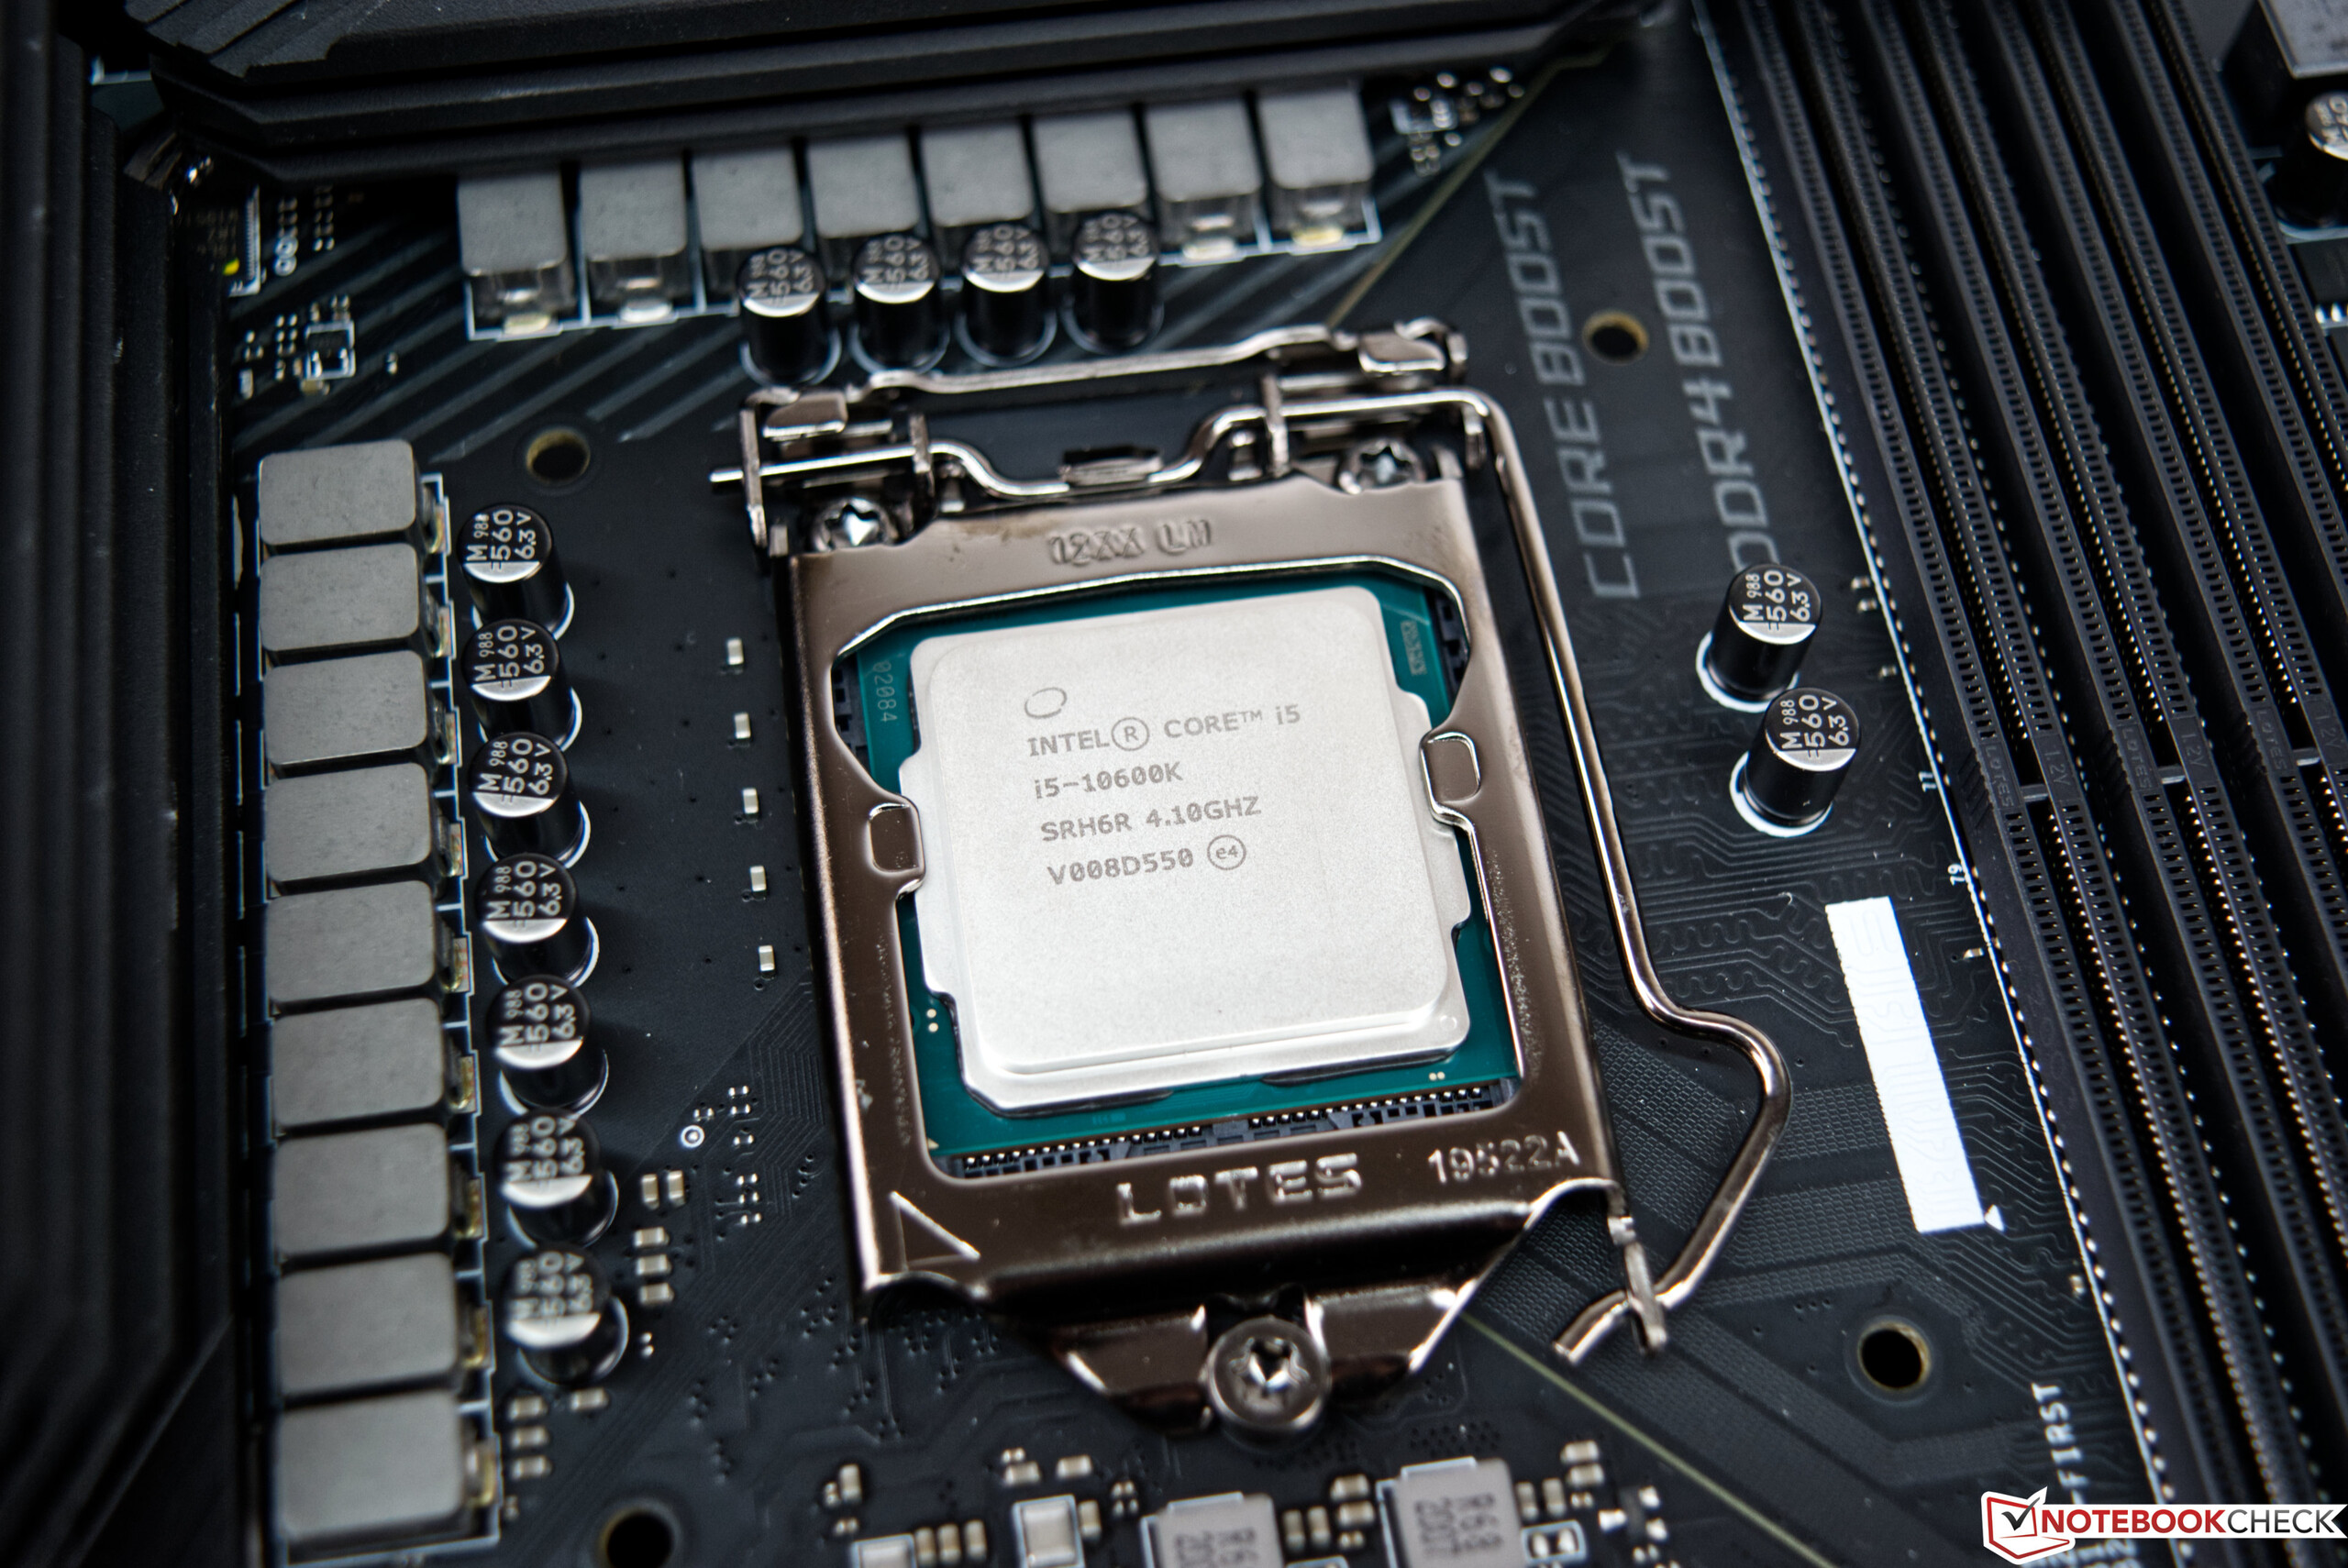
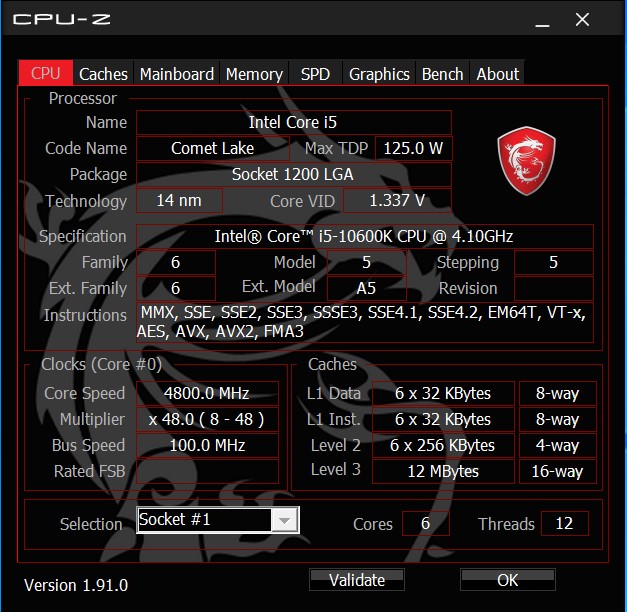
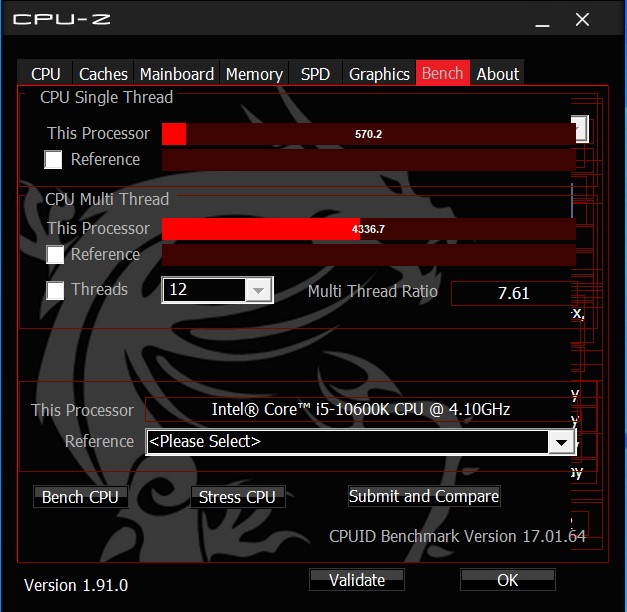
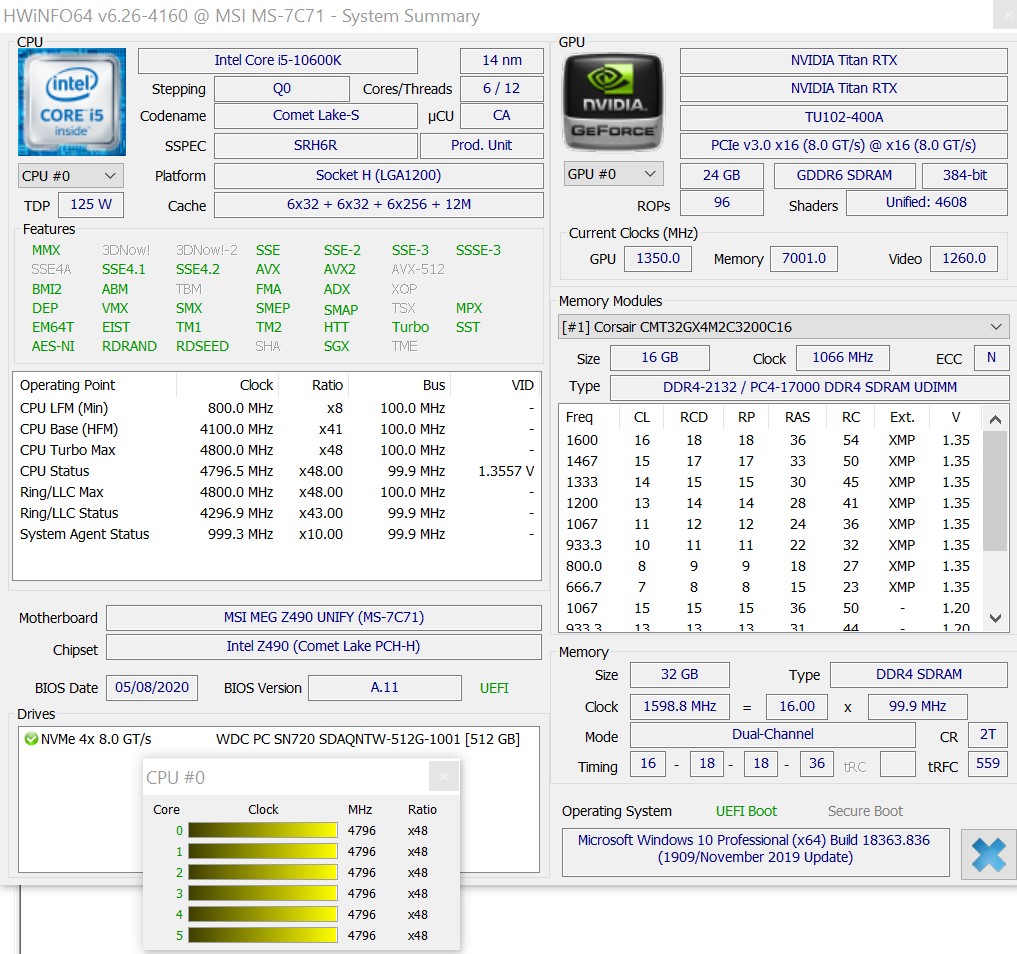
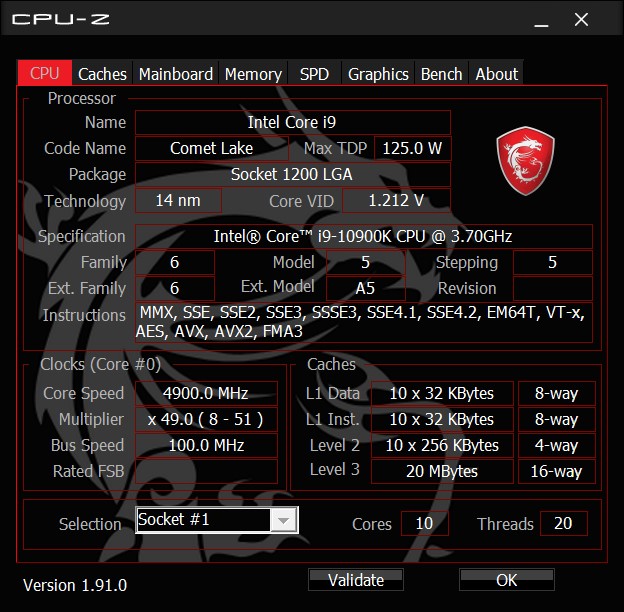
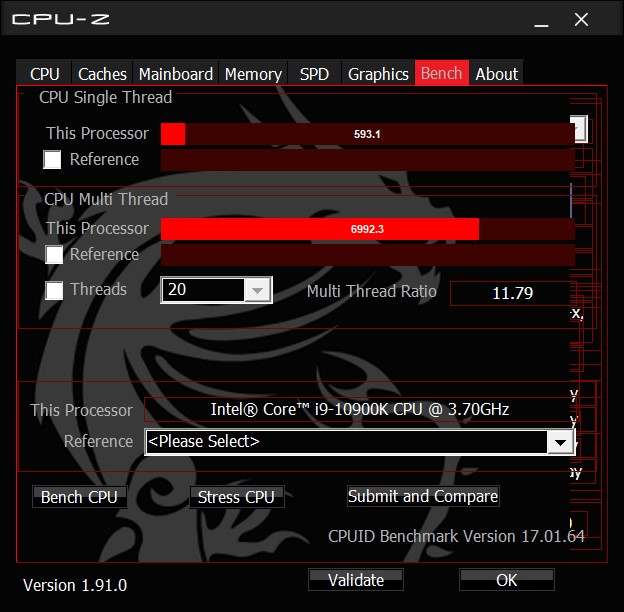
- Intel Core i9-10900K, Intel Core i5-10600K
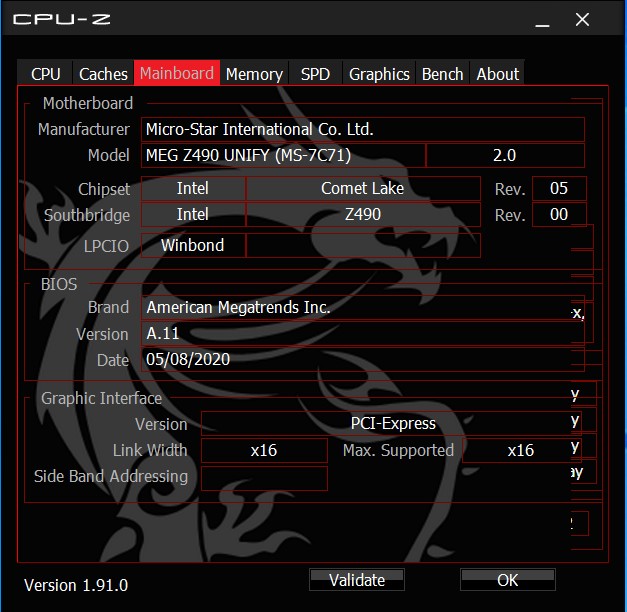
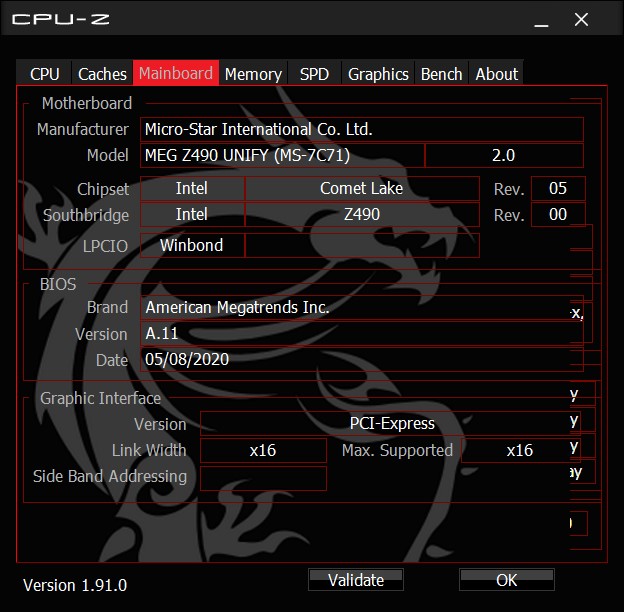
- MSI Z490 Unify
- Alphacool Eisbaer 280 AiO
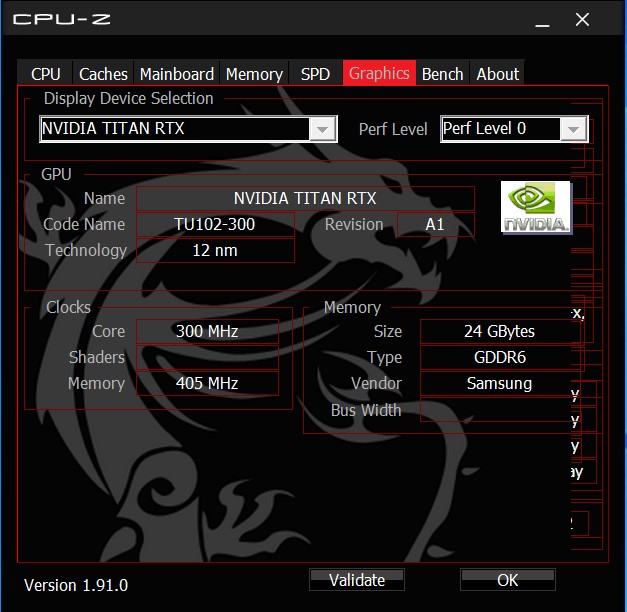
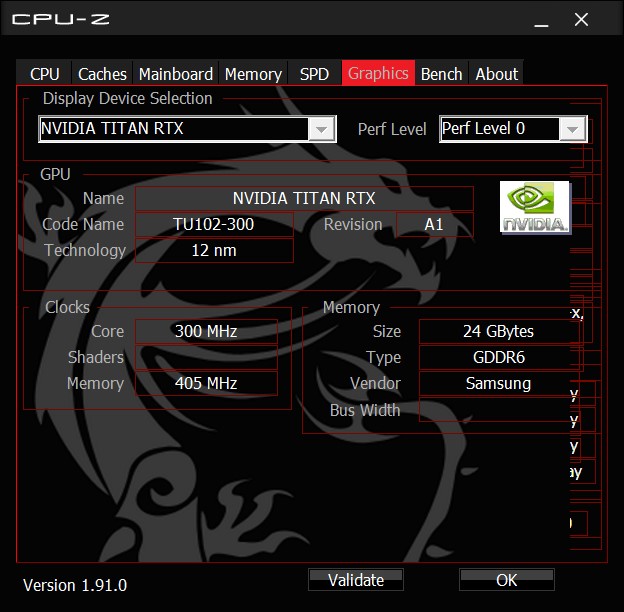
- Nvidia Titan RTX
- Corsair RM 1000X Netzteil
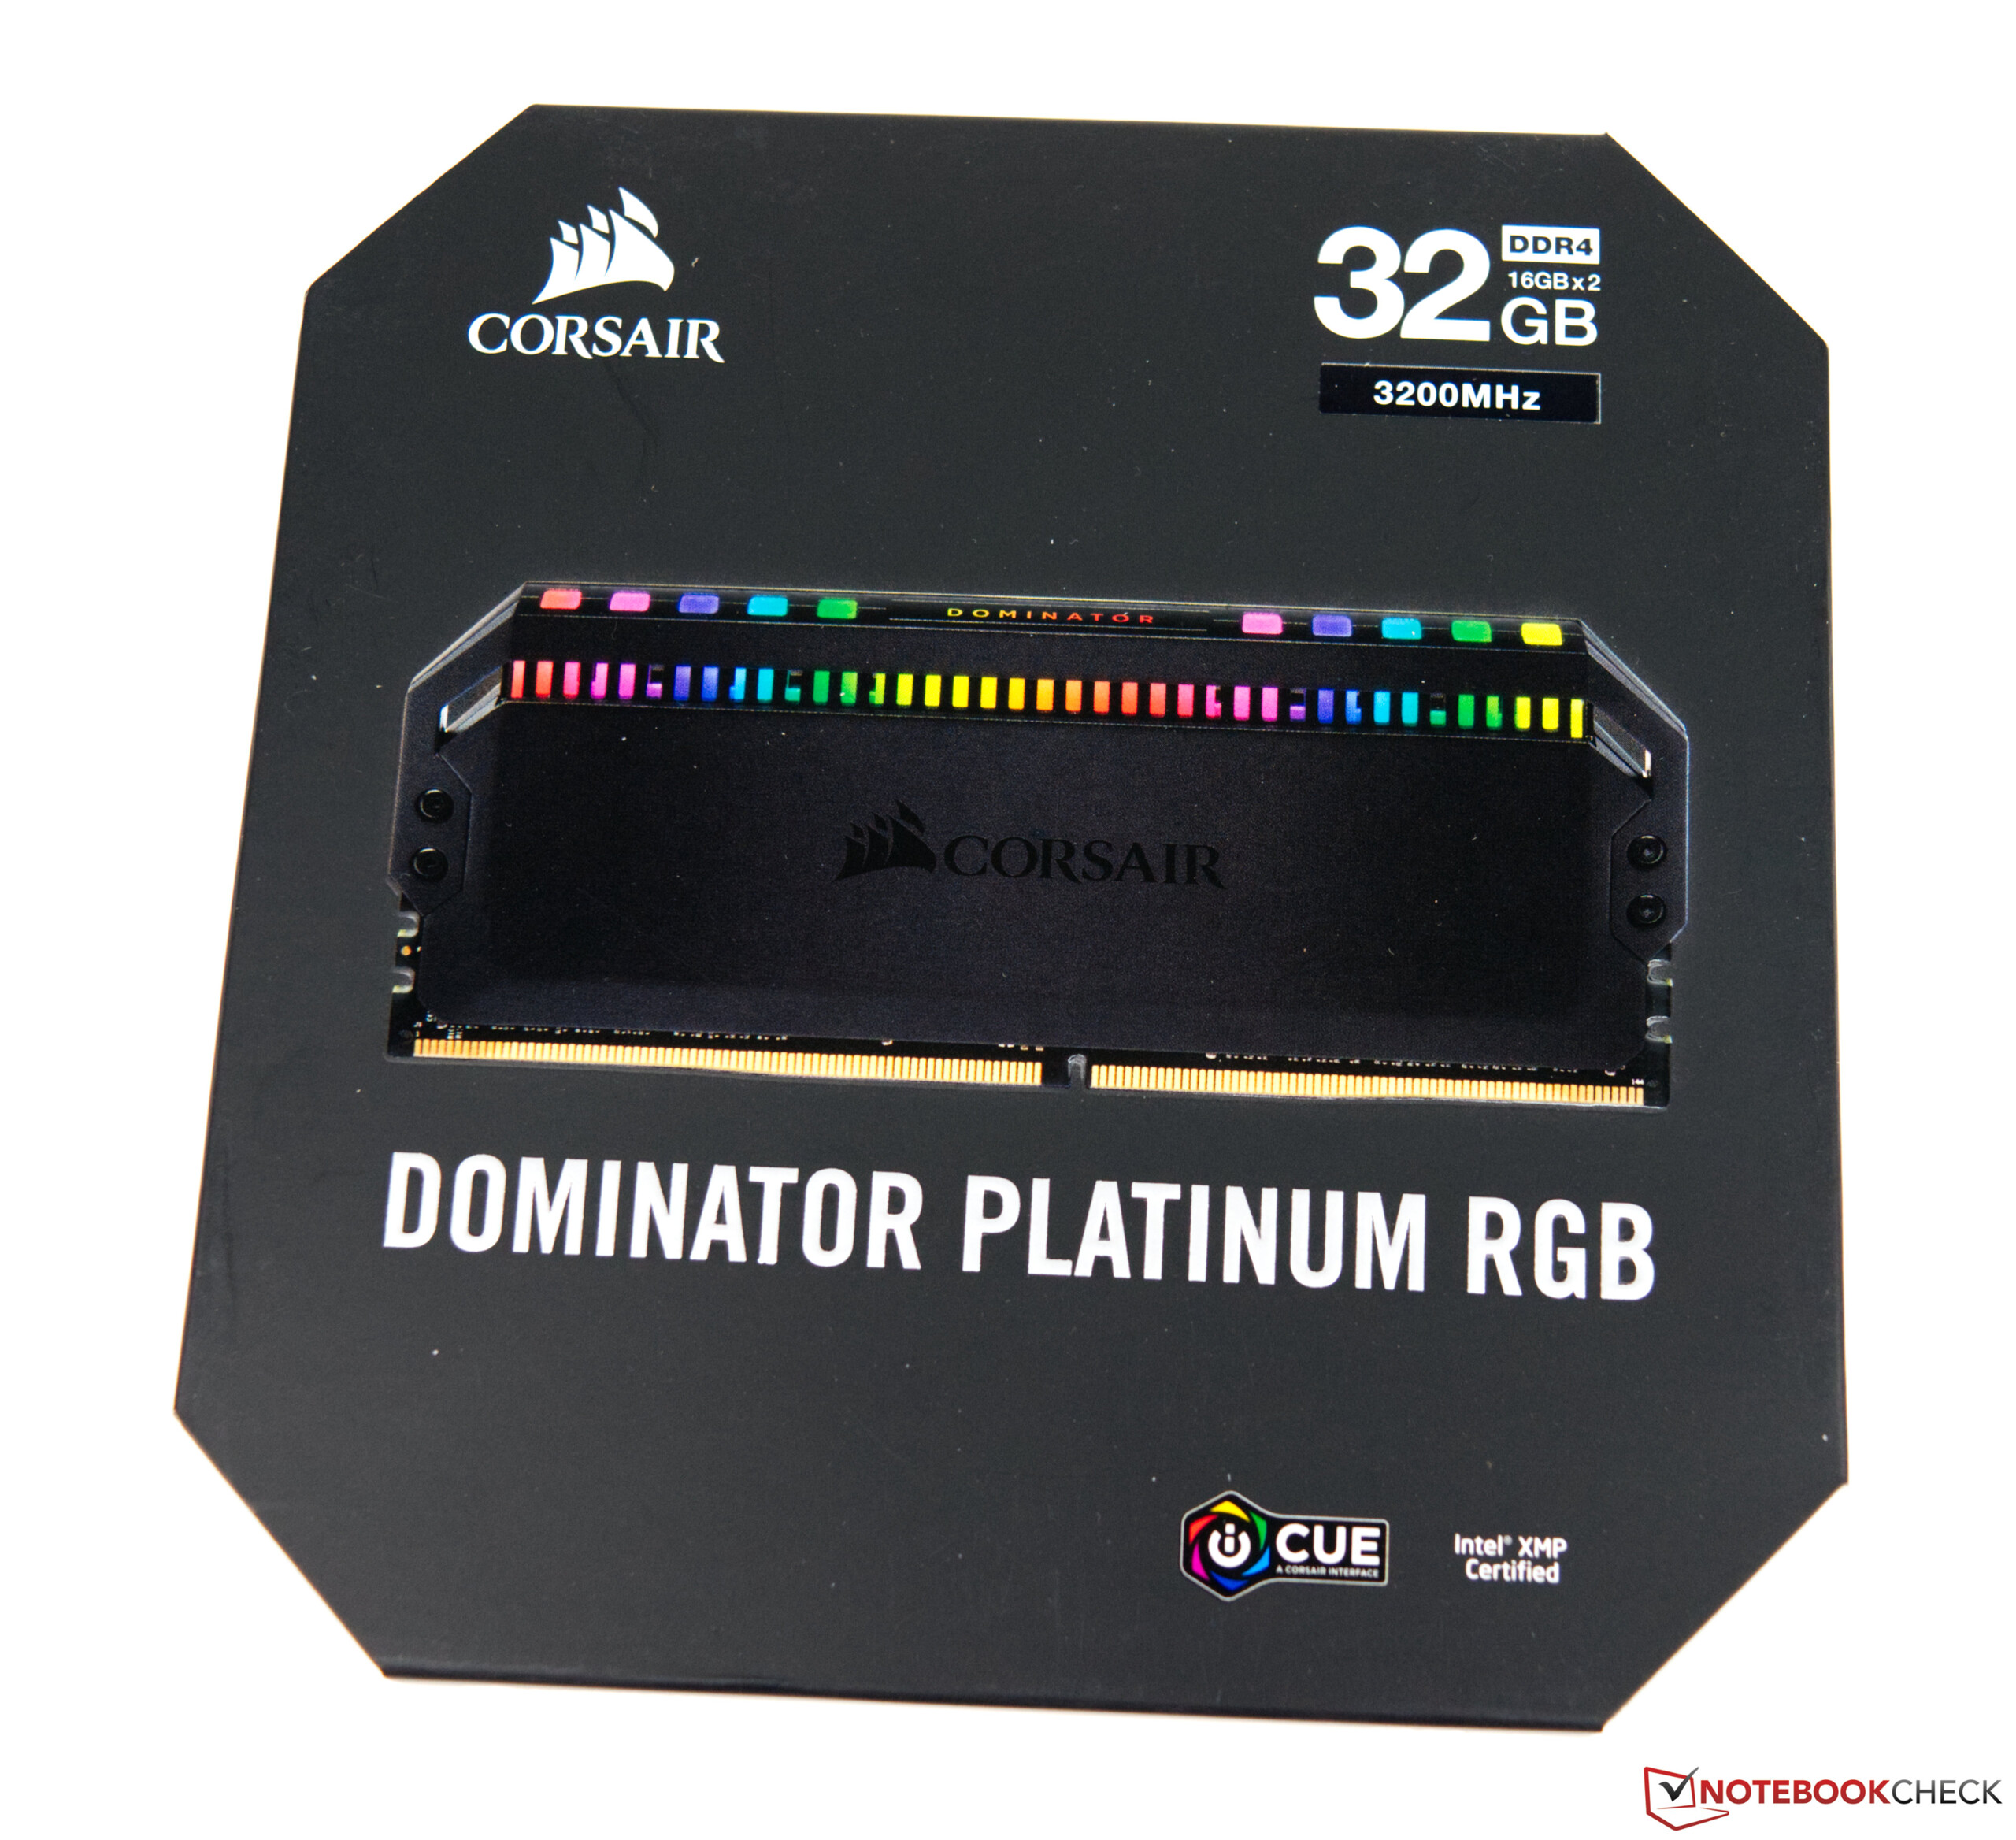
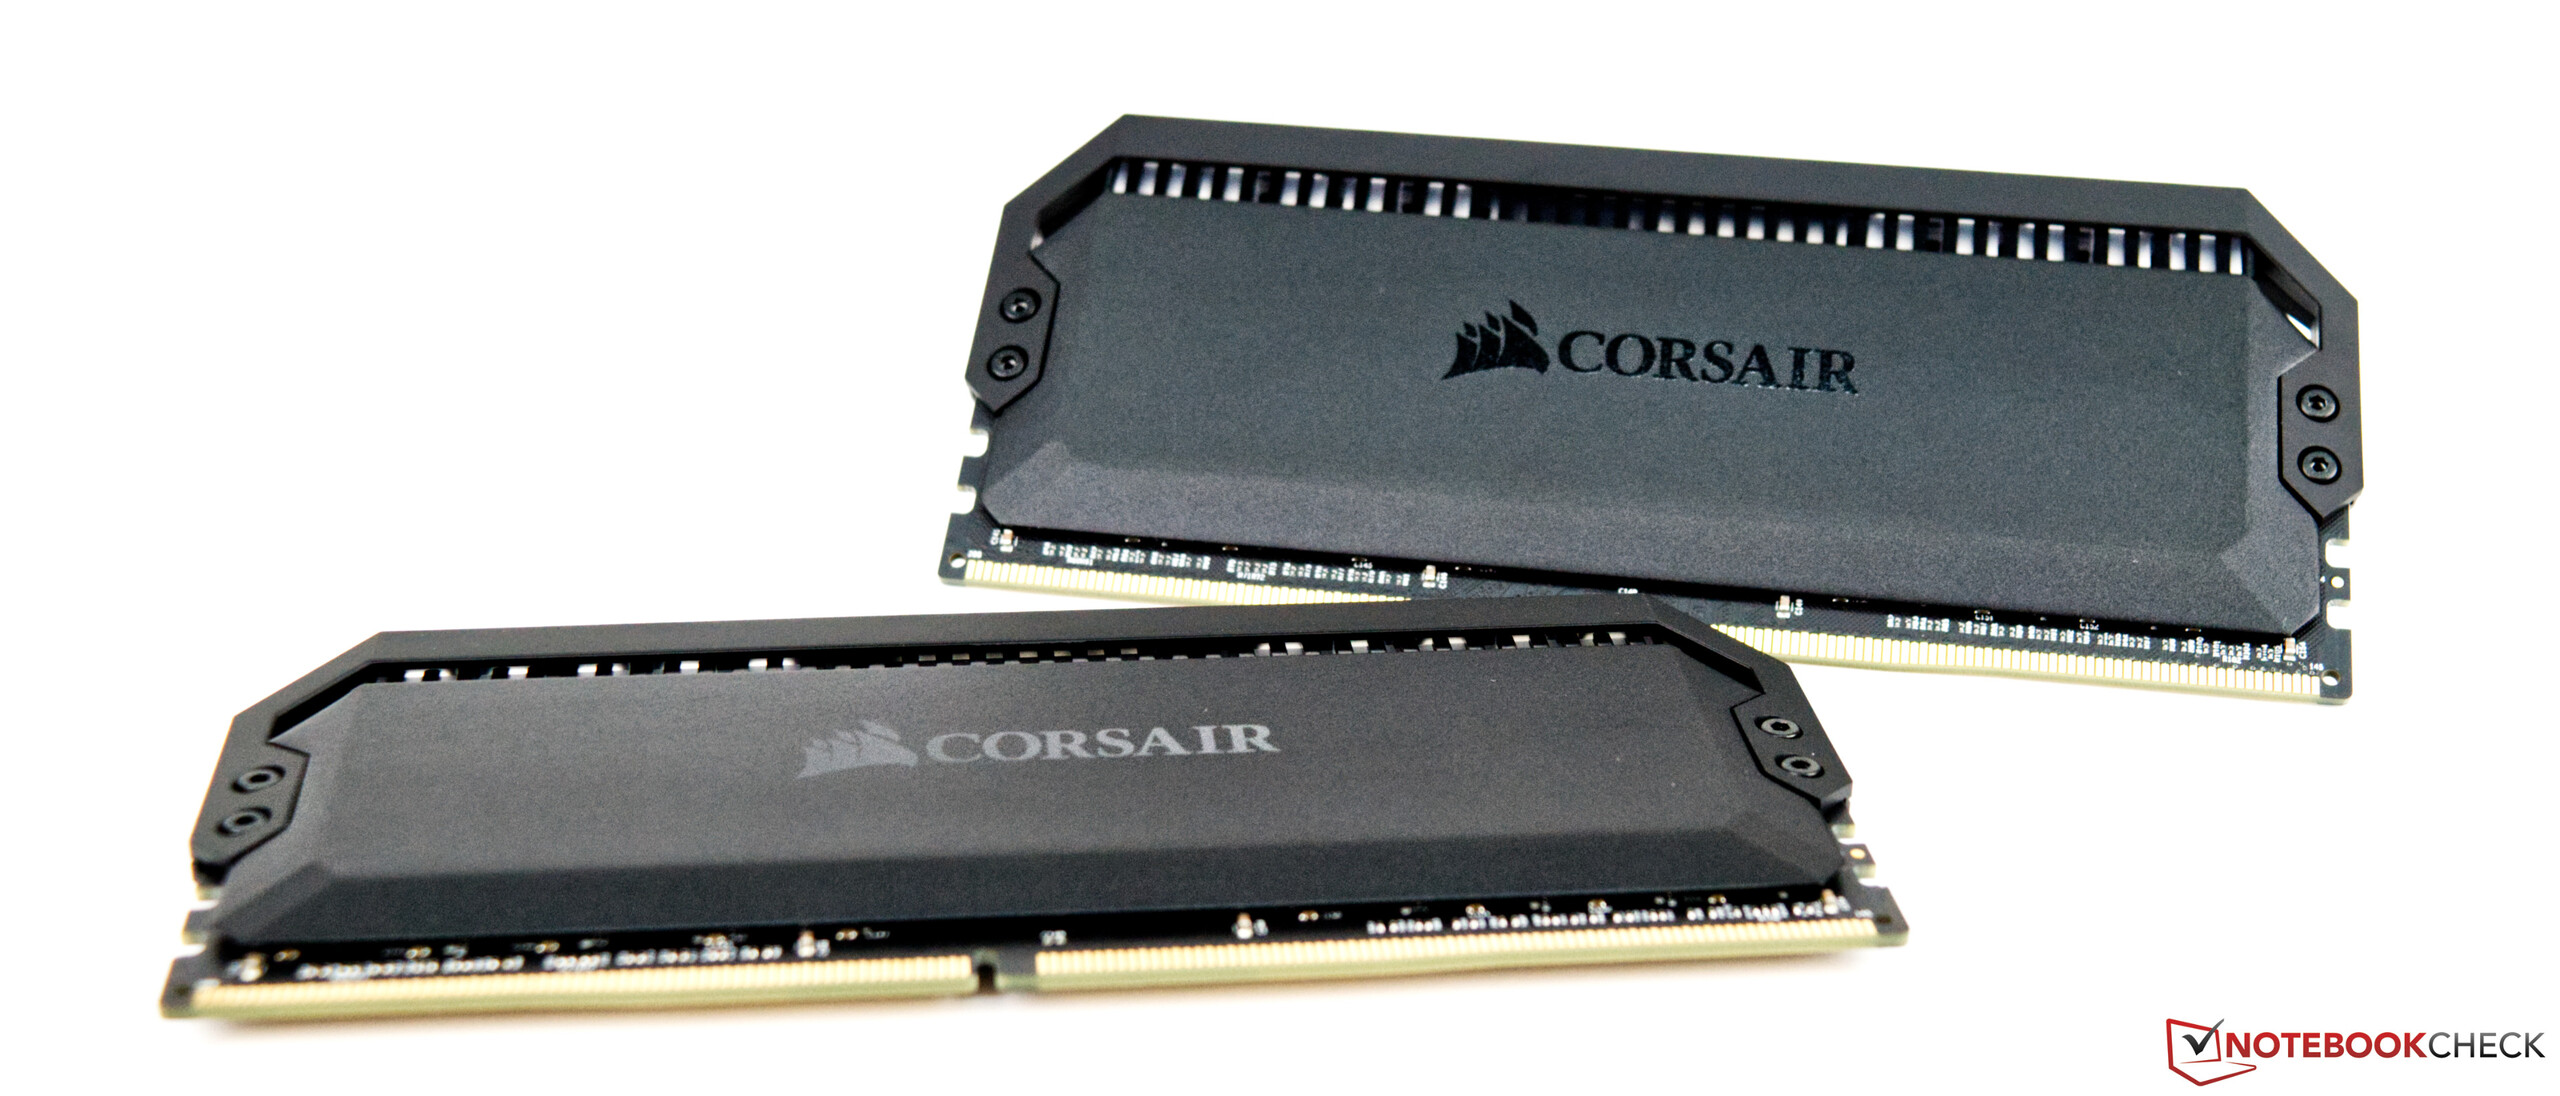
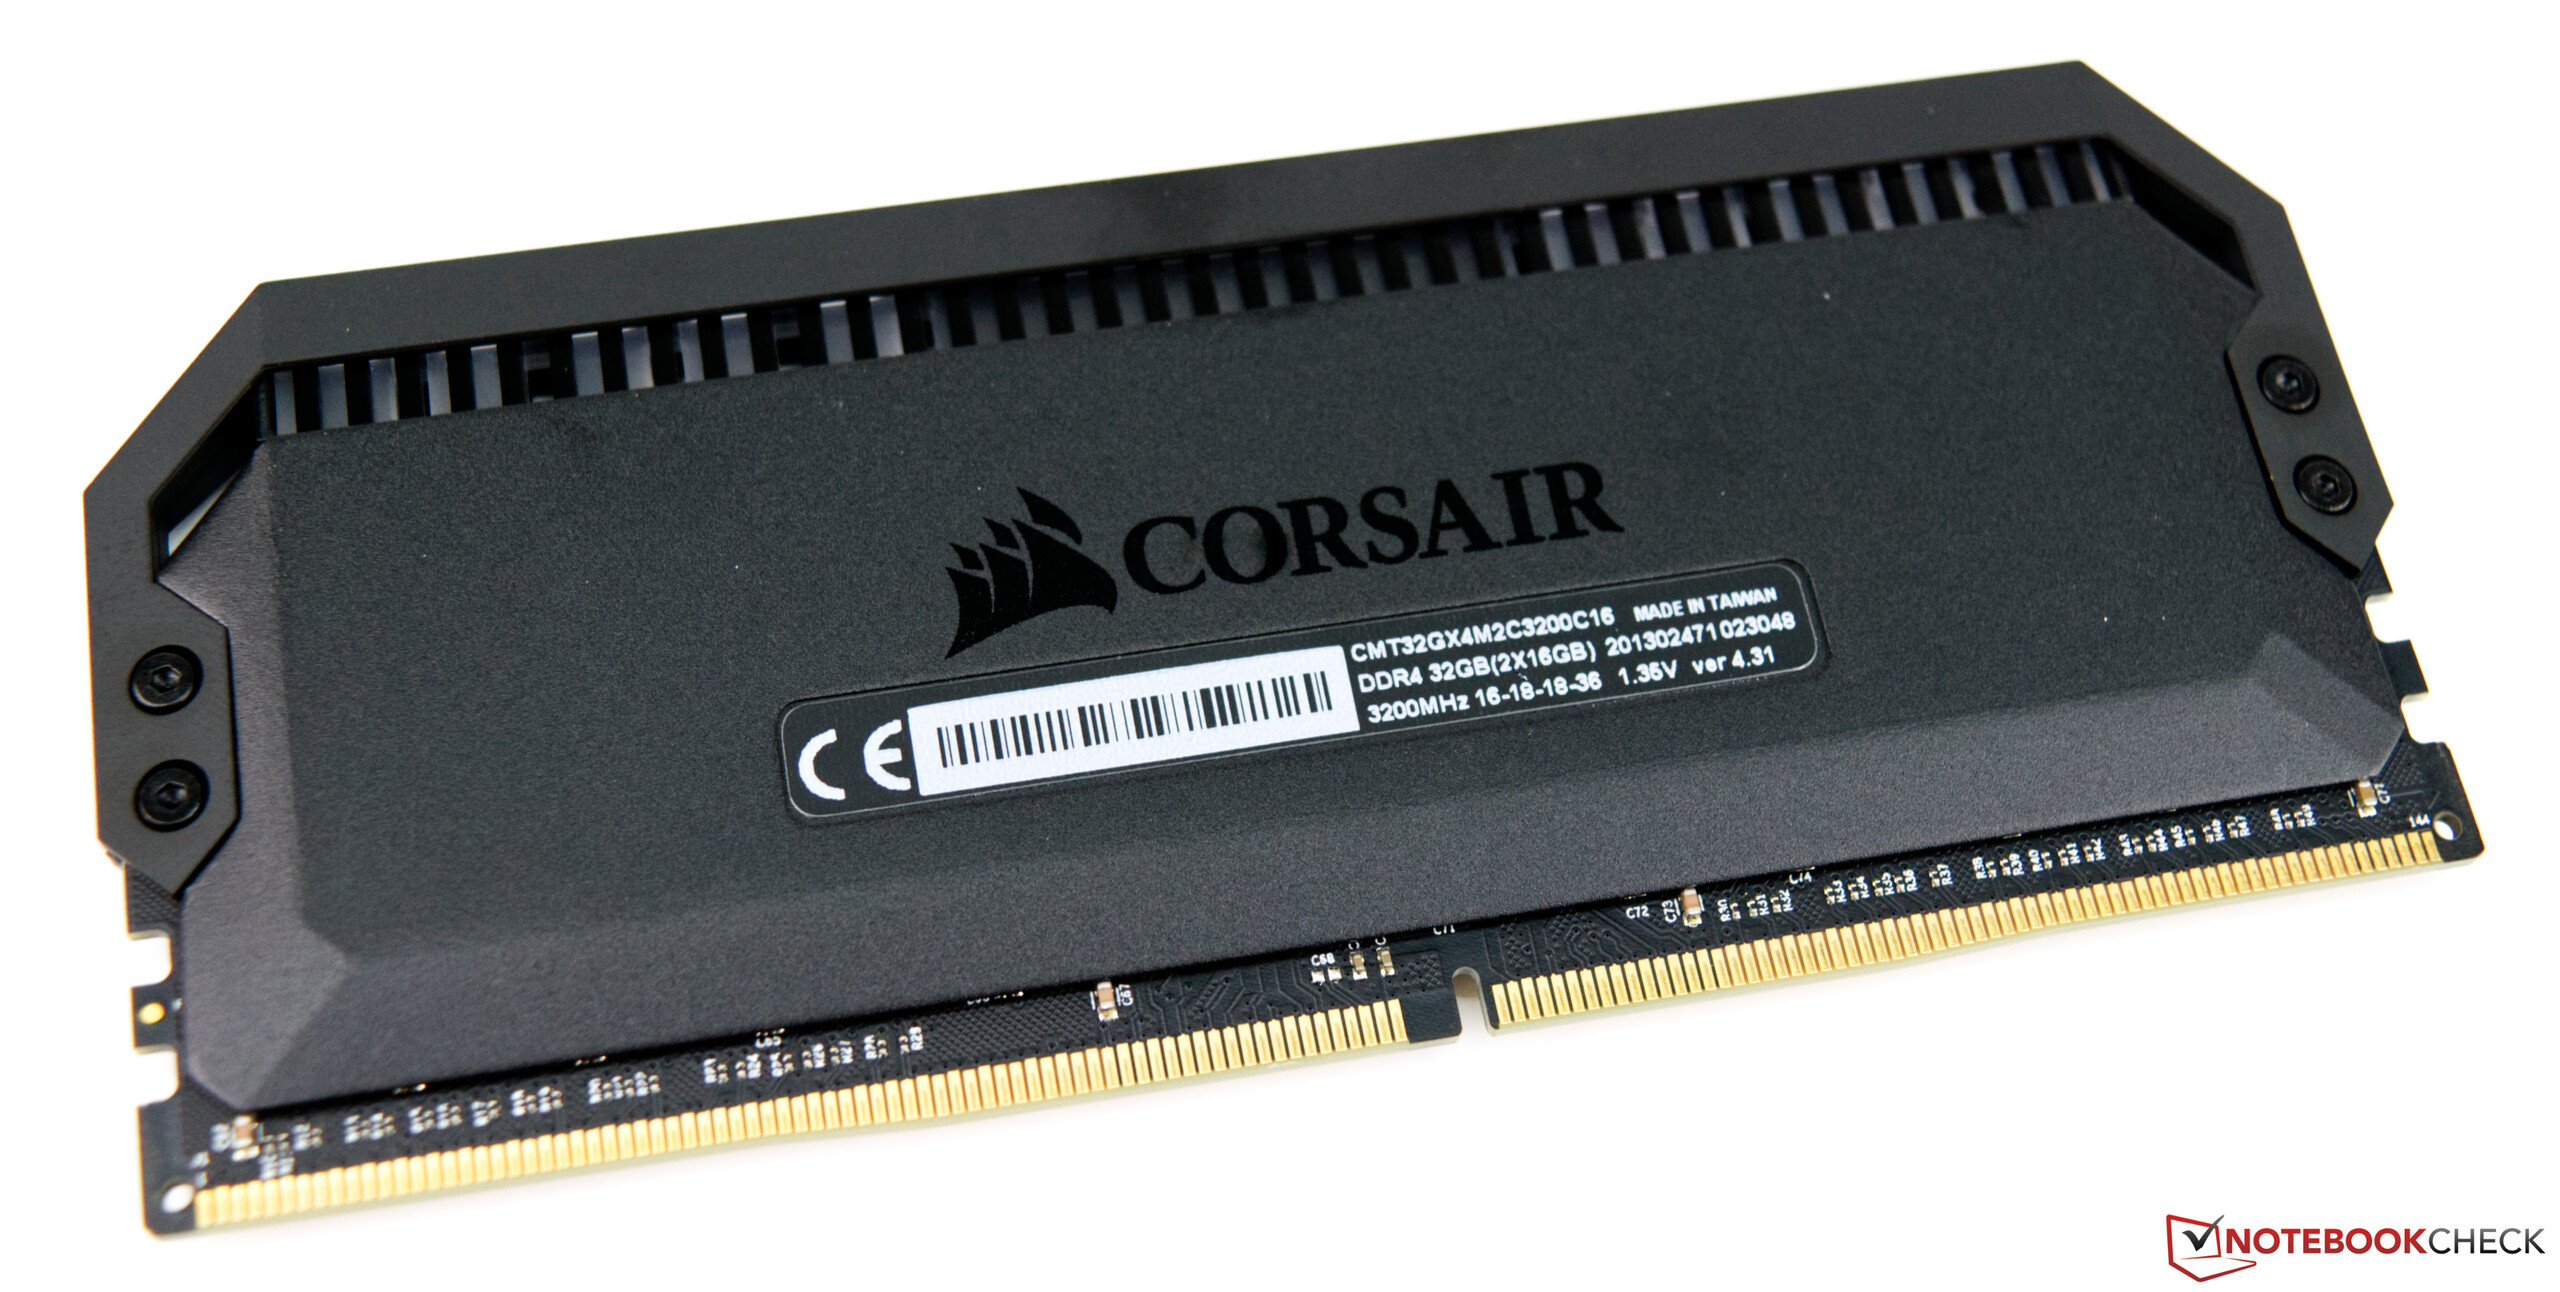
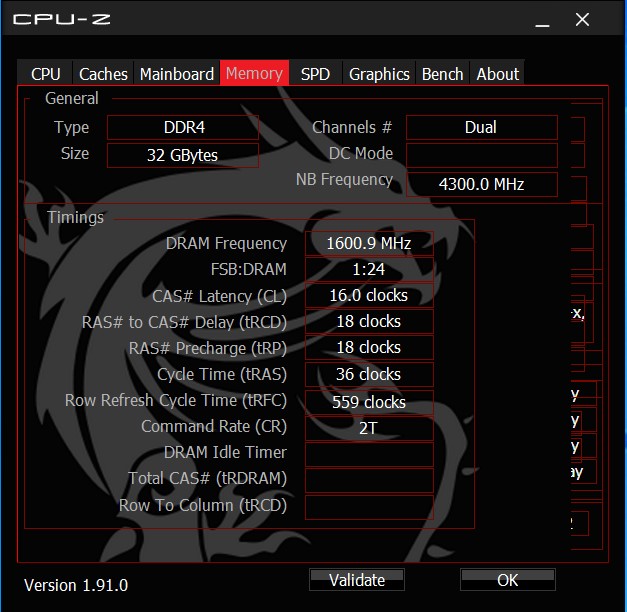
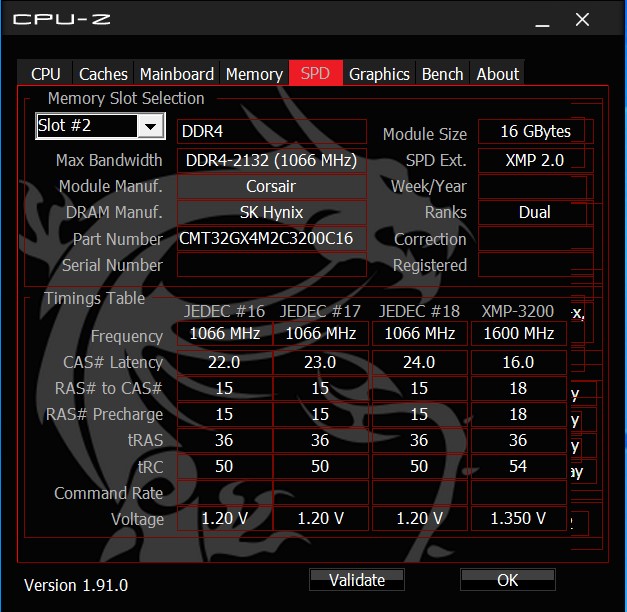
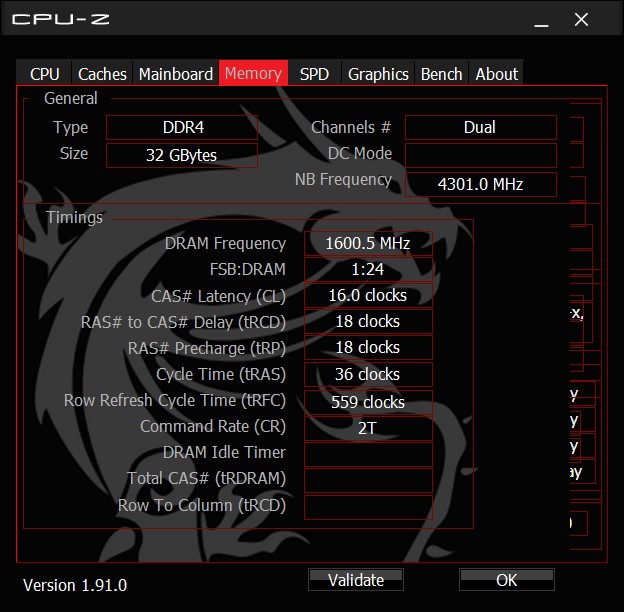
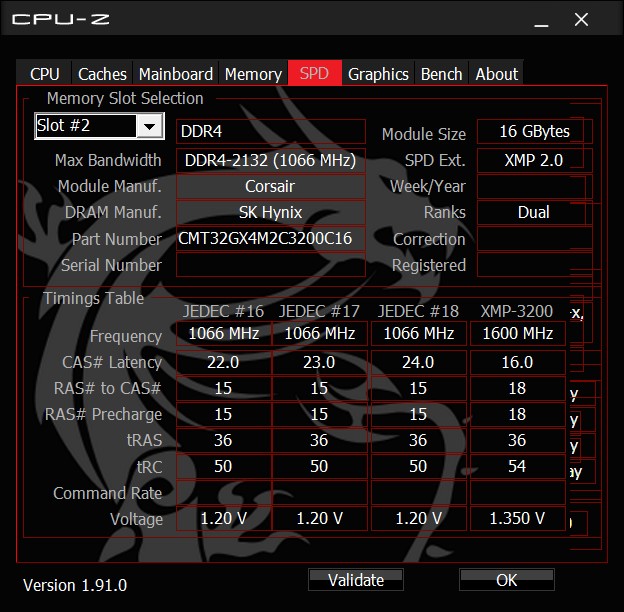
- Corsair Dominator Platinum RGB (2x 16GB - DDR4-3200)
- Western Digital PC SN720 NVMe SSD 512GB
- Microsoft Windows 10 Professional 64-Bit (Version 1909)
Intel ci ha fornito sia le CPU che la RAM. MSI ci ha fornito la scheda madre e il nostro case p della Raijintek Paean. Per la nostra soluzione di raffreddamento abbiamo utilizzato l'Alphacool Eisbaer 280 AiO.

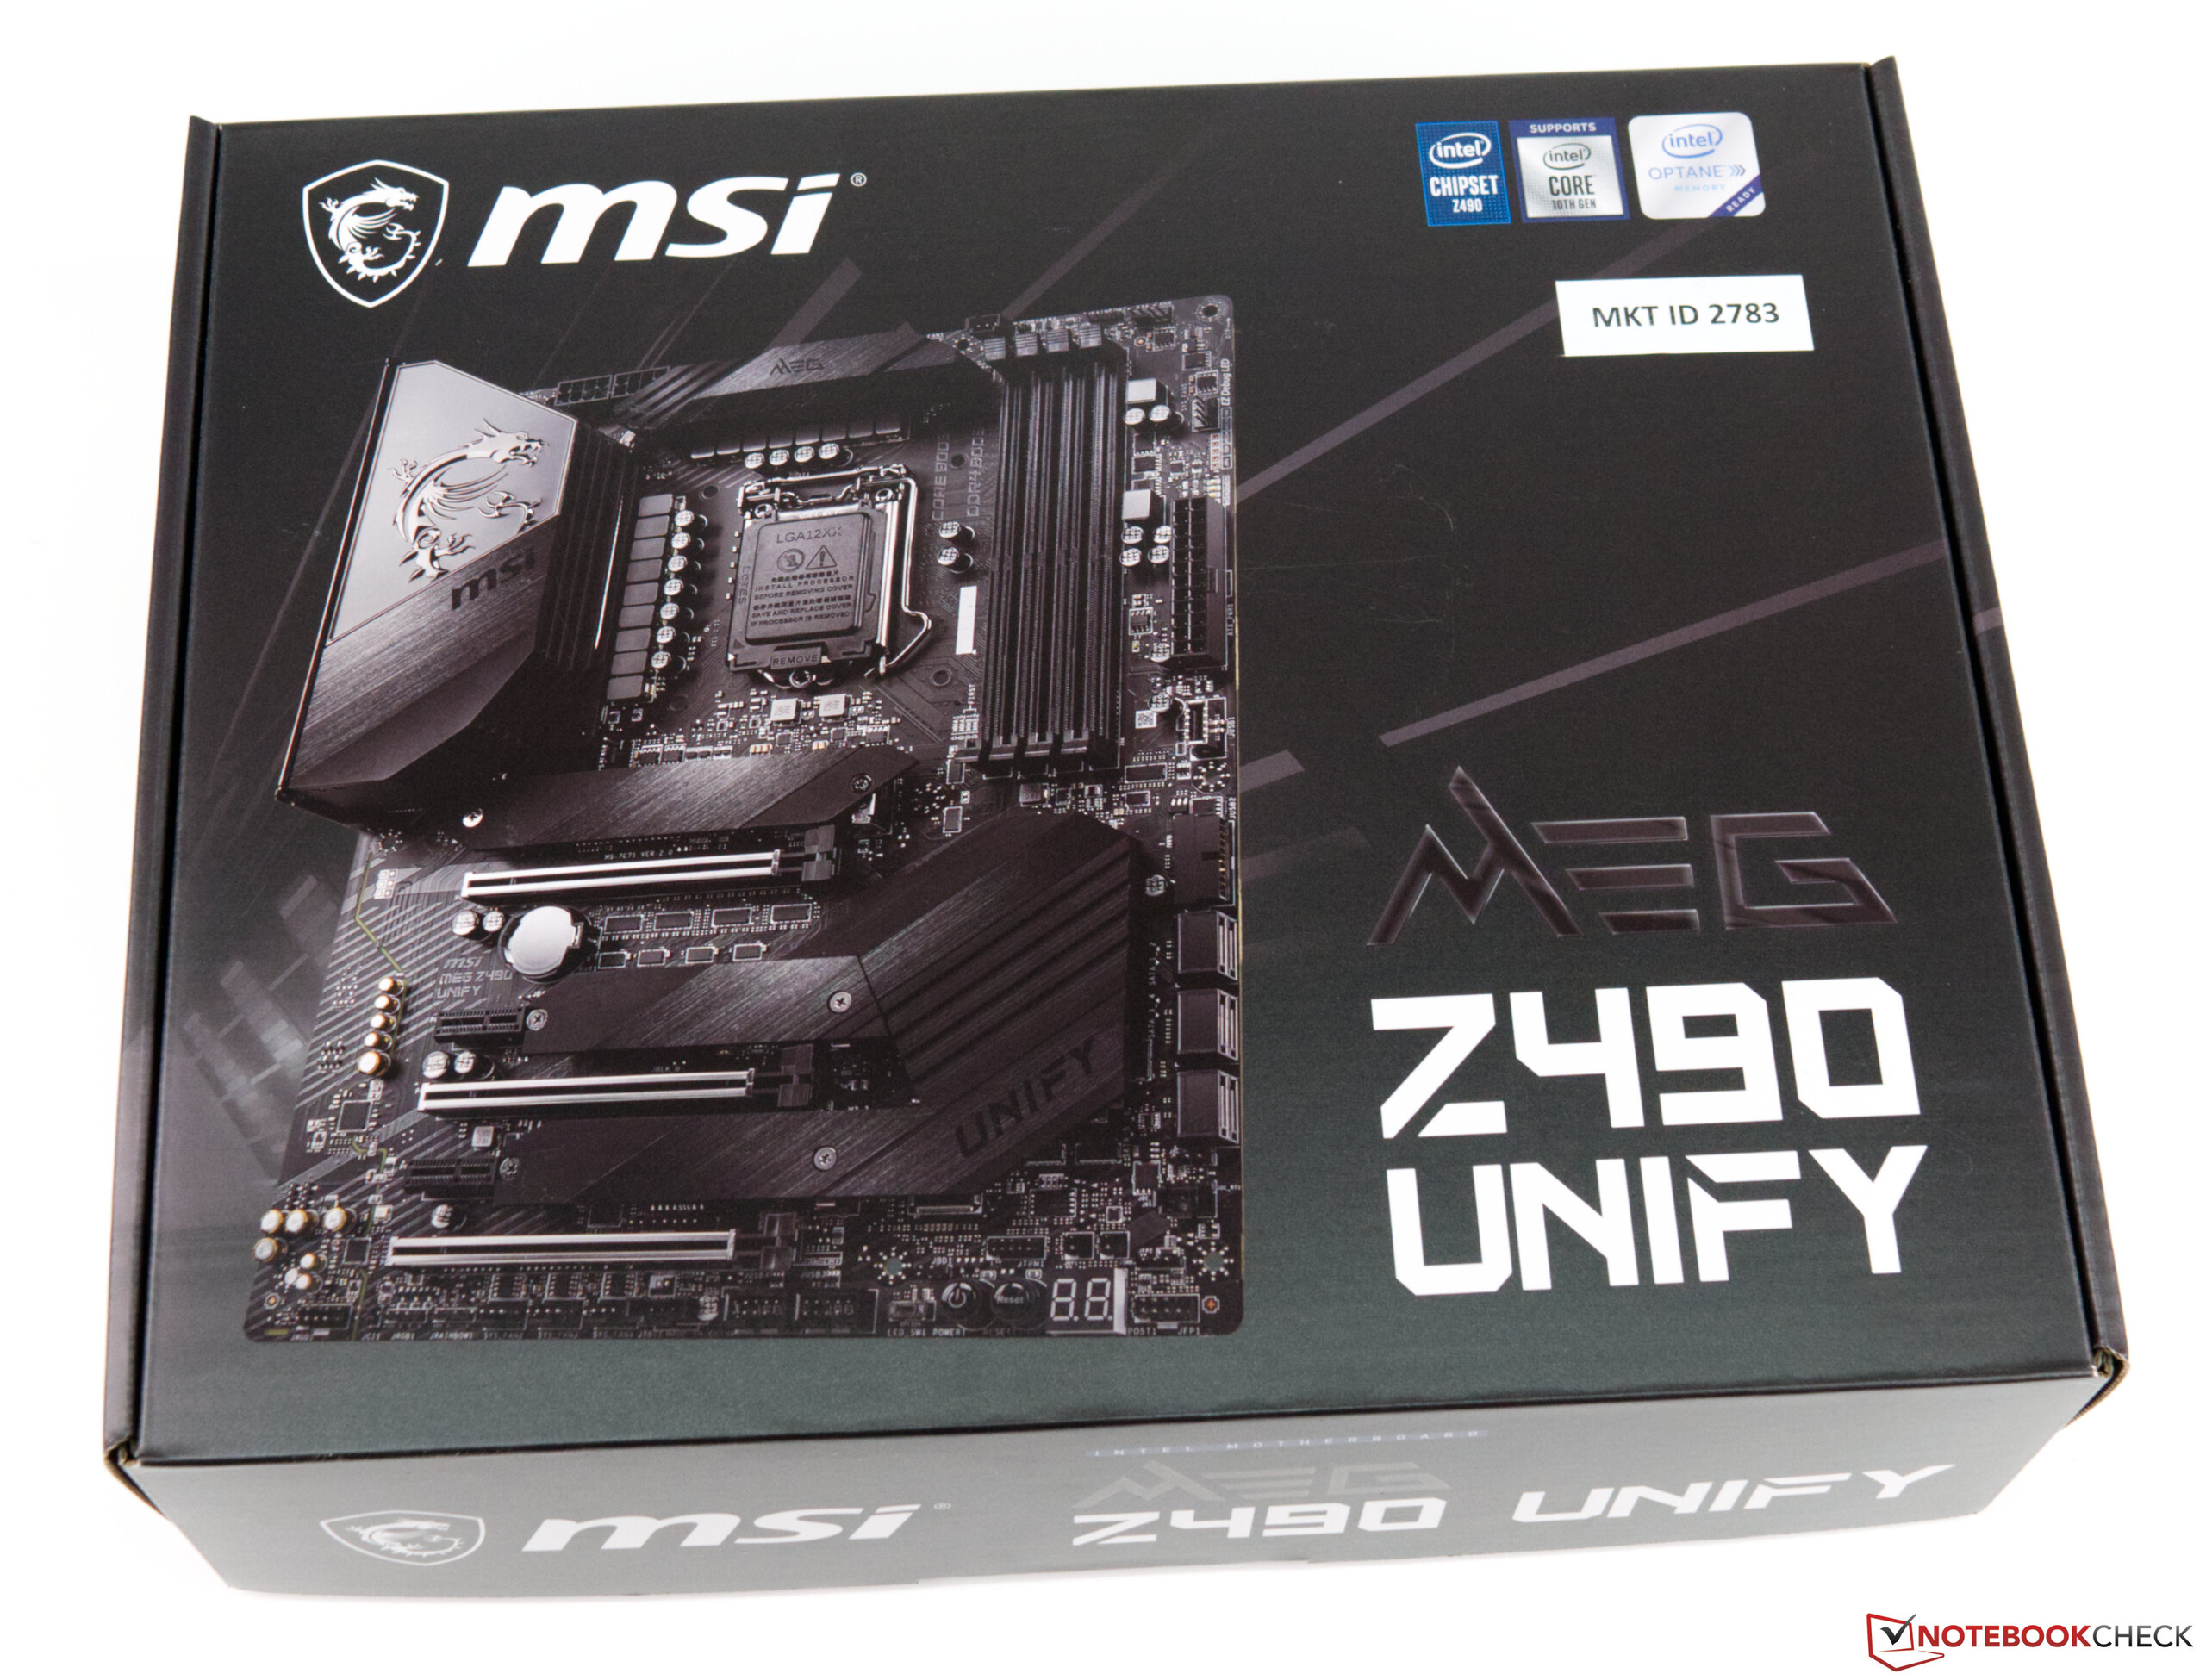
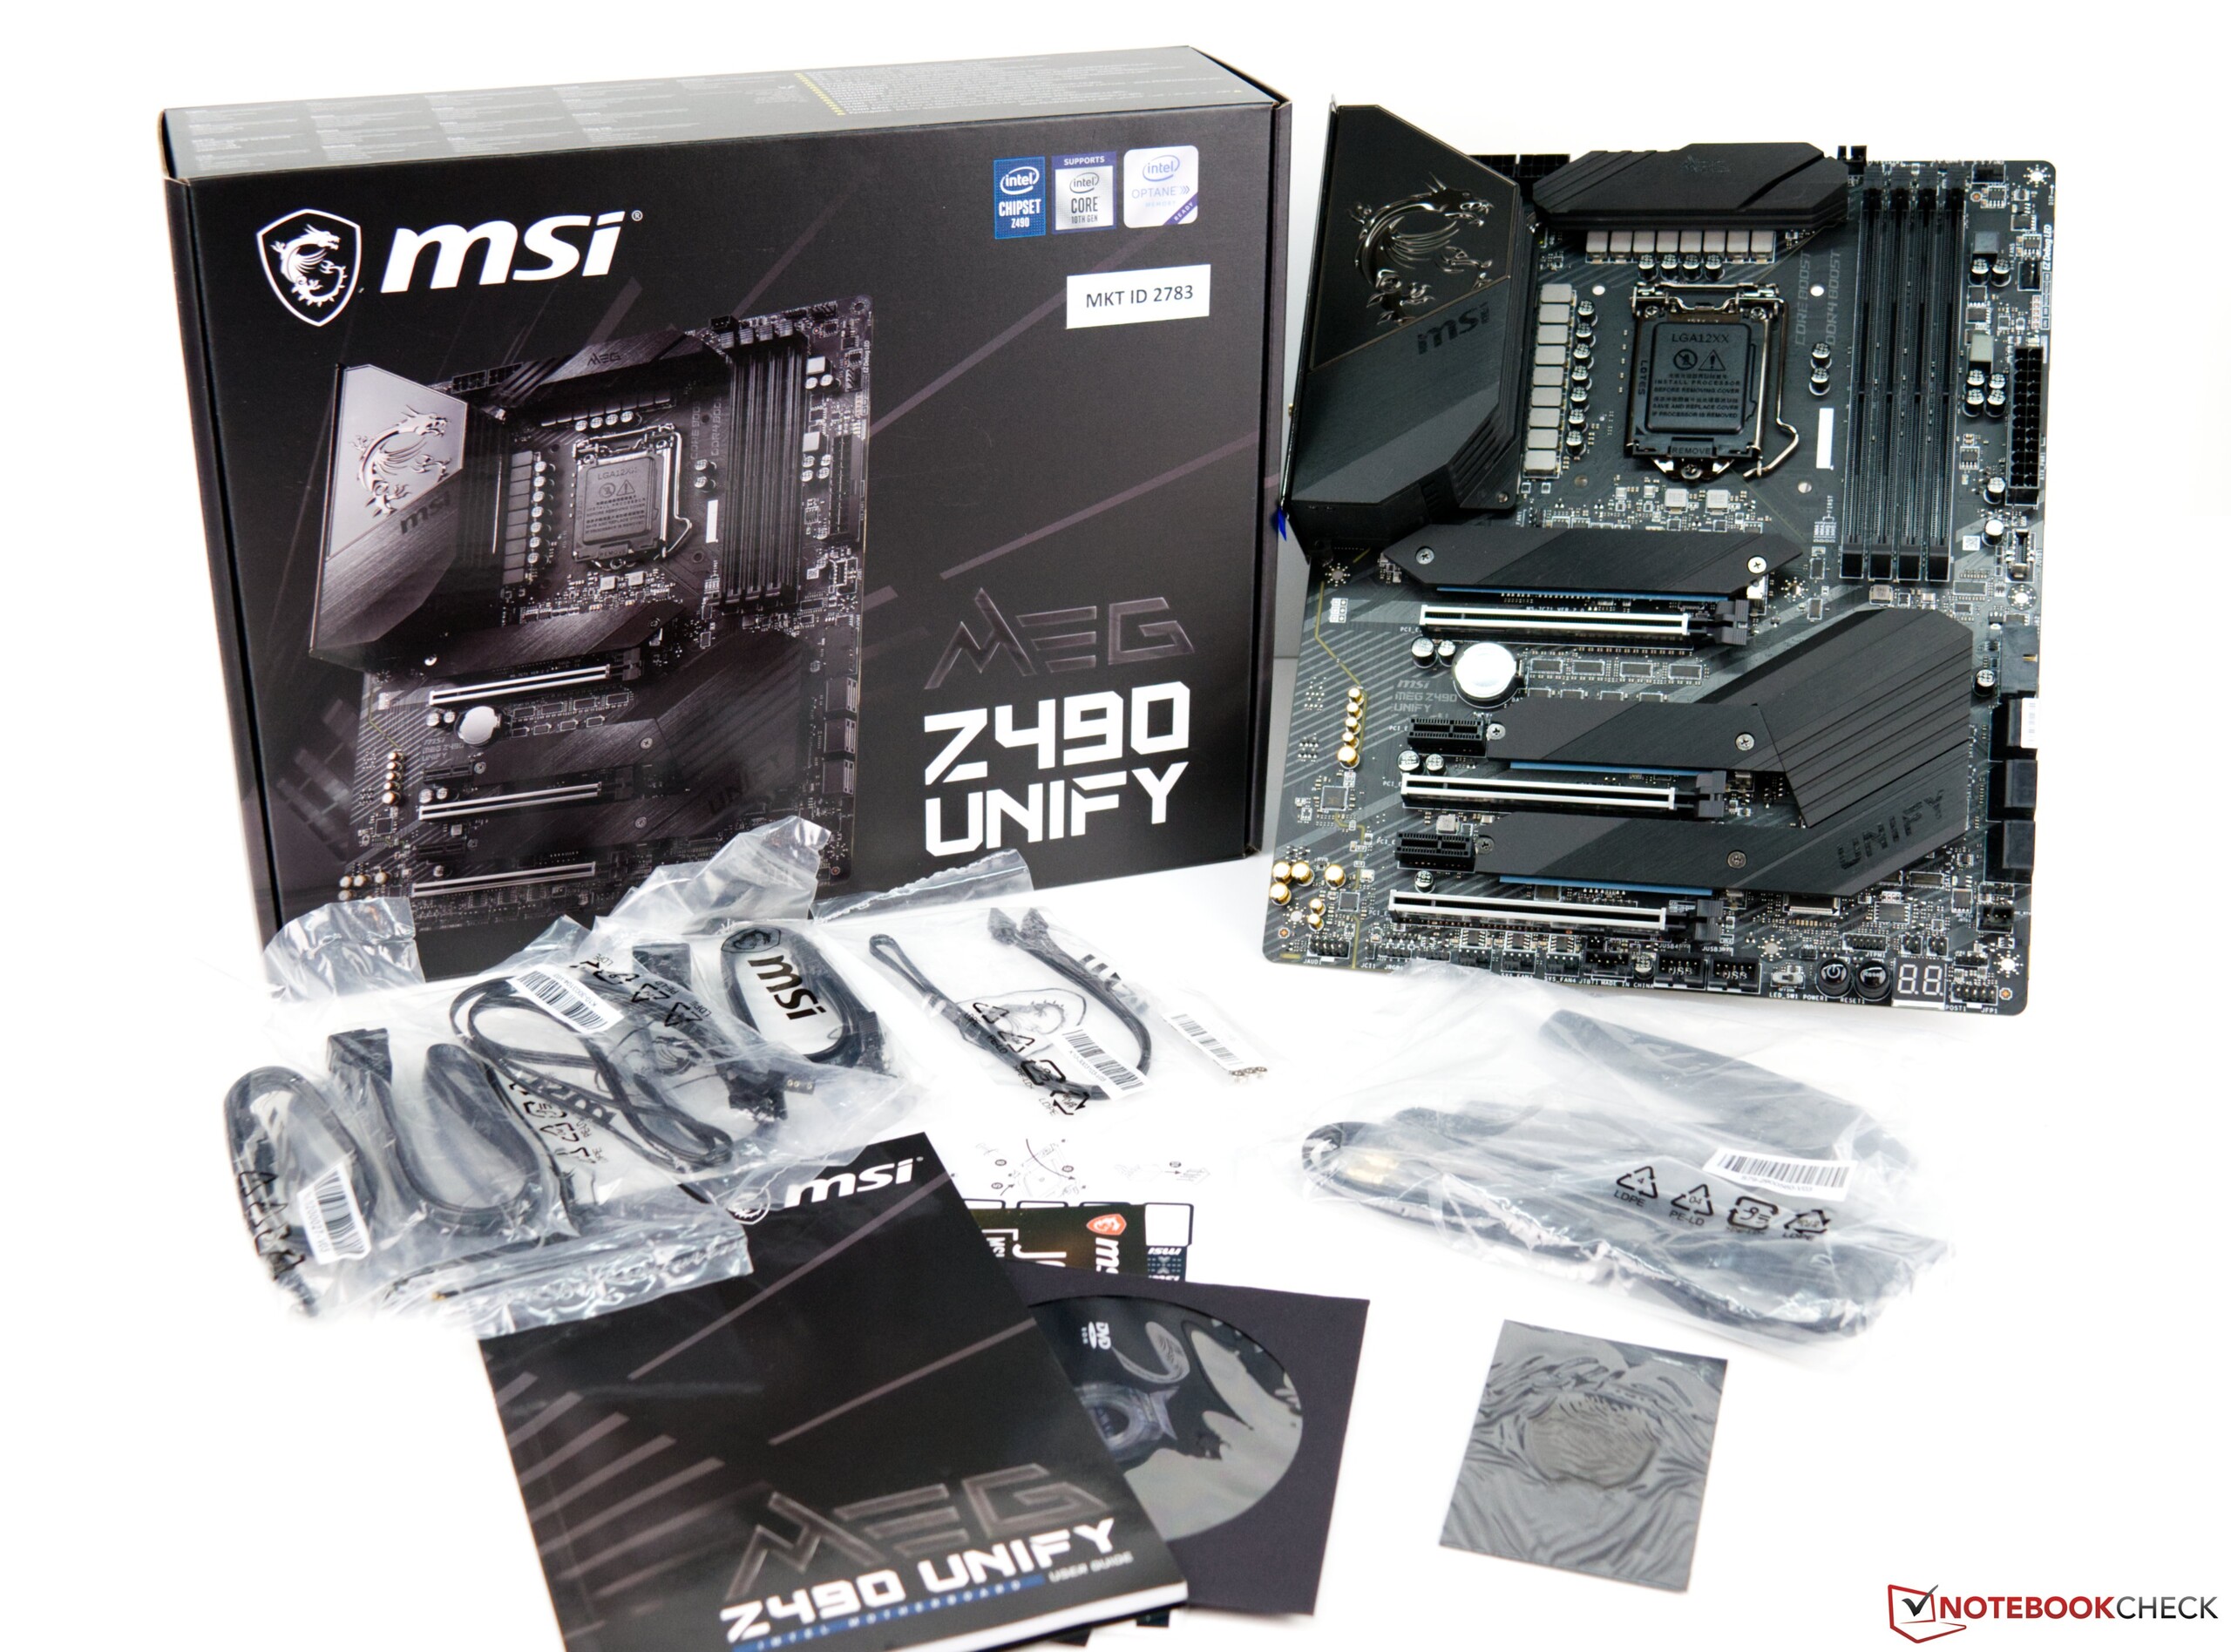
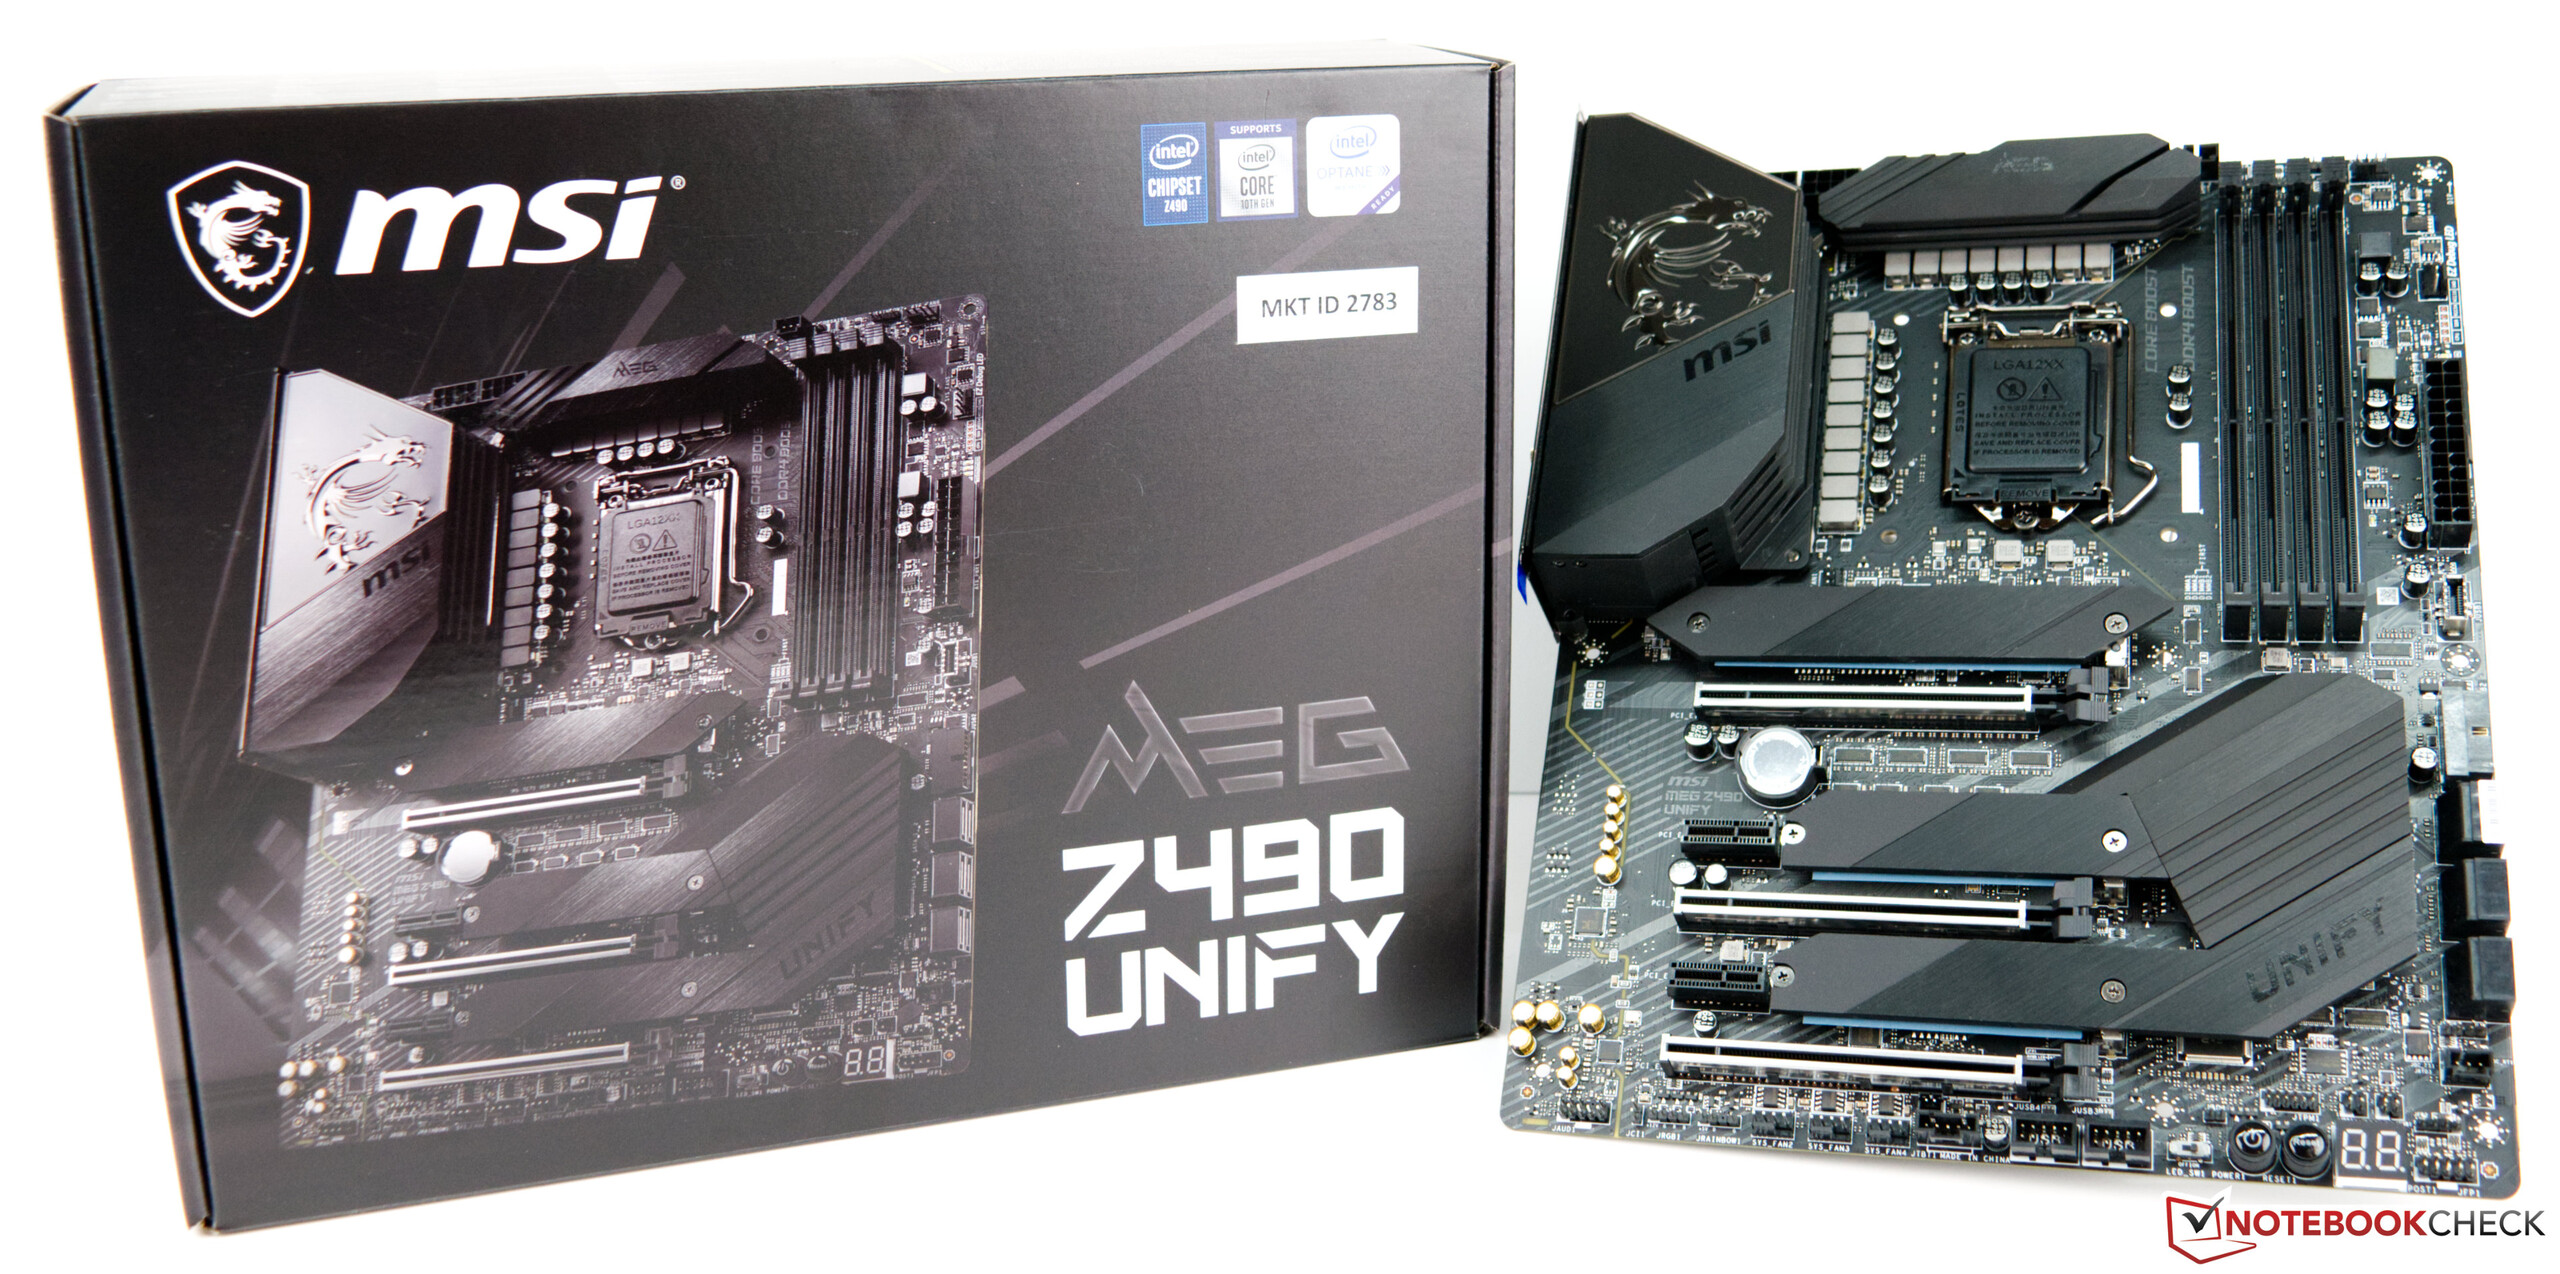
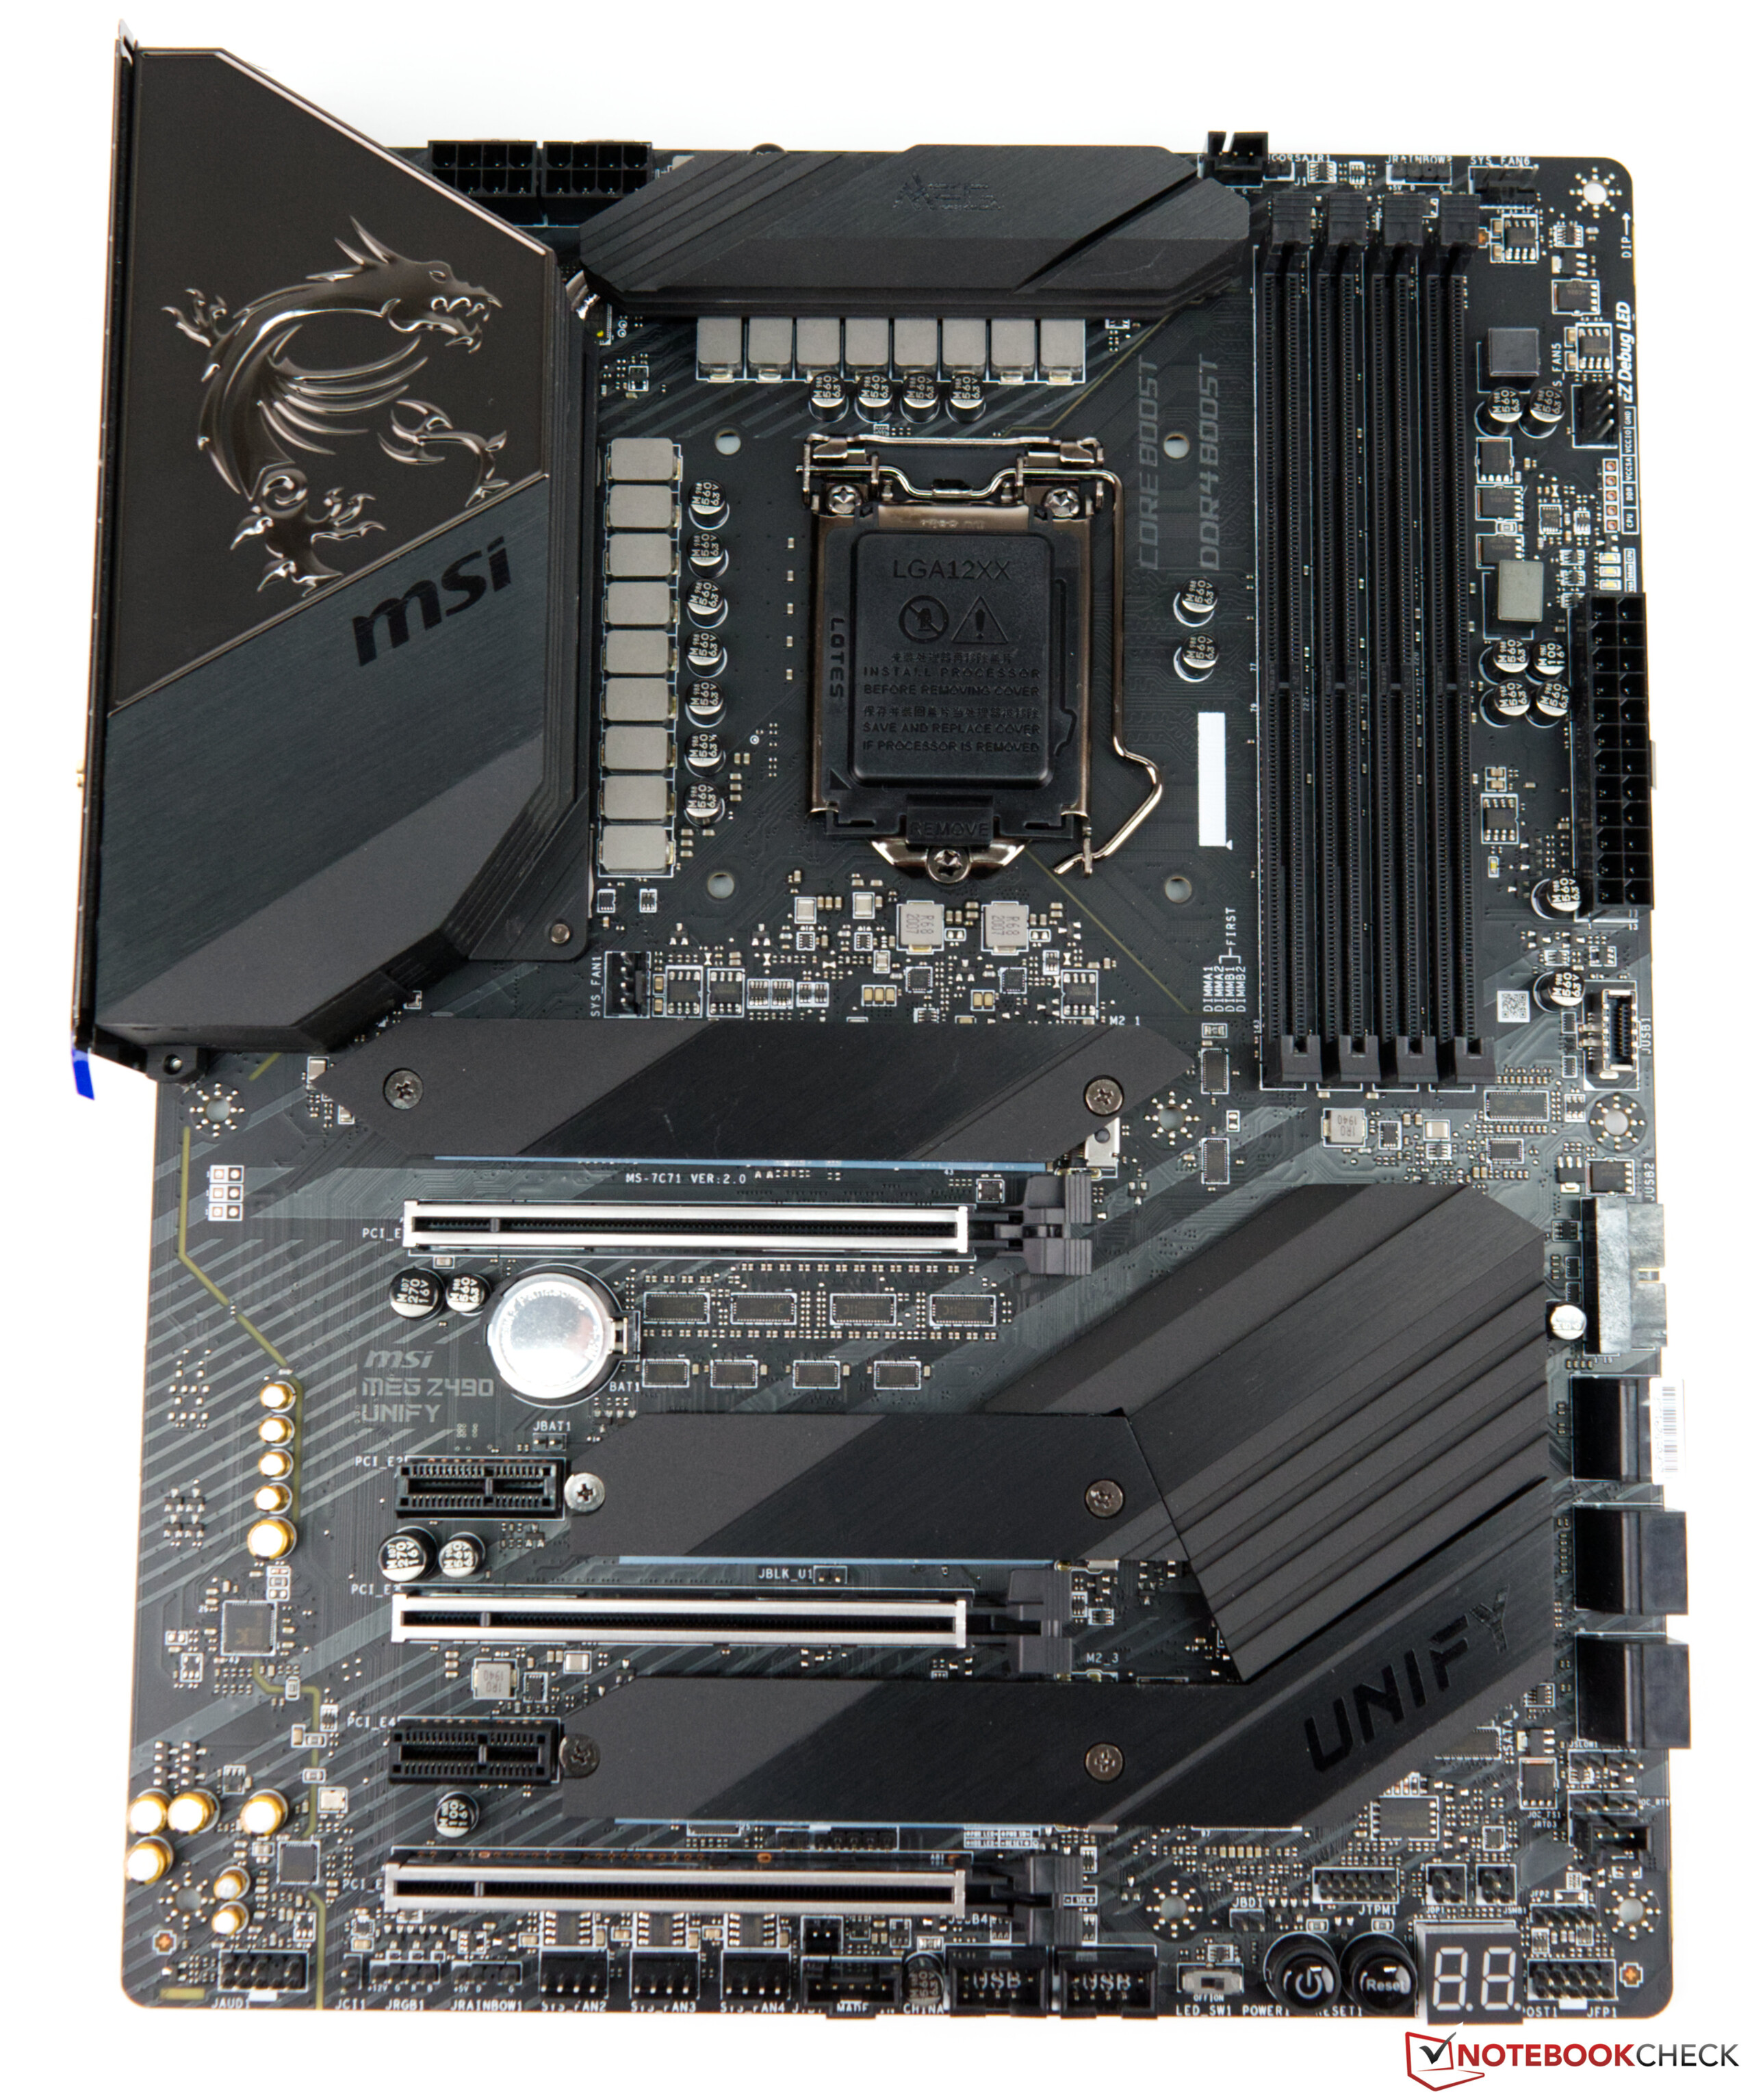
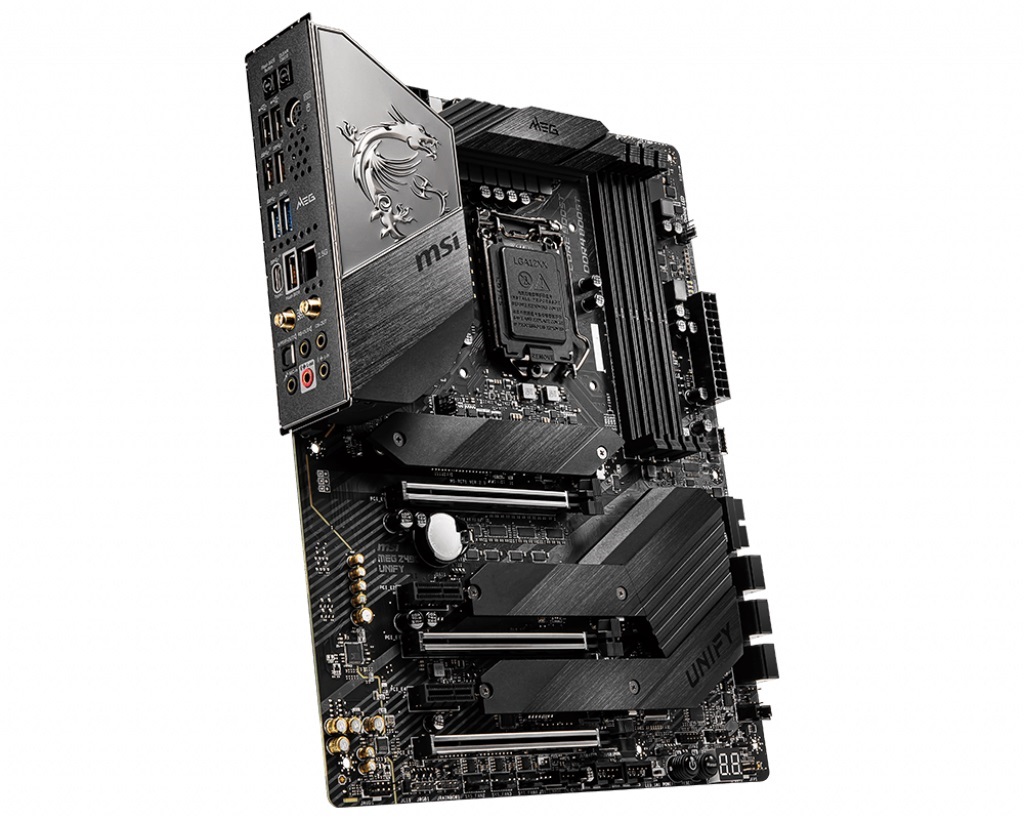
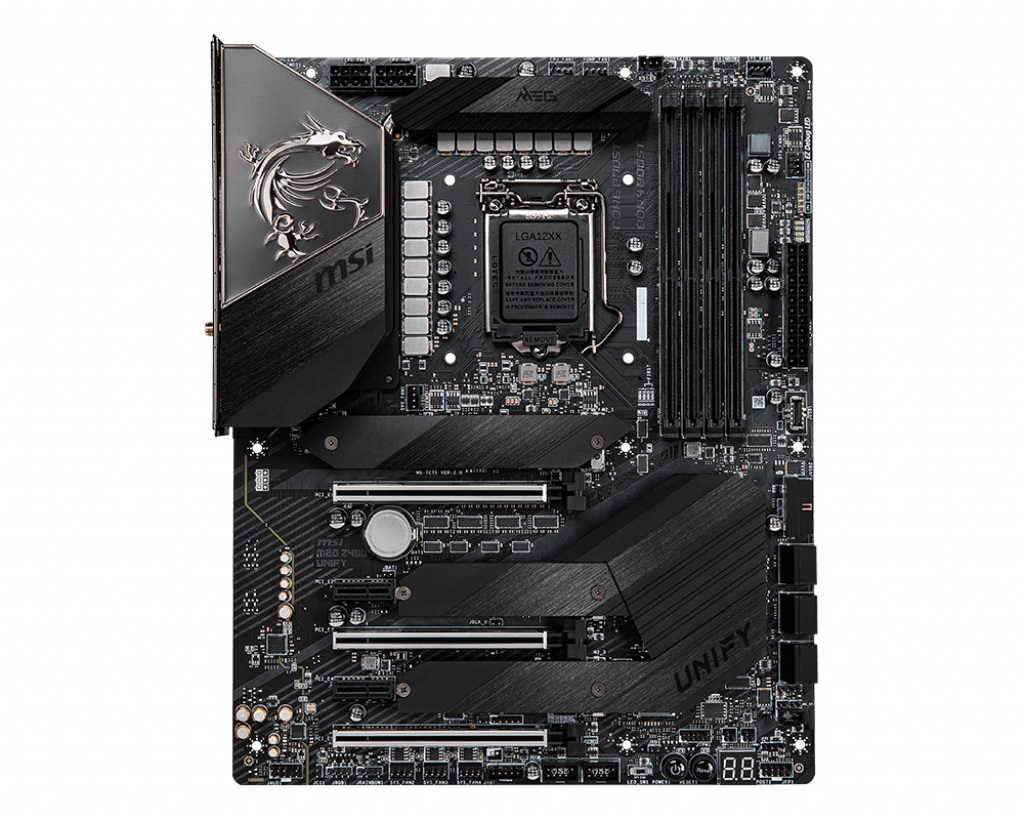
Panoramica dell'MSI Z490 Unify
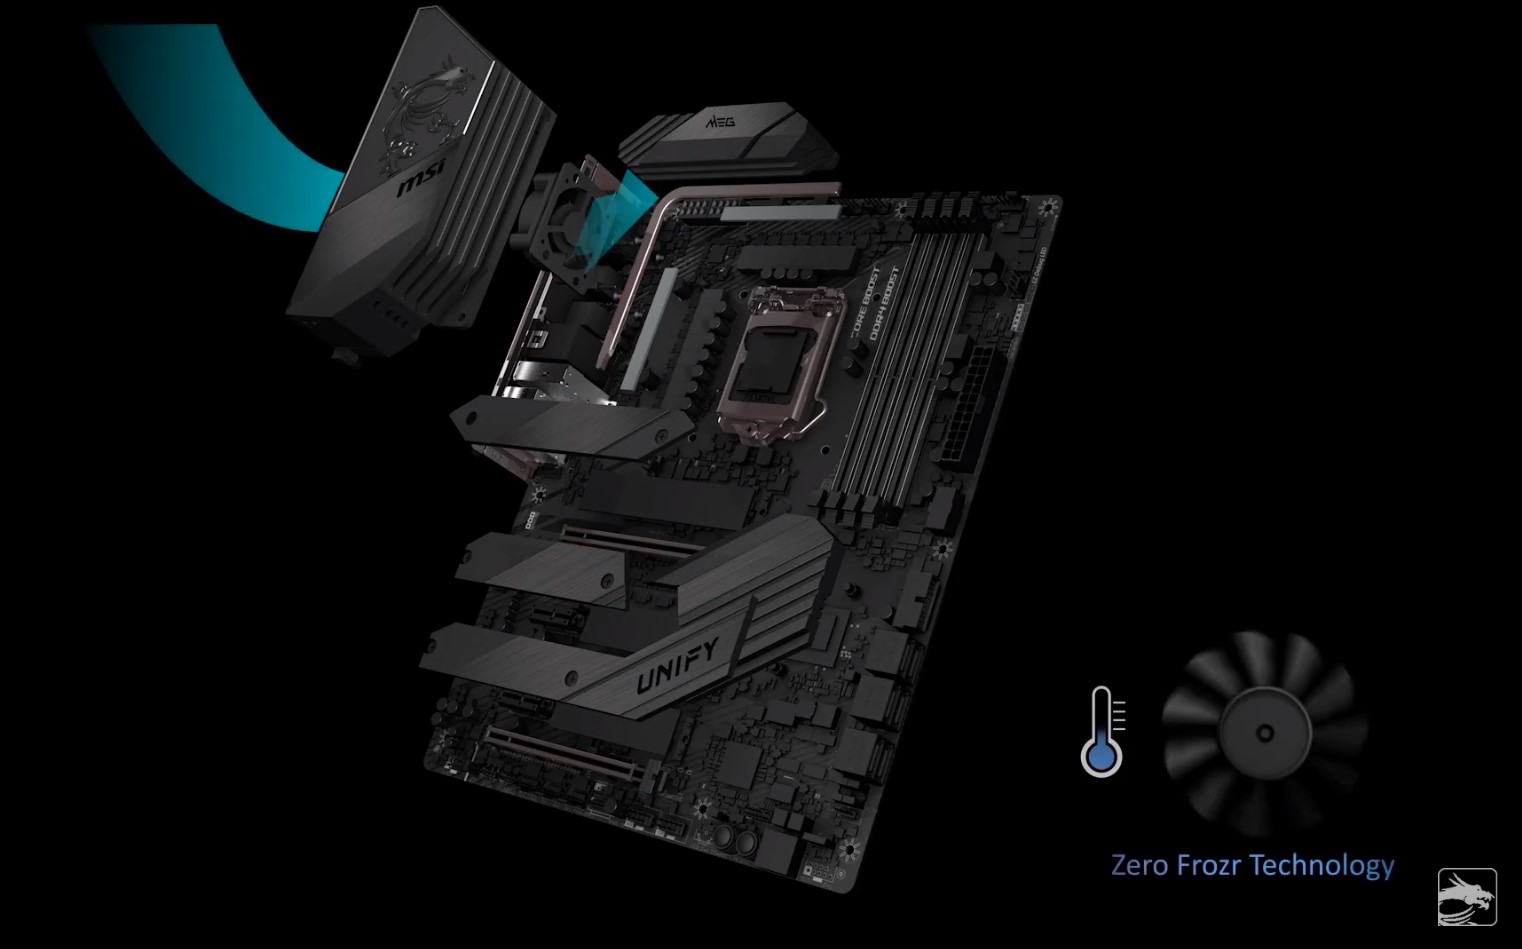
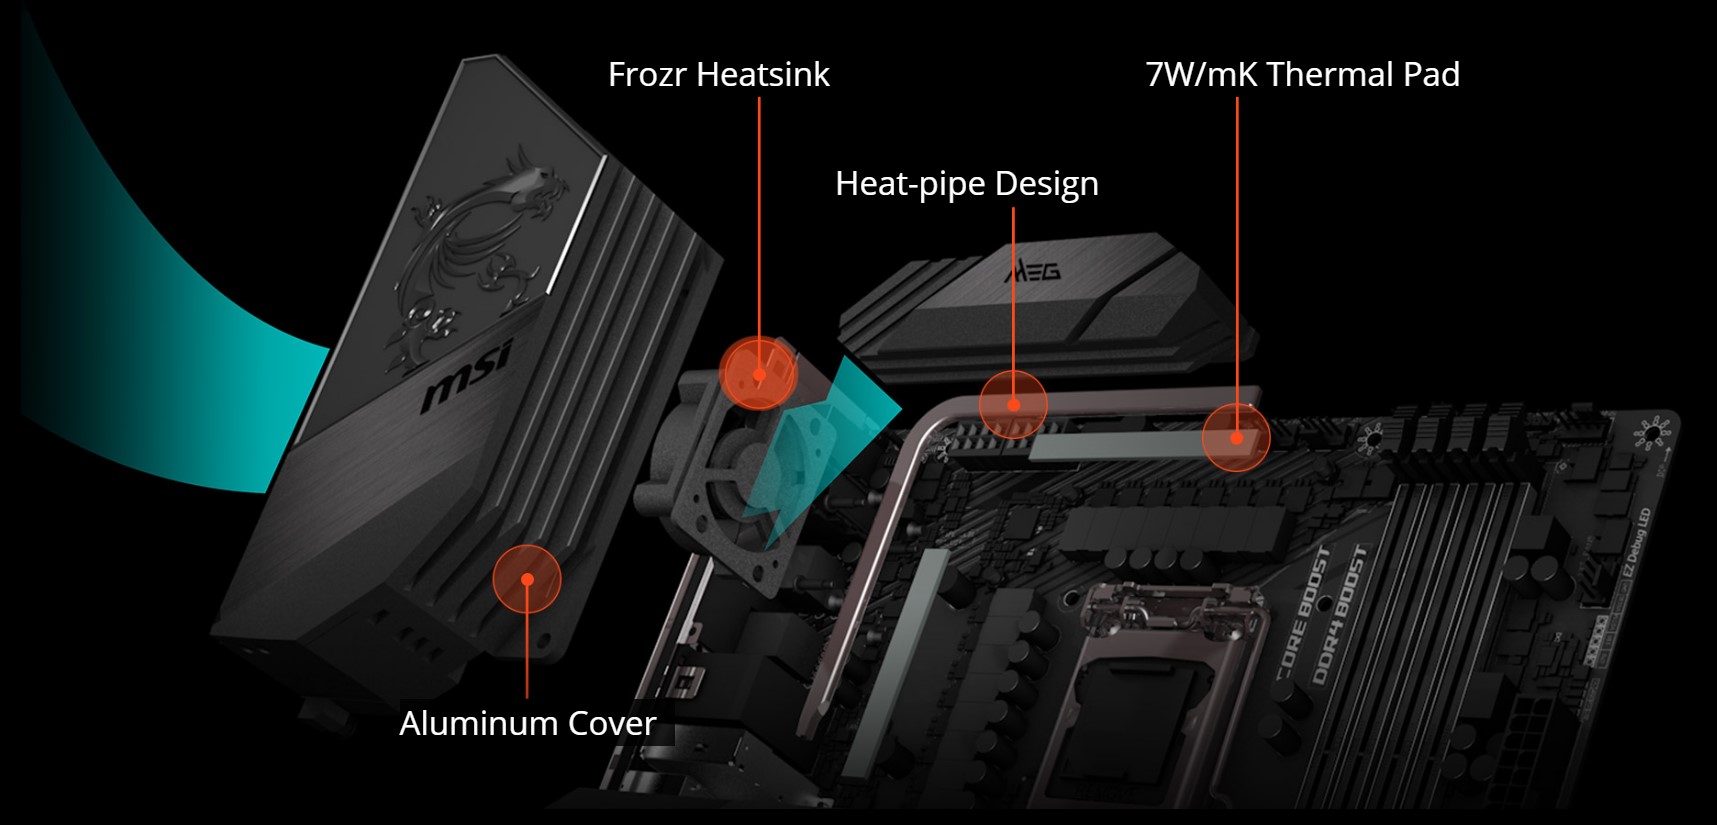
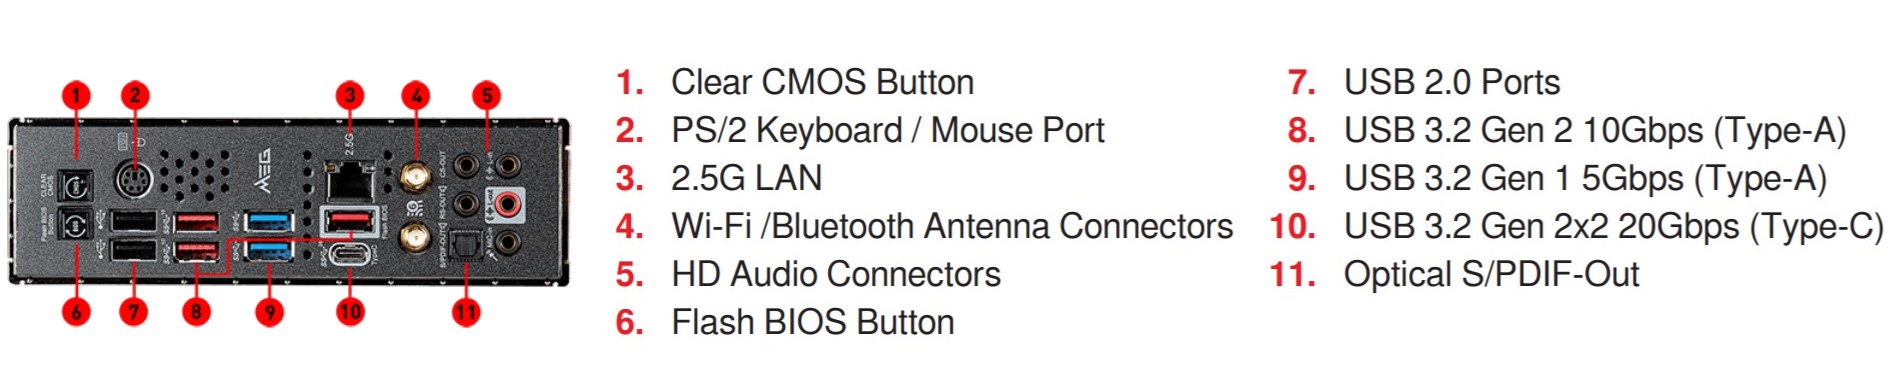
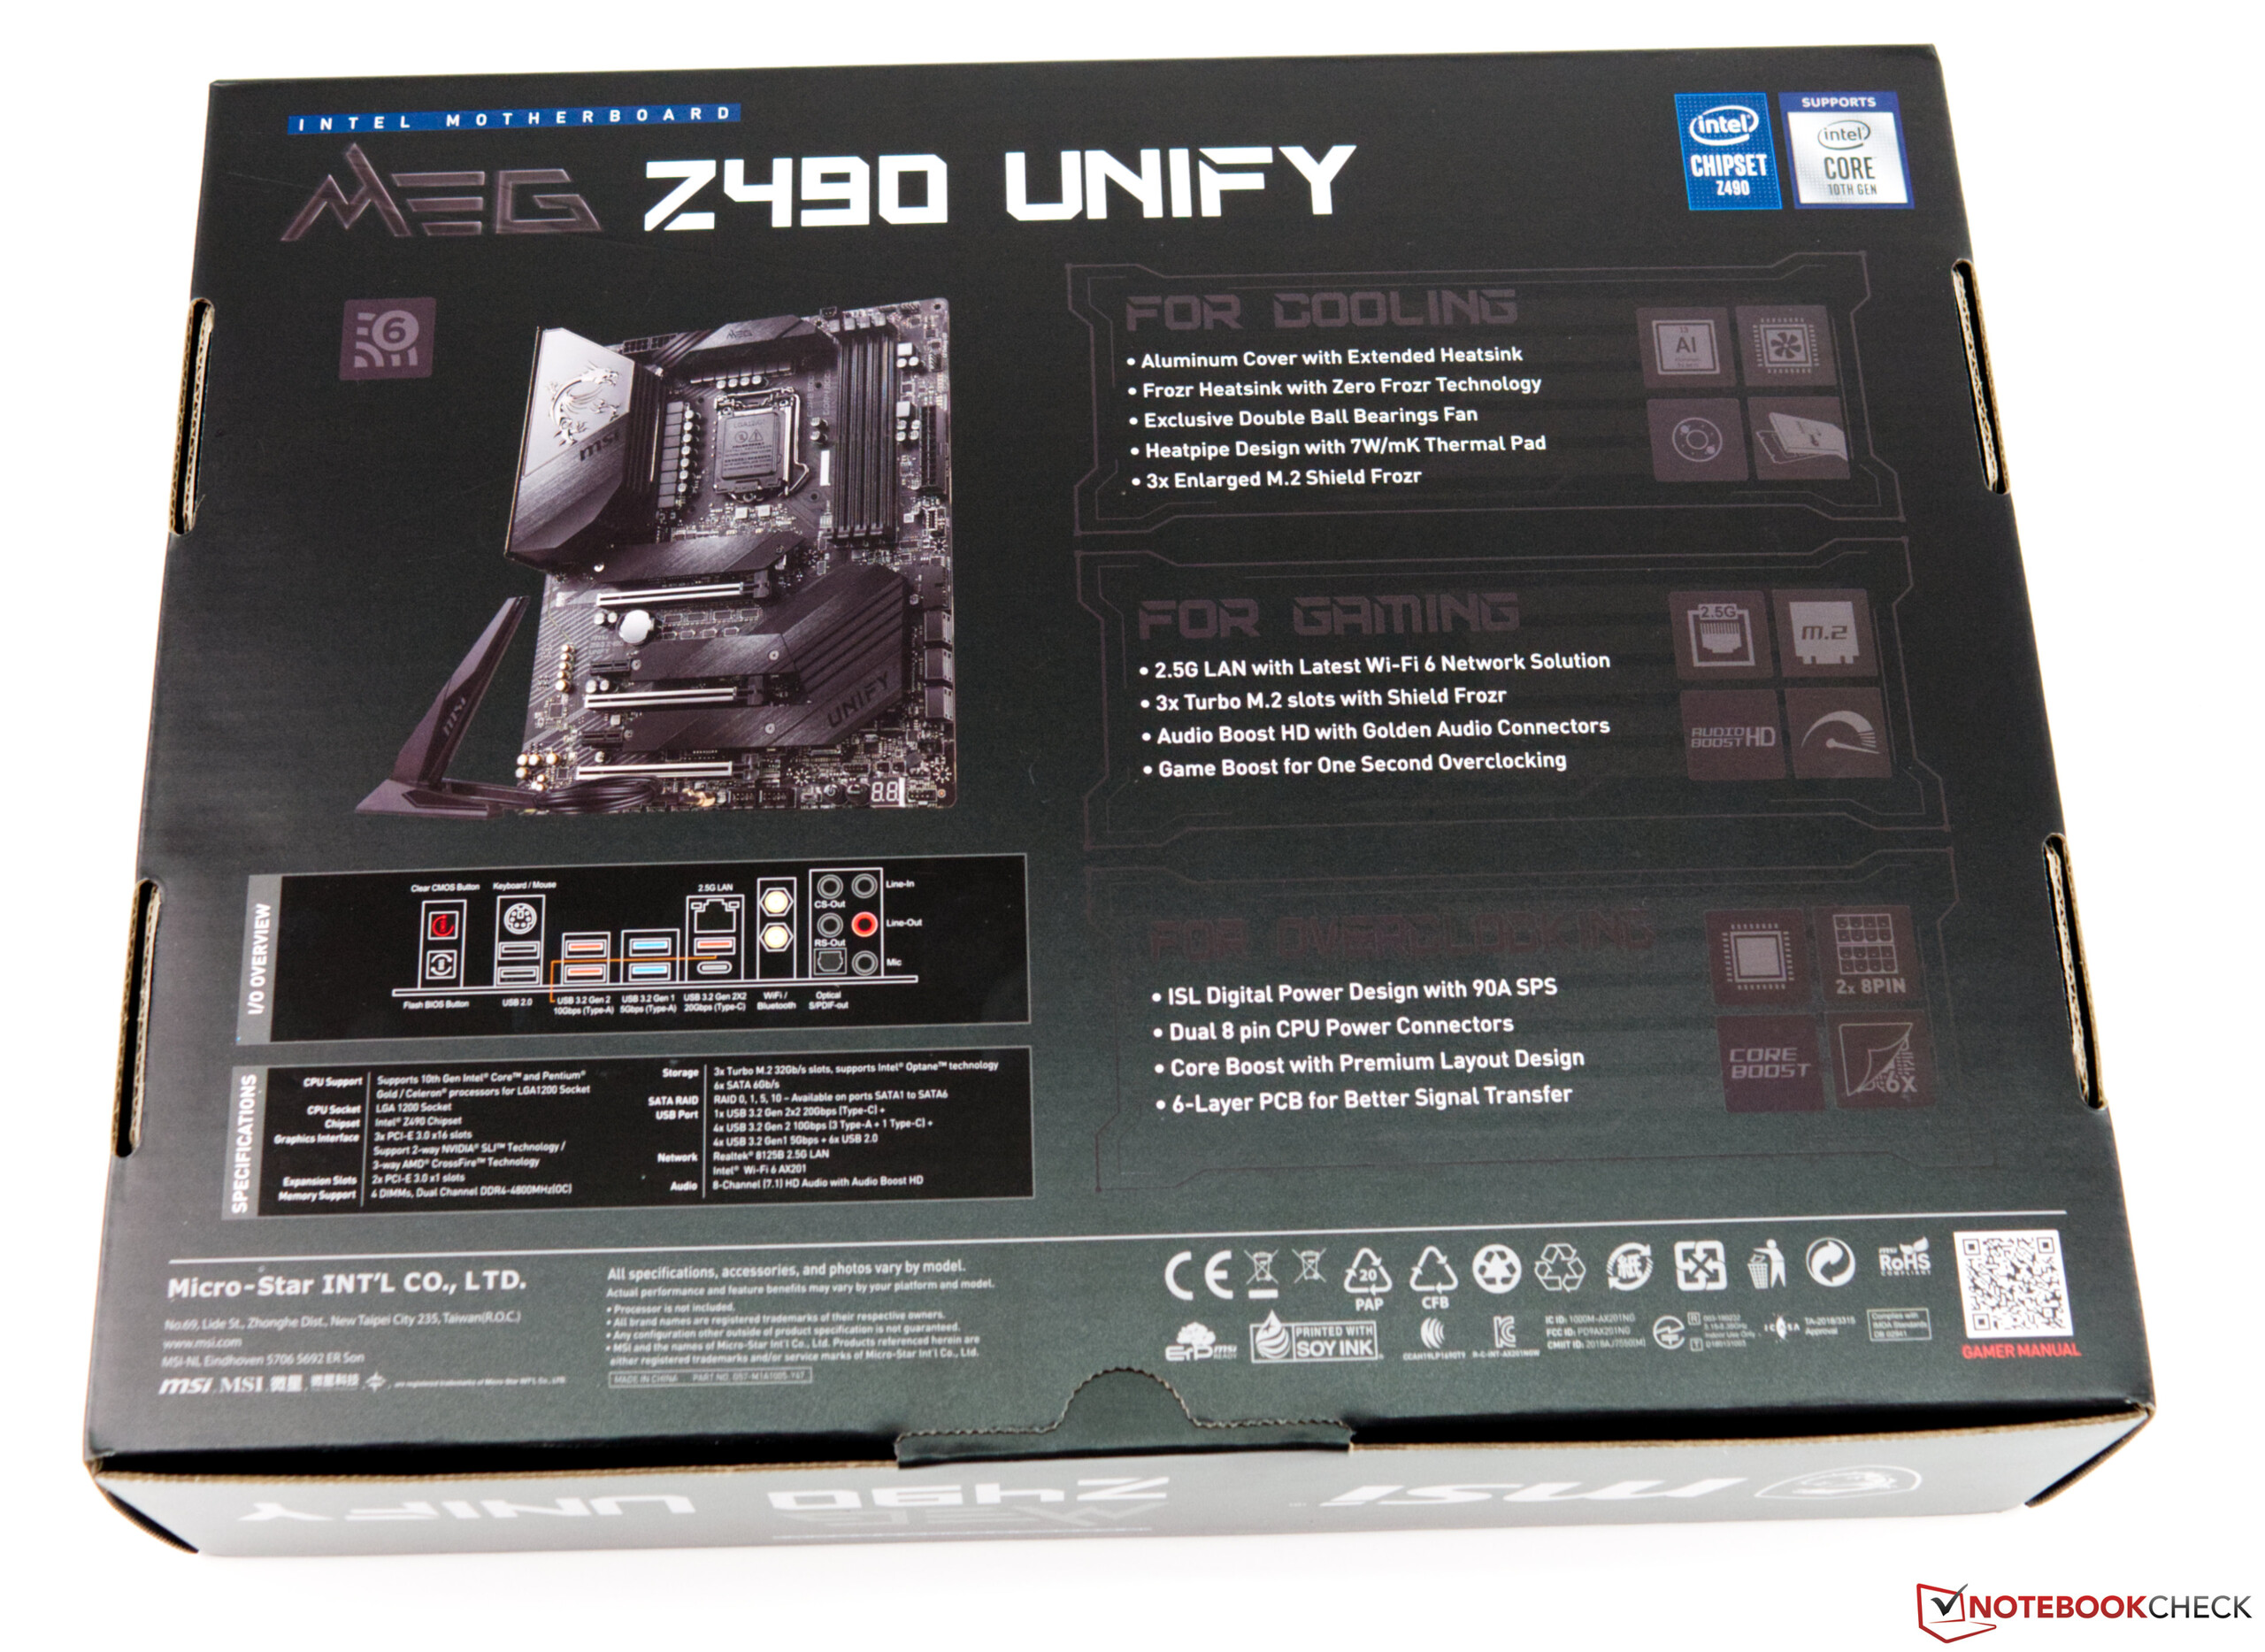
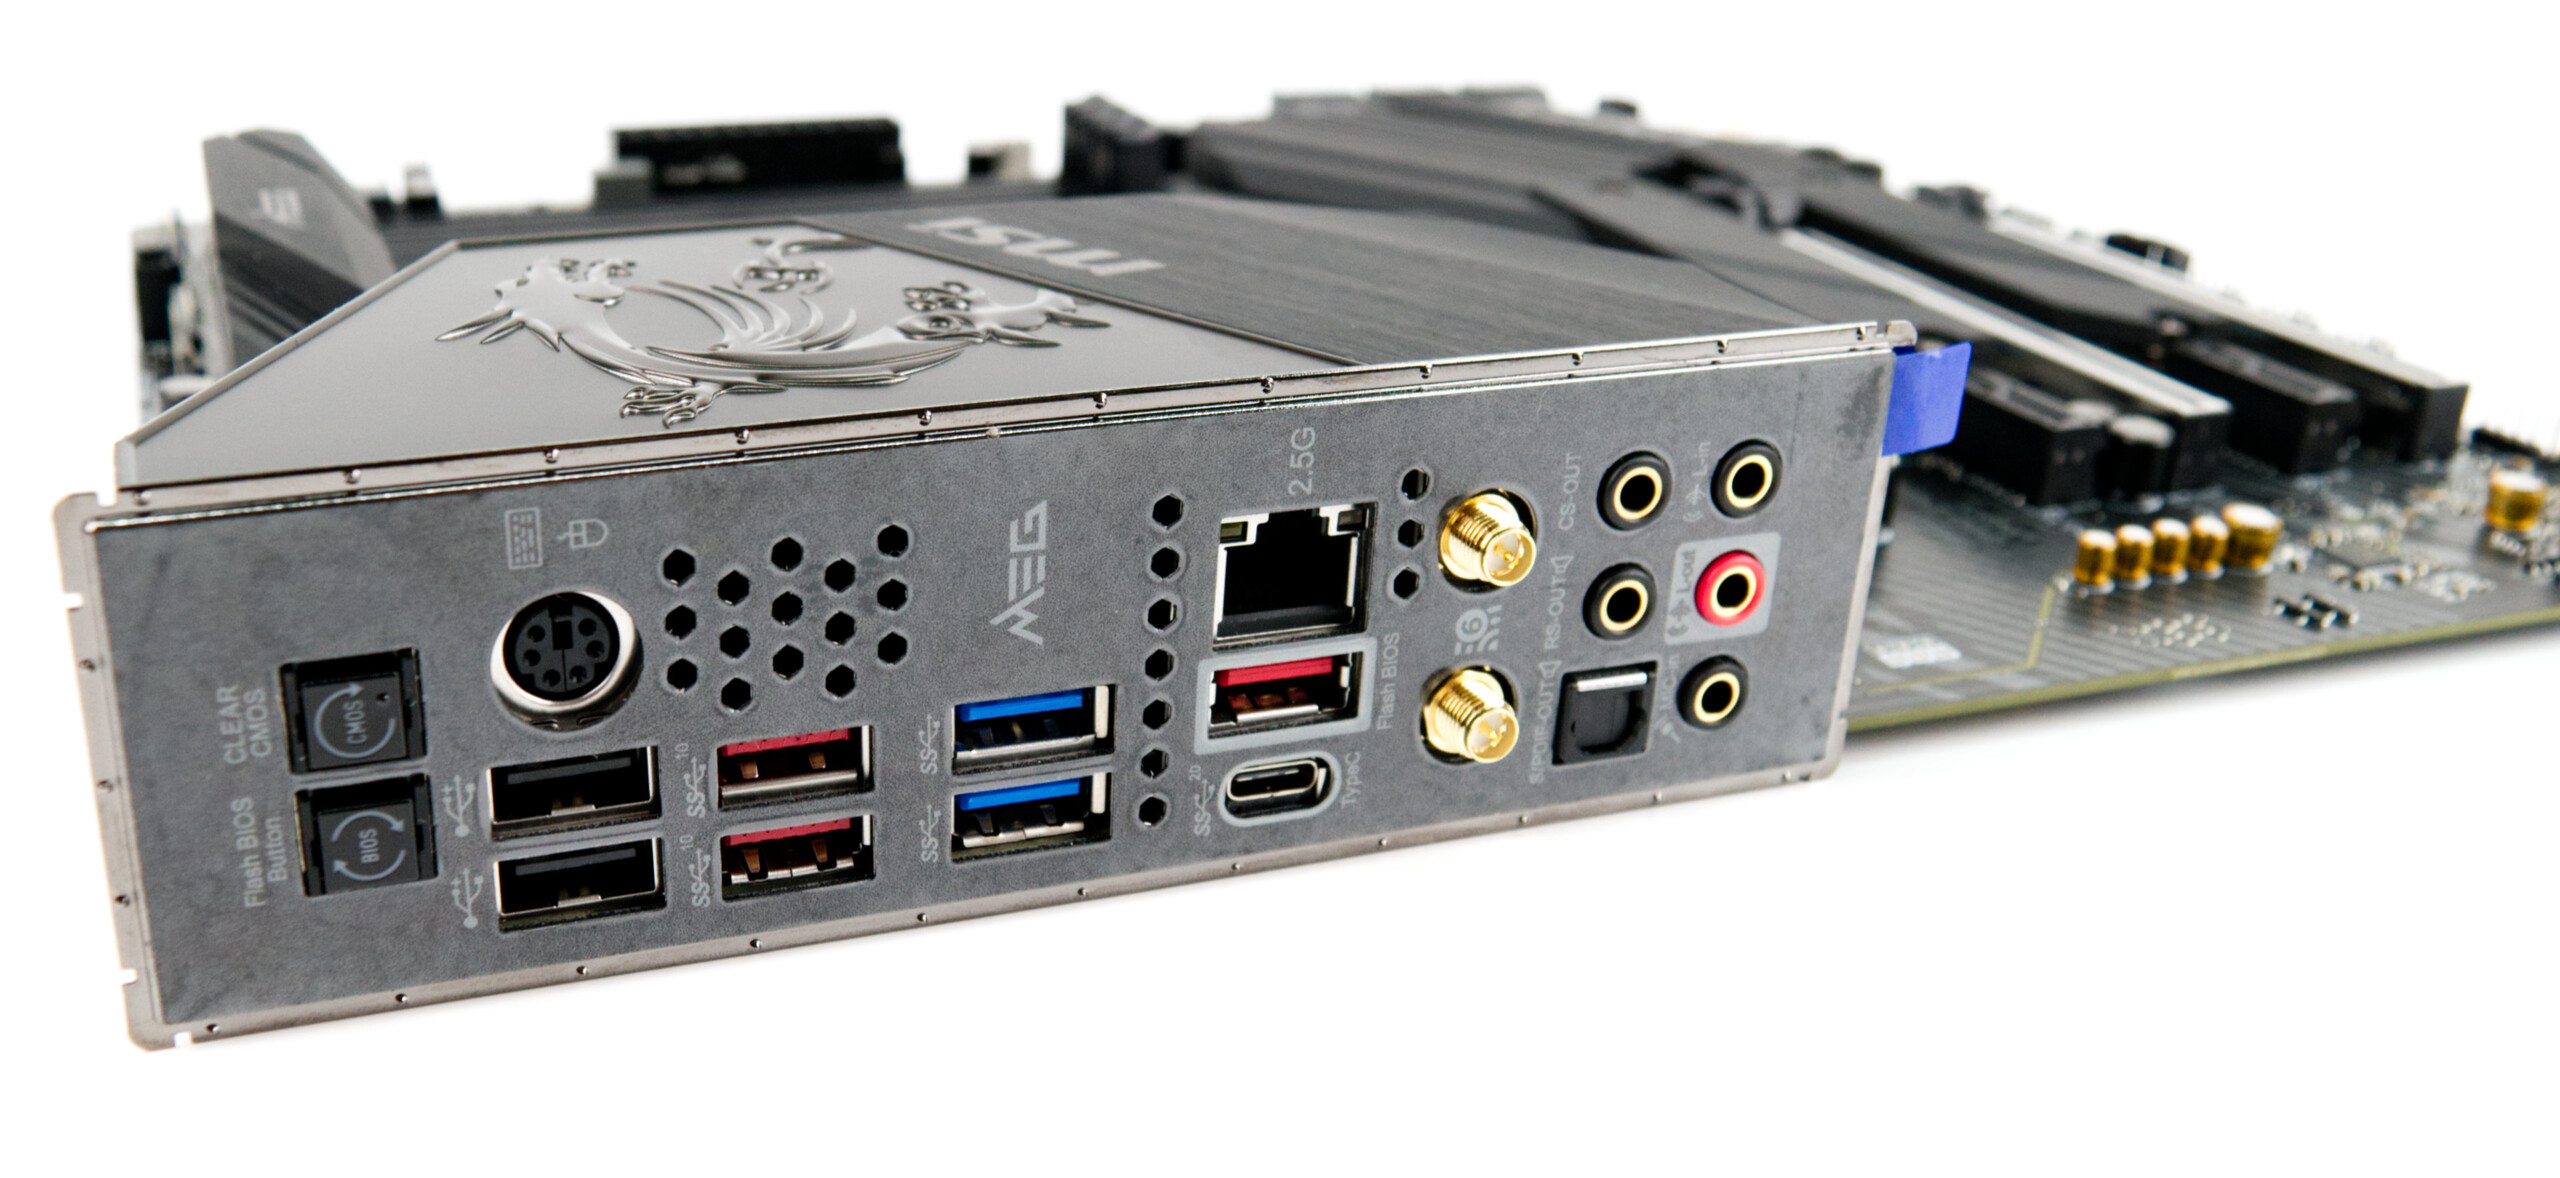
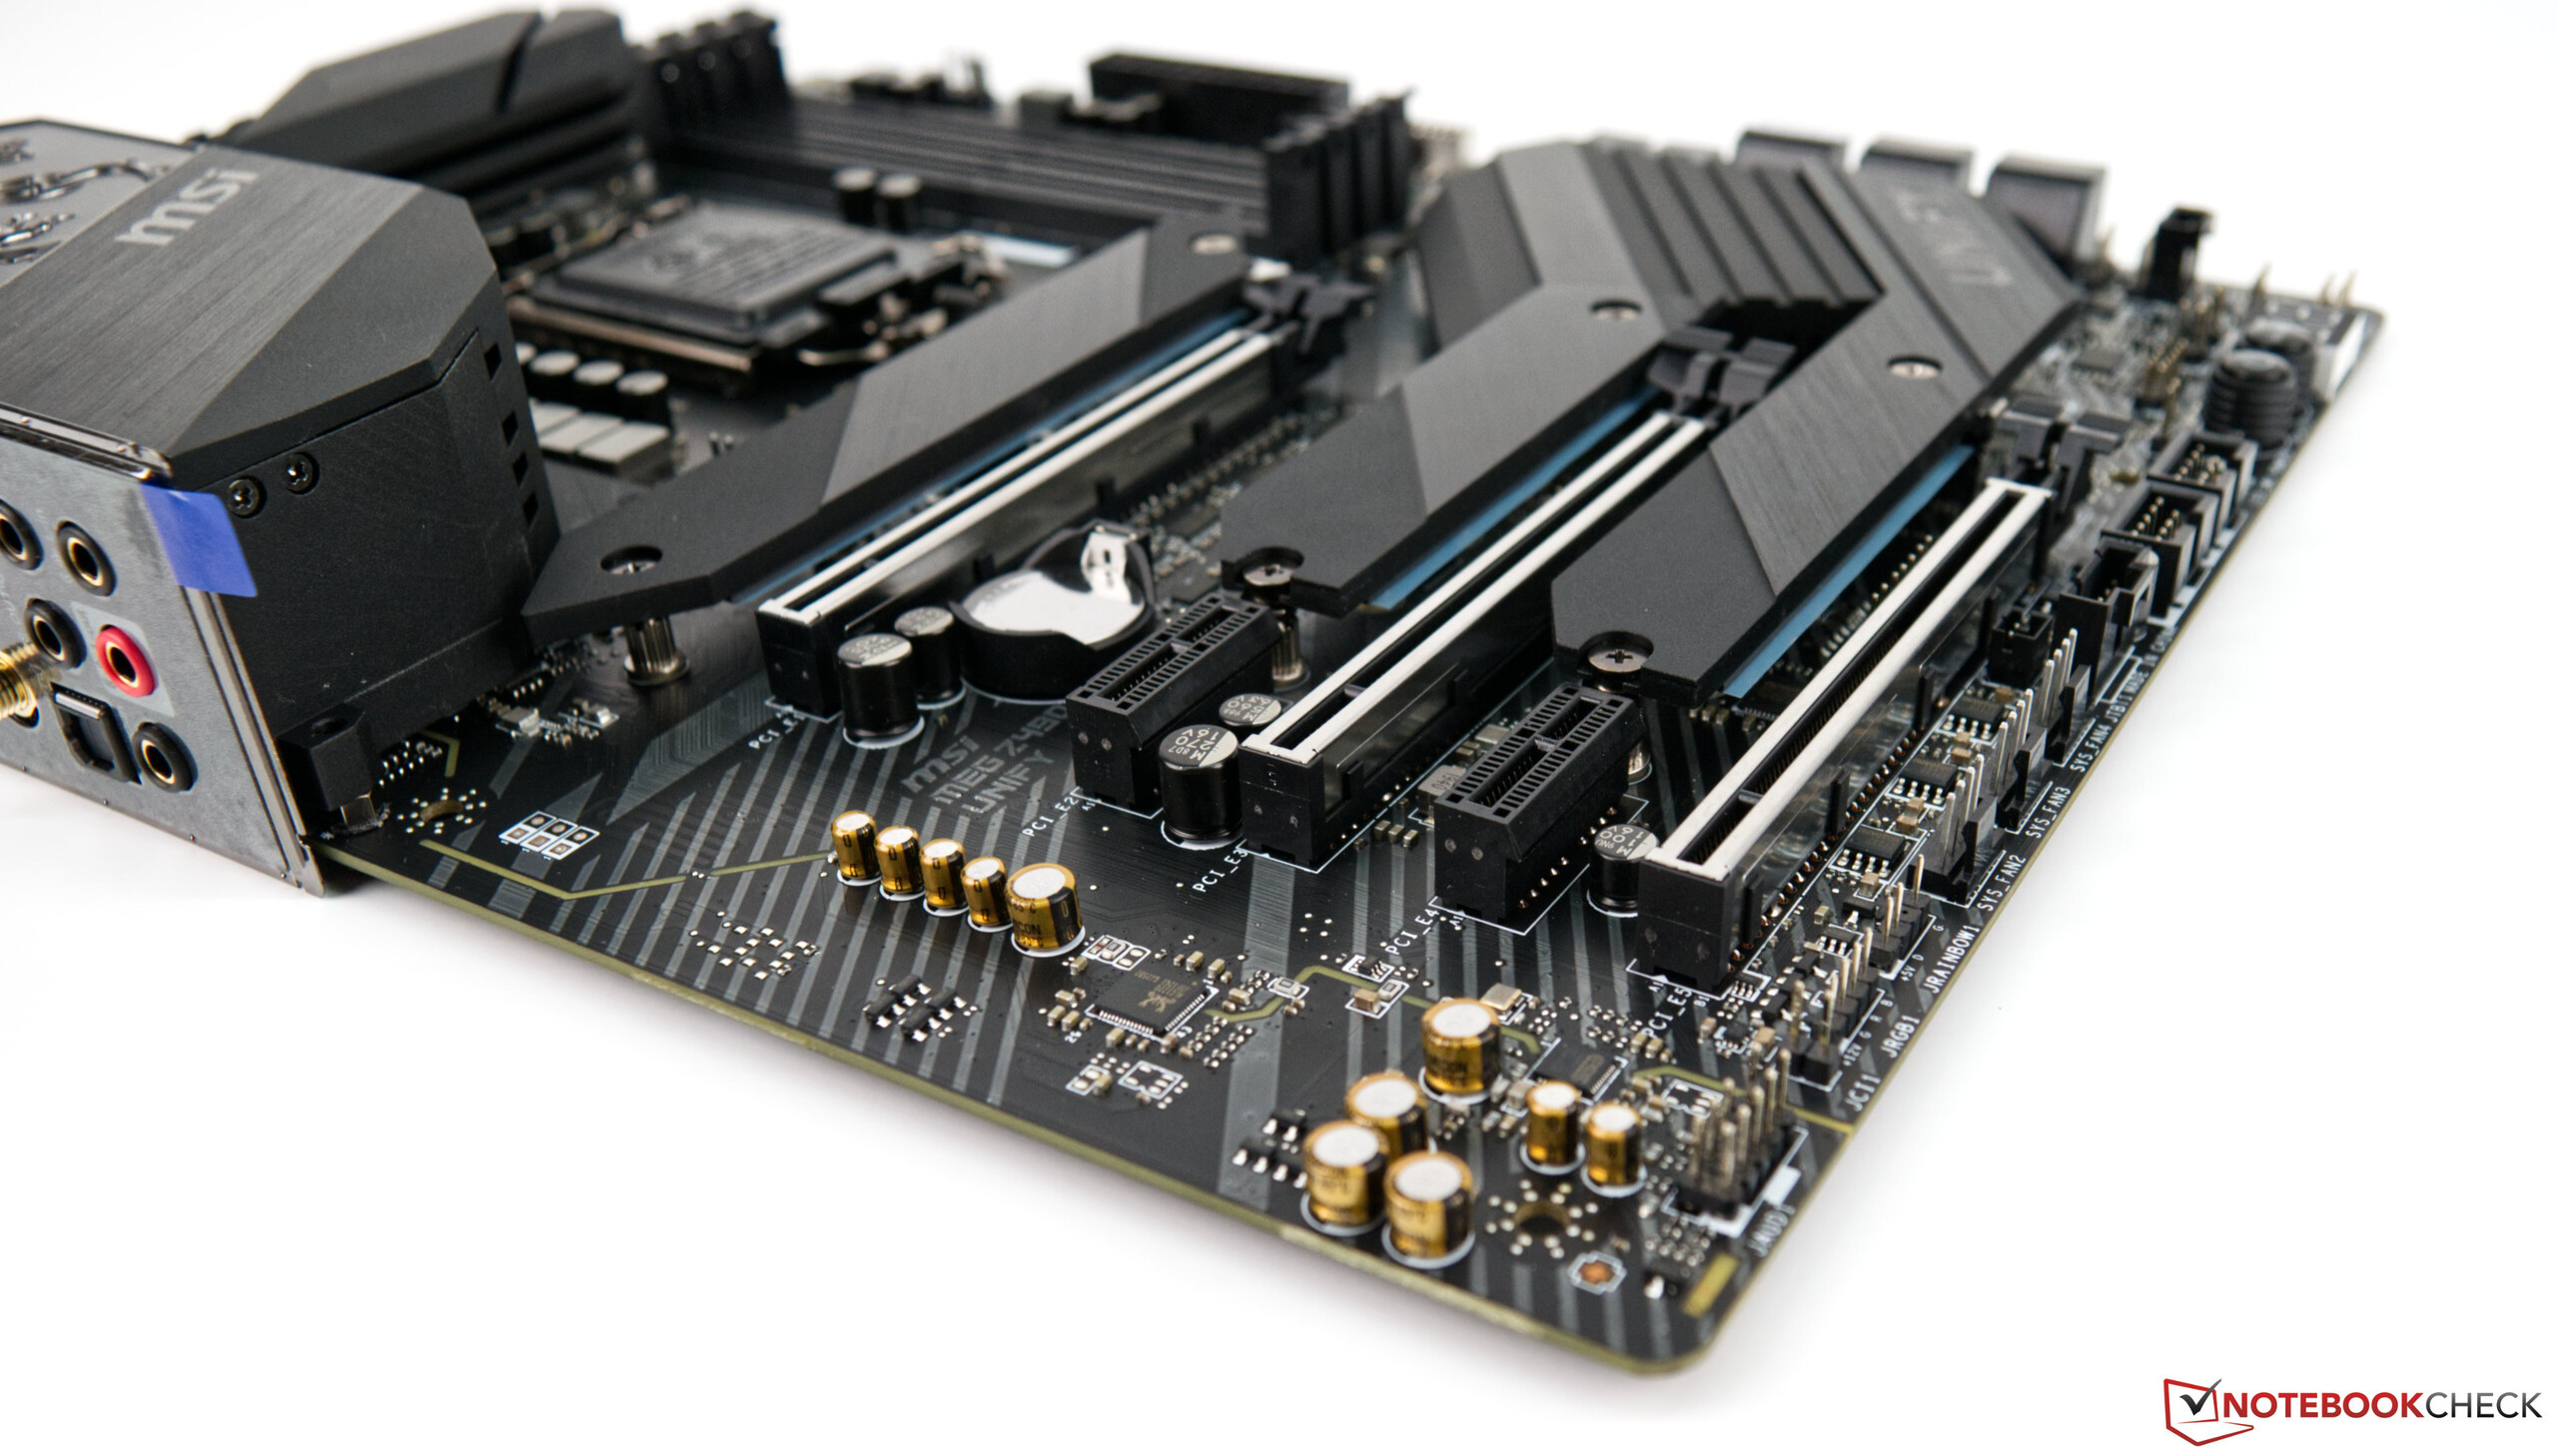
Abbiamo ricevuto la scheda madre Z490 Unify dal nostro partner MSI giusto in tempo per esaminare i nuovi processori Comet Lake-S. Siamo molto grati che MSI ci abbia prestato questa scheda madre. La scheda madre colpisce per la sua semplicità e rinuncia completamente all'illuminazione RGB, cosa che molti utenti possono apprezzare. La confezione contiene la scheda madre, un paio di cavi, antenne Wi-Fi, una guida rapida e un DVD con i driver. La scheda madre ATX ha tre slots per unità a stato solido M.2 e tre slots PCI Express 3.0 x16. Secondo MSI, i due slots superiori supportano il PCI Express 4.0, ma non sapremo per certo se questo è effettivamente il caso fino a quando non usciranno le CPU Rocket Lake-S. I chip Comet Lake-S non supportano ancora il PCIe 4.0. I quattro slot RAM supportano moduli DDR4 con clock fino a 4800 MHz. Inoltre, gli utenti possono anche collegare fino a sei unità SATA aggiuntive alla scheda madre.Ci sono 8 porte USB in totale, una delle quali funziona effettivamente a velocità USB 3.2 Gen 2x2 (20 GBit/s). Gli overclocker estremi saranno molto contenti di vedere una porta PS2 sulla scheda madre. Gli utenti possono trasferire i dati attraverso la porta Ethernet a 2,5 GBit/s. Quando si parla di rete wireless, lo Z490 Unify è a prova di futuro, perché supporta il Wi-Fi 6.
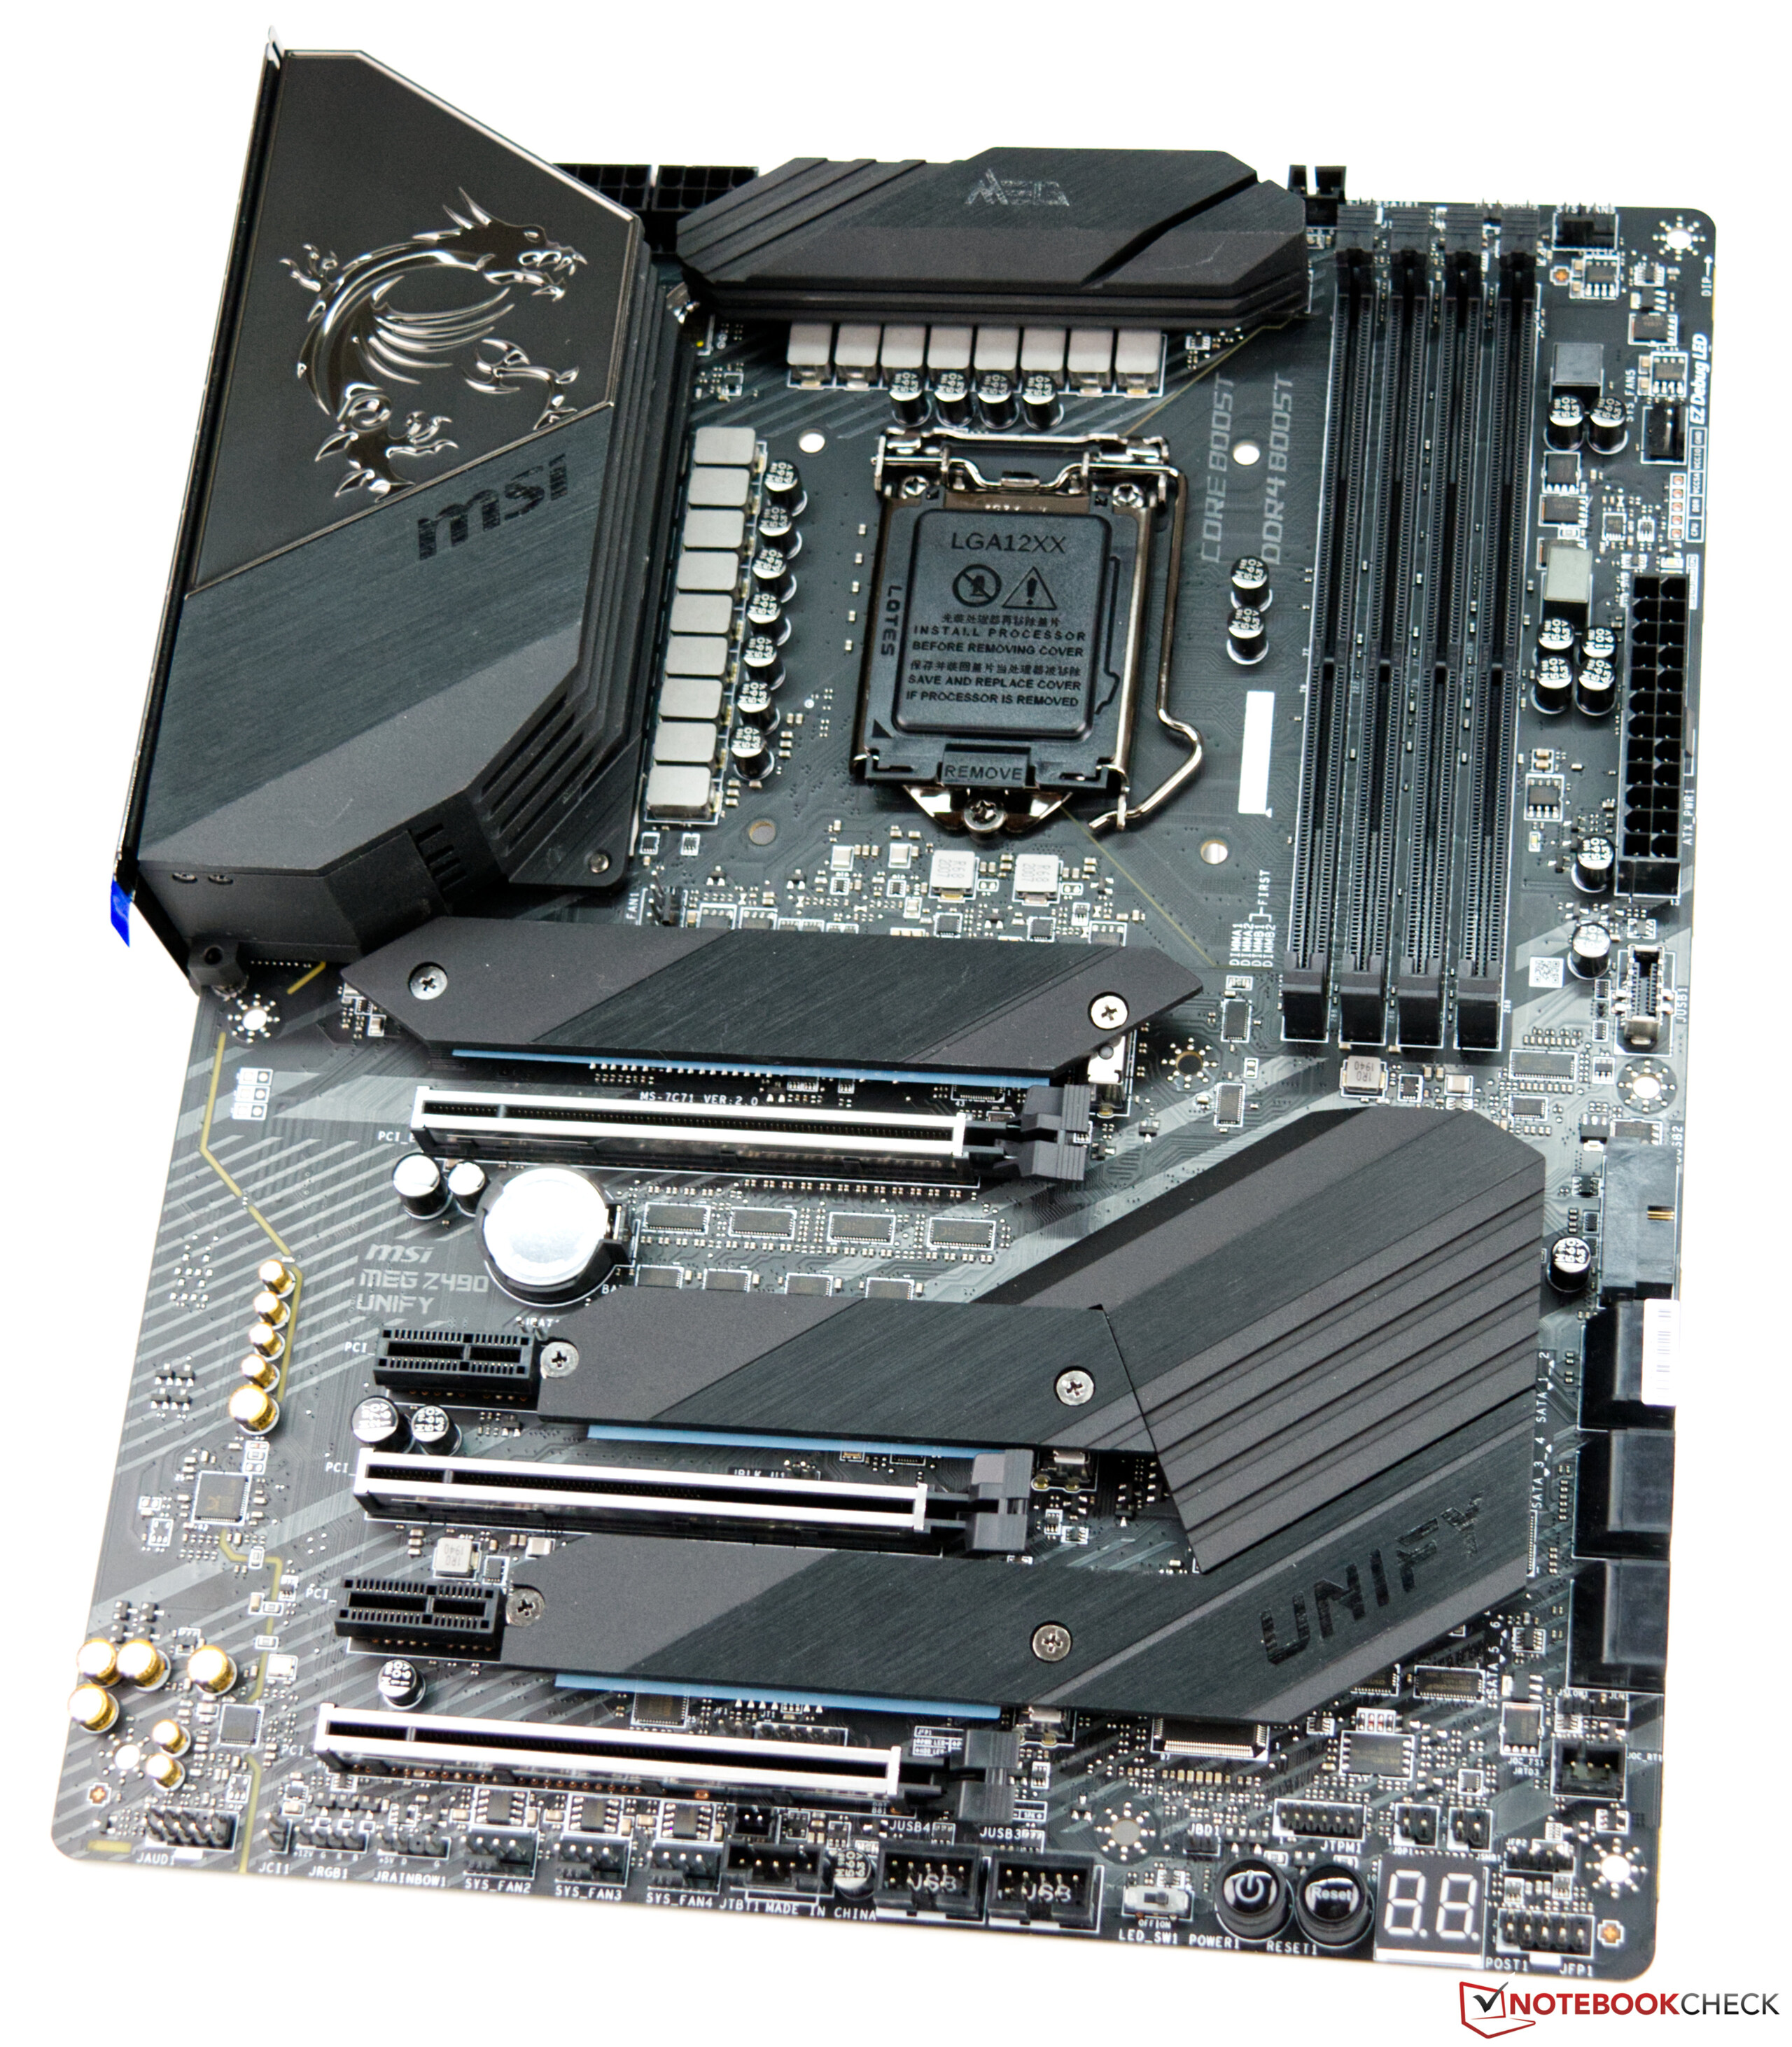
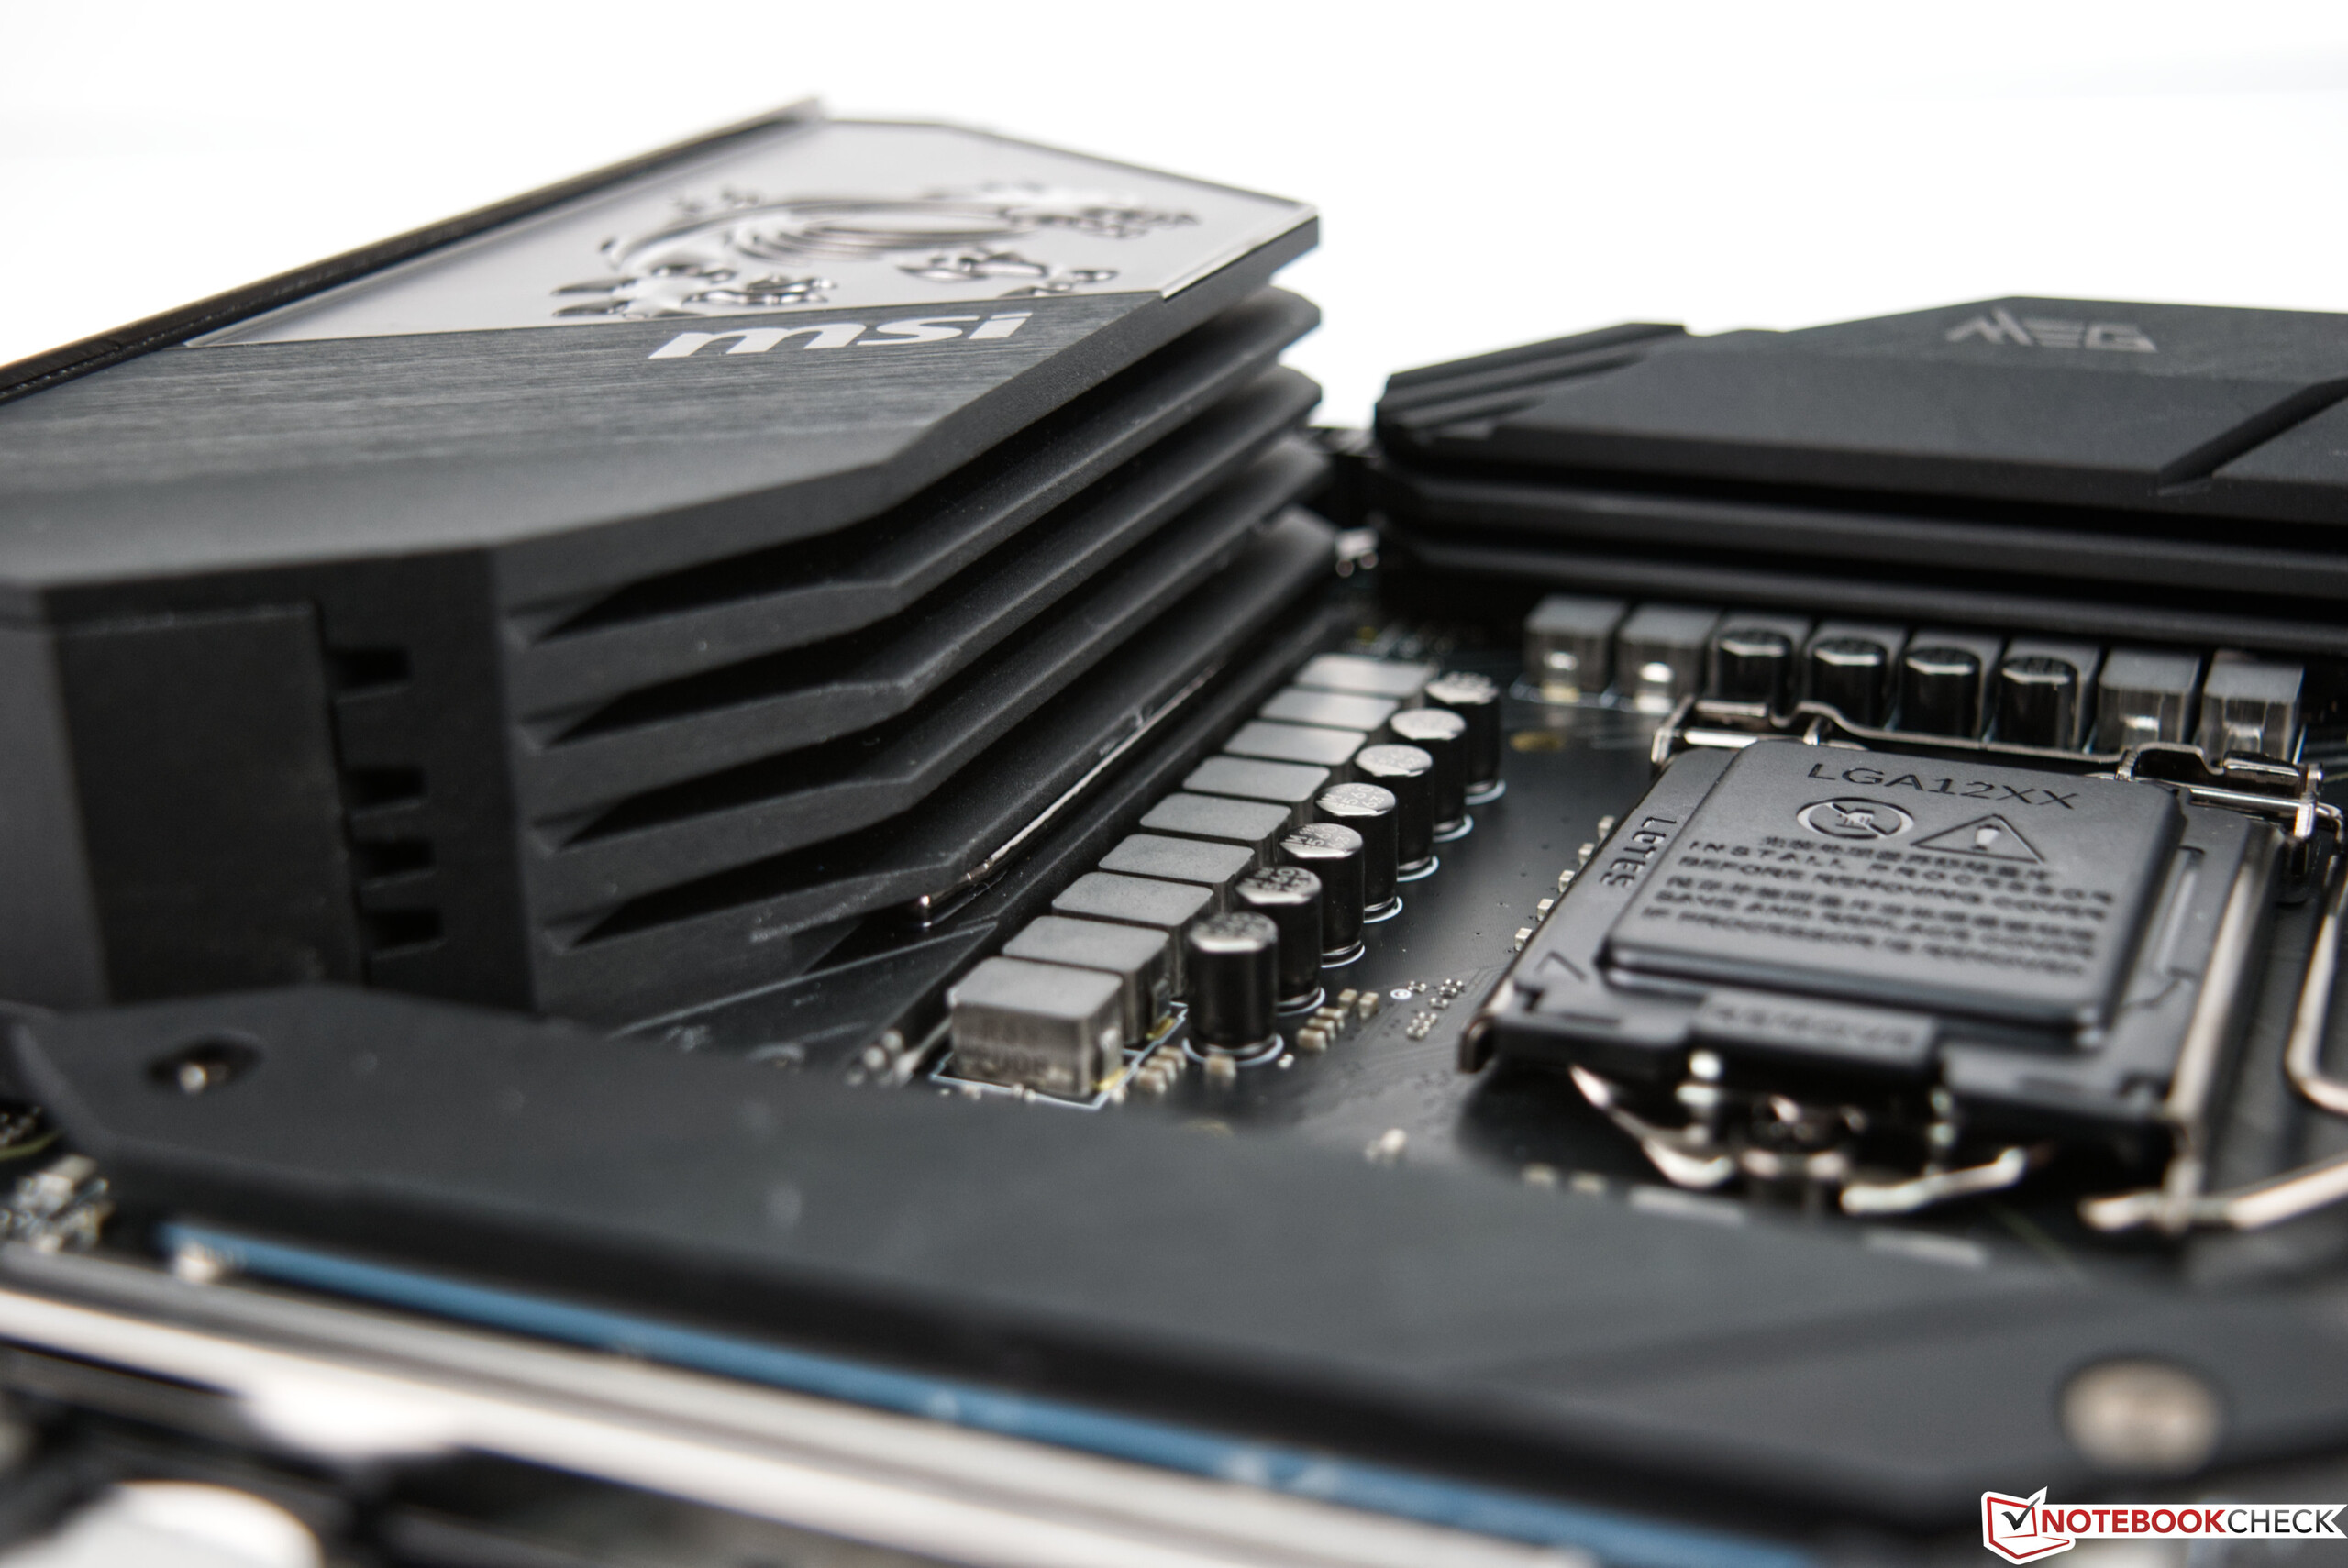
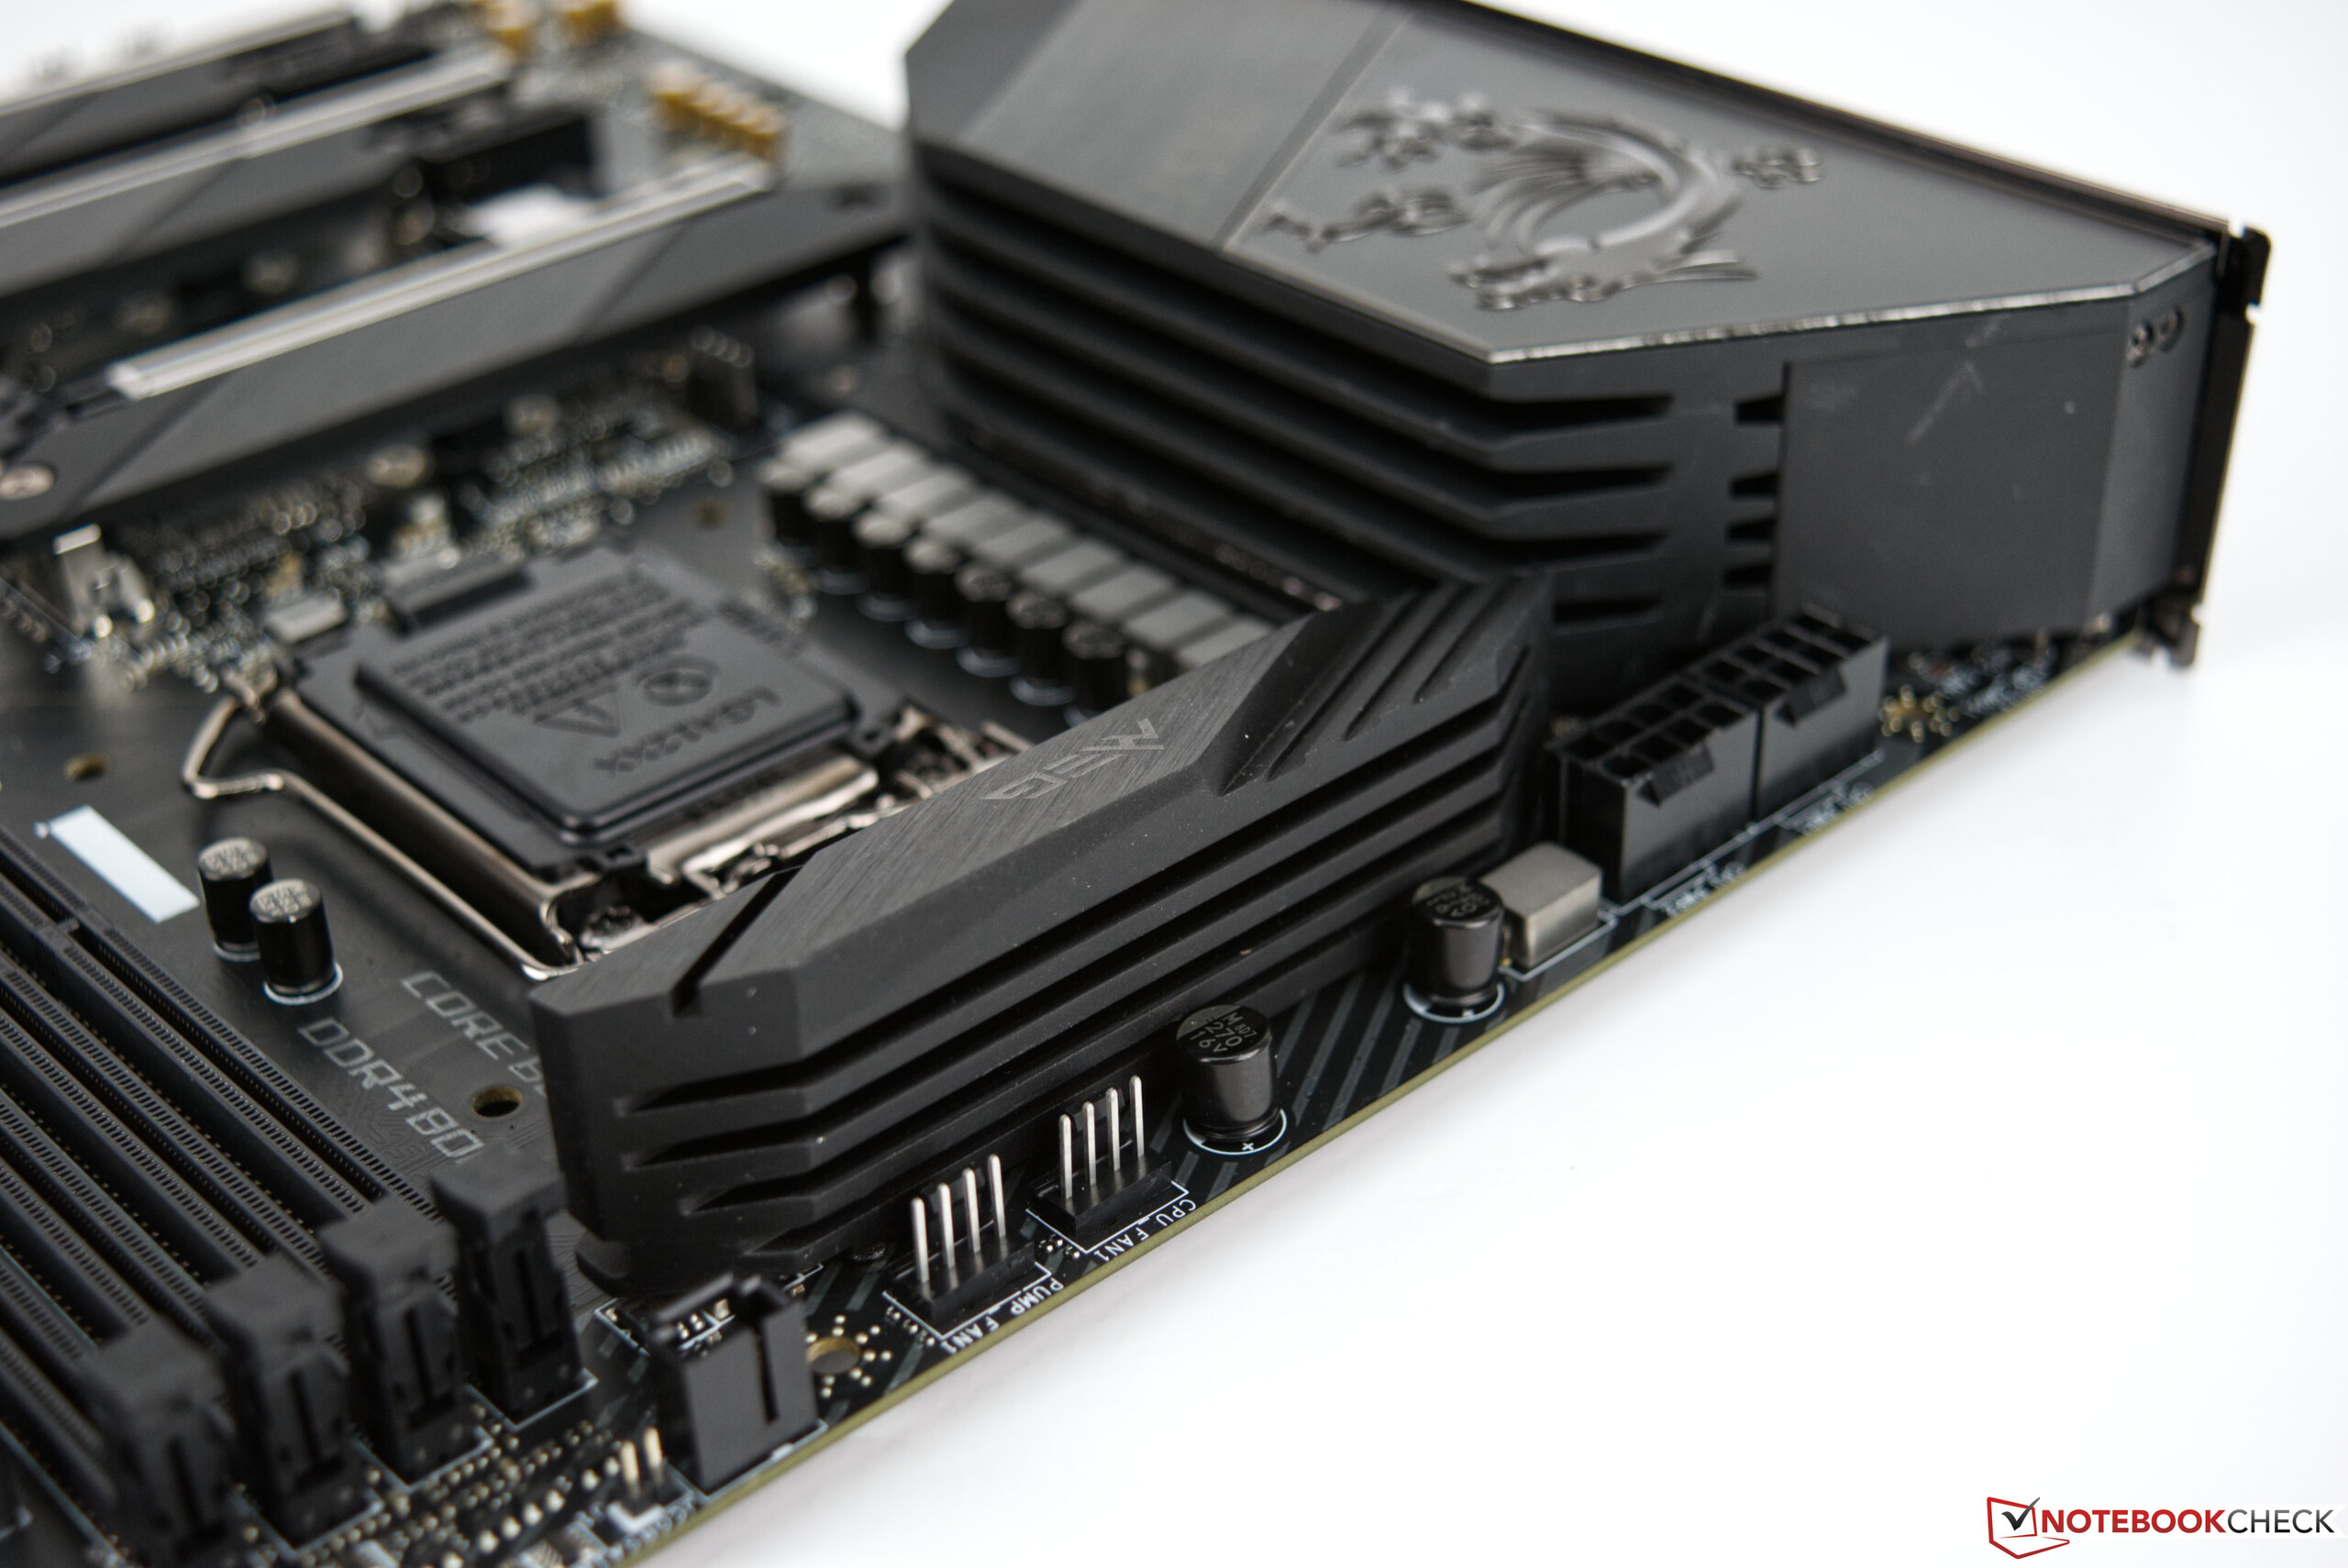
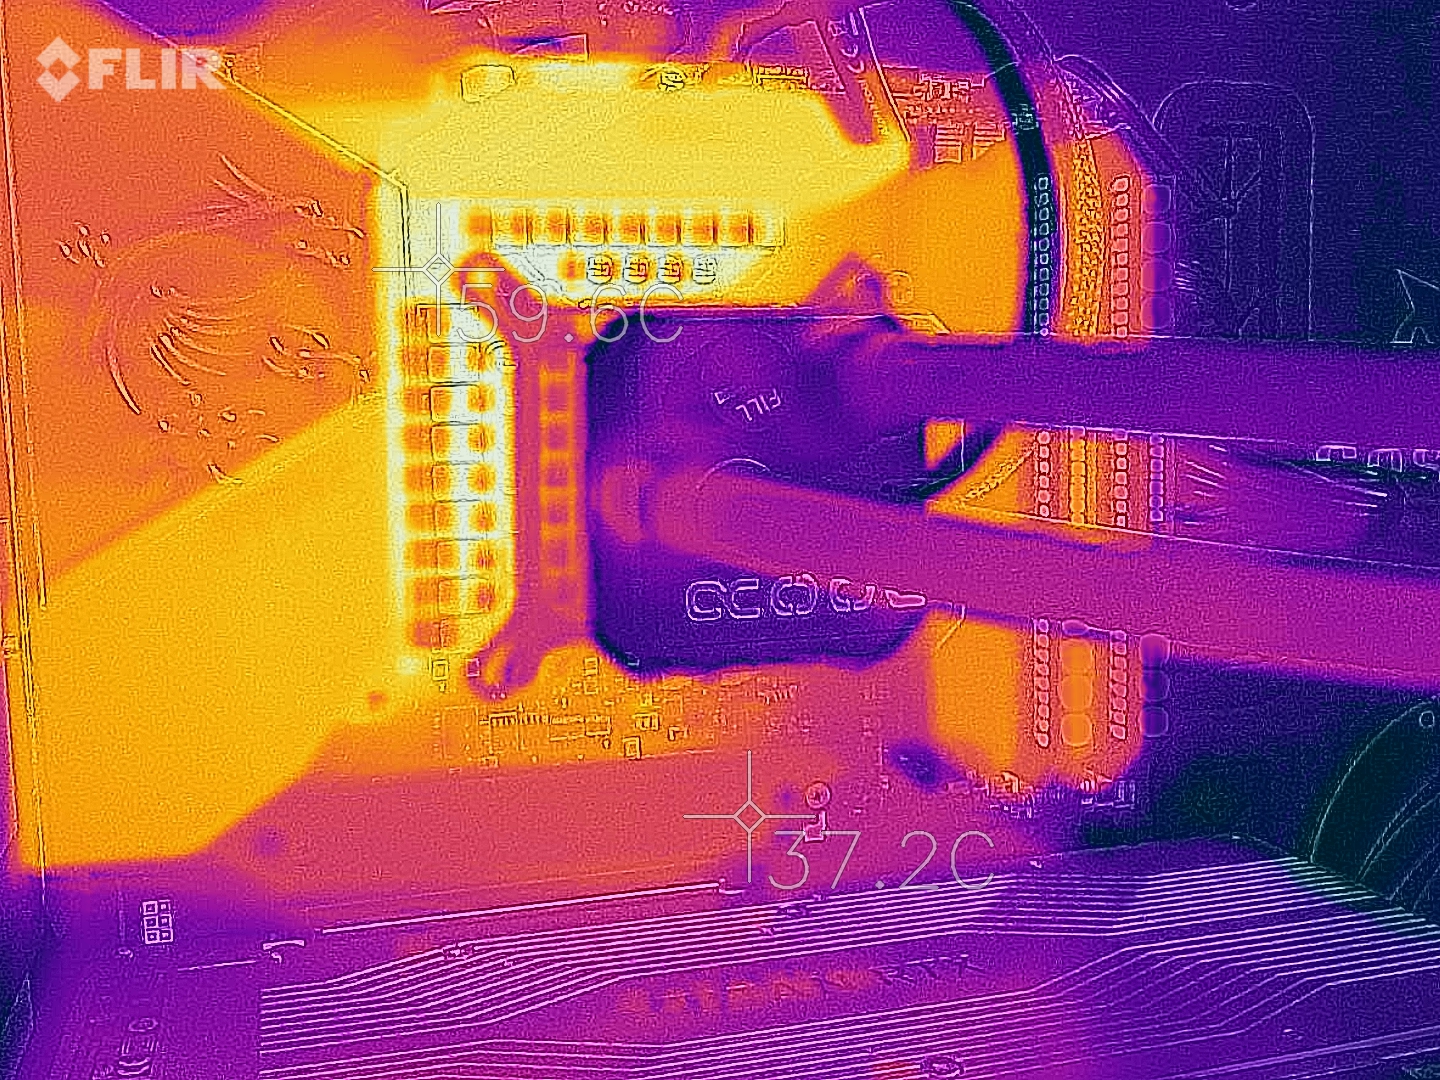
La scheda madre è dotata di un sistema di alimentazione a 16+1 fasi e di due connettori di alimentazione a 8 pin. Un enorme dissipatore di calore con un tubo di calore è collegato ai moduli regolatori di tensione, che sono responsabili del mantenimento di un'alimentazione costante. Inoltre, c'è una piccola ventola dietro lo scudo I/O, che ha lo scopo di raffreddare i VRM. È fondamentalmente inudibile durante il funzionamento. Le ventole del chipset X570 sono molto più rumorose.
CPU Benchmarks
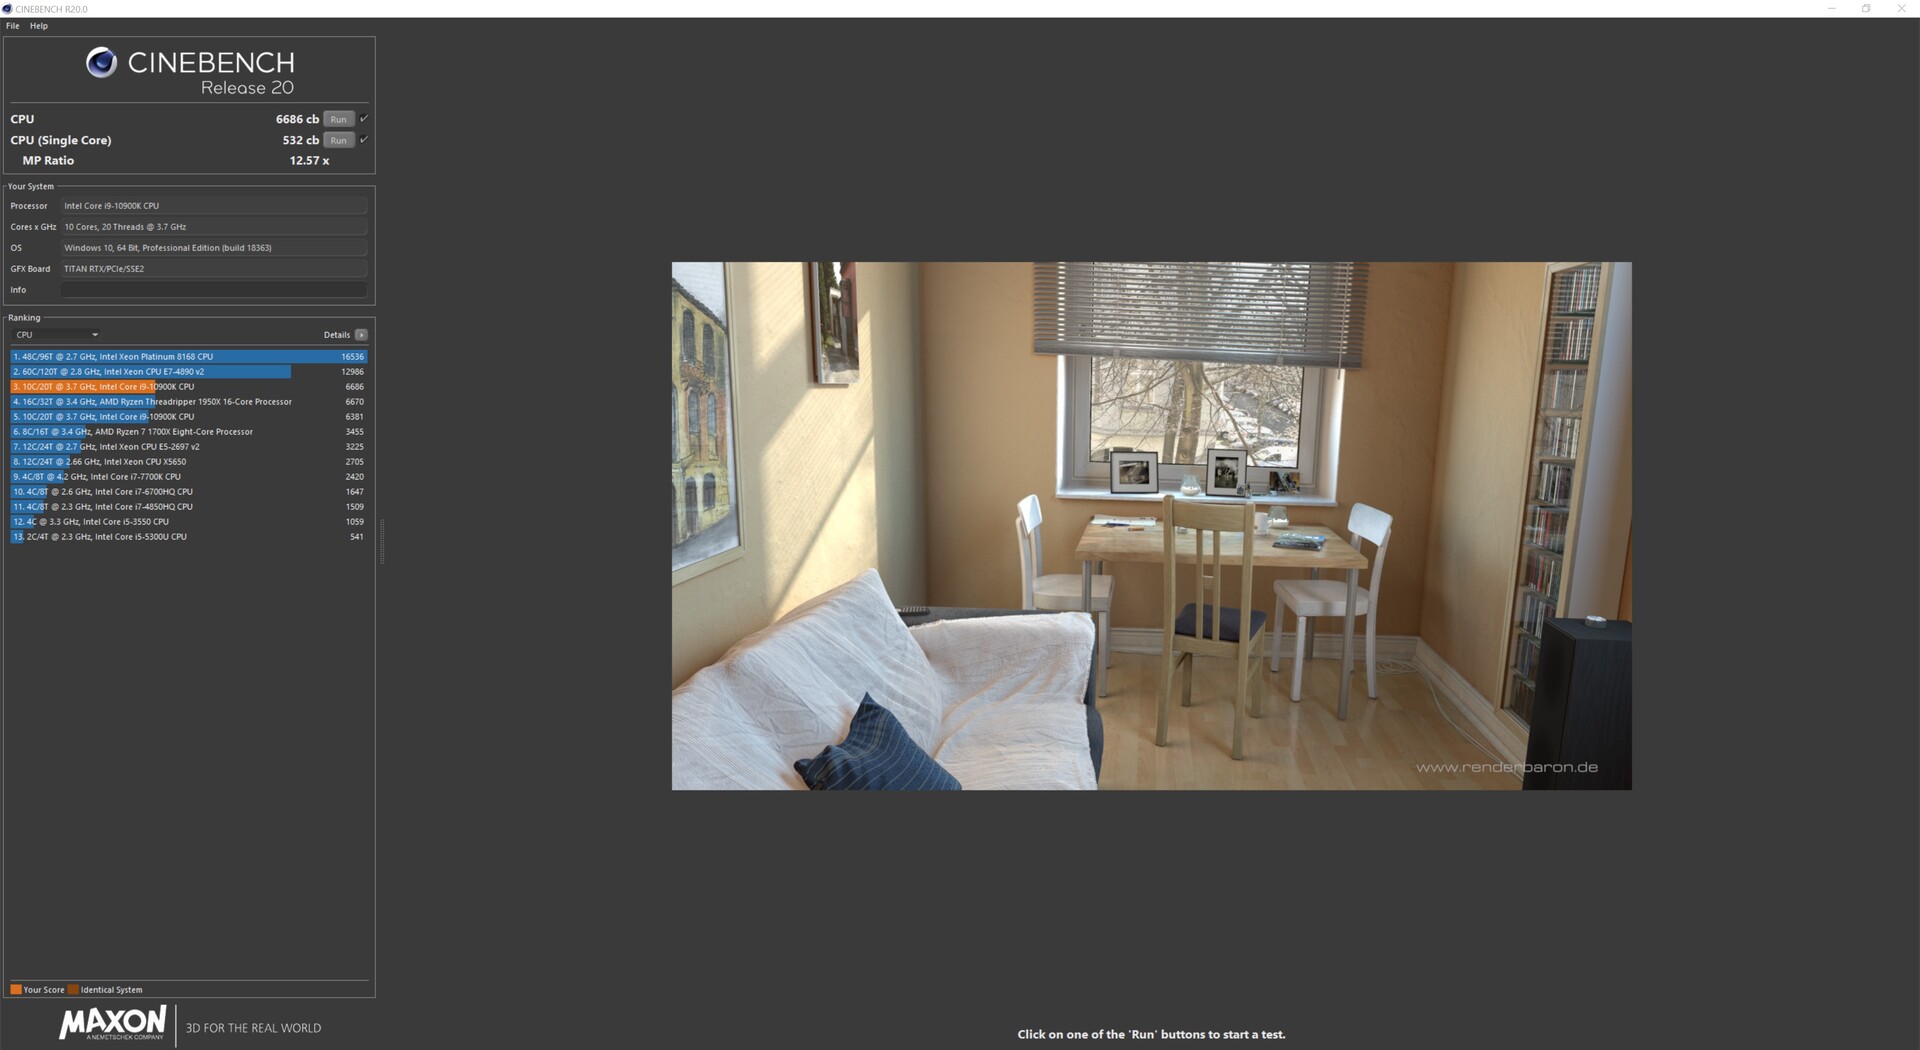
Il clock di base inferiore dell'Intel Core i9-10900K, se confrontato con l'Intel Core i9-9900KS, è compensato dal suo maggiore boost clock. Nei nostri benchmarks singlle core, la CPU a 10 cores ha guadagnato il primo posto, ma con un margine piuttosto sottile. Qui, l'Intel Core i5-10600K a 6 cores è legato al suo diretto predecessore.
La differenza di prestazioni è molto più facile da vedere nelle applicazioni multi-threaded. Qui, l'Intel Core i9-10900K beneficia notevolmente di due cores aggiuntivi. L'Intel Core i5-10600K è anche in grado di battere il suo diretto predecessore (Intel Core i5-9600K) nelle applicazioni con thread pesanti. In questo caso, il supporto Hyper-threading fa davvero la differenza. Tuttavia, il Ryzen 9 3950X a 16 core, il chip mainstream di punta di AMD, batte di gran lunga l'Intel Core i9-10900K.
Intel Core i5-10600K
Intel Core i9-10900K
| Cinebench R15 | |
| CPU Single 64Bit | |
| Intel Core i9-10900K | |
| Intel Core i9-9900KS | |
| AMD Ryzen 9 3950X | |
| AMD Ryzen 9 3900X | |
| Intel Core i5-10600K | |
| Intel Core i5-9600K | |
| CPU Multi 64Bit | |
| AMD Ryzen 9 3950X | |
| AMD Ryzen 9 3900X | |
| Intel Core i9-10900K | |
| Intel Core i9-9900KS | |
| Intel Core i5-10600K | |
| Intel Core i5-9600K | |
| Cinebench R20 | |
| CPU (Single Core) | |
| Intel Core i9-10900K | |
| AMD Ryzen 9 3950X | |
| AMD Ryzen 9 3900X | |
| Intel Core i9-9900KS | |
| Intel Core i5-10600K | |
| CPU (Multi Core) | |
| AMD Ryzen 9 3950X | |
| AMD Ryzen 9 3900X | |
| Intel Core i9-10900K | |
| Intel Core i9-9900KS | |
| Intel Core i5-10600K | |
| Cinebench R11.5 | |
| CPU Single 64Bit | |
| Intel Core i9-10900K | |
| Intel Core i9-9900KS | |
| AMD Ryzen 9 3950X | |
| AMD Ryzen 9 3900X | |
| Intel Core i5-9600K | |
| Intel Core i5-10600K | |
| CPU Multi 64Bit | |
| AMD Ryzen 9 3950X | |
| AMD Ryzen 9 3900X | |
| Intel Core i9-10900K | |
| Intel Core i9-9900KS | |
| Intel Core i5-10600K | |
| Intel Core i5-9600K | |
| Cinebench R10 | |
| Rendering Single CPUs 64Bit | |
| Intel Core i9-9900KS | |
| Intel Core i9-10900K | |
| AMD Ryzen 9 3950X | |
| AMD Ryzen 9 3900X | |
| Intel Core i5-10600K | |
| Intel Core i5-9600K | |
| Rendering Multiple CPUs 64Bit | |
| AMD Ryzen 9 3950X | |
| Intel Core i9-10900K | |
| AMD Ryzen 9 3900X | |
| Intel Core i9-9900KS | |
| Intel Core i5-10600K | |
| Intel Core i5-9600K | |
| Blender - v2.79 BMW27 CPU | |
| Intel Core i5-9600K | |
| Intel Core i5-10600K | |
| Intel Core i9-9900KS | |
| Intel Core i9-10900K | |
| AMD Ryzen 9 3900X | |
| AMD Ryzen 9 3950X | |
| wPrime 2.10 | |
| 32m | |
| Intel Core i5-9600K | |
| Intel Core i5-10600K | |
| AMD Ryzen 9 3950X | |
| Intel Core i9-9900KS | |
| Intel Core i9-10900K | |
| AMD Ryzen 9 3900X | |
| 1024m | |
| Intel Core i5-9600K | |
| Intel Core i5-10600K | |
| Intel Core i9-9900KS | |
| AMD Ryzen 9 3900X | |
| Intel Core i9-10900K | |
| AMD Ryzen 9 3950X | |
| X264 HD Benchmark 4.0 | |
| Pass 1 | |
| Intel Core i9-10900K | |
| Intel Core i9-9900KS | |
| AMD Ryzen 9 3950X | |
| Intel Core i5-10600K | |
| Intel Core i5-9600K | |
| Pass 2 | |
| AMD Ryzen 9 3950X | |
| Intel Core i9-10900K | |
| Intel Core i9-9900KS | |
| Intel Core i5-10600K | |
| Intel Core i5-9600K | |
| WinRAR - Result | |
| Intel Core i9-10900K | |
| Intel Core i9-9900KS | |
| AMD Ryzen 9 3900X | |
| AMD Ryzen 9 3950X | |
| Intel Core i5-10600K | |
| Intel Core i5-9600K | |
| TrueCrypt | |
| AES Mean 100MB | |
| Intel Core i9-10900K | |
| Intel Core i9-9900KS | |
| AMD Ryzen 9 3950X | |
| AMD Ryzen 9 3900X | |
| Intel Core i5-10600K | |
| Intel Core i5-9600K | |
| Twofish Mean 100MB | |
| AMD Ryzen 9 3950X | |
| AMD Ryzen 9 3900X | |
| Intel Core i9-10900K | |
| Intel Core i9-9900KS | |
| Intel Core i5-10600K | |
| Intel Core i5-9600K | |
| Serpent Mean 100MB | |
| AMD Ryzen 9 3950X | |
| AMD Ryzen 9 3900X | |
| Intel Core i9-10900K | |
| Intel Core i9-9900KS | |
| Intel Core i5-10600K | |
| Intel Core i5-9600K | |
| Geekbench 5.5 | |
| Multi-Core | |
| AMD Ryzen 9 3950X | |
| Intel Core i9-10900K | |
| AMD Ryzen 9 3900X | |
| Intel Core i5-10600K | |
| Intel Core i5-9600K | |
| Single-Core | |
| Intel Core i9-10900K | |
| AMD Ryzen 9 3950X | |
| Intel Core i5-10600K | |
| AMD Ryzen 9 3900X | |
| Intel Core i5-9600K | |
| Geekbench 5.0 | |
| 5.0 Multi-Core | |
| AMD Ryzen 9 3950X | |
| Intel Core i9-10900K | |
| AMD Ryzen 9 3900X | |
| Intel Core i5-10600K | |
| 5.0 Single-Core | |
| Intel Core i9-10900K | |
| AMD Ryzen 9 3950X | |
| Intel Core i5-10600K | |
| AMD Ryzen 9 3900X | |
| Geekbench 4.4 | |
| 64 Bit Single-Core Score | |
| Intel Core i9-10900K | |
| Intel Core i9-9900KS | |
| Intel Core i5-9600K | |
| Intel Core i5-10600K | |
| AMD Ryzen 9 3950X | |
| AMD Ryzen 9 3900X | |
| 64 Bit Multi-Core Score | |
| AMD Ryzen 9 3950X | |
| Intel Core i9-10900K | |
| AMD Ryzen 9 3900X | |
| Intel Core i9-9900KS | |
| Intel Core i5-10600K | |
| Intel Core i5-9600K | |
| 3DMark 11 - 1280x720 Performance Physics | |
| Intel Core i9-10900K | |
| AMD Ryzen 9 3950X | |
| AMD Ryzen 9 3900X | |
| Intel Core i9-9900KS | |
| Intel Core i5-10600K | |
| Intel Core i5-9600K | |
| 7-Zip 18.03 | |
| 7z b 4 | |
| AMD Ryzen 9 3950X | |
| AMD Ryzen 9 3900X | |
| Intel Core i9-10900K | |
| Intel Core i9-9900KS | |
| Intel Core i5-10600K | |
| 7z b 4 -mmt1 | |
| Intel Core i9-10900K | |
| Intel Core i9-9900KS | |
| AMD Ryzen 9 3950X | |
| Intel Core i5-10600K | |
| AMD Ryzen 9 3900X | |
| HWBOT x265 Benchmark v2.2 - 4k Preset | |
| Intel Core i9-10900K | |
| Intel Core i9-9900KS | |
| AMD Ryzen 9 3950X | |
| Intel Core i5-10600K | |
| Intel Core i5-9600K | |
| R Benchmark 2.5 - Overall mean | |
| Intel Core i5-10600K | |
| AMD Ryzen 9 3900X | |
| Intel Core i9-10900K | |
| AMD Ryzen 9 3950X | |
| LibreOffice - 20 Documents To PDF | |
| Intel Core i9-10900K | |
| AMD Ryzen 9 3900X | |
| AMD Ryzen 9 3950X | |
| Intel Core i5-10600K | |
| WebXPRT 3 - Overall | |
| Intel Core i9-10900K | |
| AMD Ryzen 9 3950X | |
| Intel Core i5-10600K | |
| Mozilla Kraken 1.1 - Total | |
| Intel Core i5-10600K | |
| Intel Core i9-10900K | |
| AMD Ryzen 9 3950X | |
| 3DMark | |
| 3840x2160 Fire Strike Ultra Physics | |
| AMD Ryzen 9 3950X | |
| Intel Core i9-10900K | |
| AMD Ryzen 9 3900X | |
| Intel Core i9-9900KS | |
| Intel Core i5-10600K | |
| Intel Core i5-9600K | |
| 1920x1080 Fire Strike Physics | |
| AMD Ryzen 9 3950X | |
| Intel Core i9-10900K | |
| AMD Ryzen 9 3900X | |
| Intel Core i9-9900KS | |
| Intel Core i5-10600K | |
| Intel Core i5-9600K | |
| 2560x1440 Time Spy CPU | |
| Intel Core i9-10900K | |
| AMD Ryzen 9 3950X | |
| AMD Ryzen 9 3900X | |
| Intel Core i9-9900KS | |
| Intel Core i5-10600K | |
| Intel Core i5-9600K | |
* ... Meglio usare valori piccoli
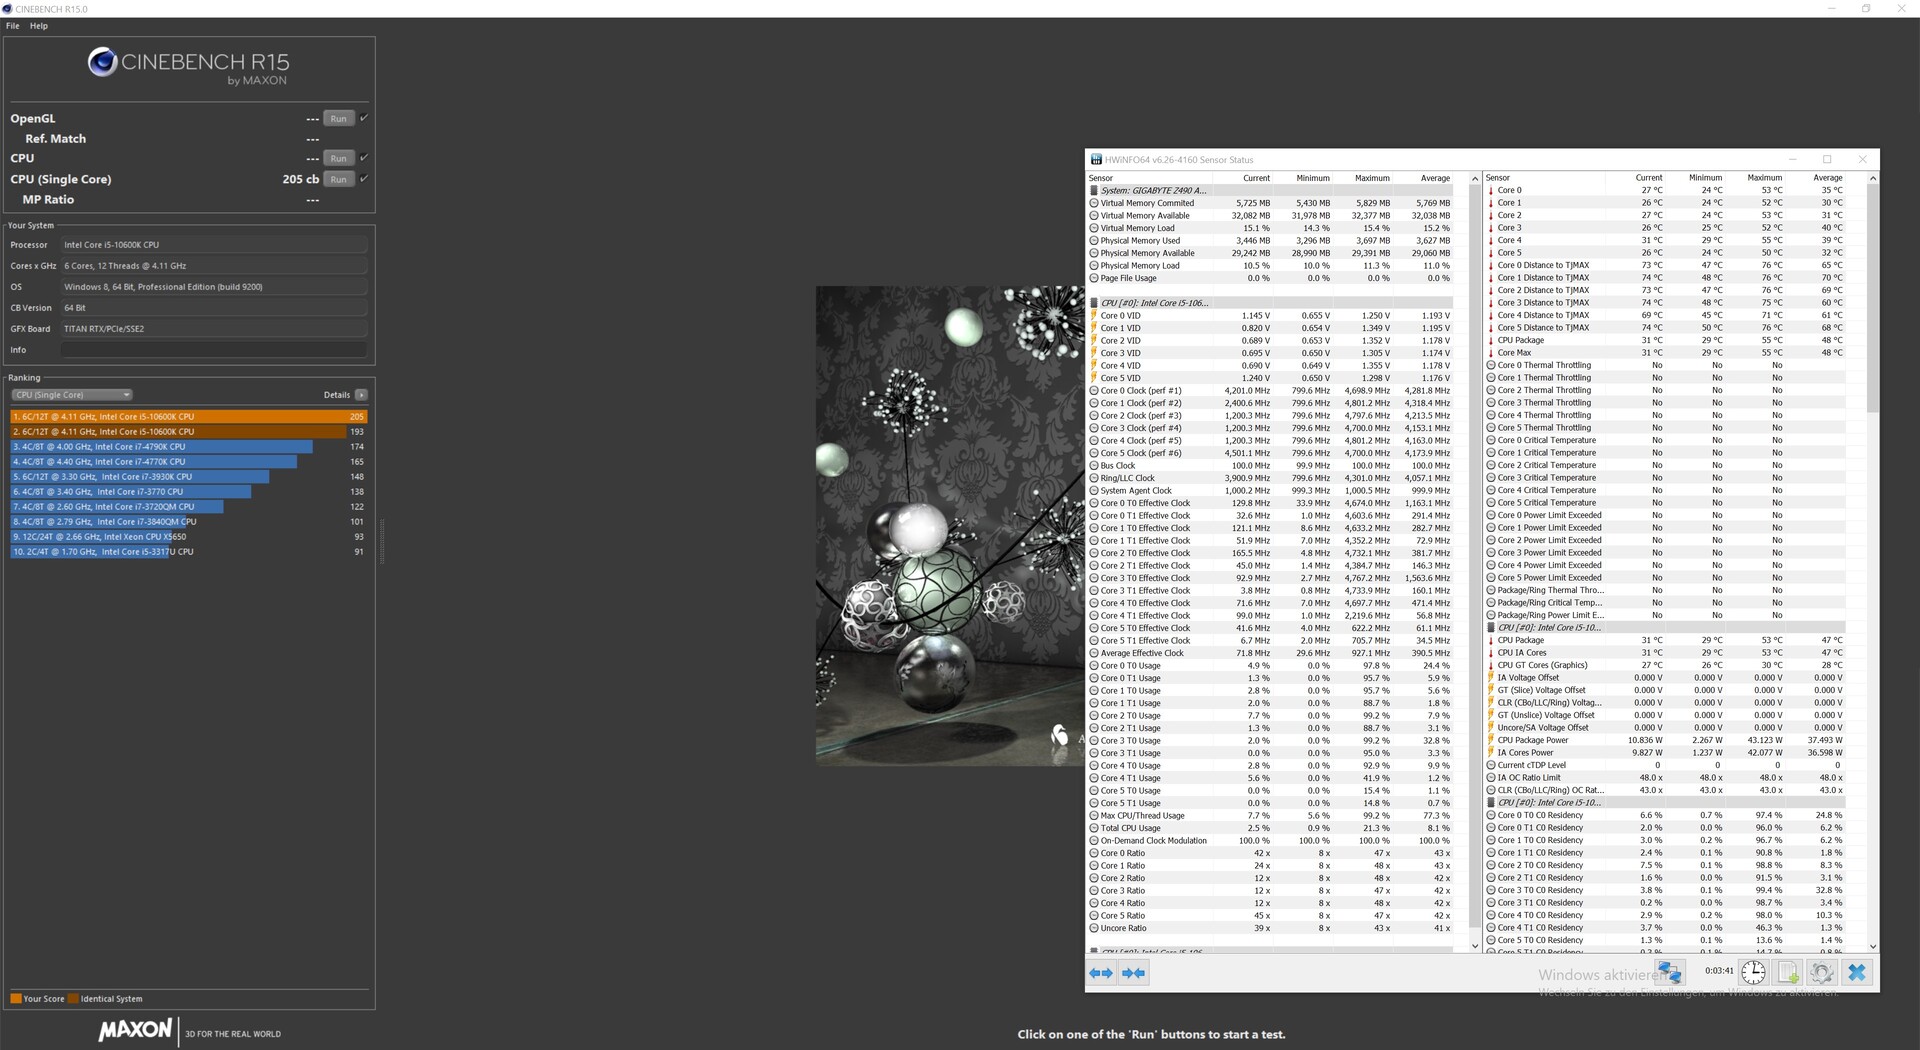
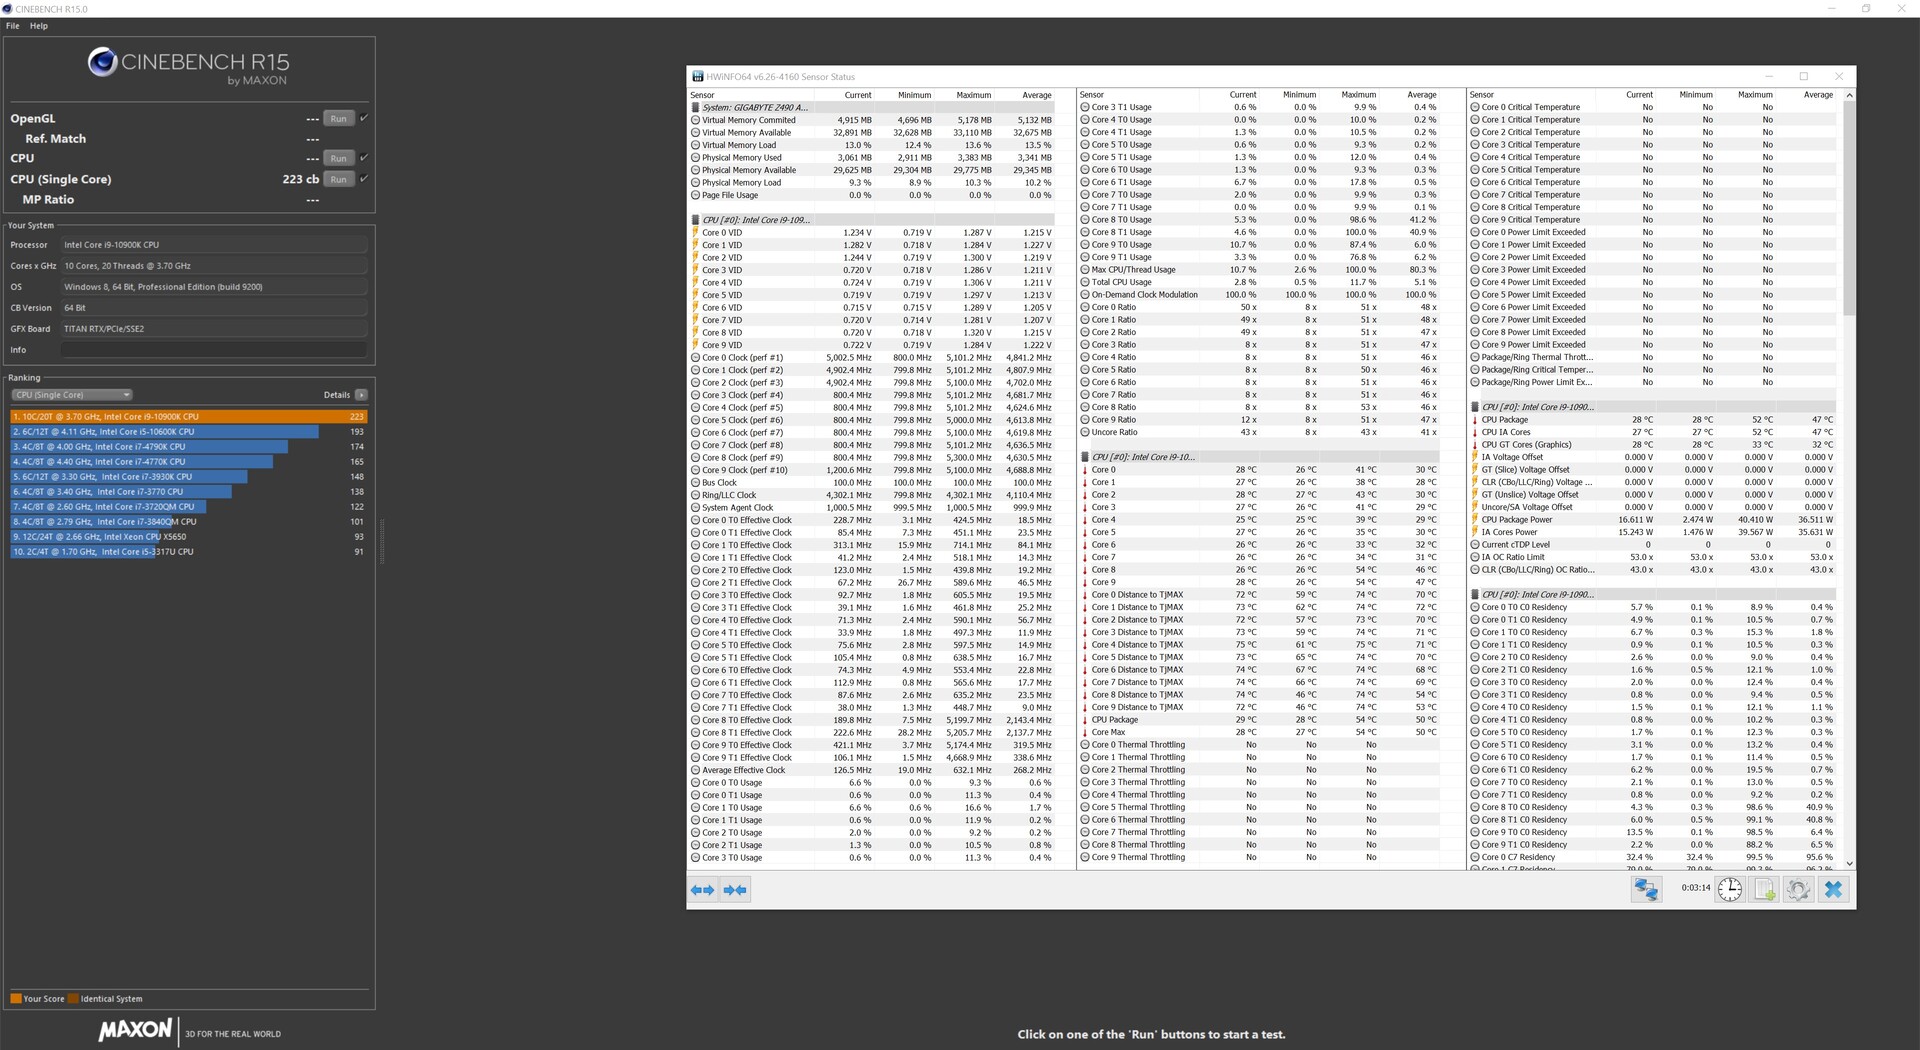
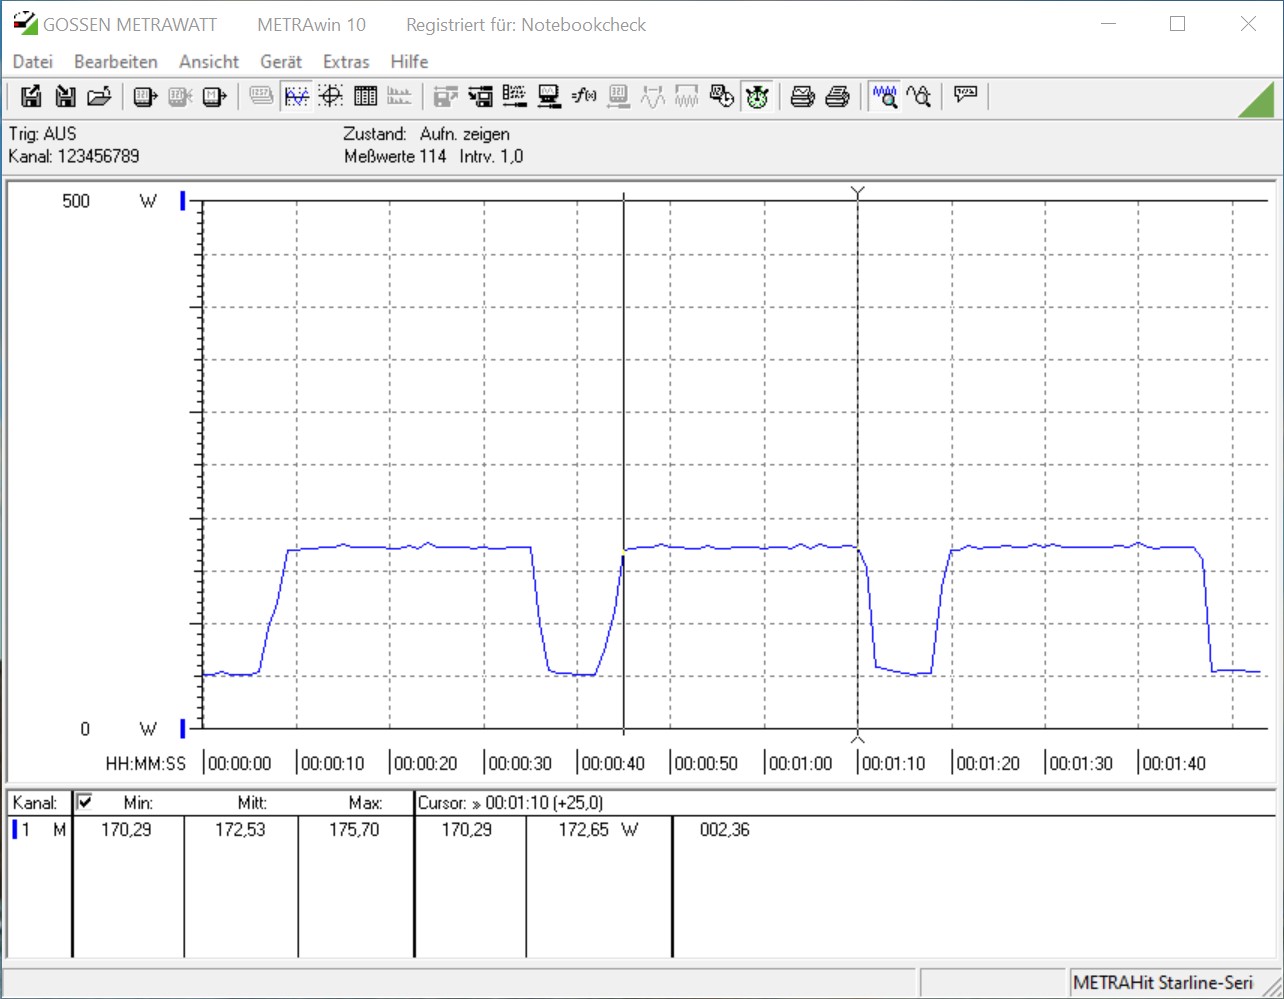
Loop Comet Lake-S vs. Cinebench R15
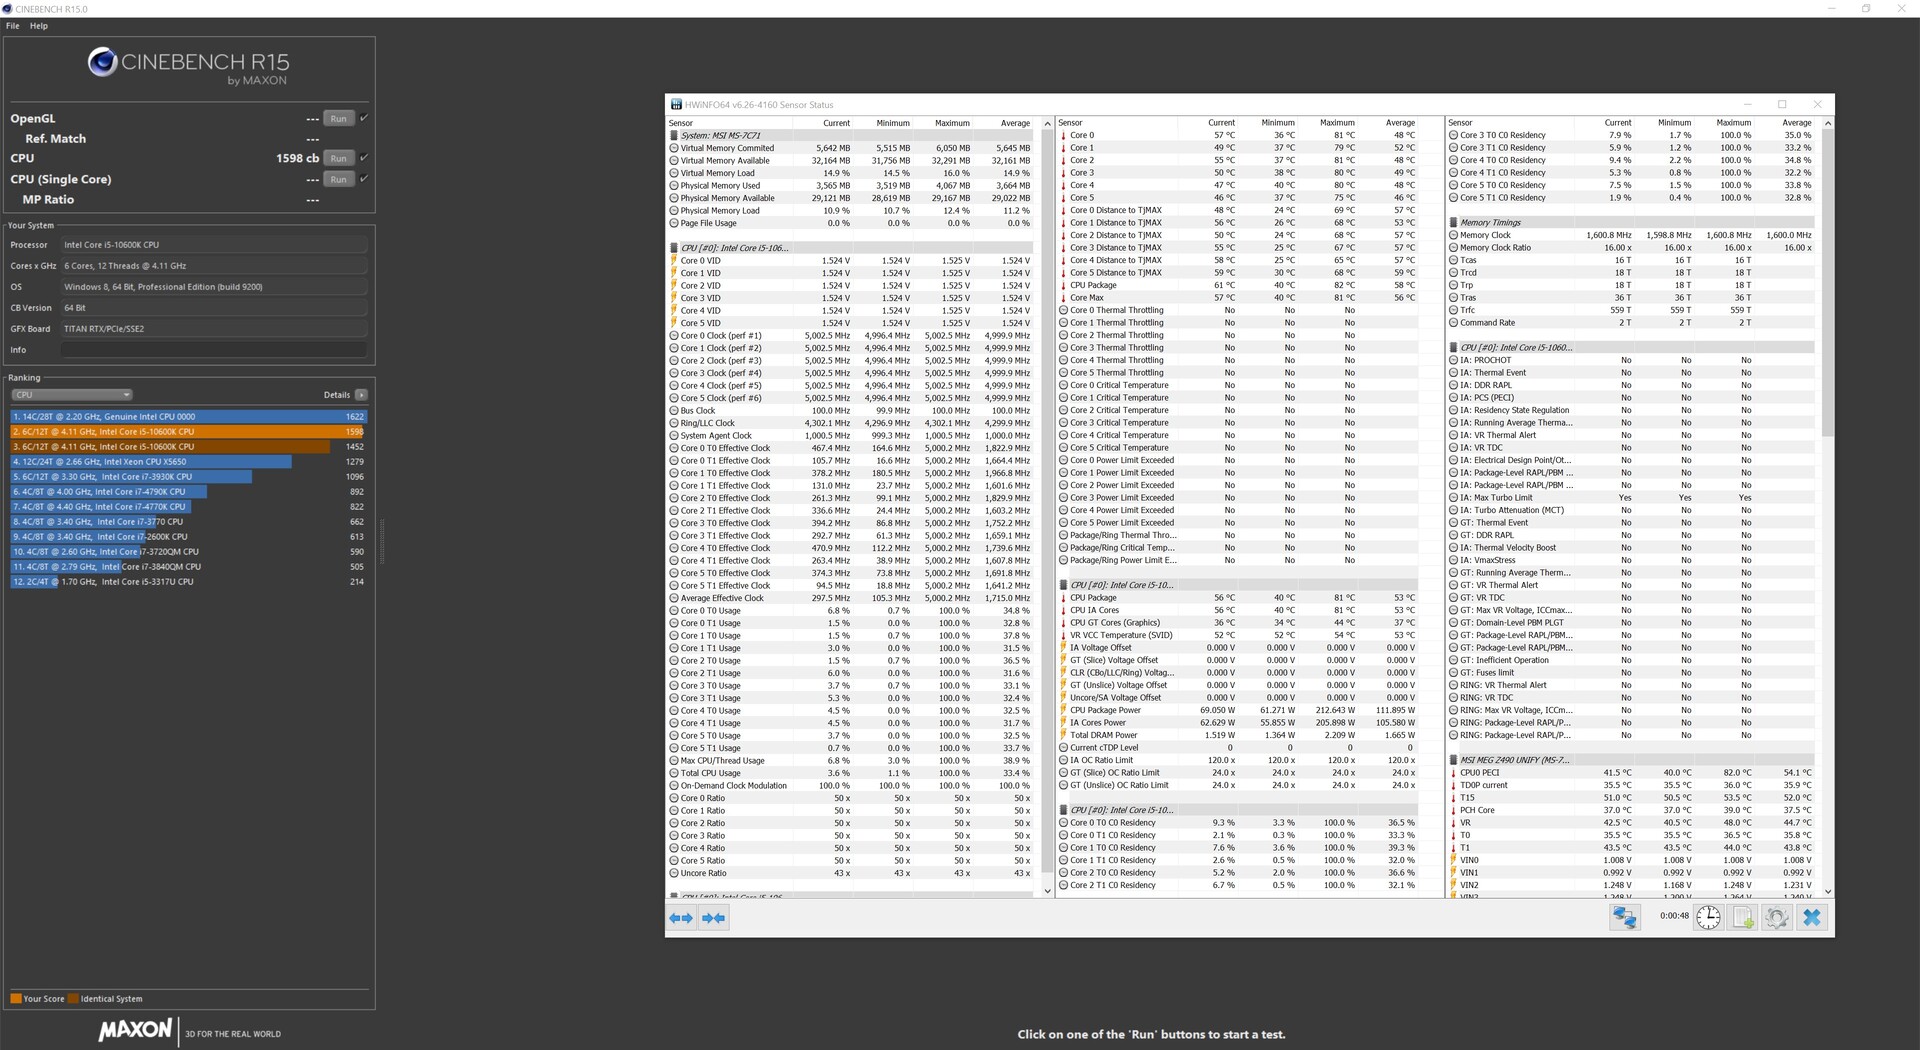
Il nostro primo sguardo alla stabilità delle nuove parti Intel deriva dall'esecuzione della versione multi-core di Cinebench R15 in un loop continuo. Il sistema di raffreddamento a liquido all-in-one di Alphacool non ha problemi a mantenere fredde le CPU nel nostro banco di prova all'aperto. I risultati del benchmark sono relativamente stabili e non ci sono cali di prestazioni di cui parlare. I risultati dell'Intel Core i5-10600K sono un po' più vicini tra loro.
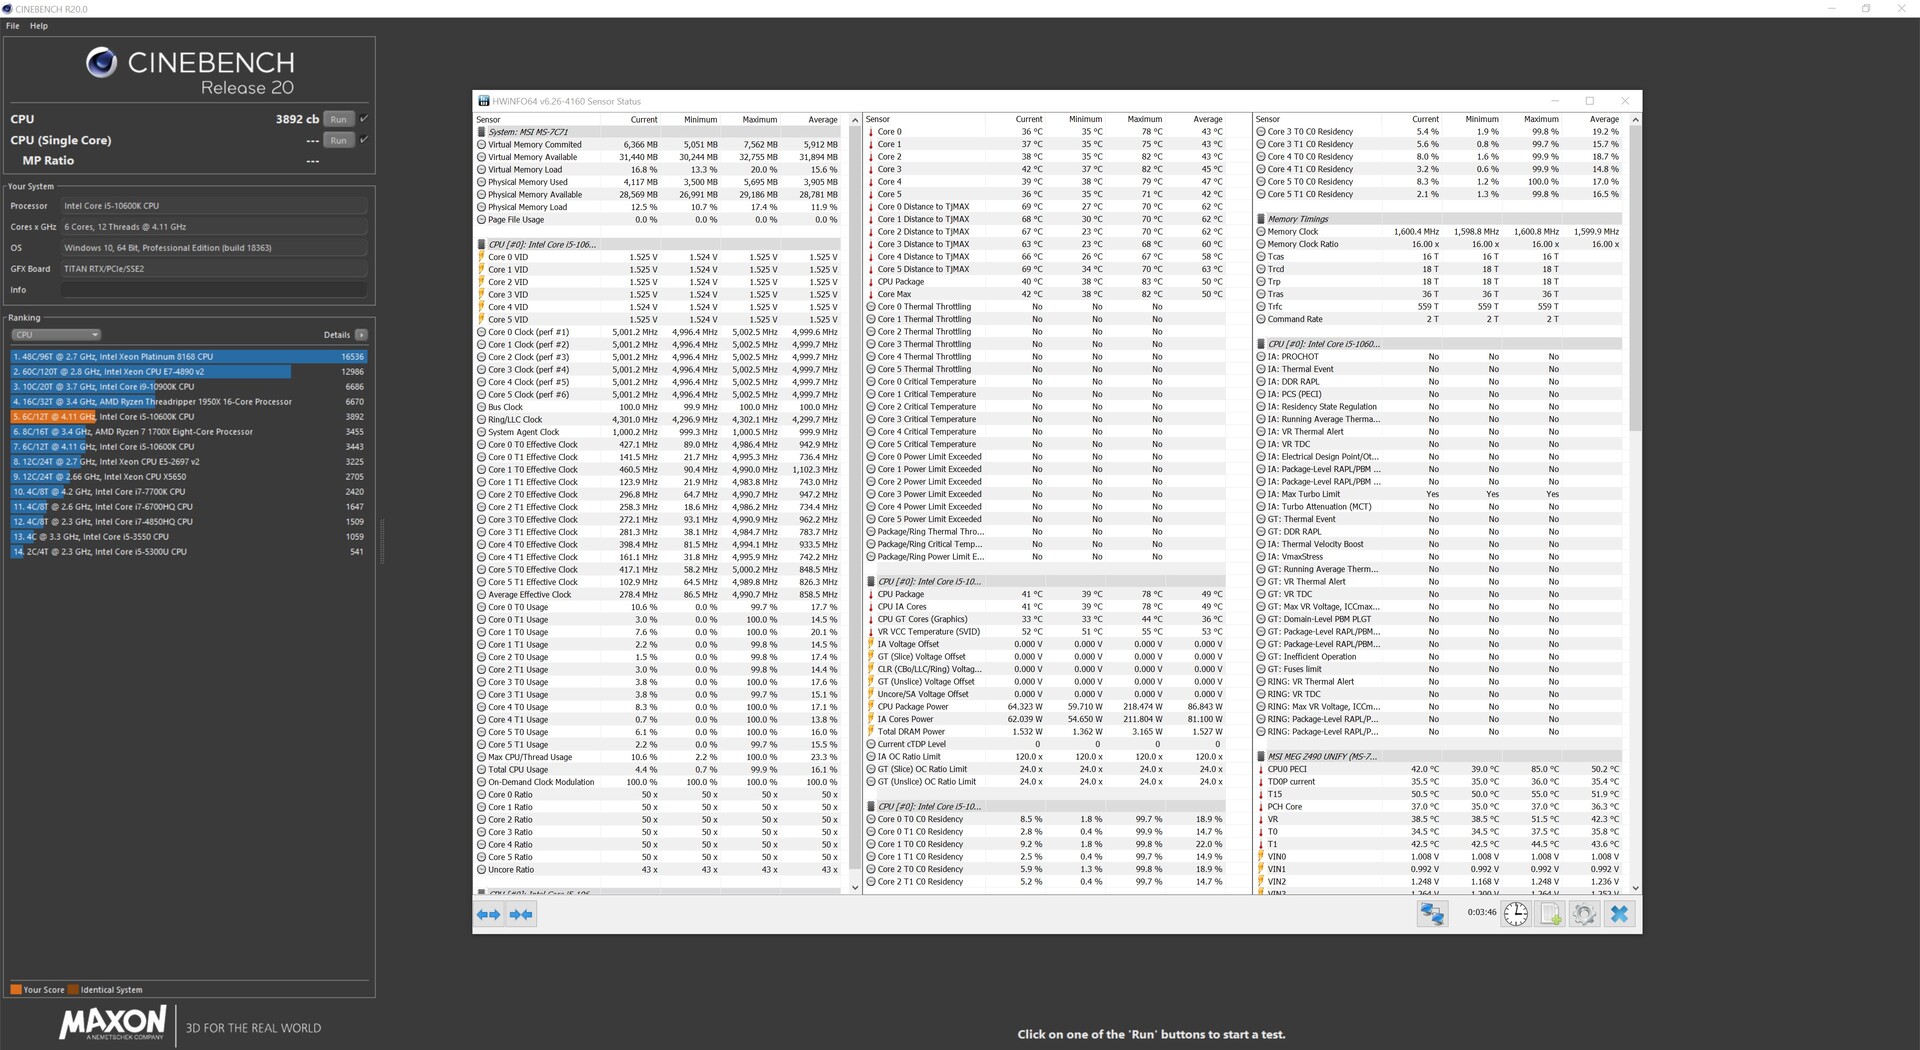
Benchmarks Produttività
In questo caso, entrambi i chip funzionano ugualmente bene. Nell'uso quotidiano, non sarete in grado di dire se state usando l'Intel Core i5-10600K o l'Intel Core i9-10900K. Non ci sono chiari vincitori o perdenti nei benchmarks sintetici.
| PCMark 10 - Score | |
| Intel Core i9-9900KS | |
| AMD Ryzen 9 3950X | |
| Intel Core i9-10900K | |
| AMD Ryzen 9 3900X | |
| Intel Core i5-10600K | |
| Intel Core i5-9600K | |
| PCMark 8 | |
| Work Score Accelerated v2 | |
| AMD Ryzen 9 3950X | |
| Intel Core i9-9900KS | |
| AMD Ryzen 9 3900X | |
| Intel Core i5-10600K | |
| Intel Core i9-10900K | |
| Intel Core i5-9600K | |
| Creative Score Accelerated v2 | |
| Intel Core i9-9900KS | |
| AMD Ryzen 9 3950X | |
| AMD Ryzen 9 3900X | |
| Intel Core i5-10600K | |
| Intel Core i9-10900K | |
| Intel Core i5-9600K | |
| Home Score Accelerated v2 | |
| Intel Core i9-9900KS | |
| AMD Ryzen 9 3950X | |
| AMD Ryzen 9 3900X | |
| Intel Core i5-10600K | |
| Intel Core i9-10900K | |
| Intel Core i5-9600K | |
E' ancora la CPU Gaming più veloce
Intel offre ancora la CPU gaming più veloce del mondo. L'Intel Core i9-10900K può raggiungere frame rates molto elevati, purché non sia legato alla GPU. Tuttavia, una volta che si introduce un collo di bottiglia della GPU aumentando la risoluzione o le impostazioni grafiche, il vantaggio prestazionale che ha svanisce. Ciononostante, l'Intel Core i9-10900K è ancora la CPU scelta da chi ha bisogno o vuole il frame rate più alto possibile. L'Intel Core i5-10600K è leggermente indietro rispetto al modello di fascia più alta, ma è comunque una CPU gaming eccezionale. Entrambi i chips Intel offrono prestazioni di gioco migliori con una Nvidia Titan RTX rispetto alle due CPU Ryzen 9 di AMD.
| Performance rating - Percent | |
| Intel Core i9-10900K | |
| Intel Core i9-9900KS, Nvidia Titan RTX | |
| Intel Core i5-10600K | |
| AMD Ryzen 9 3900X | |
| AMD Ryzen 9 3950X | |
| Borderlands 3 | |
| 1280x720 Very Low Overall Quality (DX11) | |
| Intel Core i9-10900K | |
| Intel Core i5-10600K | |
| Intel Core i9-9900KS, Nvidia Titan RTX | |
| AMD Ryzen 9 3900X | |
| AMD Ryzen 9 3950X | |
| 1920x1080 Badass Overall Quality (DX11) | |
| Intel Core i9-10900K | |
| Intel Core i5-10600K | |
| Intel Core i9-9900KS, Nvidia Titan RTX | |
| AMD Ryzen 9 3900X | |
| AMD Ryzen 9 3950X | |
| Metro Exodus | |
| 1280x720 Low Quality AF:4x | |
| Intel Core i9-10900K | |
| Intel Core i5-10600K | |
| Intel Core i9-9900KS, Nvidia Titan RTX | |
| AMD Ryzen 9 3900X | |
| AMD Ryzen 9 3950X | |
| 1920x1080 Ultra Quality AF:16x | |
| Intel Core i9-10900K | |
| Intel Core i5-10600K | |
| Intel Core i9-9900KS, Nvidia Titan RTX | |
| AMD Ryzen 9 3900X | |
| AMD Ryzen 9 3950X | |
| Far Cry New Dawn | |
| 1280x720 Low Preset | |
| Intel Core i9-10900K | |
| Intel Core i9-9900KS, Nvidia Titan RTX | |
| Intel Core i5-10600K | |
| AMD Ryzen 9 3900X | |
| AMD Ryzen 9 3950X | |
| 1920x1080 Ultra Preset | |
| Intel Core i9-9900KS, Nvidia Titan RTX | |
| Intel Core i5-10600K | |
| Intel Core i9-10900K | |
| AMD Ryzen 9 3950X | |
| AMD Ryzen 9 3900X | |
| Forza Horizon 4 | |
| 1280x720 Very Low Preset | |
| Intel Core i9-10900K | |
| Intel Core i9-9900KS, Nvidia Titan RTX | |
| Intel Core i5-10600K | |
| AMD Ryzen 9 3950X | |
| AMD Ryzen 9 3900X | |
| 1920x1080 Ultra Preset AA:2xMS | |
| Intel Core i9-10900K | |
| Intel Core i5-10600K | |
| Intel Core i9-9900KS, Nvidia Titan RTX | |
| AMD Ryzen 9 3950X | |
| AMD Ryzen 9 3900X | |
| Far Cry 5 | |
| 1280x720 Low Preset AA:T | |
| Intel Core i9-10900K | |
| Intel Core i9-9900KS, Nvidia Titan RTX | |
| Intel Core i5-10600K | |
| AMD Ryzen 9 3900X | |
| AMD Ryzen 9 3950X | |
| 1920x1080 Ultra Preset AA:T | |
| Intel Core i9-10900K | |
| Intel Core i9-9900KS, Nvidia Titan RTX | |
| Intel Core i5-10600K | |
| AMD Ryzen 9 3900X | |
| AMD Ryzen 9 3950X | |
| X-Plane 11.11 | |
| 1280x720 low (fps_test=1) | |
| Intel Core i9-10900K | |
| Intel Core i9-9900KS, Nvidia Titan RTX | |
| Intel Core i5-10600K | |
| AMD Ryzen 9 3900X | |
| AMD Ryzen 9 3950X | |
| 1920x1080 high (fps_test=3) | |
| Intel Core i9-9900KS, Nvidia Titan RTX | |
| Intel Core i9-10900K | |
| Intel Core i5-10600K | |
| AMD Ryzen 9 3900X | |
| AMD Ryzen 9 3950X | |
| Final Fantasy XV Benchmark | |
| 1280x720 Lite Quality | |
| Intel Core i9-10900K | |
| Intel Core i9-9900KS, Nvidia Titan RTX | |
| Intel Core i5-10600K | |
| AMD Ryzen 9 3950X | |
| AMD Ryzen 9 3900X | |
| 1920x1080 High Quality | |
| Intel Core i9-10900K | |
| Intel Core i5-10600K | |
| Intel Core i9-9900KS, Nvidia Titan RTX | |
| AMD Ryzen 9 3950X | |
| AMD Ryzen 9 3900X | |
| Dota 2 Reborn | |
| 1280x720 min (0/3) fastest | |
| Intel Core i9-10900K | |
| Intel Core i9-9900KS, Nvidia Titan RTX | |
| Intel Core i5-10600K | |
| AMD Ryzen 9 3900X | |
| AMD Ryzen 9 3950X | |
| 1920x1080 ultra (3/3) best looking | |
| Intel Core i9-10900K | |
| Intel Core i9-9900KS, Nvidia Titan RTX | |
| Intel Core i5-10600K | |
| AMD Ryzen 9 3900X | |
| AMD Ryzen 9 3950X | |
| The Witcher 3 | |
| 1024x768 Low Graphics & Postprocessing | |
| Intel Core i9-10900K | |
| Intel Core i9-9900KS, Nvidia Titan RTX | |
| Intel Core i5-10600K | |
| AMD Ryzen 9 3900X | |
| AMD Ryzen 9 3950X | |
| 1920x1080 Ultra Graphics & Postprocessing (HBAO+) | |
| Intel Core i5-10600K | |
| Intel Core i9-10900K | |
| AMD Ryzen 9 3900X | |
| Intel Core i9-9900KS, Nvidia Titan RTX | |
| AMD Ryzen 9 3950X | |
Intel Core i9-10900K + Nvidia Titan RTX
| basso | medio | alto | ultra | QHD | 4K | |
|---|---|---|---|---|---|---|
| The Witcher 3 (2015) | 518 | 400 | 265 | 139 | 103 | |
| Dota 2 Reborn (2015) | 198.8 | 181 | 174.2 | 172.2 | 158.9 | |
| Final Fantasy XV Benchmark (2018) | 221 | 187 | 142 | 65.4 | ||
| X-Plane 11.11 (2018) | 149 | 130 | 106 | 91.9 | ||
| Far Cry 5 (2018) | 193 | 169 | 159 | 149 | 137 | 83 |
| Shadow of the Tomb Raider (2018) | 204 | 180 | 173 | 165 | 122 | 67 |
| Forza Horizon 4 (2018) | 246 | 218 | 216 | 193 | 164 | 117 |
| Far Cry New Dawn (2019) | 151 | 120 | 113 | 98 | 97 | 85 |
| Metro Exodus (2019) | 220 | 175 | 136 | 109 | 86.4 | 55.1 |
| Borderlands 3 (2019) | 191.1 | 166.7 | 139 | 117 | 85 | 46.5 |
Intel Core i5-10600K + Nvidia Titan RTX
| basso | medio | alto | ultra | QHD | 4K | |
|---|---|---|---|---|---|---|
| The Witcher 3 (2015) | 413 | 371 | 258 | 140 | 101 | |
| Dota 2 Reborn (2015) | 171.6 | 160.6 | 155.2 | 148.1 | 146.1 | |
| Final Fantasy XV Benchmark (2018) | 201 | 176 | 140 | 64.5 | ||
| X-Plane 11.11 (2018) | 133 | 118 | 96.8 | 83.7 | ||
| Far Cry 5 (2018) | 157 | 139 | 132 | 126 | 121 | 81 |
| Shadow of the Tomb Raider (2018) | 178 | 161 | 156 | 149 | 122 | 66 |
| Forza Horizon 4 (2018) | 222 | 200 | 200 | 187 | 164 | 117 |
| Far Cry New Dawn (2019) | 147 | 125 | 120 | 109 | 113 | 83 |
| Metro Exodus (2019) | 210 | 164 | 135 | 109 | 86.3 | 53.9 |
| Borderlands 3 (2019) | 166 | 143 | 130 | 114 | 86 | 47.9 |
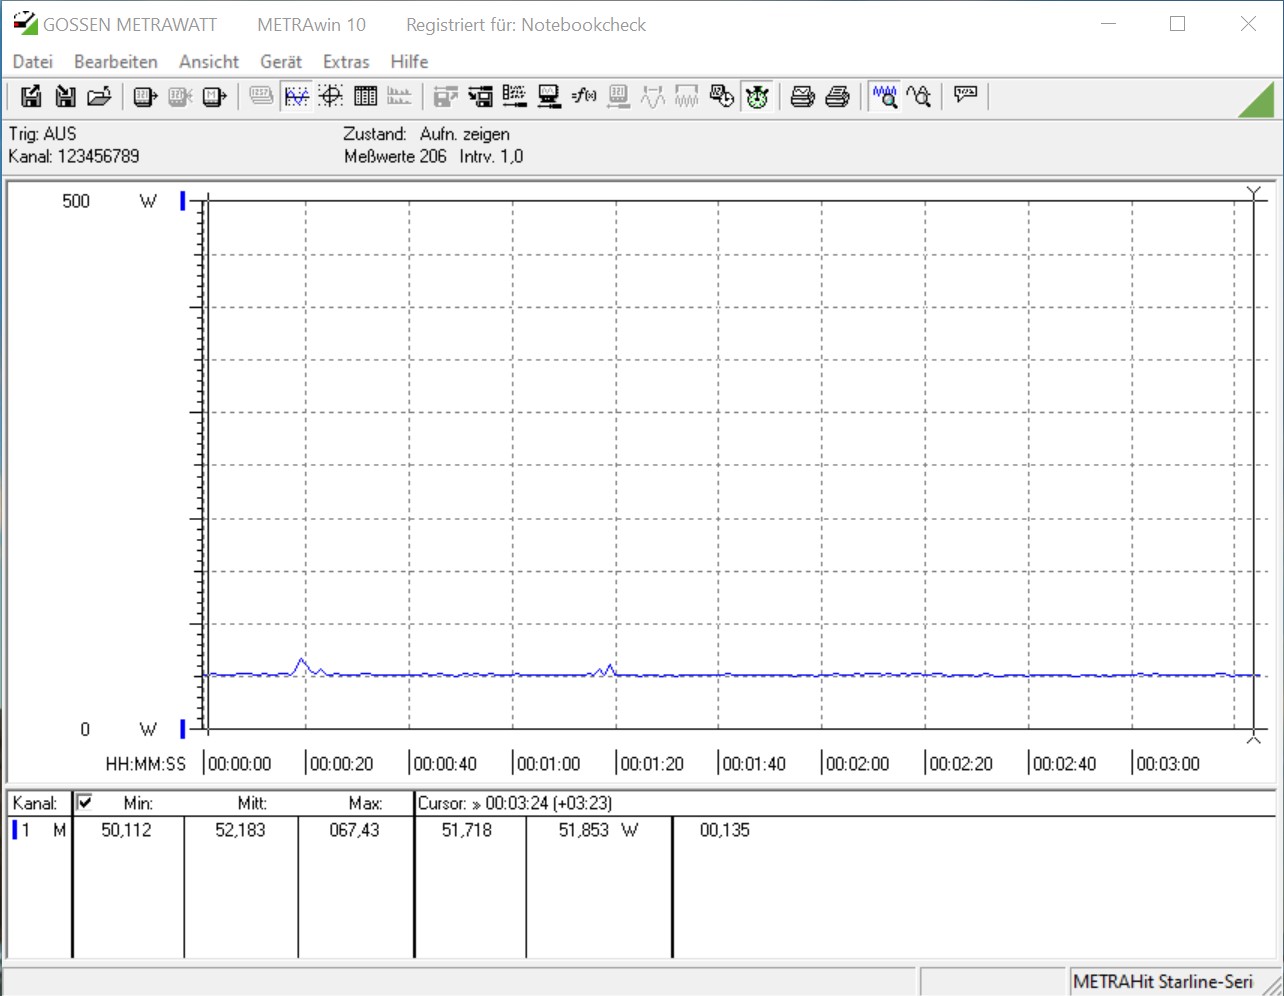
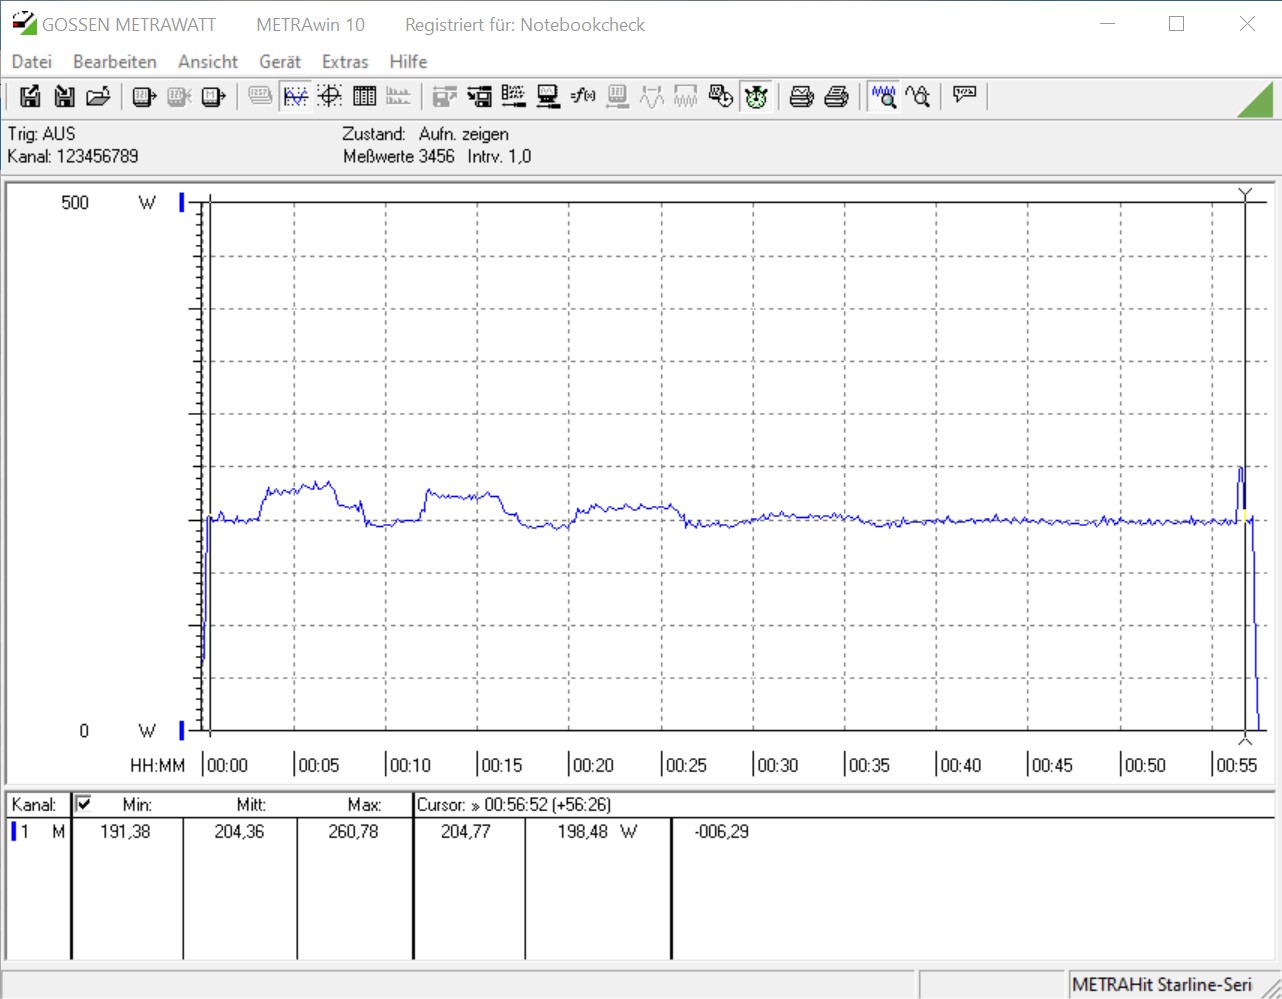
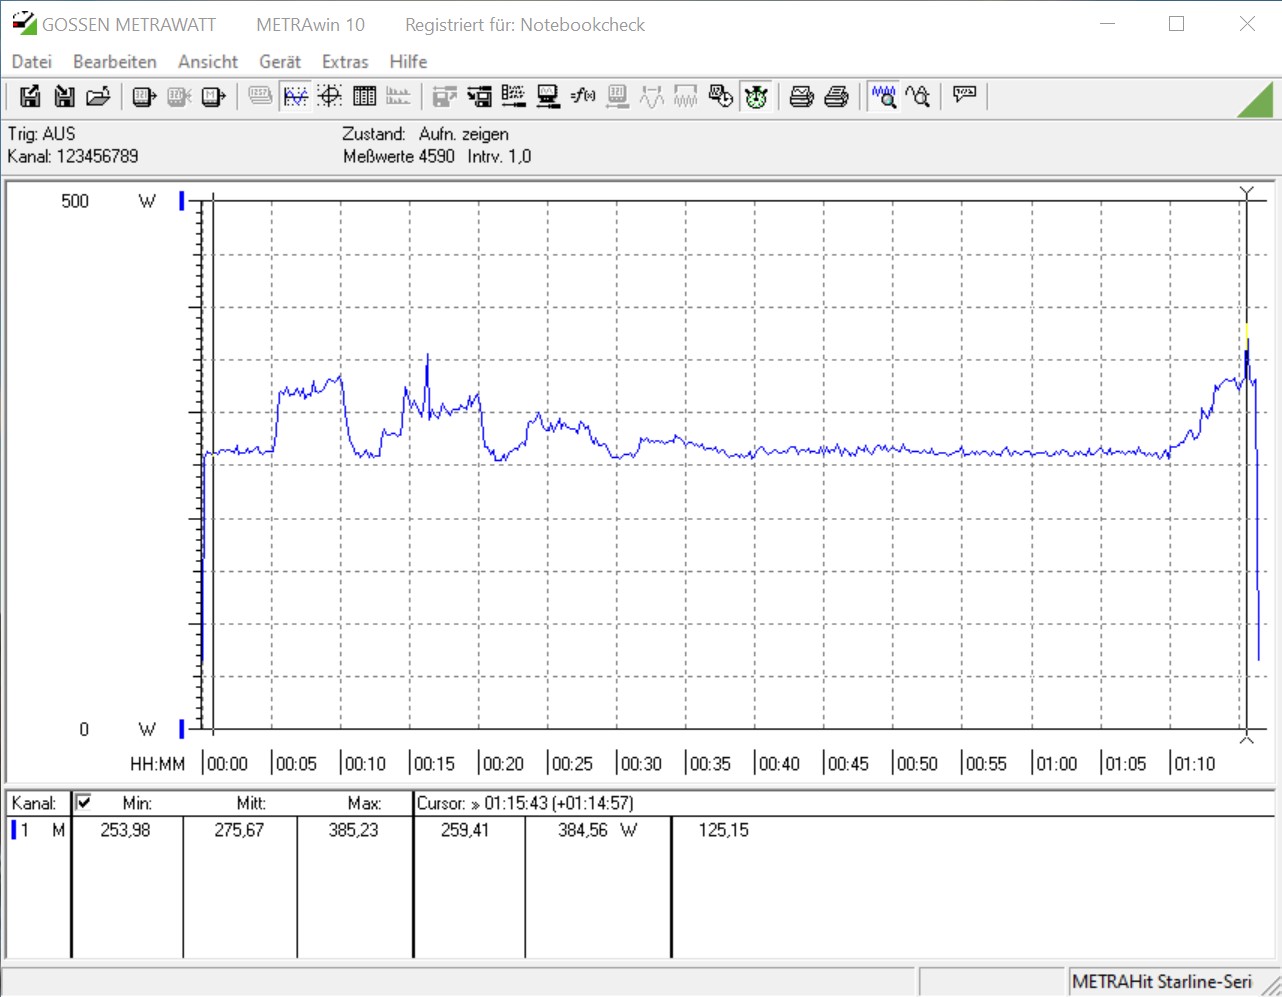
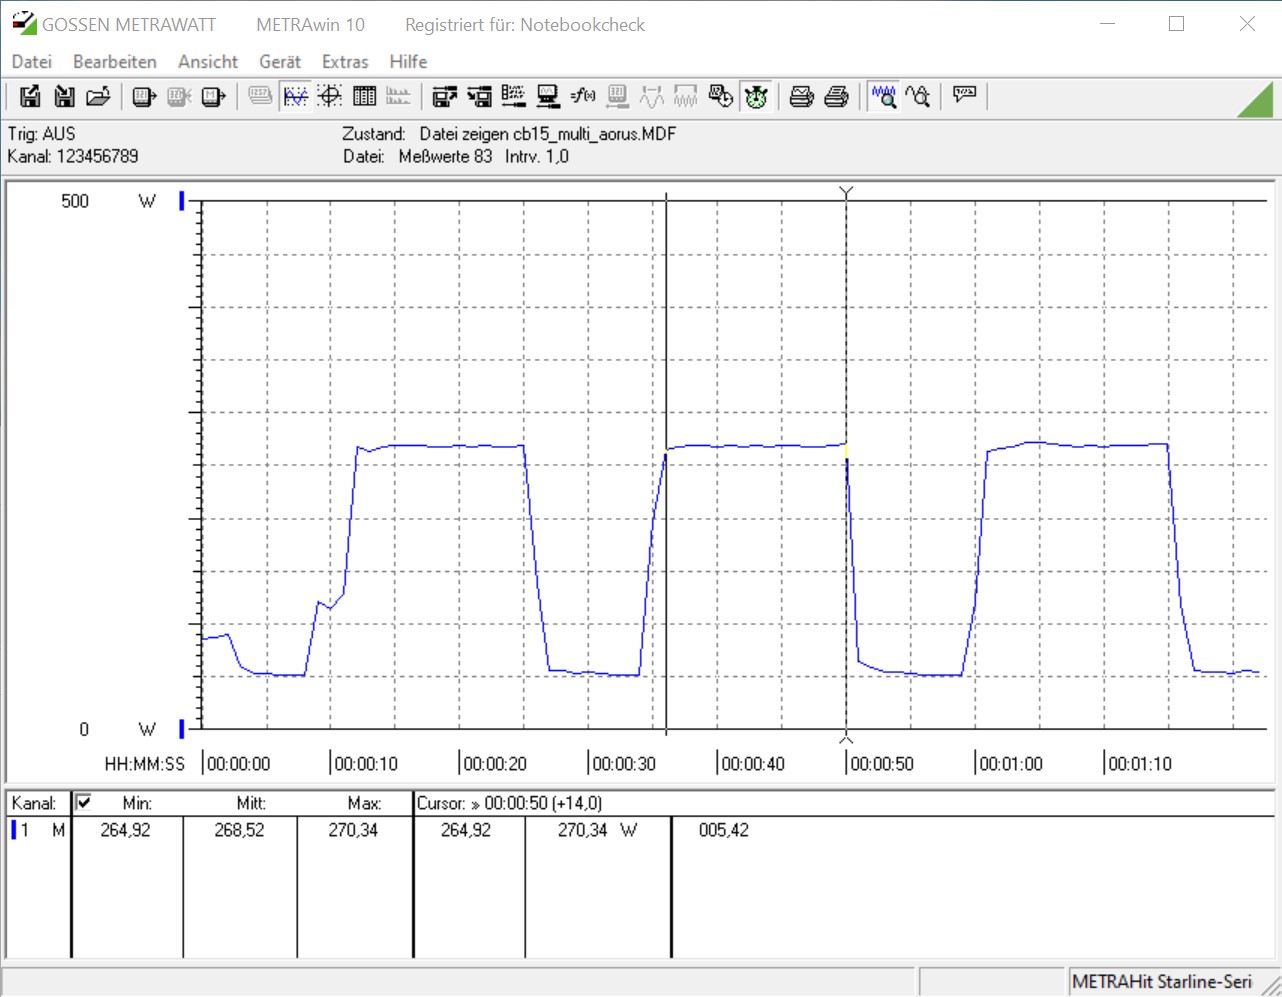
Consumo Energetico - 10 Cores consumano
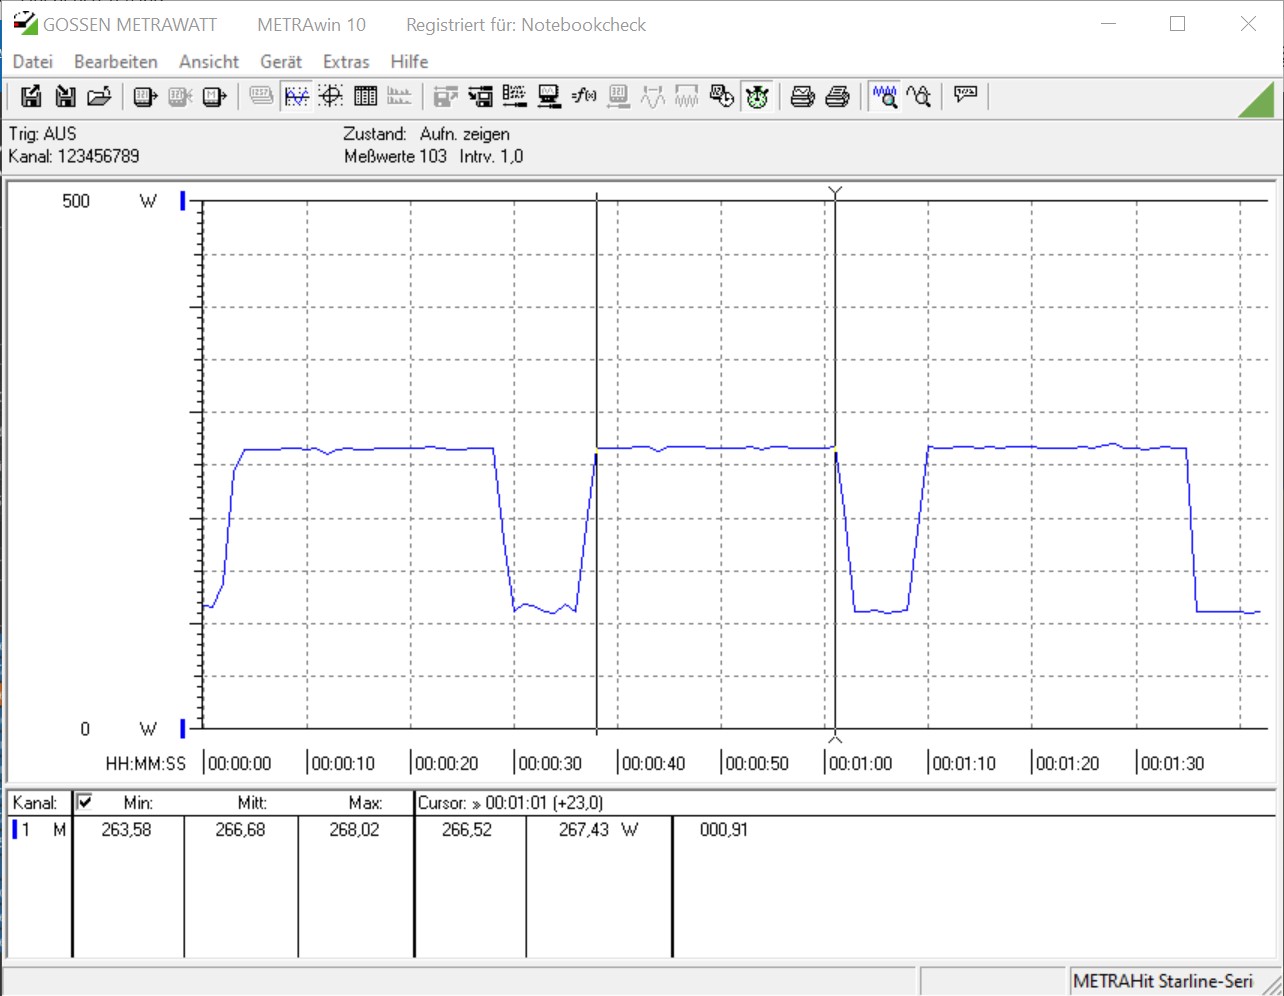
Il consumo di energia è ciò di cui la maggior parte delle persone parla quando parla dei nuovi processori Comet Lake-S. L'Intel Core i9-10900K può erogare fino a 250 watt per 56 secondi. Il consumo energetico del Core i9-10900K nel loop continuo multi-core Cinebench R15 ammonta a circa 269 watt. Questo risultato significa che il chip Intel a 10 core assorbe più energia del processore a 16 cores di AMD nello stesso benchmark. In questo caso, il consumo energetico del mid-range Core i5-10600K è molto più basso, pari a 173 watt.
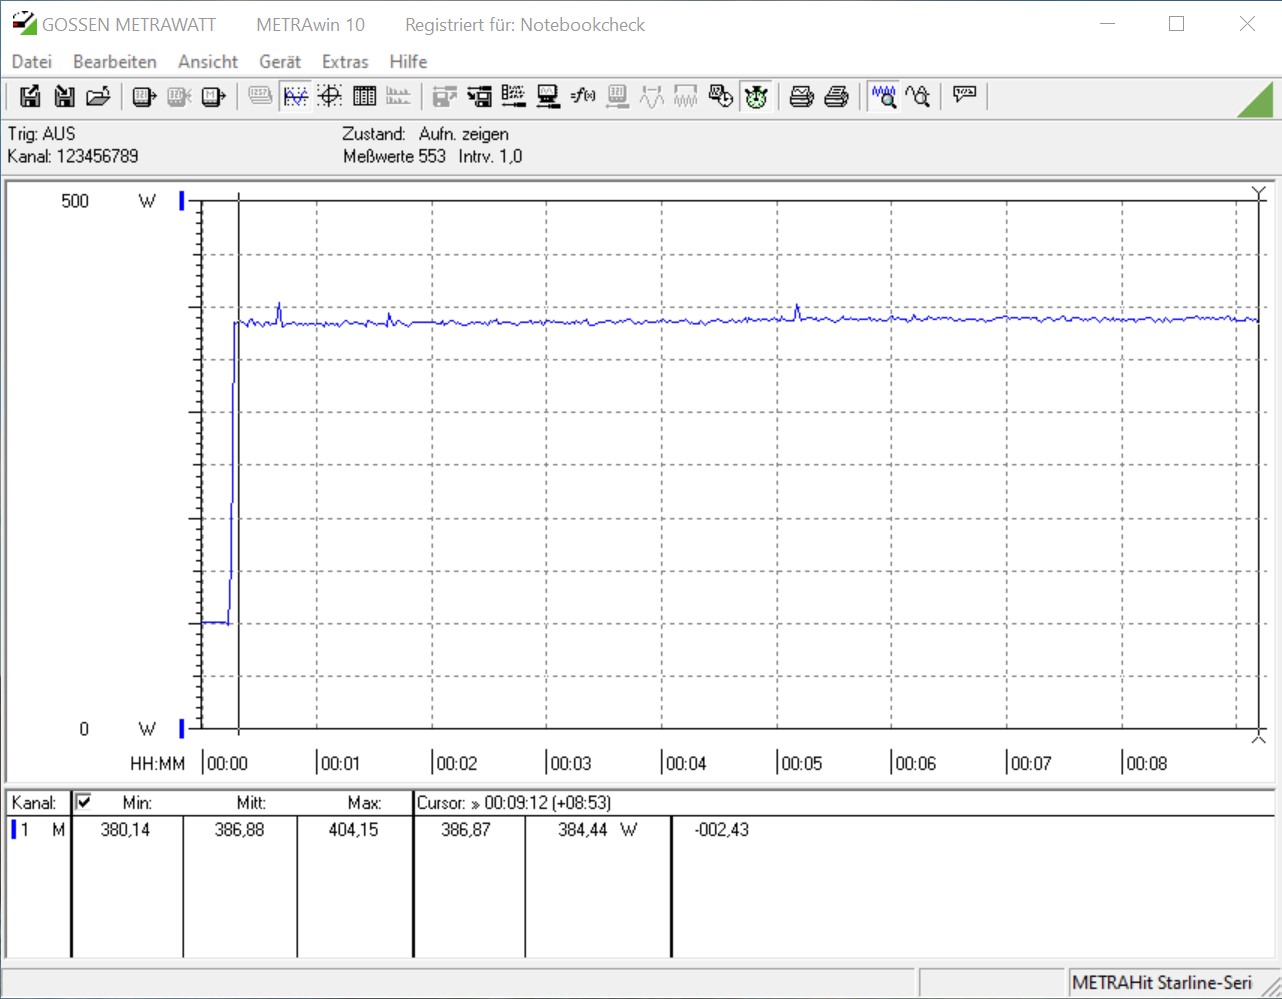
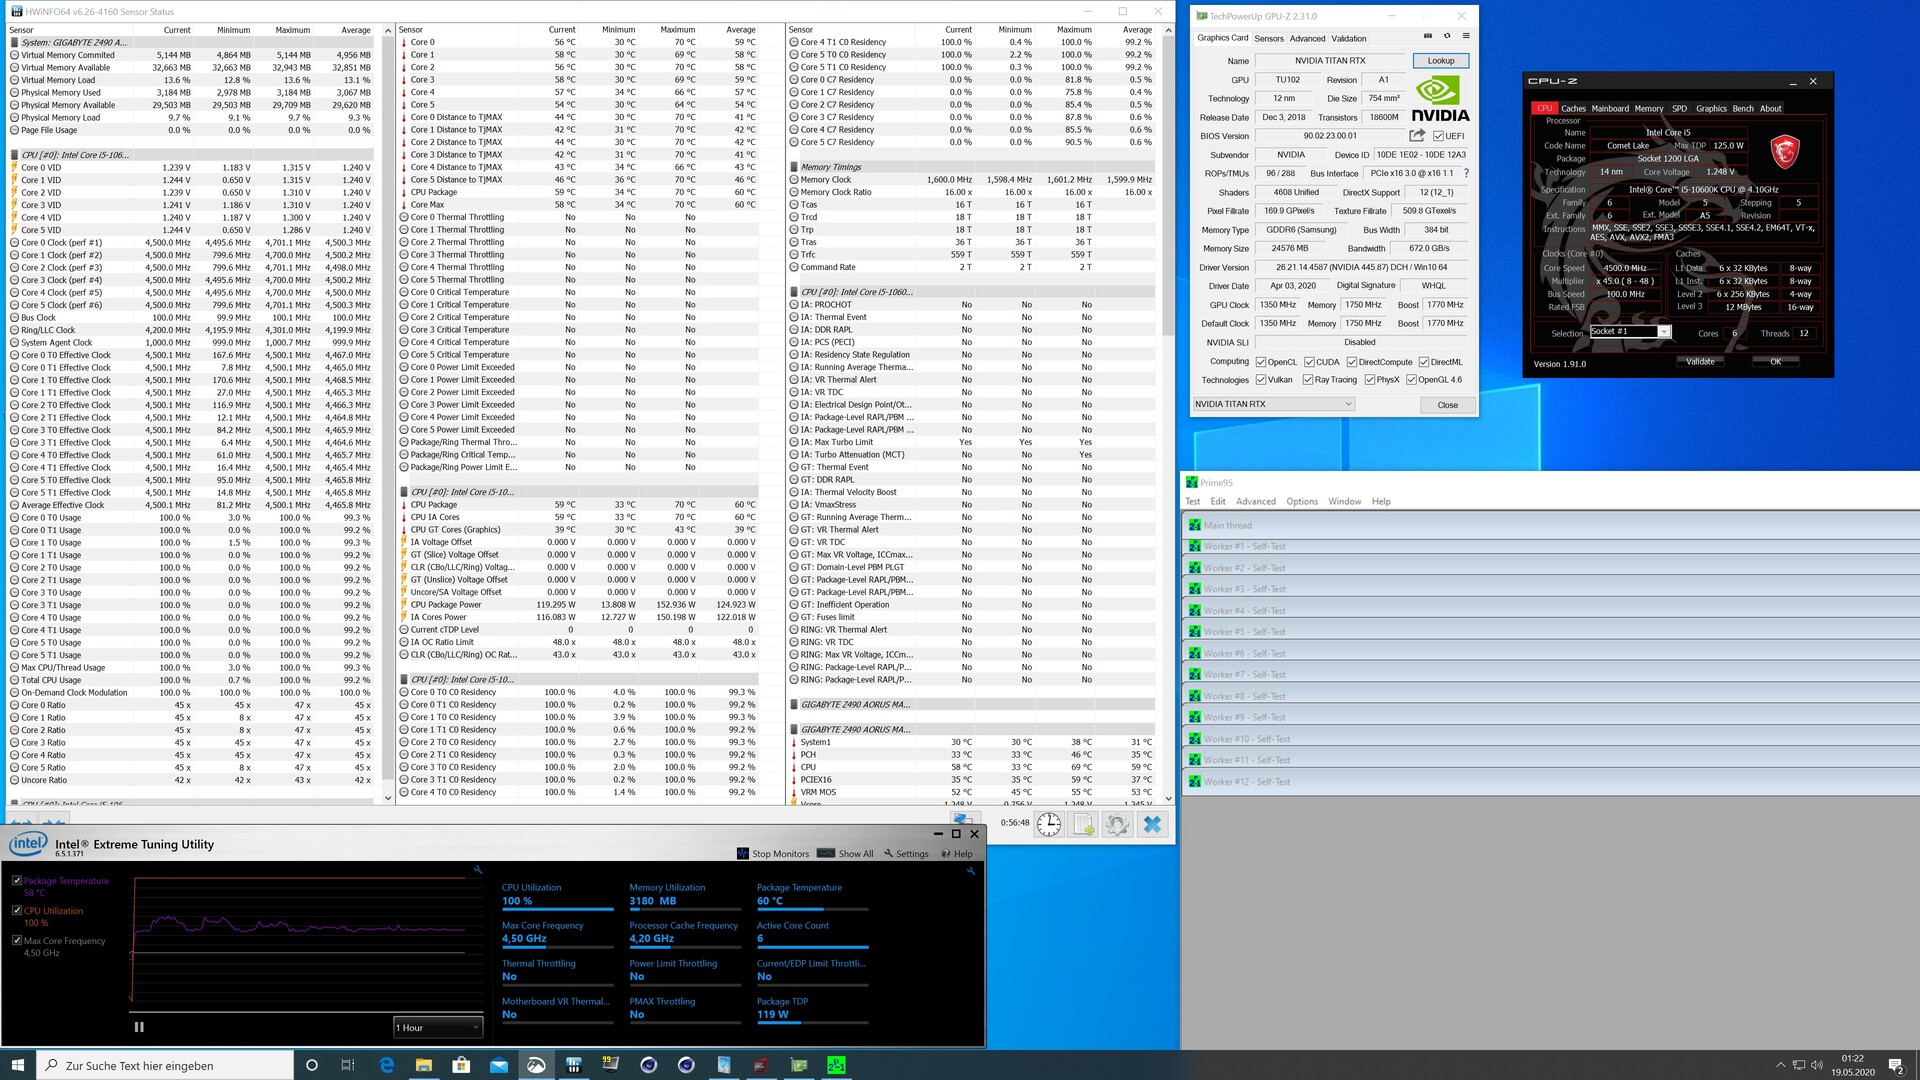
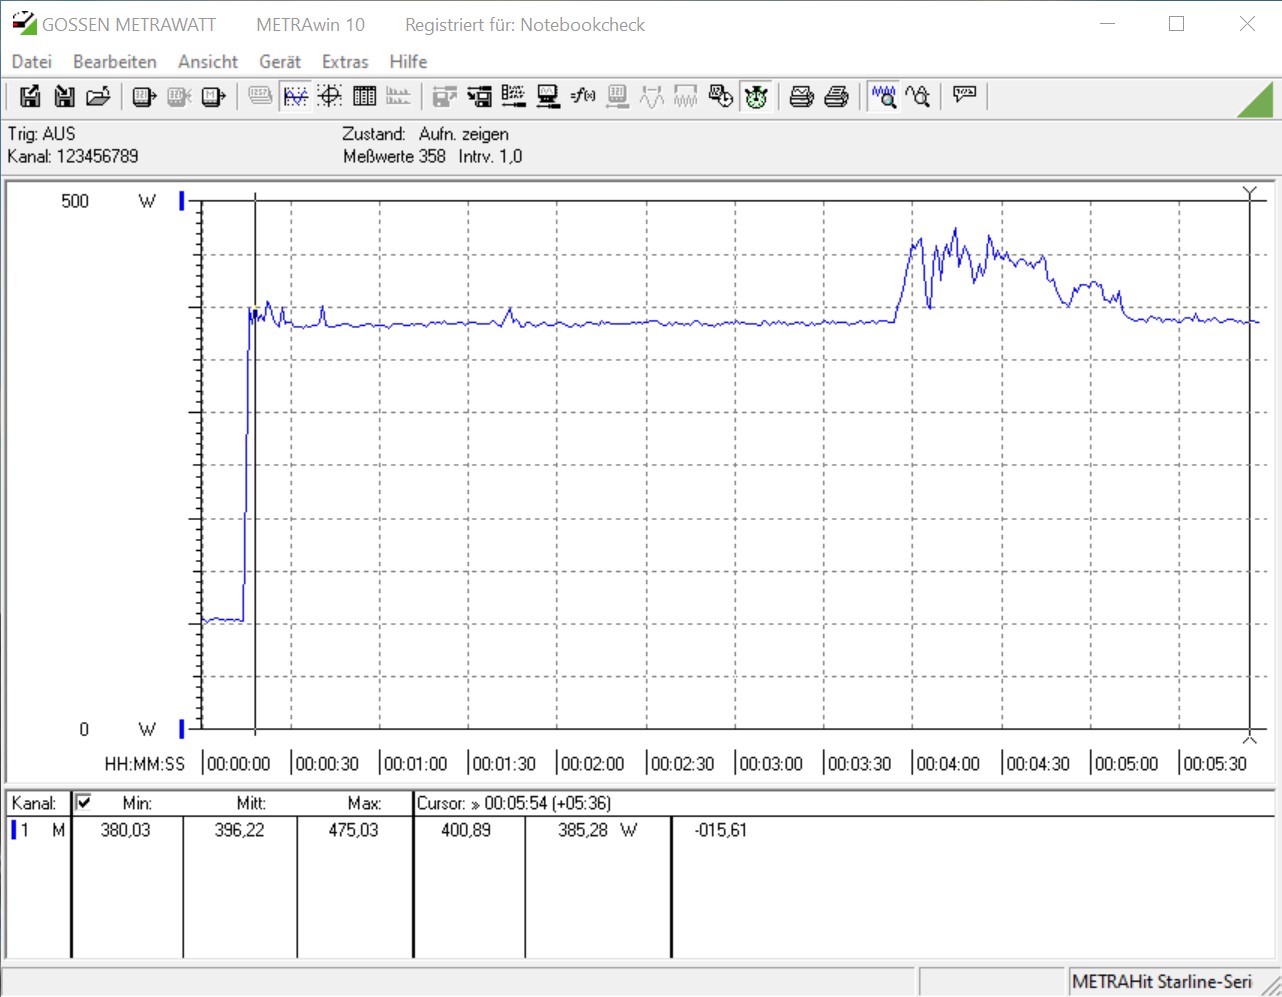
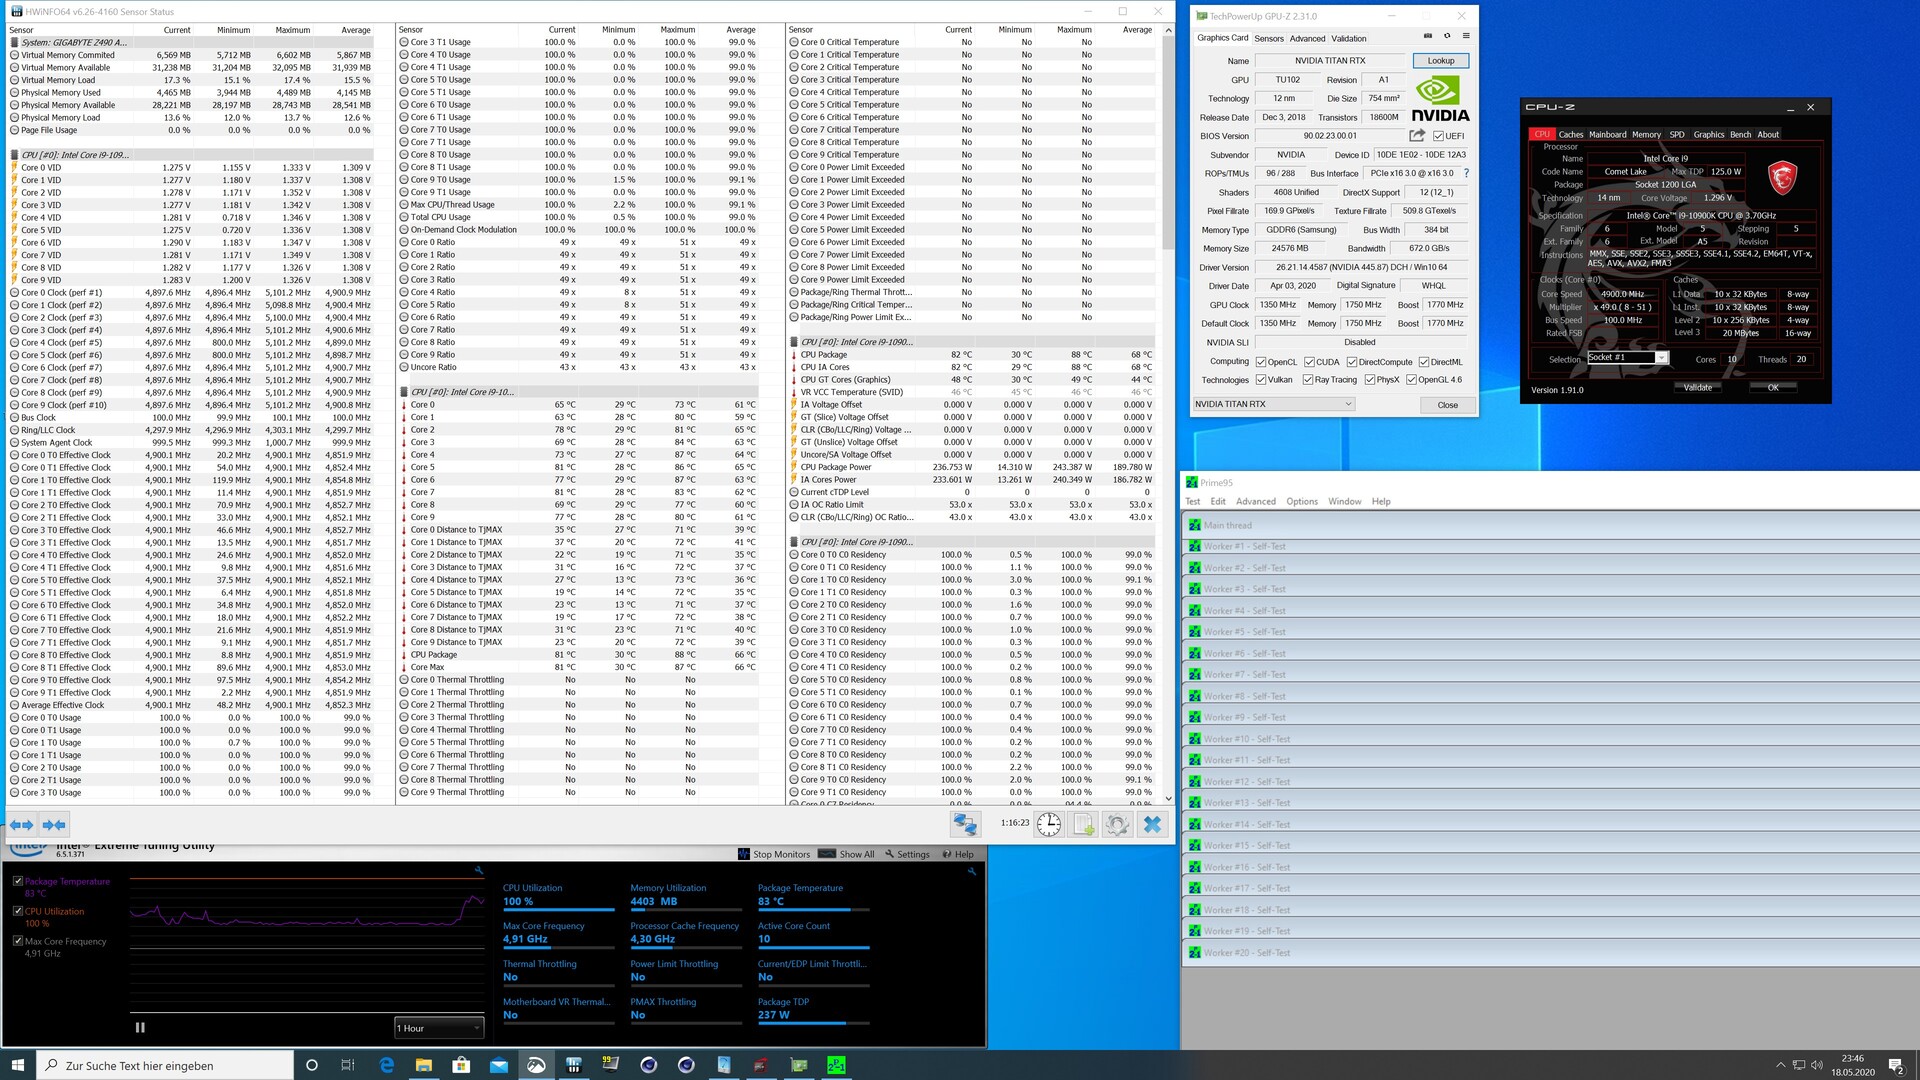
Nel test di stress Prime95, il chip a 10 cores ha assorbito 275 watt e la parte a 6 cores ha consumato 204 watt. Qui, Intel ha superato se stessa. Il Core i9-10900K assorbe più potenza del Core i9-9900KS, ma questo non dovrebbe sorprendere nessuno.
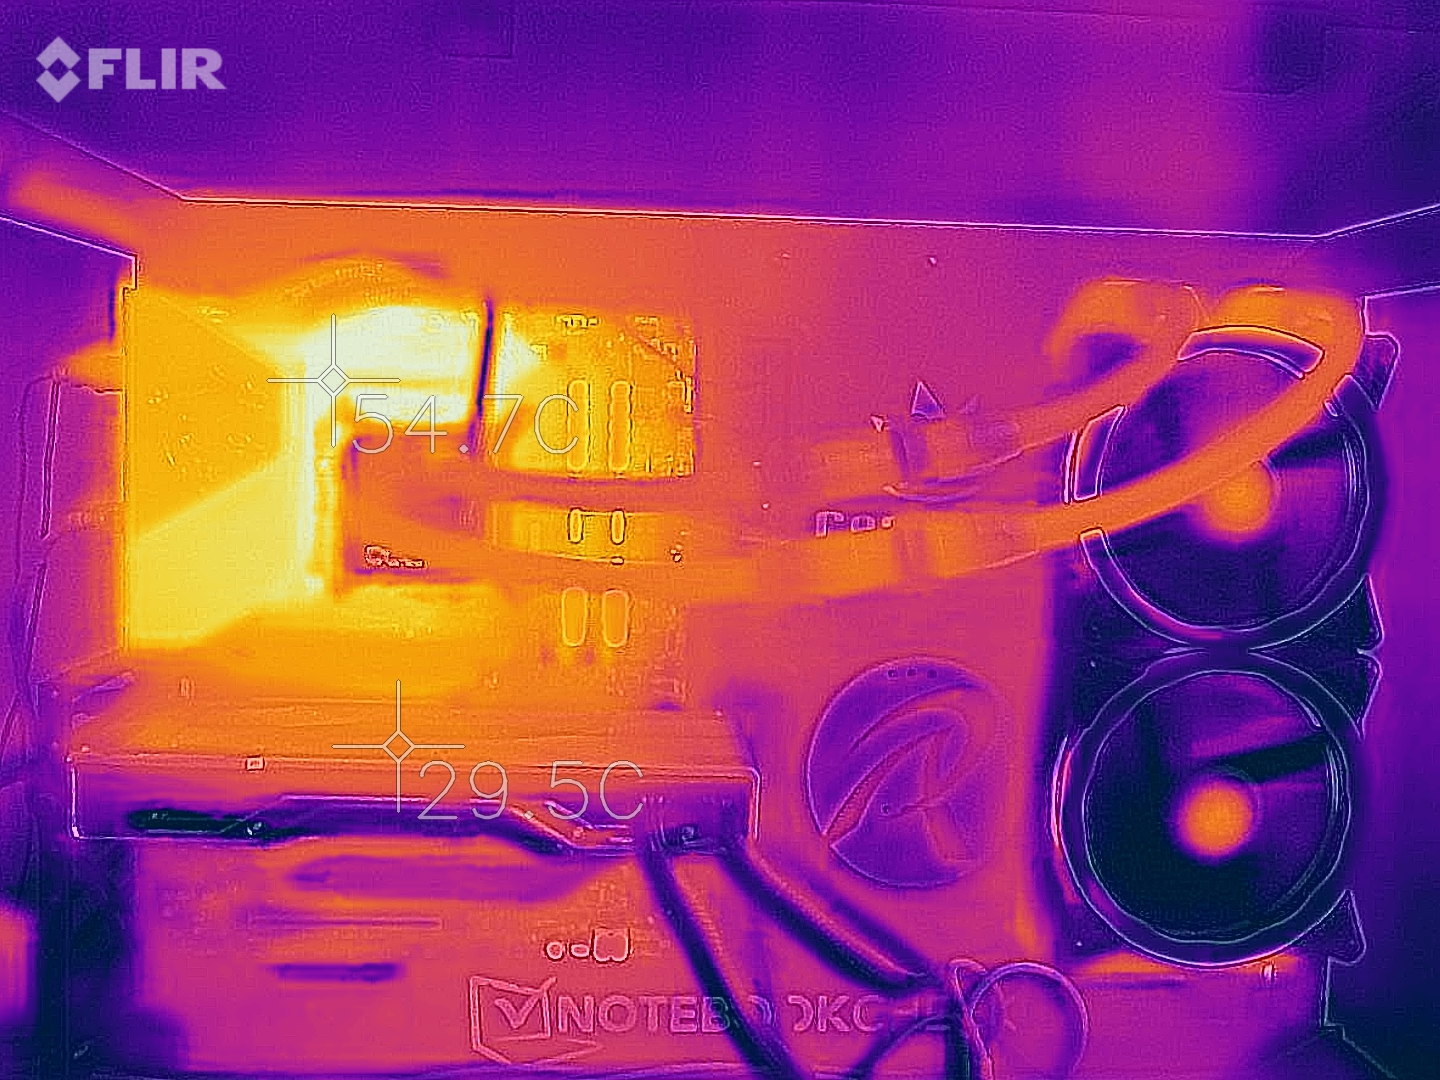
Sotto carico, anche un sistema di raffreddamento a liquido all-in-one di Alphacool fa fatica a mantenere il Core i9-10900K Intel Core abbastanza fresco. Il chip a dieci cores ha raggiunto gli 88 °C (190,4°F) nel nostro test sotto sforzo. Il Core i5-10600K ( 158°F) è più facile da raffreddare. Durante lo stress test, è arrivato solo fino a circa 70 °C.
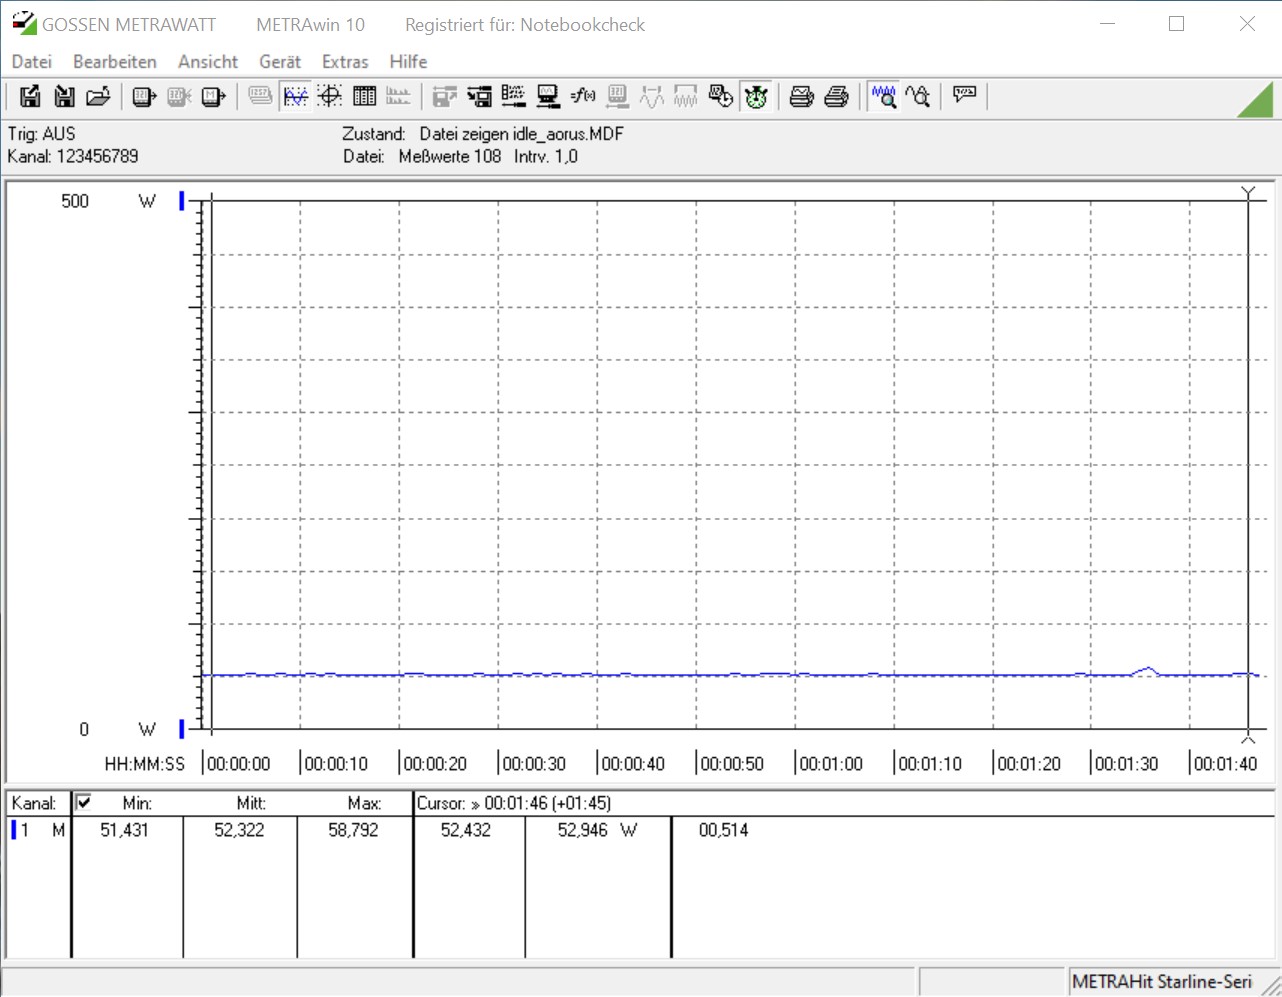
Si prega di notare:
Poiché il consumo di potenza variava molto sull'MSI Z490 Unify, abbiamo usato il Gigabyte Aorus Z490 Master per misurare l'assorbimento di potenza.
| Power Consumption | |
| 1920x1080 The Witcher 3 ultra (external Monitor) | |
| AMD Ryzen 9 3950X (Idle: 95 W) | |
| AMD Ryzen 9 3900X (Idle: 87.4 W) | |
| Intel Core i9-10900K (Idle: 52.3 W) | |
| Intel Core i9-9900KS, Nvidia Titan RTX (Idle: 48.6 W) | |
| Intel Core i5-10600K (Idle: 52.2 W) | |
| Intel Core i5-9600K, AMD Radeon RX Vega 64 | |
| Prime95 V2810 Stress (external Monitor) | |
| Intel Core i9-10900K (Idle: 52.3 W) | |
| Intel Core i9-9900KS, Nvidia Titan RTX (Idle: 48.6 W) | |
| Intel Core i5-10600K (Idle: 52.2 W) | |
| AMD Ryzen 9 3950X (Idle: 95 W) | |
| AMD Ryzen 9 3900X (Idle: 87.4 W) | |
| Intel Core i5-9600K, AMD Radeon RX Vega 64 | |
| Cinebench R15 Multi (external Monitor) | |
| Intel Core i9-9900KS, Nvidia Titan RTX (Idle: 48.6 W) | |
| Intel Core i9-10900K (Idle: 52.3 W) | |
| AMD Ryzen 9 3950X (Idle: 95 W) | |
| AMD Ryzen 9 3900X (Idle: 87.4 W) | |
| Intel Core i5-10600K (Idle: 52.2 W) | |
| Intel Core i5-9600K, AMD Radeon RX Vega 64 | |
| Temperatures - CPU Temperature Prime95 | |
| Intel Core i9-10900K | |
| AMD Ryzen 9 3950X | |
| AMD Ryzen 9 3900X | |
| Intel Core i5-10600K | |
* ... Meglio usare valori piccoli
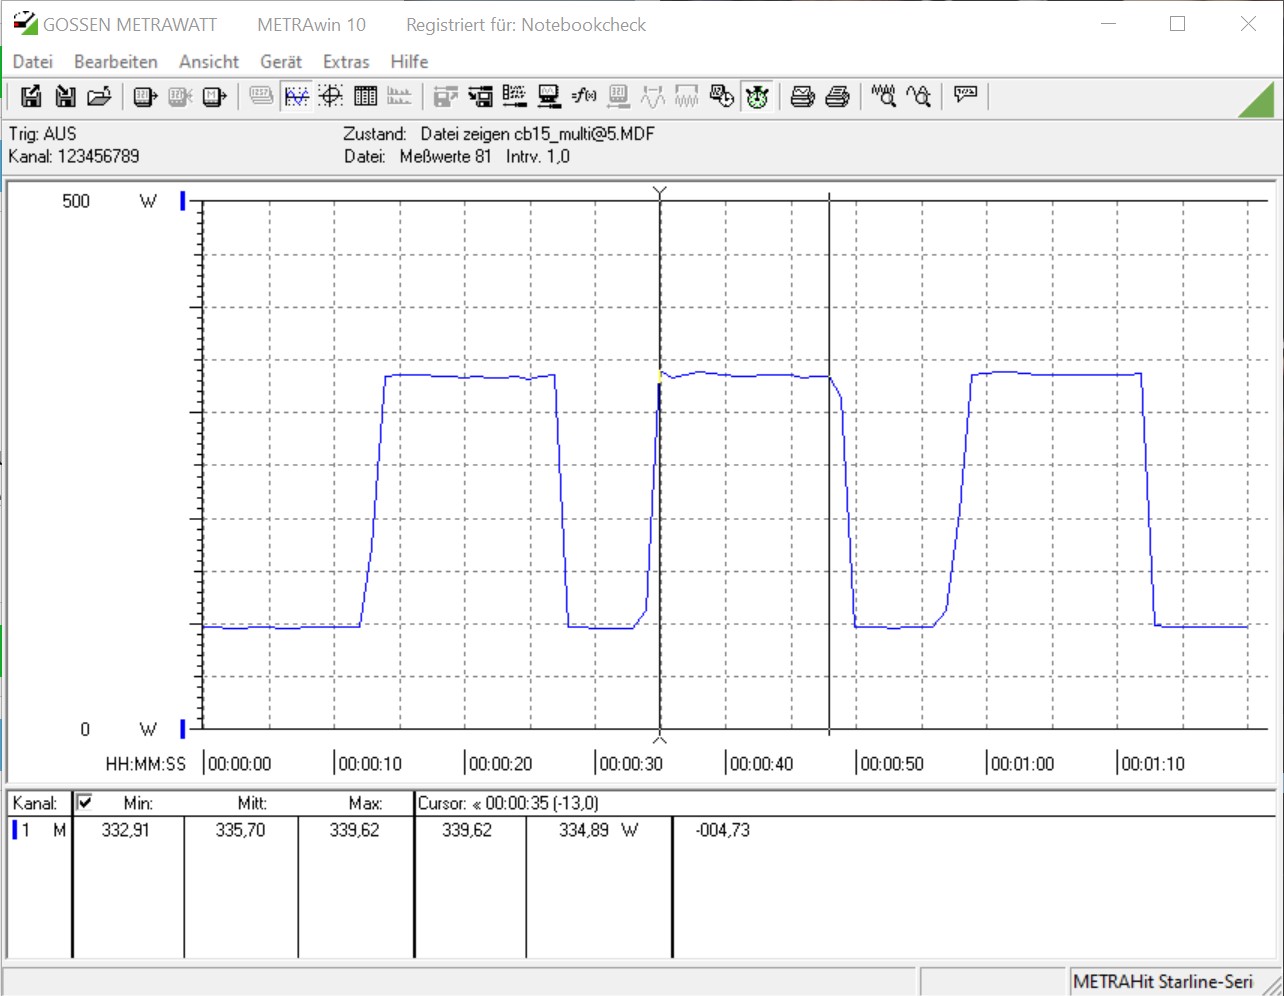
Overclocking - non raccomandato
Nonostante il fatto che le CPU Intel siano costruite per il massimo delle prestazioni, abbiamo fatto alcuni tentativi di overclocking. Tutti i chip "K" offrono un moltiplicatore sbloccato, che semplifica notevolmente il processo di overclocking. Nel nostro caso, siamo stati in grado di ottenere un overclock stabile a 5,3 GHz con l'Intel Core i9-10900K. Tuttavia, con questo overclock, il nostro sistema ha assorbito 336 watt nel loop multi-core Cinebench R15, ovvero 67 watt in più rispetto a quanto consumava la configurazione di stock. Quando abbiamo sovraccaricato l'Intel Core i5-10600K abbiamo visto risultati molto simili. In questo caso, siamo stati in grado di ottenere un overclock all-core a 5.0-GHz, con un assorbimento di potenza che è passato da 173 watt a 266 watt nel loop multi-core Cinebench R15.
Intel Core i9-10900K
Pro
Contro
Intel Core i5-10600K
Pro
Contro
Giudizio Complessivo — E' ancora la CPU gaming più veloce al mondo
Con le CPU Comet Lake-S, Intel porta per la prima volta i chip a 10 cores nel merecato. Tuttavia, chi vuole fare l'upgrade dovrà procurarsi una nuova scheda madre, perché il socket LGA 1151 è stato sostituito con LGA 1200. Ci sono quattro nuovi chipset, con lo Z490 al top dell'offerta.
Sia l'Intel Core i9-10900K che l'Intel Core i5-10600K sono andati molto bene nella nostra recensione. Il Core i9-10900K è il chip di punta di Intel sul nuovo socket. Offre un livello molto alto di prestazioni nei videogiochi. Grazie a 10 cores fisici, il processore si comporta molto bene nelle applicazioni multi-thread, il che gli conferisce un vantaggio rispetto all'Intel Core i9-9900KS. Tuttavia, il chip di Intel non riesce a superare le prestazioni delle sue controparti AMD in molti carichi di lavoro con molti thread.
L'Intel Core i9-10900K è la CPU gaming più veloce. Tuttavia, questa è una vittoria di Pirro per Intel, perché la sua CPU a 10 cores assorbe 250 watt durante i 56 secondi di Turbo Boost.
Nel complesso, Intel ha portato sul mercato 32 nuovi processori. Abbiamo anche potuto dare un'occhiata al Core i5-10600K, che è l'offerta di fascia media di Intel. Ha 6 cores e supporta l'Hyper-threading, che in precedenza era riservato solo ai modelli di fascia alta. Rispetto all'Intel Core i5-9600K, il Core i5-10600K offre un livello di prestazioni superiore. Il chip Comet Lake-S di fascia media ha fatto molto bene anche nei nostri gaming benchmarks.
C'è però un grosso svantaggio, che ha a che fare con il fatto che le nuove CPU consumano molta energia. Inoltre, Intel utilizza ancora il nodo a 14 nm per realizzare questi chip, che sta iniziando a mostrare la sua età. Vedremo se i chip Rocket Lake-S saranno costruiti con lo stesso processo o meno.