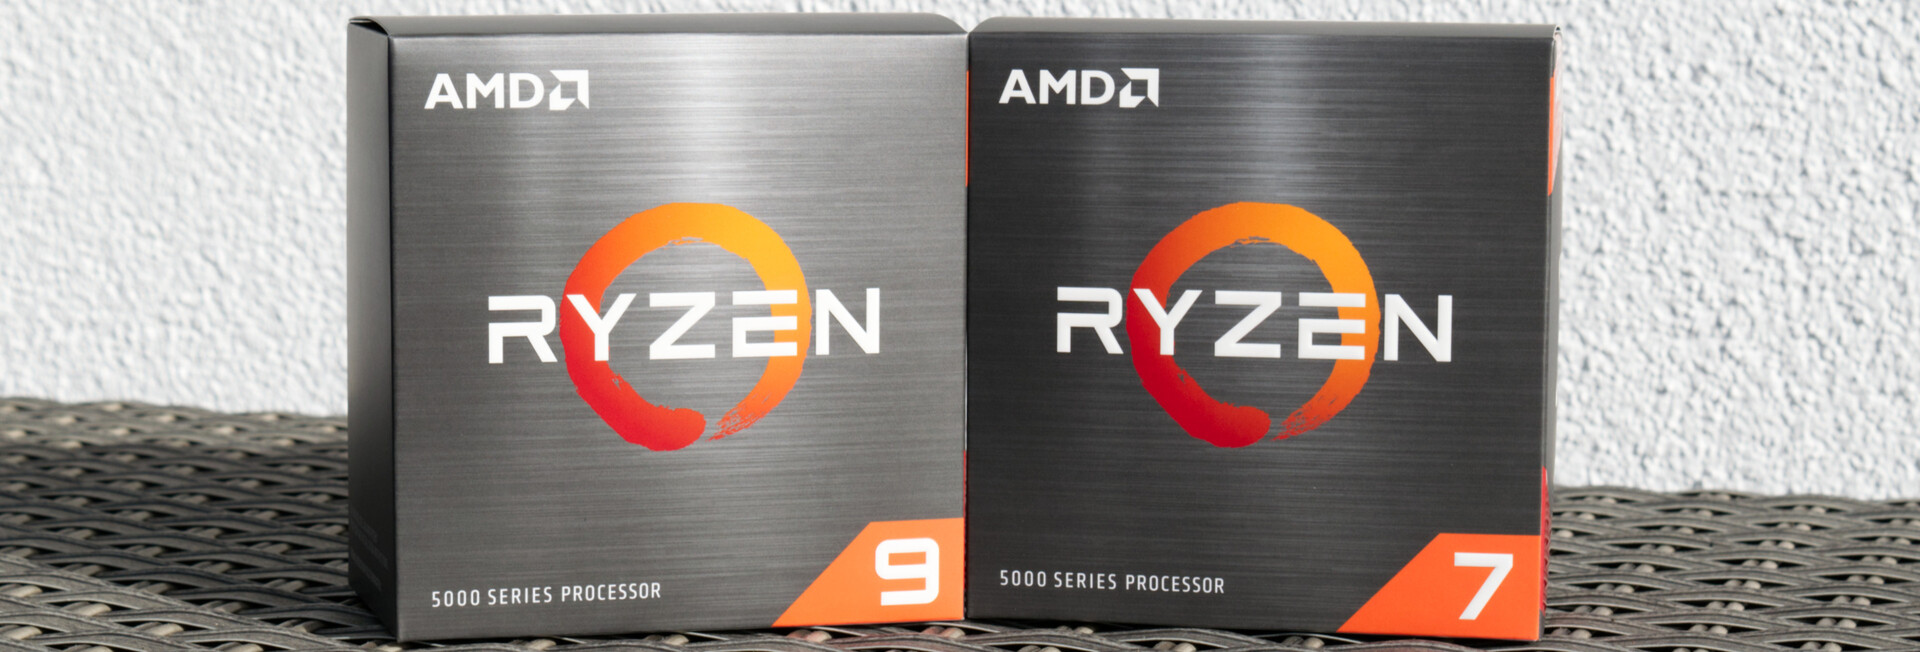
Recensione delle AMD Ryzen 9 5900X e AMD Ryzen 7 5800X: AMD detronizza Intel come CPU gaming più veloce
La nascita della serie Ryzen 3000 di AMD ha portato nuova vita al mercato delle CPU. Per la prima volta è stato possibile ottenere una CPU a 16 cores che si inserisce in un socket AM4. Per quanto riguarda le prestazioni, queste nuove CPU erano per lo più in grado di competere con i processori Intel in scenari multi-core con cui erano molto più avanti rispetto alla concorrenza. Tuttavia, le prestazioni single-core sono rimaste un punto dolente, e Intel ha continuato ad offrire la CPU gaming più veloce disponibile ed è riuscita ad alzare ulteriormente l'asticella con l'Intel Core i9-10900K sacrificando l'efficienza energetica per ottenere prestazioni extra single-core. AMD, in cambio, ha continuato a ottimizzare la sua architettura Zen 3, aggiornando il carico e le unità di memorizzazione che, combinate con la cache, sono molto più potenti di prima. Sulla carta, si suppone che la Zen 3 offra un IPC superiore del 19 % rispetto alla Zen 2. Almeno in parte responsabili di questo aumento di prestazioni sono la larghezza di banda notevolmente migliorata e le latenze più basse. L'Infinity Fabric, il connettore tra le matrici della CPU e le matrici di I/O, funzionano fino a 2.000 MHz, con il risultato di una velocità ottimale della RAM di 4.000 MHz.
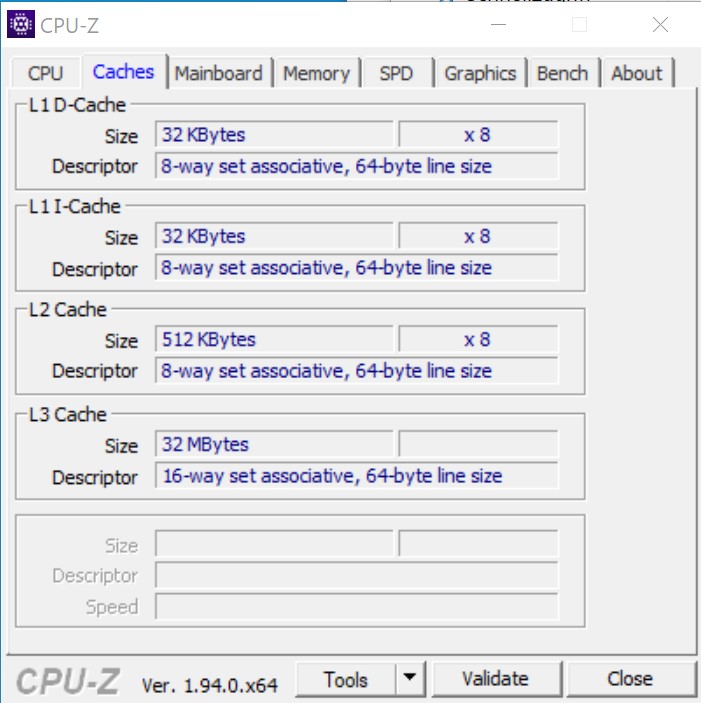
Esteticamente, non è cambiato molto sulla CPU. Una CCX Zen 3 ora contiene otto cores dove prima ce n'erano solo quattro. Ogni core ha accesso a 32 MB di cache L3. Il die di I/O è rimasto invariato e, a differenza della CPU da 7 nm, continua ad essere prodotta in un processo a 12 nm. Il prossimo passo sta nell'evoluzione della litografia, il processo di produzione a 5 nm che dovrebbe arrivare con lo Zen 4.
A differenza di Intel, AMD non ha dovuto aumentare le valutazioni TDP di una quantità significativa, e le nuove CPU Vermeer sono quindi compatibili con i chipset della serie 500 esistenti. Rispetto al Core i9-10900K di Intel i9-10900K il consumo di energia fino a 250 W le nuove CPU di AMD sono significativamente più efficienti dal punto di vista energetico.
Die AMD-Ryzen-Prozessoren im Überblick
| Modello | Cores/Threads | Base Clock | Turbo Clock | L3-Cache | TDP | MSRP al lancio |
|---|---|---|---|---|---|---|
| Ryzen 9 5950X | 16/32 | 3,4 GHz | 4,9 GHz | 64MB | 105Watt | $799 |
| Ryzen 9 3950X | 16/32 | 3,5 GHz | 4,7 GHz | 64 MB | 105 Watt | $749 |
| Ryzen 9 5900X | 12/24 | 3,7 GHz | 4,8 GHz | 64MB | 105Watt | $549 |
| Ryzen 9 3900XT | 12/24 | 3,8 GHz | 4,7 GHz | 64 MB | 105 Watt | $499 |
| Ryzen 9 3900X | 12/24 | 3,8 GHz | 4,6 GHz | 64 MB | 105 Watt | $499 |
| Ryzen 7 5800X | 8/16 | 3,8 GHz | 4,7 GHz | 32 MB | 105Watt | $449 |
| Ryzen 7 3800XT | 8/16 | 3,9 GHz | 4,7 GHz | 32 MB | 105 Watt | $399 |
| Ryzen 7 3800X | 8/16 | 3,9 GHz | 4,5 GHz | 32 MB | 105 Watt | $399 |
| Ryzen 7 3700X | 8/16 | 3,6 GHz | 4,4 GHz | 32 MB | 65 Watt | $329 |
| Ryzen 5 5600X | 6/12 | 3,7 GHz | 4,6 GHz | 32MB | 65Watt | $299 |
| Ryzen 5 3600XT | 6/12 | 3,8 GHz | 4,5 GHz | 32 MB | 95 Watt | $249 |
| Ryzen 5 3600X | 6/12 | 3,8 GHz | 4,4 GHz | 32 MB | 95 Watt | $229 |
| Ryzen 5 3600 | 6/12 | 3,6 GHz | 4,2 GHz | 32 MB | 65 Watt | $199 |
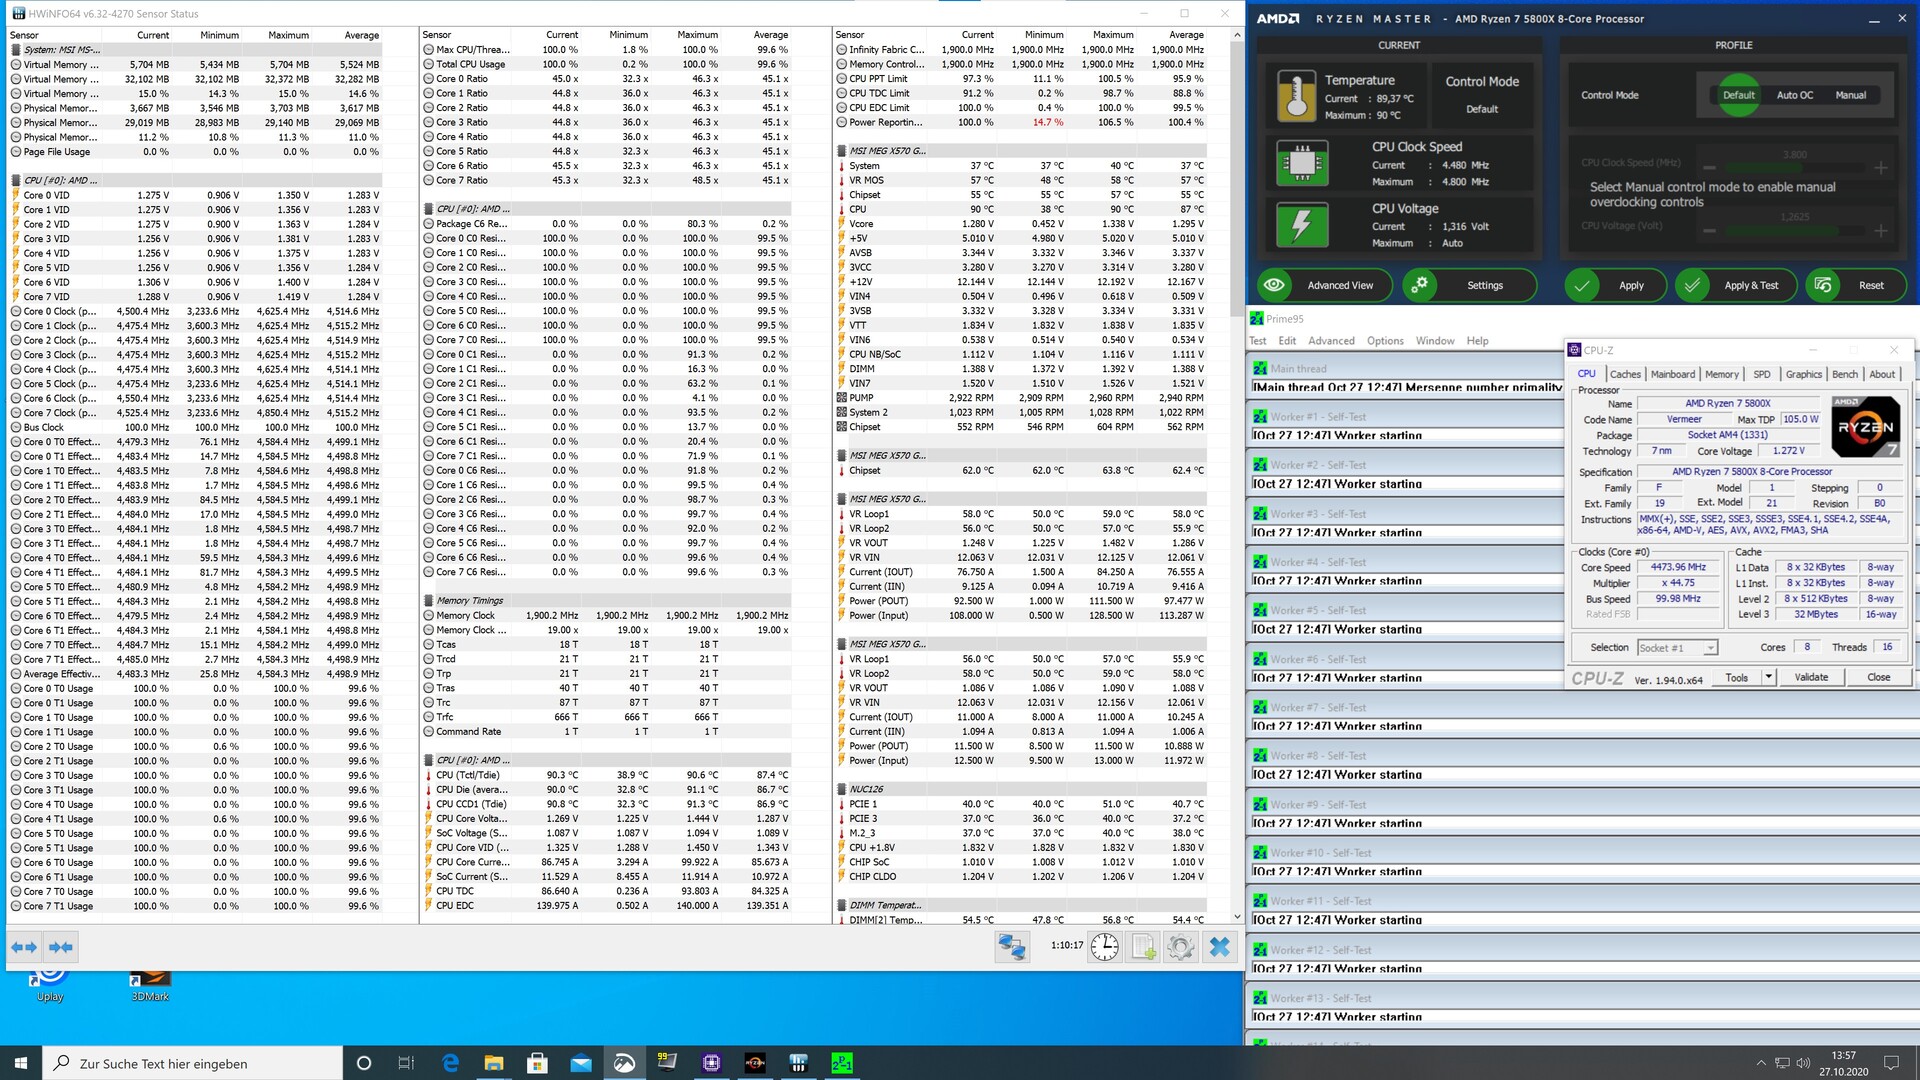
Dettagli del sistema di test
Abbiamo utilizzato il seguente sistema per eseguire tutti i parametri di riferimento e i test di questa revisione:
- BenctableRaijintek Pean
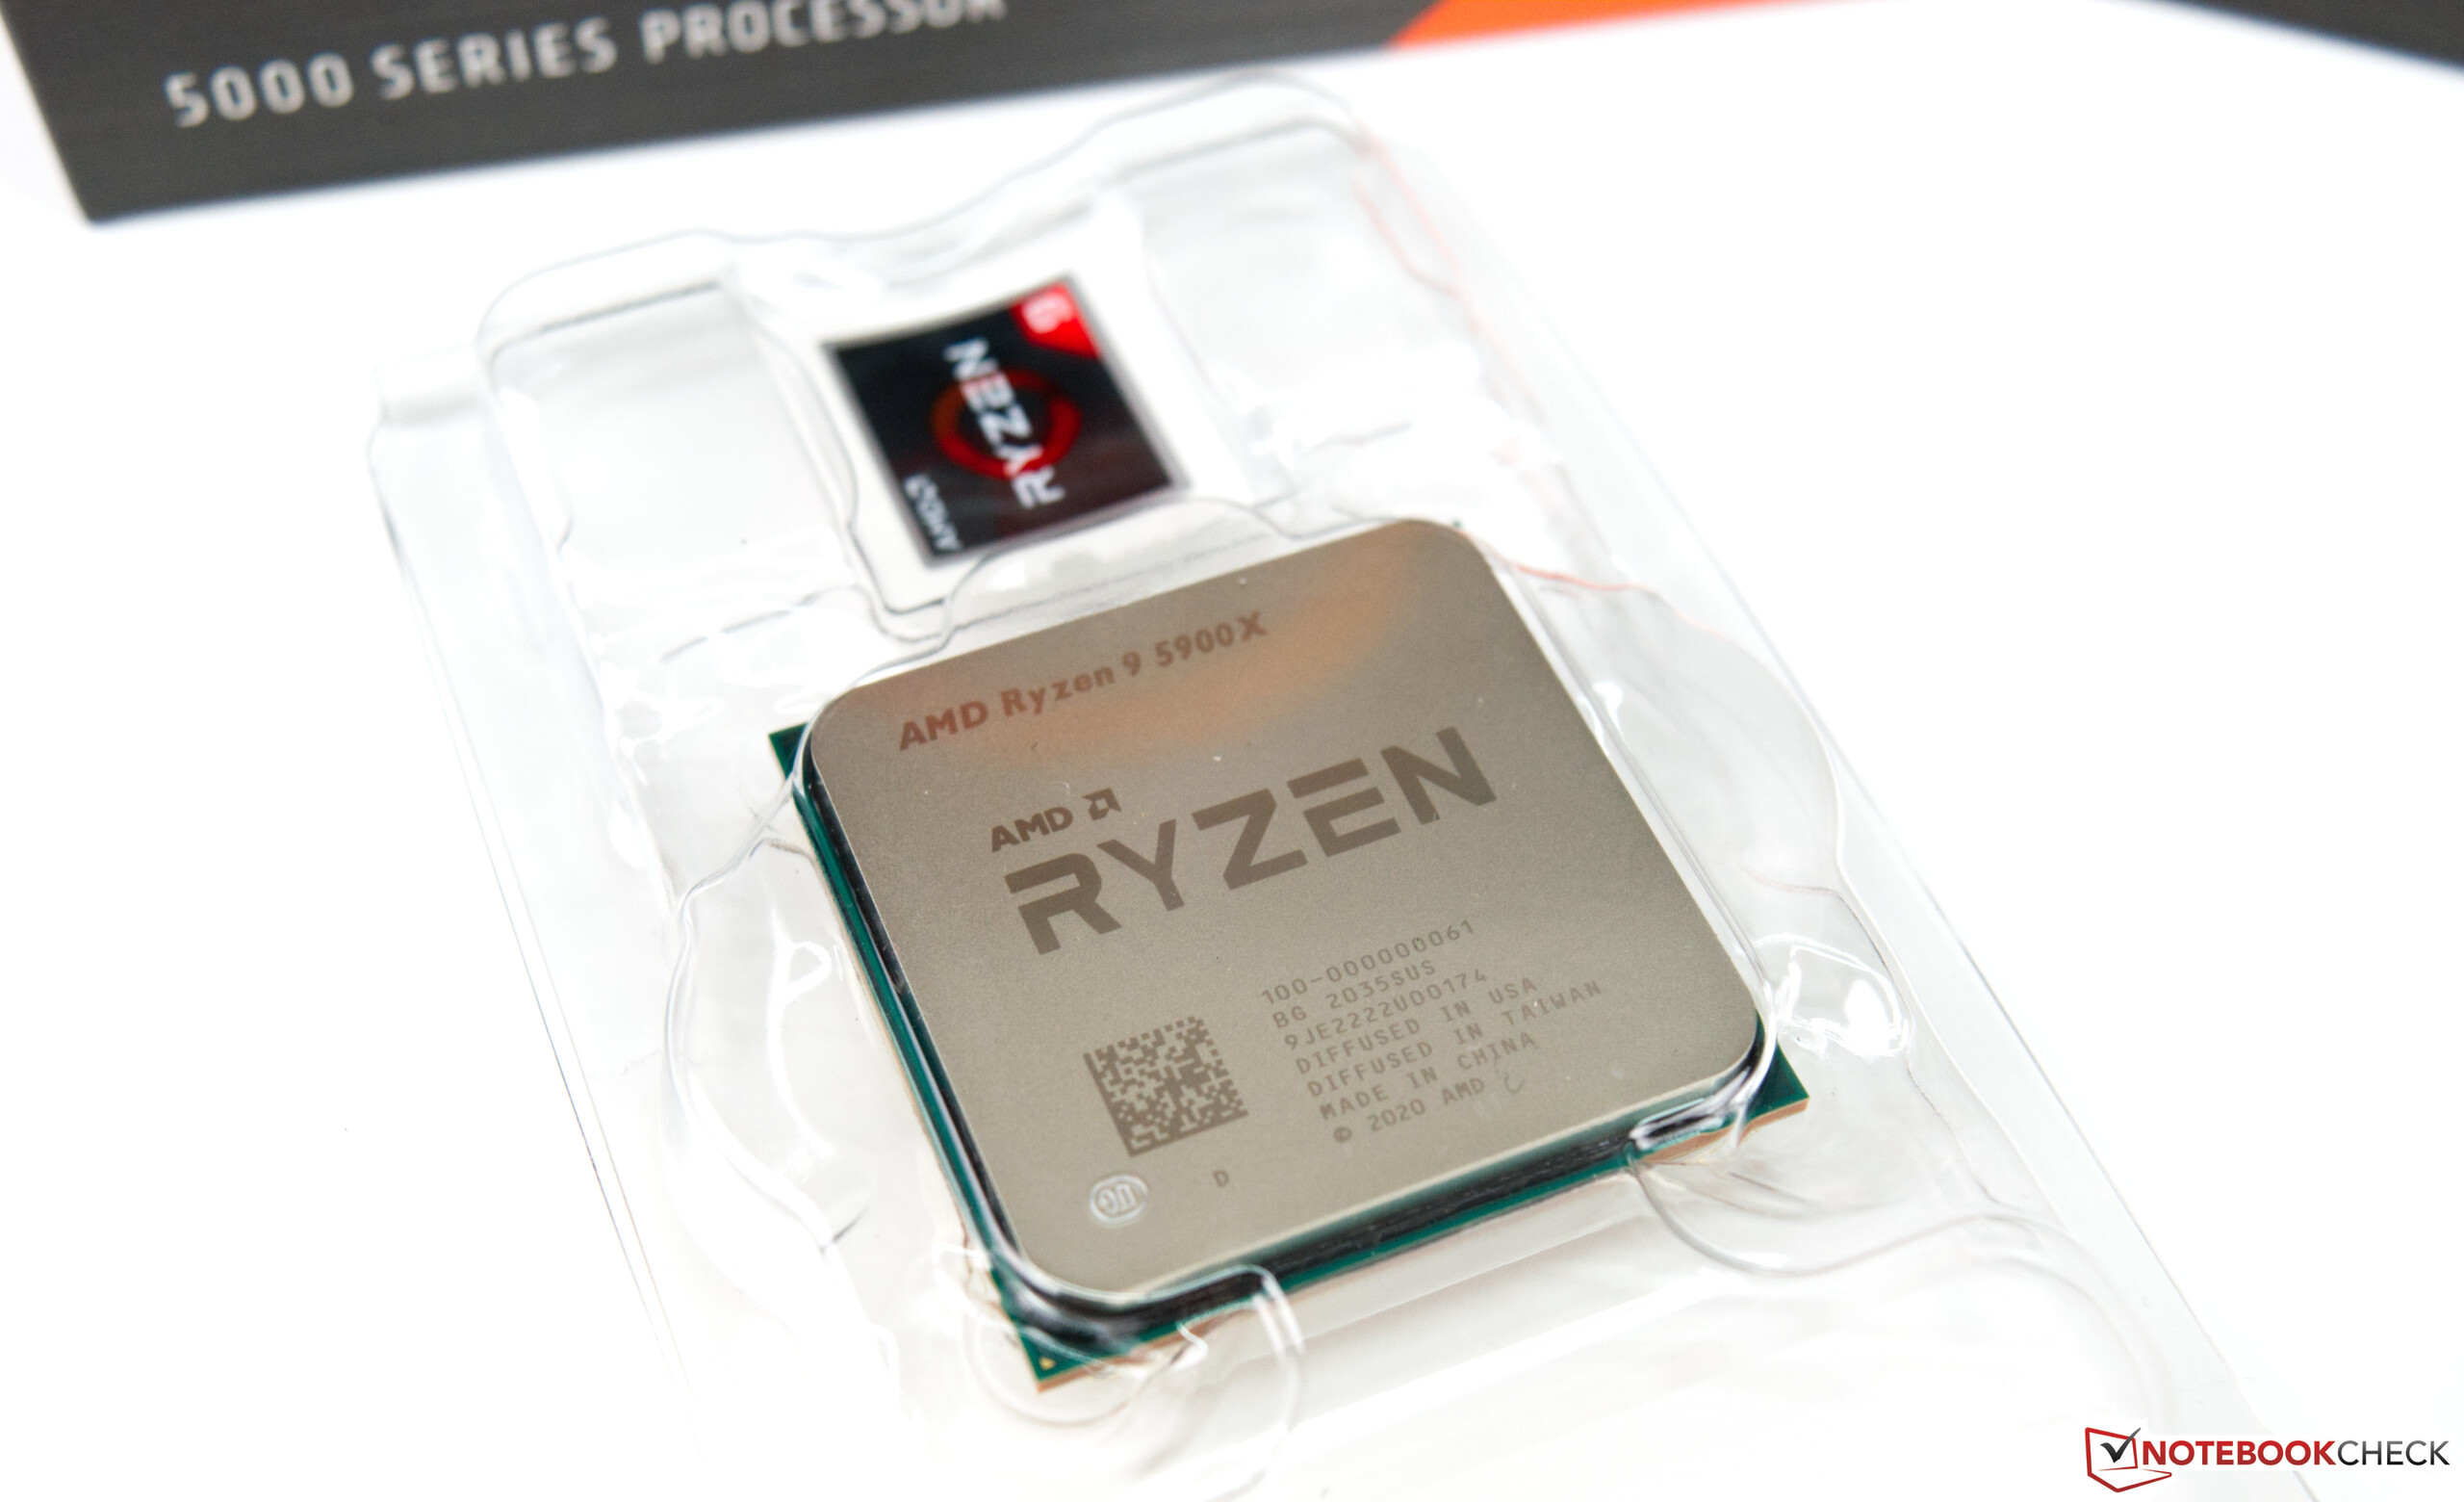
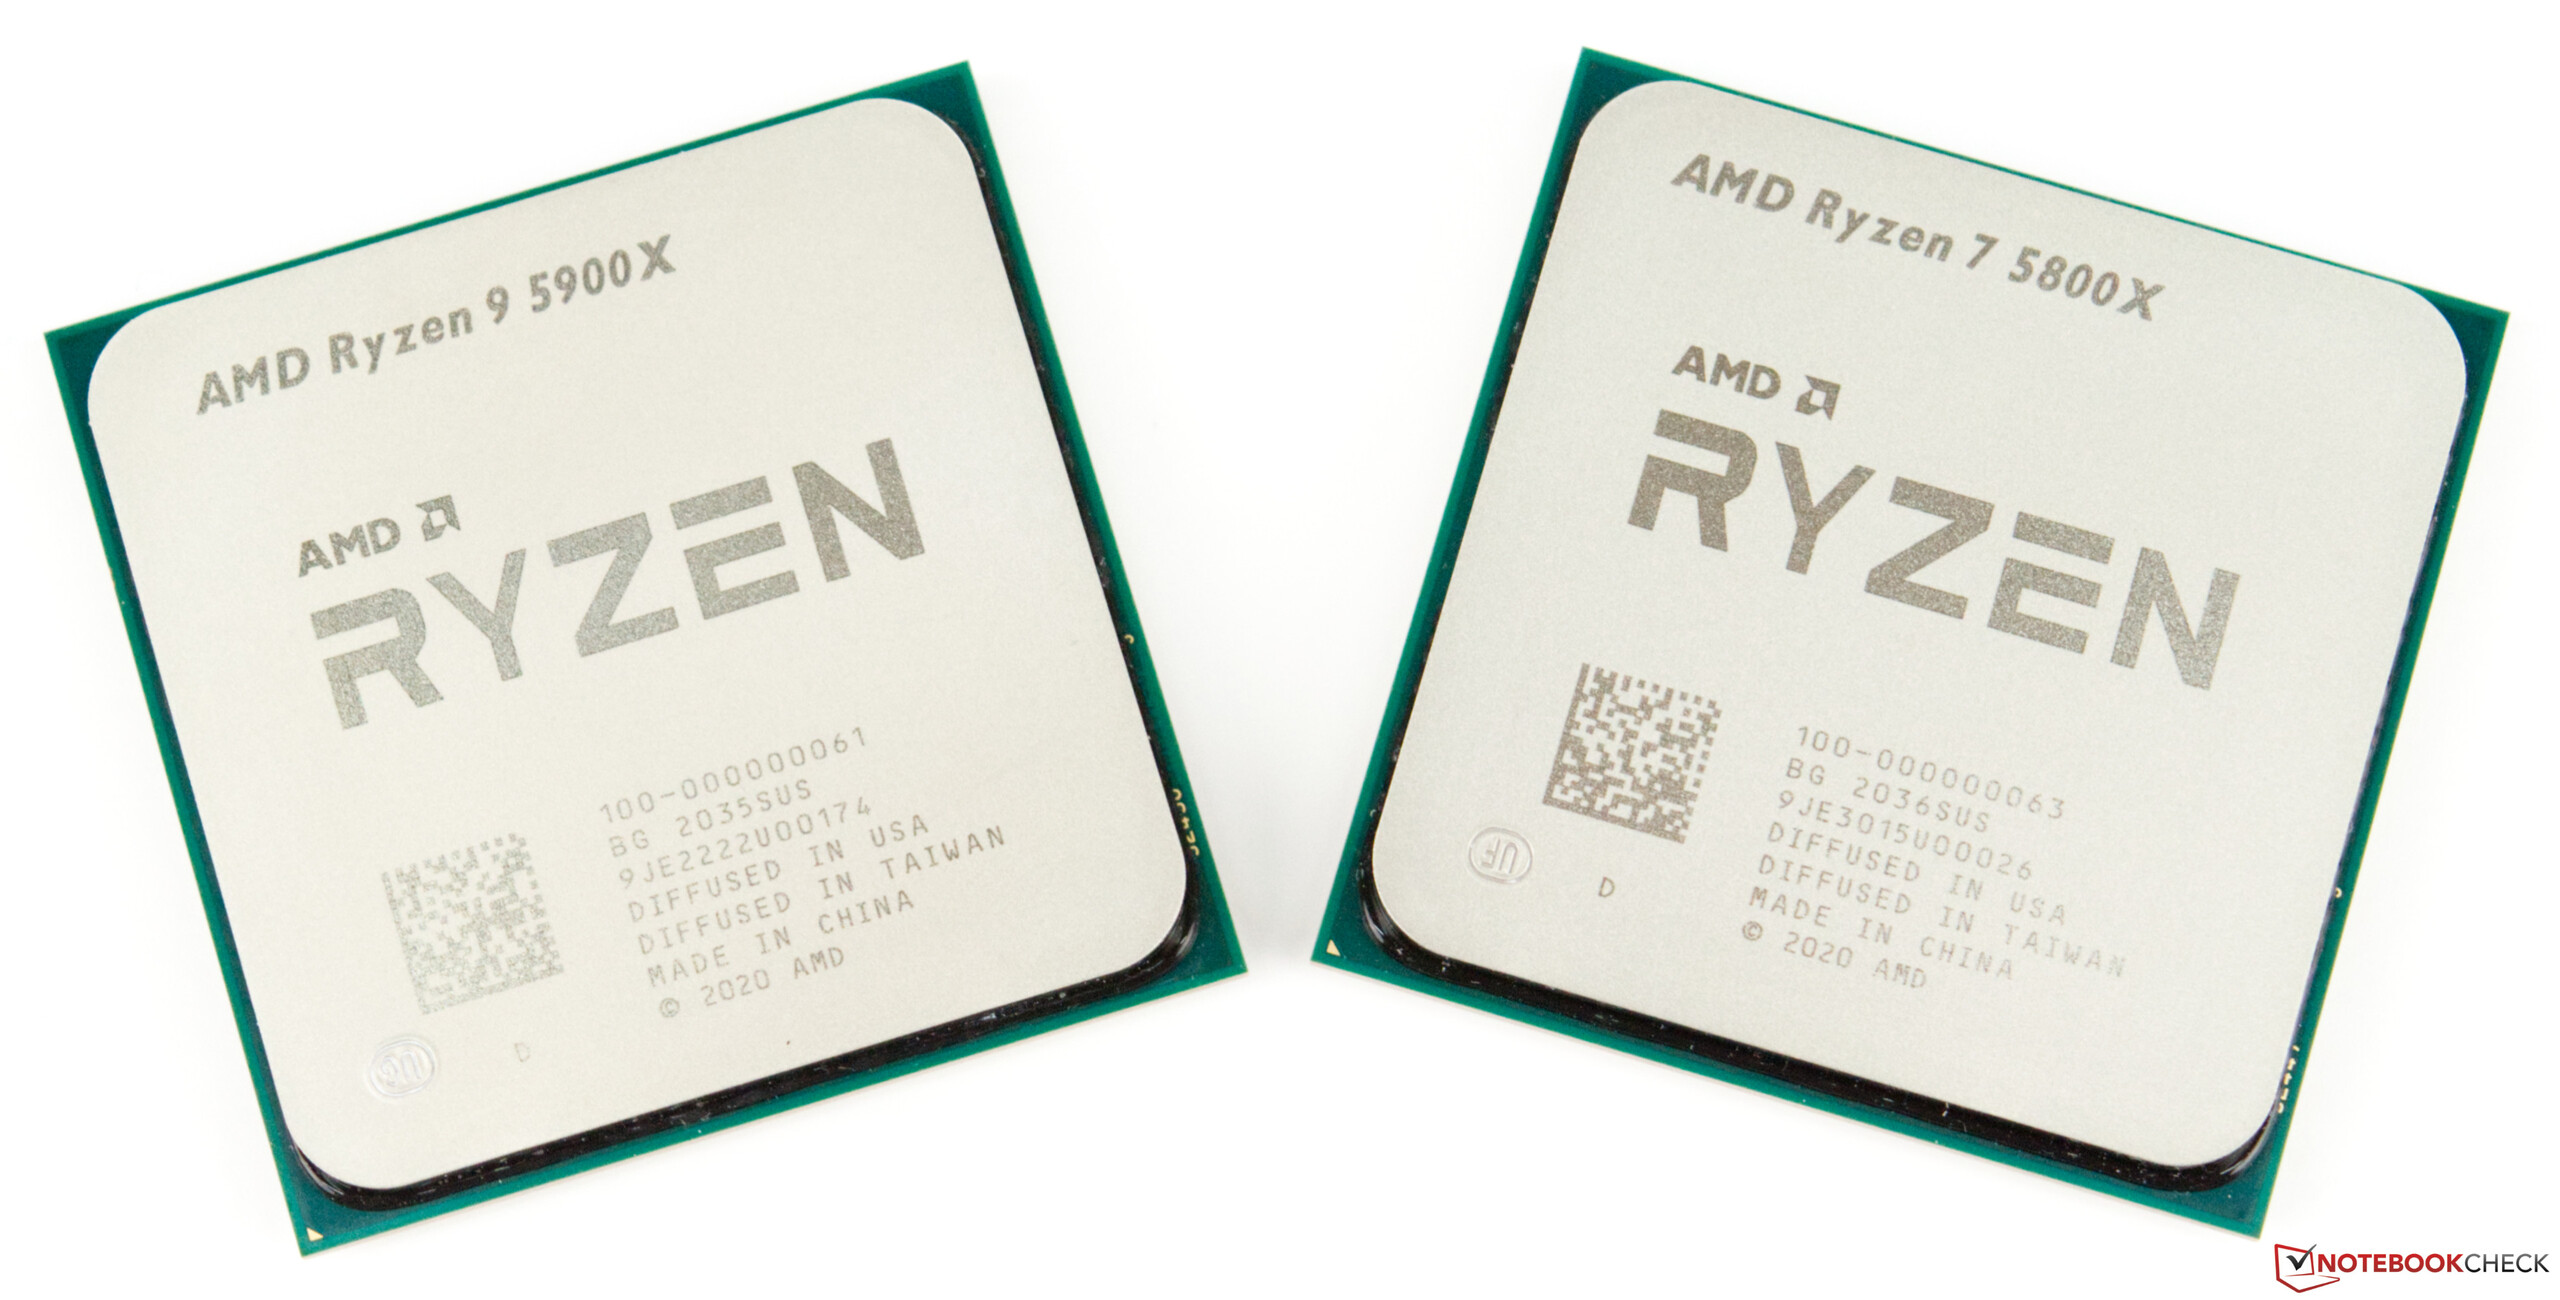
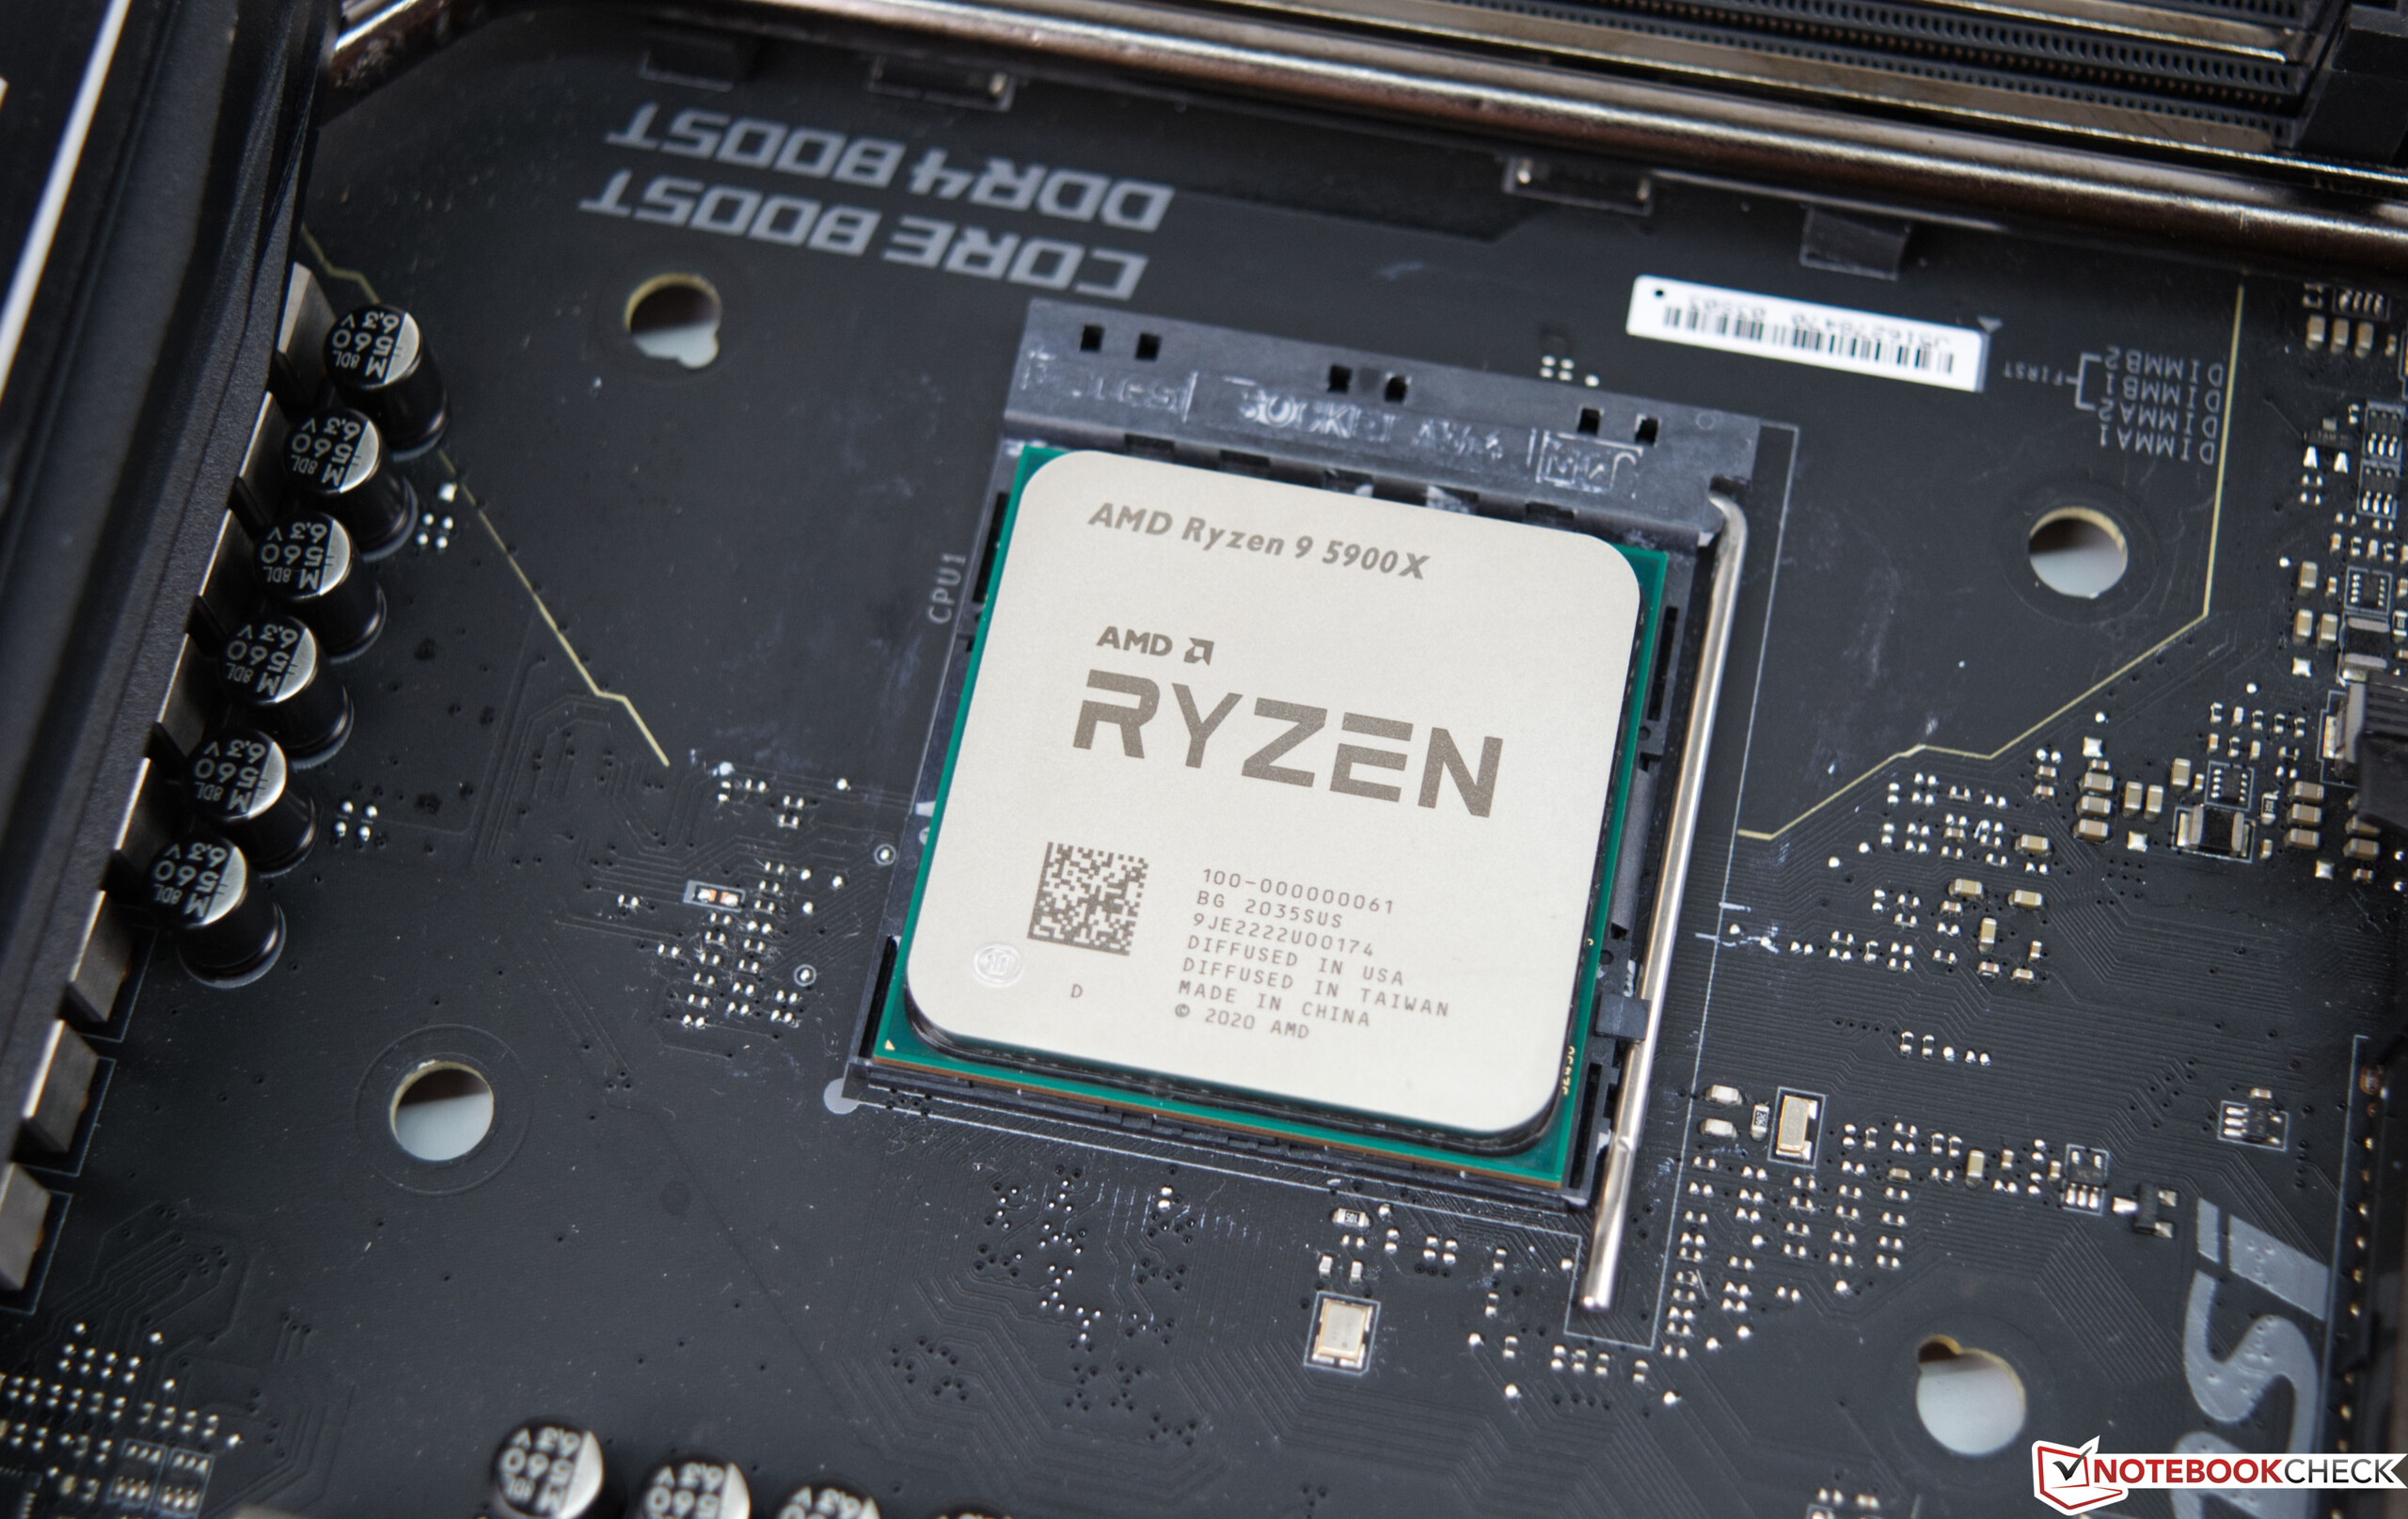
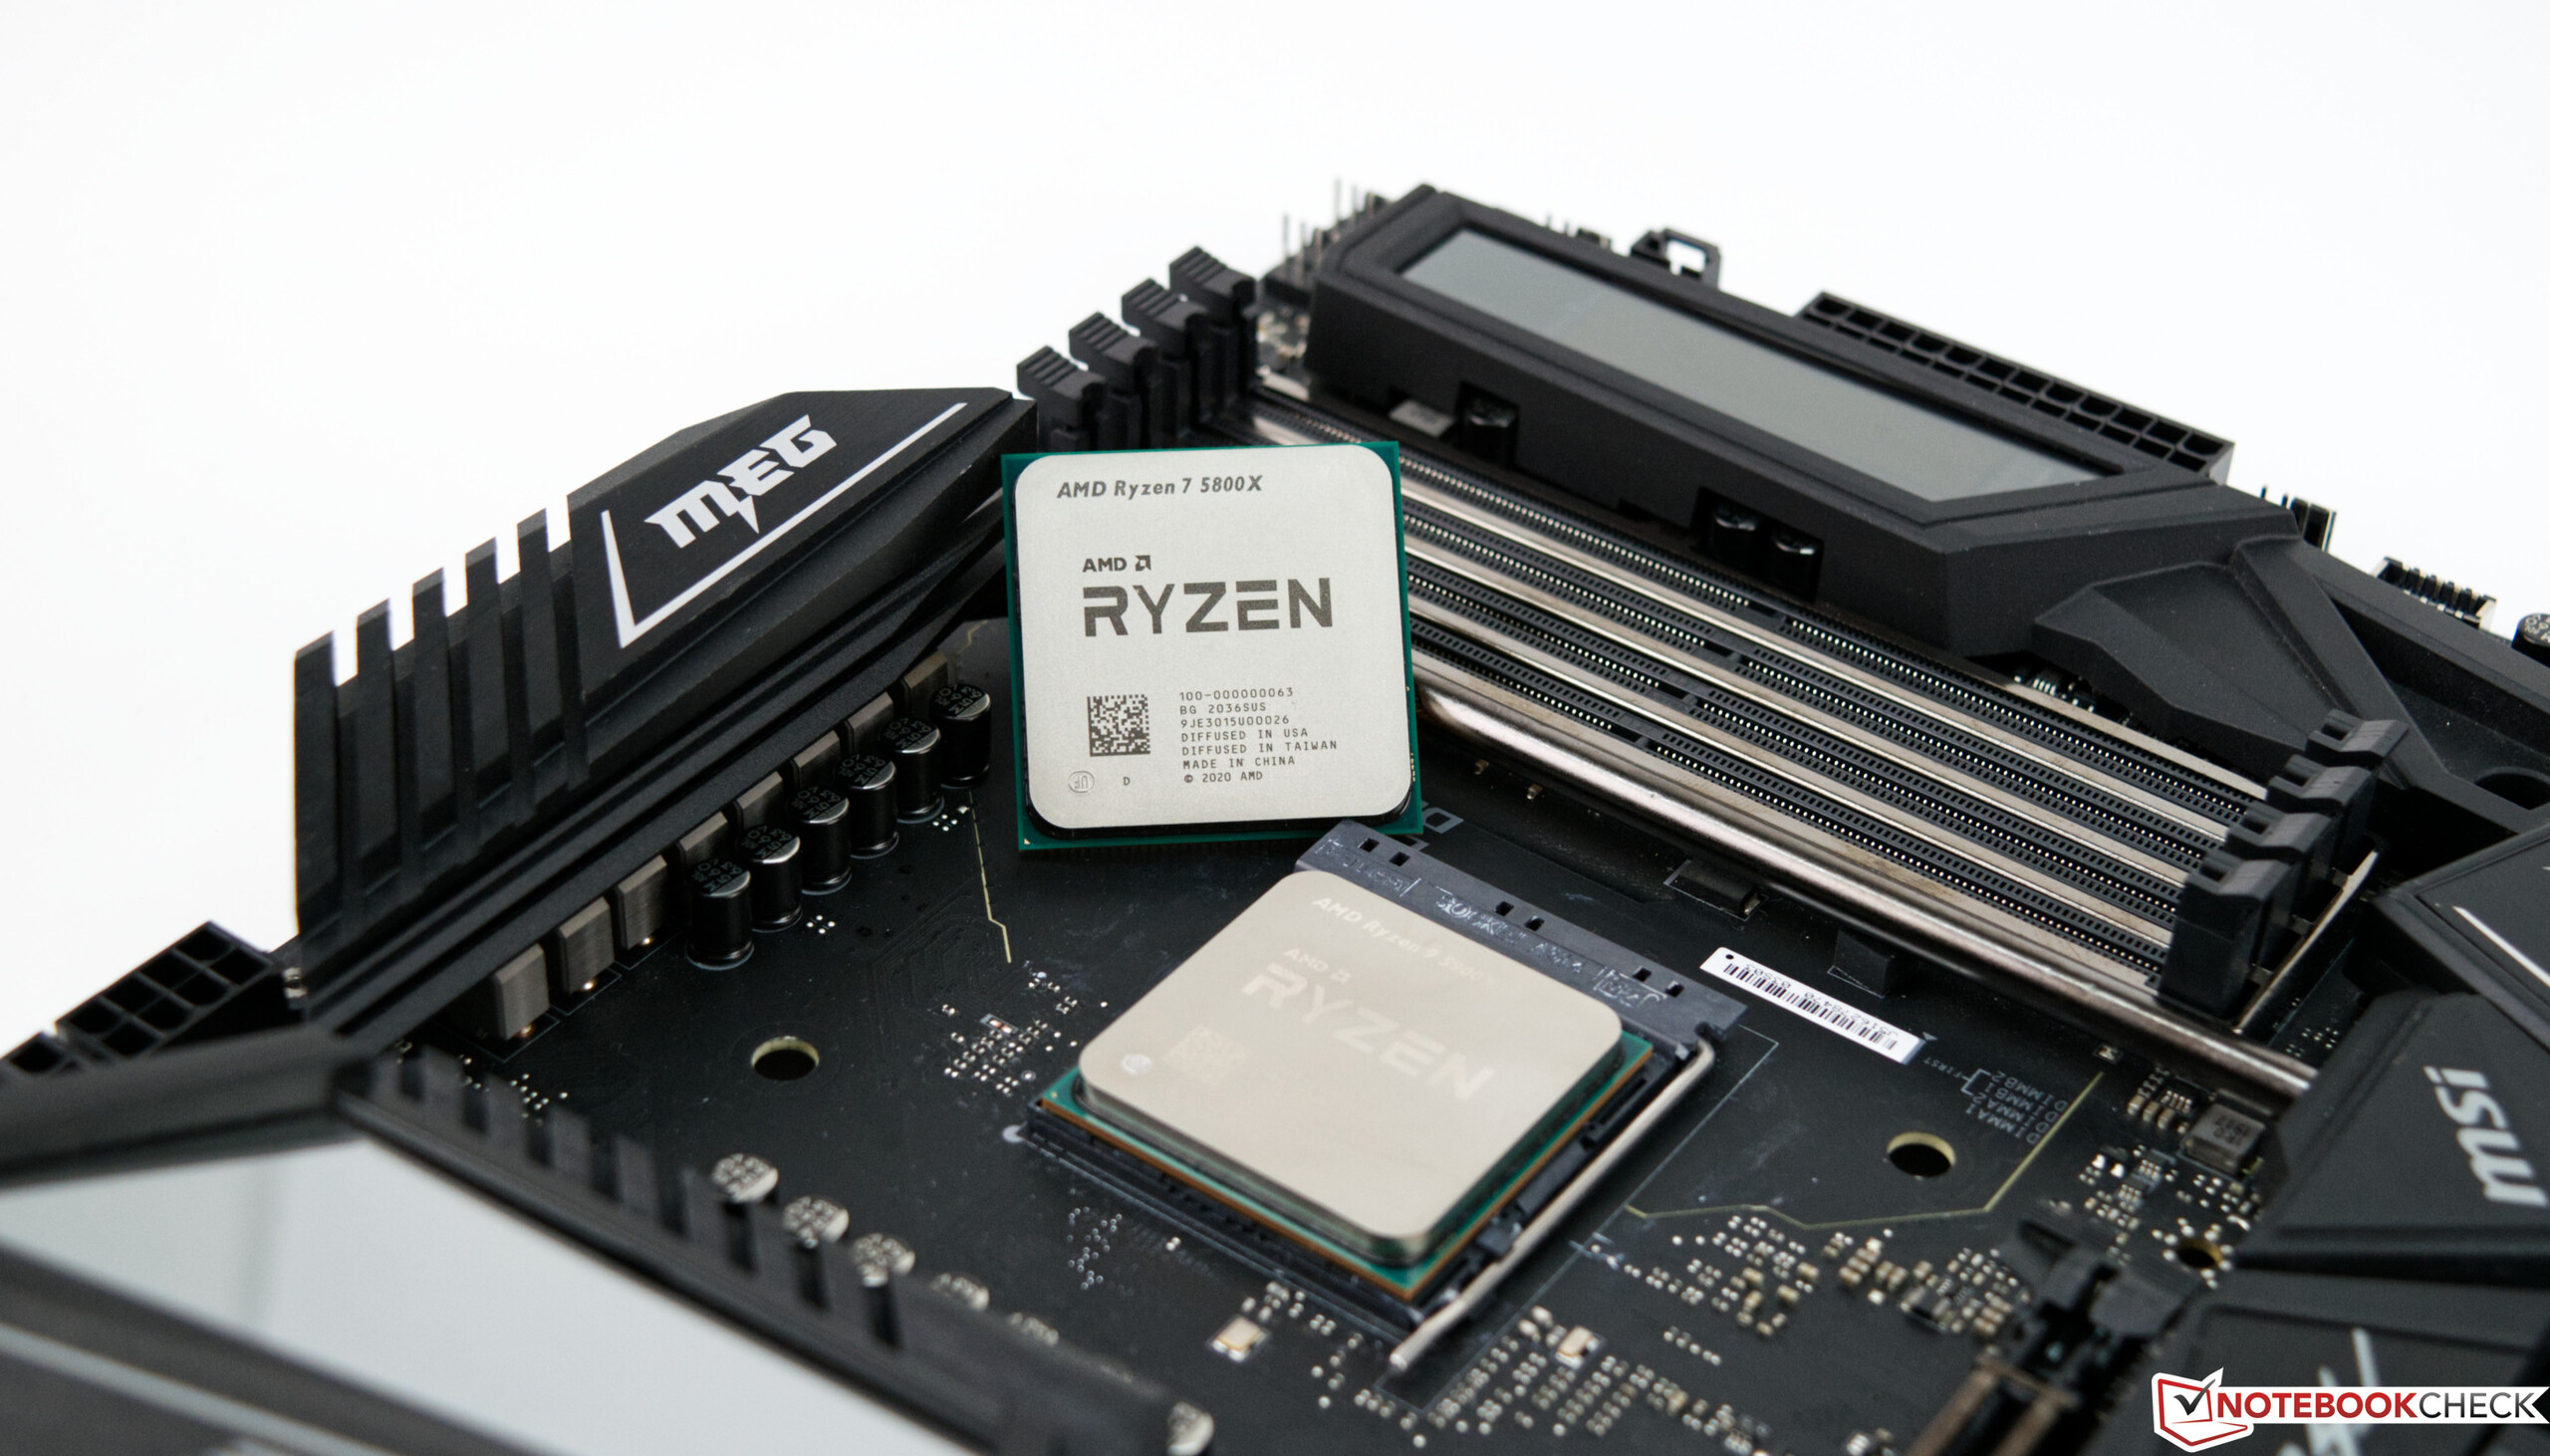
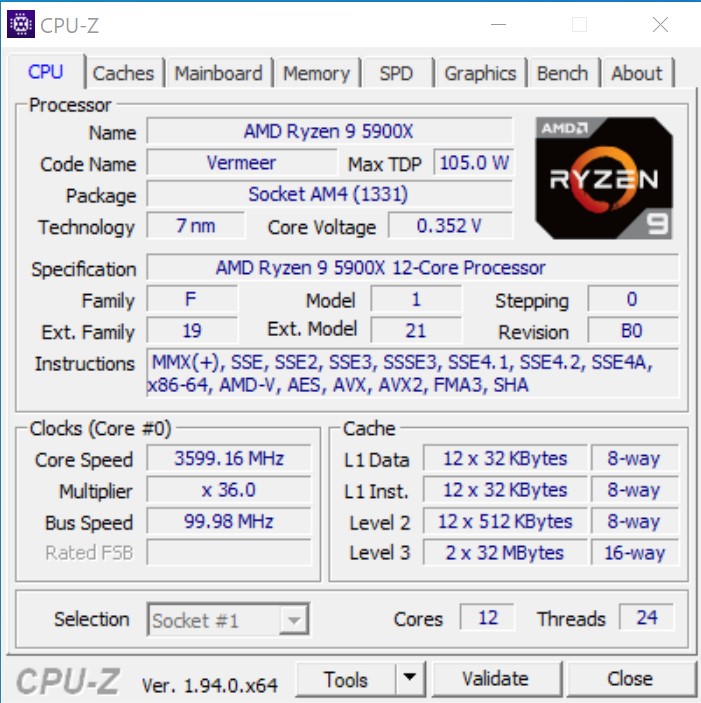
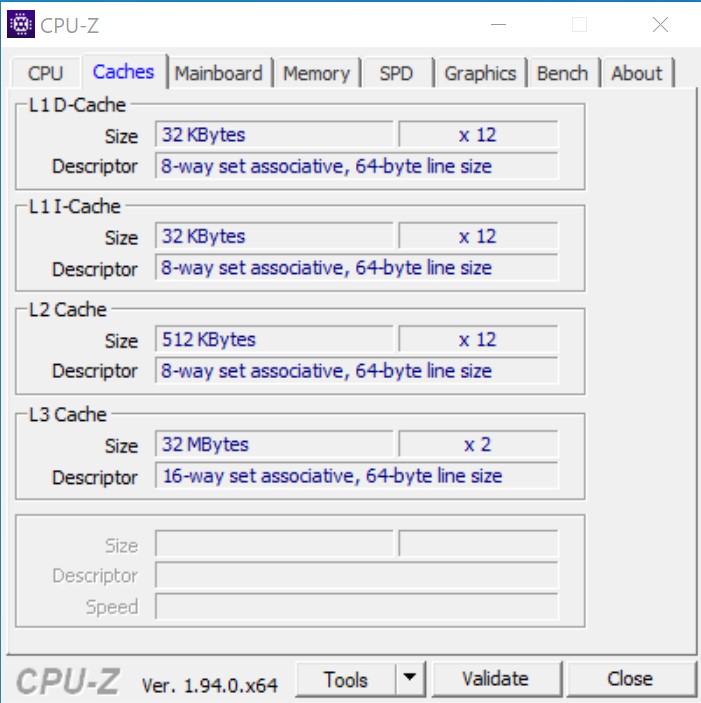
- AMD Ryzen 9 5900X, AMD Ryzen 7 5800X
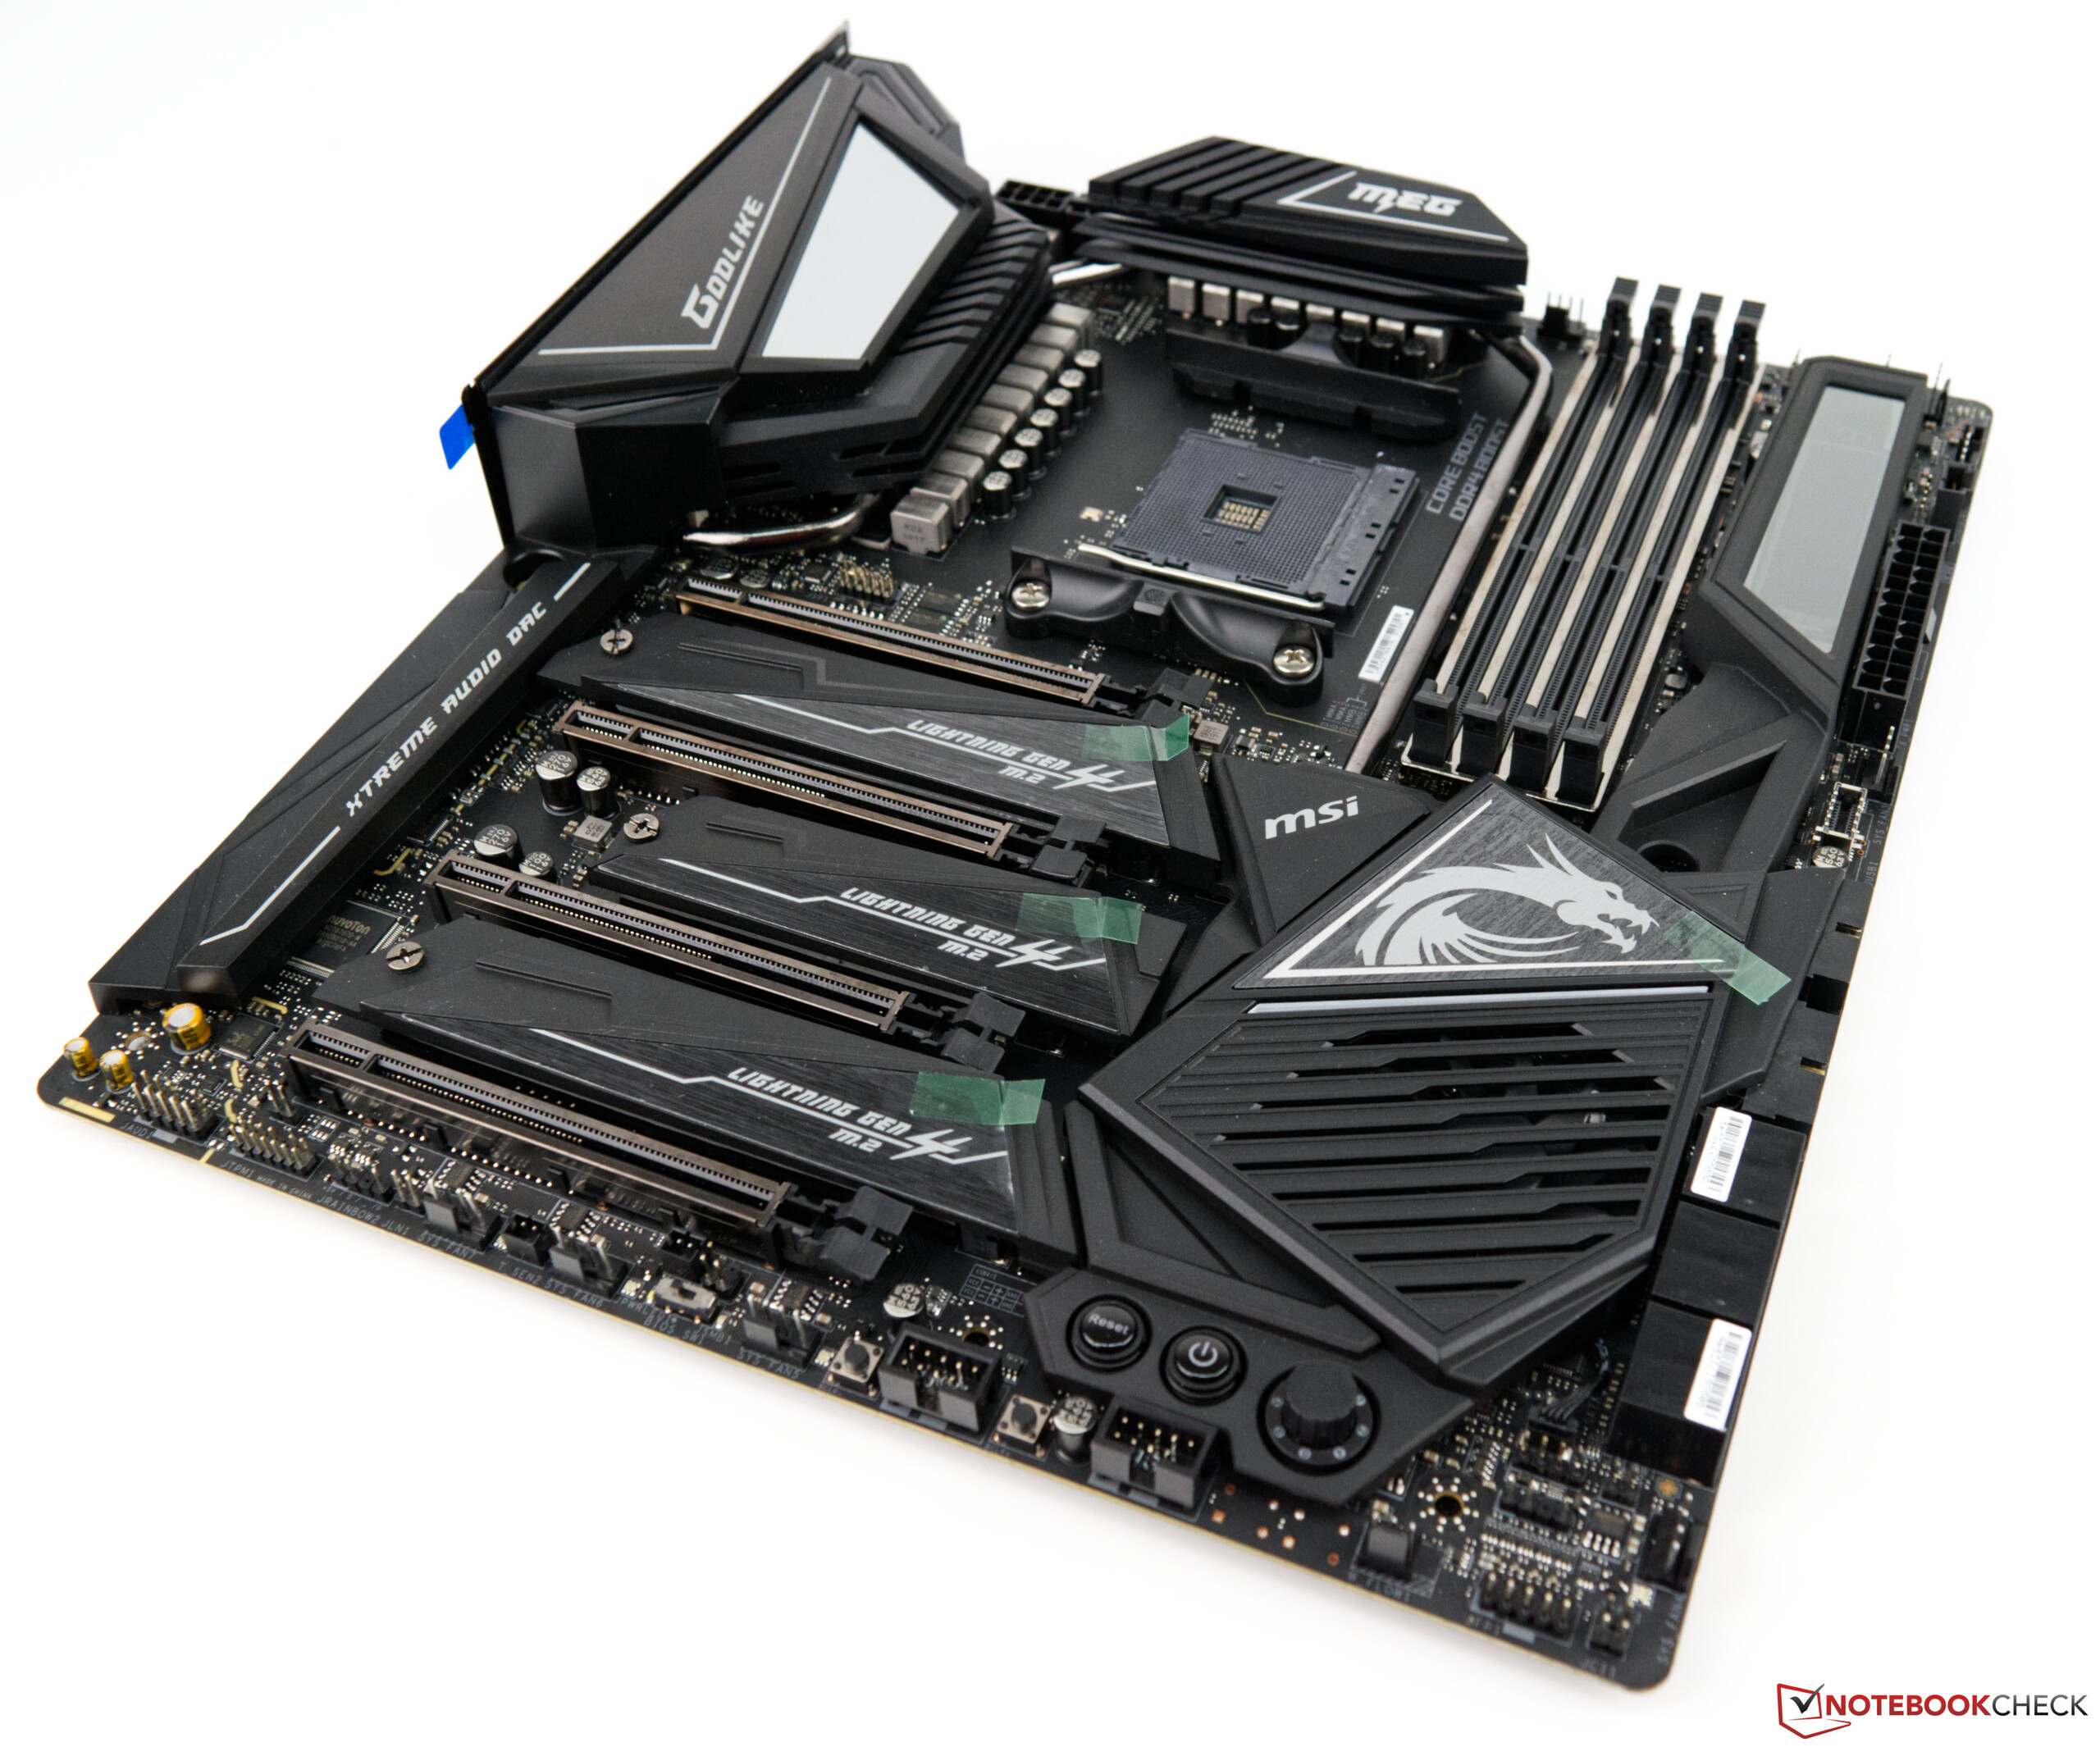
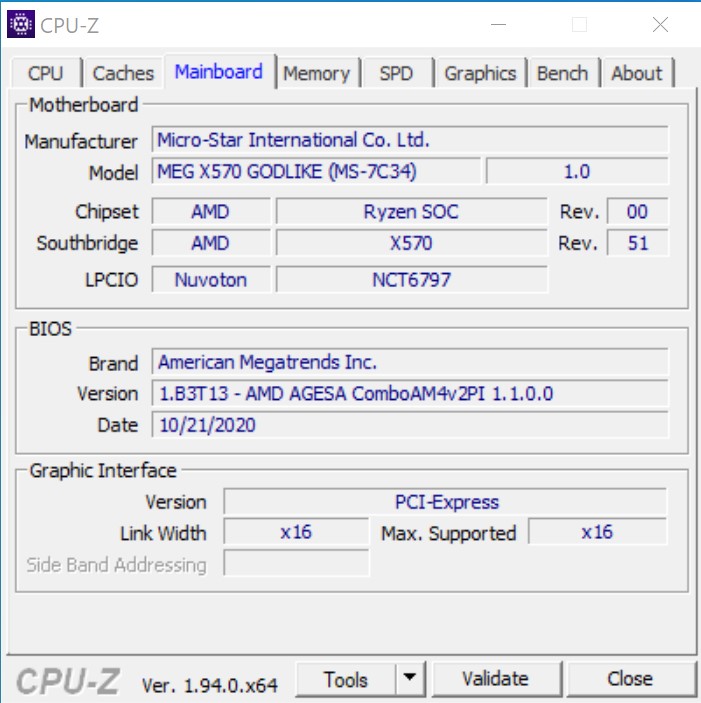
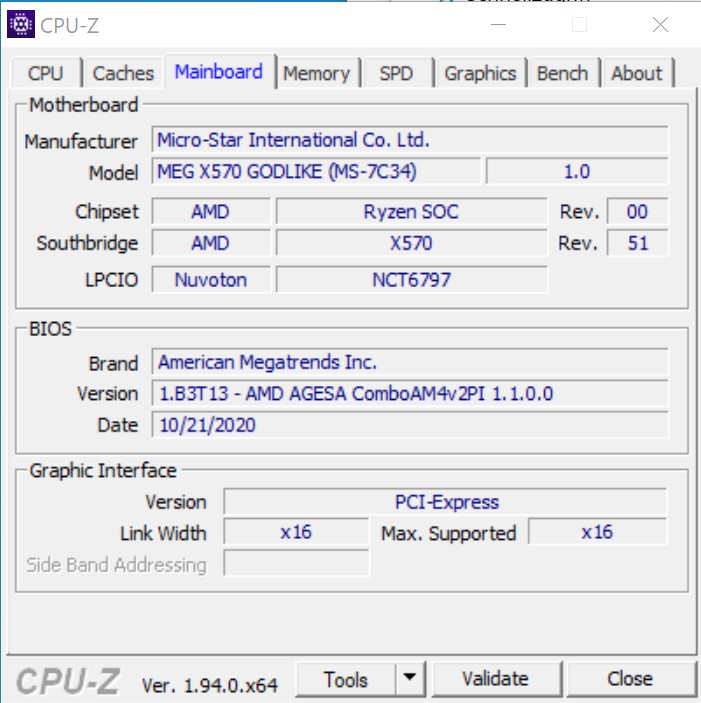
- MSI MEG X570 Godlike
- Alphacool Eisbear 280 AiO
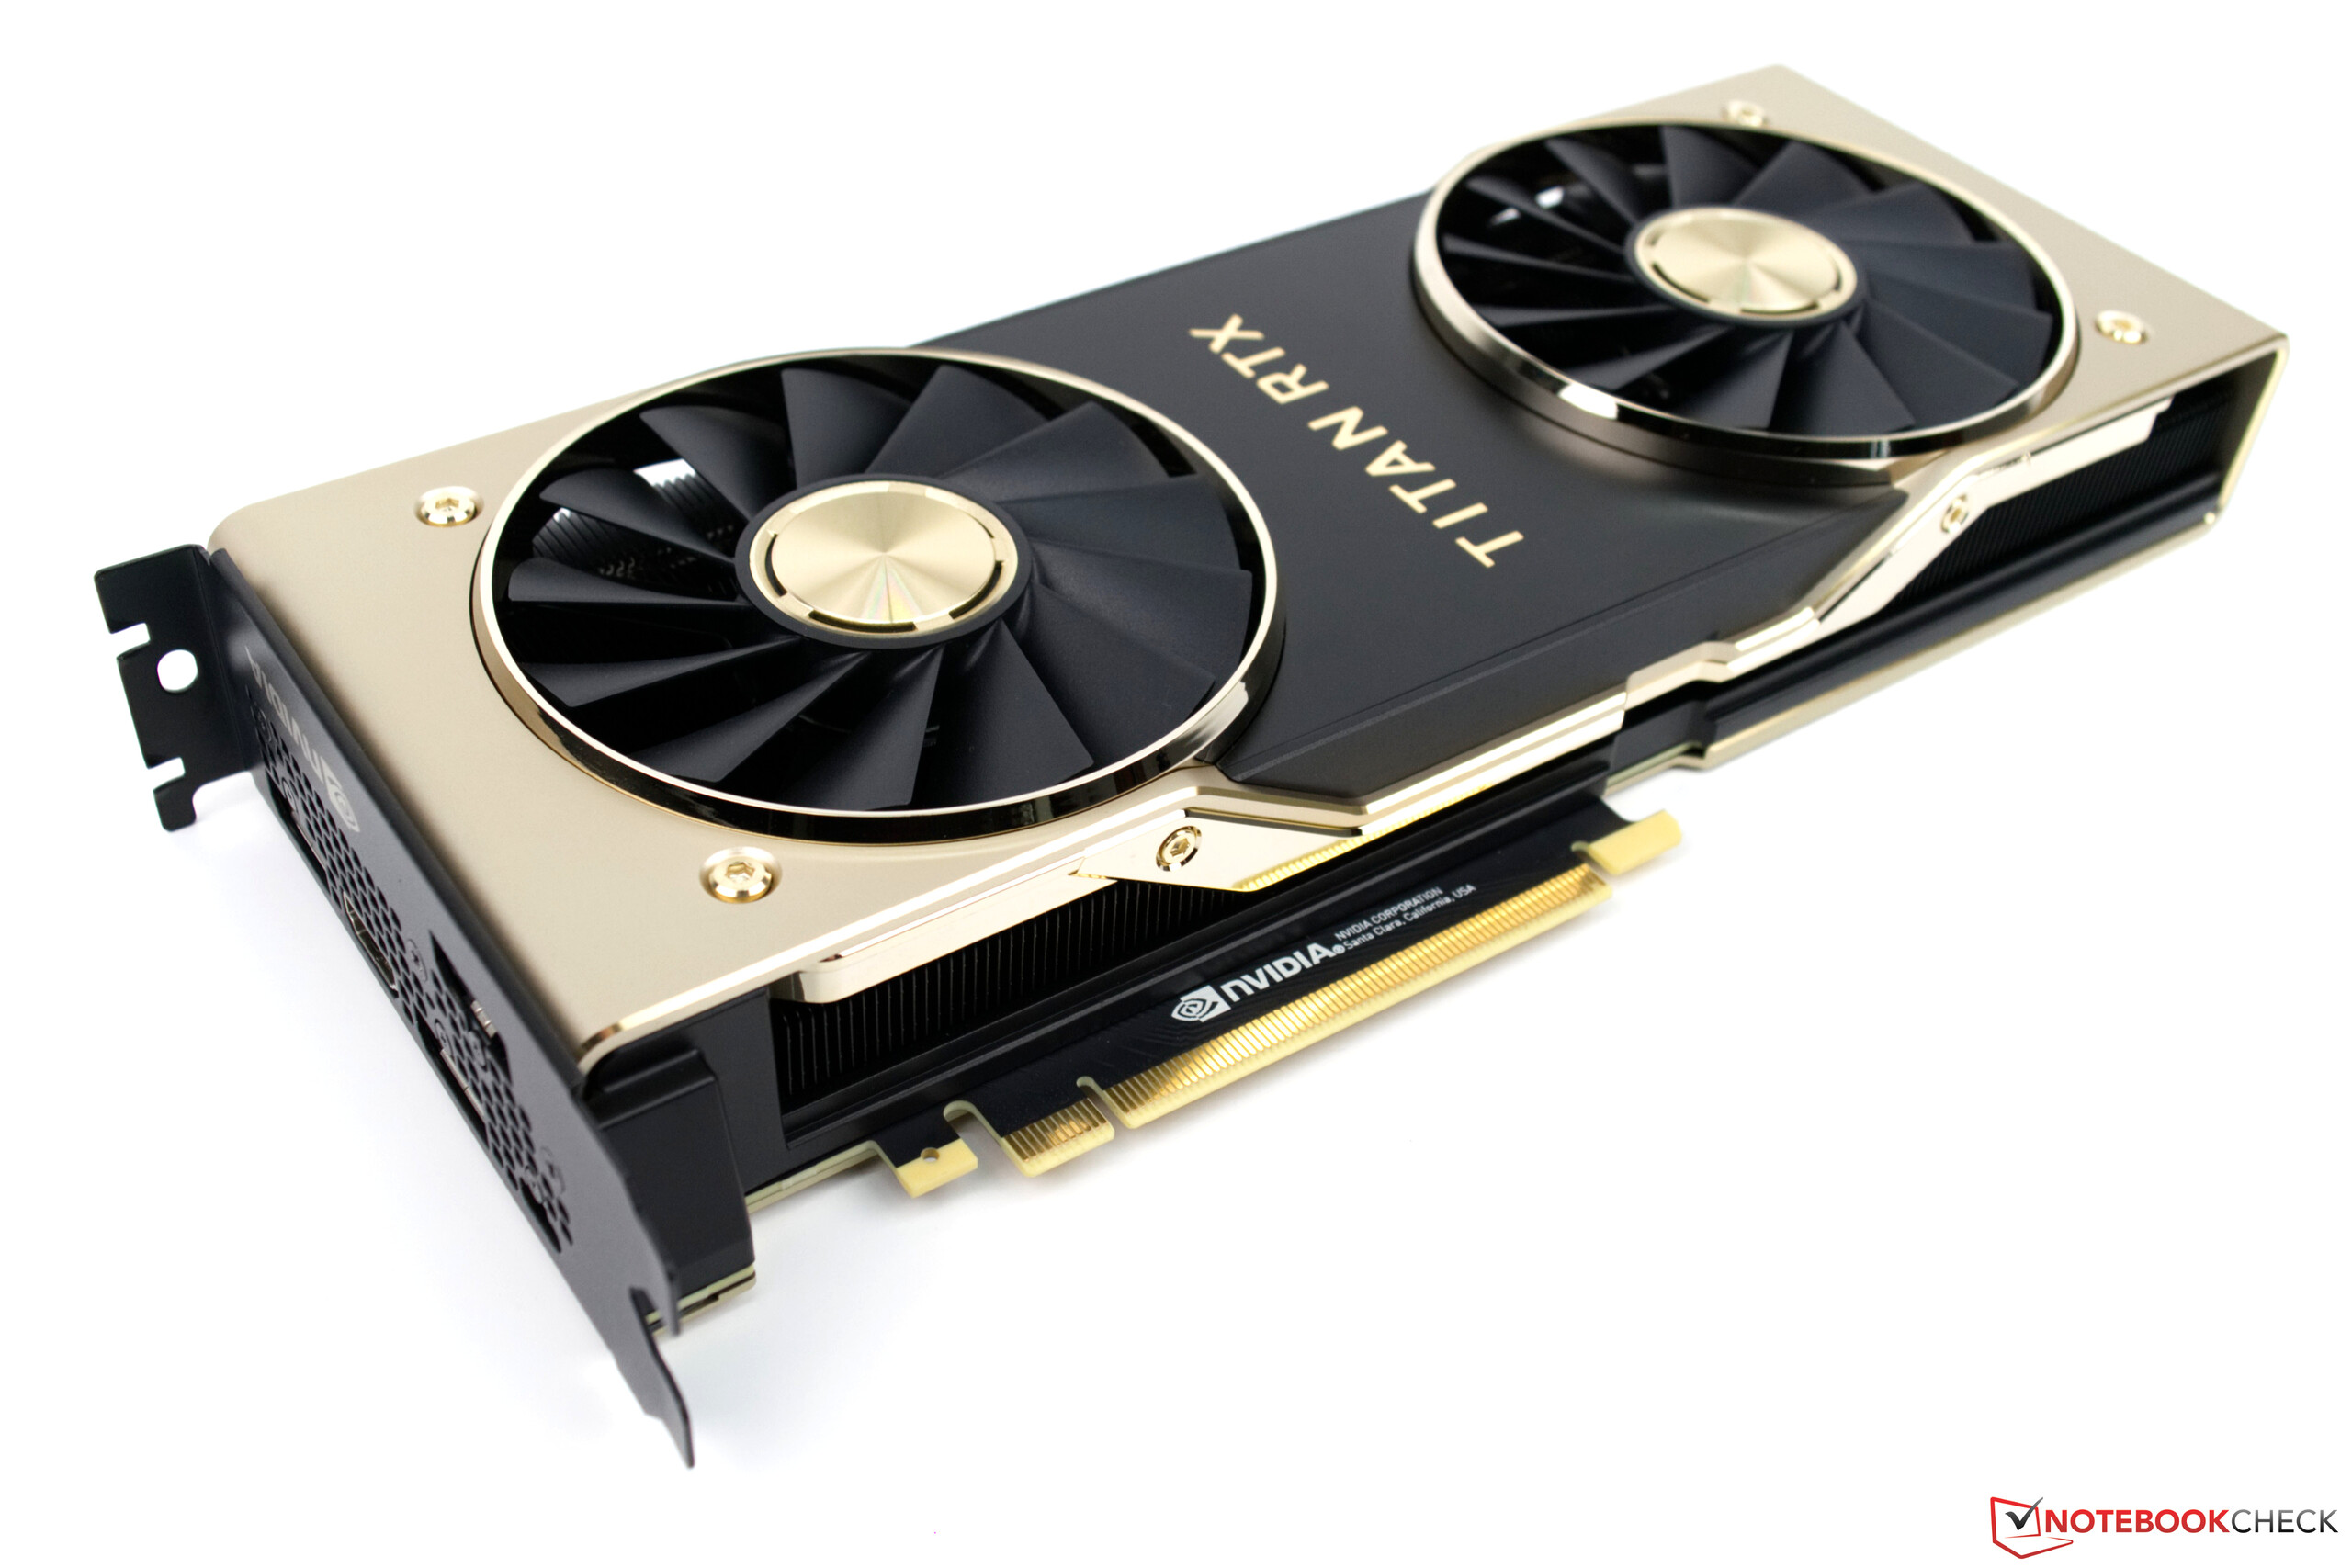
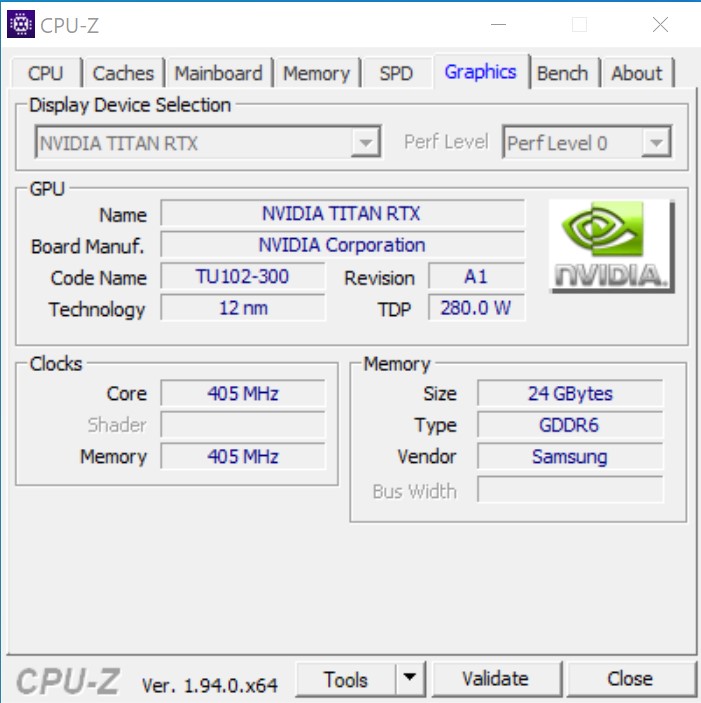
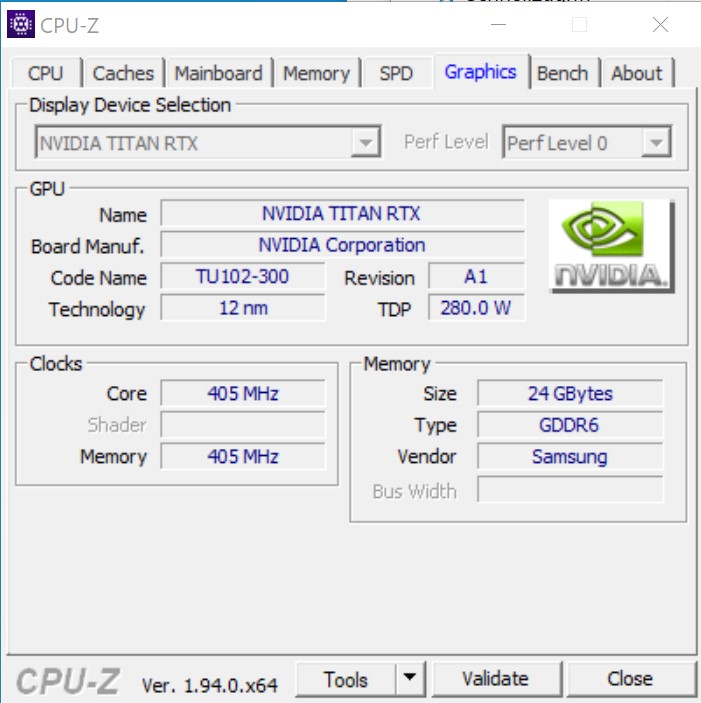
- Nvidia Titan RTX
- Alimentatore Corsair HX 1200i
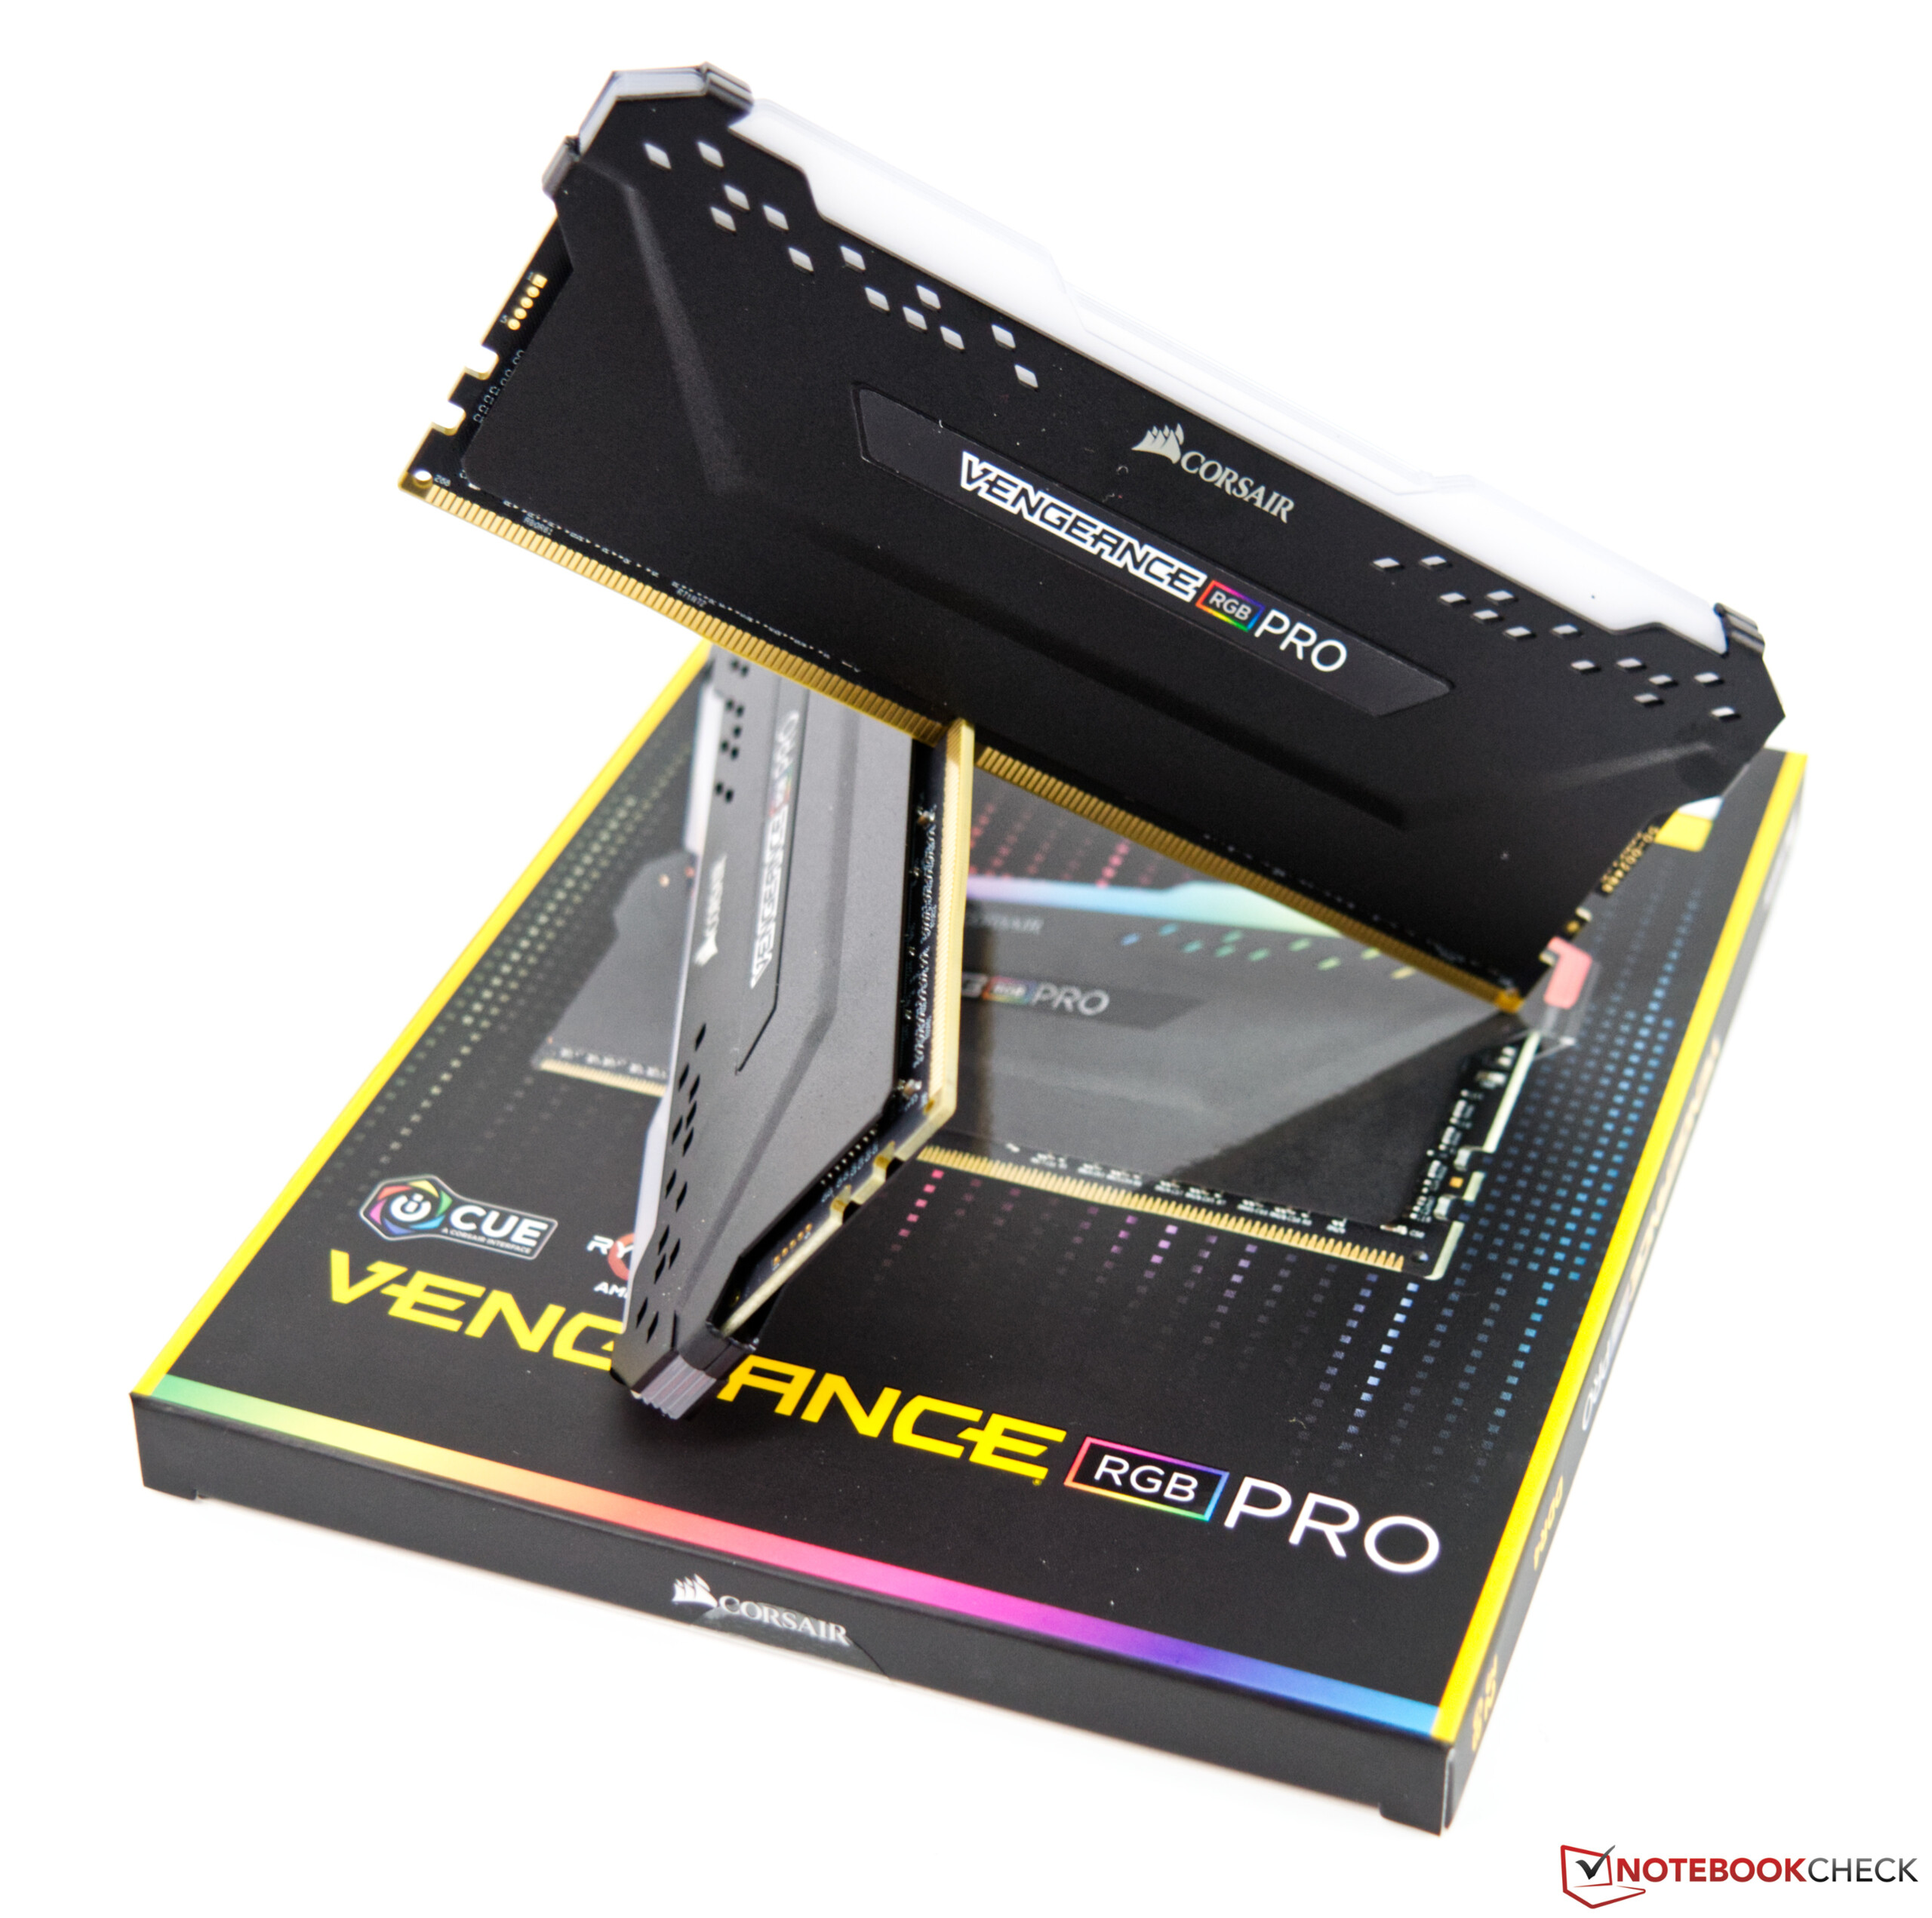
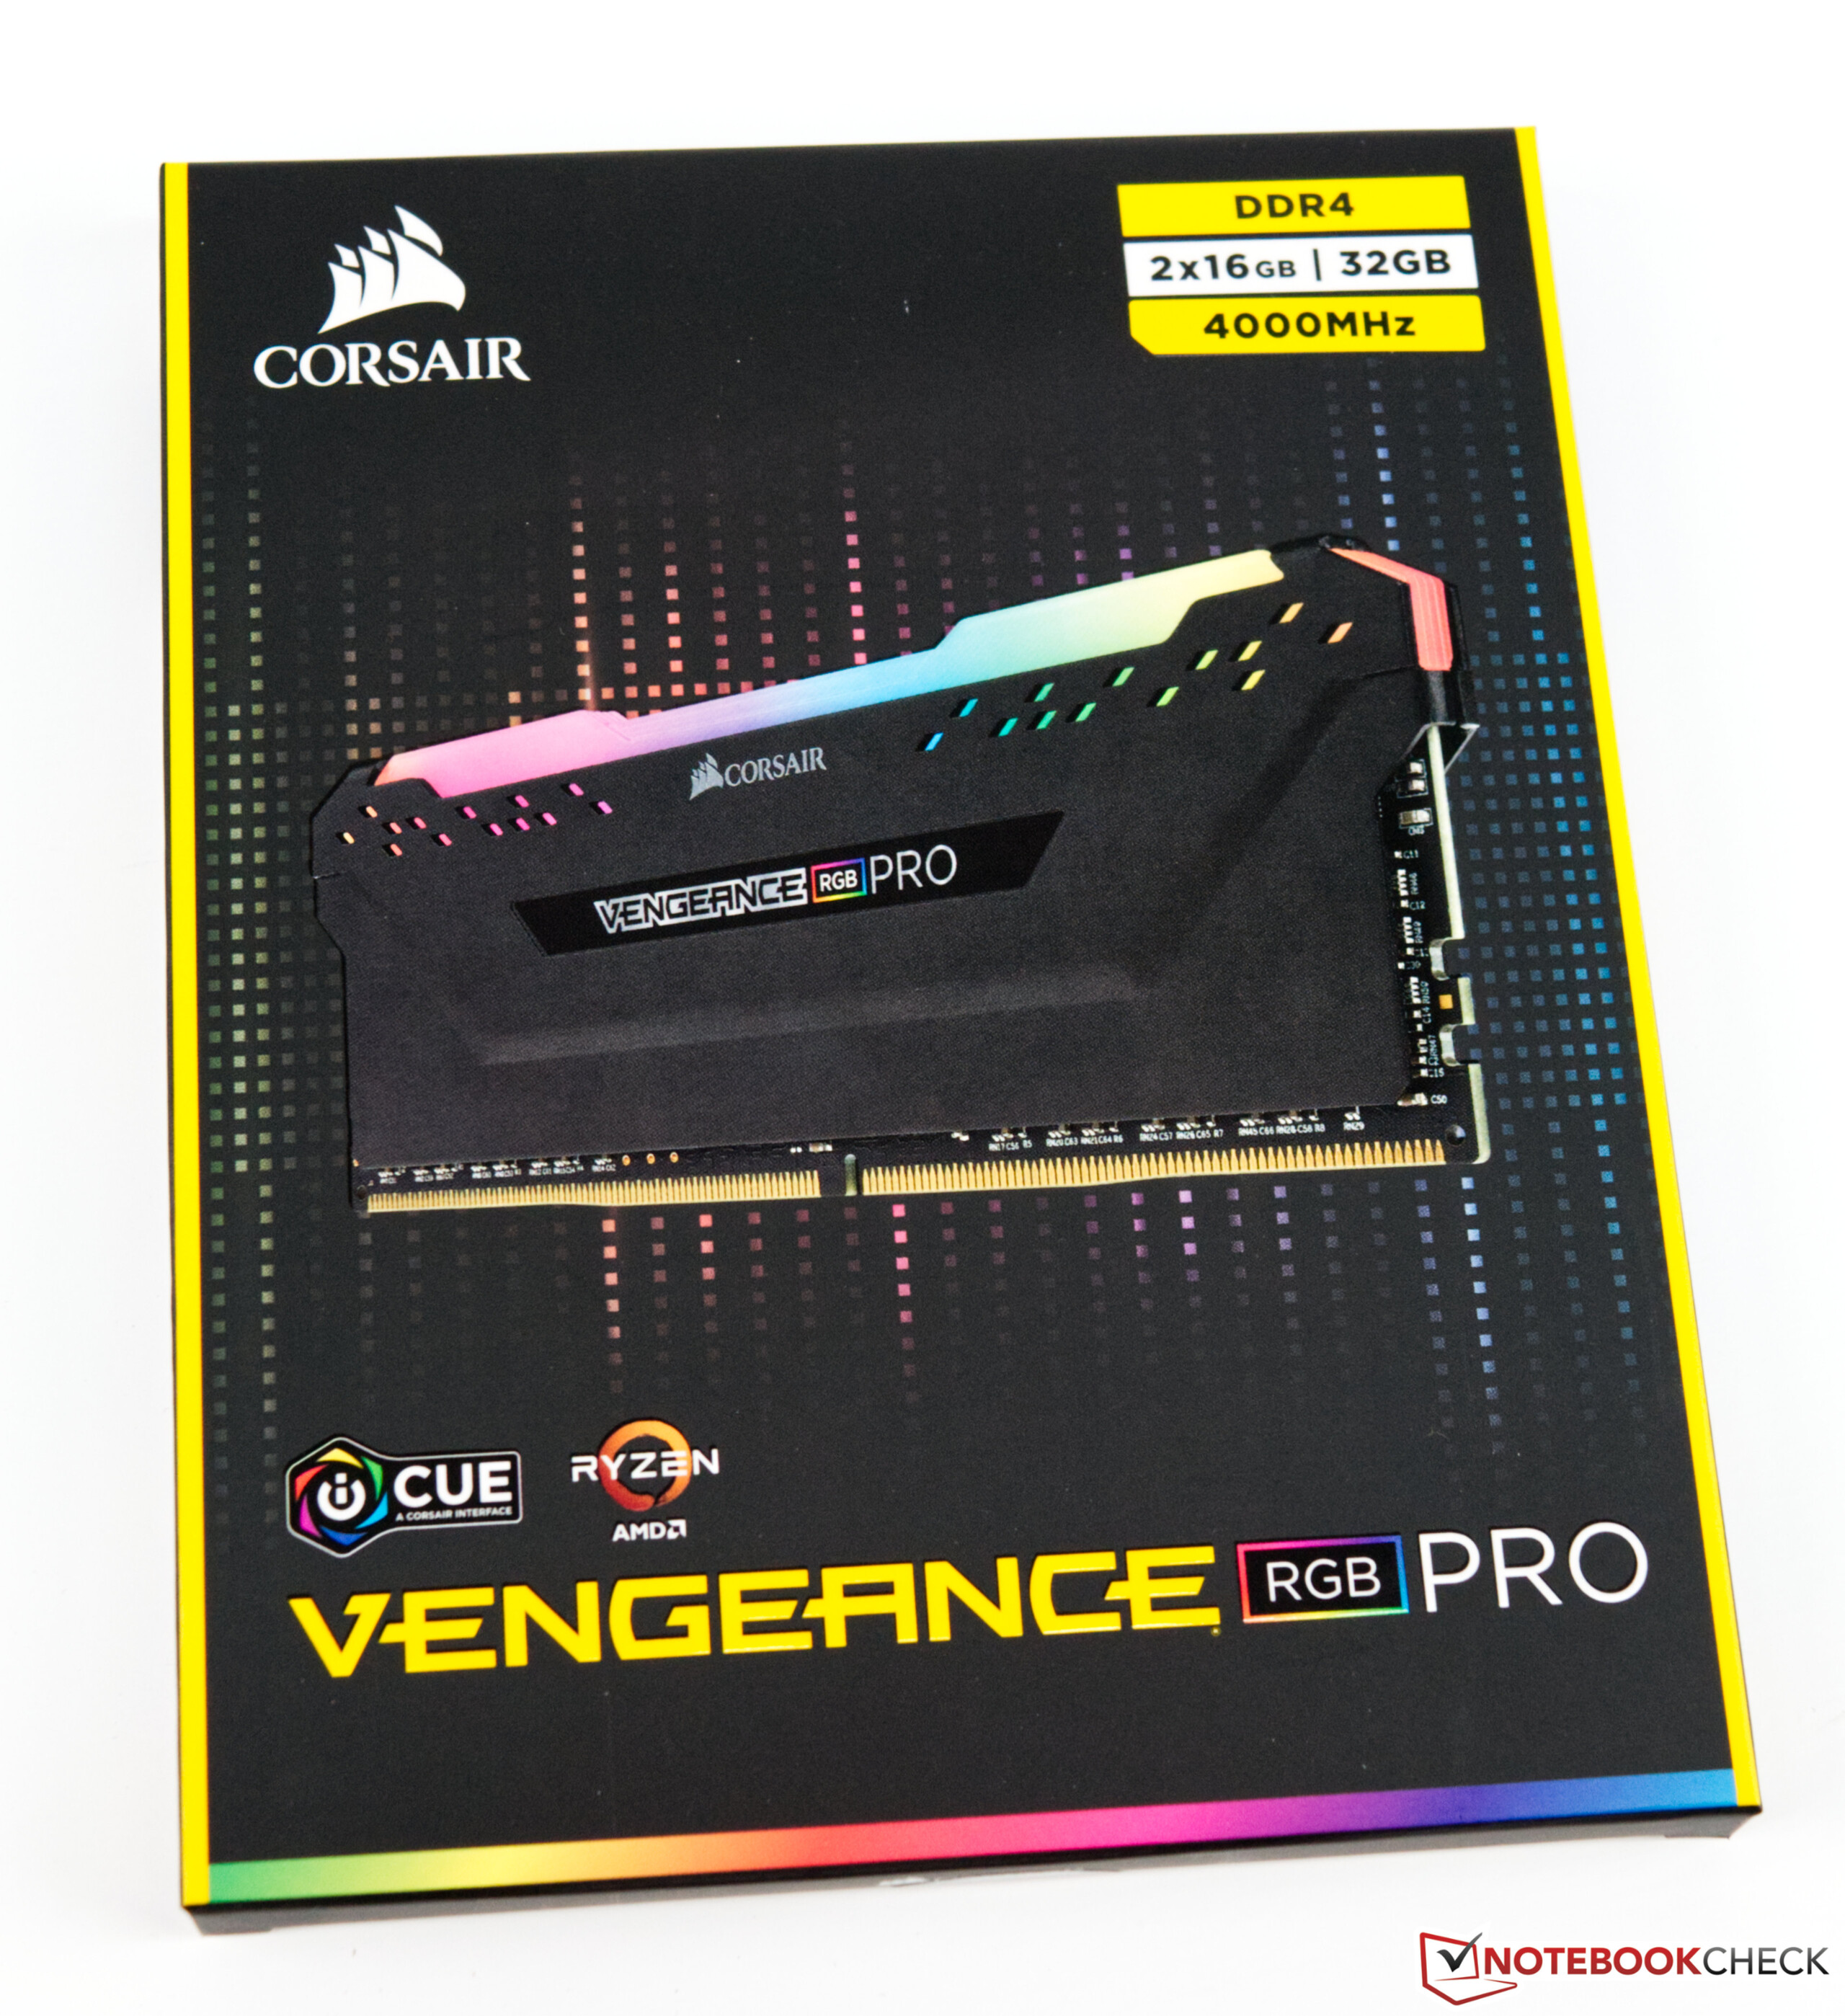
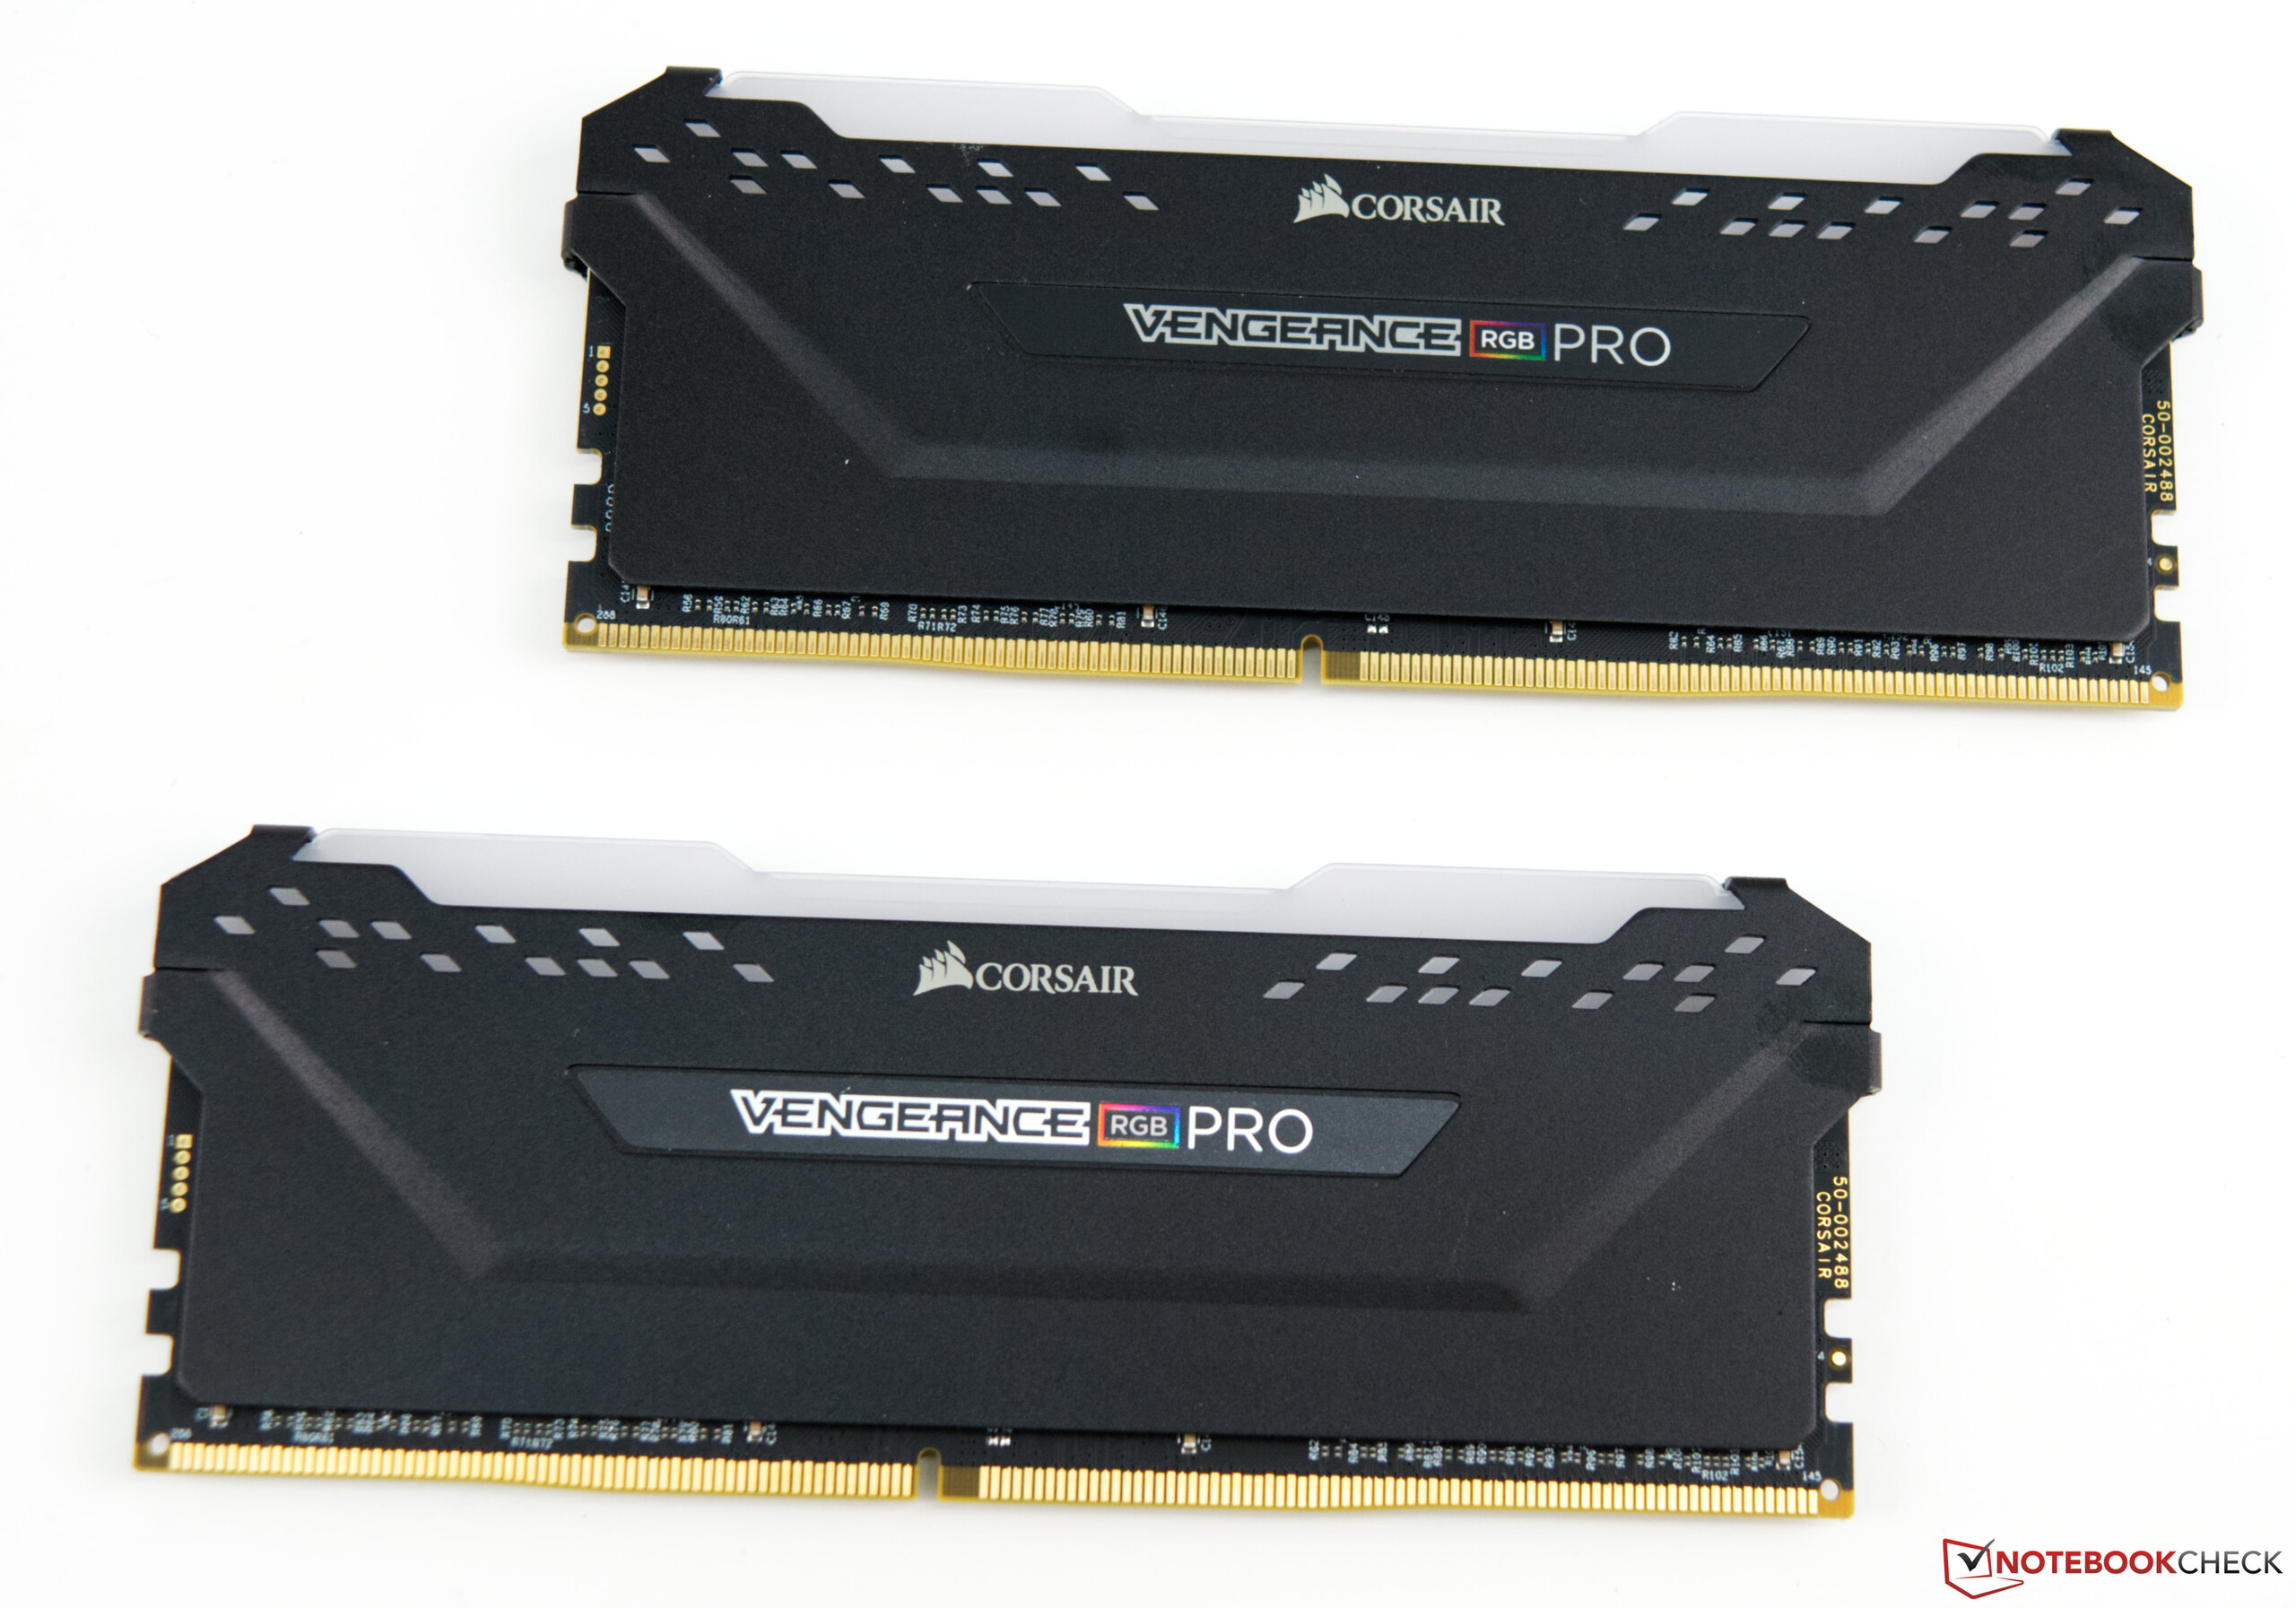
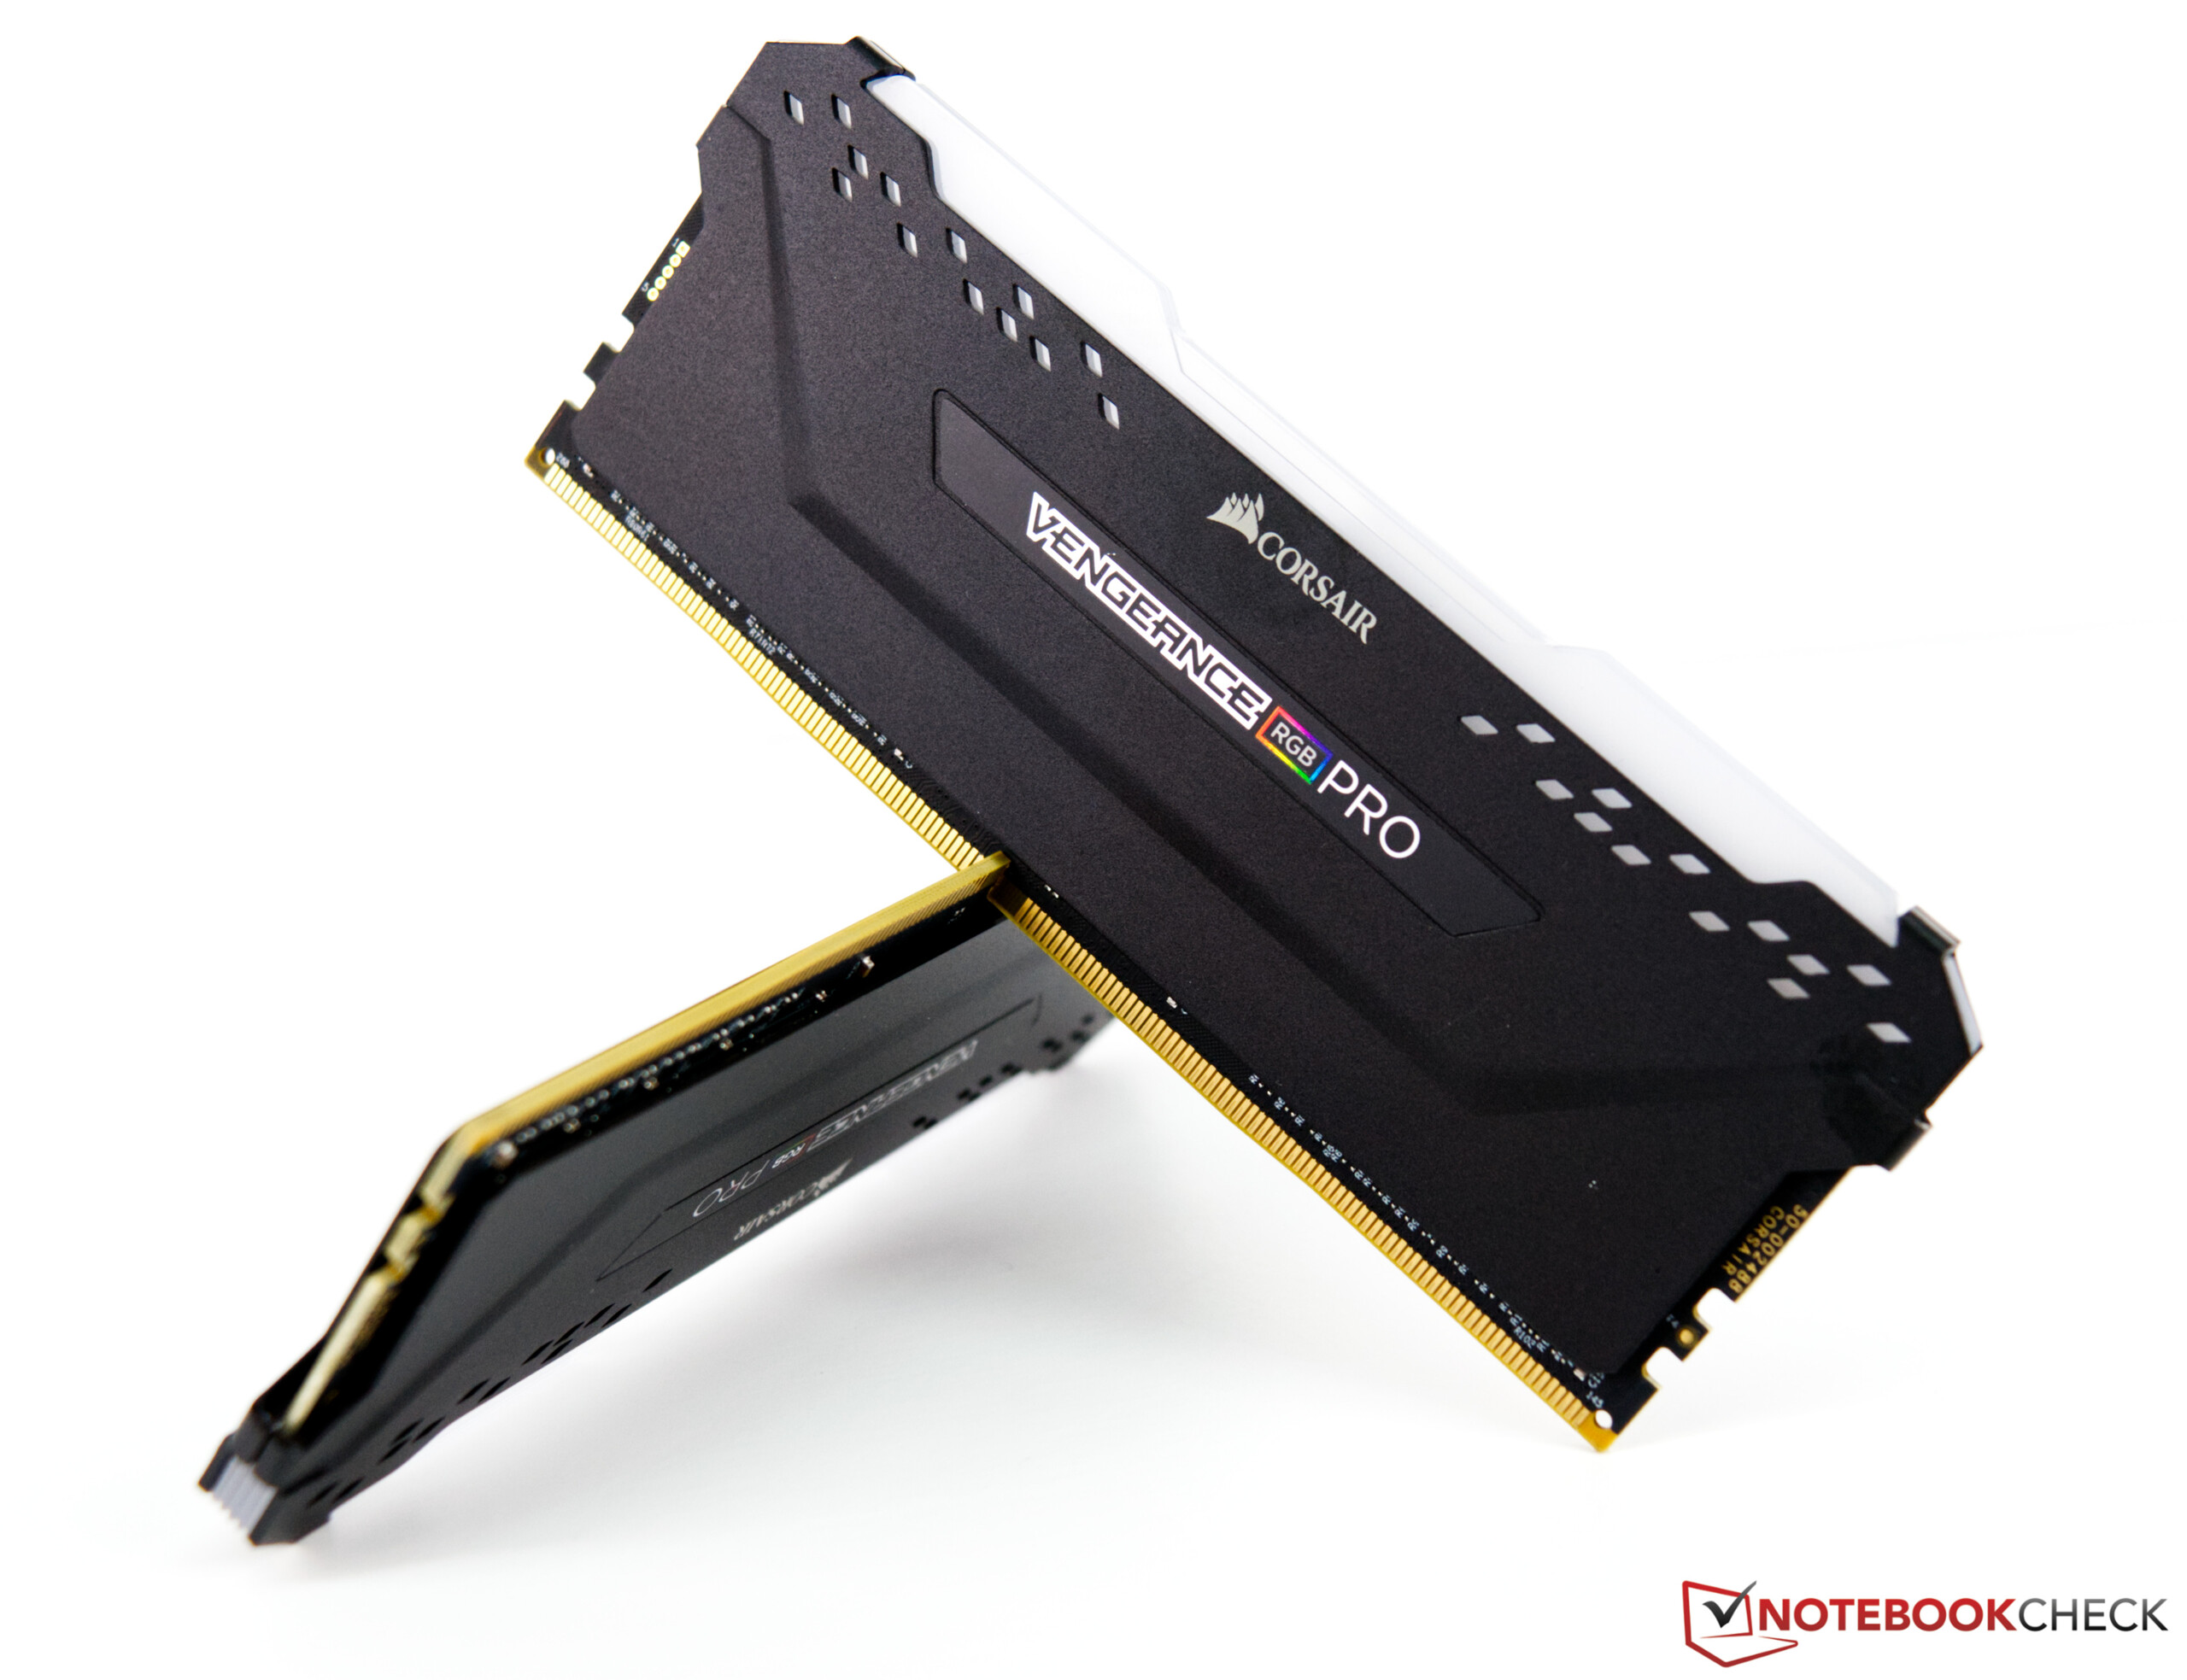
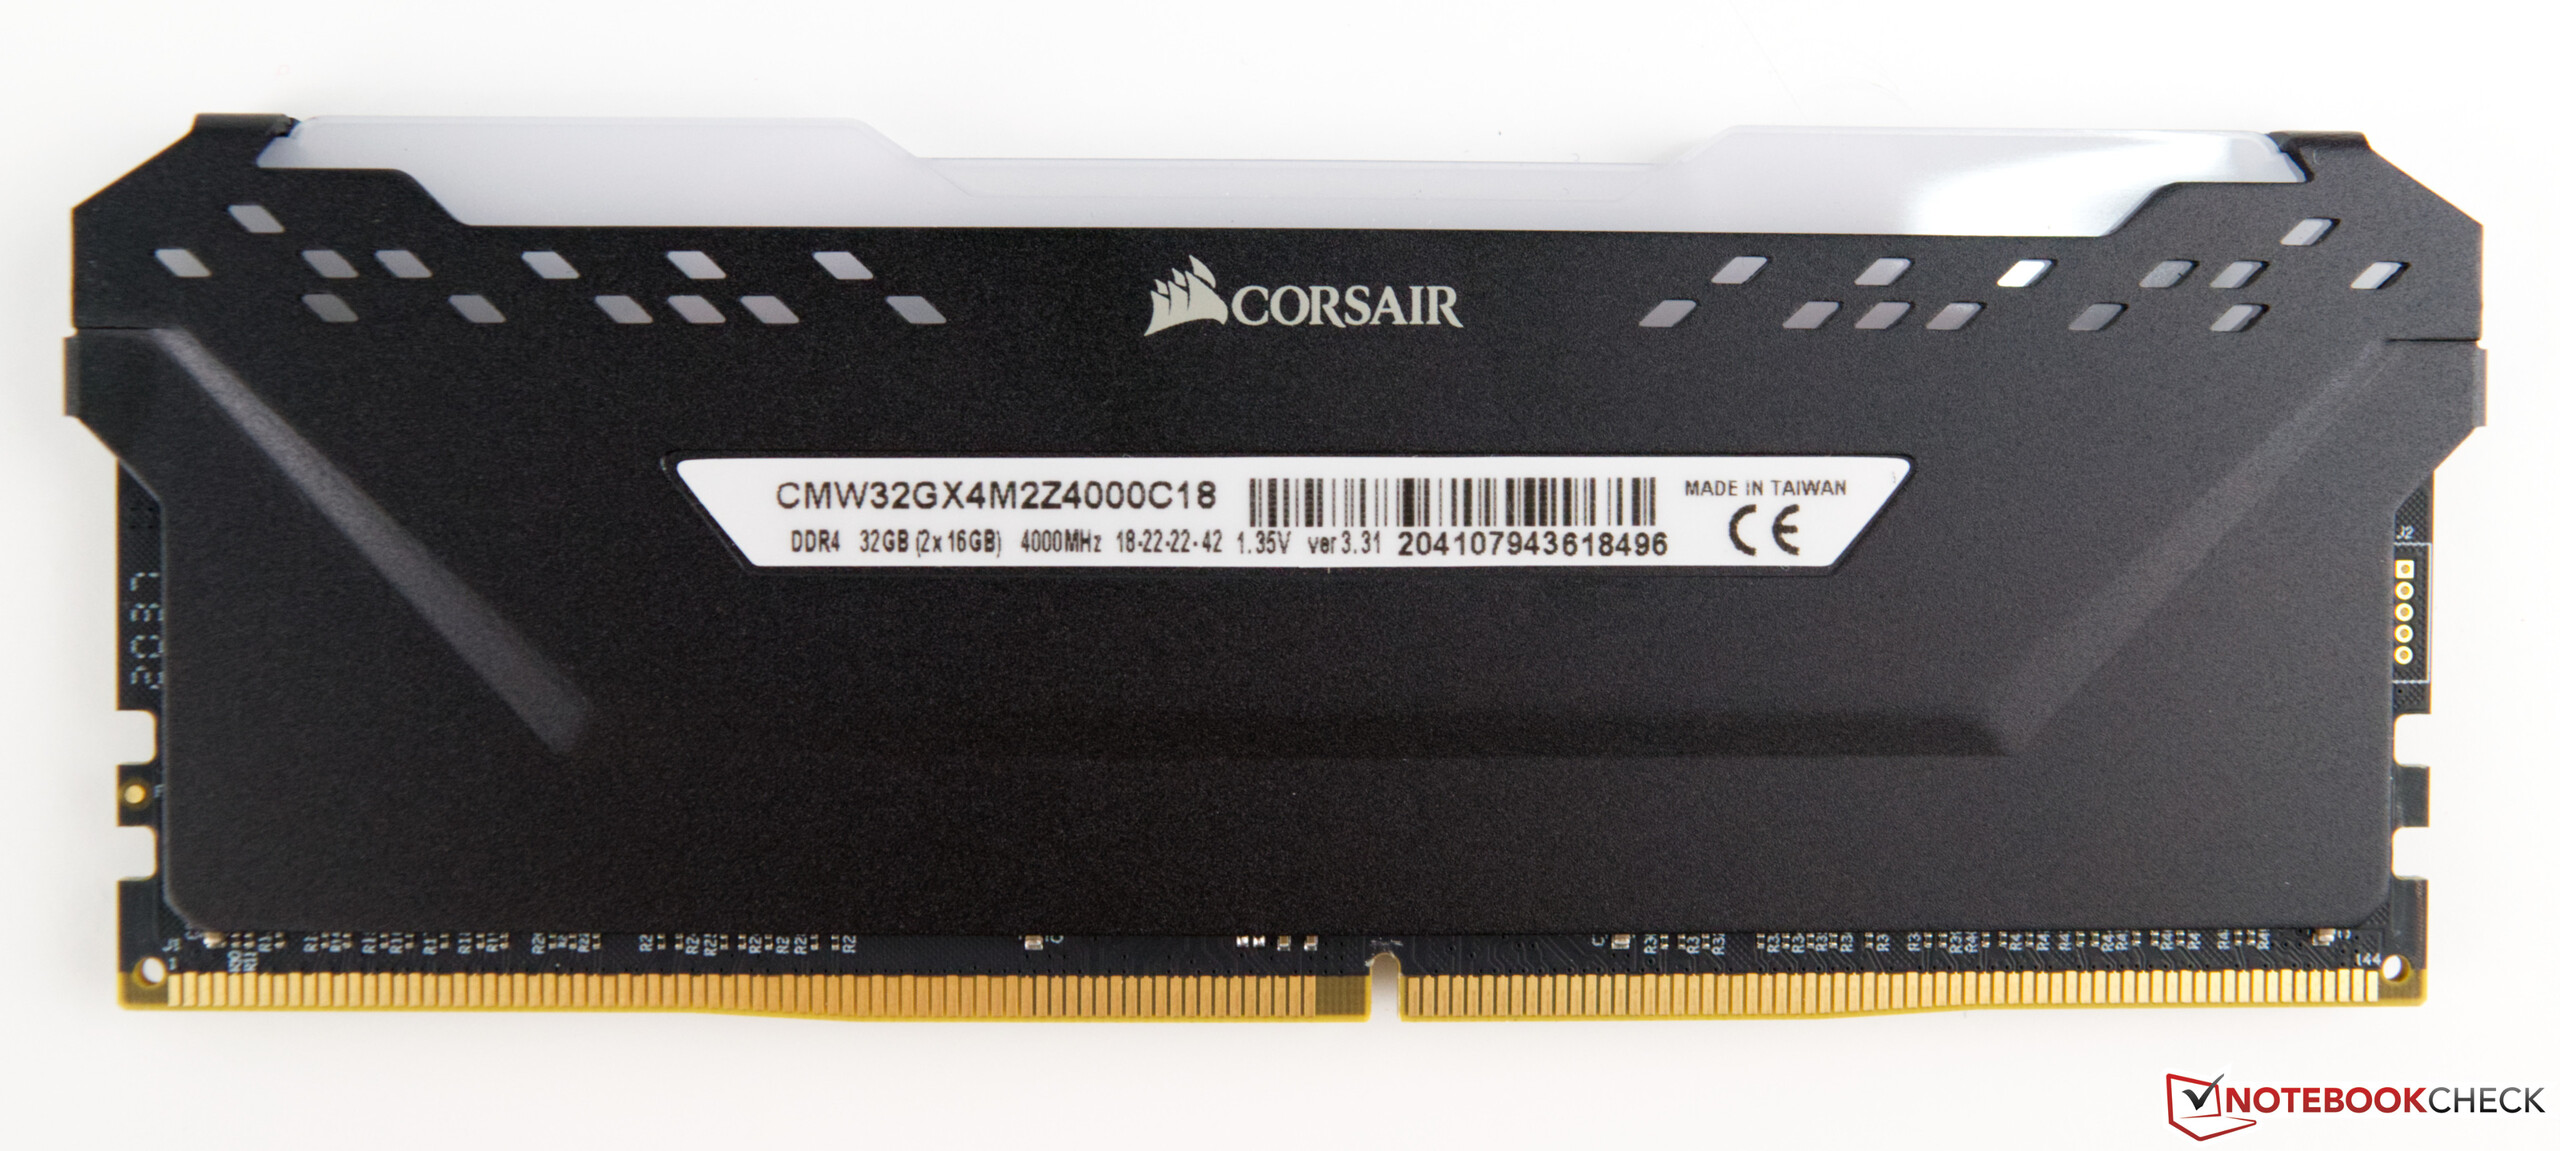
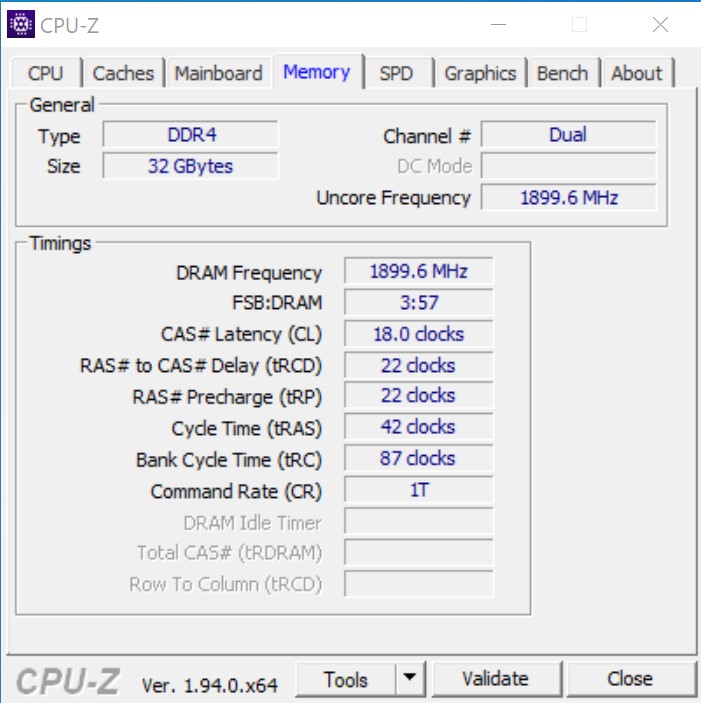
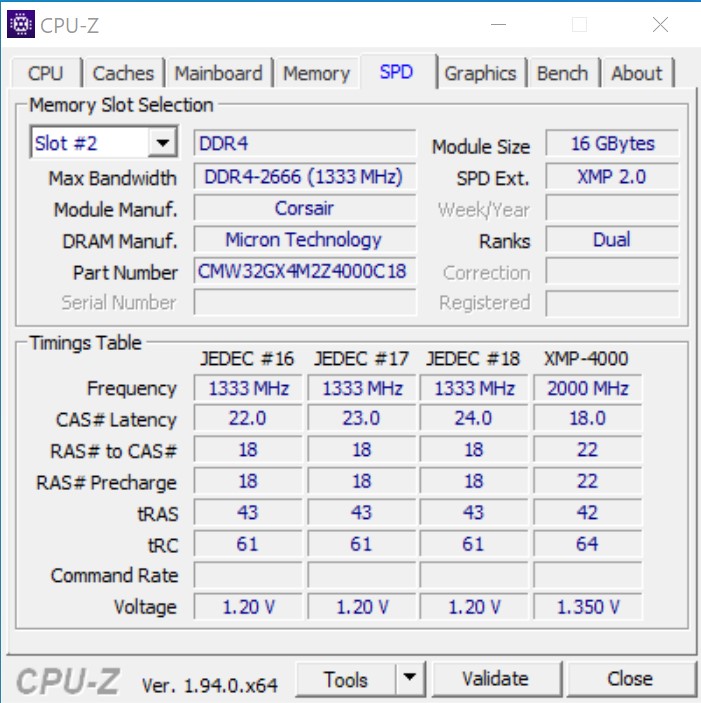
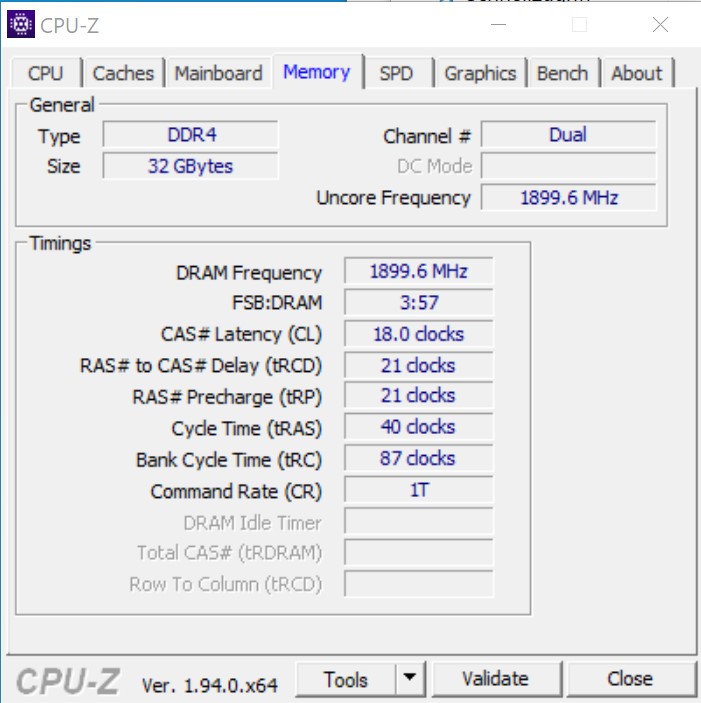
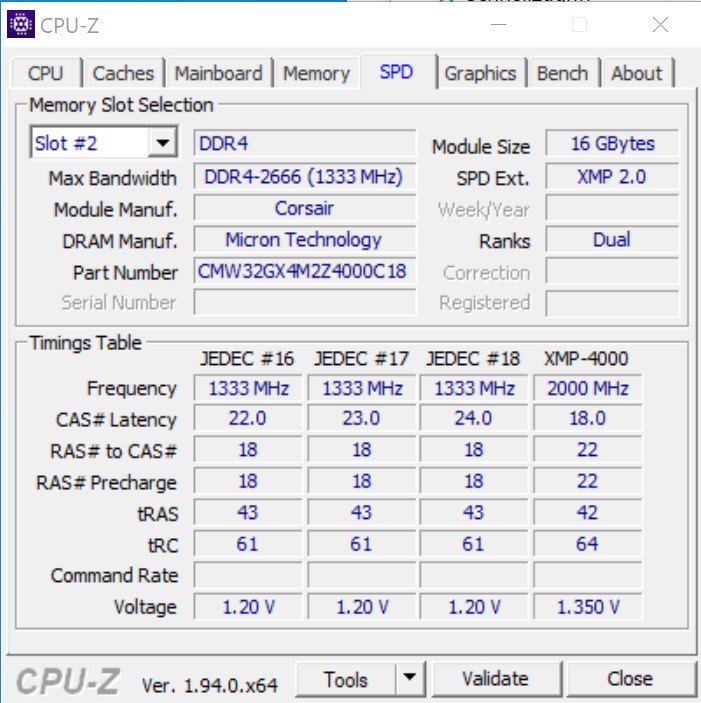
- Corsair Vengeance RGB Pro DDR4-4000 kit di memoria 2 x 16 GB
- SSD PCIe Intel Optane 905P 480GB
- Microsoft Windows 10 Professional 64-Bit (Versione 2004)
Ringraziamo Caseking per averci fornito la Raijintek Pean, che conteneva anche un'incisione laser personalizzata, e AMD per la scheda madre, che faceva parte del press kit Zen 2 che AMD ha inviato con i suoi precedenti processori Ryzen 9 3900X e Ryzen 7 3700X. Il nostro sistema di raffeddamento preferito è stato un Alphacool Eisbear 280, fornito da Alphacool. Ringraziamo inoltre Corsair per averci supportato e per averci fornito la RAM

Benchmarks del processore
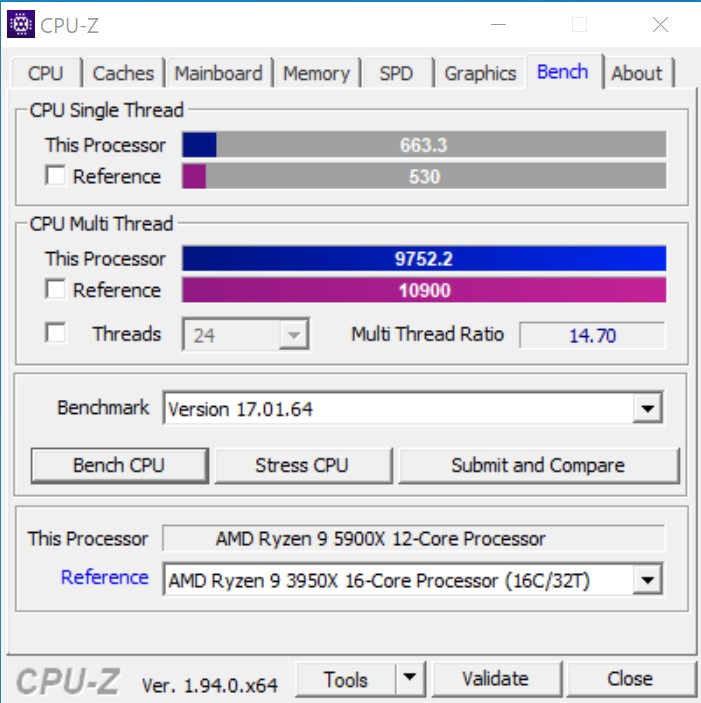
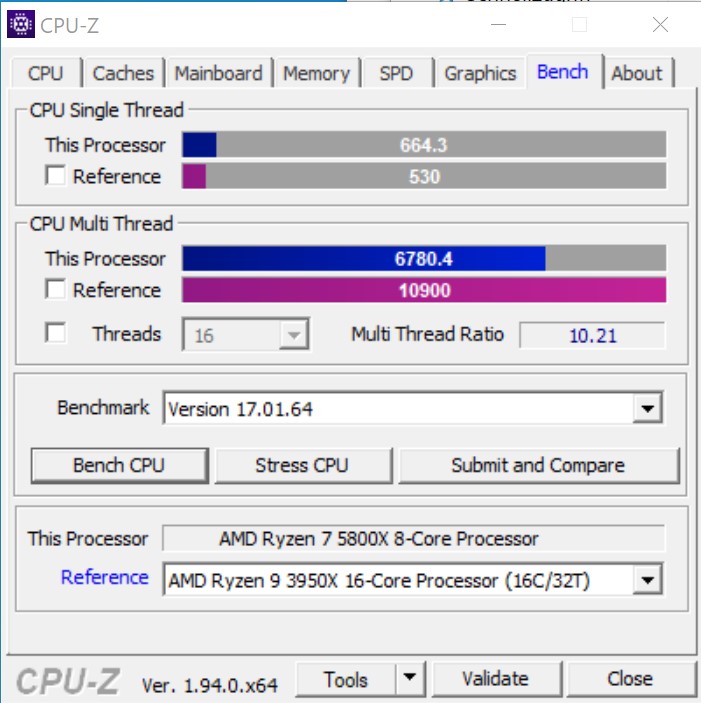
I vantaggi della struttura Zen 3 aggiornata di AMD sono stati immediatamente evidenti nei nostri benchmarks delle CPU. Le prestazioni di AMD, single-thread relativamente scarse, non sono più dovute a miglioramenti significativi delle prestazioni single-core. Il risultato: Intel Core i9-10900K trascina del circa il 20 % indietro la Ryzen 9 5900X di AMD. Anche la più lento Ryzen 7 5800X a 8 cores non ha avuto problemi a stare al passo con il processore Intel a 10 cores, e anche le sue prestazioni multi-core erano spesso superiori. Rispetto ai suoi predecessori e concorrenti, la Ryzen 9 5800X è riuscita facilmente a tenere il passo con la Ryzen 9 3950X. La nuova CPU di punta, la AMD Ryzen 9 5950X, sarà esaminata separatamente insieme alla nuova offerta entry-level di AMD, la Ryzen 5 5600X.
Ulteriori benchmarks essere trovati qui.
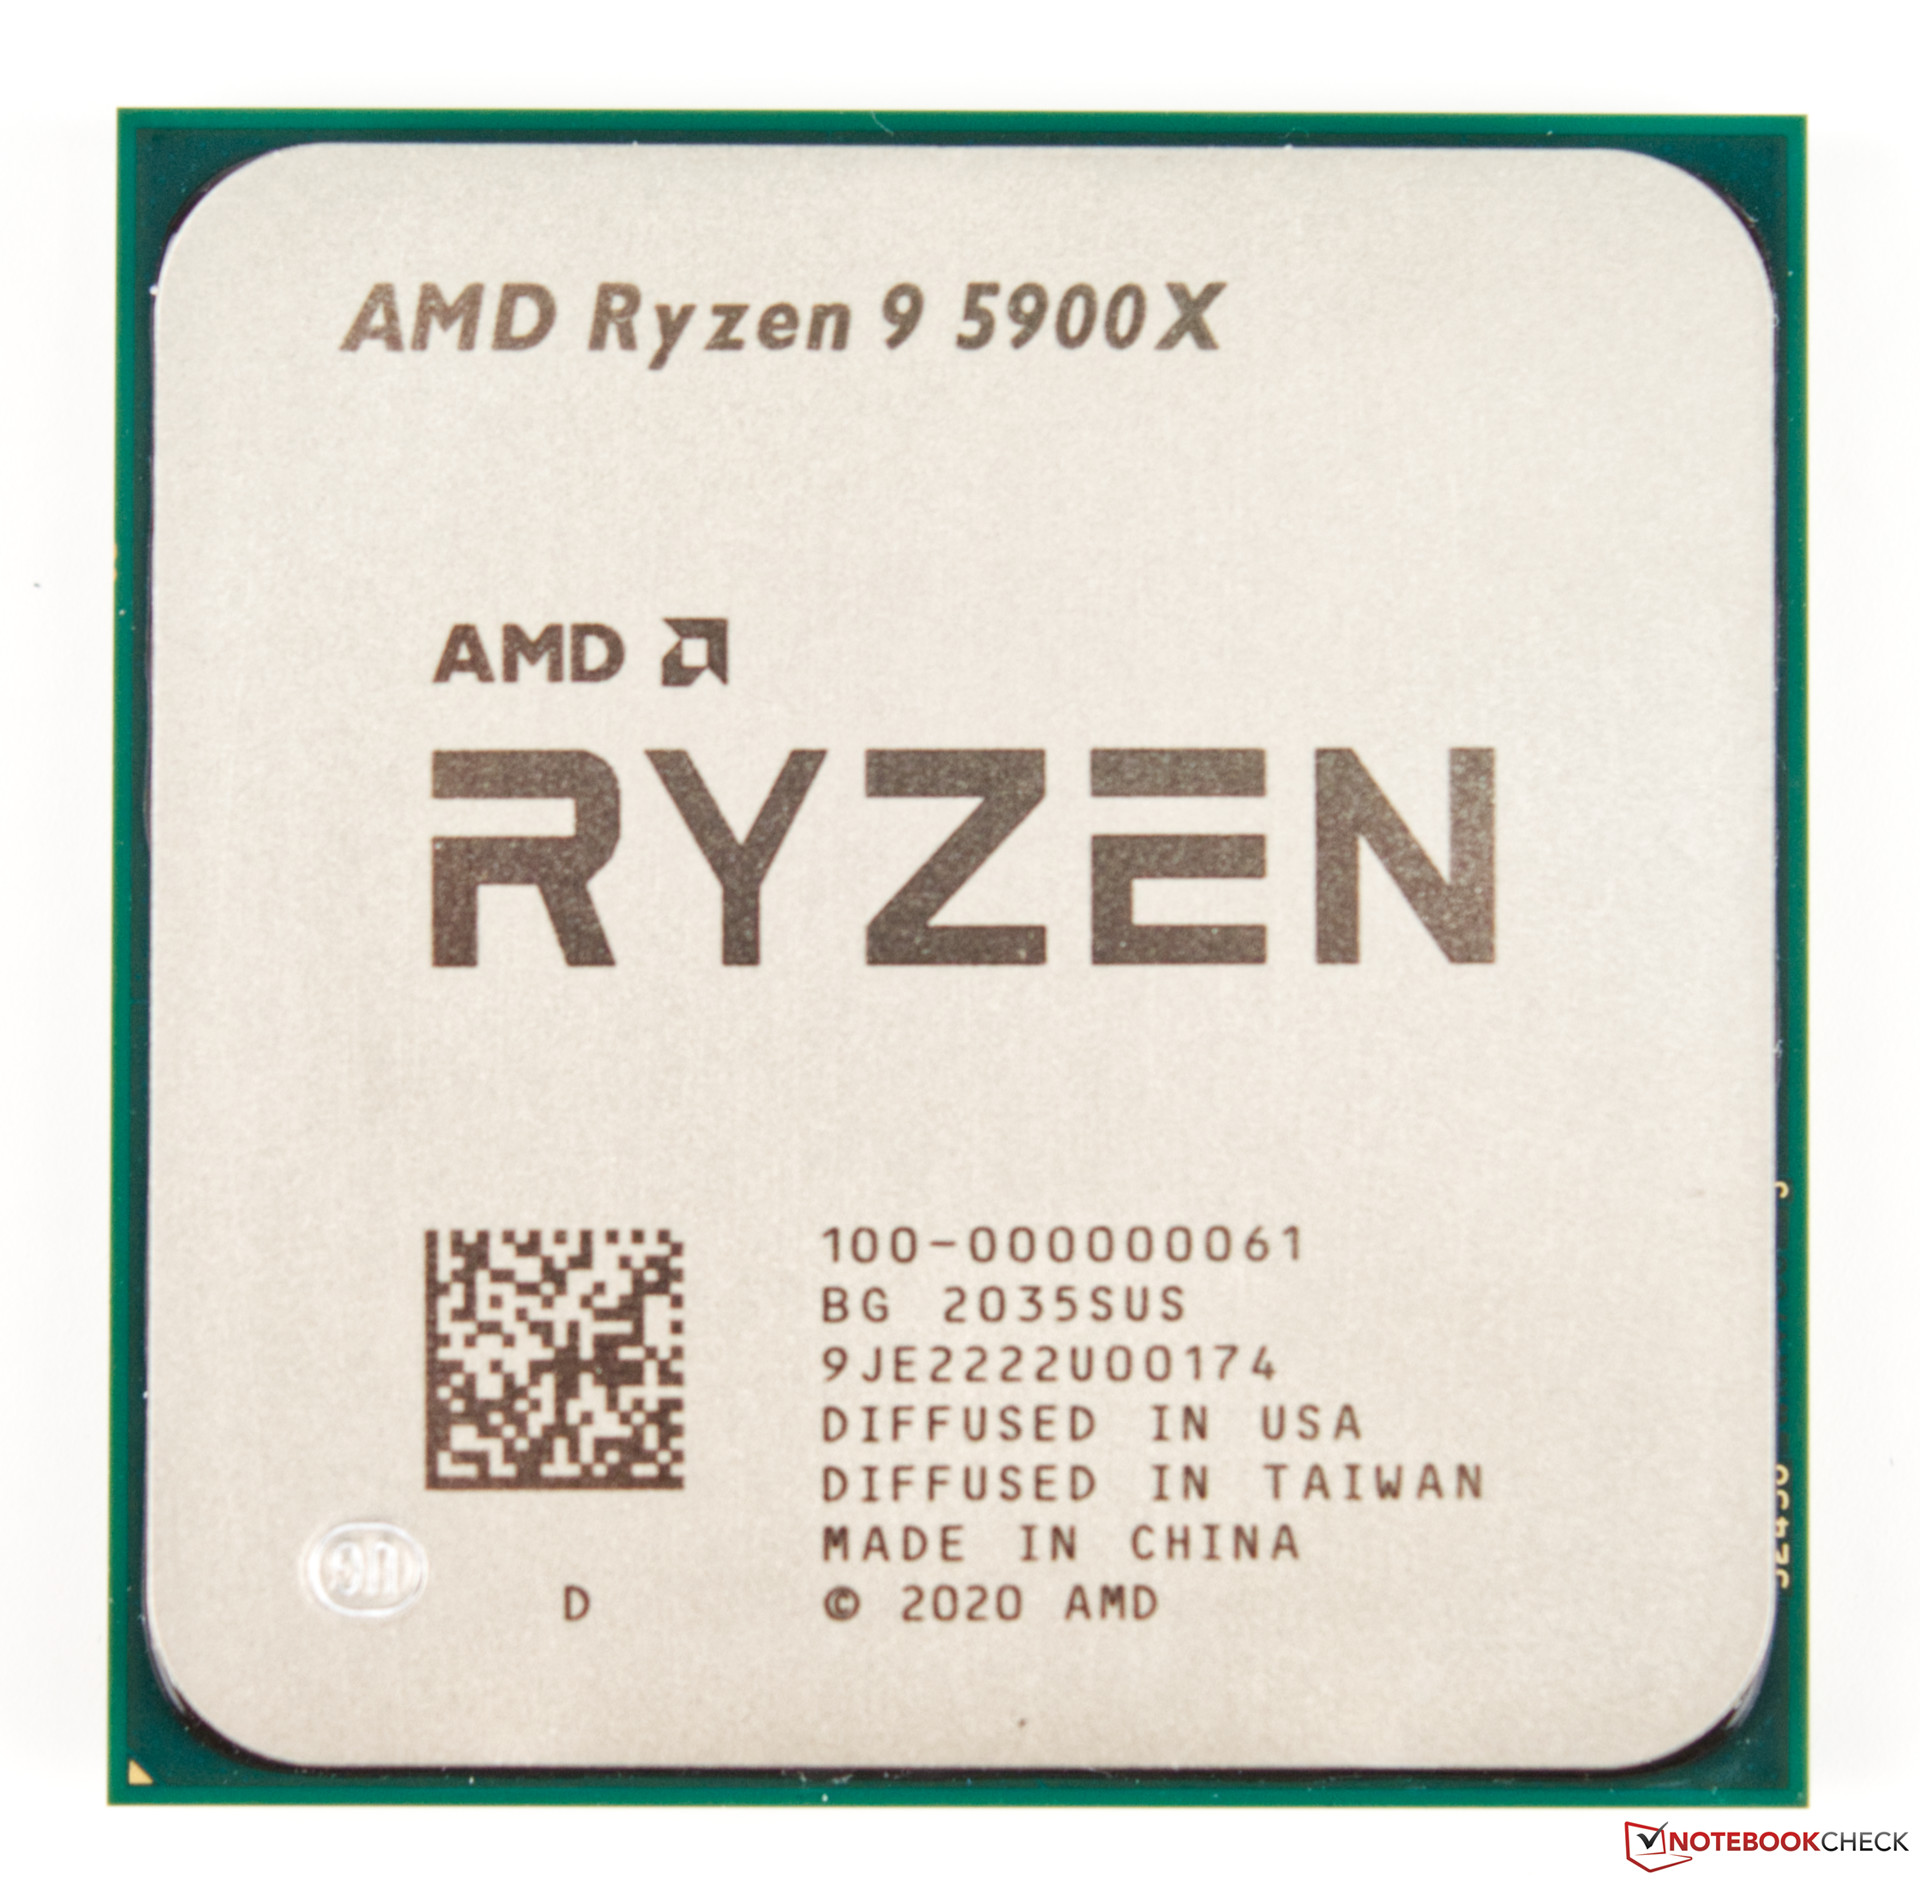
AMD Ryzen 9 5900X
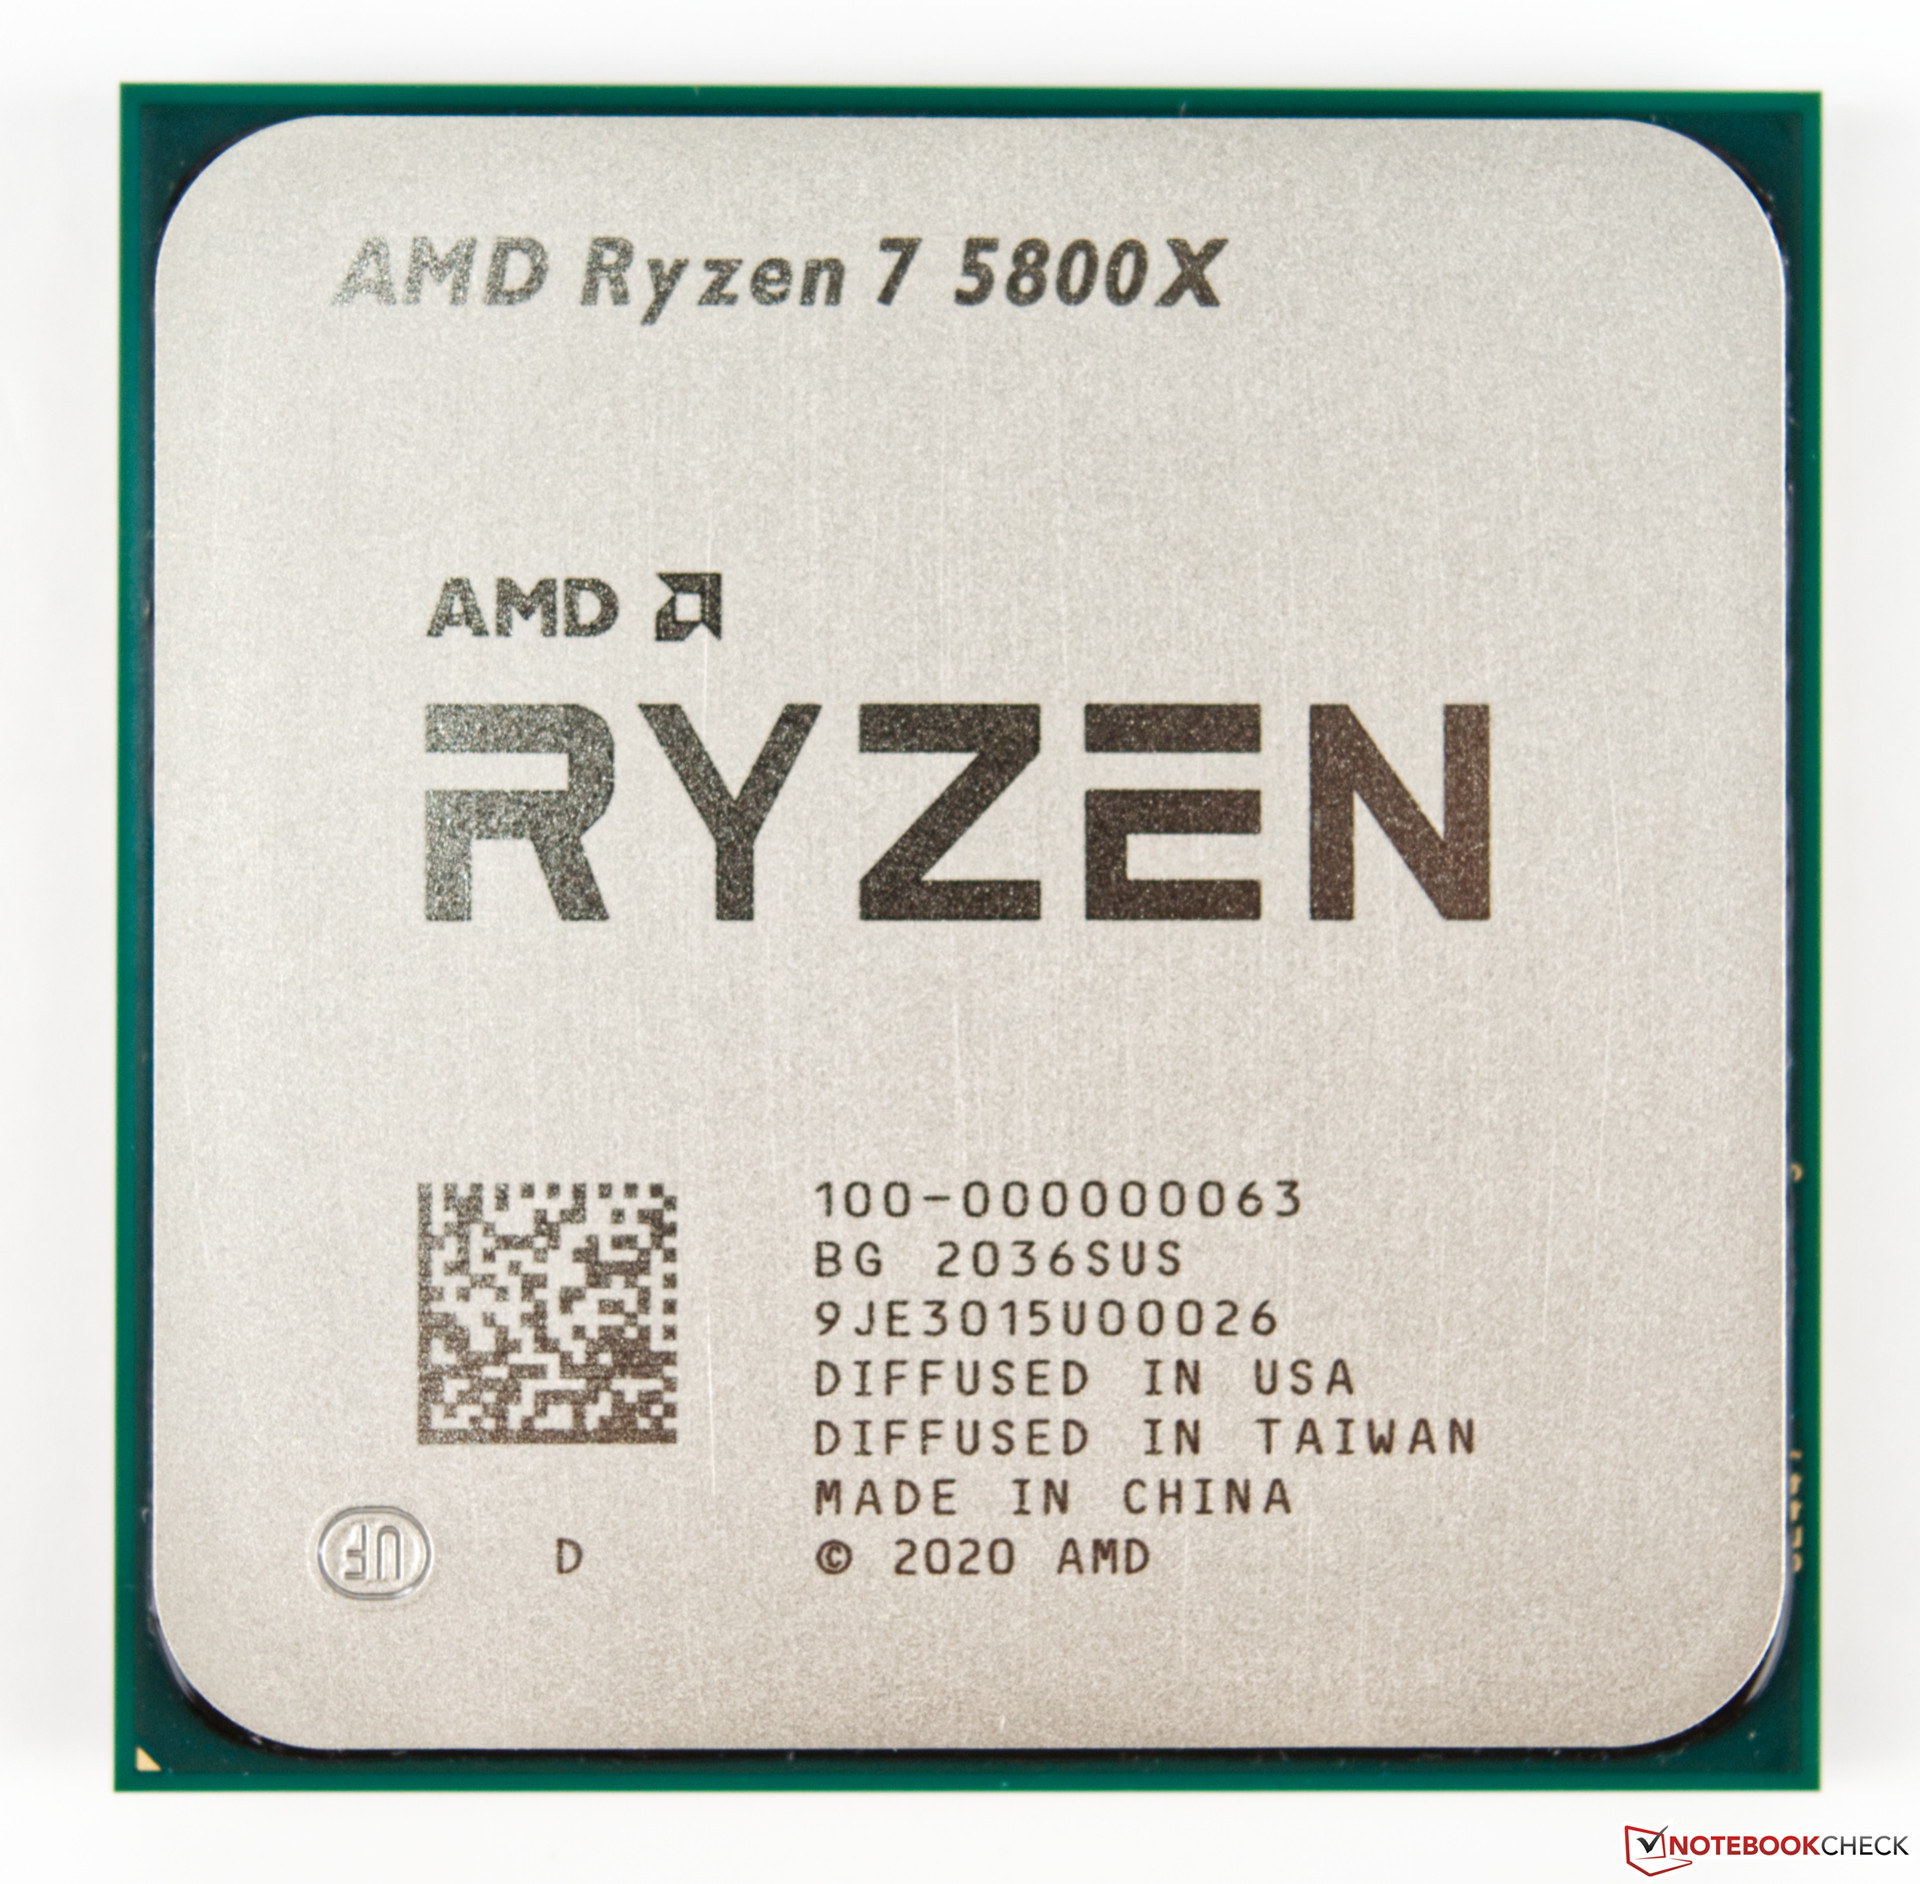
AMD Ryzen 7 5800X

| Cinebench R10 | |
| Rendering Single CPUs 64Bit | |
| AMD Ryzen 7 5800X | |
| AMD Ryzen 9 5900X | |
| Intel Core i9-10900K | |
| AMD Ryzen 9 3950X | |
| AMD Ryzen 9 3900X | |
| AMD Ryzen 3 3300X | |
| AMD Ryzen 7 3700X | |
| Rendering Multiple CPUs 64Bit | |
| AMD Ryzen 9 5900X | |
| AMD Ryzen 9 3950X | |
| AMD Ryzen 7 5800X | |
| Intel Core i9-10900K | |
| AMD Ryzen 9 3900X | |
| AMD Ryzen 7 3700X | |
| AMD Ryzen 3 3300X | |
| Blender - v2.79 BMW27 CPU | |
| AMD Ryzen 3 3300X | |
| AMD Ryzen 7 5800X | |
| AMD Ryzen 7 3700X | |
| Intel Core i9-10900K | |
| AMD Ryzen 9 3900X | |
| AMD Ryzen 9 5900X | |
| AMD Ryzen 9 3950X | |
| WinRAR - Result | |
| AMD Ryzen 7 5800X | |
| AMD Ryzen 9 5900X | |
| Intel Core i9-10900K | |
| AMD Ryzen 9 3900X | |
| AMD Ryzen 7 3700X | |
| AMD Ryzen 9 3950X | |
| AMD Ryzen 3 3300X | |
| Geekbench 4.4 | |
| 64 Bit Single-Core Score | |
| AMD Ryzen 7 5800X | |
| AMD Ryzen 9 5900X | |
| Intel Core i9-10900K | |
| AMD Ryzen 9 3900X | |
| AMD Ryzen 7 3700X | |
| AMD Ryzen 3 3300X | |
| AMD Ryzen 9 3950X | |
| 64 Bit Multi-Core Score | |
| AMD Ryzen 9 5900X | |
| AMD Ryzen 9 3950X | |
| AMD Ryzen 7 5800X | |
| AMD Ryzen 9 3900X | |
| Intel Core i9-10900K | |
| AMD Ryzen 7 3700X | |
| AMD Ryzen 3 3300X | |
| 3DMark 11 - 1280x720 Performance Physics | |
| AMD Ryzen 9 5900X | |
| AMD Ryzen 7 5800X | |
| Intel Core i9-10900K | |
| AMD Ryzen 9 3950X | |
| AMD Ryzen 9 3900X | |
| AMD Ryzen 7 3700X | |
| AMD Ryzen 3 3300X | |
| HWBOT x265 Benchmark v2.2 - 4k Preset | |
| AMD Ryzen 9 5900X | |
| Intel Core i9-10900K | |
| AMD Ryzen 9 3900X | |
| AMD Ryzen 7 5800X | |
| AMD Ryzen 9 3950X | |
| AMD Ryzen 7 3700X | |
| AMD Ryzen 3 3300X | |
| R Benchmark 2.5 - Overall mean | |
| AMD Ryzen 9 3900X | |
| AMD Ryzen 3 3300X | |
| Intel Core i9-10900K | |
| AMD Ryzen 9 3950X | |
| AMD Ryzen 9 5900X | |
| AMD Ryzen 7 5800X | |
| LibreOffice - 20 Documents To PDF | |
| Intel Core i9-10900K | |
| AMD Ryzen 9 3900X | |
| AMD Ryzen 9 3950X | |
| AMD Ryzen 3 3300X | |
| AMD Ryzen 9 5900X | |
| AMD Ryzen 7 5800X | |
| WebXPRT 3 - Overall | |
| AMD Ryzen 7 5800X | |
| AMD Ryzen 9 5900X | |
| Intel Core i9-10900K | |
| AMD Ryzen 9 3950X | |
| AMD Ryzen 3 3300X | |
| Mozilla Kraken 1.1 - Total | |
| AMD Ryzen 3 3300X | |
| Intel Core i9-10900K | |
| AMD Ryzen 9 3950X | |
| AMD Ryzen 9 5900X | |
| AMD Ryzen 7 5800X | |
| 3DMark | |
| 3840x2160 Fire Strike Ultra Physics | |
| AMD Ryzen 9 5900X | |
| AMD Ryzen 9 3950X | |
| AMD Ryzen 7 5800X | |
| Intel Core i9-10900K | |
| AMD Ryzen 9 3900X | |
| AMD Ryzen 7 3700X | |
| AMD Ryzen 3 3300X | |
| 1920x1080 Fire Strike Physics | |
| AMD Ryzen 9 5900X | |
| AMD Ryzen 9 3950X | |
| AMD Ryzen 7 5800X | |
| Intel Core i9-10900K | |
| AMD Ryzen 9 3900X | |
| AMD Ryzen 7 3700X | |
| AMD Ryzen 3 3300X | |
| 2560x1440 Time Spy CPU | |
| Intel Core i9-10900K | |
| AMD Ryzen 9 5900X | |
| AMD Ryzen 9 3950X | |
| AMD Ryzen 9 3900X | |
| AMD Ryzen 7 5800X | |
| AMD Ryzen 7 3700X | |
| AMD Ryzen 3 3300X | |
* ... Meglio usare valori piccoli
Prova di carico sostenuto con il nostro ciclo CineBench R15
Né il Ryzen 9 5900X né il Ryzen 7 5800X hanno avuto problemi con il nostro ciclo multi-thread CineBench R15. L'AiO combinato con il dissipatore da 280 mm è riuscito a mantenere le CPU sempre raffeddate.
Prestazioni gaming della Vermeer
Finora, Intel ha realizzato la CPU gaming più veloce disponibile. Grazie alla nuova serie Ryzen 5000, questo onore va ora ad AMD. Cominciamo con i benchmarks sintetici: sia il Ryzen 9 5900X che il Ryzen 7 5800X sono riusciti a battere i rispettivi predecessori. Tuttavia, il processore Intel Comet Lake S continua a superare le CPU di AMD per margini a una cifra.
La situazione cambia completamente quando guardiamo i nostri benchmarks relativi al gaming. La Zen 3 riesce a superare le prestazioni dell'Intel Core i9-10900K fino al 20%. Più alta è la risoluzione e i dettagli, minore è la differenza tra i due concorrenti. Tuttavia, entrambi i nostri modelli si sono comportati incredibilmente bene quando sono stati accoppiati con la Nvidia Titan RTX. La differenza rispetto ai precedenti processori Ryzen della serie 3000 è enorme e, a seconda del gioco, varia tra il 10 e il 40%.
| 3DMark 11 - 1280x720 Performance GPU | |
| Intel Core i7-10700K | |
| Intel Core i9-10900K | |
| AMD Ryzen 7 5800X | |
| AMD Ryzen 7 3800XT | |
| AMD Ryzen 3 3300X | |
| AMD Ryzen 9 5900X | |
| AMD Ryzen 3 3100 | |
| AMD Ryzen 9 3950X | |
| AMD Ryzen 5 1600 | |
| AMD Ryzen 3 3100 | |
| AMD Ryzen 9 3900X | |
| AMD Ryzen 7 2700X | |
| 3DMark | |
| 2560x1440 Time Spy Graphics | |
| AMD Ryzen 9 5900X | |
| AMD Ryzen 7 3800XT | |
| AMD Ryzen 7 5800X | |
| AMD Ryzen 3 3300X | |
| Intel Core i9-10900K | |
| AMD Ryzen 9 3900X | |
| AMD Ryzen 5 1600 | |
| AMD Ryzen 3 3100 | |
| Intel Core i7-10700K | |
| AMD Ryzen 9 3950X | |
| AMD Ryzen 7 2700X | |
| 1280x720 Sky Diver Graphics | |
| Intel Core i7-10700K | |
| Intel Core i9-10900K | |
| AMD Ryzen 9 5900X | |
| AMD Ryzen 7 5800X | |
| AMD Ryzen 9 3900X | |
| AMD Ryzen 9 3950X | |
| AMD Ryzen 7 3800XT | |
| AMD Ryzen 3 3300X | |
| AMD Ryzen 7 2700X | |
| AMD Ryzen 5 1600 | |
| AMD Ryzen 3 3100 | |
| 1280x720 Cloud Gate Standard Graphics | |
| Intel Core i7-10700K | |
| Intel Core i9-10900K | |
| AMD Ryzen 7 5800X | |
| AMD Ryzen 9 5900X | |
| AMD Ryzen 9 3900X | |
| AMD Ryzen 9 3950X | |
| AMD Ryzen 7 3800XT | |
| AMD Ryzen 3 3300X | |
| AMD Ryzen 3 3100 | |
| AMD Ryzen 5 1600 | |
| AMD Ryzen 7 2700X | |
| 1920x1080 Fire Strike Graphics | |
| Intel Core i7-10700K | |
| AMD Ryzen 7 5800X | |
| Intel Core i9-10900K | |
| AMD Ryzen 3 3100 | |
| AMD Ryzen 3 3100 | |
| AMD Ryzen 3 3300X | |
| AMD Ryzen 7 3800XT | |
| AMD Ryzen 7 2700X | |
| AMD Ryzen 9 3900X | |
| AMD Ryzen 9 5900X | |
| AMD Ryzen 5 1600 | |
| AMD Ryzen 9 3950X | |
| Unigine Heaven 4.0 | |
| Extreme Preset DX11 | |
| AMD Ryzen 9 5900X | |
| AMD Ryzen 7 5800X | |
| AMD Ryzen 9 3900X | |
| AMD Ryzen 7 2700X | |
| Extreme Preset OpenGL | |
| AMD Ryzen 7 5800X | |
| AMD Ryzen 9 5900X | |
| AMD Ryzen 9 3900X | |
| AMD Ryzen 7 2700X | |
| Unigine Valley 1.0 | |
| 1920x1080 Extreme HD Preset OpenGL AA:x8 | |
| AMD Ryzen 9 5900X | |
| AMD Ryzen 7 5800X | |
| AMD Ryzen 9 3900X | |
| AMD Ryzen 7 2700X | |
| 1920x1080 Extreme HD DirectX AA:x8 | |
| AMD Ryzen 9 5900X | |
| AMD Ryzen 7 5800X | |
| AMD Ryzen 9 3900X | |
| AMD Ryzen 7 2700X | |
| Unigine Superposition | |
| 1280x720 720p Low | |
| AMD Ryzen 7 5800X | |
| AMD Ryzen 9 5900X | |
| AMD Ryzen 9 3900X | |
| 1920x1080 1080p Extreme | |
| AMD Ryzen 9 5900X | |
| AMD Ryzen 7 5800X | |
| AMD Ryzen 9 3900X | |
| 7680x4320 8k Optimized | |
| AMD Ryzen 9 5900X | |
| AMD Ryzen 7 5800X | |
| AMD Ryzen 9 3900X | |
| Borderlands 3 | |
| 1280x720 Very Low Overall Quality (DX11) | |
| AMD Ryzen 9 5900X, NVIDIA Titan RTX | |
| AMD Ryzen 7 5800X, NVIDIA Titan RTX | |
| Intel Core i9-10900K, NVIDIA Titan RTX | |
| Intel Core i7-10700K, NVIDIA Titan RTX | |
| AMD Ryzen 9 3900X, NVIDIA Titan RTX | |
| AMD Ryzen 9 3950X, NVIDIA Titan RTX | |
| AMD Ryzen 7 3800XT, NVIDIA Titan RTX | |
| AMD Ryzen 3 3300X, NVIDIA Titan RTX | |
| AMD Ryzen 3 3100, NVIDIA Titan RTX | |
| AMD Ryzen 5 1600, NVIDIA Titan RTX | |
| 1920x1080 Badass Overall Quality (DX11) | |
| AMD Ryzen 9 5900X, NVIDIA Titan RTX | |
| Intel Core i9-10900K, NVIDIA Titan RTX | |
| Intel Core i7-10700K, NVIDIA Titan RTX | |
| AMD Ryzen 7 3800XT, NVIDIA Titan RTX | |
| AMD Ryzen 7 5800X, NVIDIA Titan RTX | |
| AMD Ryzen 9 3900X, NVIDIA Titan RTX | |
| AMD Ryzen 9 3950X, NVIDIA Titan RTX | |
| AMD Ryzen 3 3300X, NVIDIA Titan RTX | |
| AMD Ryzen 3 3100, NVIDIA Titan RTX | |
| AMD Ryzen 5 1600, NVIDIA Titan RTX | |
| The Witcher 3 | |
| 1024x768 Low Graphics & Postprocessing | |
| AMD Ryzen 9 5900X, NVIDIA Titan RTX | |
| AMD Ryzen 7 5800X, NVIDIA Titan RTX | |
| Intel Core i9-10900K, NVIDIA Titan RTX | |
| Intel Core i7-10700K, NVIDIA Titan RTX | |
| AMD Ryzen 9 3900X, NVIDIA Titan RTX | |
| AMD Ryzen 7 3800XT, NVIDIA Titan RTX | |
| AMD Ryzen 9 3950X, NVIDIA Titan RTX | |
| AMD Ryzen 3 3300X, NVIDIA Titan RTX | |
| AMD Ryzen 5 1600, NVIDIA Titan RTX | |
| AMD Ryzen 3 3100, NVIDIA Titan RTX | |
| 1920x1080 Ultra Graphics & Postprocessing (HBAO+) | |
| Intel Core i7-10700K, NVIDIA Titan RTX | |
| AMD Ryzen 9 5900X, NVIDIA Titan RTX | |
| Intel Core i9-10900K, NVIDIA Titan RTX | |
| AMD Ryzen 7 3800XT, NVIDIA Titan RTX | |
| AMD Ryzen 7 5800X, NVIDIA Titan RTX | |
| AMD Ryzen 9 3900X, NVIDIA Titan RTX | |
| AMD Ryzen 5 1600, NVIDIA Titan RTX | |
| AMD Ryzen 9 3950X, NVIDIA Titan RTX | |
| AMD Ryzen 3 3300X, NVIDIA Titan RTX | |
| AMD Ryzen 3 3100, NVIDIA Titan RTX | |
| Shadow of the Tomb Raider | |
| 1280x720 Lowest Preset | |
| AMD Ryzen 7 5800X, NVIDIA Titan RTX | |
| AMD Ryzen 9 5900X, NVIDIA Titan RTX | |
| Intel Core i9-10900K, NVIDIA Titan RTX | |
| AMD Ryzen 9 3950X, NVIDIA Titan RTX | |
| AMD Ryzen 7 3800XT, NVIDIA Titan RTX | |
| AMD Ryzen 9 3900X, NVIDIA Titan RTX | |
| AMD Ryzen 3 3300X, NVIDIA Titan RTX | |
| AMD Ryzen 3 3100, NVIDIA Titan RTX | |
| AMD Ryzen 5 1600, NVIDIA Titan RTX | |
| 1920x1080 Highest Preset AA:T | |
| AMD Ryzen 7 5800X, NVIDIA Titan RTX | |
| AMD Ryzen 9 5900X, NVIDIA Titan RTX | |
| Intel Core i9-10900K, NVIDIA Titan RTX | |
| AMD Ryzen 7 3800XT, NVIDIA Titan RTX | |
| AMD Ryzen 9 3950X, NVIDIA Titan RTX | |
| AMD Ryzen 3 3300X, NVIDIA Titan RTX | |
| AMD Ryzen 9 3900X, NVIDIA Titan RTX | |
| AMD Ryzen 3 3100, NVIDIA Titan RTX | |
| AMD Ryzen 5 1600, NVIDIA Titan RTX | |
| Strange Brigade | |
| 1280x720 lowest AF:1 | |
| AMD Ryzen 7 5800X, NVIDIA Titan RTX | |
| AMD Ryzen 9 5900X, NVIDIA Titan RTX | |
| Intel Core i7-10700K, NVIDIA Titan RTX | |
| AMD Ryzen 9 3900X, NVIDIA Titan RTX | |
| 1920x1080 ultra AA:ultra AF:16 | |
| AMD Ryzen 9 5900X, NVIDIA Titan RTX | |
| AMD Ryzen 7 5800X, NVIDIA Titan RTX | |
| Intel Core i7-10700K, NVIDIA Titan RTX | |
| AMD Ryzen 9 3900X, NVIDIA Titan RTX | |
| GTA V | |
| 1024x768 Lowest Settings possible | |
| Intel Core i7-10700K, NVIDIA Titan RTX | |
| AMD Ryzen 9 5900X, NVIDIA Titan RTX | |
| AMD Ryzen 7 5800X, NVIDIA Titan RTX | |
| 1920x1080 Highest AA:4xMSAA + FX AF:16x | |
| AMD Ryzen 9 5900X, NVIDIA Titan RTX | |
| AMD Ryzen 7 5800X, NVIDIA Titan RTX | |
| Intel Core i7-10700K, NVIDIA Titan RTX | |
Ryzen 9 5900X con Nvidia Titan RTX
| basso | medio | alto | ultra | QHD | 4K | |
|---|---|---|---|---|---|---|
| GTA V (2015) | 187 | 186 | 184 | 128 | 115 | 134 |
| The Witcher 3 (2015) | 617 | 437 | 276 | 141 | 104 | |
| Dota 2 Reborn (2015) | 232.6 | 208.7 | 199.4 | 180.3 | 172.1 | |
| Final Fantasy XV Benchmark (2018) | 225 | 182 | 139 | 105 | 63.6 | |
| X-Plane 11.11 (2018) | 177 | 158 | 130 | 111 | ||
| Far Cry 5 (2018) | 212 | 184 | 173 | 161 | 136 | 81 |
| Strange Brigade (2018) | 607 | 352 | 287 | 243 | 183 | 110 |
| Shadow of the Tomb Raider (2018) | 225 | 183 | 177 | 166 | 120 | 66.3 |
| Far Cry New Dawn (2019) | 176 | 152 | 147 | 131 | 121 | 84 |
| Metro Exodus (2019) | 241 | 173 | 133 | 106 | 84.9 | 54.9 |
| Borderlands 3 (2019) | 229 | 187 | 144 | 118 | 84.7 | 46.7 |
| Crysis Remastered (2020) | 273 | 74.5 | 212 | 115 | 90.9 | 48.9 |
| Dirt 5 (2020) | 187 | 128 | 106 | 95.9 | 79.5 | 57 |
| Assassin´s Creed Valhalla (2020) | 137 | 104 | 88 | 80 | 66 | 43 |
| Call of Duty Black Ops Cold War (2020) | 254 | 238 | 162 | 144 | 87.6 | 52.9 |
| Yakuza Like a Dragon (2020) | 119 | 117 | 116 | 111 | 100 | 55.2 |
| Immortals Fenyx Rising (2020) | 136 | 106 | 93 | 71 | 64 | 48 |
| Cyberpunk 2077 1.0 (2020) | 109 | 103 | 93.2 | 82.3 | 58.4 | 30.9 |
| Hitman 3 (2021) | 271 | 222 | 210 | 202 | 145 | 82 |
| Outriders (2021) | 136 | 162 | 158 | 156 | 119 | 64 |
| Resident Evil Village (2021) | 304 | 264 | 241 | 212 | 142 | 74.2 |
| Mass Effect Legendary Edition (2021) | 106 | 113 | 107 | 106 | ||
| Days Gone (2021) | 190 | 181 | 174 | 141 | 108 | 64.9 |
| Monster Hunter Stories 2 (2021) | 144 | 144 | 144 | 144 | 144 | |
| F1 2021 (2021) | 451 | 388 | 331 | 165 | 126 | 74.3 |
| Deathloop (2021) | 128 | 125 | 124 | 119 | 91.6 | 51.8 |
| New World (2021) | 180 | 139 | 131 | 123 | 101 | 54.5 |
| Alan Wake Remastered (2021) | 93.1 | 88.3 | 88.4 | 88.5 | ||
| Far Cry 6 (2021) | 143 | 106 | 95.8 | 94.7 | 80.9 | 52.8 |
| Back 4 Blood (2021) | 294 | 270 | 255 | 182 | 101 | |
| Guardians of the Galaxy (2021) | 135 | 134 | 134 | 133 | 131 | 82 |
| Riders Republic (2021) | 221 | 179 | 152 | 143 | 109 | 65 |
| Call of Duty Vanguard (2021) | 113 | 153 | 144 | 133 | 100 | 59.6 |
| Forza Horizon 5 (2021) | 237 | 161 | 148 | 96 | 84 | 62 |
| Battlefield 2042 (2021) | 99.3 | 139 | 129 | 117 | 93.6 | 60.2 |
| Farming Simulator 22 (2021) | 279 | 221 | 186 | 164 | 163 | 122 |
| Halo Infinite (2021) | 144 | 125 | 119 | 95.5 | 68.8 | |
| God of War (2022) | 174 | 149 | 124 | 89 | 72.8 | 48.9 |
| Rainbow Six Extraction (2022) | 264 | 225 | 223 | 179 | 130 | 70 |
| Dying Light 2 (2022) | 169 | 110 | 93.6 | 66.5 | 37.1 | |
| GRID Legends (2022) | 215.9 | 195.2 | 172.8 | 132.5 | 112.2 | 78.6 |
| Elden Ring (2022) | 59.9 | 59.9 | 59.7 | 59.9 | 59.9 | 59.6 |
| Cyberpunk 2077 1.6 (2022) | 78.9 | 78.7 | 78.6 | 78.3 | 66.2 | 32.8 |
| Elex 2 (2022) | 111 | 105 | 98 | 95.4 | 81.2 | 47.7 |
| Ghostwire Tokyo (2022) | 205 | 196.8 | 203 | 202 | 141 | 73.3 |
| Tiny Tina's Wonderlands (2022) | 245 | 201 | 151.3 | 124.3 | 92.4 | 50.4 |
| Vampire Bloodhunt (2022) | 391 | 267 | 252 | 244 | 173.2 | 93.6 |
Ryzen 7 5800X mit Nvidia Titan RTX
| basso | medio | alto | ultra | QHD | 4K | |
|---|---|---|---|---|---|---|
| GTA V (2015) | 187 | 187 | 184 | 123 | 112 | 125 |
| The Witcher 3 (2015) | 602 | 431 | 274 | 139 | 102 | |
| Dota 2 Reborn (2015) | 242.5 | 213.8 | 204 | 186.8 | 175.6 | |
| Final Fantasy XV Benchmark (2018) | 225 | 184 | 140 | 106 | 63.1 | |
| X-Plane 11.11 (2018) | 178 | 158 | 128 | 109 | ||
| Far Cry 5 (2018) | 207 | 177 | 168 | 158 | 134 | 79 |
| Strange Brigade (2018) | 662 | 352 | 288 | 242 | 183 | 110 |
| Shadow of the Tomb Raider (2018) | 230 | 193 | 183 | 170 | 121 | 66.3 |
| Far Cry New Dawn (2019) | 166 | 145 | 140 | 124 | 115 | 82 |
| Metro Exodus (2019) | 251 | 172 | 133 | 106 | 84.7 | 54.9 |
| Borderlands 3 (2019) | 221 | 183 | 141 | 116 | 83.8 | 46.3 |
Prestazioni con le applicazioni
Considerando che i nuovi processori Vermeer sono le CPU più veloci attualmente disponibili, non dovrebbe sorprendere che le prestazioni delle applicazioni quotidiane siano state impeccabili. Per i nostri test abbiamo utilizzato un SSD Intel Optane 905p, che conteneva il sistema operativo e alcuni benchmarks sintetici.
Proprio come per i test delle CPU, entrambi i nostri modelli sono riusciti a garantirsi i primi due posti in quasi tutti i benchmarks delle applicazioni. Sono anche riusciti a trovare alcune prestazioni extra nel test di rendering. Miglioramenti delle prestazioni fino al 20% non hanno fatto eccezione.
Il precedente dominatore del PCMark 10, il Ryzen 9 3950X di AMD, è stato superato di margini significativi. Il Core i9-10900K di Intel non ha avuto alcuna possibilità di tenere il passo ed è risultato più lento dell'11 % rispetto al Ryzen 9 5900X di AMD e dell'8 % in meno rispetto al Ryzen 7 5800X di AMD.
* ... Meglio usare valori piccoli
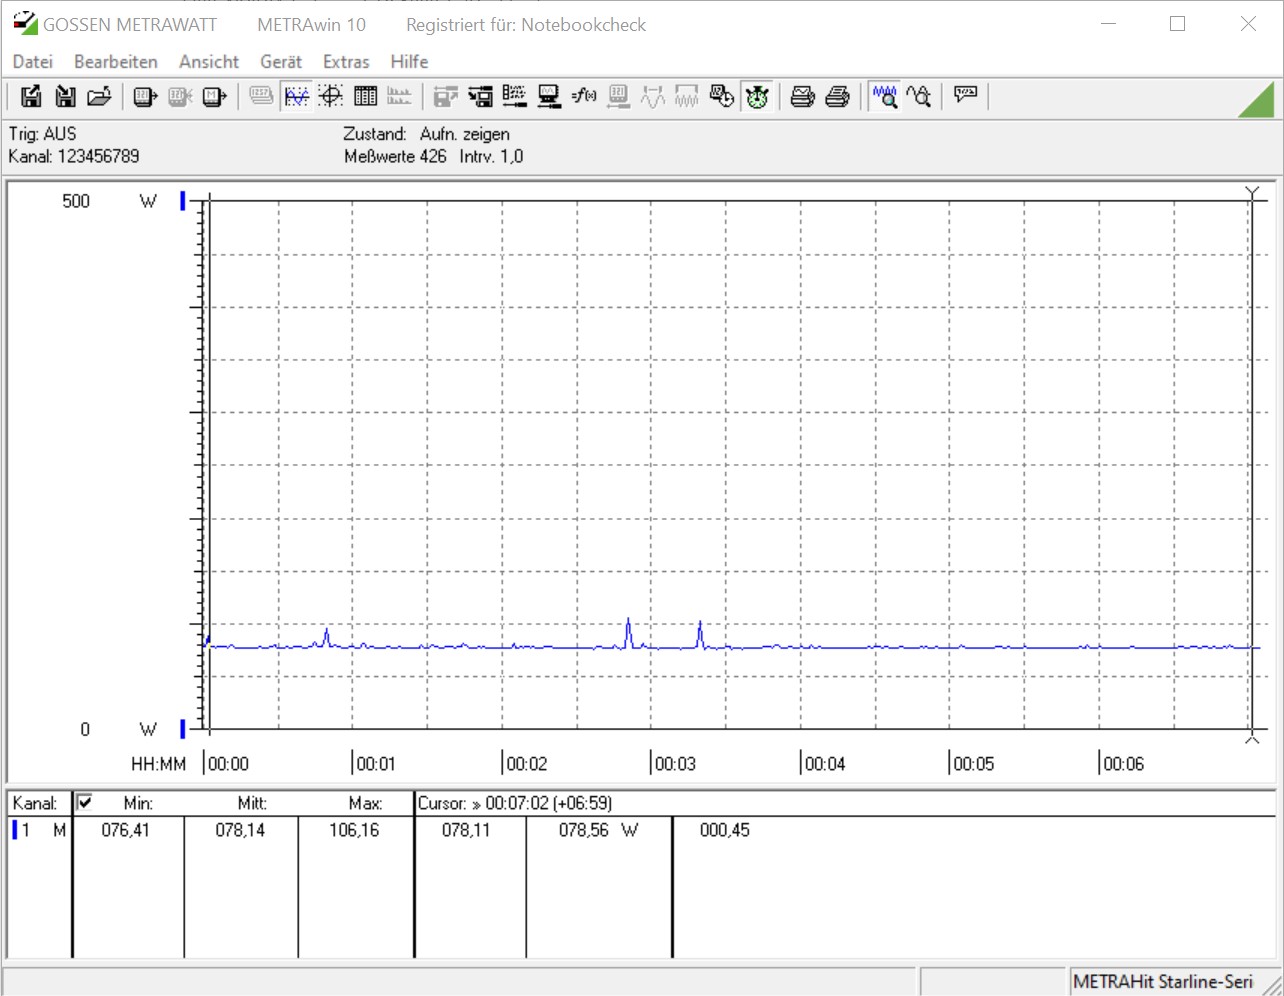
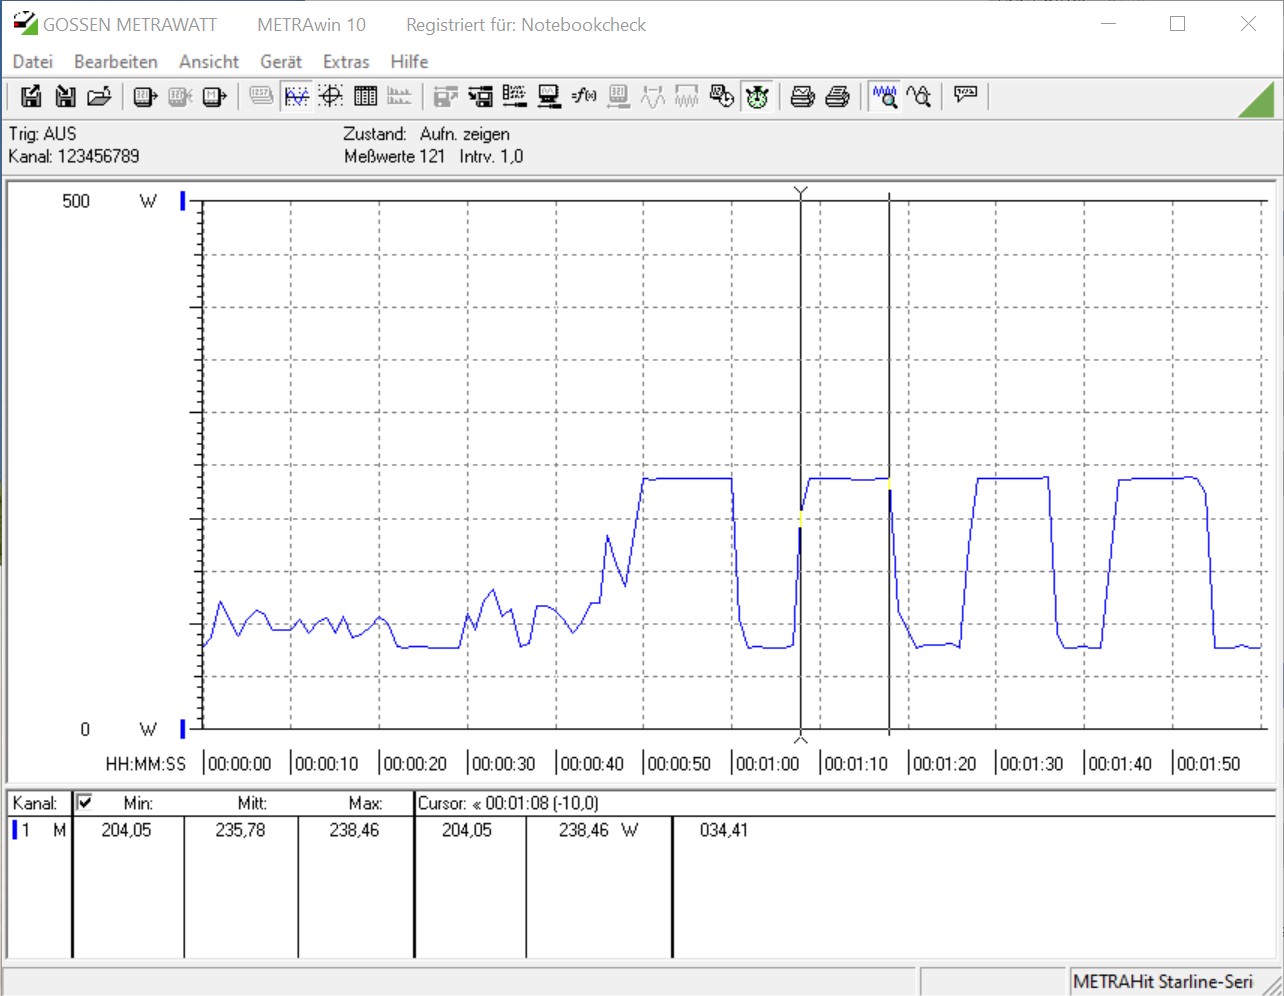
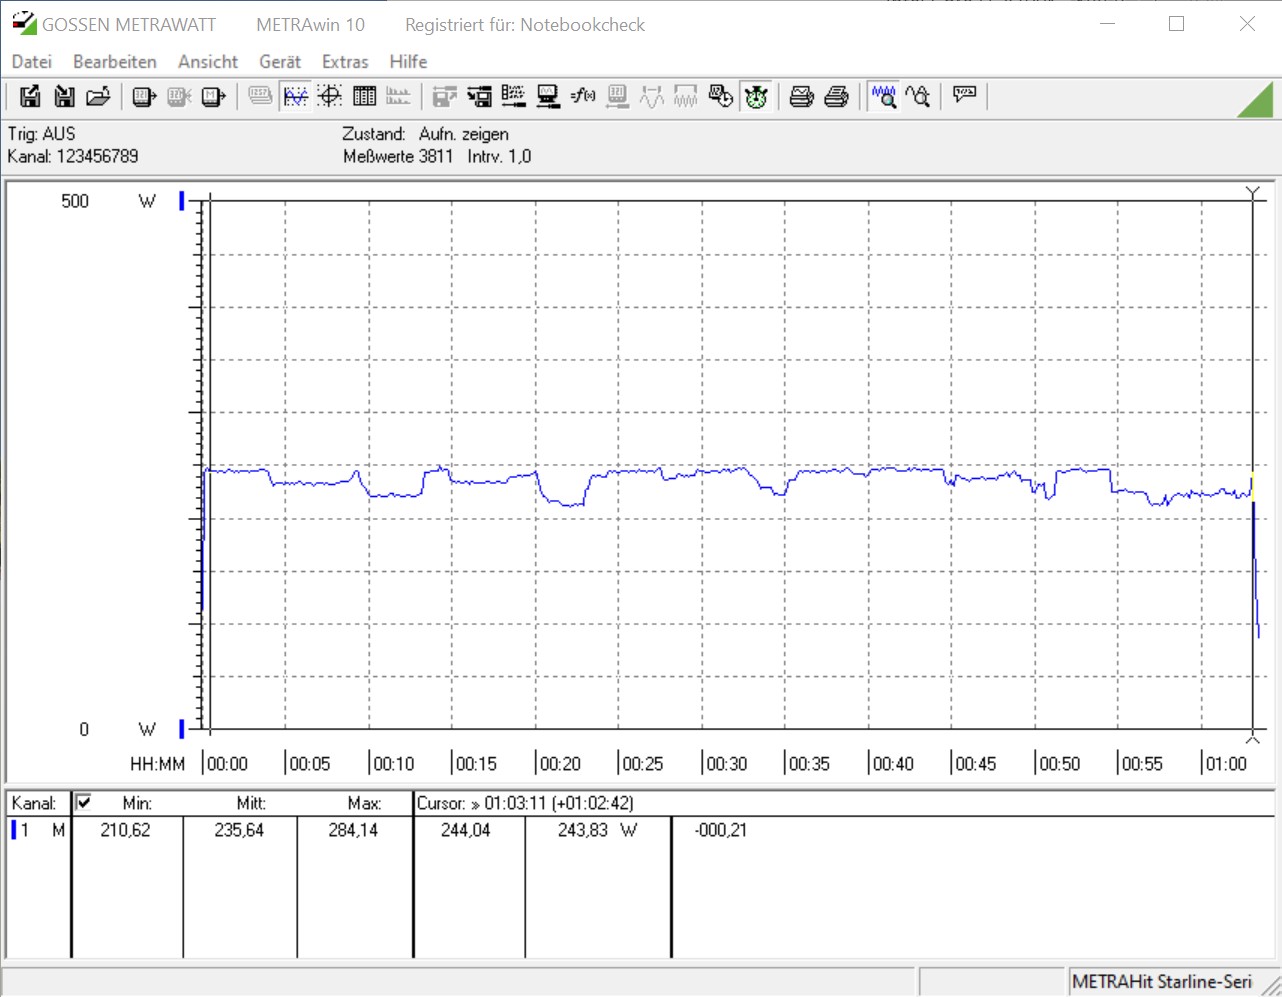
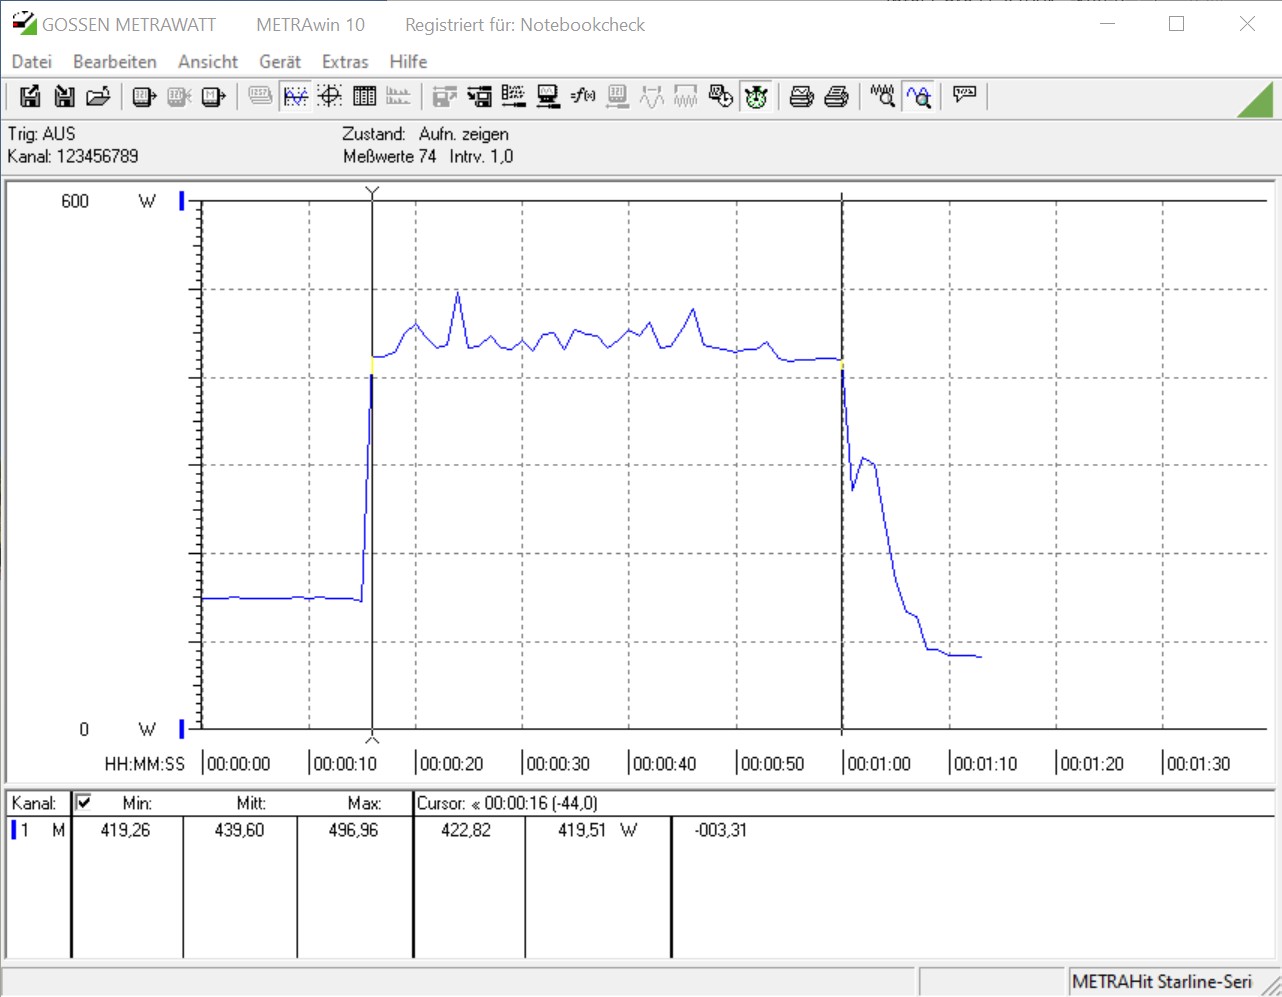
Consumo energetico
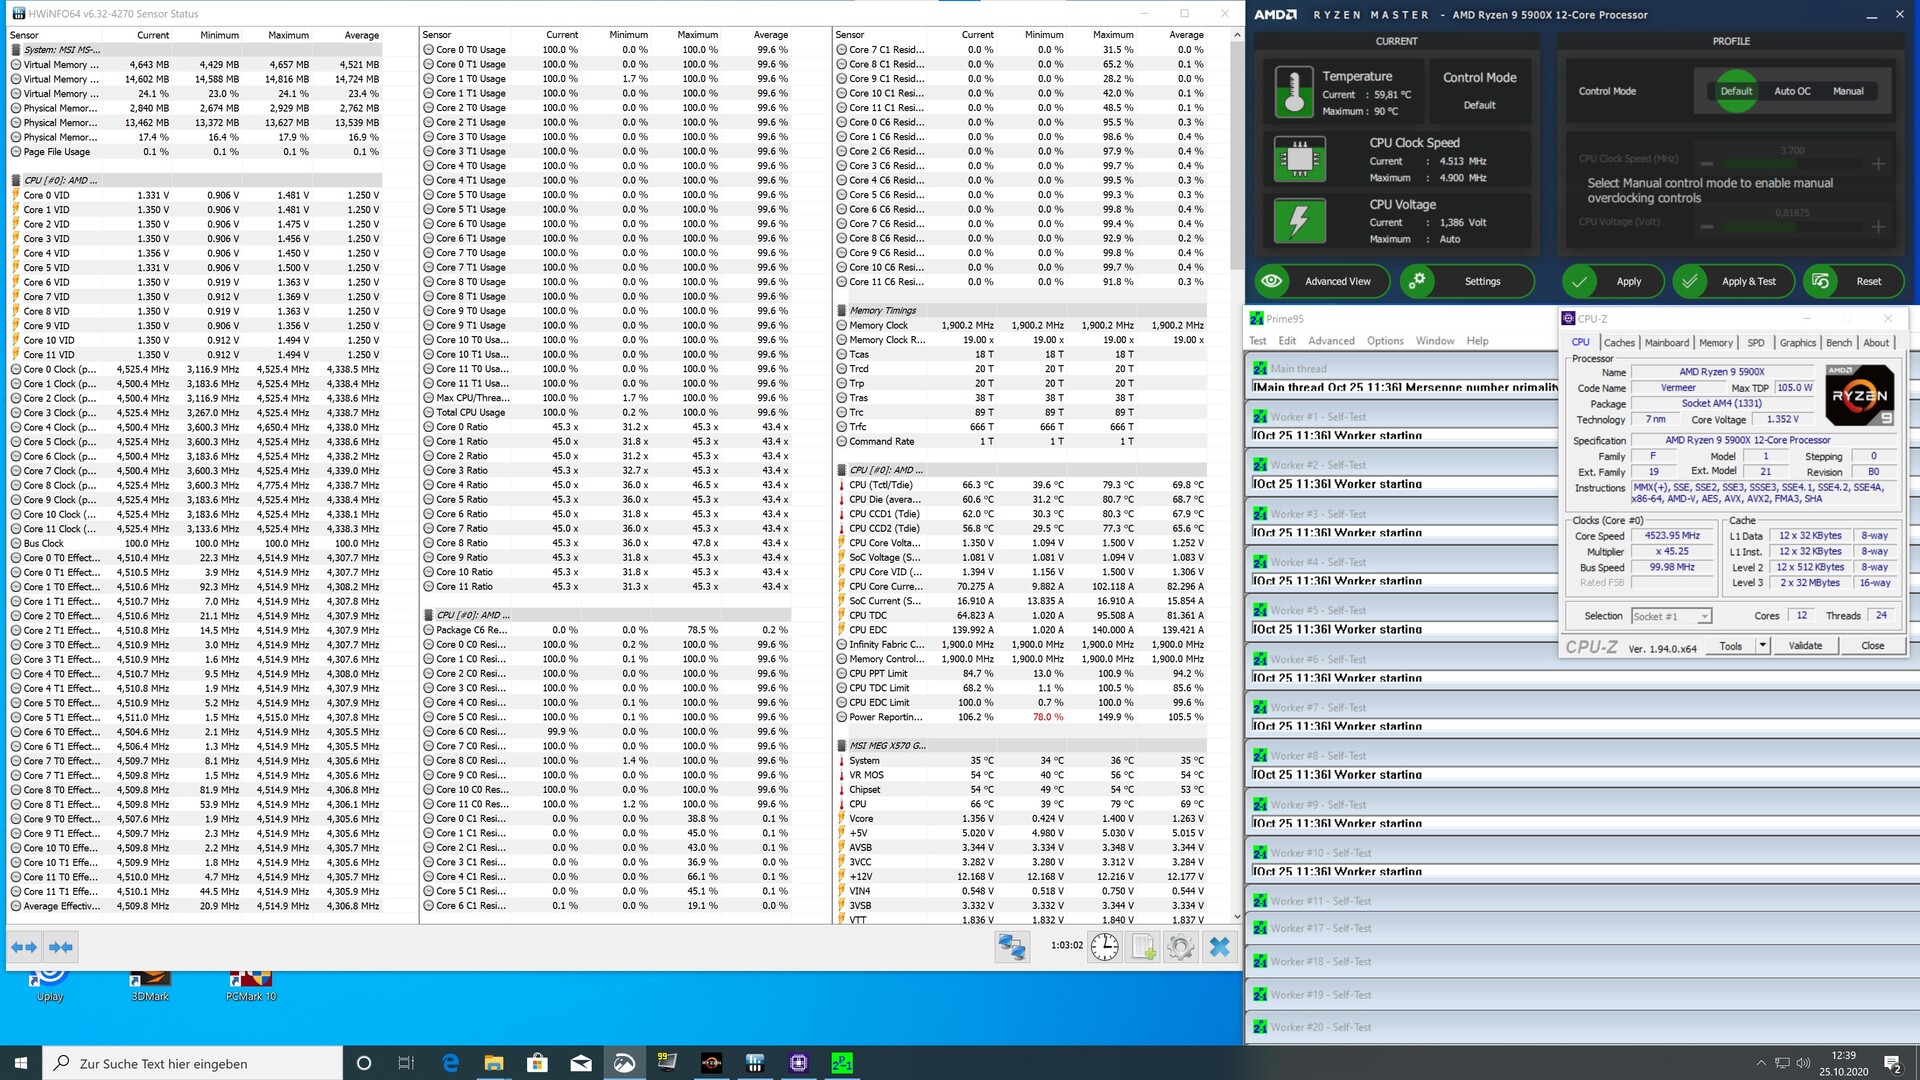
Ufficialmente, AMD specifica sia per il Ryzen 9 5900X che per il Ryzen 7 5800X un TDP di 105 W. Tuttavia, sappiamo già dal suo predecessore che questa specifica ufficiale non è altro che un approssimativo indicatore, e in passato, abbiamo visto picchi fino a 142 W. Lo stesso vale fondamentalmente per le nuove CPU Ryzen, così come è permesso loro di consumare fino a 142 W grazie al PBO2 (Precision Boost 2) con una temperatura non superiore a 61,8 °C. Il Core i9-10900K dovrebbe arrivare fino a 250 W. Dato che AMD non ha creato una nuova specifica di piattaforma per accompagnare le CPU Vermeer, possiamo aspettarci che tutte le altre specifiche relative al consumo energetico rimangano invariate. Lo Zen 3 dovrebbe quindi consumare circa la stessa potenza dello Zen 2. Tuttavia, i nostri test hanno rivelato che sia il Ryzen 9 5900X che il Ryzen 7 5800X richiedono un po' più di energia del Ryzen 9 3950X ma meno del Core i9-10900K. Quest'ultimo ha richiesto circa il 14% in più di energia durante il nostro stress test e il test multi-thread CineBench R15. La maggior parte è andata a favore del Core i9-10900K di Intel nei nostri benchmarks per il gaming, dove è risultato circa l'11% più efficiente dal punto di vista energetico rispetto al Ryzen 9 5900X dotato della stessa GPU.
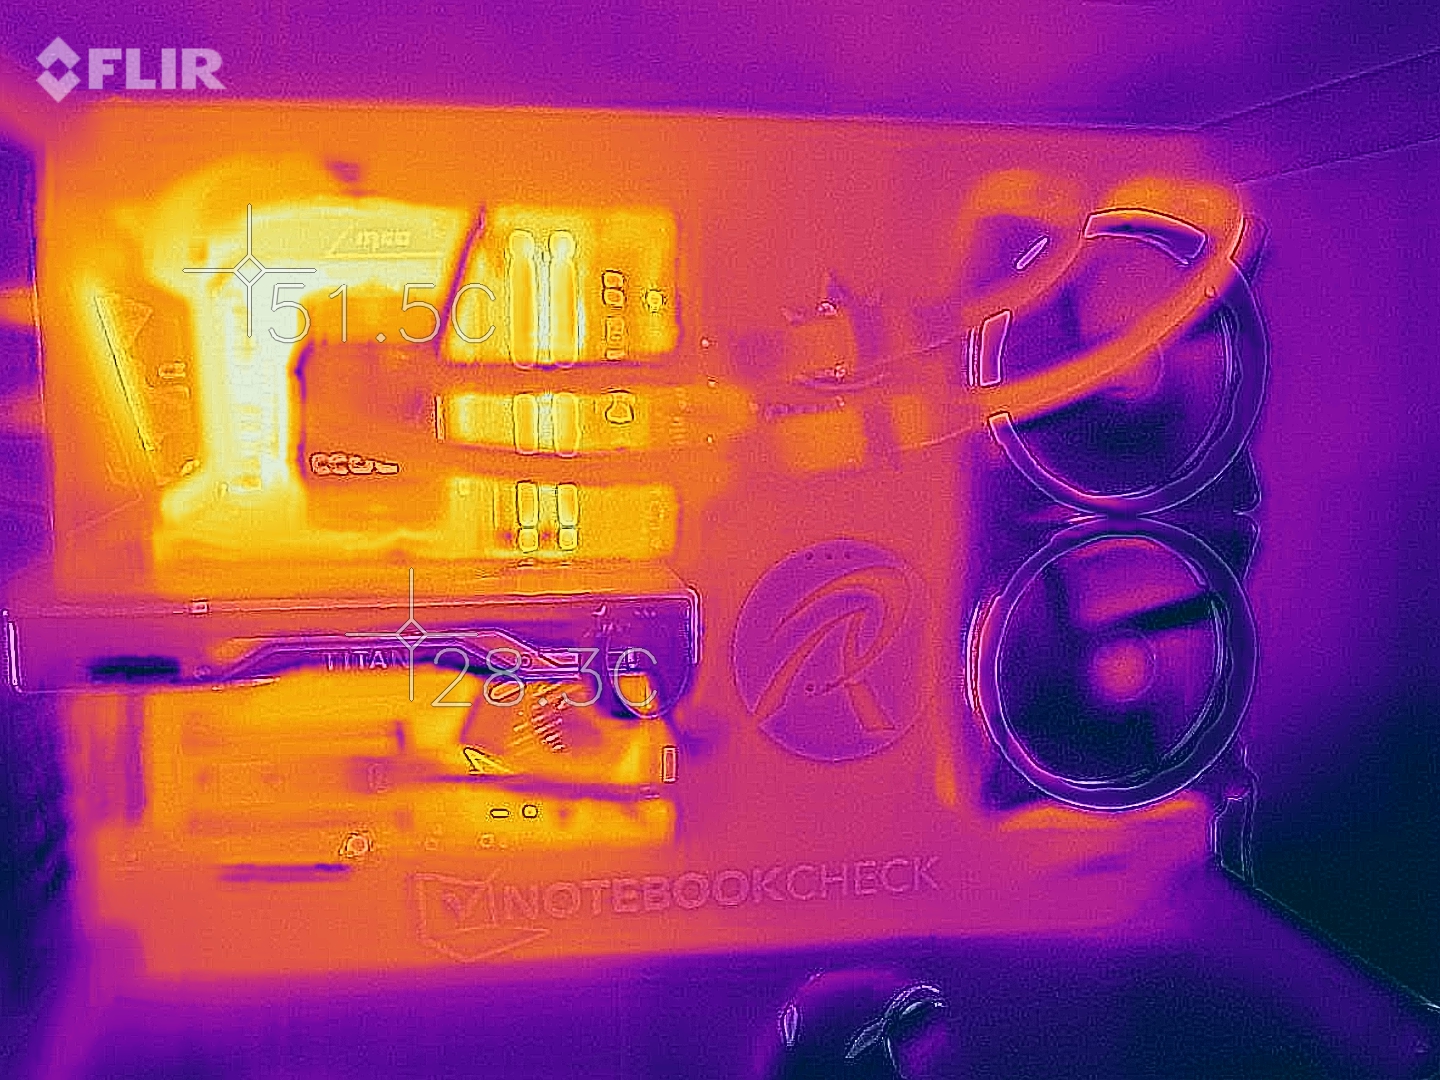
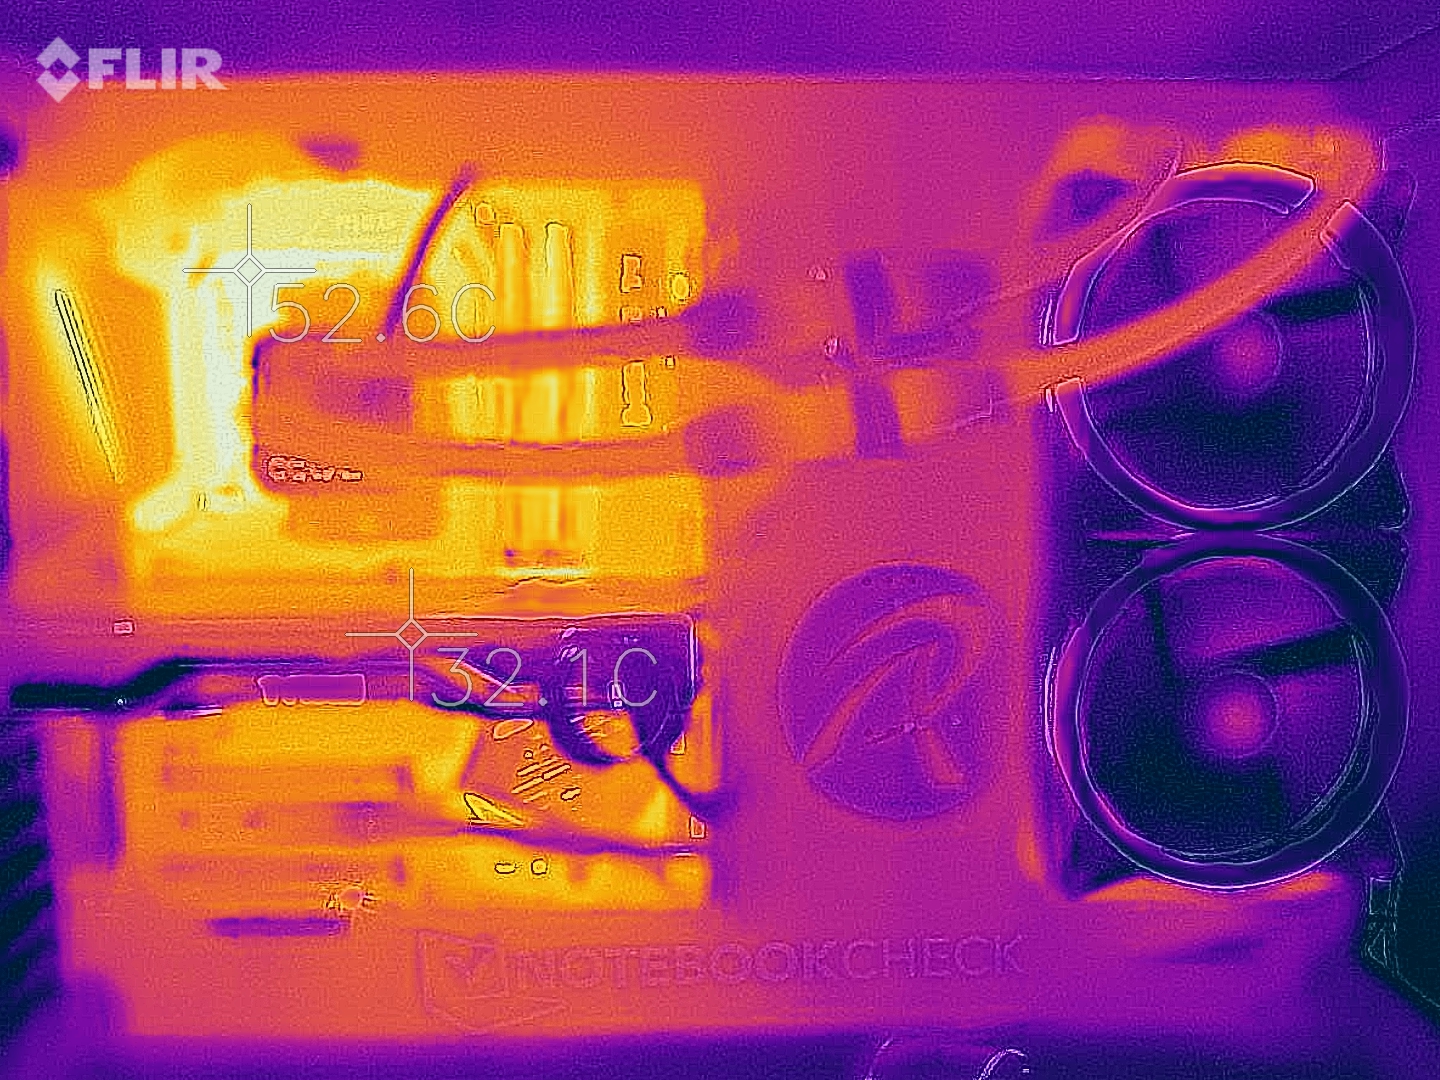
Nessuno dei nostri due dispositivi di prova ha mostrato problemi termici durante lo stress stress. L'Alphacool Eisbear 280 non ha avuto problemi a tenere sotto controllo le temperature di entrambi i modelli nel nostro confronto, anche se dobbiamo notare che il Ryzen 7 5800X è diventato un po' più caldo del Ryzen 9 5900X durante le nostre prove.
A differenza dell'AMD Ryzen 9 3900X queste CPU non sono dotate di un box di raffreddamento. Se si opta per un processore Ryzen serie 5000, è necessario fornire un potente sistema di raffreddamento per CPU.
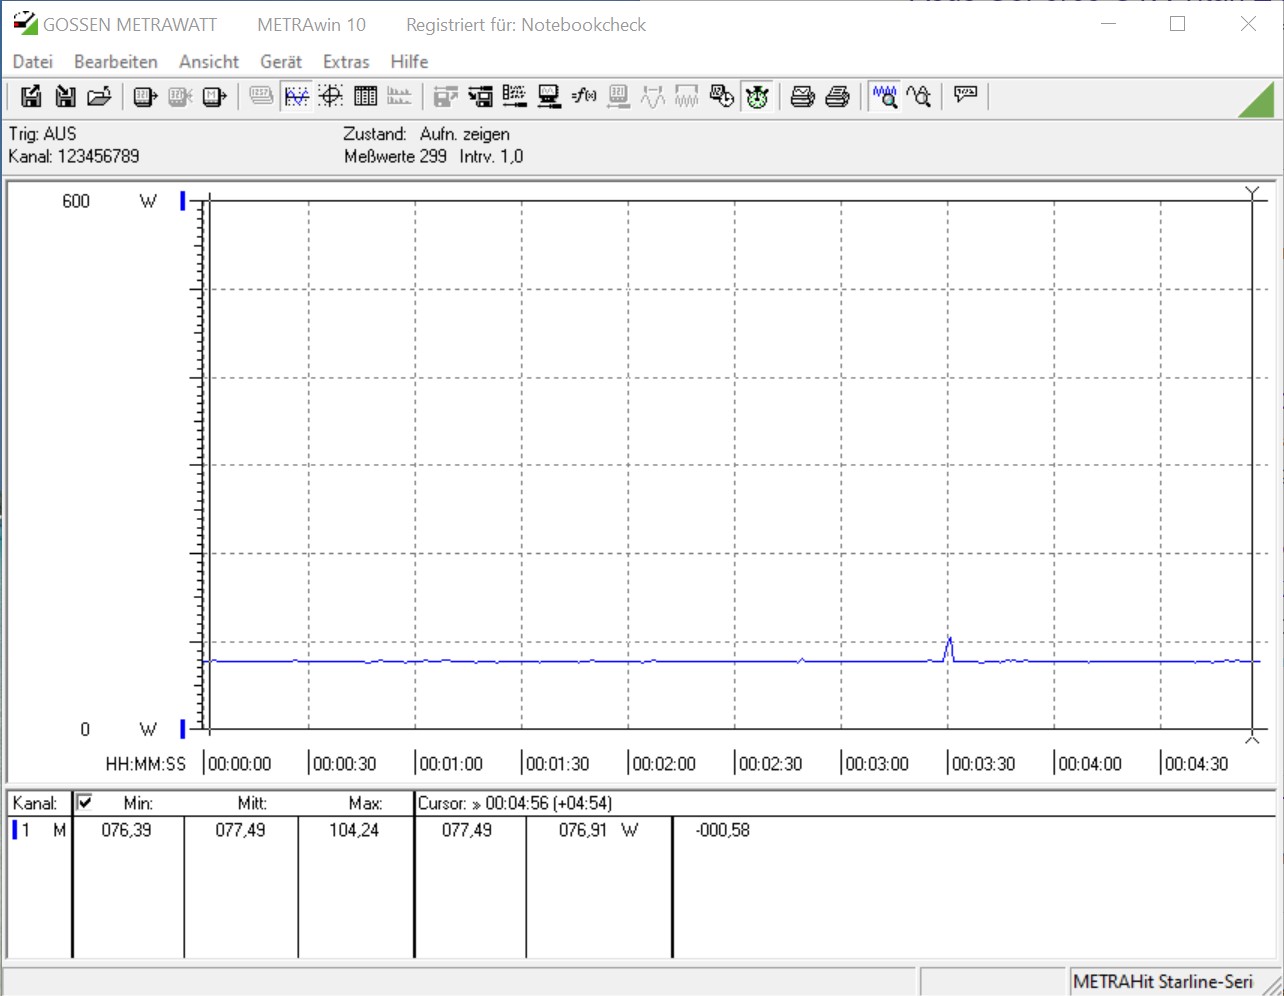
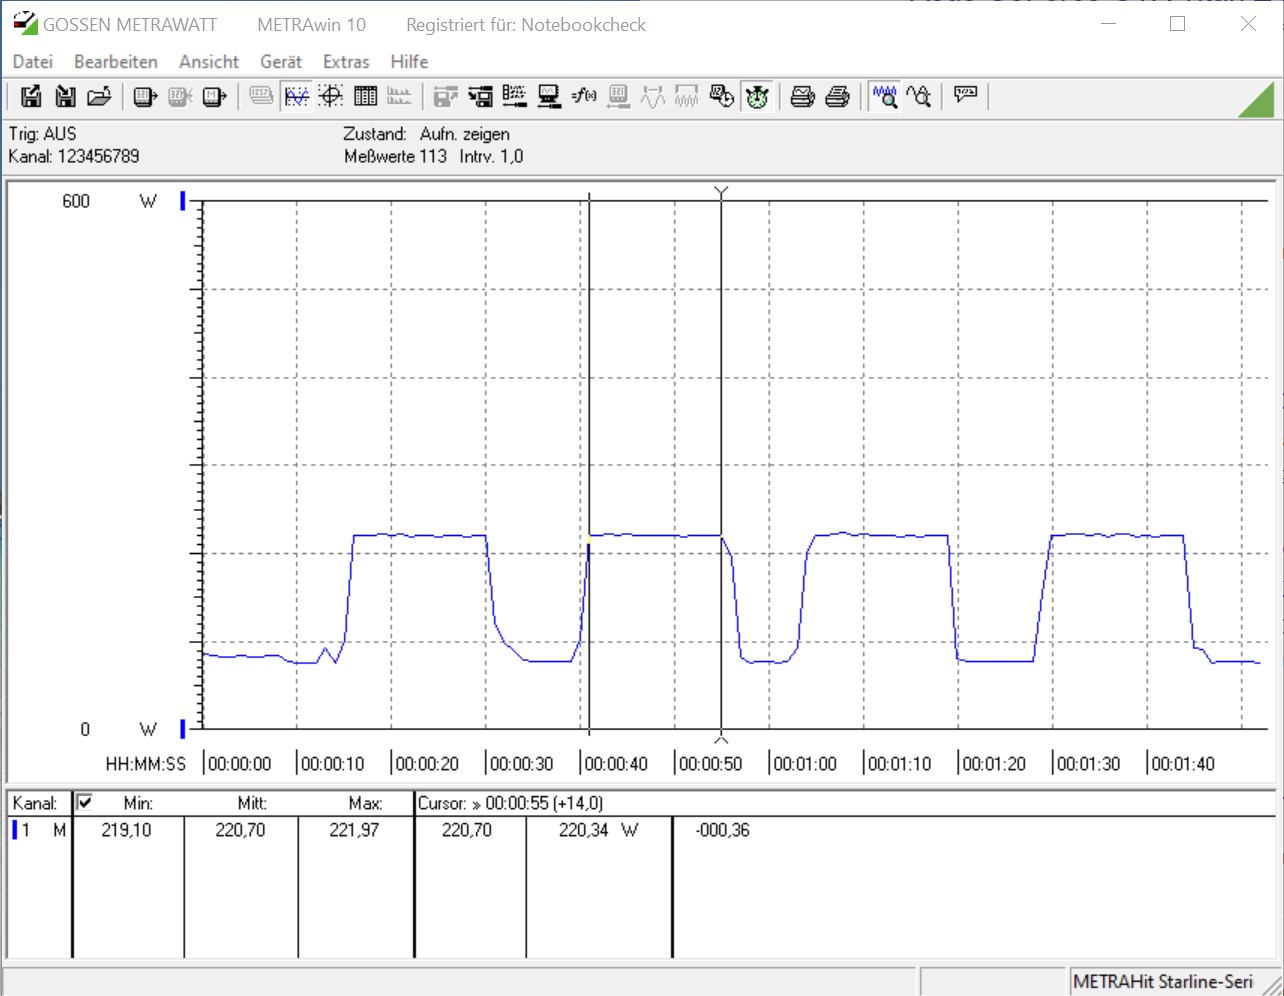
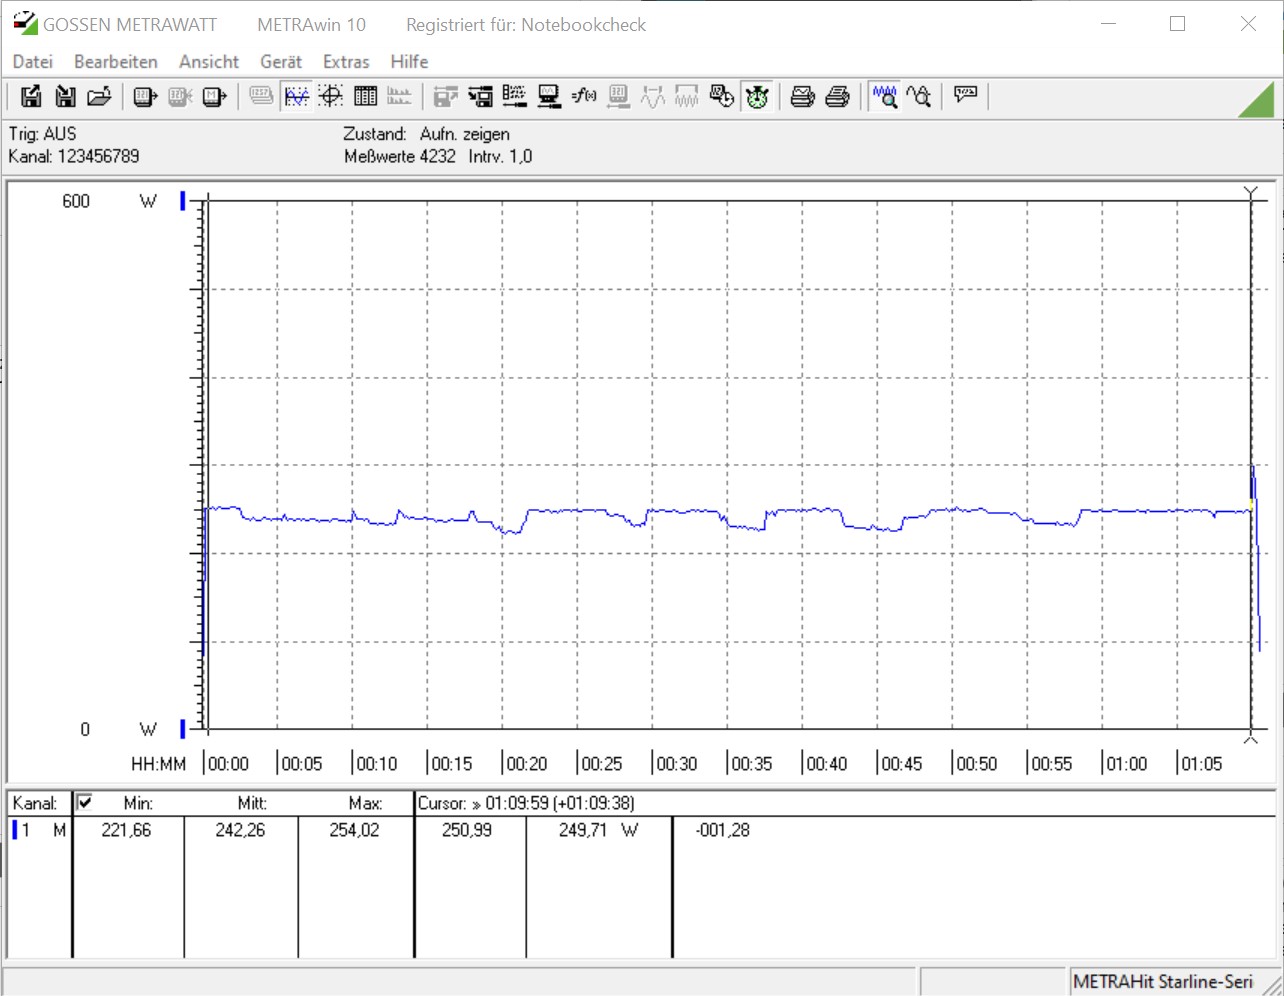
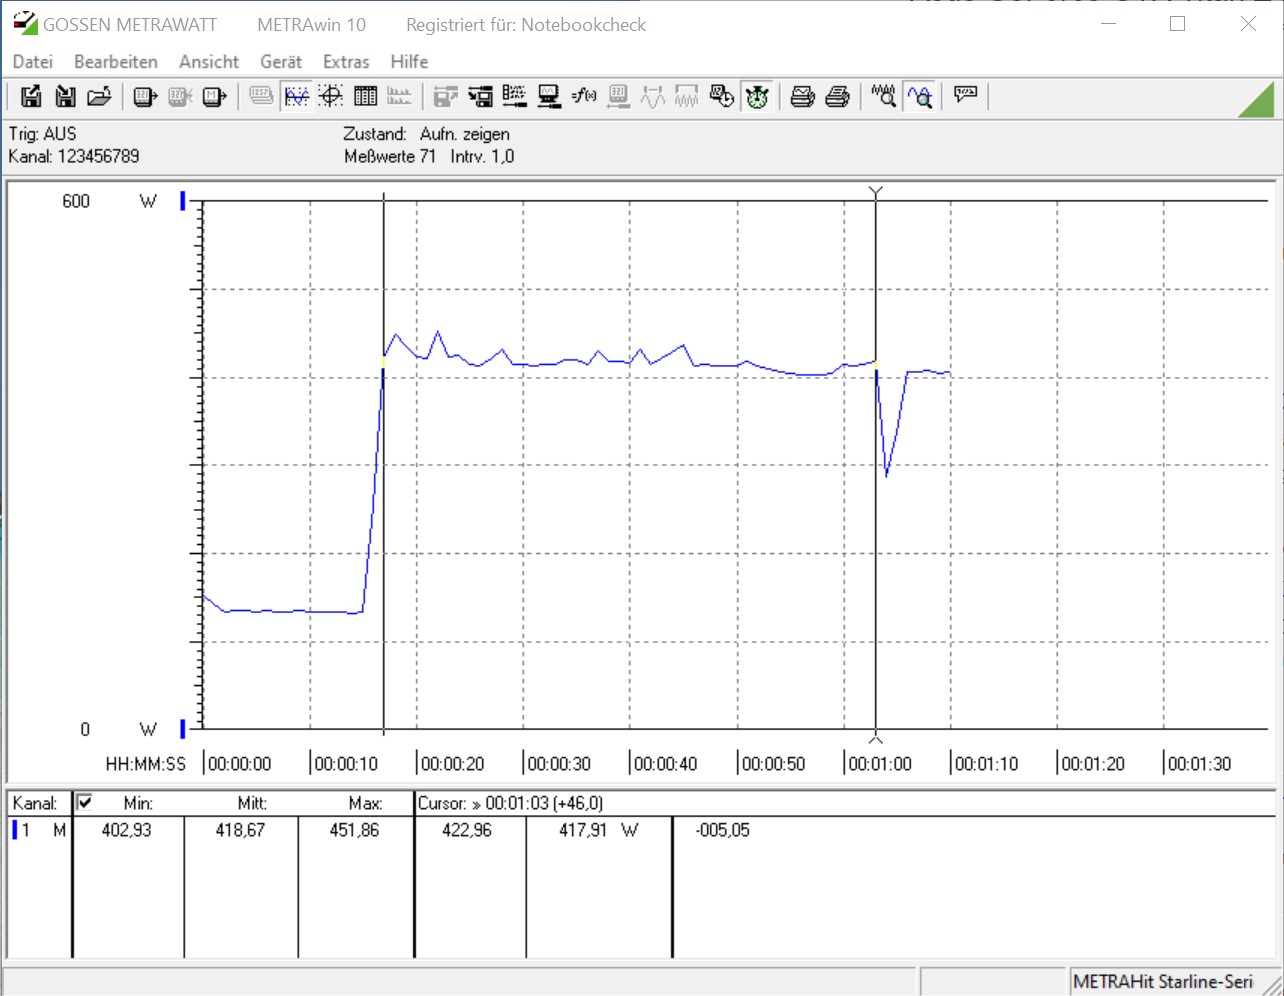
Da notare che il consumo di energia come indicato in questo test si riferisce per l'intero sistema senza monitor.
AMD Ryzen 9 5900X
AMD Ryzen 7 5800X
* ... Meglio usare valori piccoli
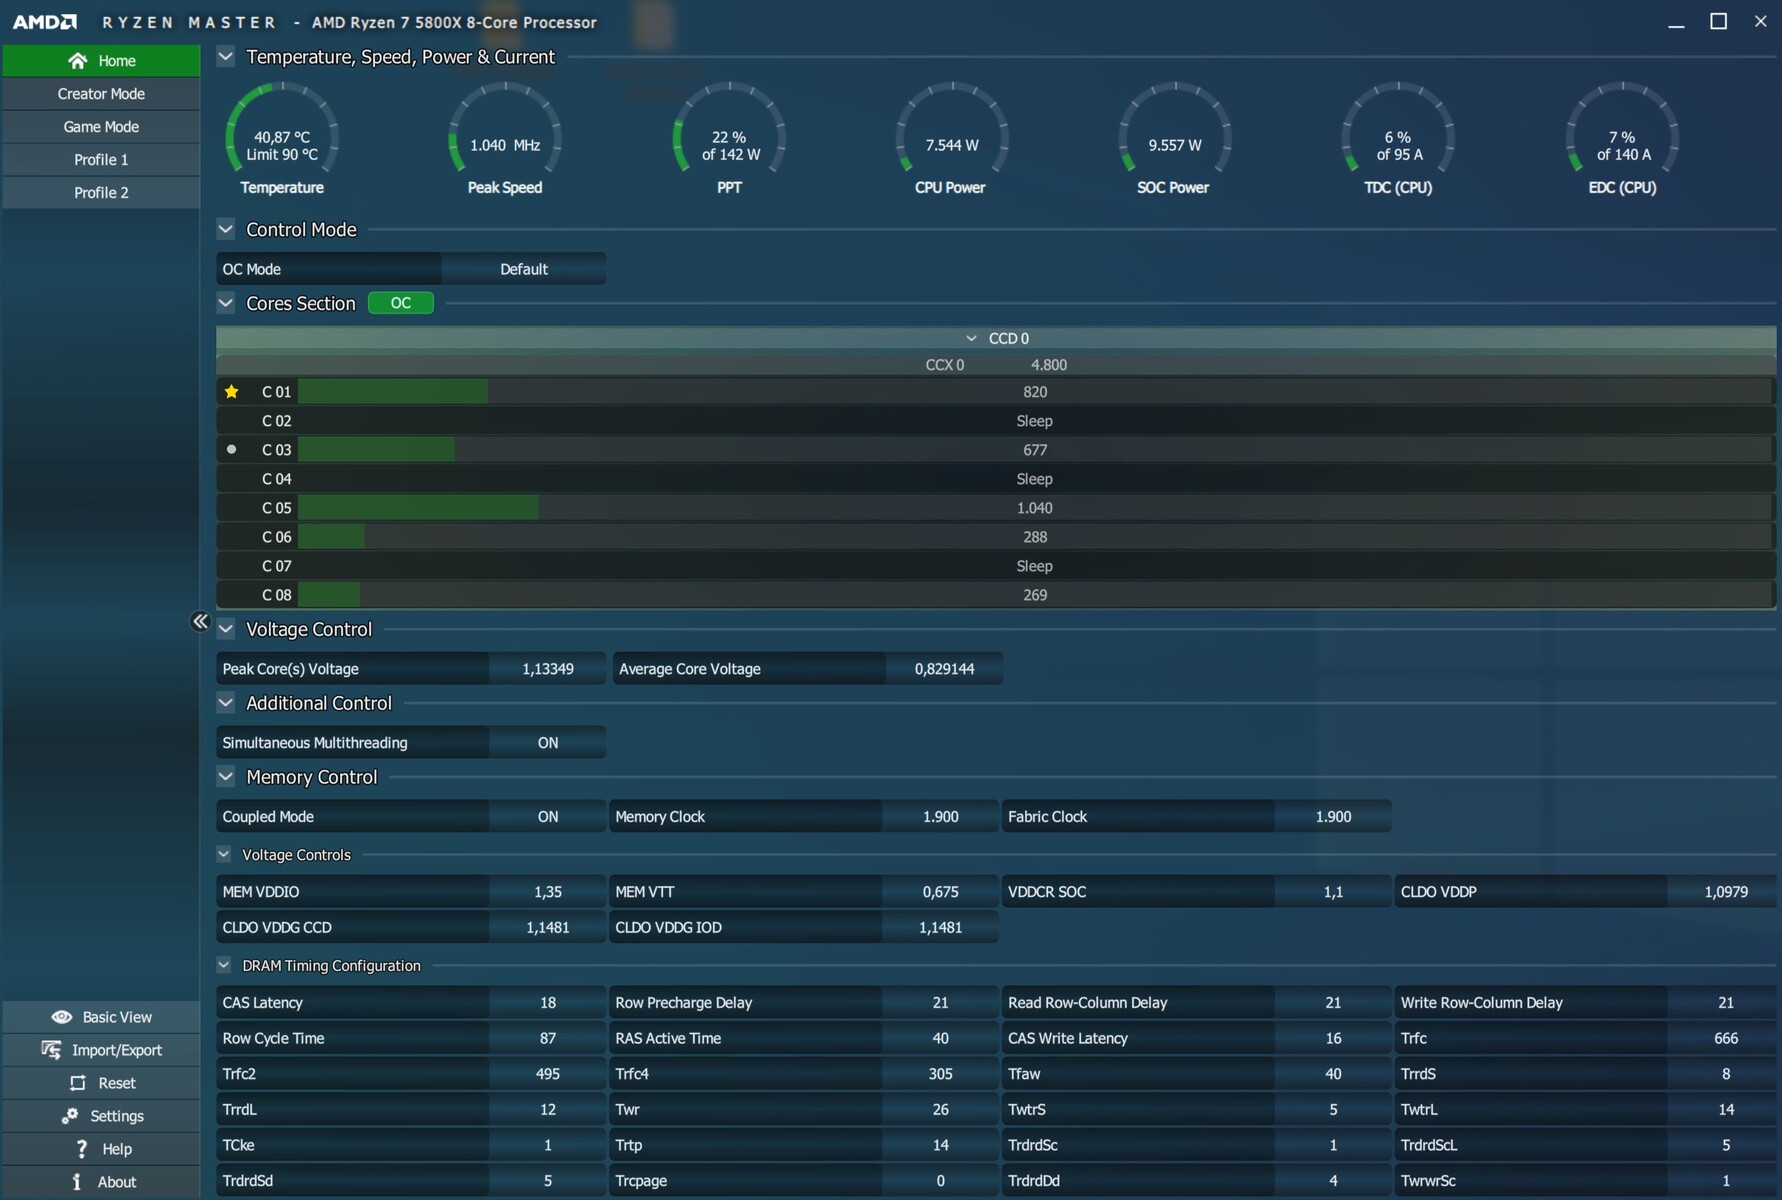
Overclocking - Non lo consigliamo
L'overclocking è un modo per guadagnare quel po' di prestazioni in più dai propri componenti. Tuttavia, richiede un raffreddamento della CPU molto potente, altrimenti non si ottiene nulla.
Come abbiamo già stabilito in passato, i processori Ryzen non sono particolarmente adatti all'overclocking, e questo vale anche per l'ultima generazione Zen 3. Considerando l'aumento del voltaggio della CPU e le temperature più elevate che ne derivano, non considereremmo un utile compromesso un aumento delle prestazioni del 5%. Soprattutto considerando che in realtà si perdono le prestazioni del single-core a causa del fatto che il PBO è disabilitato quando l'overclocking viene eseguito manualmente.
Pro
Contro
Valutazione complessiva - AMD ha realizzato la CPU gaming più veloce
La famiglia Ryzen 5000 di AMD è il prosieguo della storia di successo dell'AMD Ryzen, e per la prima volta un processore Ryzen è la migliore CPU gaming e batte il precedente dominatore, il Core i9-10900K. E non abbiamo ancora preso in considerazione il nuovo modello di punta di fascia alta, il Ryzen 9 5950X, e ci siamo basati sul modello AMD Ryzen 9 5900X e sul modello AMD Ryzen 7 5800X. Ci aspettiamo che il 5950X alzi ulteriormente l'asticella per diventare la CPU gaming più veloce, si spera in non più di qualche giorno.
Fino ad allora possiamo concludere che i miglioramenti dello Zen 3 di AMD hanno funzionato benissimo. Non solo AMD è riuscita ad inserire ancora più cores su un singolo stampo, ma ha anche ridisegnato completamente il CCX per migliorare l'IPC. E non sorprende che sia proprio qui che i nuovi processori della serie Ryzen 5000 brillano e riescono a surclassare l'attuale CPU di punta di Intel in molti benchmarks di CPU single-core. Inoltre, questo miglioramento delle prestazioni single-core è direttamente correlato anche con l'aumento delle prestazioni multi-core, che sono migliorate in modo significativo rispetto alla generazione Zen 2 della serie 3000.
Il prezzo dell'AMD di 549 dollari è leggermente superiore al prezzo richiesto da Intel per il Core i9-10900K. Il meno potente Ryzen 7 5800X costa 100 dollari in meno, e per 449 dollari è a un livello di prezzo simile a quello del concorrente di Intel, offrendo allo stesso tempo prestazioni più elevate. Un altro vantaggio è il TDP più basso, che può accontentarsi di un sistema di raffreddamento più piccolo rispetto a quello del Core i9-10900K. Inoltre, il PCI Express 4.0 è attualmente disponibile solo sulla piattaforma AMDs. Si prevede che le piattaforme Intel otterranno il supporto PCIe 4.0 con Rocket Lake nel prossimo futuro.
AMD batte Intel e realizza la CPU gaming più veloce attualmente disponibile. La forza di Intel, nelle prestazioni single-core, è stata fatta a pezzi.
I clienti ora hanno una indicazione di scelta e possono decidere tra una CPU 8-cores veloce e una CPU 12-cores ancora più veloce. Entrambi i modelli si sono comportati eccezionalmente bene nei nostri test. Tuttavia, se il vostro interesse principale è il gaming, allora dovreste tenere presente che il Ryzen 7 5800X offre prestazioni praticamente identiche a quelle del Ryzen 9 5900X. I creatori di contenuti e gli streamer che non vogliono gestire un PC dedicato allo streaming beneficeranno molto probabilmente del Ryzen 9 5900X o forse anche del Ryzen 9 5950X.
