|
|
AMD Ryzen 9 3900X
Titan RTX, R9 3900X, Corsair MP600 (Idle: 87.4 W) | |
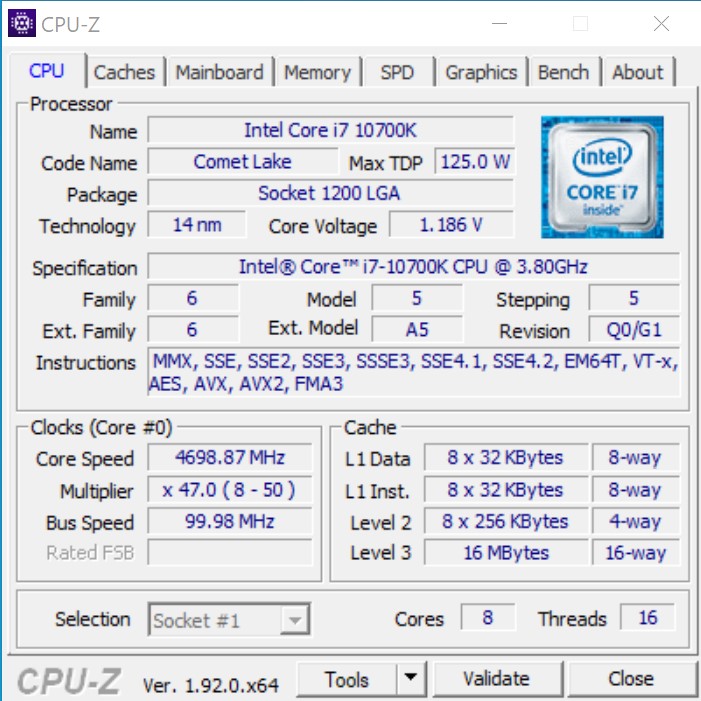
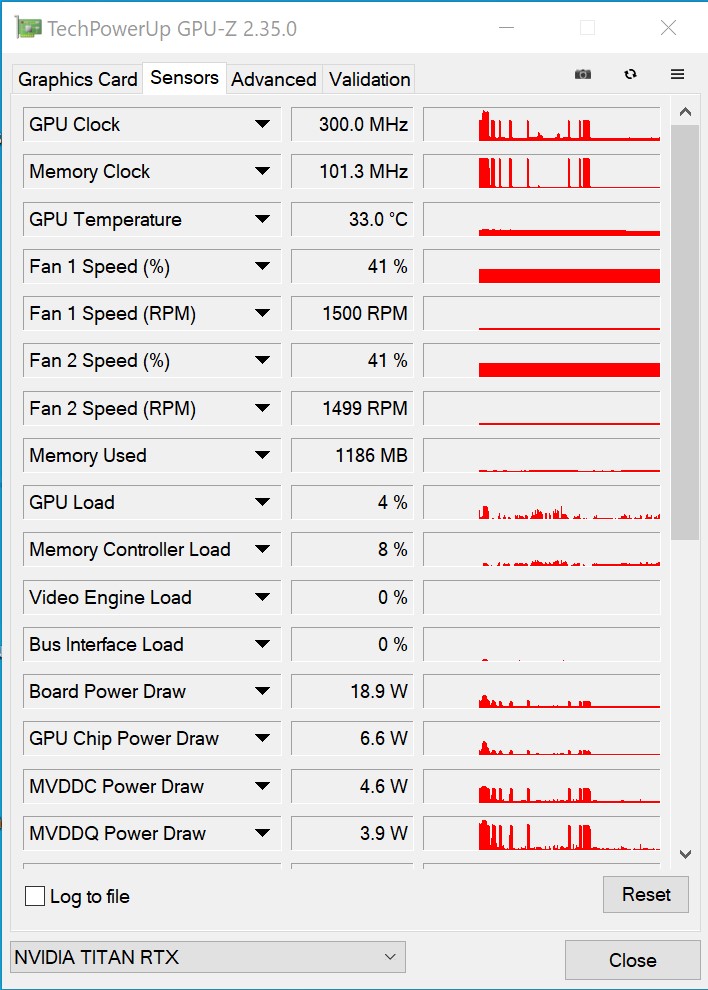
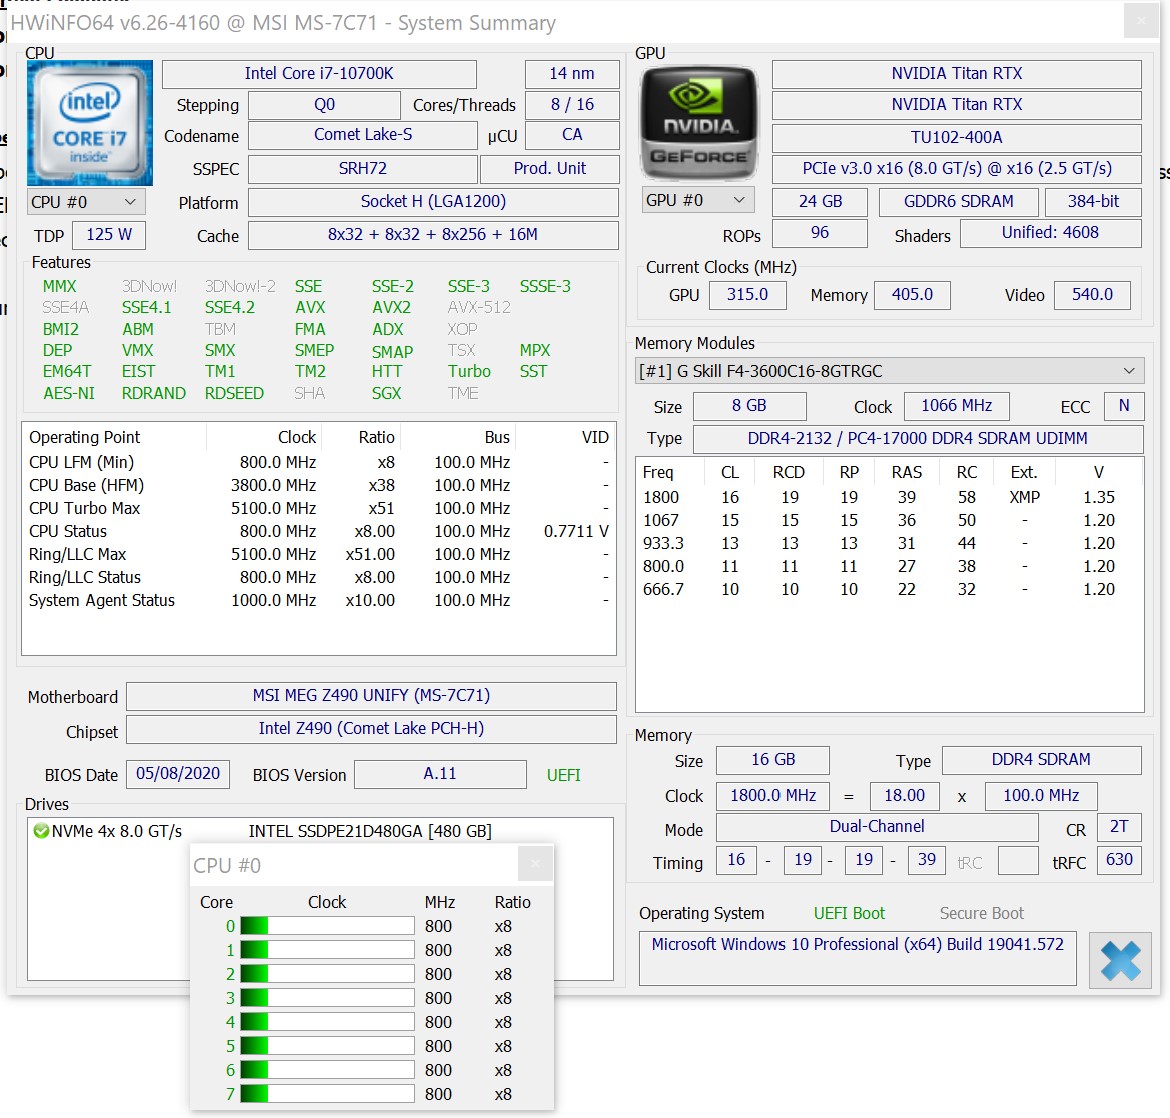
Intel Core i7-10700K
Titan RTX, i7-10700K, Intel Optane 905P 480GB 2.5 (Idle: 67.7 W) |
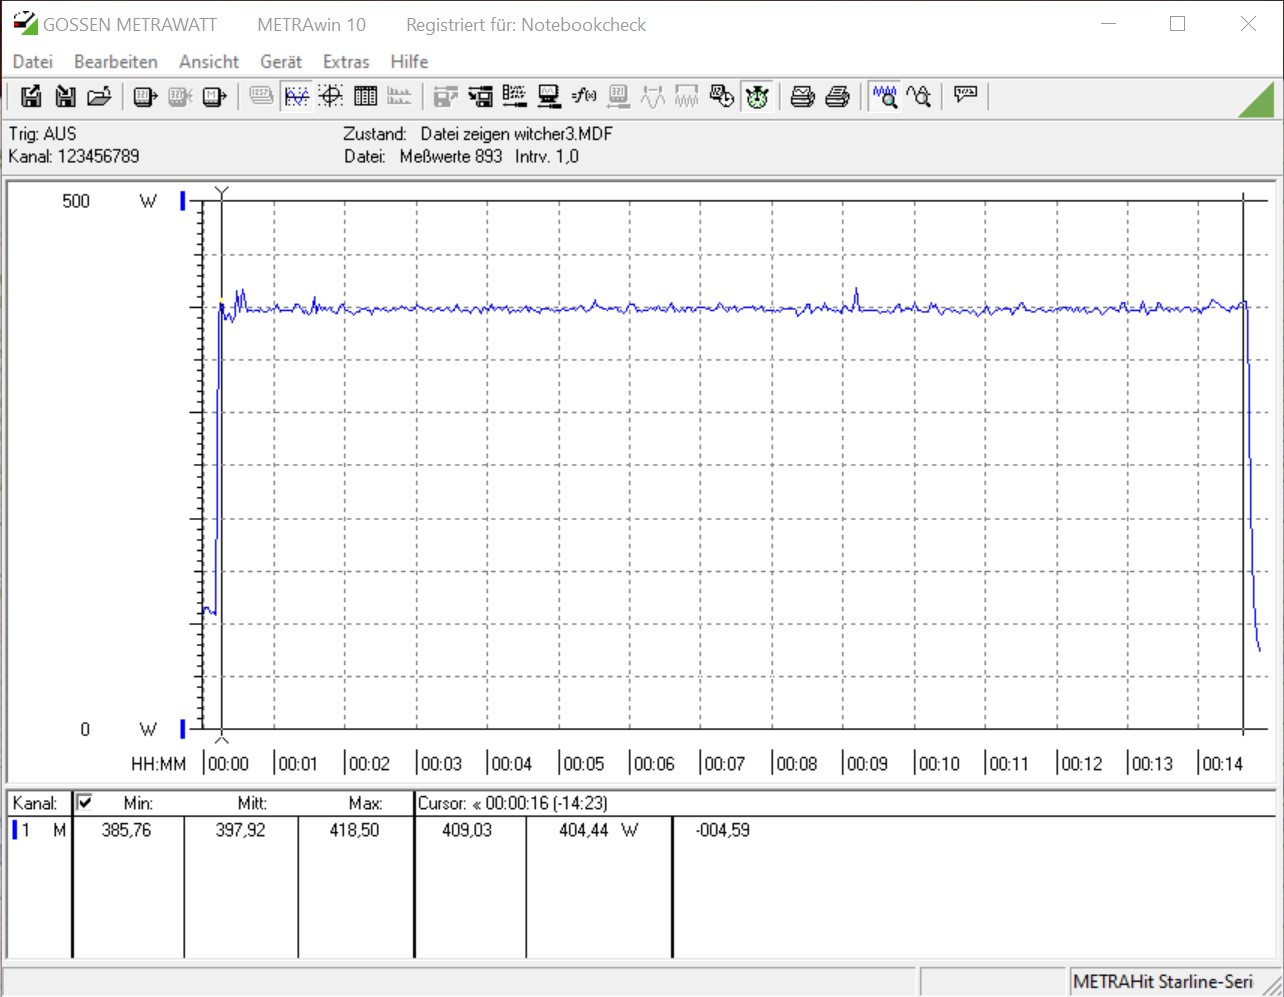
397.9 (386min - 409max) Watt * |
AMD Ryzen 3 3300X
Titan RTX, R3 3300X, Intel Optane 905P 480GB 2.5 (Idle: 88.8 W) |
397.6 (356min - 412max) Watt * -0% |
Intel Core i9-10900K
Titan RTX, i9-10900K, WDC PC SN720 SDAQNTW-512G (Idle: 52.3 W) |
396.2 (380min - 475max) Watt * -0% |
Intel Core i5-10600K
Titan RTX, i5-10600K (Idle: 52.2 W) |
386.9 (380min - 404max) Watt * +3% |
AMD Radeon RX Vega 64
RX Vega 64, R7 3700X, Corsair MP600 (Idle: 79.2 W) |
378 (316min - 411max) Watt * +5% |
Intel Core i9-9900K, AMD Radeon RX Vega 64
RX Vega 64, i9-9900K (80 fps) | |
Intel Core i7-9700K, AMD Radeon RX Vega 64
RX Vega 64, i7-9700K |
365.3 (316min - 388max) Watt * +8% |
Intel Core i5-9600K, AMD Radeon RX Vega 64
RX Vega 64, i5-9600K |
363.7 (403min) Watt * +9% |
|
Intel Core i9-10900K
Titan RTX, i9-10900K, WDC PC SN720 SDAQNTW-512G (Idle: 52.3 W) |
275.7 (254min - 385max) Watt * -34% |
Intel Core i7-9700K, AMD Radeon RX Vega 64
RX Vega 64, i7-9700K |
222.4 (193min - 249max) Watt * -8% |
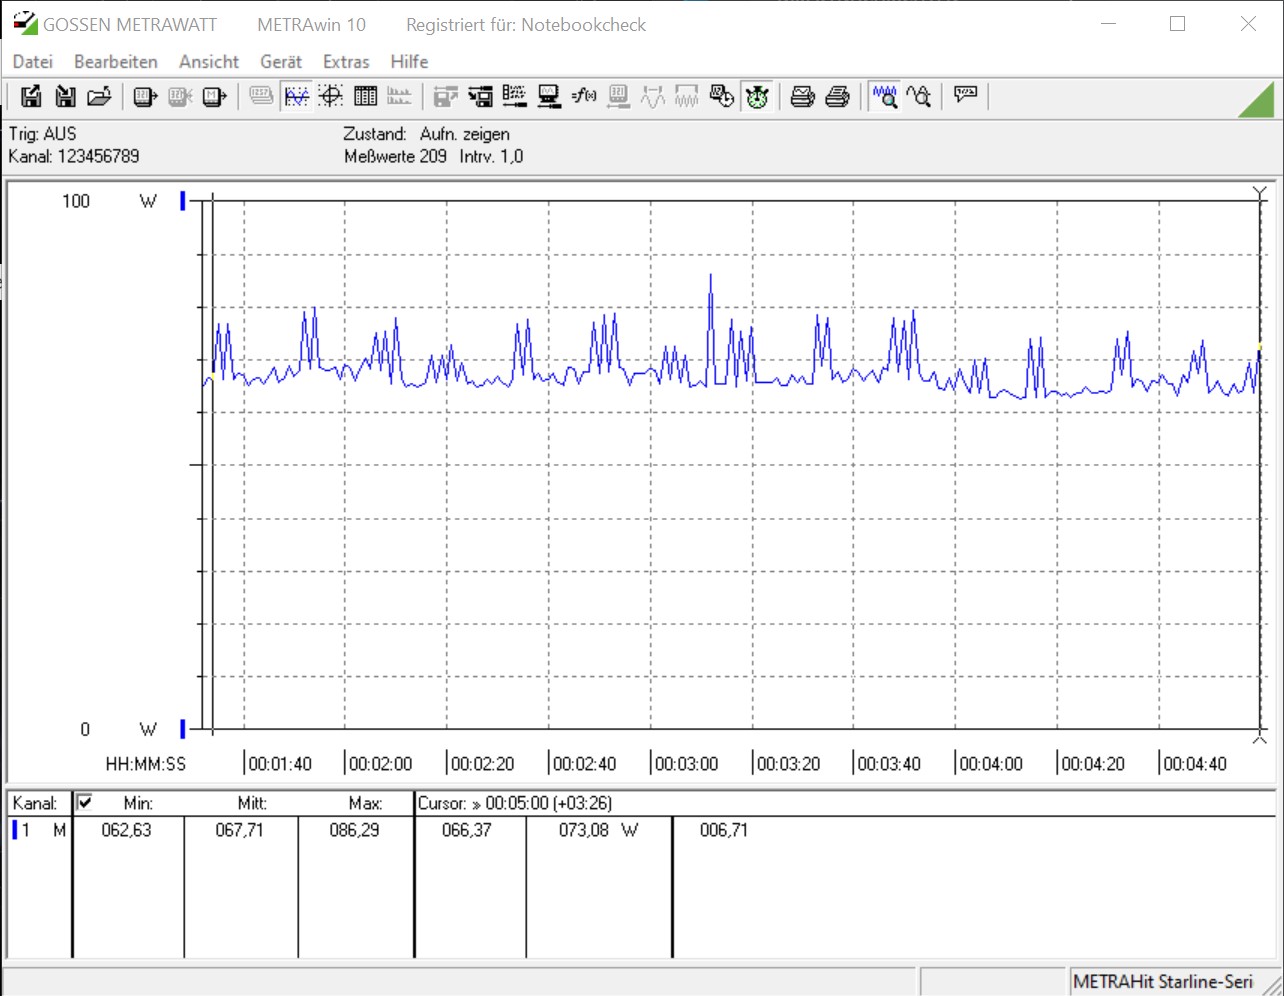
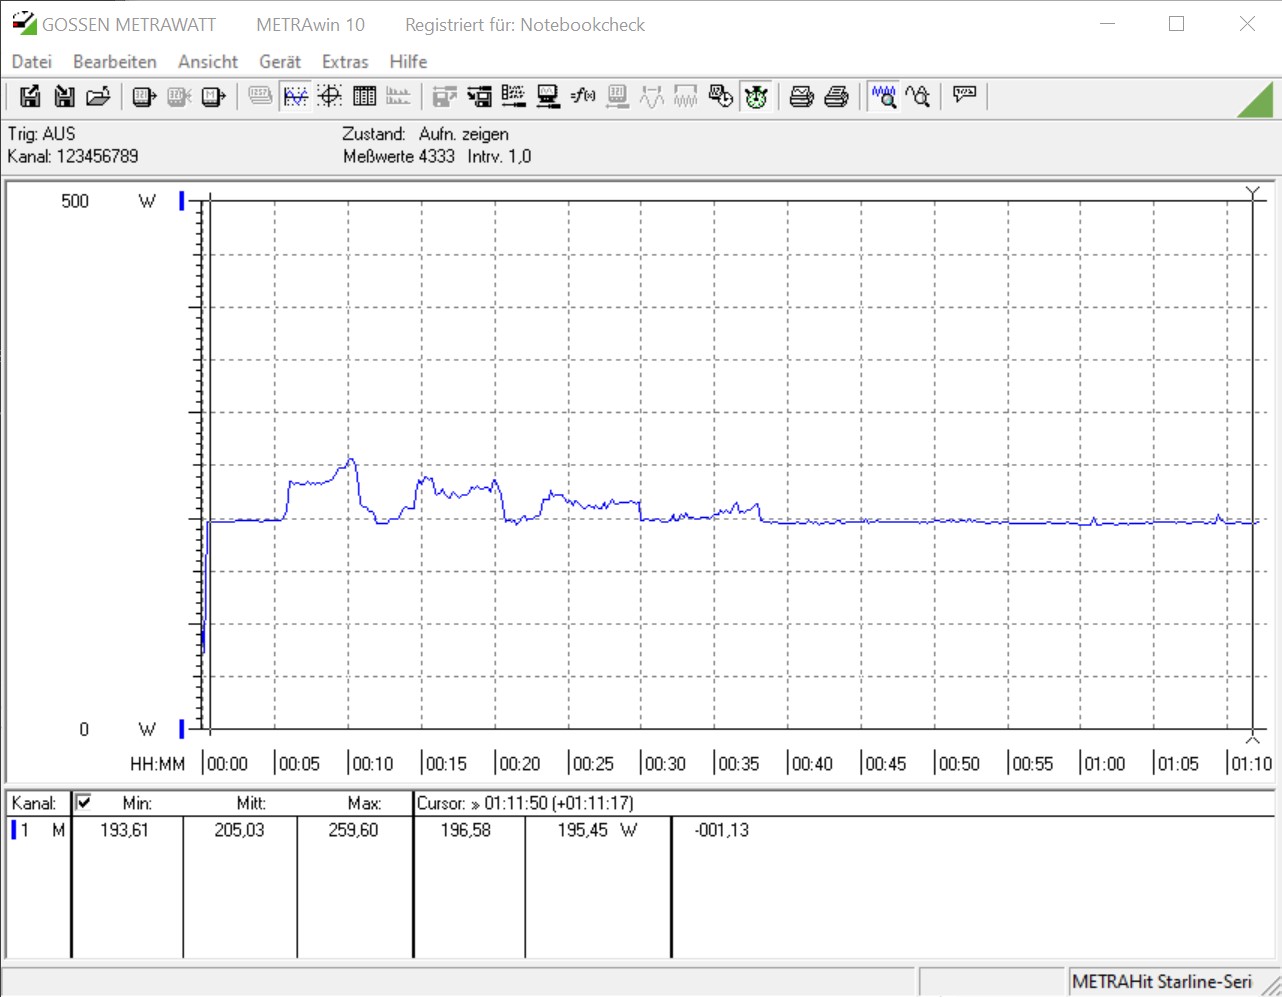
Intel Core i7-10700K
Titan RTX, i7-10700K, Intel Optane 905P 480GB 2.5 (Idle: 67.7 W) |
205 (194min - 260max) Watt * |
Intel Core i5-10600K
Titan RTX, i5-10600K (Idle: 52.2 W) |
204.4 (191min - 261max) Watt * -0% |
Intel Core i9-9900K, AMD Radeon RX Vega 64
RX Vega 64, i9-9900K | |
AMD Ryzen 9 3900X
Titan RTX, R9 3900X, Corsair MP600 (Idle: 87.4 W) | |
AMD Radeon RX Vega 64
RX Vega 64, R7 3700X, Corsair MP600 (Idle: 79.2 W) |
170.3 (161min - 187max) Watt * +17% |
Intel Core i5-9600K, AMD Radeon RX Vega 64
RX Vega 64, i5-9600K |
145.9 (143min - 155max) Watt * +29% |
AMD Ryzen 3 3300X
Titan RTX, R3 3300X, Intel Optane 905P 480GB 2.5 (Idle: 88.8 W) |
144.7 (139min - 195max) Watt * +29% |
|
Intel Core i9-10900K
Titan RTX, i9-10900K, WDC PC SN720 SDAQNTW-512G (Idle: 52.3 W) |
268.5 (265min - 270max) Watt * -29% |
AMD Ryzen 9 3900X
Titan RTX, R9 3900X, Corsair MP600 (Idle: 87.4 W) | |
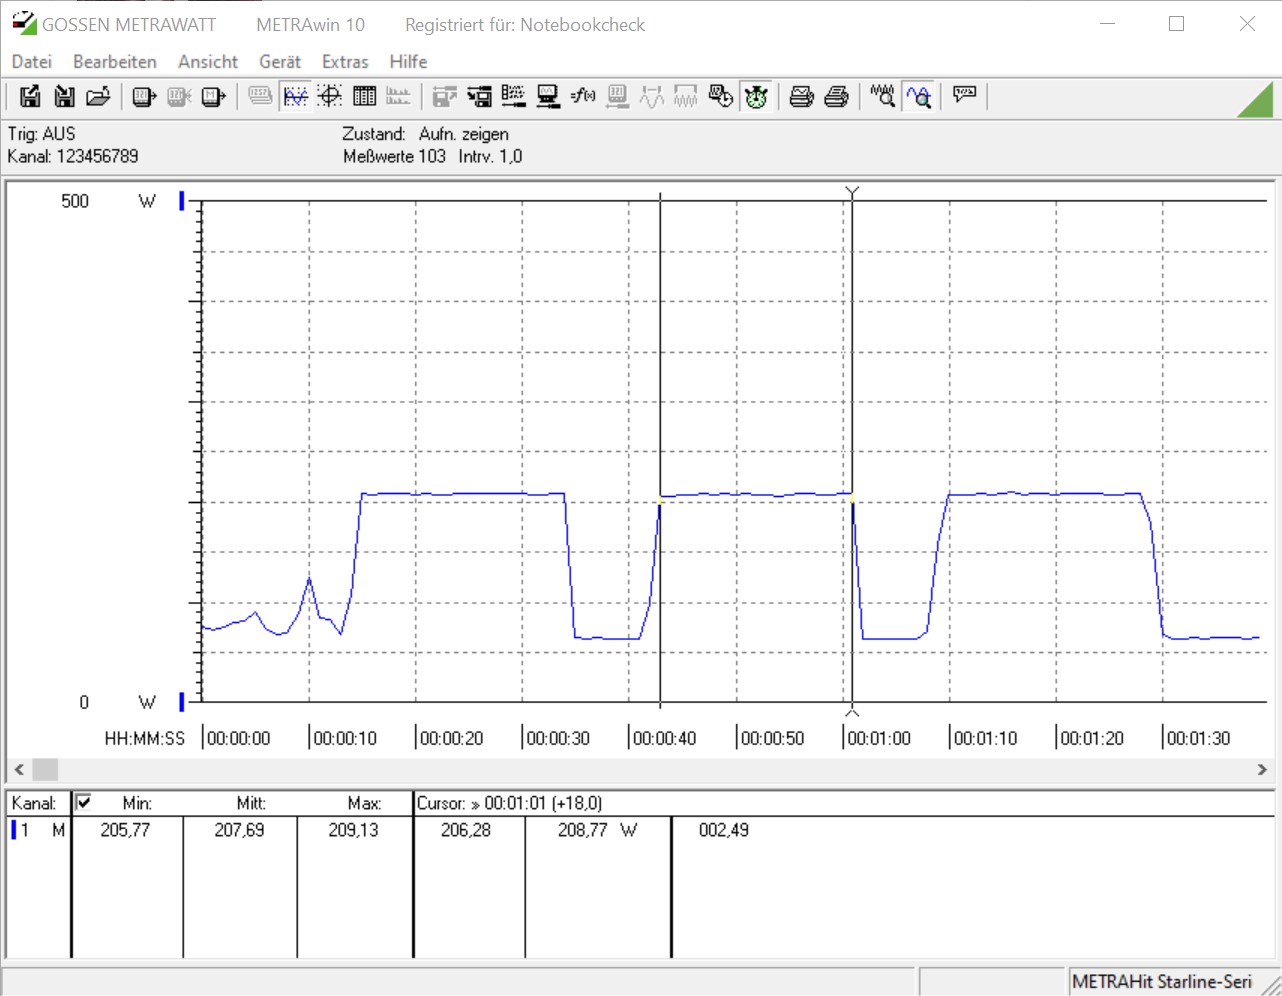
Intel Core i7-10700K
Titan RTX, i7-10700K, Intel Optane 905P 480GB 2.5 (Idle: 67.7 W) |
207.7 (206min - 209max) Watt * |
Intel Core i9-9900K, AMD Radeon RX Vega 64
RX Vega 64, i9-9900K |
203.2 (197min - 205max) Watt * +2% |
Intel Core i7-9700K, AMD Radeon RX Vega 64
RX Vega 64, i7-9700K |
202.6 (190min - 207max) Watt * +2% |
Intel Core i5-10600K
Titan RTX, i5-10600K (Idle: 52.2 W) |
172.5 (170min - 176max) Watt * +17% |
AMD Radeon RX Vega 64
RX Vega 64, R7 3700X, Corsair MP600 (Idle: 79.2 W) |
171.6 (171min - 173max) Watt * +17% |
AMD Ryzen 3 3300X
Titan RTX, R3 3300X, Intel Optane 905P 480GB 2.5 (Idle: 88.8 W) |
137.3 (136min - 139max) Watt * +34% |
Intel Core i5-9600K, AMD Radeon RX Vega 64
RX Vega 64, i5-9600K |
134 (132min - 135max) Watt * +35% |
* ... Meglio usare valori piccoli