Notebookcheck Logo

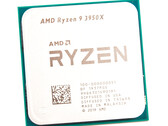
AMD Ryzen 9 3950X

AMD R9 3950X

AMD Ryzen 9 3950X è un processore desktop di fascia alta con 16 core basati sull'architettura Zen 2. Al lancio nel novembre 2019 è la CPU più veloce della serie Matisse. Il 3950X clock da 3,5 GHz (base) fino a 4,7 GHz (Turbo per un singolo core). Tutti i sedici core possono raggiungere fino a 4,1 GHz.

Grazie ai 16 core e ai 32 fili, il 3950X offre eccellenti prestazioni applicative - se il numero di core può essere utilizzato. Grazie al Turbo relativamente alto, le prestazioni del singolo core si trovano anche nella fascia alta. Per i giochi, invece, ci sono CPU più veloci, come il Core i9-10900K.

Il Ryzen 9 3950X è prodotto in 7nm (i quattro CCX-cluster con i core) a TSMC e 12 nm (die I/O) alla Globalfoundries. Il TDP è valutato a 250 Watt e quindi la CPU ha bisogno di un sistema di raffreddamento molto potente.

SerieAMD Matisse (Ryzen 3000 Desktop)
Nome in codiceMatisse (Zen 2)

Serie: Matisse (Ryzen 3000 Desktop) Matisse (Zen 2)

AMD Ryzen 9 3950X « 3.5 - 4.7 GHz16 / 32 cores64 MB L3
AMD Ryzen 9 3900X3.8 - 4.6 GHz12 / 24 cores64 MB L3
AMD Ryzen 9 39003.1 - 4.3 GHz12 / 24 cores64 MB L3
AMD Ryzen 7 3800XT3.9 - 4.7 GHz8 / 16 cores32 MB L3
AMD Ryzen 7 3700X3.6 - 4.4 GHz8 / 16 cores32 MB L3
AMD Ryzen 3 3300X3.8 - 4.3 GHz4 / 8 cores16 MB L3
AMD Ryzen 3 31003.6 - 3.9 GHz4 / 8 cores16 MB L3
Clock Rate3500 - 4700 MHz
Level 1 Cache1 MB
Level 2 Cache8 MB
Level 3 Cache64 MB
Numero di Cores / Threads16 / 32
Consumo energetico (TDP = Thermal Design Power)105 Watt
Tecnologia del produttore7 nm
Dimensione Die2 x 72 mm + 125 mm (IO-Die) mm2
SocketAM4 (1331)
FeaturesMMX(+), SSE, SSE2, SSE3, SSSE3, SSE4.1, SSE4.2, SSE4A, x86-64, AMD-V, AES, AVX, AVX2, FMA3, SHA, Precision Boost 2
64 BitSupporto 64 Bit
Architecturex86
Prezzo base$799 U.S.
Data di annuncio11/14/2019

Benchmark

Performance Rating - CB R15 + R20 + 7-Zip + X265 + Blender + 3DM11 CPU
47.9 pt (70%)
2.55 -95%
...
46.5 -3%
46.5 -3%
46.6 -3%
Intel Core i7-12850HX
47.1 -2%
Intel Core i7-13700H
47.5 -1%
47.6 -1%
47.7 0%
Intel Core i9-13905H
47.8 0%
AMD Ryzen Z1 Extreme
47.8 0%
AMD Ryzen 9 3950X
47.9
47.9 0%
48 0%
48.3 1%
48.4 1%
Intel Core i5-13500HX
48.5 1%
48.5 1%
Intel Core i7-1370P
48.6 1%
AMD Ryzen 5 7645HX
48.8 2%
AMD Ryzen 7 7840HS
49.4 3%
...
AMD Ryzen 9 7950X3D
68.3 43%
0%
100%
Cinebench R20 - Cinebench R20 CPU (Single Core)
520 Points (60%)
Cinebench R20 - Cinebench R20 CPU (Multi Core)
9075 Points (39%)
Cinebench R15 - Cinebench R15 CPU Multi 64 Bit
4002 Points (41%)
31 -99%
...
Intel Core i7-13700HX
3276 -18%
3299 -18%
3325 -17%
Intel Core i7-12800HX
3383 -15%
Intel Core i9-12900HX
3493 -13%
3642 -9%
3712 -7%
3736 -7%
3877 -3%
AMD Ryzen 9 3950X
4002
AMD Ryzen 9 7900
4020 0%
AMD Ryzen 9 7845HX
4320 8%
4324 8%
AMD Ryzen Threadripper 2970WX
4376 9%
Intel Core i7-13700
4398 10%
Intel Core i9-13900HX
4519 13%
Intel Core i7-13700K
4577 14%
Intel Core i9-13950HX
4739 18%
Intel Core i9-13980HX
4763 19%
...
AMD Ryzen Threadripper PRO 3995WX
9706 143%
0%
100%
0200400600800100012001400160018002000220024002600280030003200340036003800Tooltip
Cinebench R15 - Cinebench R15 CPU Single 64 Bit
209 Points (64%)
19 -91%
...
205 -2%
AMD Ryzen 7 PRO 6850H
205.1 -2%
205.5 -2%
AMD Ryzen 9 3900X
206.3 -1%
206.7 -1%
206.7 -1%
207.3 -1%
Apple M1
207.3 -1%
208 0%
AMD Ryzen 9 3950X
209
209.8 0%
210 0%
Intel Core i5-11400F
210 0%
210.3 1%
210.6 1%
210.7 1%
211.8 1%
212.1 1%
213.8 2%
...
AMD Ryzen 9 7950X3D
326 56%
0%
100%
Cinebench R11.5 - Cinebench R11.5 CPU Multi 64 Bit
43.7 Points (62%)
Cinebench R11.5 - Cinebench R11.5 CPU Single 64 Bit
2.4 Points (60%)
Cinebench R10 - Cinebench R10 Rend. Single (32bit)
6102 punti (37%)
Cinebench R10 - Cinebench R10 Rend. Multi (32bit)
53396 punti (39%)
Cinebench R10 - Cinebench R10 Rend. Multi (64bit)
86232 Points (62%)
Cinebench R10 - Cinebench R10 Rend. Single (64bit)
10580 Points (58%)
wPrime 2.10 - wPrime 2.0 1024m *
44.9 s (1%)
wPrime 2.10 - wPrime 2.0 32m *
4.1 s (1%)
WinRAR - WinRAR 4.0
7409 punti (14%)
7-Zip 18.03 - 7-Zip 18.03 Multli Thread 4 runs
99467 MIPS (62%)
7-Zip 18.03 - 7-Zip 18.03 Single Thread 4 runs
5340 MIPS (64%)
X264 HD Benchmark 4.0 - x264 Pass 2
168 fps (61%)
X264 HD Benchmark 4.0 - x264 Pass 1
265 fps (62%)
HWBOT x265 Benchmark v2.2 - HWBOT x265 4k Preset
15.8 fps (34%)
0510152025Tooltip
TrueCrypt - TrueCrypt Serpent
2.3 GB/s (77%)
TrueCrypt - TrueCrypt Twofish
3.6 GB/s (67%)
TrueCrypt - TrueCrypt AES
10.8 GB/s (33%)
Blender - Blender 2.79 BMW27 CPU *
125.8 Seconds (1%)
R Benchmark 2.5 - R Benchmark 2.5 *
0.5 sec (11%)
Super Pi mod 1.5 XS 1M - Super Pi mod 1.5 XS 1M *
9.2 s (2%)
Super Pi mod 1.5 XS 2M - Super Pi mod 1.5 XS 2M *
19.8 s (1%)
Super Pi Mod 1.5 XS 32M - Super Pi mod 1.5 XS 32M *
512 s (2%)
3DMark 11 - 3DM11 Performance Physics
21016 Points (57%)
3DMark - 3DMark Ice Storm Physics
68726 Points (57%)
3DMark - 3DMark Ice Storm Extreme Physics
68471 Points (57%)
3DMark - 3DMark Ice Storm Unlimited Physics
69542 Points (59%)
3DMark - 3DMark Cloud Gate Physics
17927 Points (45%)
3DMark - 3DMark Fire Strike Standard Physics
32004 Points (59%)
3DMark - 3DMark Time Spy CPU
12404 Points (61%)
Geekbench 5.4 - Geekbench 5.1 - 5.4 64 Bit Single-Core
1306 punti (57%)
58 -96%
...
1296 -1%
Intel Core i7-10700
1299 -1%
1300 0%
1300 0%
1303 0%
1303 0%
1304 0%
AMD Ryzen 7 3700X
1304 0%
1305 0%
AMD Ryzen 9 3950X
1306
1312 0%
1322 1%
Apple A13 Bionic
1333 2%
1339 3%
1339 3%
1346 3%
1353 4%
Intel Core i5-1140G7
1353 4%
1363 4%
...
AMD Ryzen 9 7950X3D
2311 77%
0%
100%
Geekbench 5.4 - Geekbench 5.1 - 5.4 64 Bit Multi-Core
12363 punti (43%)
238.5 -98%
...
11914 -4%
11914 -4%
11957 -3%
Intel Core i7-13700H
12010 -3%
Intel Core i5-13400F
12095 -2%
Intel Core i5-13400
12107 -2%
Apple M2 Pro 10-Core
12132 -2%
AMD Ryzen Threadripper 2950X
12160 -2%
Intel Core i7-12850HX
12302 0%
AMD Ryzen 9 3950X
12363
AMD Ryzen 7 7745HX
12378 0%
12461 1%
12499 1%
12656 2%
12797 4%
Intel Core i9-13900H
13483 9%
13575 10%
Intel Core i5-13500HX
13767 11%
AMD Ryzen 7 7700
13929 13%
...
AMD Ryzen Threadripper PRO 3975WX
28798 133%
0%
100%
Geekbench 5.0 - Geekbench 5.0 64 Bit Single-Core
1315 punti (6%)
Geekbench 5.0 - Geekbench 5.0 64 Bit Multi-Core
12976 punti (41%)
Geekbench 4.1 - 4.4 - Geekbench 4.1 - 4.4 64 Bit Single-Core
5749 punti (59%)
Geekbench 4.1 - 4.4 - Geekbench 4.1 - 4.4 64 Bit Multi-Core
48962 punti (55%)
Mozilla Kraken 1.1 - Kraken 1.1 Total Score *
706 ms (1%)
WebXPRT 3 - WebXPRT 3 Score
239 Points (50%)
Power Consumption - Prime95 Power Consumption - external Monitor *
198.8 Watt (34%)
Power Consumption - Cinebench R15 Multi Power Consumption - external Monitor *
219.5 Watt (46%)
Power Consumption - Cinebench R15 Multi Power Efficiency - external Monitor
18.2 Points per Watt (14%)
- Valori di benchmark per questa scheda grafica
- Valori medi di benchmark per questa scheda grafica
* Numeri più piccoli rappresentano prestazioni supeiori

v1.25
log 11. 12:21:32

#0 no ids found in url (should be separated by "_") +0s ... 0s

#1 not redirecting to Ajax server +0s ... 0s

#2 did not recreate cache, as it is less than 5 days old! Created at Mon, 11 Sep 2023 11:09:48 +0200 +0.001s ... 0.001s

#3 no comparison url found in template nbc.compare_page_2 needed +0.006s ... 0.007s

#4 no comparison url found in template nbc.compare_page_2 needed +0s ... 0.007s

#5 no comparison url found in template nbc.compare_page_2 needed +0s ... 0.007s

#6 no comparison url found in template nbc.compare_page_2 needed +0s ... 0.007s

#7 no comparison url found in template nbc.compare_page_2 needed +0s ... 0.008s

#8 no comparison url found in template nbc.compare_page_2 needed +0s ... 0.008s

#9 composed specs +0s ... 0.008s

#10 did output specs +0s ... 0.008s

#11 getting avg benchmarks for device 12204 +0.011s ... 0.019s

#12 got single benchmarks 12204 +0.008s ... 0.026s

#13 got avg benchmarks for devices +0s ... 0.026s

#14 min, max, avg, median took s +0.575s ... 0.601s

#15 no comparison url found in template nbc.compare_page_2 needed +0s ... 0.601s

#16 return log +0s ... 0.601s

Please share our article, every link counts!

» Confronto CPU Mobile
Confronto di tutte le serie di CPU mobile

» Processori Mobile - Elenco Benchmark
Elenco Benchmark di tutte le CPUs conosciute, usate nei portatili (CPUs desktop e portatili)

Altre CPU della serie Matisse (Ryzen 3000 Desktop)

» AMD Ryzen 9 3950X
   16x 3.5 GHz - 4.7 GHz
» AMD Ryzen 9 3900X
   12x 3.8 GHz - 4.6 GHz
» AMD Ryzen 9 3900
   12x 3.1 GHz - 4.3 GHz
» AMD Ryzen 7 3800XT
   8x 3.9 GHz - 4.7 GHz
» AMD Ryzen 7 3700X
   8x 3.6 GHz - 4.4 GHz
» AMD Ryzen 3 3300X
   4x 3.8 GHz - 4.3 GHz
» AMD Ryzen 3 3100
   4x 3.6 GHz - 3.9 GHz

CPUs simili

+ AMD Ryzen 9 5950X
   16x 3.4 GHz - 4.9 GHz
+ Intel Core i5-13600K
   12x 2.6 GHz - 5.1 GHz
+ AMD Ryzen 7 7800X3D
   8x 4.2 GHz - 5 GHz
+ Intel Core i9-12900
   16x 2.4 GHz - 5.1 GHz
+ Intel Core i7-13700
   16x 2.1 GHz - 5.2 GHz
» AMD Ryzen 9 3950X
   16x 3.5 GHz - 4.7 GHz
- AMD Ryzen Threadripper 2970WX
   24x 3 GHz - 4.2 GHz
- Intel Core i7-12700K
   12x 2.7 GHz - 5 GHz
- AMD Ryzen 9 5900X
   12x 3.7 GHz - 4.8 GHz
- Intel Core i9-10980XE
   18x 3 GHz - 4.6 GHz
- Intel Core i9-9980XE
   18x 3 GHz - 4.4 GHz
> Recensioni e prove di notebook, tablets e smartphones > Info Techniche / Tips > Processori per portatili > AMD Matisse (Ryzen 3000 Desktop) R9 3950X Notebook Processor
Klaus Hinum (Update: 2020-11- 4)