Notebookcheck Logo

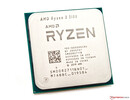
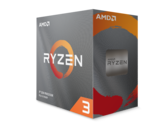
AMD Ryzen 3 3100

AMD R3 3100

Il Ryzen 3 3100 è un processore da tavolo entry level economico della serie Matisse con 4 core e 8 thread. Orologgia da 3,6 (base) a 3,9 GHz (boost) e utilizza la microarchitettura Zen 2. Utilizza due cluster CCX con due core ciascuno. Pertanto, ci sono alcuni svantaggi rispetto al più veloce Ryzen 3 3300X che utilizza tutti e quattro i core di un singolo CCX-cluster. La CPU è prodotta nel moderno processore a 7nm al TSMC. Il die I/O sul pacchetto è separato e prodotto in 12 nm alla Globalfoundries. Il TDP è specificato a 65 Watt e quindi la CPU non ha bisogno di un grosso e robusto refrigeratore.

Nelle applicazioni multi-threaded le prestazioni del Ryzen 3 3100 possono raggiungere il vecchio Core i7-7700K (una ex CPU di fascia alta). Nei giochi e nelle applicazioni single threaded, le prestazioni sono leggermente inferiori in quanto il Ryzen 3 3300X con clock più alto è alla pari con il 7700K. Tuttavia, il 3100 può essere una buona scelta per un sistema di gioco entry level.

SerieAMD Matisse (Ryzen 3000 Desktop)
Nome in codiceMatisse (Zen 2)

Serie: Matisse (Ryzen 3000 Desktop) Matisse (Zen 2)

AMD Ryzen 9 3950X3.5 - 4.7 GHz16 / 32 cores64 MB L3
AMD Ryzen 9 3900X3.8 - 4.6 GHz12 / 24 cores64 MB L3
AMD Ryzen 9 39003.1 - 4.3 GHz12 / 24 cores64 MB L3
AMD Ryzen 7 3800XT3.9 - 4.7 GHz8 / 16 cores32 MB L3
AMD Ryzen 7 3700X3.6 - 4.4 GHz8 / 16 cores32 MB L3
AMD Ryzen 3 3300X3.8 - 4.3 GHz4 / 8 cores16 MB L3
AMD Ryzen 3 3100 « 3.6 - 3.9 GHz4 / 8 cores16 MB L3
Clock Rate3600 - 3900 MHz
Level 1 Cache256 KB
Level 2 Cache2 MB
Level 3 Cache16 MB
Numero di Cores / Threads4 / 8
Consumo energetico (TDP = Thermal Design Power)65 Watt
Tecnologia del produttore7 nm
SocketAM4 (LGA1331)
FeaturesDDR4-3200 RAM, PCIe 4, MMX, SSE, SSE2, SSE3, SSSE3, SSE4A, SSE4.1, SSE4.2, AVX, AVX2, BMI2, ABM, FMA, ADX, SMEP, SMAP, SMT, CPB, AES-NI, RDRAND, RDSEED, SHA, SME
64 BitSupporto 64 Bit
Architecturex86
Prezzo base$99 U.S.
Data di annuncio05/07/2020
Collegamento Prodotto (esterno)www.amd.com

Benchmark

Performance Rating - CB R15 + R20 + 7-Zip + X265 + Blender + 3DM11 CPU
31.4 pt (44%)
2.47 -92%
...
30.5 -3%
30.9 -2%
Intel Core i7-4790K
31 -1%
AMD Ryzen 5 2600X
31 -1%
31.1 -1%
31.2 -1%
31.3 0%
AMD Ryzen 7 1800X
31.3 0%
31.4 0%
AMD Ryzen 3 3100
31.4
31.5 0%
Intel Core i7-1180G7
31.6 1%
31.7 1%
31.8 1%
31.8 1%
31.8 1%
31.9 2%
31.9 2%
32 2%
...
72.1 130%
0%
100%
Cinebench R20 - Cinebench R20 CPU (Single Core)
446 Points (50%)
Cinebench R20 - Cinebench R20 CPU (Multi Core)
2282 Points (6%)
Cinebench R15 - Cinebench R15 CPU Multi 64 Bit
991 Points (6%)
31 -97%
...
929 -6%
940 -5%
Intel Core i5-8400
943 -5%
946 -5%
Intel Core i3-10320
949 -4%
Intel Core i5-8500
950 -4%
957 -3%
984 -1%
Intel Core i5-8600K
990 0%
AMD Ryzen 3 3100
991
unknown
1038 5%
Apple M1
1063 7%
Intel Xeon E-2176M
1067 8%
1071 8%
1076 9%
1089 10%
1091 10%
1094 10%
Intel Xeon E-2186M
1098 11%
...
15842 1499%
0%
100%
050100150200250300350400450500550600650700750800850900950Tooltip
Cinebench R15 - Cinebench R15 CPU Single 64 Bit
178 Points (54%)
19 -89%
...
175.5 -1%
175.6 -1%
AMD Ryzen 7 2700X
175.7 -1%
175.8 -1%
176 -1%
AMD Ryzen Threadripper 2950X
176 -1%
Intel Core i5-1230U
176 -1%
176.5 -1%
Intel Xeon W-2145
177 -1%
AMD Ryzen 3 3100
178
178.4 0%
179 1%
Intel Core i5-1140G7
179 1%
Intel Core i5-7600K
179.5 1%
179.9 1%
180 1%
180.3 1%
180.4 1%
Intel Core i5-8600K
181 2%
...
332 87%
0%
100%
Cinebench R11.5 - Cinebench R11.5 CPU Multi 64 Bit
10.9 Points (14%)
Cinebench R11.5 - Cinebench R11.5 CPU Single 64 Bit
2 Points (50%)
Cinebench R10 - Cinebench R10 Rend. Single (32bit)
5181 punti (31%)
Cinebench R10 - Cinebench R10 Rend. Multi (32bit)
23406 punti (17%)
Cinebench R10 - Cinebench R10 Rend. Multi (64bit)
37584 Points (26%)
Cinebench R10 - Cinebench R10 Rend. Single (64bit)
9057 Points (11%)
wPrime 2.10 - wPrime 2.0 1024m *
177.6 s (2%)
wPrime 2.10 - wPrime 2.0 32m *
6.6 s (1%)
WinRAR - WinRAR 4.0
4848 punti (8%)
7-Zip 18.03 - 7-Zip 18.03 Multli Thread 4 runs
27541 MIPS (16%)
7-Zip 18.03 - 7-Zip 18.03 Single Thread 4 runs
4602 MIPS (55%)
X264 HD Benchmark 4.0 - x264 Pass 2
58.6 fps (20%)
X264 HD Benchmark 4.0 - x264 Pass 1
202.5 fps (47%)
HWBOT x265 Benchmark v2.2 - HWBOT x265 4k Preset
7.6 fps (13%)
01234567891011121314Tooltip
TrueCrypt - TrueCrypt Serpent
0.5 GB/s (0%)
TrueCrypt - TrueCrypt Twofish
0.9 GB/s (16%)
TrueCrypt - TrueCrypt AES
5.4 GB/s (14%)
Blender - Blender 2.79 BMW27 CPU *
486.4 Seconds (3%)
R Benchmark 2.5 - R Benchmark 2.5 *
0.6 sec (13%)
Super Pi mod 1.5 XS 1M - Super Pi mod 1.5 XS 1M *
10.6 s (2%)
Super Pi mod 1.5 XS 2M - Super Pi mod 1.5 XS 2M *
23.3 s (1%)
Super Pi Mod 1.5 XS 32M - Super Pi mod 1.5 XS 32M *
594 s (3%)
3DMark 11 - 3DM11 Performance Physics
10702 Points (29%)
3DMark - 3DMark Ice Storm Physics
67897 Points (55%)
3DMark - 3DMark Ice Storm Extreme Physics
67598 Points (55%)
3DMark - 3DMark Ice Storm Unlimited Physics
68313 Points (58%)
3DMark - 3DMark Cloud Gate Physics
9154 Points (23%)
3DMark - 3DMark Fire Strike Standard Physics
13430 Points (24%)
3DMark - 3DMark Time Spy CPU
4808 Points (20%)
Geekbench 5.5 - Geekbench 5.1 - 5.4 64 Bit Single-Core
1135 punti (48%)
58 -95%
...
Apple A12 Bionic
1118 -1%
1118 -1%
AMD Ryzen 5 2600
1119 -1%
Apple A12X Bionic
1120 -1%
1121 -1%
Apple A12Z Bionic
1122 -1%
Intel Core i5-8400H
1127 -1%
1133 0%
1134 0%
AMD Ryzen 3 3100
1135
1136 0%
1139 0%
1140 0%
1143 1%
1143 1%
AMD Ryzen 5 2600X
1145 1%
Intel Core i5-11400T
1146 1%
1148 1%
1150 1%
...
2331 105%
0%
100%
Geekbench 5.5 - Geekbench 5.1 - 5.4 64 Bit Multi-Core
5005 punti (9%)
238.5 -95%
...
4802 -4%
4820 -4%
Intel Core i3-10320
4846 -3%
AMD Ryzen 3 2200G
4882 -2%
4908 -2%
4937 -1%
4938 -1%
4940 -1%
4945 -1%
AMD Ryzen 3 3100
5005
5020 0%
Intel Core i7-7740X
5107 2%
5151 3%
5205 4%
5207 4%
AMD Ryzen 3 1300X
5210 4%
5227 4%
Intel Xeon E-2186M
5239 5%
5256 5%
...
55811 1015%
0%
100%
Geekbench 5.0 - Geekbench 5.0 64 Bit Single-Core
1138 punti (5%)
Geekbench 5.0 - Geekbench 5.0 64 Bit Multi-Core
5023 punti (16%)
Geekbench 4.4 - Geekbench 4.1 - 4.4 64 Bit Single-Core
5162 punti (52%)
Geekbench 4.4 - Geekbench 4.1 - 4.4 64 Bit Multi-Core
18756 punti (21%)
Mozilla Kraken 1.1 - Kraken 1.1 Total Score *
812 ms (1%)
WebXPRT 3 - WebXPRT 3 Score
209 Points (44%)
Power Consumption - Prime95 Power Consumption - external Monitor *
138.3 Watt (24%)
Power Consumption - Cinebench R15 Multi Power Consumption - external Monitor *
127.1 Watt (23%)
Power Consumption - Cinebench R15 Multi Power Efficiency - external Monitor
7.8 Points per Watt (6%)
- Valori di benchmark per questa scheda grafica
- Valori medi di benchmark per questa scheda grafica
* Numeri più piccoli rappresentano prestazioni supeiori

v1.26
log 25. 08:38:16

#0 no ids found in url (should be separated by "_") +0s ... 0s

#1 not redirecting to Ajax server +0s ... 0s

#2 did not recreate cache, as it is less than 5 days old! Created at Thu, 25 Apr 2024 05:38:32 +0200 +0.001s ... 0.001s

#3 no comparison url found in template nbc.compare_page_2 needed +0.008s ... 0.009s

#4 no comparison url found in template nbc.compare_page_2 needed +0s ... 0.009s

#5 no comparison url found in template nbc.compare_page_2 needed +0s ... 0.009s

#6 no comparison url found in template nbc.compare_page_2 needed +0s ... 0.009s

#7 no comparison url found in template nbc.compare_page_2 needed +0s ... 0.009s

#8 no comparison url found in template nbc.compare_page_2 needed +0s ... 0.01s

#9 composed specs +0s ... 0.01s

#10 did output specs +0s ... 0.01s

#11 getting avg benchmarks for device 12168 +0.019s ... 0.029s

#12 got single benchmarks 12168 +0.01s ... 0.039s

#13 got avg benchmarks for devices +0s ... 0.039s

#14 min, max, avg, median took s +0.965s ... 1.004s

#15 no comparison url found in template nbc.compare_page_2 needed +0s ... 1.004s

#16 return log +0s ... 1.004s

Please share our article, every link counts!

» Confronto CPU Mobile
Confronto di tutte le serie di CPU mobile

» Processori Mobile - Elenco Benchmark
Elenco Benchmark di tutte le CPUs conosciute, usate nei portatili (CPUs desktop e portatili)

Altre CPU della serie Matisse (Ryzen 3000 Desktop)

» AMD Ryzen 9 3950X
   16x 3.5 GHz - 4.7 GHz
» AMD Ryzen 9 3900X
   12x 3.8 GHz - 4.6 GHz
» AMD Ryzen 9 3900
   12x 3.1 GHz - 4.3 GHz
» AMD Ryzen 7 3800XT
   8x 3.9 GHz - 4.7 GHz
» AMD Ryzen 7 3700X
   8x 3.6 GHz - 4.4 GHz
» AMD Ryzen 3 3300X
   4x 3.8 GHz - 4.3 GHz
» AMD Ryzen 3 3100
   4x 3.6 GHz - 3.9 GHz

CPUs simili

+ Intel Core i7-5775C
   4x 3.3 GHz - 3.7 GHz
+ Intel Core i7-4770K
   4x 3.5 GHz - 3.9 GHz
+ Intel Core i7-4790S
   4x 3.2 GHz - 4 GHz
+ AMD Ryzen 5 1500X
   4x 3.5 GHz - 3.7 GHz
+ Intel Core i5-9400F
   6x 2.9 GHz - 4.1 GHz
» AMD Ryzen 3 3100
   4x 3.6 GHz - 3.9 GHz
- Intel Core i3-10100
   4x 3.6 GHz - 4.3 GHz
- Intel Core i3-10100F
   4x 3.6 GHz - 4.3 GHz
- Intel Core i3-9100F
   4x 3.6 GHz - 4.2 GHz
- Intel Core i7-990X EE
   6x 3.47 GHz - 3.73 GHz
- Intel Core i7-980X EE
   6x 3.33 GHz - 3.6 GHz
> Recensioni e prove di notebook, tablets e smartphones > Info Techniche / Tips > Processori per portatili > AMD Matisse (Ryzen 3000 Desktop) R3 3100 Notebook Processor
Klaus Hinum (Update: 2020-06-29)