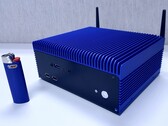
Intel Core i9-9900T
L'Intel Core i9-9900T è un processore desktop ad alta efficienza energetica basato sull'architettura di Coffee Lake. Rispetto all'analogo modello di punta denominato Core i9-9900K, il 9900T offre velocità di clock inferiori (2,1 - 4,4 GHz contro 3,6 - 5 GHz) e un TDP ridotto di 35 contro 95 Watt. Offre ancora tutti gli 8 cores e 16 threads ed è destinato a piccoli chassis o laptop.
Le prestazioni sono chiaramente inferiori a quelle del Core i9-9900K e di più nel range delle vecchie CPU a 6 cores Coffee Lake.
La scheda grafica integrata Intel UHD Graphics 630 ha un clock fino a 1,2 GHz e non offre alcun vantaggio rispetto alle generazioni precedenti. Essendo una GPU di fascia molto bassa, solo alcuni giochi poco impegnativi come Hearthstone possono essere riprodotti con essa (vedi la pagina GPU per i benchmarks).
Serie Intel Coffee Lake Nome in codice Coffee Lake-R Serie: Coffee Lake Coffee Lake-R Clock Rate 2100 - 4400 MHz Level 1 Cache 512 KB Level 2 Cache 2 MB Level 3 Cache 16 MB Numero di Cores / Threads 8 / 16 Consumo energetico (TDP = Thermal Design Power) 35 Watt Tecnologia del produttore 14++ nm Dimensione Die 178 mm2 Temperatura massima 100 °C Socket FCLGA1151 Features Dual-Channel DDR4-2666 Memory Controller, HyperThreading, AVX, AVX2, AES-NI, TSX-NI, Quick Sync, Virtualization, vPro GPU Intel UHD Graphics 630 (350 - 1200 MHz)64 Bit Supporto 64 Bit Architecture x86 Prezzo base $439 U.S. Data di annuncio 10/08/2018 Collegamento Prodotto (esterno) Intel Coffee Lake i9-9900T
Benchmark Performance Rating - CB R15 + R20 + 7-Zip + X265 + Blender + 3DM11 CPU
36.9 pt (41%)
...
AMD Ryzen 5 1600 -4%
Intel Core i5-1038NG7 -3%
Intel Core i7-1180G7 -2%
AMD Ryzen 5 2600 1%
Intel Core i7-4790K 1%
...
Cinebench R20 - Cinebench R20 CPU (Single Core)
440 Points (51%)
...
Intel Core i5-1038NG7 0%
Intel Core i5-1140G7 0%
Intel Core i7-1065G7 0%
Intel Core i7-9750H 1%
AMD Ryzen Threadripper 2950X 1%
Apple M2 Pro 1%
...
Cinebench R20 - Cinebench R20 CPU (Multi Core)
2626 Points (11%)
...
Intel Core i7-7740X -9%
Intel Core i7-9750H -2%
AMD Ryzen 5 1600 -2%
AMD Ryzen 5 2600X 2%
...
AMD Ryzen Threadripper PRO 3995WX 798%
Cinebench R15 - Cinebench R15 CPU Multi 64 Bit
1112 Points (11%)
...
Apple M1 -4%
Intel Xeon E-2176M -4%
Intel Xeon E-2186M -1%
Intel Core i7-1260U 0%
AMD Ryzen 5 1600 3%
Intel Core i7-3960X 4%
Intel Core i7-9750H 6%
Intel Core i7-8700 7%
...
AMD Ryzen Threadripper PRO 3995WX 773%
0 60 120 180 240 300 360 420 480 540 600 660 720 780 840 900 960 1020 1080 Tooltip Impact Display Solutions IMP-3654-B1-R Core i9-9900T: Ø939 (350.72-1113.77)
Cinebench R15 - Cinebench R15 CPU Single 64 Bit
185 Points (56%)
...
Intel Core i5-8600K -2%
Intel Xeon E-2176M -2%
Intel Core i7-9750H -1%
Intel Core i7-1180G7 2%
Intel Core i7-8559U 2%
Intel Core i3-10320 2%
...
Cinebench R11.5 - Cinebench R11.5 CPU Multi 64 Bit
12.4 Points (17%)
...
Intel Xeon E-2176M -8%
Intel Xeon E5-2680 -3%
AMD Ryzen 5 1600 3%
Intel Core i7-9750H 5%
Intel Core i7-8700 5%
...
Cinebench R11.5 - Cinebench R11.5 CPU Single 64 Bit
2.1 Points (7%)
...
Intel Core i5-1038NG7 -3%
Intel Core i5-1035G4 -2%
Intel Xeon E-2176M -2%
Intel Core i5-8600K -1%
Intel Core i7-9750H 0%
Intel Core i3-10320 0%
AMD Ryzen Threadripper PRO 3995WX 1%
Intel Core i7-1065G7 1%
...
Cinebench R10 - Cinebench R10 Rend. Single (32bit)
6758 punti (55%)
...
Intel Core i7-4790K -3%
Intel Core i5-1038NG7 0%
Intel Core i5-7600K 1%
Intel Core i7-7700T 1%
Intel Core i5-1035G4 1%
Intel Core i5-1035G1 2%
...
Cinebench R10 - Cinebench R10 Rend. Multi (32bit)
31357 punti (35%)
...
AMD Ryzen 7 1700 -7%
Intel Core i7-7740X -6%
AMD Ryzen 5 2600X -4%
Intel Core i5-8400 -2%
Intel Xeon E5-2680 v4 -1%
AMD Ryzen 7 2700 0%
AMD Ryzen 7 1700X 2%
...
wPrime 2.10 - wPrime 2.0 1024m *
162.1 s (2%)
AMD Ryzen Threadripper PRO 3975WX -85%
...
AMD Ryzen 5 2600 -13%
Intel Core i7-3960X -6%
Intel Core i7-9750H -5%
Intel Core i7-980X EE -4%
Intel Xeon E-2176M 1%
Intel Core i7-7740X 3%
...
VIA C3-M C3-M-1200 5119%
wPrime 2.10 - wPrime 2.0 32m *
5.9 s (1%)
...
Intel Xeon E-2176M -9%
Intel Core i5-1245U -7%
Intel Core i7-7740X -7%
AMD Ryzen 5 2600 -6%
Intel Core i5-8600K -3%
Intel Core i7-4790K 1%
AMD Ryzen 7 1700 2%
AMD Ryzen Threadripper PRO 3995WX 4%
Intel Core i5-8400 6%
...
6109 punti (35%)
...
Intel Core i9-7900X -3%
Intel Core i7-1265U -2%
AMD Ryzen 9 PRO 6950HS -2%
Intel Core i5-1245U 1%
Intel Core i7-8700 2%
...
7-Zip 18.03 - 7-Zip 18.03 Multli Thread 4 runs
35084 MIPS (22%)
...
Apple M1 -1%
Intel Core i7-7740X 0%
Intel Core i5-1245U 2%
Intel Core i7-8086K 3%
...
7-Zip 18.03 - 7-Zip 18.03 Single Thread 4 runs
4894 MIPS (59%)
...
Intel Core i7-1260U -3%
Intel Core i7-1250U -2%
Intel Core i7-9750H -1%
Intel Core i3-10320 0%
Intel Core i3-1215U 1%
Intel Core i7-4790K 2%
AMD Ryzen Threadripper PRO 3995WX 3%
...
X264 HD Benchmark 4.0 - x264 Pass 2
70.3 fps (26%)
Intel Pentium 4 2.4 GHz -97%
...
Intel Xeon E-2176M -10%
Intel Core i5-8600K -10%
AMD Ryzen 5 1600 -1%
Intel Core i7-9750H 0%
AMD Ryzen 7 1700 6%
AMD Ryzen 5 2600 7%
Intel Core i7-8700 8%
...
X264 HD Benchmark 4.0 - x264 Pass 1
173.4 fps (41%)
...
Intel Core i7-4790 -1%
AMD Ryzen 5 2400G -1%
Intel Core i7-3960X 0%
Intel Core i7-7700T 0%
Intel Core i5-6500 1%
AMD Ryzen 5 1500X 2%
AMD Ryzen 7 1800X 3%
AMD Ryzen 5 1600 4%
Intel Core i7-5775C 4%
...
HWBOT x265 Benchmark v2.2 - HWBOT x265 4k Preset
5.5 fps (12%)
...
AMD Ryzen 5 1500X -7%
Intel Core i5-11400T -5%
Intel Core i3-1215U -3%
Intel Core i7-8559U 4%
Intel Core i5-1038NG7 9%
...
AMD Ryzen Threadripper PRO 3995WX 747%
0 1 2 3 4 5 6 7 8 9 10 11 12 13 14 15 Tooltip Impact Display Solutions IMP-3654-B1-R Core i9-9900T: Ø8.41 (0.88-15.1)
TrueCrypt - TrueCrypt Serpent
0.5 GB/s (0%)
...
AMD Ryzen 5 2400G -7%
Intel Core i5-8500 -3%
Intel Core i3-10320 -2%
Intel Core i5-8600K -1%
Intel Core i7-7740X 2%
...
AMD Ryzen Threadripper PRO 3995WX 439%
TrueCrypt - TrueCrypt Twofish
0.8 GB/s (0%)
...
Intel Core i7-4790K -3%
AMD Ryzen 5 2400G -2%
Intel Core i7-8559U -2%
Intel Core i5-8400 0%
Intel Core i7-3960X 3%
Intel Core i5-8500 6%
Intel Core i5-8600K 8%
...
TrueCrypt - TrueCrypt AES
4.6 GB/s (0%)
...
Intel Core i7-7700T -4%
Intel Xeon E3-1280 v5 -2%
Intel Core i5-1035G7 2%
Intel Core i5-1035G4 2%
AMD Ryzen 5 1500X 7%
...
Blender - Blender 2.79 BMW27 CPU *
422 Seconds (3%)
Intel Core i5-1038NG7 -99%
...
AMD Ryzen 5 1600 -4%
Intel Core i7-1260U 2%
Intel Core i7-9750H 3%
...
R Benchmark 2.5 - R Benchmark 2.5 *
1.9 sec (41%)
...
Qualcomm Snapdragon 850 25%
...
3DMark 06 - CPU - 3DMark 06 - CPU
10259 Points (22%)
...
Intel Core i7-7740X 0%
Intel Core i7-8700 3%
AMD Ryzen 7 2700X 4%
Intel Core i7-6950X 4%
Intel Core i7-9750H 5%
AMD Ryzen Threadripper 2920X 7%
...
Super Pi mod 1.5 XS 1M - Super Pi mod 1.5 XS 1M *
8.8 s (2%)
AMD Ryzen 7 PRO 6850H -89%
...
Intel Xeon E-2176M -2%
Intel Core i5-8600K 0%
Intel Core i5-7600K 0%
Intel Core i5-7500 3%
Intel Xeon E3-1280 v5 3%
Intel Xeon E3-1226 v3 3%
Intel Core i7-6700K 3%
...
VIA C3-M C3-M-1200 5178%
Super Pi mod 1.5 XS 2M - Super Pi mod 1.5 XS 2M *
19.6 s (1%)
...
Intel Core i7-9750H -4%
Intel Xeon E-2176M -3%
Intel Core i5-8600K 1%
AMD Ryzen 9 3900X 1%
...
Super Pi Mod 1.5 XS 32M - Super Pi mod 1.5 XS 32M *
481 s (2%)
...
Intel Core i7-8700 -2%
Intel Core i7-9750H -2%
Intel Xeon E-2176M -1%
Intel Core i7-6700K 0%
Intel Core i7-6950X 3%
...
VIA C3-M C3-M-1200 4581%
3DMark 11 - 3DM11 Performance Physics
4080 Points (11%)
...
Intel Core i5-4310M -3%
AMD A10-7850K -2%
AMD A10-6800K 0%
Intel Core i7-2640M 1%
Intel Core i5-7200U 2%
...
3DMark - 3DMark Ice Storm Physics
12668 Points (8%)
Samsung Hummingbird S5PC110 / Exynos 3110 -96%
...
Intel Atom Z3736F -3%
Intel Atom Z3735G -1%
Mediatek Helio P22 MT6762 0%
Intel Atom Z3735F 1%
Intel Pentium 3558U 6%
Qualcomm Snapdragon 850 6%
Intel Atom Z3735D 6%
AMD A4-6210 7%
...
Intel Core i5-4300Y 1128%
3DMark - 3DMark Ice Storm Extreme Physics
12727 Points (11%)
...
Mediatek MT6752 -6%
Mediatek Helio A22 MT6761 -6%
Qualcomm Snapdragon 850 -3%
HiSilicon Kirin 659 -1%
Intel Atom Z3735F 2%
Mediatek Helio P22 MT6762 2%
Intel Atom Z3735G 5%
Intel Pentium N3700 7%
Mediatek Helio P20 (LP4) MT6757 17%
Intel Celeron 3865U 18%
...
3DMark - 3DMark Ice Storm Unlimited Physics
13200 Points (11%)
Qualcomm Snapdragon S4 Play MSM8625Q -77%
...
HiSilicon Kirin 920 -3%
Mediatek MT6752 -3%
Intel Celeron N2840 -3%
Intel Atom x5-Z8550 -1%
Apple A9 0%
HiSilicon Kirin 910T 1%
Intel Atom x5-Z8300 3%
HiSilicon Kirin 659 3%
...
3DMark - 3DMark Cloud Gate Physics
3268 Points (8%)
...
Intel Core i3-7130U -5%
Intel Core i5-5350U -4%
AMD A10-6800K 0%
Intel Core i3-8121U 1%
Intel Core i5-6267U 1%
Intel Core i5-4310M 1%
...
3DMark - 3DMark Fire Strike Standard Physics
13365 Points (25%)
...
Intel Core i7-6700K -4%
Intel Core i5-8600K -3%
Intel Xeon E5-2680 1%
Intel Core i3-10320 1%
Intel Xeon E-2176M 3%
...
3DMark - 3DMark Time Spy CPU
5870 Points (29%)
...
Intel Core i7-7740X -3%
Intel Core i7-1250U 3%
Intel Core i7-1260U 5%
...
Geekbench 5.4 - Geekbench 5.1 - 5.4 64 Bit Single-Core
1206 punti (52%)
...
Intel Core i7-9750H -1%
Intel Xeon W-2145 -1%
Intel Core i5-1035G1 -1%
Intel Core i7-8700K 0%
Intel Core i3-10320 1%
...
Geekbench 5.4 - Geekbench 5.1 - 5.4 64 Bit Multi-Core
5888 punti (20%)
...
Intel Core i7-9750H -5%
Intel Core i3-1215U 2%
AMD Ryzen 5 2600 3%
AMD Ryzen 5 2600X 3%
...
AMD Ryzen Threadripper PRO 3975WX 389%
Geekbench 5.0 - Geekbench 5.0 64 Bit Single-Core
1193 punti (5%)
...
Intel Core i7-9750H -1%
Intel Core i5-1035G4 0%
...
Geekbench 5.0 - Geekbench 5.0 64 Bit Multi-Core
5875 punti (19%)
...
Intel Core i7-9750H -5%
Intel Core i7-8086K -4%
AMD Ryzen 5 2600 0%
AMD Ryzen 5 2600X 1%
Intel Core i3-1215U 2%
...
AMD Ryzen Threadripper PRO 3995WX 440%
Geekbench 4.1 - 4.4 - Geekbench 4.1 - 4.4 64 Bit Single-Core
5381 punti (56%)
...
Intel Core i5-1035G7 -2%
Intel Core i5-1035G4 0%
Intel Core i7-8559U 0%
AMD Ryzen 9 3900 1%
...
Geekbench 4.1 - 4.4 - Geekbench 4.1 - 4.4 64 Bit Multi-Core
23223 punti (26%)
...
AMD Ryzen 5 2600X -4%
AMD Ryzen 7 2700 -2%
AMD Ryzen 5 2600 -1%
Intel Core i3-1215U 0%
Intel Core i7-8700 0%
AMD Ryzen 7 1700X 6%
Intel Core i7-8086K 6%
Intel Core i7-8700K 7%
...
Mozilla Kraken 1.1 - Kraken 1.1 Total Score *
878 ms (1%)
...
Intel Core i7-8086K -2%
AMD Ryzen 5 2600X 1%
Intel Core i5-11400T 1%
Intel Xeon E3-1280 v5 1%
...
WebXPRT 3 - WebXPRT 3 Score
197 Points (50%)
...
AMD Ryzen Threadripper PRO 3975WX 1%
Intel Core i7-1065G7 1%
...
Apple M2 Pro 96%
Power Consumption - Prime95 Power Consumption - external Monitor *
65.2 Watt (11%)
...
Intel Core i5-1245U -15%
Intel Core i5-11400T -9%
AMD Ryzen 9 PRO 6950HS -5%
Intel Core i7-9750H 16%
...
AMD Ryzen Threadripper PRO 3975WX 790%
Power Consumption - Cinebench R15 Multi Power Consumption - external Monitor *
57 Watt (12%)
...
Intel Core i5-11400T 1%
...
AMD Ryzen Threadripper 2970WX 563%
Power Consumption - Cinebench R15 Multi Power Efficiency - external Monitor
19.5 Points per Watt (22%)
...
Intel Core i7-1065G7 -2%
Intel Core i5-1230U 1%
Intel Core i5-1035G7 2%
AMD Ryzen 7 PRO 6850H 4%
AMD Ryzen 7 7700 5%
...
- Valori di benchmark per questa scheda grafica
- Valori medi di benchmark per questa scheda grafica
* Numeri più piccoli rappresentano prestazioni supeiori
v1.22
log 30. 18:27:00
#0 no ids found in url (should be separated by "_") +0s ... 0s
#1 not redirecting to Ajax server +0s ... 0s
#2 did not recreate cache, as it is less than 5 days old! Created at Mon, 30 Jan 2023 08:57:14 +0100 +0.001s ... 0.001s
#3 no comparison url found in template nbc.compare_page_2 needed +0.006s ... 0.007s
#4 no comparison url found in template nbc.compare_page_2 needed +0s ... 0.008s
#5 no comparison url found in template nbc.compare_page_2 needed +0s ... 0.008s
#6 no comparison url found in template nbc.compare_page_2 needed +0s ... 0.008s
#7 no comparison url found in template nbc.compare_page_2 needed +0s ... 0.008s
#8 no comparison url found in template nbc.compare_page_2 needed +0s ... 0.009s
#9 no comparison url found in template nbc.compare_page_2 needed +0s ... 0.009s
#10 composed specs +0s ... 0.009s
#11 did output specs +0s ... 0.009s
#12 getting avg benchmarks for device 12027 +0.009s ... 0.018s
#13 got single benchmarks 12027 +0.007s ... 0.025s
#14 got avg benchmarks for devices +0s ... 0.025s
#15 min, max, avg, median took s +0.479s ... 0.504s
#16 no comparison url found in template nbc.compare_page_2 needed +0s ... 0.504s
#17 return log +0s ... 0.504s
Please share our article, every link counts!
.170
Altre CPU della serie Coffee Lake » Intel Core i7-8086K 6x 3.7 GHz - 5 GHz
» Intel Core i7-8700K 6x 3.7 GHz - 4.7 GHz
» Intel Xeon E-2186M 6x 2.9 GHz - 4.8 GHz
» Intel Core i7-8700 6x 3.2 GHz - 4.6 GHz
» Intel Core i7-9750H 6x 2.6 GHz - 4.5 GHz
» Intel Xeon E-2176M 6x 2.7 GHz - 4.4 GHz
» Intel Core i5-8600K 6x 3.6 GHz - 4.3 GHz
» Intel Core i5-8500 6x 3 GHz - 4.1 GHz
» Intel Core i5-8400 6x 2.8 GHz - 4 GHz
» Intel Core i5-8500T 6x 2.1 GHz - 3.5 GHz
» Intel Core i5-9400H 4x 2.5 GHz - 4.3 GHz
» Intel Core i5-8400H 4x 2.5 GHz - 4.2 GHz
» Intel Core i7-8559U 4x 2.7 GHz - 4.5 GHz
» Intel Core i5-8269U 4x 2.6 GHz - 4.2 GHz
» Intel Core i5-8260U 4x 1.6 GHz - 3.9 GHz
» Intel Core i3-8109U 2x 3 GHz - 3.6 GHz
CPUs simili + Intel Core i7-6950X 10x 3 GHz - 3.5 GHz
+ Intel Core i7-8700 6x 3.2 GHz - 4.6 GHz
- AMD Ryzen 7 2700 8x 3.2 GHz - 4.1 GHz
- AMD Ryzen 7 1800X 8x 3.6 GHz - 4 GHz
- AMD Ryzen 7 1700X 8x 3.4 GHz - 3.8 GHz
- Intel Xeon E5-2680 v4 14x 2.4 GHz - 3.3 GHz
- Intel Xeon E5-2697 v2 12x 2.7 GHz - 3.5 GHz
Klaus Hinum (Update: 2020-04-13)