AMD Ryzen 7 4800U
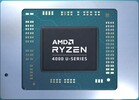
L'AMD Ryzen 7 4800U è un processore per computer portatili sottili e leggeri basato sull'architettura Renoir. Il 4800U integra tutti gli otto core basati sulla microarchitettura Zen 2. Sono clockati a 1,8 (clock di base garantito) a 4,2 GHz (Turbo) e supportano SMT / Hyperthreading (16 thread). Il chip è prodotto nel moderno processo a 7 nm al TSMC e in parte grazie ad esso AMD pubblicizza un miglioramento di 2x delle prestazioni per Watt per i chip Renoir. Rispetto all'analogo Ryzen 7 4800H, il 4800U offre un TDP inferiore (15 contro 45 Watt) e un clock di base (1,8 contro 2,9 GHz).
Secondo AMD, il Ryzen 7 4800U è il 4% più veloce nel test a filo singolo Cinebench R20 e il 90% più veloce nel test multithread rispetto al veloce Intel Core i7-1065G7 (Ice Lake, 4 core, 3,9 GHz). Ciò significa che la CPU dovrebbe essere uno dei processori più veloci nella gamma di 15 Watt TDP e ben adatto per compiti impegnativi. Le prestazioni sostenute, tuttavia, dipendono fortemente dal sistema di raffreddamento e dalle impostazioni TDP del portatile.
Oltre agli otto core della CPU, l'APU integra anche una scheda grafica integrata Radeon RX Vega 8 con 8 CU e fino a 1750 MHz. Il controller di memoria a doppio canale supporta DDR4-3200 e LPDDR4-4266 RAM ad alta efficienza energetica. Inoltre, sul chip sono presenti 8 MB di cache di livello 3. Per ulteriori informazioni, consultare la nostra pagina degli hub sui processori Renoir.
Il TDP dell'APU è specificato a 15 Watt (default) e può essere configurato da 10 a 25 Watt dal fornitore del laptop. Ciò significa che il chip è destinato a laptop sottili e leggeri (ma con ventole).
Serie AMD Renoir (Ryzen 4000 APU) Nome in codice Renoir (Zen 2) Serie: Renoir (Ryzen 4000 APU) Renoir (Zen 2) Clock Rate 1800 - 4200 MHz Level 1 Cache 512 KB Level 2 Cache 4 MB Level 3 Cache 8 MB Numero di Cores / Threads 8 / 16 Consumo energetico (TDP = Thermal Design Power) 15 Watt Tecnologia del produttore 7 nm Temperatura massima 105 °C Socket FP6 Features XFR, FMA3, SSE 4.2, AVX2, SMT GPU AMD Radeon RX Vega 8 (Ryzen 4000/5000) ( - 1750 MHz)64 Bit Supporto 64 Bit Architecture x86 Data di annuncio 01/07/2020 Collegamento Prodotto (esterno) AMD Renoir (Ryzen 4000 APU) R7 4800U
Benchmark Performance Rating - CB R15 + R20 + 7-Zip + X265 + Blender + 3DM11 CPU
41.5 pt (47%)
...
Intel Core i7-1260U 4%
...
Intel Core i9-12900HX 60%
Cinebench R23 - Cinebench R23 Multi Core
min: 7558 media: 8565 media: 8376 (14%) massimo: 9762 Points
CPU TDP ? TDP 20 W TDP 25 W 100% 77% 86%
...
Intel Core i5-1245U -4%
Apple M2 1%
...
Intel Core i9-13980HX 255%
Cinebench R23 - Cinebench R23 Single Core
min: 1231 media: 1235 media: 1235 (54%) massimo: 1240 Points
CPU TDP ? TDP 20 W TDP 25 W 100% 99% 100%
...
Intel Core i5-1140G7 1%
Intel Core i7-1180G7 4%
...
Intel Core i9-12900HX 55%
Cinebench R20 - Cinebench R20 CPU (Single Core)
min: 474 media: 480.5 media: 480 (55%) massimo: 488 Points
CPU TDP ? TDP 20 W TDP 25 W 98% 99% 100%
...
Intel Core i7-8559U -3%
Intel Core i7-1180G7 2%
...
Intel Core i9-12900HX 54%
Cinebench R20 - Cinebench R20 CPU (Multi Core)
min: 2943 media: 3178 media: 3230.5 (14%) massimo: 3306 Points
CPU TDP ? TDP 20 W TDP 25 W 100% 90% 100%
...
Intel Core i5-1245U -1%
...
Intel Core i7-12800HX 169%
Cinebench R15 - Cinebench R15 CPU Multi 64 Bit
min: 1281 media: 1444 media: 1411 (15%) massimo: 1639 Points
CPU TDP ? TDP 20 W TDP 25 W 100% 78% 86%
...
Intel Core i5-1245U -9%
...
Intel Core i7-12800HX 134%
0 85 170 255 340 425 510 595 680 765 850 935 1020 1105 1190 1275 1360 1445 1530 1615 Tooltip GPD Win Max 2021: Ø1274 (1269.36-1281.19)
Beelink SER4: Ø1404 (1390.29-1411.03)
Lenovo Yoga Slim 7-14ARE: Ø1522 (1505.17-1639.01)
Cinebench R15 - Cinebench R15 CPU Single 64 Bit
min: 182 media: 184 media: 183 (56%) massimo: 187 Points
CPU TDP ? TDP 20 W TDP 25 W 97% 98% 100%
...
Intel Core i5-1140G7 -3%
Intel Xeon E-2176M -1%
Intel Core i7-9750H 0%
Intel Core i7-8559U 2%
Intel Core i7-1180G7 2%
...
Intel Core i9-12900HX 51%
Cinebench R11.5 - Cinebench R11.5 CPU Multi 64 Bit
17.8 Points (25%)
...
Intel Core i5-1245U -9%
Intel Core i7-1265U -8%
...
Intel Core i9-12900HX 133%
Cinebench R11.5 - Cinebench R11.5 CPU Single 64 Bit
2.2 Points (7%)
...
Intel Core i7-9750H -2%
Intel Core i7-1065G7 -1%
Intel Core i7-8559U 1%
...
Cinebench R10 - Cinebench R10 Rend. Single (32bit)
5690 punti (46%)
...
Intel Core i5-7360U 2%
...
Cinebench R10 - Cinebench R10 Rend. Multi (32bit)
33649 punti (38%)
...
Intel Core i7-9750H 0%
AMD Ryzen 7 PRO 6850H 2%
Intel Xeon E-2176M 7%
...
Intel Core i9-12900HX 92%
wPrime 2.10 - wPrime 2.0 1024m *
99.5 s (1%)
Intel Core i3-1215U -1%
AMD Ryzen 7 PRO 6850H 4%
AMD Ryzen 9 5980HS 10%
...
VIA C3-M C3-M-1200 8403%
wPrime 2.10 - wPrime 2.0 32m *
3.6 s (1%)
Intel Core i3-1215U -6%
AMD Ryzen 9 5980HS -5%
AMD Ryzen 7 PRO 6850H 2%
Intel Core i7-9750H 36%
...
3881 punti (22%)
...
Intel Core i5-1035G1 -2%
Intel Core i7-4712HQ 2%
Intel Core i5-8265U 4%
...
7-Zip 18.03 - 7-Zip 18.03 Multli Thread 4 runs
min: 38654 media: 41192 media: 40117 (25%) massimo: 44804 MIPS
CPU TDP ? TDP 20 W TDP 25 W 100% 86% 90%
...
...
Intel Core i7-12800HX 87%
7-Zip 18.03 - 7-Zip 18.03 Single Thread 4 runs
min: 4420 media: 4486 media: 4436 (53%) massimo: 4603 MIPS
CPU TDP ? TDP 20 W TDP 25 W 96% 96% 100%
...
Intel Core i5-1230U -3%
Intel Core i7-7700HQ -2%
...
Intel Core i9-12900HX 40%
X264 HD Benchmark 4.0 - x264 Pass 2
88.5 fps (32%)
...
Intel Core i7-1265U -8%
AMD Ryzen 9 PRO 6950HS 16%
...
Intel Core i9-12900HX 110%
X264 HD Benchmark 4.0 - x264 Pass 1
196.1 fps (46%)
...
Intel Core i7-8559U -2%
Intel Core i3-1215U 2%
...
Intel Core i9-12900HX 60%
HWBOT x265 Benchmark v2.2 - HWBOT x265 4k Preset
min: 9.48 media: 10.2 media: 10.4 (22%) massimo: 10.77 fps
CPU TDP ? TDP 20 W TDP 25 W 100% 88% 97%
...
Intel Core i5-1245U -7%
...
Intel Core i7-12800HX 144%
0 1 2 3 4 5 6 7 8 9 10 11 12 13 14 15 16 Tooltip GPD Win Max 2021: Ø9.83 (0.85-15.7)
Beelink SER4: Ø10.7 (0.9-16.9)
TrueCrypt - TrueCrypt Serpent
1.1 GB/s (0%)
...
AMD Ryzen 7 PRO 6850H -9%
AMD Ryzen 9 PRO 6950HS -8%
Intel Core i3-1215U 0%
...
Intel Core i9-12900HX 55%
TrueCrypt - TrueCrypt Twofish
1.5 GB/s (0%)
...
Intel Core i7-9750H -17%
Intel Core i7-1265U 7%
AMD Ryzen 9 PRO 6950HS 7%
Intel Core i3-1215U 13%
...
Intel Core i9-12900HX 113%
TrueCrypt - TrueCrypt AES
10.2 GB/s (0%)
...
Intel Core i5-1245U -10%
Intel Core i7-1265U -5%
Intel Core i3-1215U 14%
...
Intel Core i9-12900HX 71%
Blender - Blender 2.79 BMW27 CPU *
min: 322 media: 345.3 media: 340 (2%) massimo: 374 Seconds
CPU TDP ? TDP 20 W TDP 25 W 100% 100% 100%
Intel Core i5-1038NG7 -99%
...
...
R Benchmark 2.5 - R Benchmark 2.5 *
min: 0.576 media: 0.6 media: 0.6 (13%) massimo: 0.613 sec
CPU TDP ? TDP 20 W TDP 25 W 100% 100% 101%
Intel Core i9-12900HX -30%
...
Intel Core i7-8559U 4%
...
3DMark 06 - CPU - 3DMark 06 - CPU
10227 Points (22%)
...
Intel Core i7-9750H 5%
...
Intel Core i9-12900HX 73%
Super Pi mod 1.5 XS 1M - Super Pi mod 1.5 XS 1M *
9.7 s (2%)
AMD Ryzen 7 PRO 6850H -90%
...
Intel Core i7-8706G -3%
Intel Core i5-8265U 2%
...
VIA C3-M C3-M-1200 4658%
Super Pi mod 1.5 XS 2M - Super Pi mod 1.5 XS 2M *
22.9 s (1%)
...
AMD Ryzen 7 PRO 6850H -1%
Intel Core i5-7360U 1%
Intel Core i7-1065G7 1%
Intel Core i5-8305G 2%
Intel Core i7-7700HQ 2%
...
Super Pi Mod 1.5 XS 32M - Super Pi mod 1.5 XS 32M *
585 s (3%)
...
Intel Core i7-2860QM 1%
Intel Core i5-4310M 1%
Intel Core i7-4700MQ 2%
...
VIA C3-M C3-M-1200 3749%
3DMark Vantage - 3DM Vant. Perf. CPU no Physx
50726 Points (47%)
...
Intel Core i7-9750H -18%
Intel Core i5-1245U -12%
...
Intel Core i9-12900HX 75%
3DMark 11 - 3DM11 Performance Physics
min: 11658 media: 12133 media: 12201 (34%) massimo: 12541 Points
CPU TDP ? TDP 20 W TDP 25 W 97% 93% 100%
...
Intel Core i3-1215U -1%
Intel Core i7-1265U 2%
Intel Core i7-9750H 5%
...
Intel Core i7-12800HX 84%
3DMark - 3DMark Ice Storm Physics
58600 Points (38%)
...
Intel Core i7-9750H -3%
Intel Core i3-1215U 0%
AMD Ryzen 9 5980HS 3%
...
Intel Core i5-4300Y 165%
3DMark - 3DMark Ice Storm Extreme Physics
58705 Points (49%)
...
Intel Core i3-1215U 0%
Intel Core i7-9750H 0%
...
Intel Core i9-12900HX 74%
3DMark - 3DMark Ice Storm Unlimited Physics
67233 Points (57%)
...
Intel Core i7-1265U 1%
...
Intel Core i9-12900HX 47%
3DMark - 3DMark Cloud Gate Physics
min: 11486 media: 13163 media: 13102 (33%) massimo: 14901 Points
CPU TDP ? TDP 20 W TDP 25 W 100% 77% 88%
...
AMD Ryzen 9 PRO 6950HS 14%
...
Intel Core i9-12950HX 73%
3DMark - 3DMark Fire Strike Standard Physics
min: 16762 media: 18139 media: 17885 (33%) massimo: 19769 Points
CPU TDP ? TDP 20 W TDP 25 W 100% 85% 90%
...
Intel Core i5-1245U 2%
Intel Xeon W-2145 8%
...
Intel Core i7-12800HX 90%
3DMark - 3DMark Time Spy CPU
min: 6229 media: 6498 media: 6514 (32%) massimo: 6750 Points
CPU TDP ? TDP 20 W TDP 25 W 100% 92% 97%
...
Intel Core i7-1250U -7%
Intel Core i7-1260U -5%
Intel Core i5-1245U -5%
Intel Core i7-9750H -3%
AMD Ryzen 9 PRO 6950HS 10%
...
Intel Core i7-12800HX 120%
Geekbench 5.4 - Geekbench 5.1 - 5.4 64 Bit Single-Core
min: 1150 media: 1164 media: 1156.5 (50%) massimo: 1192 punti
CPU TDP ? TDP 25 W 97% 100%
...
Intel Core i5-1035G7 0%
Intel Core i7-1068G7 1%
Intel Core i5-1035G4 2%
Intel Core i7-9750H 2%
...
Apple M2 Max 69%
Geekbench 5.4 - Geekbench 5.1 - 5.4 64 Bit Multi-Core
min: 5798 media: 6255 media: 6136.5 (21%) massimo: 6950 punti
CPU TDP ? TDP 25 W 97% 100%
...
Intel Core i3-1215U -4%
Intel Core i7-11600H 2%
Intel Core i5-11500H 12%
...
Apple M2 Max 146%
Geekbench 5.0 - Geekbench 5.0 64 Bit Single-Core
1162 punti (5%)
...
Intel Core i5-1035G1 -6%
Intel Core i5-1035G7 -2%
Intel Core i7-8559U -1%
Intel Core i7-9750H 1%
...
Geekbench 5.0 - Geekbench 5.0 64 Bit Multi-Core
7298 punti (23%)
...
Intel Core i7-1250U -3%
Intel Core i7-1260U -3%
Intel Core i5-1230U -1%
...
Intel Core i9-12900HX 126%
Geekbench 4.1 - 4.4 - Geekbench 4.1 - 4.4 64 Bit Single-Core
min: 4919 media: 4963 media: 4963 (51%) massimo: 5007 punti
...
Intel Xeon W-2145 1%
Intel Core i7-8706G 1%
...
Intel Core i9-13900HX 80%
Geekbench 4.1 - 4.4 - Geekbench 4.1 - 4.4 64 Bit Multi-Core
min: 27166 media: 27287 media: 27286.5 (30%) massimo: 27407 punti
...
...
Intel Core i9-13900HX 161%
Mozilla Kraken 1.1 - Kraken 1.1 Total Score *
min: 793 media: 810 media: 816 (1%) massimo: 822 ms
CPU TDP ? TDP 20 W TDP 25 W 100% 100% 100%
...
Intel Core i5-7360U -2%
Intel Core i5-7267U 1%
...
Octane V2 - Octane V2 Total Score
36619 Points (38%)
...
Intel Core i5-1035G4 -3%
Intel Core i5-1035G1 -3%
Intel Core i7-9750H -2%
Intel Xeon E-2176M -1%
Intel Core i7-1065G7 2%
Intel Core i7-7700HQ 5%
Intel Core i5-7267U 6%
...
Intel Core i9-12900HX 160%
WebXPRT 3 - WebXPRT 3 Score
min: 205 media: 210.7 media: 208 (53%) massimo: 219 Points
CPU TDP ? TDP 20 W TDP 25 W 94% 95% 100%
...
Intel Core i7-9750H 0%
Intel Core i5-1140G7 3%
...
Power Consumption - Prime95 Power Consumption - external Monitor *
min: 37 media: 42.1 media: 38.6 (7%) massimo: 50.8 Watt
CPU TDP ? TDP 20 W TDP 25 W 100% 103% 102%
...
Intel Core i7-1265U -1%
Intel Core i5-7360U 0%
Intel Core i5-7267U 2%
...
Intel Core i7-12800HX 321%
0 5 10 15 20 25 30 35 Tooltip GPD Win Max 2021: Ø37 (34-37.7)
Beelink SER4: Ø38.6 (37.9-39.9)
Power Consumption - Cinebench R15 Multi Power Consumption - external Monitor *
min: 33.7 media: 39.3 media: 34.8 (7%) massimo: 49.5 Watt
CPU TDP ? TDP 20 W TDP 25 W 100% 104% 103%
...
Intel Core i5-7360U -9%
Intel Core i7-1260U -2%
...
Intel Core i9-12950HX 405%
0 5 10 15 20 25 30 35 Tooltip GPD Win Max 2021: Ø33.7 (21.5-36)
Beelink SER4: Ø34.8 (34-35.5)
Power Consumption - Cinebench R15 Multi Power Efficiency - external Monitor
min: 33.1 media: 37.2 media: 38 (44%) massimo: 40.5 Points per Watt
CPU TDP ? TDP 20 W TDP 25 W 82% 94% 100%
...
Apple M1 1%
Apple M2 14%
- Valori di benchmark per questa scheda grafica
- Valori medi di benchmark per questa scheda grafica
* Numeri più piccoli rappresentano prestazioni supeiori
v1.22
log 29. 20:29:53
#0 no ids found in url (should be separated by "_") +0s ... 0s
#1 not redirecting to Ajax server +0s ... 0s
#2 did not recreate cache, as it is less than 5 days old! Created at Wed, 25 Jan 2023 08:57:11 +0100 +0.001s ... 0.001s
#3 no comparison url found in template nbc.compare_page_2 needed +0.007s ... 0.008s
#4 no comparison url found in template nbc.compare_page_2 needed +0s ... 0.009s
#5 no comparison url found in template nbc.compare_page_2 needed +0s ... 0.009s
#6 no comparison url found in template nbc.compare_page_2 needed +0s ... 0.009s
#7 no comparison url found in template nbc.compare_page_2 needed +0s ... 0.01s
#8 no comparison url found in template nbc.compare_page_2 needed +0s ... 0.01s
#9 no comparison url found in template nbc.compare_page_2 needed +0s ... 0.011s
#10 no comparison url found in template nbc.compare_page_2 needed +0s ... 0.011s
#11 no comparison url found in template nbc.compare_page_2 needed +0s ... 0.011s
#12 no comparison url found in template nbc.compare_page_2 needed +0s ... 0.012s
#13 no comparison url found in template nbc.compare_page_2 needed +0s ... 0.012s
#14 no comparison url found in template nbc.compare_page_2 needed +0s ... 0.012s
#15 composed specs +0s ... 0.013s
#16 did output specs +0s ... 0.013s
#17 getting avg benchmarks for device 11681 +0.011s ... 0.023s
#18 got single benchmarks 11681 +0.015s ... 0.038s
#19 got avg benchmarks for devices +0s ... 0.038s
#20 min, max, avg, median took s +0.639s ... 0.677s
#21 no comparison url found in template nbc.compare_page_2 needed +0s ... 0.678s
#22 return log +0s ... 0.678s
Recensioni per il AMD Ryzen 7 4800U processore
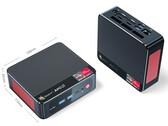
Recensione del mini PC Beelink SER4: AMD Zen 2 dà ancora del filo da torcere all'Intel NUC Passando dallo Zen+ Ryzen 7 3750H allo Zen 2 Ryzen 7 4800U, il SER4 ha reso il SER3 obsoleto. Il Ryzen 7 4800U continua a corrispondere da vicino o a volte a su...
AMD Ryzen 7 4800U | AMD Radeon RX Vega 8 (Ryzen 4000/5000) | | 494 gr
Recensione del computer portatile gaming GPD Win Max 2021: Ryzen 7 più lento del Core i7 Il Win Max sembra ottimo sulla carta e il suo formato portatile è attraente per il gaming portatile, ma ci sono abbastanza inconvenienti per noi per frenare que...
AMD Ryzen 7 4800U | AMD Radeon RX Vega 8 (Ryzen 4000/5000) | 8.00" | 850 gr
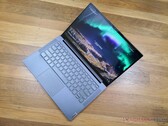
Recensione del laptop Lenovo Yoga Slim 7 14: la Ryzen 7 4800U è un mostro Dopo aver affrontato alcuni ritardi, il primo Ryzen 7 4800U di AMD sta finalmente iniziando ad arrivare sugli scaffali dei negozi. I risultati sono pazzeschi pe...
AMD Ryzen 7 4800U | AMD Radeon RX Vega 8 (Ryzen 4000/5000) | 14.00" | 1.4 kg
Lenovo Yoga Slim 7 14ARE05-82A20087MH : AMD Radeon RX Vega 8 (Ryzen 4000/5000), 14.00", 1.3 kg
Recensioni esterne » Lenovo Yoga Slim 7 14ARE05-82A20087MH
Lenovo Yoga Slim 7 14ARE05-82A200A5GE : AMD Radeon RX Vega 8 (Ryzen 4000/5000), 14.00", 1.3 kg
Recensioni esterne » Lenovo Yoga Slim 7 14ARE05-82A200A5GE
Lenovo Yoga Slim 7 14ARH05 : AMD Radeon RX Vega 8 (Ryzen 4000/5000), 14.00", 1.5 kg
Recensioni esterne » Lenovo Yoga Slim 7 14ARH05
Lenovo IdeaPad S540-13ARE-82DL002TMH : AMD Radeon RX Vega 8 (Ryzen 4000/5000), 13.30", 1.3 kg
Recensioni esterne » Lenovo IdeaPad S540-13ARE-82DL002TMH
Lenovo IdeaPad Slim 7-14ARE05, Ryzen 7 4800U : AMD Radeon RX Vega 8 (Ryzen 4000/5000), 14.00", 1.4 kg
Recensioni esterne » Lenovo IdeaPad Slim 7-14ARE05, Ryzen 7 4800U
Lenovo Yoga Slim 7-14ARE05-82A2005KMH : AMD Radeon RX Vega 8 (Ryzen 4000/5000), 14.00", 1.3 kg
Recensioni esterne » Lenovo Yoga Slim 7-14ARE05-82A2005KMH
Lenovo Yoga Slim 7-14ARE : AMD Radeon RX Vega 8 (Ryzen 4000/5000), 14.00", 1.4 kg
Recensioni esterne » Lenovo Yoga Slim 7-14ARE
GPD Win Max 2021 : AMD Radeon RX Vega 8 (Ryzen 4000/5000), 8.00", 0.9 kg
» Tre svantaggi e vantaggi del Win Max di cui GPD non vi parla
Please share our article, every link counts!
.170
Altre CPU della serie Renoir (Ryzen 4000 APU) CPUs simili + Intel Xeon E-2186M 6x 2.9 GHz - 4.8 GHz
+ Intel Xeon W-2145 8x 3.7 GHz - 4.5 GHz
- Intel Core i7-9750H 6x 2.6 GHz - 4.5 GHz
- AMD Ryzen 5 5600HS 6x 3 GHz - 4.2 GHz
- Apple M2 8x 2.42 GHz - 3.48 GHz
Klaus Hinum (Update: 2020-06-28)