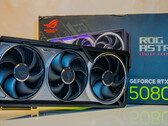
Recensione dell'Asus ROG Astral GeForce RTX 5080 OC Edition: Bella, ingombrante e incredibilmente costosa
Intel Core i9-14900K | NVIDIA GeForce RTX 5080 | 32.00" | 2.9 kg
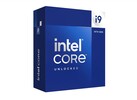
L'Intel Core i9-14900K è un processore di fascia alta basato sull'architettura Raptor Lake, simile all'Intel Core i9-13900K dello scorso anno. Il clock di base è di 3,2 GHz e può arrivare fino a 6 GHz in condizioni ottimali. Il totale di 32 thread è ancora suddiviso in 8 core P e 16 core E. Gli 8 core ad alte prestazioni (core P) offrono anche l'hyperthreading, il che significa che è possibile elaborare simultaneamente un totale di 32 thread insieme ai 16 core E ad alta efficienza energetica. Come in precedenza, i modelli K continuano ad offrire un moltiplicatore liberamente selezionabile, che semplifica l'overclocking. L'Intel Core i9-14900K utilizza lo stesso socket della CPU (LGA 1700) dell'Intel Core i9-13900K. Ciò significa che non è necessariamente necessaria una nuova scheda madre, in quanto i chipset della serie 600 supportano i nuovi processori dopo un aggiornamento del BIOS. C'è anche la possibilità di utilizzare la RAM DDR4.
Prestazioni
Rispetto a Intel Core i9-13900K, il Core i9-14900K offre ancora 8 core P, che vengono alleggeriti da 16 core E aggiuntivi per le applicazioni più esigenti, garantendo così prestazioni multi-thread molto elevate. Nel confronto, tuttavia, l'Intel Core i9-14900K può guadagnare solo un leggero vantaggio. Gli e-cores si occupano principalmente delle applicazioni in background. L'architettura ibrida si affida all'Intel Thread Director, che è responsabile della corretta assegnazione dei compiti. Nel frattempo, l'IPC può essere aumentato solo leggermente. Come innovazione con l'Intel Core i9-14900K, il produttore si affida sempre più all'intelligenza artificiale, che viene utilizzata anche per l'overclocking. Con un solo clic nell'Intel Extreme Utility, lo strumento controlla l'intero sistema ed effettua le impostazioni necessarie.
Unità grafica
Come l'Intel Core i9-13900K, l'Intel Core i9-14900K offre un'unità grafica integrata. L'architettura Intel Iris Xe continua a fungere da base. In termini di prestazioni, tuttavia, nulla è cambiato con Intel UHD Graphics 770.
Consumo di energia
L'Intel Core i9-14900K è specificato con un TDP di 125 watt, che corrisponde al valore PL1. In modalità Boost, le prestazioni del processore possono aumentare fino a 253 watt (PL2). Tuttavia, questo richiede un ottimo raffreddamento. Rispetto all'Intel Core i9-13900K, il consumo energetico specificato non aumenta se si rispettano i limiti. La situazione è diversa se i limiti sono disattivati. Poiché questo valore dipende dal sistema complessivo, non possiamo fare una dichiarazione esatta in merito.
| Nome in codice | Raptor Lake | ||||||||||||||||||||||||||||
| Serie | Intel Raptor Lake-R | ||||||||||||||||||||||||||||
Serie: Raptor Lake-R Raptor Lake
| |||||||||||||||||||||||||||||
| Clock Rate | 3200 - 6000 MHz | ||||||||||||||||||||||||||||
| Level 2 Cache | 32 MB | ||||||||||||||||||||||||||||
| Level 3 Cache | 36 MB | ||||||||||||||||||||||||||||
| Numero di Cores / Threads | 24 / 32 8 x 6.0 GHz Intel Raptor Cove P-Core 16 x 4.4 GHz Intel Gracemont E-Core | ||||||||||||||||||||||||||||
| Consumo energetico (TDP = Thermal Design Power) | 125 Watt | ||||||||||||||||||||||||||||
| Tecnologia del produttore | 10 nm | ||||||||||||||||||||||||||||
| Dimensione Die | 257 mm2 | ||||||||||||||||||||||||||||
| Temperatura massima | 100 °C | ||||||||||||||||||||||||||||
| Socket | LGA 1700 | ||||||||||||||||||||||||||||
| Features | Intel UHD Graphics 770, DDR5 5600 MT/s, DDR4 3200 MT/s | ||||||||||||||||||||||||||||
| GPU | Intel UHD Graphics 770 (300 - 1650 MHz) | ||||||||||||||||||||||||||||
| 64 Bit | Supporto 64 Bit | ||||||||||||||||||||||||||||
| Architecture | x86 | ||||||||||||||||||||||||||||
| Prezzo base | $589 U.S. | ||||||||||||||||||||||||||||
| Data di annuncio | 10/17/2023 | ||||||||||||||||||||||||||||
| Collegamento Prodotto (esterno) | ark.intel.com | ||||||||||||||||||||||||||||


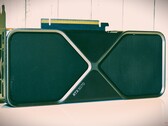
MSI GeForce RTX 5070 Ti 16G Ventus 3X OC: NVIDIA GeForce RTX 5070 Ti, 32.00"
recensione » Recensione dell'MSI GeForce RTX 5070 Ti 16G Ventus 3X OC: GPU Blackwell mainstream quasi perfetta, a patto che sia possibile averla a 749 dollari
Asus Prime GeForce RTX 5080 OC Edition: NVIDIA GeForce RTX 5080, 32.00"
recensione » Recensione dell'Asus Prime GeForce RTX 5080 OC Edition: 13% di guadagno rispetto alla RX 7900 XTX per un prezzo aumentato del 30% rispetto alla RTX 5080 FE
Intel Arc B580: Intel Arc B580, 0.00", 0.8 kg
recensione » Recensione della GPU desktop Intel Arc B580 Limited Edition: La risposta di Intel a AMD Radeon RX e Nvidia GeForce RTX
MSI MAG 274QRF QD E2: NVIDIA GeForce RTX 4090, 27.00", 4 kg
recensione » Recensione dell'MSI MAG 274QRF QD E2: Monitor per il gaming QHD 180 Hz impressionante, con un ottimo rapporto qualità-prezzo
Thermaltake TH420 V2 Ultra EX ARGB: NVIDIA GeForce RTX 4090, 28.00"
recensione » Recensione del Thermaltake TH420 V2 Ultra EX ARGB AiO: Prestazioni di raffreddamento senza freni, senza spendere una fortuna
Alienware AW2725DF: NVIDIA GeForce RTX 4090, 27.00", 10 kg
recensione » Recensione del monitor per il gaming QD-OLED Alienware AW2725DF: QHD 360 Hz, velocissimo, con un vantaggio competitivo
ASUS TUF Gaming Radeon RX 7800 XT: AMD Radeon RX 7800 XT, 0.00"
recensione » Recensione dell'Asus TUF Gaming Radeon RX 7800 XT OC: Un serio sfidante della Nvidia GeForce RTX 4070 Super a meno di 600 euro?
recensione » Recensione dell'AMD Radeon RX 7900 XTX con 24 GB di VRAM: Già disponibile a meno di 1000 euro
recensione » Recensione degli Intel Core i9-14900K e Intel Core i5-14600K - Con 6 GHz contro i processori X3D di AMD
NVIDIA GeForce RTX 5070 Founders Edition: NVIDIA GeForce RTX 5070, 32.00"
» RX 9070 vs RTX 5070 con FSR 4 e DLSS 4: secondo quanto riferito, RX 9070 è ancora più veloce ora che al lancio
Intel Arc B580: Intel Arc B580, 0.00", 0.8 kg
» La dGPU Intel Arc Celestial sembra essere la prima vittima della partnership con Nvidia, mentre Intel Arc B770 sarebbe ancora vivo
NVIDIA GeForce RTX 5090 Founders Edition: NVIDIA GeForce RTX 5090
» Asus lancia la GPU RTX 5090 Dhahab Edition placcata in oro a partire da $7.000
Intel Arc B580: Intel Arc B580, 0.00", 0.8 kg
» Intel Xe2 Battlemage GPUs on the chopping block as Nvidia high-end slated to remain unchallenged
MSI GeForce RTX 5070 Ti 16G Ventus 3X OC: NVIDIA GeForce RTX 5070 Ti, 32.00"
» La battaglia tra RX 9070 XT e RTX 5070 Ti in 55 giochi mostra un delta di prestazioni del 5% con alcune grandi vittorie e perdite per le GPU Radeon
» Zotac lancia le GPU Solid Core RTX 5080 e 5070 Ti, che sono poco ingombranti
NVIDIA GeForce RTX 5080 Founders Edition: NVIDIA GeForce RTX 5080, 32.00"
» Zotac lancia le GPU Solid Core RTX 5080 e 5070 Ti, che sono poco ingombranti
NVIDIA GeForce RTX 5070 Founders Edition: NVIDIA GeForce RTX 5070, 32.00"
» GeForce Il risultato del benchmark della RTX 5070 la vede in corrispondenza con l'errata RTX 4090
MSI GeForce RTX 5070 Ti 16G Ventus 3X OC: NVIDIA GeForce RTX 5070 Ti, 32.00"
» CyberPowerPC protegge i clienti dall'errore di Nvidia, assicurando le GPU RTX 50 con ROP complete nei PC da gioco
NVIDIA GeForce RTX 5090 Founders Edition: NVIDIA GeForce RTX 5090
» La RTX 5090D di GeForce, sovrapotenziata, prende un enorme vantaggio sulla RTX 4090 nella classifica dei benchmark e raddoppia il risultato del test DirectX 12
MSI GeForce RTX 5070 Ti 16G Ventus 3X OC: NVIDIA GeForce RTX 5070 Ti, 32.00"
» L'abissale stock di RTX 5070 al lancio sembra all'orizzonte, mentre l'ultima fuga di notizie indica una possibile carenza di scorte
NVIDIA GeForce RTX 5090 Founders Edition: NVIDIA GeForce RTX 5090
» Gli strani problemi di benchmark della serie RTX 50 di GeForce sono stati risolti, ma è sorto un nuovo problema per i giocatori
MSI GeForce RTX 5070 Ti 16G Ventus 3X OC: NVIDIA GeForce RTX 5070 Ti, 32.00"
» Secondo quanto riferito, la RTX 5070 Ti difettosa subisce una perdita di prestazioni fino a due cifre
NVIDIA GeForce RTX 5090 Founders Edition: NVIDIA GeForce RTX 5090
» GeForce RTX 5090 scende sotto RTX 4090 nel grafico di benchmark delle schede grafiche di fascia alta
NVIDIA GeForce RTX 5080 Founders Edition: NVIDIA GeForce RTX 5080, 32.00"
» Secondo quanto riferito, i gravi problemi dei driver di RTX 5090 e RTX 5090D trasformano le GPU in costosi fermacarte
NVIDIA GeForce RTX 5090 Founders Edition: NVIDIA GeForce RTX 5090
» Secondo quanto riferito, i gravi problemi dei driver di RTX 5090 e RTX 5090D trasformano le GPU in costosi fermacarte
NVIDIA GeForce RTX 5080 Founders Edition: NVIDIA GeForce RTX 5080, 32.00"
» Nvidia è stata accusata di essere "di serie B" quando Edward Snowden ha spifferato le quantità di VRAM di RTX 5080 e RTX 5090
Intel Arc B580: Intel Arc B580, 0.00", 0.8 kg
» Il nuovo aggiornamento dei driver di Intel suggerisce 3 nuove GPU Arc Battlemage: B580 Pro e B770 sulle schede
» Asus TUF Gaming Radeon RX 7800 XT OC in un duello contro Nvidia GeForce RTX 4070 Super
» Confronto CPU Mobile
Confronto di tutte le serie di CPU mobile
» Processori Mobile - Elenco Benchmark
Elenco Benchmark di tutte le CPUs conosciute, usate nei portatili (CPUs desktop e portatili)
I nostri Top 10
» Top 10 Portatili Multimedia
» Top 10 Portatili Gaming
» Top 10 Portatili Gaming Leggeri
» Top 10 Portatili da Ufficio e Business economici
» Top 10 Portatili Premium da Ufficio/Business
» Top 10 Portatili sotto i 300 Euro
» Top 10 Portatili sotto i 500 Euro
» Top 10 dei Portatili Workstation
» Top 10 Subnotebooks
» Top 10 Ultrabooks
» Top 10 Convertibili
» Top 10 Tablets
» Top 10 Tablets Windows
» Top 10 Smartphones