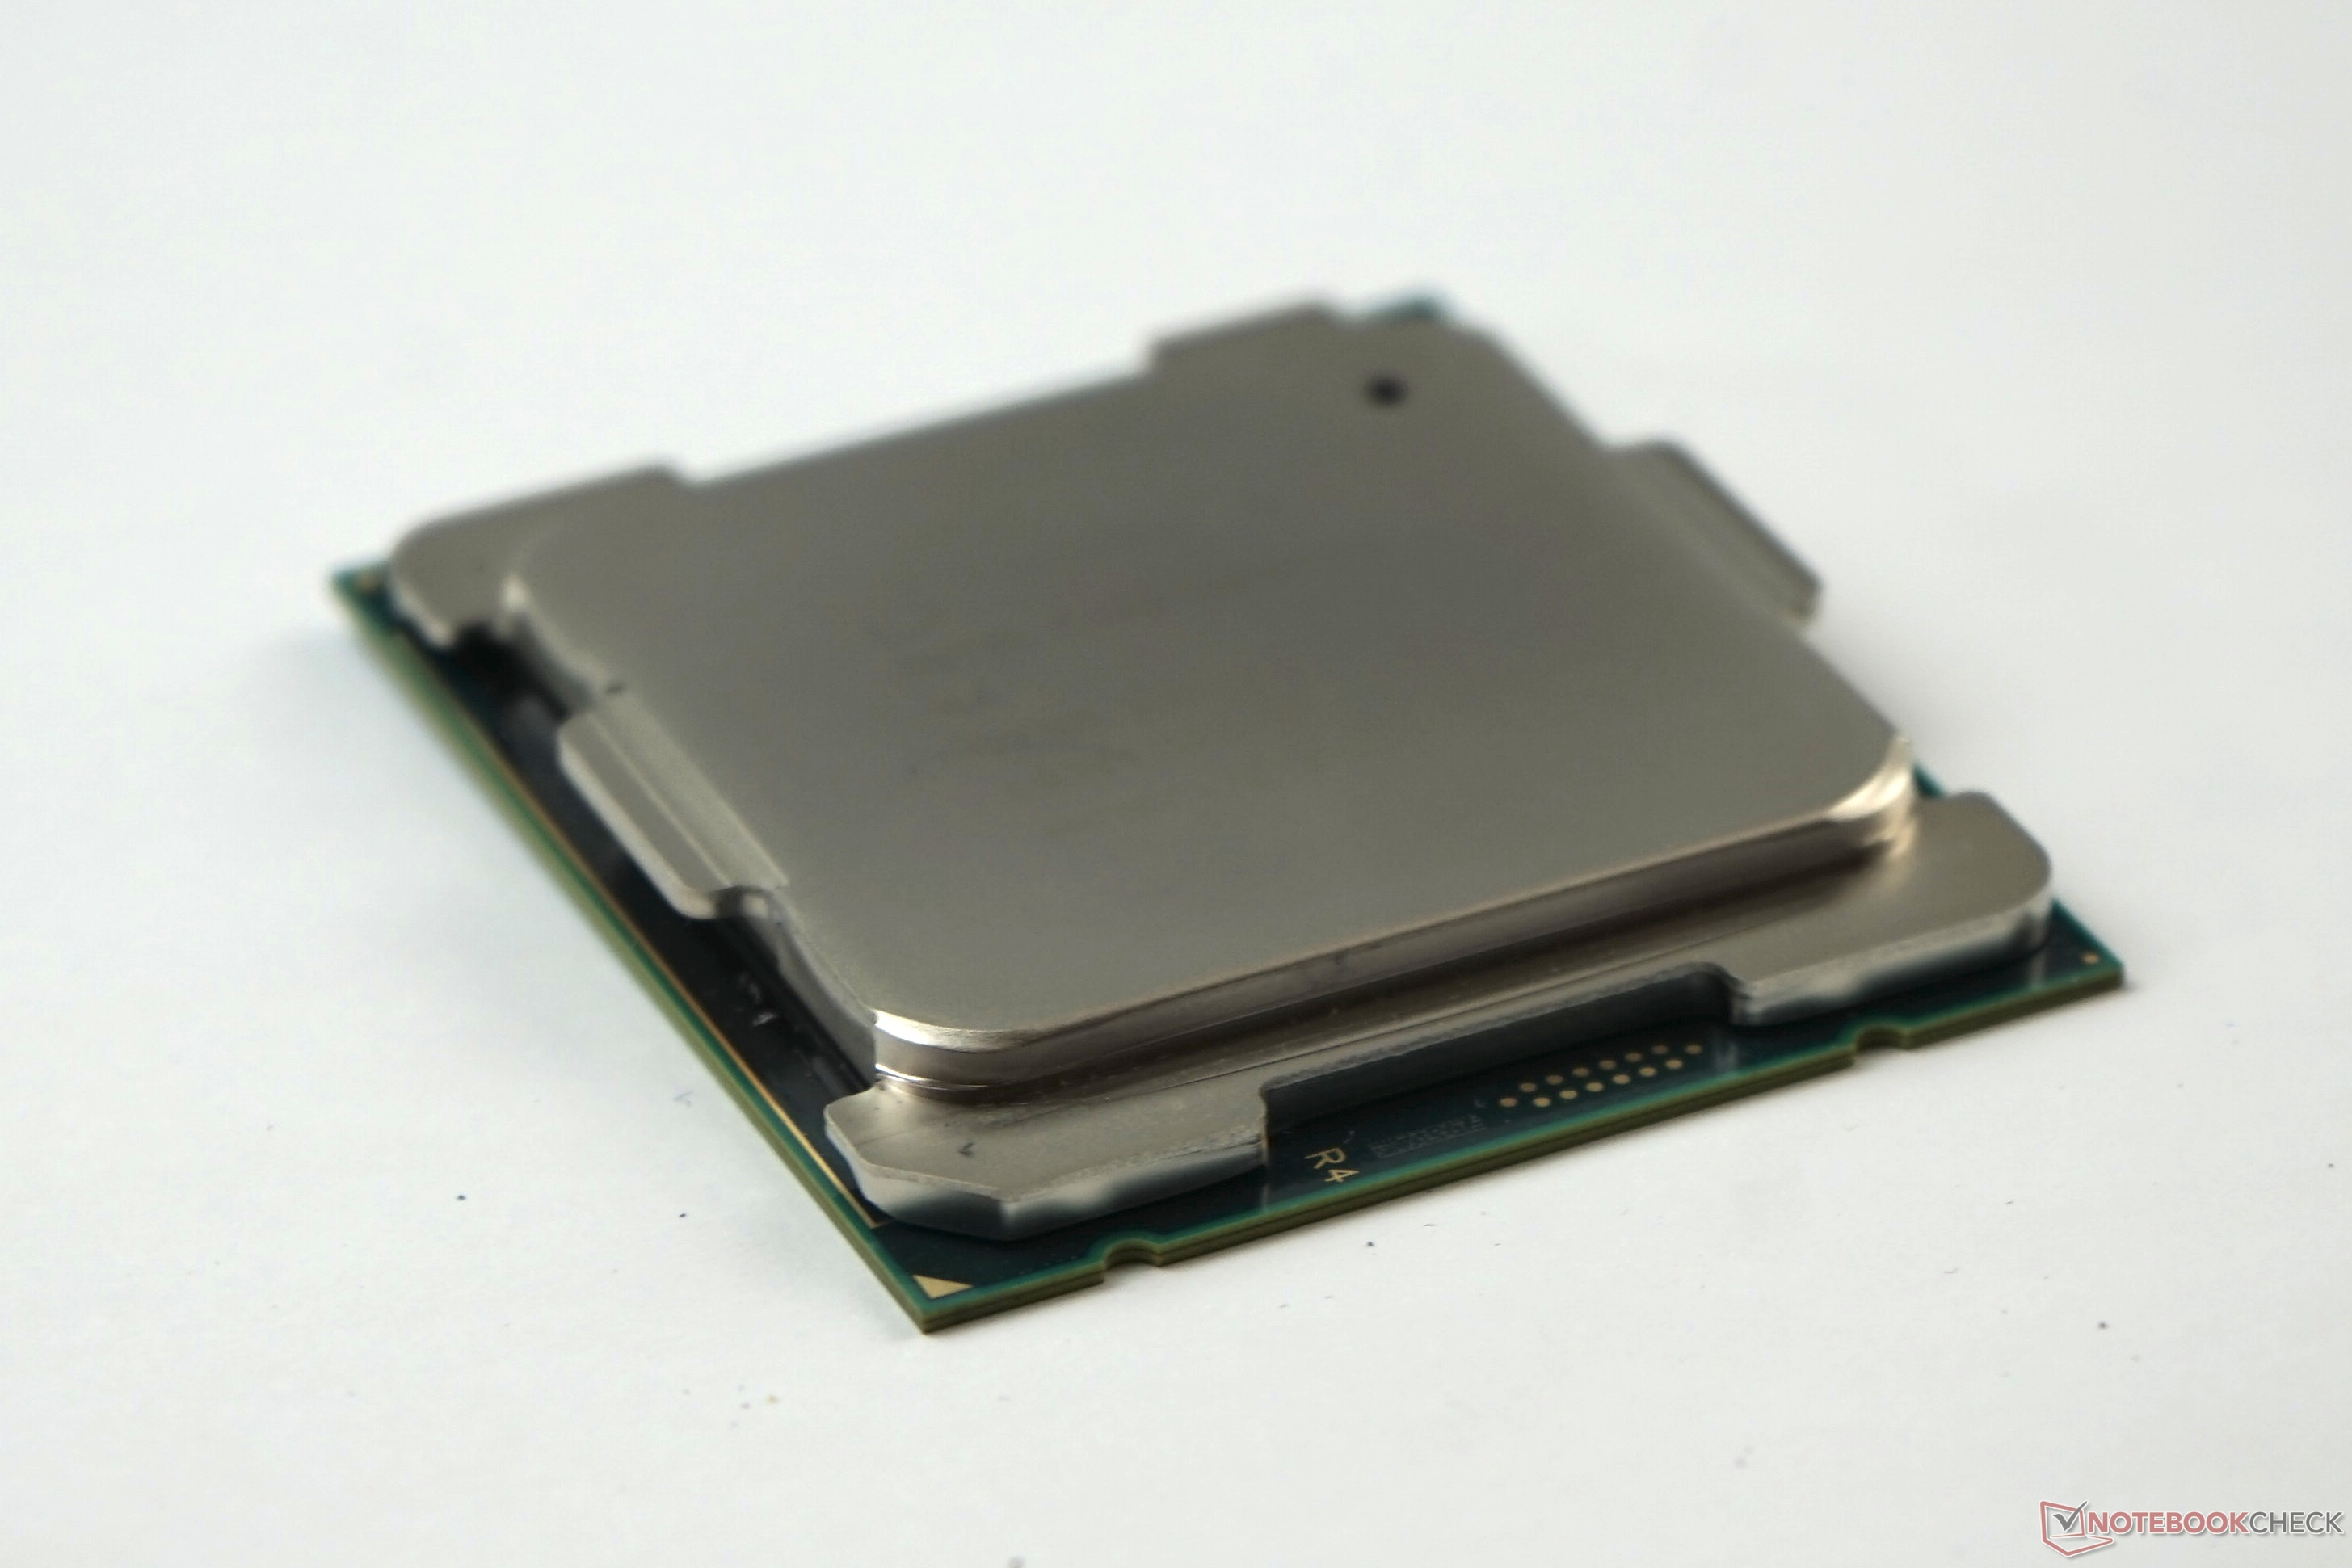
L'Intel Core i9-10980XE è un processore desktop / workstation di fascia alta basato sulla serie Cascade Lake-X. Esso integra 18 core di processore che effettuano il clock tra 3 e 4,6 GHz (Turbo Boost 3.0). Rispetto al i9-9980XE, il 10980XE ha aumentato la velocità del Turbo clock di 200 MHz e offre istruzioni aggiuntive AVX-512 per piccoli tipi di dati (8 Bit e 16 Bit interi). L'architettura di base è ancora simile a quella di Skylake. Grazie a HyperThreading la CPU può gestire fino a 36 thread contemporaneamente. I singoli core sono collegati da una mesh al posto del bus ad anello nelle CPU consumer.
Le prestazioni nelle applicazioni multi-threaded della CPU a 18 core sono eccellenti, tuttavia nei giochi e nei carichi di lavoro con meno thread, le CPU consumer con clock veloce come il Core i9-9900K sono più veloci.
Nome in codice Cascade Lake Serie Intel Core i9 (Desktop) Clock Rate 3000 - 4600 MHz Level 1 Cache 1.1 MB Level 2 Cache 18 MB Level 3 Cache 24.8 MB Numero di Cores / Threads 18 / 36 Consumo energetico (TDP = Thermal Design Power) 165 Watt Tecnologia del produttore 14 nm Temperatura massima 86 °C Socket FCLGA-2066 (LGA) Features Quad-Channel DDR4-2933 Memory Controller, HyperThreading, AVX, AVX2, AES-NI, TSX-NI, Quick Sync, Virtualization, vPro 64 Bit Supporto 64 Bit Architecture x86 Prezzo base $979 U.S. Data di annuncio 10/02/2019 Collegamento Prodotto (esterno) ark.intel.com
Performance Rating - CB R15 + R20 + 7-Zip + X265 + Blender + 3DM11 CPU
Cinebench R20 - Cinebench R20 CPU (Single Core)
min: 487 media: 489.5 media: 489.5 (53%) massimo: 492 Points
...
AMD Ryzen Threadripper PRO 3995WX
AMD Ryzen 9 3900
Intel Core i7-1180G7
Intel Core i7-8086K
...
Cinebench R20 - Cinebench R20 CPU (Multi Core)
min: 8220 media: 8533 media: 8532.5 (21%) massimo: 8845 Points
...
Intel Core i7-12700
AMD Ryzen 7 9850X3D
...
Cinebench R15 - Cinebench R15 CPU Multi 64 Bit
min: 3632 media: 3712 media: 3744 (24%) massimo: 3761 Points
...
AMD Ryzen 7 9850X3D
Intel Core Ultra 5 245K
...
0 80 160 240 320 400 480 560 640 720 800 880 960 1040 1120 1200 1280 1360 1440 1520 1600 1680 1760 1840 1920 2000 2080 2160 2240 2320 2400 2480 2560 2640 2720 2800 2880 2960 3040 3120 3200 3280 3360 3440 3520 3600 3680 3760 Tooltip Asus X299 Prime Desktop: Ø3596 (3541.7-3632.07)
Asus X299 Prime Desktop DDR4-3200: Ø3704 (3571.43-3760.81)
Cinebench R15 - Cinebench R15 CPU Single 64 Bit
min: 204 media: 207.3 media: 208 (57%) massimo: 210 Points
...
AMD Ryzen 7 3700X
Intel Core i7-8086K
AMD Ryzen 9 3900X
Apple M1
...
Intel Core Ultra 9 285K
Cinebench R11.5 - Cinebench R11.5 CPU Multi 64 Bit
...
Intel Core i7-12700
AMD Ryzen 7 9850X3D
...
Cinebench R11.5 - Cinebench R11.5 CPU Single 64 Bit
...
Intel Core i7-8086K
AMD Ryzen 7 3700X
AMD Ryzen 9 3900X
...
Intel Core Ultra 9 285K
Cinebench R10 - Cinebench R10 Rend. Single (32bit)
AMD Geode LX 800
...
Intel Xeon E-2176M
Intel Core i5-1140G7
...
Cinebench R10 - Cinebench R10 Rend. Multi (32bit)
...
Intel Core i7-12700
AMD Ryzen 7 9850X3D
...
wPrime 2.10 - wPrime 2.0 1024m *
...
Intel Core Ultra 9 285K
AMD Ryzen Threadripper 2950X
AMD Ryzen 7 9850X3D
AMD Ryzen Threadripper 1950X
Intel Core Ultra 5 250K Plus
...
VIA C3-M C3-M-1200
wPrime 2.10 - wPrime 2.0 32m *
...
AMD Ryzen 9 3900X
Intel Core i7-12700
Intel Core i9-7900X
Intel Core Ultra 5 245K
...
WinRAR - WinRAR 4.0
...
Intel Core i7-5960X
AMD Ryzen 9 3900
Intel Core i7-8700K
Intel Xeon E5-2697 v2
...
7-Zip 18.03 - 7-Zip 18.03 Multi Thread 4 runs
min: 93061 media: 93077 media: 93076.5 (53%) massimo: 93092 MIPS
...
AMD Ryzen 7 9850X3D
...
7-Zip 18.03 - 7-Zip 18.03 Single Thread 4 runs
min: 5333 media: 5371 media: 5370.5 (61%) massimo: 5408 MIPS
...
AMD Ryzen 9 3900X
...
AMD Ryzen 7 9850X3D
X264 HD Benchmark 4.0 - x264 Pass 2
Intel Pentium 4 2.4 GHz
...
Intel Core i7-12700
...
X264 HD Benchmark 4.0 - x264 Pass 1
...
Intel Core i5-8500
AMD Ryzen 5 2600X
AMD Ryzen Threadripper 2920X
Intel Core i7-9750H
Intel Core i9-7900X
...
HWBOT x265 Benchmark v2.2 - HWBOT x265 4k Preset
min: 26.2 media: 27 media: 27 (47%) massimo: 27.8 fps
...
Intel Core i7-12700
Intel Core Ultra 5 245K
...
0 5 10 15 20 25 30 35 Tooltip Asus X299 Prime Desktop DDR4-3200: Ø25.8 (1.21-33.3)
Asus X299 Prime Desktop: Ø27.2 (1.25-35.2)
TrueCrypt - TrueCrypt Serpent
...
AMD Ryzen Threadripper 2950X
AMD Ryzen Threadripper 1950X
Intel Core Ultra 5 250K Plus
AMD Ryzen Threadripper 2970WX
...
TrueCrypt - TrueCrypt Twofish
...
AMD Ryzen 7 9850X3D
Intel Core Ultra 5 245K
AMD Ryzen Threadripper 2970WX
...
TrueCrypt - TrueCrypt AES
...
Intel Core Ultra 5 250K Plus
AMD Ryzen 7 9850X3D
AMD Ryzen Threadripper 1950X
...
Blender - Blender 2.79 BMW27 CPU *
min: 125 media: 130 media: 130 (1%) massimo: 135 Seconds
Intel Core i5-1038NG7
...
Intel Core Ultra 5 245K
AMD Ryzen 7 9850X3D
...
3DMark 06 - CPU - 3DMark 06 - CPU
VIA C7-M C7-M-1200
...
AMD Ryzen 7 3700X
AMD Ryzen 9 3900
...
Super Pi mod 1.5 XS 1M - Super Pi mod 1.5 XS 1M *
...
Intel Core i7-4790K
AMD Ryzen 9 9955HX3D
...
VIA C3-M C3-M-1200
Super Pi mod 1.5 XS 2M - Super Pi mod 1.5 XS 2M *
...
Intel Core i7-12700
AMD Ryzen 9 9955HX
...
Super Pi Mod 1.5 XS 32M - Super Pi mod 1.5 XS 32M *
3DMark 11 - 3DM11 Performance Physics
AMD E-240
...
...
AMD Ryzen 9 9950X3D
3DMark - 3DMark Ice Storm Unlimited Physics
Qualcomm Snapdragon S4 Play MSM8625Q
...
Intel Xeon E3-1230 v3
Intel Core i5-8305G
Intel Core i7-7700HQ
Intel Core i5-7360U
Intel Core i5-1035G4
...
Intel Core Ultra 5 250K Plus
3DMark - 3DMark Cloud Gate Physics
...
AMD Ryzen Threadripper PRO 3995WX
...
3DMark - 3DMark Fire Strike Standard Physics
3DMark - 3DMark Time Spy CPU
Geekbench 6.7 - Geekbench 6.7.1 Single-Core
modello CPU GPU RAM Valutazione Apple Mac Pro (Late 2019) i9-10980XE 1593
...
Intel Xeon E-2186M
Qualcomm Snapdragon G3x Gen 1
Intel Core i5-1035G7
AMD Ryzen 5 7235HS
...
Apple M5 Pro 15-Core
Geekbench 6.7 - Geekbench 6.7.1 Multi-Core
modello CPU GPU RAM Valutazione Apple Mac Pro (Late 2019) i9-10980XE 11650
Mediatek Helio A22 MT6761
...
Qualcomm Snapdragon 8 Elite Gen 5 for Galaxy
...
Apple M5 Max
Geekbench 5.5 - Geekbench 5.1 - 5.5 64 Bit Single-Core
...
Intel Core i7-8086K
AMD Ryzen 9 3900
Intel Xeon E-2186M
AMD Ryzen 9 3900X
Intel Core i5-1038NG7
Intel Core i7-7740X
Intel Core i7-1065G7
AMD Ryzen Threadripper PRO 3975WX
...
Apple M5 10-Core
Geekbench 5.5 - Geekbench 5.1 - 5.5 64 Bit Multi-Core
...
Apple M5 10-Core
AMD Ryzen 7 9850X3D
...
Geekbench 5.0 - Geekbench 5.0 64 Bit Single-Core
min: 1208 media: 1240 media: 1239.5 (5%) massimo: 1271 punti
...
Intel Core i5-1035G4
AMD Ryzen 9 3900
AMD Ryzen 9 3900X
Intel Core i7-7740X
AMD Ryzen Threadripper PRO 3995WX
...
AMD Ryzen 7 9850X3D
Geekbench 5.0 - Geekbench 5.0 64 Bit Multi-Core
min: 15598 media: 15744 media: 15743.5 (50%) massimo: 15889 punti
...
Intel Core i7-12700
AMD Ryzen 7 9850X3D
...
AMD Ryzen Threadripper PRO 3995WX
Geekbench 4.4 - Geekbench 4.1 - 4.4 64 Bit Single-Core
min: 5769 media: 5795 media: 5794.5 (53%) massimo: 5820 punti
...
Intel Core i7-10700
Intel Core i7-7740X
AMD Ryzen Threadripper PRO 3975WX
AMD Ryzen 7 3700X
Intel Core i7-8086K
Intel Core i7-8700K
...
Samsung Exynos 2600
Geekbench 4.4 - Geekbench 4.1 - 4.4 64 Bit Multi-Core
min: 50801 media: 54223 media: 54222.5 (52%) massimo: 57644 punti
...
Intel Core i7-12700
...
Geekbench 3 - Geekbench 3 32 Bit Multi-Core
Samsung Hummingbird S5PC110 / Exynos 3110
...
Intel Core i7-8700
AMD Ryzen 7 1700
Intel Xeon E5-2680 v4
AMD Ryzen 7 1800X
Intel Core i7-6950X
Geekbench 3 - Geekbench 3 32 Bit Single-Core
Samsung Hummingbird S5PC110 / Exynos 3110
...
Intel Core i5-8600K
Intel Core i7-6700K
Intel Core i7-9750H
Intel Core i7-4790K
Intel Core i7-8700
Intel Core i7-7740X
Intel Core i5-1230U
Geekbench 3 - Geekbench 3 64 Bit Multi-Core
...
Intel Core i7-8700
Intel Core i5-1230U
AMD Ryzen 7 1700
Intel Core i7-8700K
AMD Ryzen 7 1700X
Intel Xeon E5-2680 v4
Intel Core i7-6950X
Intel Core i9-7900X
Geekbench 3 - Geekbench 3 64 Bit Single-Core
...
Intel Core i9-7900X
Intel Core i5-8600K
Intel Core i5-7600K
Intel Core i7-8559U
Intel Core i7-6700K
Intel Core i7-8700
Intel Core i7-7740X
Intel Core i7-8700K
Intel Core i5-1230U
...
Geekbench 2 - 32 Bit - Geekbench Stream
Qualcomm Snapdragon S1 MSM7227
...
Intel Core i7-8559U
Intel Core i5-6360U
Intel Core i7-4790K
AMD Ryzen 7 1800X
Intel Core i5-8265U
AMD Ryzen 5 1500X
Intel Core i7-7740X
...
Geekbench 2 - 32 Bit - Geekbench Memory
Qualcomm Snapdragon S1 MSM7227
...
AMD Ryzen 5 1500X
Intel Core i9-7900X
Intel Core i5-8265U
Intel Core i7-4790K
Intel Core i7-8559U
Intel Core i7-7740X
Geekbench 2 - 32 Bit - Geekbench Floating Point
Qualcomm Snapdragon S1 MSM7227
...
AMD Ryzen 5 1600
AMD Ryzen 7 1700X
AMD Ryzen 7 1800X
Intel Core i7-6950X
Intel Core i9-7900X
Geekbench 2 - 32 Bit - Geekbench Integer
Qualcomm Snapdragon S1 MSM7227
...
AMD Ryzen 5 1600
AMD Ryzen 7 1700X
AMD Ryzen 7 1800X
Intel Core i7-6950X
Intel Core i9-7900X
Geekbench 2 - 32 Bit - Geekbench Total Score
Qualcomm Snapdragon S1 MSM7227
...
AMD Ryzen 5 1600
AMD Ryzen 7 1700
AMD Ryzen 7 1700X
AMD Ryzen 7 1800X
Intel Core i7-6950X
Intel Core i9-7900X
Mozilla Kraken 1.1 - Kraken 1.1 Total Score *
Apple M5 Pro 18-Core
...
Intel Core i5-1035G1
AMD Ryzen 7 1800X
AMD Ryzen 5 2600
Intel Core i5-1035G7
...
Sunspider - Sunspider 1.0 Total Score *
...
Intel Core i7-6950X
Intel Core i7-4712HQ
...
Octane V2 - Octane V2 Total Score
...
Intel Core i5-7267U
Intel Core i7-6700K
Intel Core i5-7360U
Intel Xeon E3-1280 v5
...
Apple M5 Pro 18-Core
WebXPRT 3 - WebXPRT 3 Score
Mediatek MT8321
...
Intel Core i5-1230U
Intel Core Ultra 5 115U
Intel Core i7-1180G7
...
Apple M5 Pro 18-Core
Power Consumption - Prime95 Power Consumption - external Monitor *
...
Intel Core i7-4790K
Intel Core i9-7900X
Intel Core i5-12400F
Intel Core Ultra 5 250K Plus
AMD Ryzen 7 9850X3D
Intel Core Ultra 5 245K
...
AMD Ryzen Threadripper PRO 3975WX
Power Consumption - Cinebench R15 Multi Power Consumption - external Monitor *
...
AMD Ryzen Threadripper 2920X
Intel Core i7-12700
AMD Ryzen 9 9950X3D
AMD Ryzen Threadripper PRO 3995WX
...
Power Consumption - Power Efficiency - Cinebench R15 Multi external Monitor
11.9 Points per Watt (9%)
...
AMD Ryzen Threadripper 2970WX
AMD Ryzen Threadripper 2950X
AMD Ryzen 7 3700X
Intel Atom x7-E3950
...
- Valori di benchmark per questa scheda grafica
- Valori medi di benchmark per questa scheda grafica
* Numeri più piccoli rappresentano prestazioni supeiori
log 30. 16:28:01
#0 ran 0s before starting gpusingle class +0s ... 0s
#1 no ids found in url (should be separated by "_") +0s ... 0s
#2 not redirecting to Ajax server +0s ... 0s
#3 did not recreate cache, as it is less than 5 days old! Created at Tue, 28 Jul 2026 05:30:19 +0200 +0.002s ... 0.002s
#4 composed specs +0.006s ... 0.008s
#5 did output specs +0s ... 0.008s
#6 getting avg benchmarks for device 11561 +0.029s ... 0.037s
#7 got single benchmarks 11561 +0.007s ... 0.045s
#8 got avg benchmarks for devices +0s ... 0.045s
#9 min, max, avg, median took s +2.531s ... 2.576s
#10 no comparison url found in template nbc.compare_page_2 needed +0.569s ... 3.145s
#11 return log +0s ... 3.145s