Recensione del convertibile Chuwi Hi10 Max - Un'alternativa economica al Surface Pro con CPU Intel
Intel Processor N100 | Intel UHD Graphics 24EUs (Alder Lake-N) | 12.96" | 768 gr

Il processore Intel N100 è una CPU mobile entry-level per computer portatili sottili e leggeri, appartenente alla serie Alder Lake-N. È stato annunciato all'inizio del 2023 e offre nessun core di prestazioni e 4 degli 8 core efficienti (E-cores, architettura Gracemont). Il chip non supporta l'HyperThreading e si blocca da 1 a 3,4 GHz. Le prestazioni degli E-cores dovrebbero essere simili a quelle dei vecchi core Skylake (paragonate a quelle del Core i7-6700HQ). Tutti i core possono utilizzare fino a 6 MB di cache L3.
Prestazioni
L'N100 medio nel nostro database offre punteggi di benchmark multi-thread poco impressionanti, molto simili a quelli dei Core i3-1115G4 Core i3-1115G4. Il chip è abbastanza veloce per molte attività quotidiane, ma non molto di più; l'altra cosa da tenere presente è che dei due sistemi con N100 da noi testati a ottobre 2023, entrambi hanno limiti di potenza della CPU piuttosto elevati. Il chip sarà notevolmente più lento se limitato a soli sei o sette Watt.
Caratteristiche
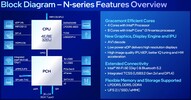
I chip Alder Lake-N supportano solo la memoria a canale singolo fino a DDR5-4800, DDR4-3200 o LPDDR5-4800. Il chip supporta anche Quick Sync e la decodifica AV1 (molto probabilmente lo stesso motore di Alder Lake). Inoltre, Wi-Fi 6E e Bluetooth 5.2 sono parzialmente integrati (ma non Thunderbolt). I chip esterni possono essere collegati tramite PCIe Gen3 x9 (tramite il PCH).
L'adattatore grafico integrato si basa sull'architettura Xe e offre solo 24 delle 32 EU (Execution Unit) che operano a soli 450 - 750 MHz. A causa della memoria a canale singolo, delle basse velocità di clock e del basso numero di shader, le prestazioni di gioco dell'iGPU sono molto limitate.
Consumo di energia
L'N100 ha un consumo energetico di base di soli 6 W ed è quindi adatto al raffreddamento senza ventola. La CPU è costruita con un processo SuperFin a 10 nm ulteriormente migliorato da Intel (chiamato Intel 7).
| Nome in codice | Alder Lake-N | ||||||||||||||||||||||||||||
| Serie | Intel Alder Lake-N | ||||||||||||||||||||||||||||
Serie: Alder Lake-N Alder Lake-N
| |||||||||||||||||||||||||||||
| Clock Rate | 1000 - 3400 MHz | ||||||||||||||||||||||||||||
| Level 3 Cache | 6 MB | ||||||||||||||||||||||||||||
| Numero di Cores / Threads | 4 / 4 4 x 3.4 GHz Intel Crestmont E-Core | ||||||||||||||||||||||||||||
| Consumo energetico (TDP = Thermal Design Power) | 6 Watt | ||||||||||||||||||||||||||||
| Tecnologia del produttore | 10 nm | ||||||||||||||||||||||||||||
| Temperatura massima | 105 °C | ||||||||||||||||||||||||||||
| Socket | BGA1264 | ||||||||||||||||||||||||||||
| Features | DDR4-3200/DDR5-4800/LPDDR5-4800 RAM (sin. chan.), PCIe 3, GNA, MMX, SSE, SSE2, SSE3, SSSE3, SSE4.1, SSE4.2, AVX, AVX2, BMI2, ABM, FMA, ADX, VMX, SMEP, SMAP, EIST, TM1, TM2, Turbo, SST, AES-NI, RDRAND, RDSEED, SHA | ||||||||||||||||||||||||||||
| GPU | Intel UHD Graphics 24EUs (Alder Lake-N) ( - 750 MHz) | ||||||||||||||||||||||||||||
| 64 Bit | Supporto 64 Bit | ||||||||||||||||||||||||||||
| Architecture | x86 | ||||||||||||||||||||||||||||
| Prezzo base | $128 U.S. | ||||||||||||||||||||||||||||
| Data di annuncio | 01/03/2023 | ||||||||||||||||||||||||||||
| Collegamento Prodotto (esterno) | ark.intel.com | ||||||||||||||||||||||||||||


Geekom MiniAir 12: Intel UHD Graphics 24EUs (Alder Lake-N), 0.5 kg
recensione » Recensione del Geekom MiniAir 12: Un mini PC economico con Intel N100 e RAM DDR5, con il noto design di un Intel NUC
Trigkey G4: Intel UHD Graphics 24EUs (Alder Lake-N), 0.3 kg
recensione » Test del Trigkey Mini-PC con Intel N100 e 16 GB di RAM e 500 GB di SSD: Mini-PC Trigkey a meno di 200 dollari
Dell Chromebook 3120: Intel UHD Graphics 24EUs (Alder Lake-N), 11.60", 1.4 kg
Recensioni esterne » Dell Chromebook 3120
Chuwi Hi10 X1: Intel UHD Graphics 24EUs (Alder Lake-N), 10.10", 0.6 kg
Recensioni esterne » Chuwi Hi10 X1
Chuwi FreeBook N100: Intel UHD Graphics 24EUs (Alder Lake-N), 13.50", 1.3 kg
Recensioni esterne » Chuwi FreeBook N100
Chuwi Hi10 Max: Intel UHD Graphics 24EUs (Alder Lake-N), 12.96", 0.8 kg
Recensioni esterne » Chuwi Hi10 Max
Acer Aspire Lite 14 AL14-31P: Intel UHD Graphics 24EUs (Alder Lake-N), 14.00", 1.5 kg
Recensioni esterne » Acer Aspire Lite 14 AL14-31P
Lenovo IdeaPad Duet 3 11IAN8, Intel N100: Intel UHD Graphics 24EUs (Alder Lake-N), 11.50", 0.7 kg
Recensioni esterne » Lenovo IdeaPad Duet 3 11IAN8, Intel N100
Chuwi GemiBook Plus: Intel UHD Graphics 24EUs (Alder Lake-N), 15.60", 1.8 kg
Recensioni esterne » Chuwi GemiBook Plus
Chuwi Minibook X 2023: Intel UHD Graphics 24EUs (Alder Lake-N), 10.50", 0.9 kg
Recensioni esterne » Chuwi Minibook X 2023
Lenovo IdeaPad Flex 3 Chrome 12IAN8, Intel N100: Intel UHD Graphics 24EUs (Alder Lake-N), 12.20", 1.3 kg
Recensioni esterne » Lenovo IdeaPad Flex 3 Chrome 12IAN8, Intel N100
Chuwi Gemibook XPro: Intel UHD Graphics 24EUs (Alder Lake-N), 14.10", 1.5 kg
Recensioni esterne » Chuwi Gemibook XPro
Asus BR1104CGA-N00007XA: Intel UHD Graphics 24EUs (Alder Lake-N), 11.60", 1.6 kg
» Campione di efficienza energetica: Il laptop didattico Asus ExpertBook BR1104CGA riceve il trattamento Intel N100
» Confronto CPU Mobile
Confronto di tutte le serie di CPU mobile
» Processori Mobile - Elenco Benchmark
Elenco Benchmark di tutte le CPUs conosciute, usate nei portatili (CPUs desktop e portatili)
I nostri Top 10
» Top 10 Portatili Multimedia
» Top 10 Portatili Gaming
» Top 10 Portatili Gaming Leggeri
» Top 10 Portatili da Ufficio e Business economici
» Top 10 Portatili Premium da Ufficio/Business
» Top 10 Portatili sotto i 300 Euro
» Top 10 Portatili sotto i 500 Euro
» Top 10 dei Portatili Workstation
» Top 10 Subnotebooks
» Top 10 Ultrabooks
» Top 10 Convertibili
» Top 10 Tablets
» Top 10 Tablets Windows
» Top 10 Smartphones