

Un mostro di archiviazione da 88 TB messo alla prova: l'Aoostar WTR Pro è un NAS e un mini PC in un'unica soluzione
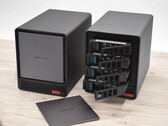
Un potente ibrido NAS e Mini-PC che può essere utilizzato in modo flessibile ed è adatto a compiti sia semplici che impegnativi: questo è esattamente ciò che promette Aoostar WTR Pro. Con due varianti di processore, l'economico Intel N100 e il potente AMD Ryzen 7 5825U, il dispositivo si rivolge a diversi gruppi di utenti. Abbiamo testato Aoostar WTR Pro e verificato le sue prestazioni, il livello di rumore e l'efficienza energetica.
Intel Processor N150, UHD Graphics 24EUs (Alder Lake-N), 3.8 kg