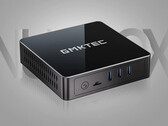


Recensione dell'Higole PC Stick: Il PC stick più piccolo del mondo ha un Intel Celeron J4125, 8 GB di RAM e un SSD da 128 GB
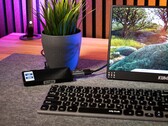
I PC non devono sempre essere grandi e ingombranti. Molti mini PC che abbiamo testato in precedenza lo hanno dimostrato. Il produttore di Higole PC Stick ha fatto un ulteriore passo avanti, riuscendo a inserire l'intero hardware del PC in un case che ricorda una chiavetta USB sovradimensionata. Abbiamo dato un'occhiata più da vicino al dispositivo e alle capacità del suo Intel Celeron J4125.
Intel Celeron J4125, UHD Graphics 600, 108 gr