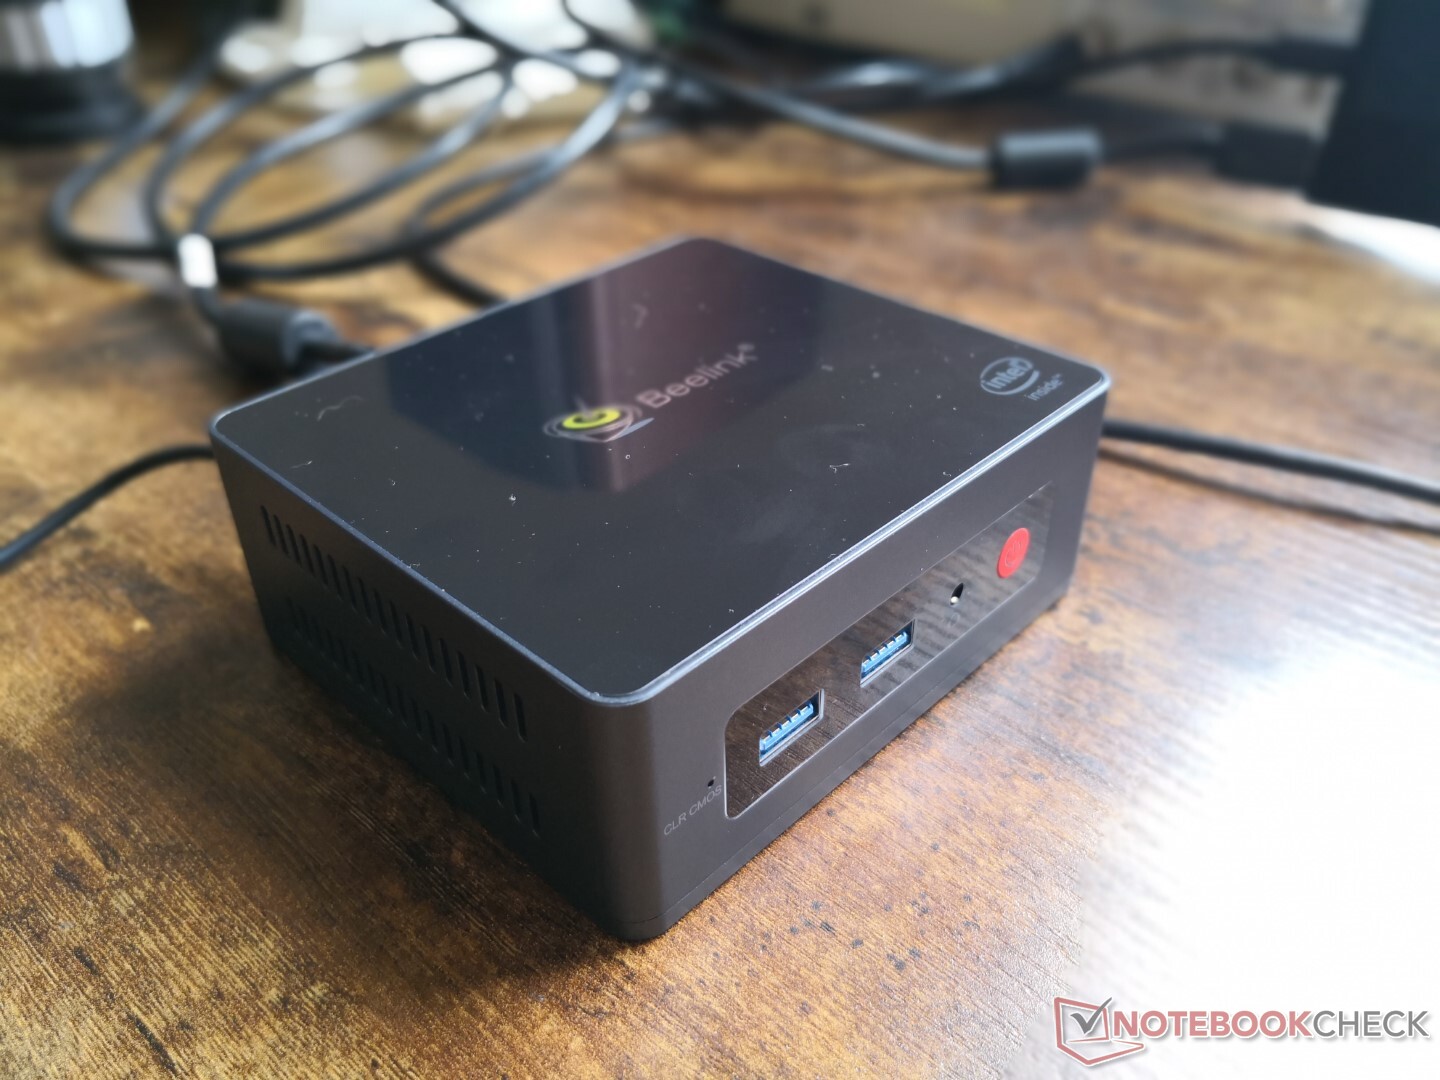
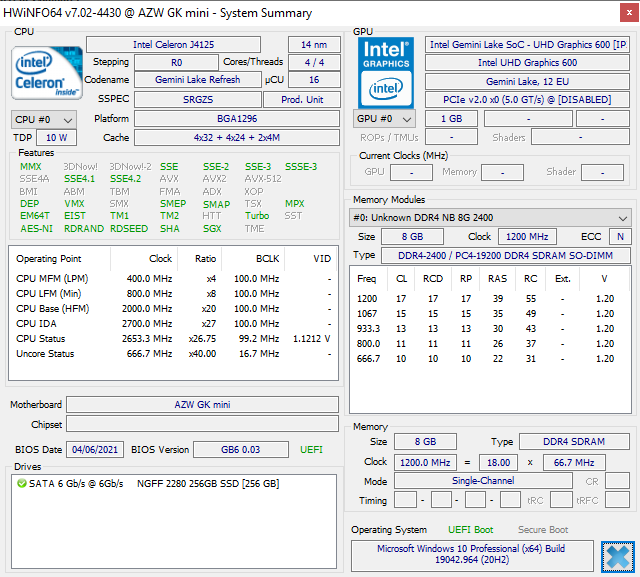
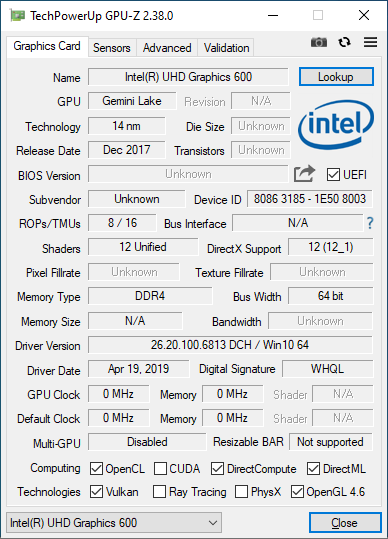
Recensione del Mini PC Beelink GK: HTPC pronto all'uso
Confronto con i potenziali concorrenti
Punteggio | Data | Modello | Peso | Altezza | Dimensione | Risoluzione | Prezzo |
|---|---|---|---|---|---|---|---|
v (old) | 05/2021 | Beelink GK Mini Celeron J4125, UHD Graphics 600 | 269 gr | 43 mm | x | ||
v (old) | 04/2021 | Intel NUC11TNKi5 i5-1135G7, Iris Xe G7 80EUs | 504 gr | 37 mm | x | ||
v (old) | 03/2021 | GMK NucBox 2 i5-8259U, Iris Plus Graphics 655 | 430 gr | 50 mm | x | ||
v (old) | 12/2020 | Beelink SEi10 i3-1005G1, UHD Graphics G1 (Ice Lake 32 EU) | 350 gr | 41 mm | x | ||
v (old) | 09/2018 | Zotac ZBOX-CI660 Nano i5-8550U, UHD Graphics 620 | 1.1 kg | 68 mm | x | ||
v (old) | 02/2021 | Intel NUC11PAQi7 i7-1165G7, Iris Xe G7 96EUs | 647 gr | 56 mm | x |
| Networking | |
| iperf3 transmit AX12 | |
| Intel NUC11TNKi5 | |
| Beelink SEi10 | |
| Intel NUC11PAQi7 | |
| GMK NucBox 2 | |
| Zotac ZBOX-CI660 Nano | |
| Beelink GK Mini | |
| iperf3 receive AX12 | |
| Intel NUC11TNKi5 | |
| Beelink SEi10 | |
| Intel NUC11PAQi7 | |
| GMK NucBox 2 | |
| Beelink GK Mini | |
| Zotac ZBOX-CI660 Nano | |
Cinebench R23: Multi Core | Single Core
Cinebench R15: CPU Multi 64Bit | CPU Single 64Bit
Blender: v2.79 BMW27 CPU
7-Zip 18.03: 7z b 4 -mmt1 | 7z b 4
Geekbench 5.5: Single-Core | Multi-Core
HWBOT x265 Benchmark v2.2: 4k Preset
LibreOffice : 20 Documents To PDF
R Benchmark 2.5: Overall mean
| Cinebench R20 / CPU (Multi Core) | |
| Intel NUC11PAQi7 | |
| Intel NUC11TNKi5 | |
| Acer Swift 3 SF314-42-R27B | |
| GMK NucBox 2 | |
| Fujitsu Lifebook U939 i5 | |
| Dell Inspiron 15 5000 5502 | |
| Dell Latitude 15 3510 NK2MC | |
| Beelink SEi10 | |
| Asus Vivobook 15 F512DA-SH31 | |
| Beelink GK Mini | |
| Chuwi LarkBook CWI509 | |
| Media Intel Celeron J4125 (304 - 610, n=5) | |
| LincPlus P1 | |
| Chuwi LapBook Plus | |
| Cinebench R20 / CPU (Single Core) | |
| Intel NUC11PAQi7 | |
| Dell Inspiron 15 5000 5502 | |
| Intel NUC11TNKi5 | |
| Acer Swift 3 SF314-42-R27B | |
| Dell Latitude 15 3510 NK2MC | |
| Beelink SEi10 | |
| GMK NucBox 2 | |
| Fujitsu Lifebook U939 i5 | |
| Asus Vivobook 15 F512DA-SH31 | |
| Beelink GK Mini | |
| Media Intel Celeron J4125 (155 - 174, n=5) | |
| Chuwi LarkBook CWI509 | |
| LincPlus P1 | |
| Chuwi LapBook Plus | |
| Cinebench R23 / Multi Core | |
| Intel NUC11PAQi7 | |
| Intel NUC11TNKi5 | |
| GMK NucBox 2 | |
| Dell Latitude 15 3510 NK2MC | |
| Beelink GK Mini | |
| Chuwi LarkBook CWI509 | |
| Media Intel Celeron J4125 (860 - 1563, n=3) | |
| Cinebench R23 / Single Core | |
| Intel NUC11TNKi5 | |
| Dell Latitude 15 3510 NK2MC | |
| GMK NucBox 2 | |
| Beelink GK Mini | |
| Media Intel Celeron J4125 (392 - 446, n=3) | |
| Blender / v2.79 BMW27 CPU | |
| LincPlus P1 | |
| Chuwi LapBook Plus | |
| Media Intel Celeron J4125 (2198 - 3860, n=5) | |
| Beelink GK Mini | |
| Asus Vivobook 15 F512DA-SH31 | |
| Dell Inspiron 15 5000 5502 | |
| Dell Latitude 15 3510 NK2MC | |
| Beelink SEi10 | |
| Fujitsu Lifebook U939 i5 | |
| Acer Swift 3 SF314-42-R27B | |
| GMK NucBox 2 | |
| Intel NUC11TNKi5 | |
| Intel NUC11PAQi7 | |
| 7-Zip 18.03 / 7z b 4 -mmt1 | |
| Intel NUC11PAQi7 | |
| Intel NUC11TNKi5 | |
| Dell Inspiron 15 5000 5502 | |
| Beelink SEi10 | |
| Dell Latitude 15 3510 NK2MC | |
| Acer Swift 3 SF314-42-R27B | |
| Fujitsu Lifebook U939 i5 | |
| GMK NucBox 2 | |
| Asus Vivobook 15 F512DA-SH31 | |
| Beelink GK Mini | |
| Media Intel Celeron J4125 (2237 - 2444, n=5) | |
| LincPlus P1 | |
| Chuwi LarkBook CWI509 | |
| Chuwi LapBook Plus | |
| Geekbench 5.5 / Single-Core | |
| Intel NUC11PAQi7 | |
| Intel NUC11TNKi5 | |
| Dell Inspiron 15 5000 5502 | |
| Beelink SEi10 | |
| Fujitsu Lifebook U939 i5 | |
| Acer Swift 3 SF314-42-R27B | |
| GMK NucBox 2 | |
| Dell Latitude 15 3510 NK2MC | |
| Asus Vivobook 15 F512DA-SH31 | |
| Beelink GK Mini | |
| Media Intel Celeron J4125 (435 - 466, n=5) | |
| Chuwi LarkBook CWI509 | |
| LincPlus P1 | |
| Geekbench 5.5 / Multi-Core | |
| Intel NUC11PAQi7 | |
| Intel NUC11TNKi5 | |
| Fujitsu Lifebook U939 i5 | |
| GMK NucBox 2 | |
| Acer Swift 3 SF314-42-R27B | |
| Dell Inspiron 15 5000 5502 | |
| Beelink SEi10 | |
| Dell Latitude 15 3510 NK2MC | |
| Asus Vivobook 15 F512DA-SH31 | |
| Beelink GK Mini | |
| Chuwi LarkBook CWI509 | |
| Media Intel Celeron J4125 (1198 - 1512, n=5) | |
| LincPlus P1 | |
| HWBOT x265 Benchmark v2.2 / 4k Preset | |
| Intel NUC11PAQi7 | |
| Intel NUC11TNKi5 | |
| GMK NucBox 2 | |
| Acer Swift 3 SF314-42-R27B | |
| Fujitsu Lifebook U939 i5 | |
| Beelink SEi10 | |
| Dell Inspiron 15 5000 5502 | |
| Dell Latitude 15 3510 NK2MC | |
| Asus Vivobook 15 F512DA-SH31 | |
| Beelink GK Mini | |
| Media Intel Celeron J4125 (0.95 - 1.61, n=5) | |
| Chuwi LarkBook CWI509 | |
| Chuwi LapBook Plus | |
| LincPlus P1 | |
| LibreOffice / 20 Documents To PDF | |
| LincPlus P1 | |
| Media Intel Celeron J4125 (124 - 168.4, n=5) | |
| Chuwi LarkBook CWI509 | |
| Beelink GK Mini | |
| Asus Vivobook 15 F512DA-SH31 | |
| GMK NucBox 2 | |
| Dell Inspiron 15 5000 5502 | |
| Acer Swift 3 SF314-42-R27B | |
| Fujitsu Lifebook U939 i5 | |
| Beelink SEi10 | |
| Intel NUC11TNKi5 | |
| Intel NUC11PAQi7 | |
| Dell Latitude 15 3510 NK2MC | |
| R Benchmark 2.5 / Overall mean | |
| LincPlus P1 | |
| Chuwi LarkBook CWI509 | |
| Media Intel Celeron J4125 (1.525 - 1.579, n=5) | |
| Beelink GK Mini | |
| Asus Vivobook 15 F512DA-SH31 | |
| GMK NucBox 2 | |
| Beelink SEi10 | |
| Dell Latitude 15 3510 NK2MC | |
| Fujitsu Lifebook U939 i5 | |
| Acer Swift 3 SF314-42-R27B | |
| Dell Inspiron 15 5000 5502 | |
| Intel NUC11TNKi5 | |
| Intel NUC11PAQi7 | |
Cinebench R23: Multi Core | Single Core
Cinebench R15: CPU Multi 64Bit | CPU Single 64Bit
Blender: v2.79 BMW27 CPU
7-Zip 18.03: 7z b 4 -mmt1 | 7z b 4
Geekbench 5.5: Single-Core | Multi-Core
HWBOT x265 Benchmark v2.2: 4k Preset
LibreOffice : 20 Documents To PDF
R Benchmark 2.5: Overall mean
* ... Meglio usare valori piccoli
| PCMark 8 | |
| Home Score Accelerated v2 | |
| Intel NUC11PAQi7 | |
| Zotac ZBOX-CI660 Nano | |
| Beelink SEi10 | |
| Media Intel Celeron J4125, Intel UHD Graphics 600 (n=1) | |
| Work Score Accelerated v2 | |
| Media Intel Celeron J4125, Intel UHD Graphics 600 (n=1) | |
| Intel NUC11PAQi7 | |
| Beelink SEi10 | |
| PCMark 10 Score | 1898 punti | |
Aiuto | ||
| DPC Latencies / LatencyMon - interrupt to process latency (max), Web, Youtube, Prime95 | |
| Beelink GK Mini | |
| Beelink SEi10 | |
| GMK NucBox 2 | |
| Intel NUC11PAQi7 | |
| Intel NUC11TNKi5 | |
* ... Meglio usare valori piccoli
| Beelink GK Mini Silicon Motion SM2258XT 256GB | Intel NUC11TNKi5 Transcend M.2 SSD 430S TS512GMTS430S | GMK NucBox 2 Netac S930E8/256GPN | Beelink SEi10 Silicon Motion AZW 256G M.2280 NVMe 4X 200725 D | Intel NUC11PAQi7 Samsung SSD 980 Pro 500GB MZ-V8P500BW | |
|---|---|---|---|---|---|
| AS SSD | 40% | 152% | 63% | 617% | |
| Seq Read (MB/s) | 445.5 | 527 18% | 2069 364% | 1111 149% | 3257 631% |
| Seq Write (MB/s) | 440.5 | 469 6% | 1203 173% | 323.5 -27% | 3937 794% |
| 4K Read (MB/s) | 12.69 | 20.41 61% | 41.66 228% | 33.1 161% | 51.3 304% |
| 4K Write (MB/s) | 51.8 | 42.52 -18% | 136.9 164% | 66.2 28% | 75.7 46% |
| 4K-64 Read (MB/s) | 134.3 | 231.4 72% | 366.3 173% | 357.3 166% | 2283 1600% |
| 4K-64 Write (MB/s) | 249.2 | 285.3 14% | 340.5 37% | 154.8 -38% | 2206 785% |
| Access Time Read * (ms) | 3.629 | 0.124 97% | 0.064 98% | 0.066 98% | 0.056 98% |
| Access Time Write * (ms) | 0.253 | 0.269 -6% | 0.347 -37% | 0.616 -143% | 0.154 39% |
| Score Read (Points) | 192 | 304 58% | 615 220% | 501 161% | 2660 1285% |
| Score Write (Points) | 345 | 375 9% | 598 73% | 253 -27% | 2676 676% |
| Score Total (Points) | 638 | 839 32% | 1497 135% | 983 54% | 6725 954% |
| Copy ISO MB/s (MB/s) | 269.3 | 490.9 82% | 1186 340% | 1160 331% | 2030 654% |
| Copy Program MB/s (MB/s) | 173.9 | 415.9 139% | 428.6 146% | 121.1 -30% | 883 408% |
| Copy Game MB/s (MB/s) | 394.5 | 352.3 -11% | 435.7 10% | 364.4 -8% | 1817 361% |
| CrystalDiskMark 5.2 / 6 | 41% | 210% | 208% | 675% | |
| Write 4K (MB/s) | 73.4 | 65.9 -10% | 178.4 143% | 203 177% | 244.6 233% |
| Read 4K (MB/s) | 27.42 | 24.27 -11% | 61 122% | 63.2 130% | 80.4 193% |
| Write Seq (MB/s) | 416.8 | 456.4 10% | 1040 150% | 1114 167% | 4094 882% |
| Read Seq (MB/s) | 427.7 | 542 27% | 1919 349% | 1765 313% | 4099 858% |
| Write 4K Q32T1 (MB/s) | 119.5 | 331.3 177% | 417.7 250% | 423.9 255% | 715 498% |
| Read 4K Q32T1 (MB/s) | 137.7 | 295 114% | 325.6 136% | 389.2 183% | 783 469% |
| Write Seq Q32T1 (MB/s) | 498.2 | 506 2% | 1144 130% | 1104 122% | 5065 917% |
| Read Seq Q32T1 (MB/s) | 475.3 | 562 18% | 2379 401% | 1990 319% | 6884 1348% |
| Media totale (Programma / Settaggio) | 41% /
40% | 181% /
173% | 136% /
116% | 646% /
638% |
* ... Meglio usare valori piccoli

Throttling disco: DiskSpd Read Loop, Queue Depth 8
| 3DMark 11 Performance | 694 punti | |
| 3DMark Cloud Gate Standard Score | 3389 punti | |
| 3DMark Fire Strike Score | 423 punti | |
| 3DMark Time Spy Score | 143 punti | |
Aiuto | ||
| basso | medio | alto | ultra | |
|---|---|---|---|---|
| Dota 2 Reborn (2015) | 41.3 | 18.4 | 8.8 | 8 |
| Final Fantasy XV Benchmark (2018) | 5.33 | 2.34 | 1.63 | |
| X-Plane 11.11 (2018) | 8.89 | 5.8 | 5.39 |
| Beelink GK Mini UHD Graphics 600, Celeron J4125, Silicon Motion SM2258XT 256GB | Intel NUC11TNKi5 Iris Xe G7 80EUs, i5-1135G7, Transcend M.2 SSD 430S TS512GMTS430S | GMK NucBox 2 Iris Plus Graphics 655, i5-8259U, Netac S930E8/256GPN | Beelink SEi10 UHD Graphics G1 (Ice Lake 32 EU), i3-1005G1, Silicon Motion AZW 256G M.2280 NVMe 4X 200725 D | Zotac ZBOX-CI660 Nano UHD Graphics 620, i5-8550U, OCZ Vertex OCZSSD2-1VTX120G | Intel NUC11PAQi7 Iris Xe G7 96EUs, i7-1165G7, Samsung SSD 980 Pro 500GB MZ-V8P500BW | |
|---|---|---|---|---|---|---|
| Noise | -3% | 16% | -4% | 9% | ||
| off /ambiente * (dB) | 24.6 | 24.8 -1% | 25.6 -4% | 27.5 -12% | 25.6 -4% | |
| Idle Minimum * (dB) | 36.9 | 35.6 4% | 25.7 30% | 30.9 16% | 25.6 31% | |
| Idle Average * (dB) | 36.9 | 35.6 4% | 25.7 30% | 33.5 9% | 25.6 31% | |
| Idle Maximum * (dB) | 36.9 | 35.6 4% | 25.7 30% | 33.5 9% | 25.6 31% | |
| Load Average * (dB) | 37 | 36.2 2% | 35.3 5% | 38.5 -4% | 33.6 9% | |
| Load Maximum * (dB) | 37 | 47.6 -29% | 35.1 5% | 51.6 -39% | 54.5 -47% | |
| Witcher 3 ultra * (dB) | 38 | 33.6 |
* ... Meglio usare valori piccoli
Rumorosità
| Idle |
| 36.9 / 36.9 / 36.9 dB(A) |
| Sotto carico |
| 37 / 37 dB(A) |
 | ||
30 dB silenzioso 40 dB(A) udibile 50 dB(A) rumoroso |
||
min: | ||
| Off / Standby | |
| Idle | |
| Sotto carico |
|
Leggenda:
min: | |
| Beelink GK Mini Celeron J4125, UHD Graphics 600, Silicon Motion SM2258XT 256GB, , x, | Intel NUC11TNKi5 i5-1135G7, Iris Xe G7 80EUs, Transcend M.2 SSD 430S TS512GMTS430S, , x, | GMK NucBox 2 i5-8259U, Iris Plus Graphics 655, Netac S930E8/256GPN, , x, | Beelink SEi10 i3-1005G1, UHD Graphics G1 (Ice Lake 32 EU), Silicon Motion AZW 256G M.2280 NVMe 4X 200725 D, , x, | Zotac ZBOX-CI660 Nano i5-8550U, UHD Graphics 620, OCZ Vertex OCZSSD2-1VTX120G, , x, | Intel NUC11PAQi7 i7-1165G7, Iris Xe G7 96EUs, Samsung SSD 980 Pro 500GB MZ-V8P500BW, , x, | |
|---|---|---|---|---|---|---|
| Power Consumption | -259% | -144% | -106% | -231% | -138% | |
| Idle Minimum * (Watt) | 3.2 | 11.5 -259% | 6.1 -91% | 6.3 -97% | 9.7 -203% | 5.6 -75% |
| Idle Average * (Watt) | 3.3 | 12.4 -276% | 6.8 -106% | 6.6 -100% | 9.8 -197% | 5.6 -70% |
| Idle Maximum * (Watt) | 3.7 | 12.9 -249% | 7.3 -97% | 6.7 -81% | 11.8 -219% | 6 -62% |
| Load Average * (Watt) | 13.6 | 40.7 -199% | 46.3 -240% | 25.9 -90% | 51.6 -279% | 31.4 -131% |
| Load Maximum * (Watt) | 17.8 | 73.5 -313% | 50.7 -185% | 46.7 -162% | 63.2 -255% | 80.5 -352% |
| Witcher 3 ultra * (Watt) | 43.9 | 39 |
* ... Meglio usare valori piccoli
Pro
Contro
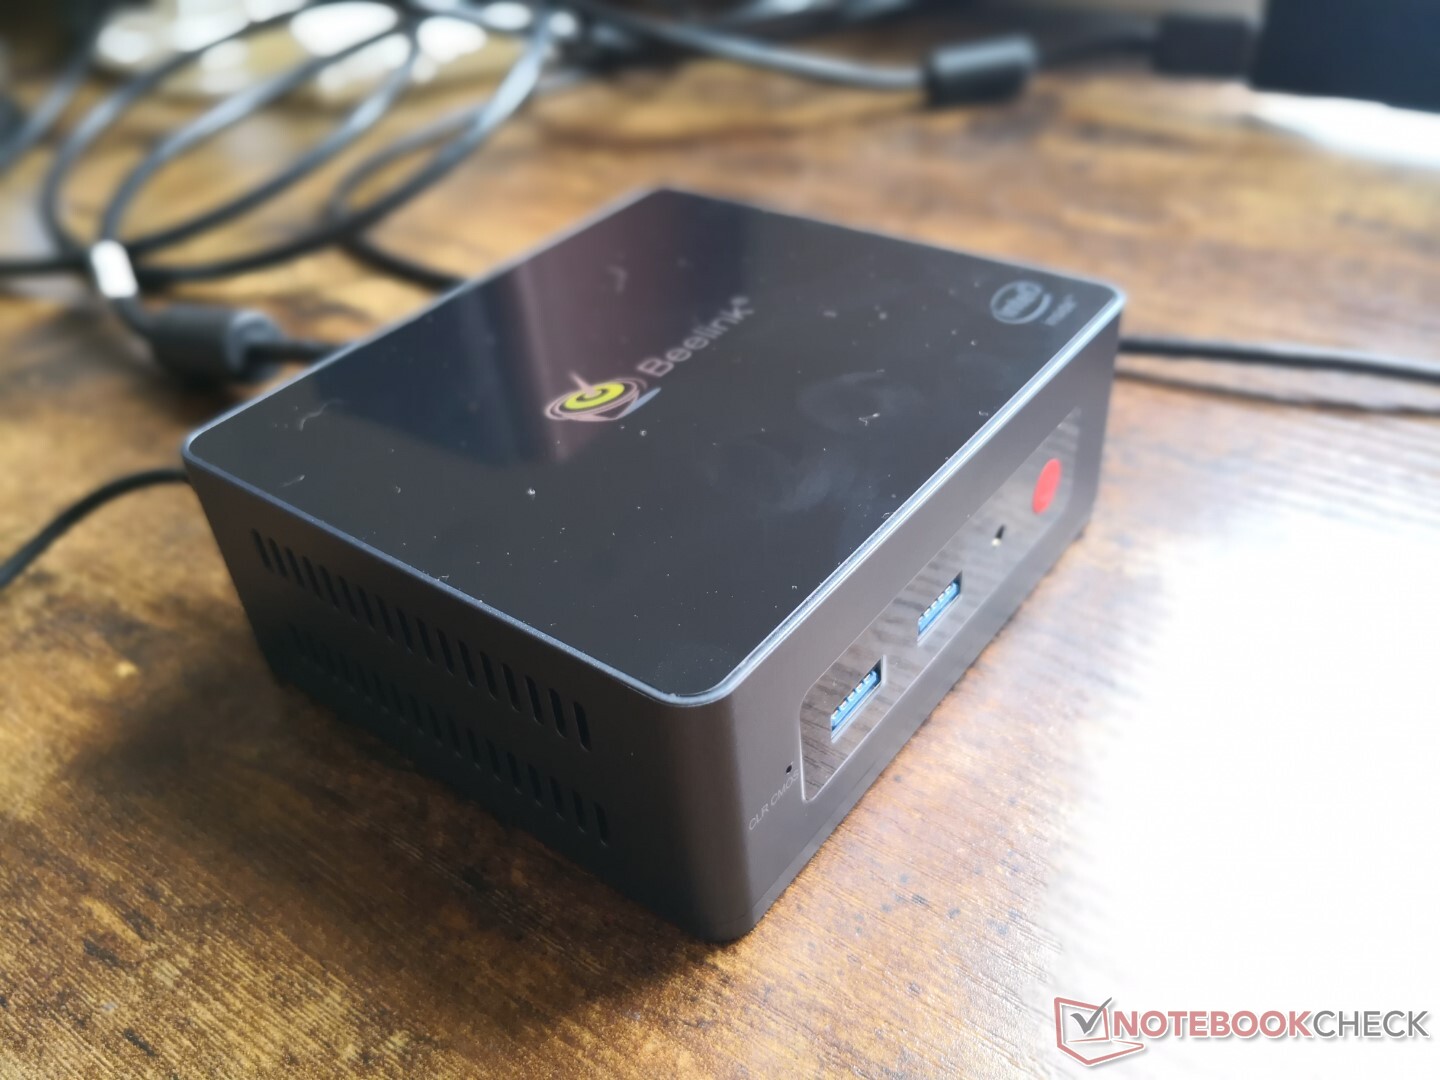
Gli attributi maggiormente positivi del Beelink sono la sua facilità d'uso, le temperature di funzionamento basse e il prezzo economico che attirerà gli utenti HTPC di base 1080p. È una buona soluzione per gli utenti che non hanno bisogno degli ultimi processori Core ix, Wi-Fi 6, opzioni di archiviazione NVMe, o più di 8 GB di RAM. Sicuramente vorrete aggiungere un'unità secondaria da 2,5 pollici SATA III per espandere l'archiviazione.
Un mini PC economico ottimo per lo streaming 1080p di base. Inizia a faticare una volta che vengono introdotti il 4K e il multitasking leggero.
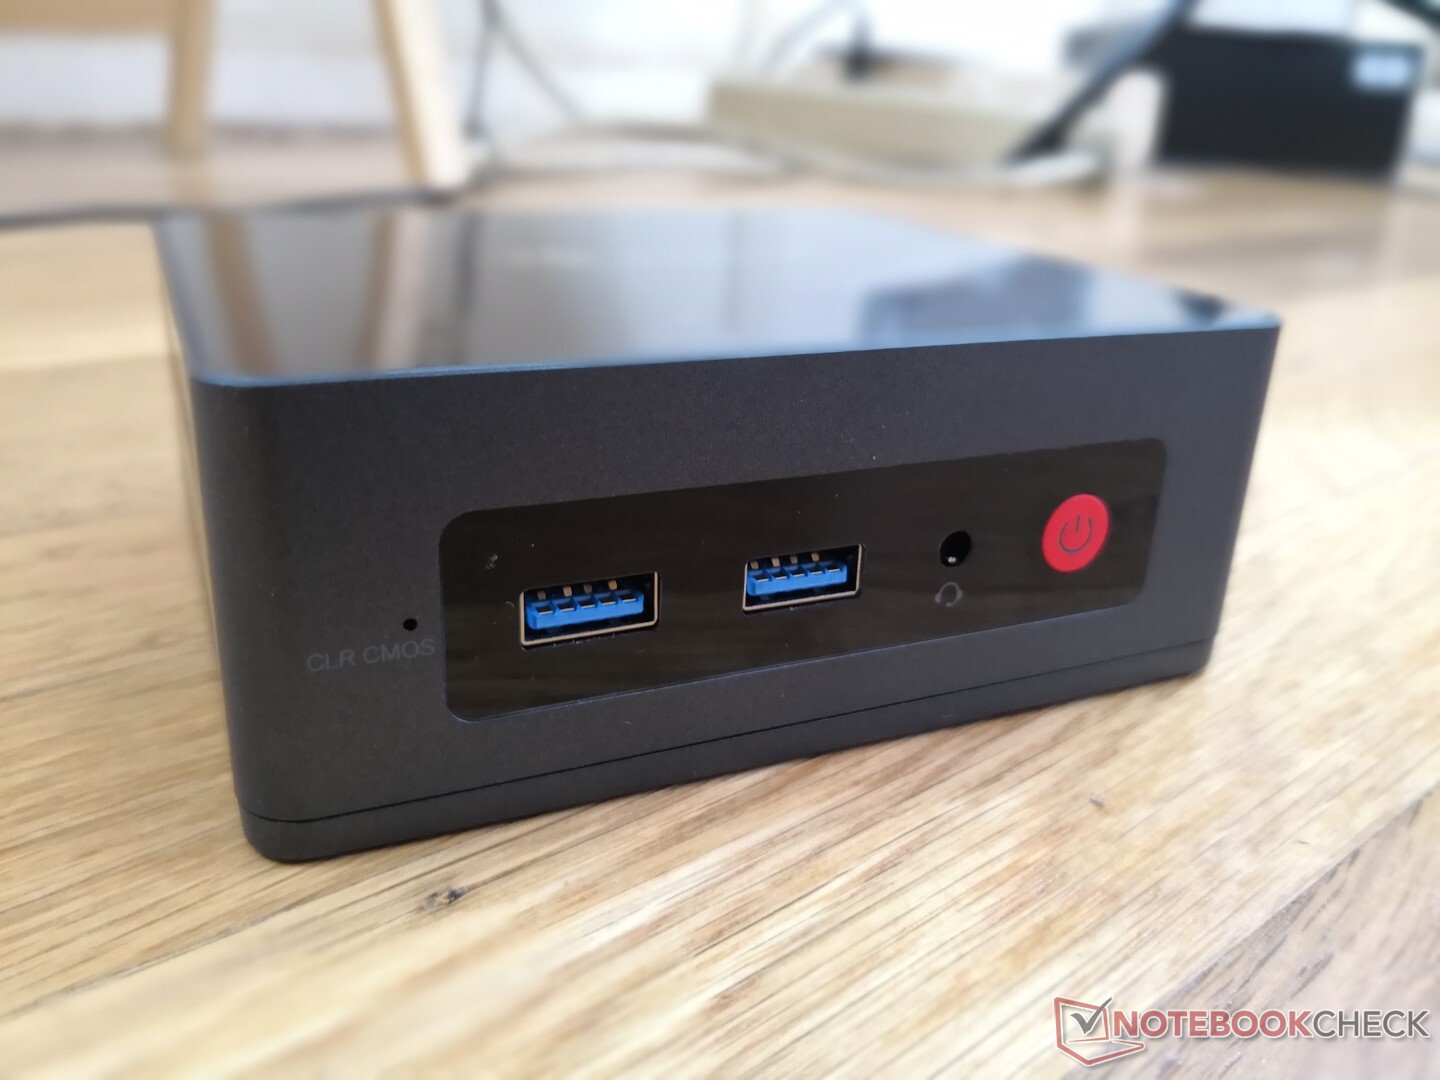
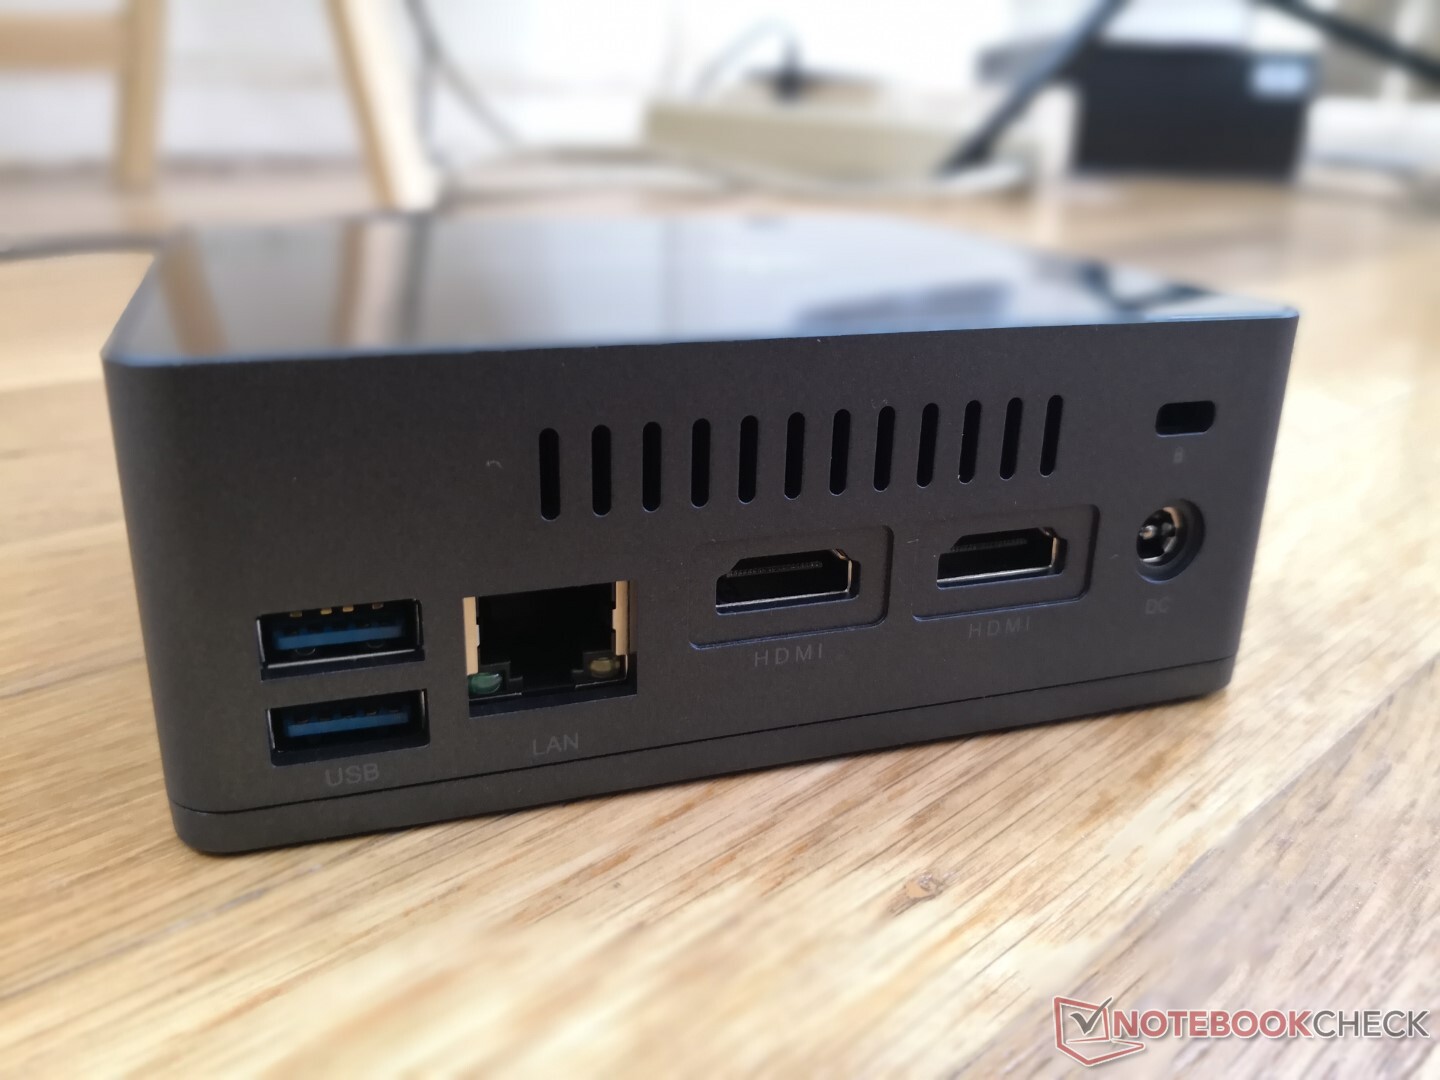
Uno svantaggio notevole del GK Mini è la sua mancanza di USB-C che avrebbe potuto aggiungere DisplayPort e Power Delivery per una maggiore versatilità. Lo streaming video 4K è decente fino a quando non si iniziano a eseguire contemporaneamente altre attività in background come la navigazione web. Gli utenti HTPC più esigenti dovrebbero investire in qualcosa di più potente.
