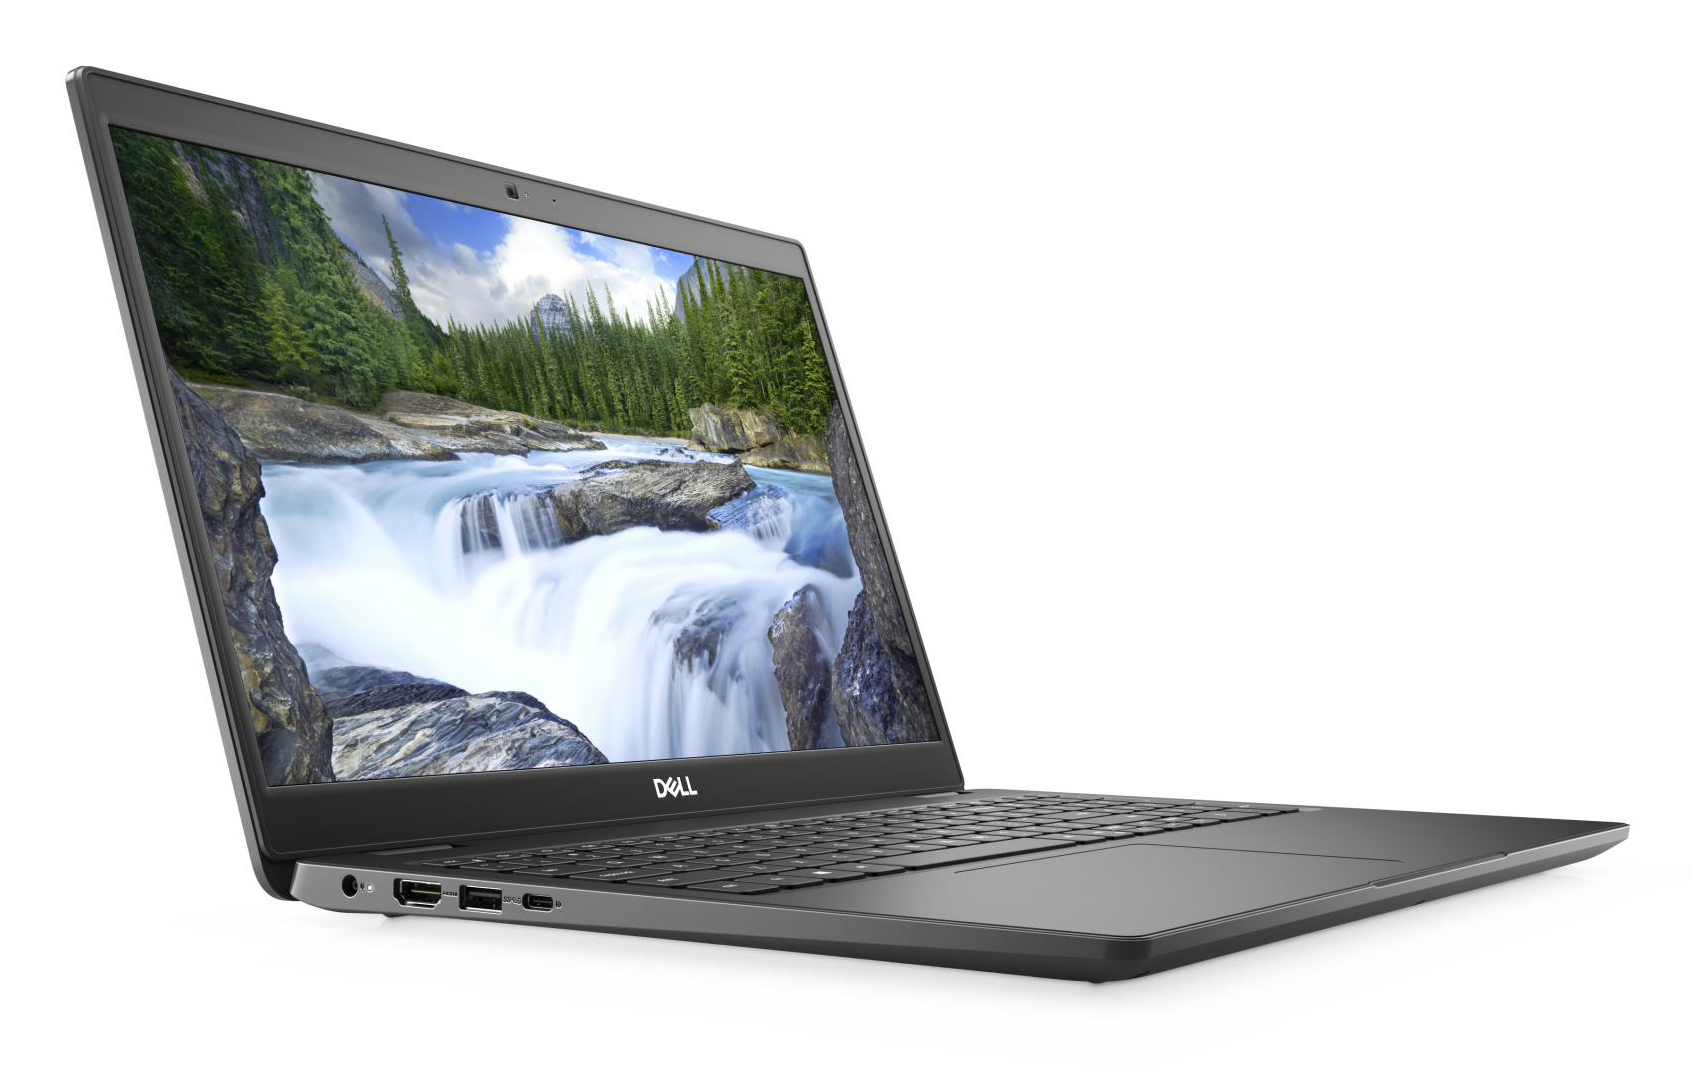
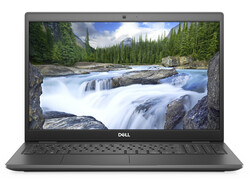
Recensione del Laptop Dell Latitude 3510: Buona durata della batteria nonostante la piccola batteria
Punteggio | Data | Modello | Peso | Altezza | Dimensione | Risoluzione | Prezzo |
|---|---|---|---|---|---|---|---|
| 81 % v7 (old) | 12/2020 | Dell Latitude 15 3510 NK2MC i3-10110U, UHD Graphics 620 | 1.9 kg | 18 mm | 15.60" | 1920x1080 | |
| 83.9 % v7 (old) | 11/2020 | Lenovo ThinkPad E15 Gen2-20T9S00K00 R7 4700U, Vega 7 | 1.8 kg | 18.9 mm | 15.60" | 1920x1080 | |
| 82.6 % v7 (old) | 07/2020 | HP ProBook 455 G7-175W8EA R7 4700U, Vega 7 | 1.8 kg | 19 mm | 15.60" | 1920x1080 | |
| 76.6 % v7 (old) | 02/2020 | Acer Extensa 15 EX215-51-56UX i5-10210U, UHD Graphics 620 | 1.9 kg | 19.9 mm | 15.60" | 1920x1080 |

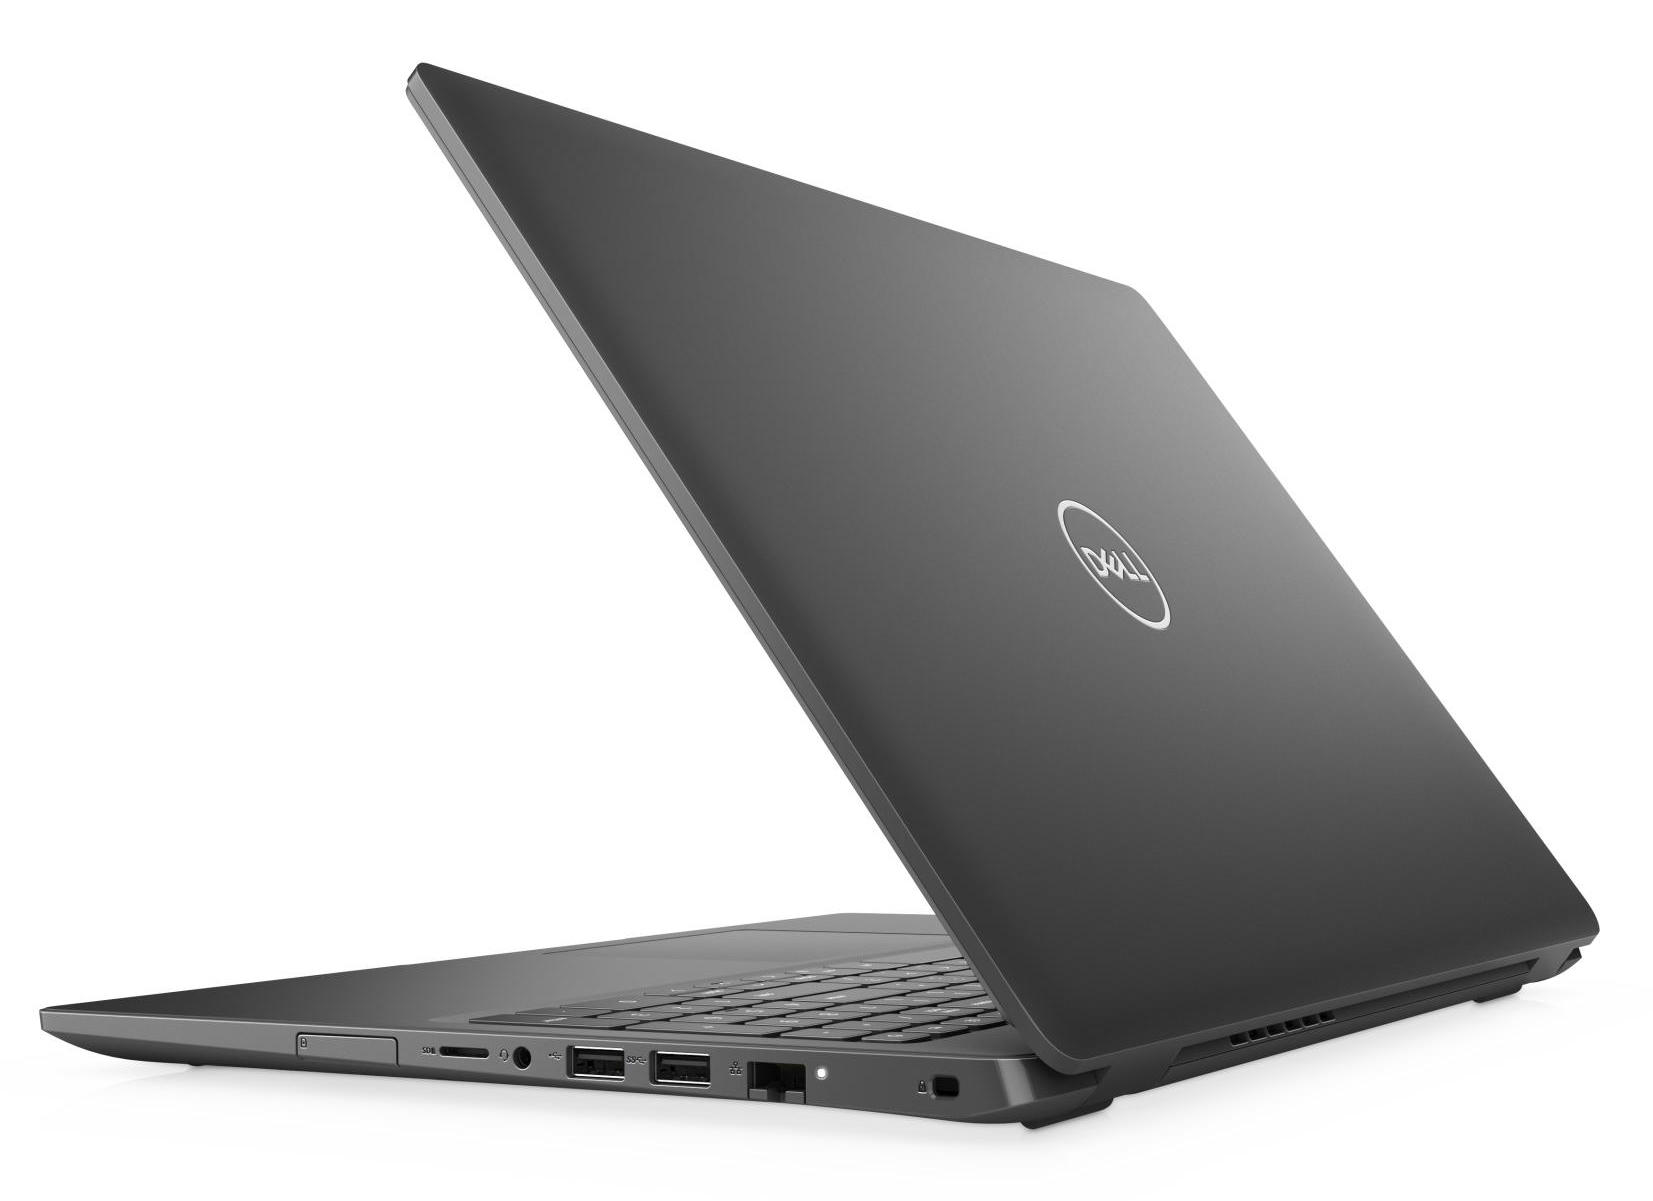
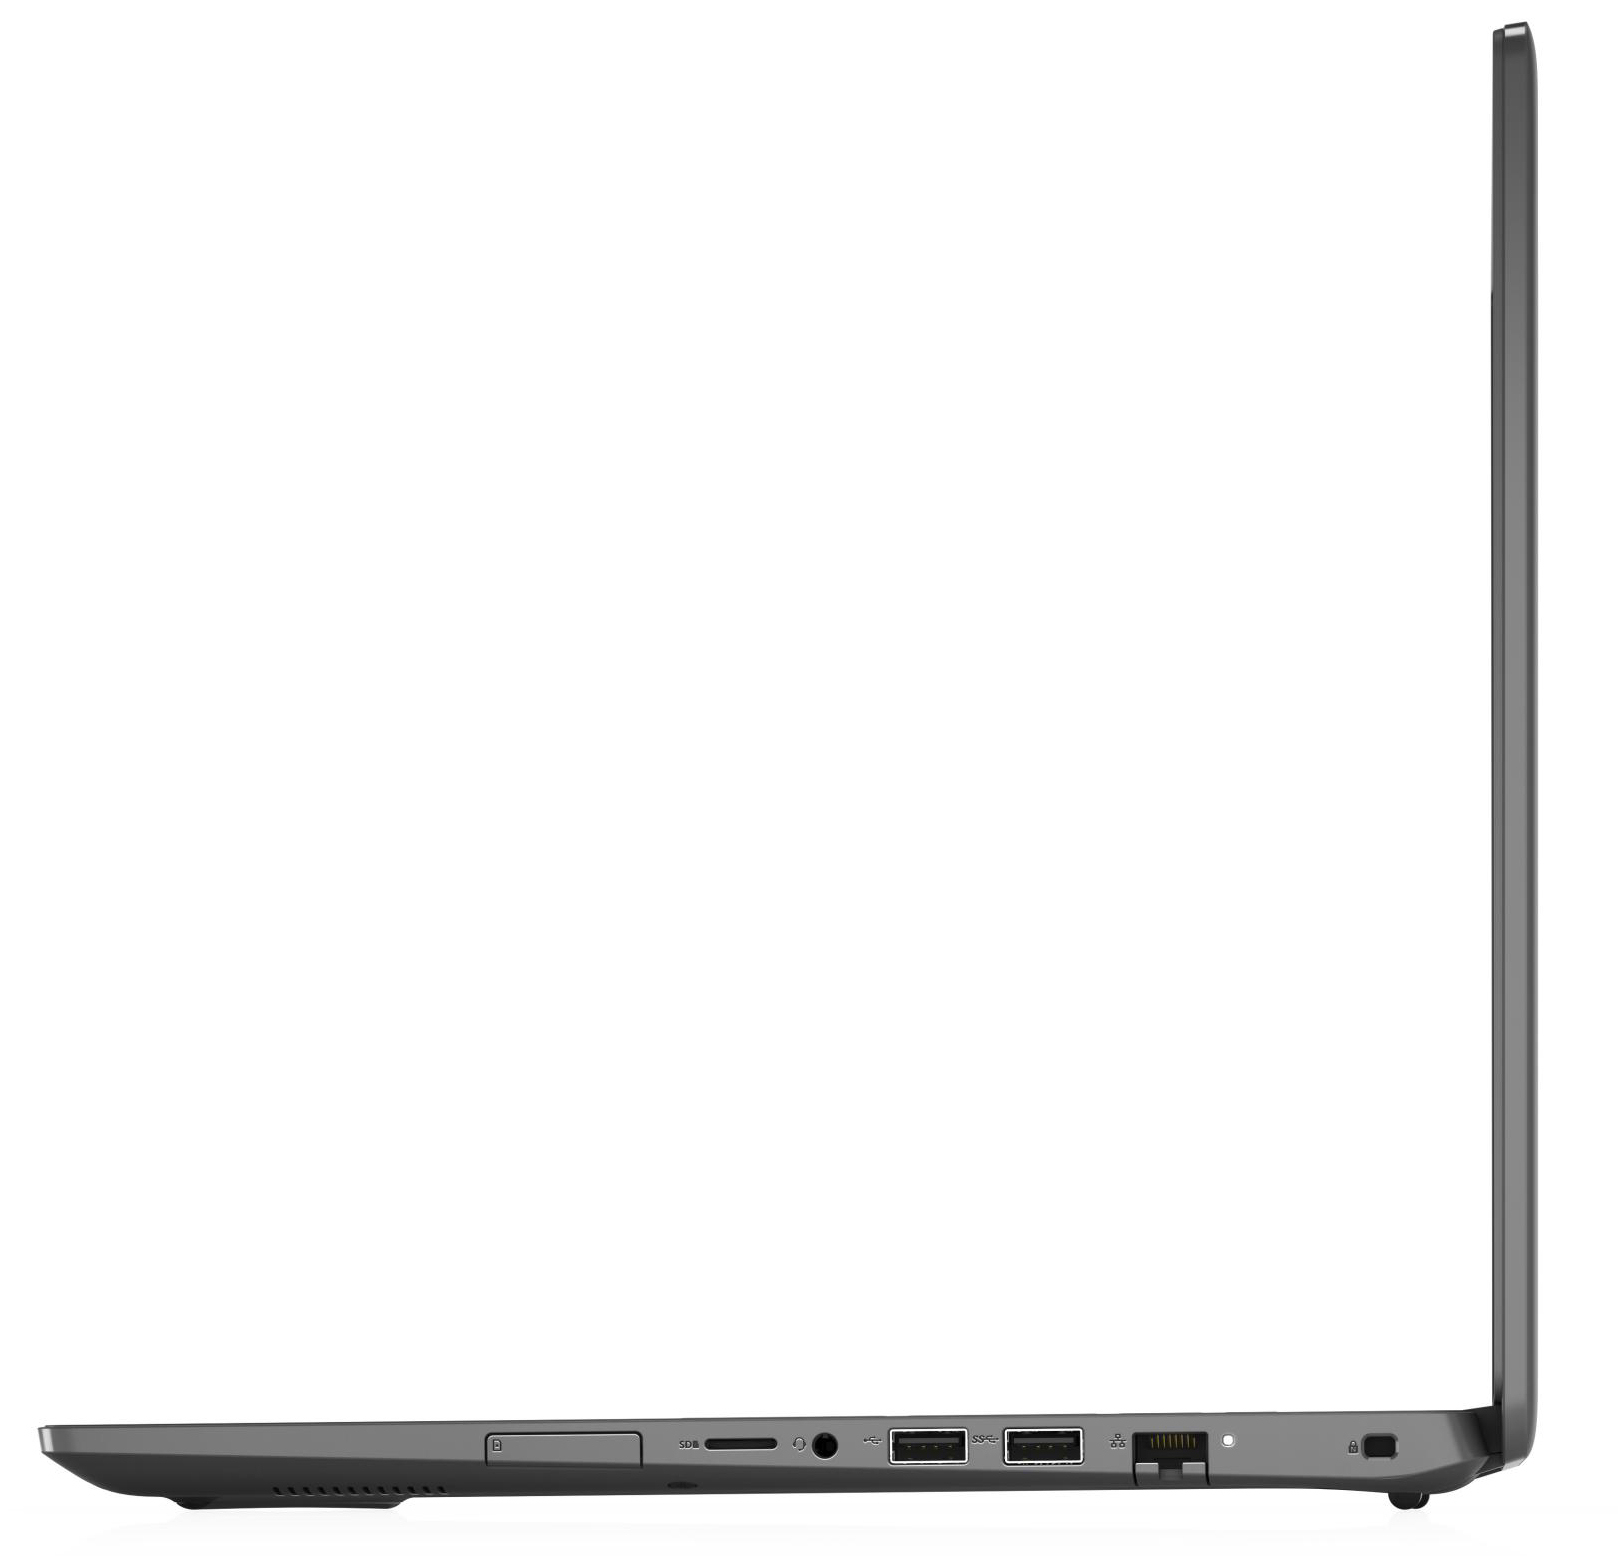
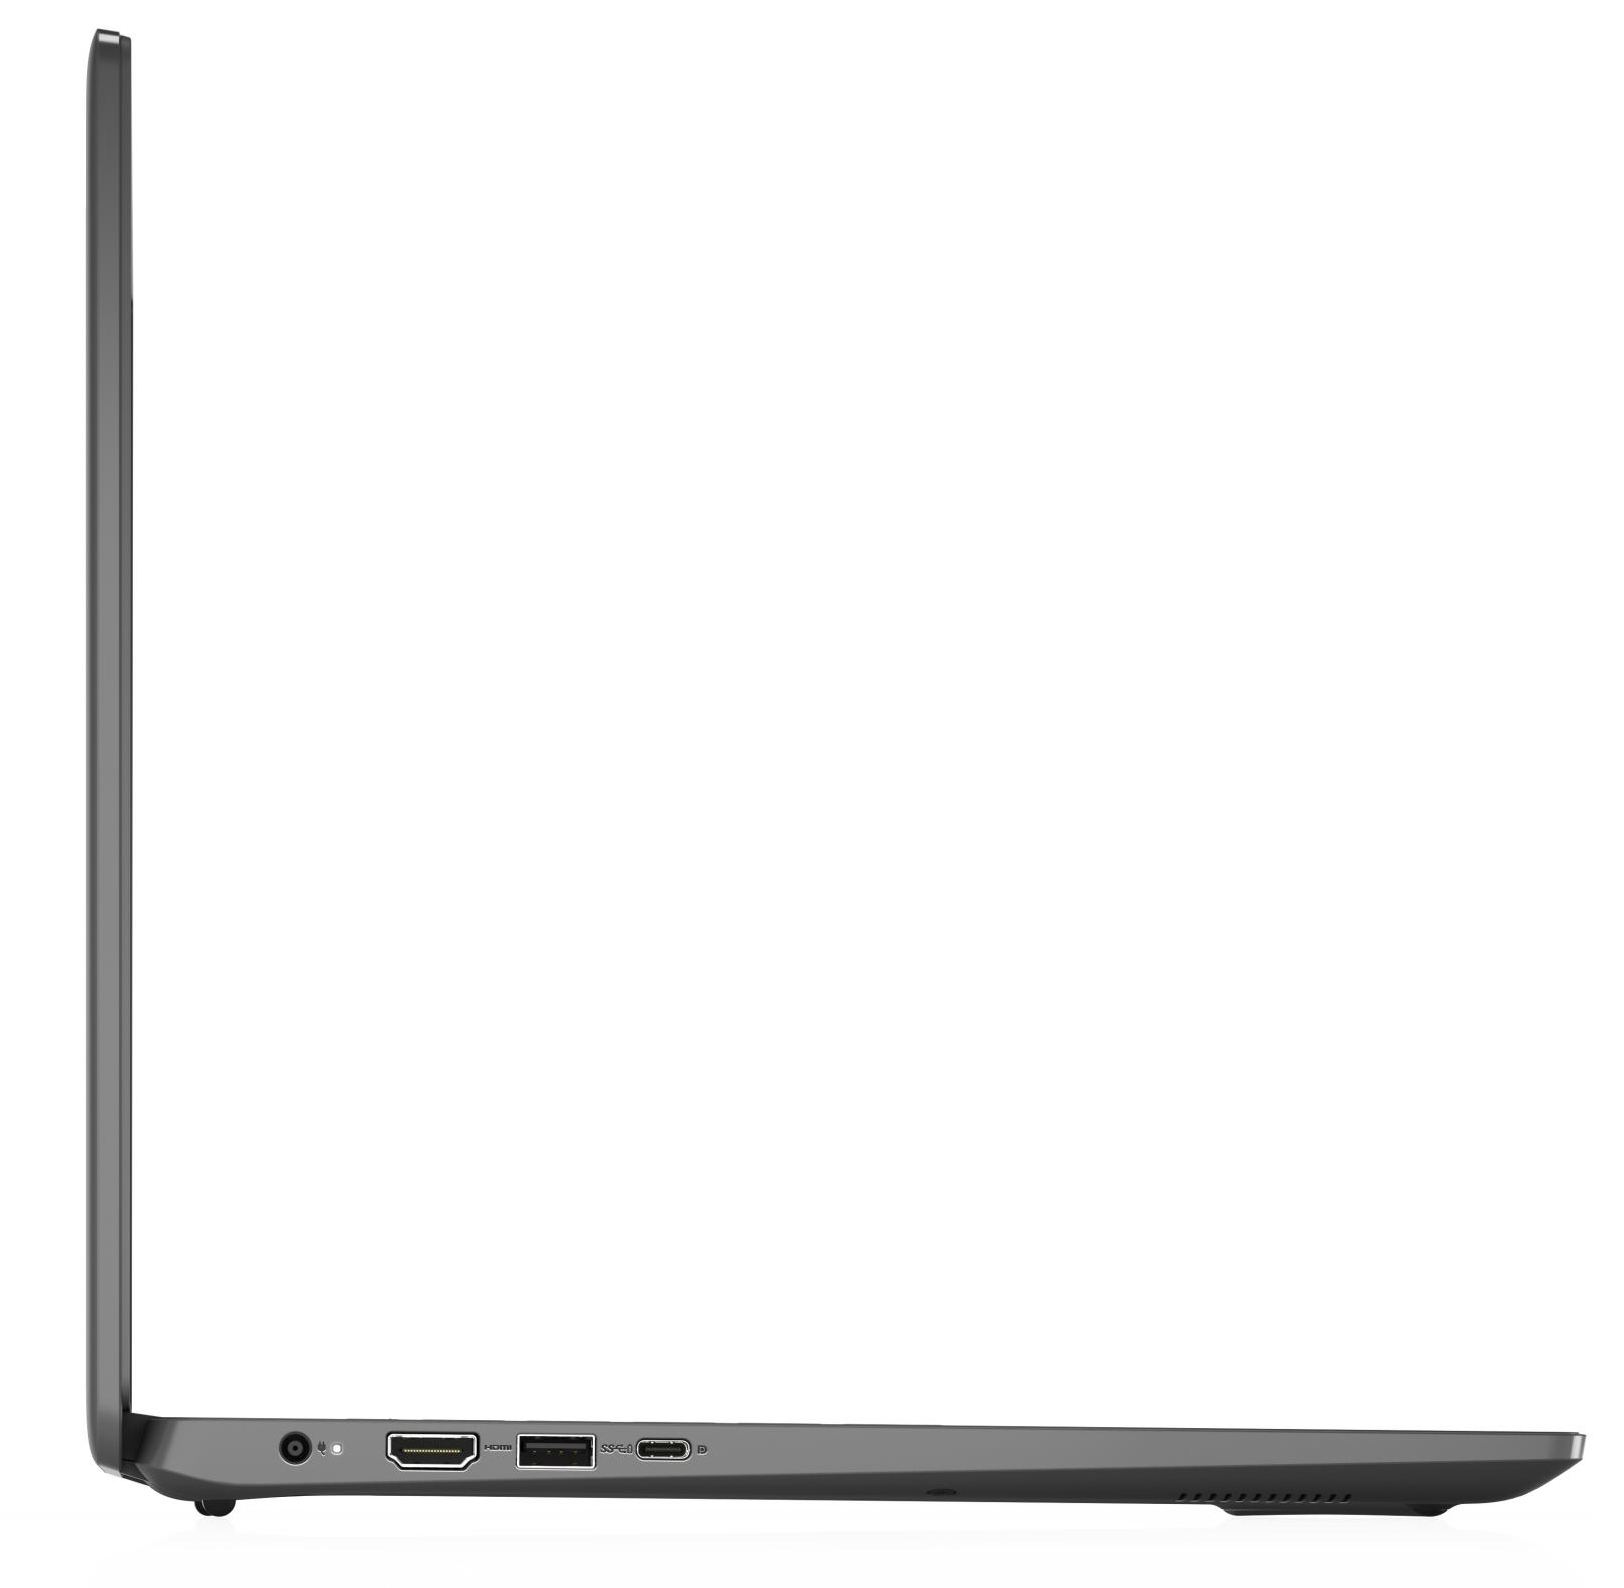
Connettività


| SD Card Reader | |
| average JPG Copy Test (av. of 3 runs) | |
| HP ProBook 455 G7-175W8EA (Toshiba Exceria Pro SDXC 64 GB UHS-II) | |
| HP ProBook 450 G7 8WC04UT (Toshiba Exceria Pro SDXC 64 GB UHS-II) | |
| Media della classe Office (22.4 - 198.5, n=22, ultimi 2 anni) | |
| Dell Latitude 15 3510 NK2MC (Toshiba Exceria Pro M501 microSDXC 64GB) | |
| maximum AS SSD Seq Read Test (1GB) | |
| HP ProBook 455 G7-175W8EA (Toshiba Exceria Pro SDXC 64 GB UHS-II) | |
| HP ProBook 450 G7 8WC04UT (Toshiba Exceria Pro SDXC 64 GB UHS-II) | |
| Media della classe Office (27.4 - 249, n=20, ultimi 2 anni) | |
| Dell Latitude 15 3510 NK2MC (Toshiba Exceria Pro M501 microSDXC 64GB) | |


| |||||||||||||||||||||||||
Distribuzione della luminosità: 86 %
Al centro con la batteria: 230 cd/m²
Contrasto: 845:1 (Nero: 0.31 cd/m²)
ΔE ColorChecker Calman: 4.92 | ∀{0.5-29.43 Ø4.73}
calibrated: 4.34
ΔE Greyscale Calman: 3.47 | ∀{0.09-98 Ø4.97}
61% sRGB (Argyll 1.6.3 3D)
39% AdobeRGB 1998 (Argyll 1.6.3 3D)
42.15% AdobeRGB 1998 (Argyll 3D)
61.3% sRGB (Argyll 3D)
40.78% Display P3 (Argyll 3D)
Gamma: 2.4
CCT: 6680 K
| Dell Latitude 15 3510 NK2MC Dell 156CL05, IPS, 1920x1080, 15.6" | Lenovo ThinkPad E15 Gen2-20T9S00K00 B156HAN02.1, IPS, 1920x1080, 15.6" | HP ProBook 450 G7 8WC04UT LG Philips LGD062E, IPS, 1920x1080, 15.6" | HP ProBook 455 G7-175W8EA AUO, B156HW02, IPS, 1920x1080, 15.6" | Acer Extensa 15 EX215-51-56UX BOE CQ NT156FHM-N61, TN LED, 1920x1080, 15.6" | |
|---|---|---|---|---|---|
| Display | -6% | -7% | -7% | -6% | |
| Display P3 Coverage (%) | 40.78 | 38.42 -6% | 37.9 -7% | 37.92 -7% | 38.17 -6% |
| sRGB Coverage (%) | 61.3 | 57.8 -6% | 56.5 -8% | 57.1 -7% | 57.5 -6% |
| AdobeRGB 1998 Coverage (%) | 42.15 | 39.69 -6% | 39.08 -7% | 39.18 -7% | 39.44 -6% |
| Response Times | -17% | -1% | -1% | 19% | |
| Response Time Grey 50% / Grey 80% * (ms) | 38 ? | 46.8 ? -23% | 35.2 ? 7% | 41 ? -8% | 41 ? -8% |
| Response Time Black / White * (ms) | 28 ? | 31.2 ? -11% | 30.4 ? -9% | 26 ? 7% | 15 ? 46% |
| PWM Frequency (Hz) | 250 | ||||
| Screen | -5% | -11% | 7% | -61% | |
| Brightness middle (cd/m²) | 262 | 249 -5% | 259.8 -1% | 282 8% | 203 -23% |
| Brightness (cd/m²) | 236 | 239 1% | 251 6% | 264 12% | 188 -20% |
| Brightness Distribution (%) | 86 | 87 1% | 91 6% | 88 2% | 87 1% |
| Black Level * (cd/m²) | 0.31 | 0.22 29% | 0.42 -35% | 0.19 39% | 0.635 -105% |
| Contrast (:1) | 845 | 1132 34% | 619 -27% | 1484 76% | 320 -62% |
| Colorchecker dE 2000 * | 4.92 | 6.7 -36% | 6.09 -24% | 5.56 -13% | 10.84 -120% |
| Colorchecker dE 2000 max. * | 15.83 | 19.7 -24% | 16.33 -3% | 19.07 -20% | 22.18 -40% |
| Colorchecker dE 2000 calibrated * | 4.34 | 4.4 -1% | 5.2 -20% | 4.5 -4% | 5.09 -17% |
| Greyscale dE 2000 * | 3.47 | 5.1 -47% | 3.7 -7% | 3.57 -3% | 12.87 -271% |
| Gamma | 2.4 92% | 2.48 89% | 2.56 86% | 2.61 84% | 2.58 85% |
| CCT | 6680 97% | 7277 89% | 6759 96% | 6895 94% | 15854 41% |
| Color Space (Percent of AdobeRGB 1998) (%) | 39 | 36.6 -6% | 35.7 -8% | 36 -8% | 36.4 -7% |
| Color Space (Percent of sRGB) (%) | 61 | 57.7 -5% | 56.2 -8% | 57 -7% | 57.4 -6% |
| Media totale (Programma / Settaggio) | -9% /
-7% | -6% /
-9% | -0% /
4% | -16% /
-41% |
* ... Meglio usare valori piccoli
Tempi di risposta del Display
| ↔ Tempi di risposta dal Nero al Bianco | ||
|---|---|---|
| 28 ms ... aumenta ↗ e diminuisce ↘ combinato | ↗ 17 ms Incremento | 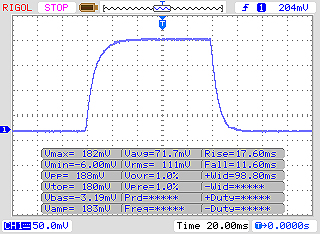 |
| ↘ 11 ms Calo | ||
| Lo schermo mostra tempi di risposta relativamente lenti nei nostri tests e potrebbe essere troppo lento per i gamers. In confronto, tutti i dispositivi di test variano da 0.1 (minimo) a 240 (massimo) ms. » 71 % di tutti i dispositivi è migliore. Questo significa che i tempi di risposta rilevati sono peggiori rispetto alla media di tutti i dispositivi testati (19.9 ms). | ||
| ↔ Tempo di risposta dal 50% Grigio all'80% Grigio | ||
| 38 ms ... aumenta ↗ e diminuisce ↘ combinato | ↗ 19 ms Incremento | 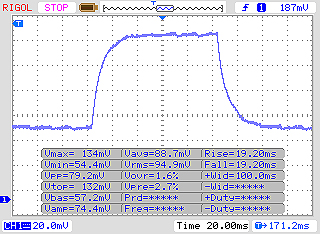 |
| ↘ 19 ms Calo | ||
| Lo schermo mostra tempi di risposta lenti nei nostri tests e sarà insoddisfacente per i gamers. In confronto, tutti i dispositivi di test variano da 0.165 (minimo) a 636 (massimo) ms. » 55 % di tutti i dispositivi è migliore. Questo significa che i tempi di risposta rilevati sono peggiori rispetto alla media di tutti i dispositivi testati (31.1 ms). | ||
Sfarfallio dello schermo / PWM (Pulse-Width Modulation)
| flickering dello schermo / PWM rilevato | 250 Hz | 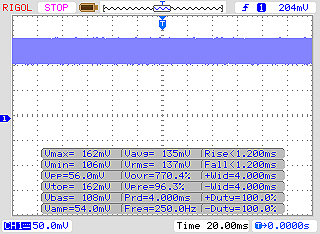 | |
Il display sfarfalla a 250 Hz (Probabilmente a causa dell'uso di PWM) . La frequenza di 250 Hz è relativamente bassa, quindi gli utenti sensibili potrebbero notare il flickering ed accusare stanchezza agli occhi a questo livello di luminosità e a livelli inferiori. In confronto: 52 % di tutti i dispositivi testati non utilizza PWM per ridurre la luminosita' del display. Se è rilevato PWM, una media di 7798 (minimo: 5 - massimo: 343500) Hz è stata rilevata. | |||
* ... Meglio usare valori piccoli
| PCMark 8 Home Score Accelerated v2 | 2898 punti | |
| PCMark 8 Creative Score Accelerated v2 | 2958 punti | |
| PCMark 8 Work Score Accelerated v2 | 4314 punti | |
| PCMark 10 Score | 3360 punti | |
Aiuto | ||
| DPC Latencies / LatencyMon - interrupt to process latency (max), Web, Youtube, Prime95 | |
| Dell Latitude 15 3510 NK2MC | |
| HP ProBook 450 G7 8WC04UT | |
| HP ProBook 455 G7-175W8EA | |
* ... Meglio usare valori piccoli

| Dell Latitude 15 3510 NK2MC Toshiba KBG40ZNS256G NVMe | Lenovo ThinkPad E15 Gen2-20T9S00K00 Samsung PM991 MZALQ512HALU | HP ProBook 450 G7 8WC04UT Crucial P1 SSD CT1000P1SSD8 | HP ProBook 455 G7-175W8EA Samsung PM991 MZVLQ512HALU | Acer Extensa 15 EX215-51-56UX WDC PC SN520 SDAPNUW-512G | Media Toshiba KBG40ZNS256G NVMe | Media della classe Office | |
|---|---|---|---|---|---|---|---|
| CrystalDiskMark 5.2 / 6 | 18% | -15% | 2% | 21% | -1% | 111% | |
| Write 4K (MB/s) | 150 | 104.9 -30% | 111.1 -26% | 141.9 -5% | 176.1 17% | 112.1 ? -25% | 151.4 ? 1% |
| Read 4K (MB/s) | 61.8 | 46.54 -25% | 56.3 -9% | 37.25 -40% | 50.4 -18% | 50.6 ? -18% | 72.8 ? 18% |
| Write Seq (MB/s) | 458 | 1333 191% | 559 22% | 998 118% | 1457 218% | 961 ? 110% | 2558 ? 459% |
| Read Seq (MB/s) | 1881 | 1565 -17% | 1348 -28% | 1233 -34% | 1424 -24% | 1562 ? -17% | 3237 ? 72% |
| Write 4K Q32T1 (MB/s) | 338.4 | 437.2 29% | 277.1 -18% | 338.4 0% | 381 13% | 299 ? -12% | 424 ? 25% |
| Read 4K Q32T1 (MB/s) | 447.3 | 498.9 12% | 312.1 -30% | 431.1 -4% | 436.5 -2% | 359 ? -20% | 509 ? 14% |
| Write Seq Q32T1 (MB/s) | 1563 | 1315 -16% | 1652 6% | 1367 -13% | 1455 -7% | 1366 ? -13% | 3999 ? 156% |
| Read Seq Q32T1 (MB/s) | 2422 | 2340 -3% | 1588 -34% | 2355 -3% | 1725 -29% | 2170 ? -10% | 5962 ? 146% |
| Write 4K Q8T8 (MB/s) | 877 | 380 ? | 901 ? | ||||
| Read 4K Q8T8 (MB/s) | 518 | 852 ? | 1317 ? | ||||
| AS SSD | 76% | 61% | 49% | 55% | 33% | 191% | |
| Seq Read (MB/s) | 1971 | 1934 -2% | 1155 -41% | 1929 -2% | 1542 -22% | 1752 ? -11% | 4258 ? 116% |
| Seq Write (MB/s) | 1130 | 1198 6% | 984 -13% | 1199 6% | 1249 11% | 720 ? -36% | 2707 ? 140% |
| 4K Read (MB/s) | 51.3 | 47.08 -8% | 48.85 -5% | 43.9 -14% | 38.79 -24% | 47.3 ? -8% | 57.3 ? 12% |
| 4K Write (MB/s) | 119.7 | 132.8 11% | 96.6 -19% | 116.2 -3% | 89.3 -25% | 118.6 ? -1% | 163 ? 36% |
| 4K-64 Read (MB/s) | 585 | 866 48% | 581 -1% | 897 53% | 966 65% | 866 ? 48% | 924 ? 58% |
| 4K-64 Write (MB/s) | 495.5 | 872 76% | 658 33% | 801 62% | 885 79% | 402 ? -19% | 1631 ? 229% |
| Access Time Read * (ms) | 0.107 | 0.116 -8% | 0.066 38% | 0.069 36% | 0.1034 ? 3% | 0.08483 ? 21% | |
| Access Time Write * (ms) | 0.22 | 0.03 86% | 0.207 6% | 0.033 85% | 0.044 80% | 0.3076 ? -40% | 0.05741 ? 74% |
| Score Read (Points) | 833 | 1106 33% | 745 -11% | 1134 36% | 1159 39% | 1088 ? 31% | 1407 ? 69% |
| Score Write (Points) | 728 | 1125 55% | 853 17% | 1037 42% | 1099 51% | 592 ? -19% | 2065 ? 184% |
| Score Total (Points) | 1962 | 2771 41% | 1986 1% | 2723 39% | 2842 45% | 2197 ? 12% | 4127 ? 110% |
| Copy ISO MB/s (MB/s) | 273.5 | 1258 360% | 2635 863% | 1409 415% | 894 227% | 926 ? 239% | 2527 ? 824% |
| Copy Program MB/s (MB/s) | 184.6 | 411.2 123% | 95.1 -48% | 70.2 -62% | 304.9 65% | 372 ? 102% | 793 ? 330% |
| Copy Game MB/s (MB/s) | 281 | 945 236% | 361.9 29% | 254.9 -9% | 642 128% | 714 ? 154% | 1607 ? 472% |
| Media totale (Programma / Settaggio) | 47% /
54% | 23% /
33% | 26% /
32% | 38% /
42% | 16% /
20% | 151% /
162% |
* ... Meglio usare valori piccoli
Carico di lettura continuo: DiskSpd Read Loop, Queue Depth 8
| 3DMark 11 Performance | 1690 punti | |
| 3DMark Ice Storm Standard Score | 51185 punti | |
| 3DMark Cloud Gate Standard Score | 5883 punti | |
| 3DMark Fire Strike Score | 882 punti | |
Aiuto | ||
| basso | medio | alto | ultra | |
|---|---|---|---|---|
| BioShock Infinite (2013) | 42 | 28.5 | 23.5 | 7.5 |
| Dota 2 Reborn (2015) | 60 | 31 | 15.6 | 13.9 |
Rumorosità
| Idle |
| 25 / 25 / 27.8 dB(A) |
| Sotto carico |
| 35.1 / 34.8 dB(A) |
 | ||
30 dB silenzioso 40 dB(A) udibile 50 dB(A) rumoroso |
||
min: | ||
(+) La temperatura massima sul lato superiore è di 39 °C / 102 F, rispetto alla media di 34.3 °C / 94 F, che varia da 21.2 a 62.5 °C per questa classe Office.
(±) Il lato inferiore si riscalda fino ad un massimo di 40.6 °C / 105 F, rispetto alla media di 36.8 °C / 98 F
(+) In idle, la temperatura media del lato superiore è di 24.1 °C / 75 F, rispetto alla media deld ispositivo di 29.5 °C / 85 F.
(+) I poggiapolsi e il touchpad sono piu' freddi della temperatura della pelle con un massimo di 25 °C / 77 F e sono quindi freddi al tatto.
(+) La temperatura media della zona del palmo della mano di dispositivi simili e'stata di 27.5 °C / 81.5 F (+2.5 °C / 4.5 F).
Dell Latitude 15 3510 NK2MC analisi audio
(±) | potenza degli altiparlanti media ma buona (73.3 dB)
Bassi 100 - 315 Hz
(-) | quasi nessun basso - in media 25.9% inferiori alla media
(-) | bassi non lineari (16.7% delta rispetto alla precedente frequenza)
Medi 400 - 2000 Hz
(±) | medi elevati - circa 6.9% superiore alla media
(+) | medi lineari (6.4% delta rispetto alla precedente frequenza)
Alti 2 - 16 kHz
(+) | Alti bilanciati - appena 1.6% dalla media
(+) | alti lineari (3.9% delta rispetto alla precedente frequenza)
Nel complesso 100 - 16.000 Hz
(±) | la linearità complessiva del suono è media (21.5% di differenza rispetto alla media
Rispetto alla stessa classe
» 54% di tutti i dispositivi testati in questa classe è stato migliore, 8% simile, 38% peggiore
» Il migliore ha avuto un delta di 7%, medio di 21%, peggiore di 53%
Rispetto a tutti i dispositivi testati
» 61% di tutti i dispositivi testati in questa classe è stato migliore, 7% similare, 33% peggiore
» Il migliore ha avuto un delta di 4%, medio di 24%, peggiore di 134%
| Off / Standby | |
| Idle | |
| Sotto carico |
|
Leggenda:
min: | |
Pro
Contro
Il Dell Latitude 3510 è un notebook aziendale poco appariscente alimentato da un processore Core i3 abbastanza veloce per le applicazioni da ufficio e Internet. Nel complesso il dispositivo è rimasto molto silenzioso e fresco.
Il suo scarso rapporto qualità-prezzo rende il Dell Latitude 3510 poco attraente per i consumatori.
La CPU ha accesso a 8 GB di RAM in modalità single-channel, sacrificando così alcune prestazioni. Questo può essere alleviato grazie al fatto che il notebook dispone di due slot RAM. Esso supporta fino a 32 GB di RAM.
La durata della batteria è stata discreta e ad un livello pari a quello della concorrenza. Le versioni più costose e potenti potrebbero funzionare ancora più a lungo grazie alle loro batterie da 53 Wh. Il Latitude dotato del Core i3 deve accontentarsi di una batteria da 40 Wh.
L'alimentatore Dell incluso si inserisce nella porta di ricarica proprietaria. Tuttavia, il dispositivo può essere caricato anche via USB-C grazie al supporto per Power Delivery, che abbiamo tentato con successo.
Il display FHD IPS è il suo più grande punto debole. Troppo debole, contrasto troppo basso, scarsa copertura dello spazio colore e sfarfallio del PWM per l'avvio. In cambio, offre una superficie opaca oltre a grandi angoli di visualizzazione. Un notebook in questa fascia di prezzo ha da offrire di più.
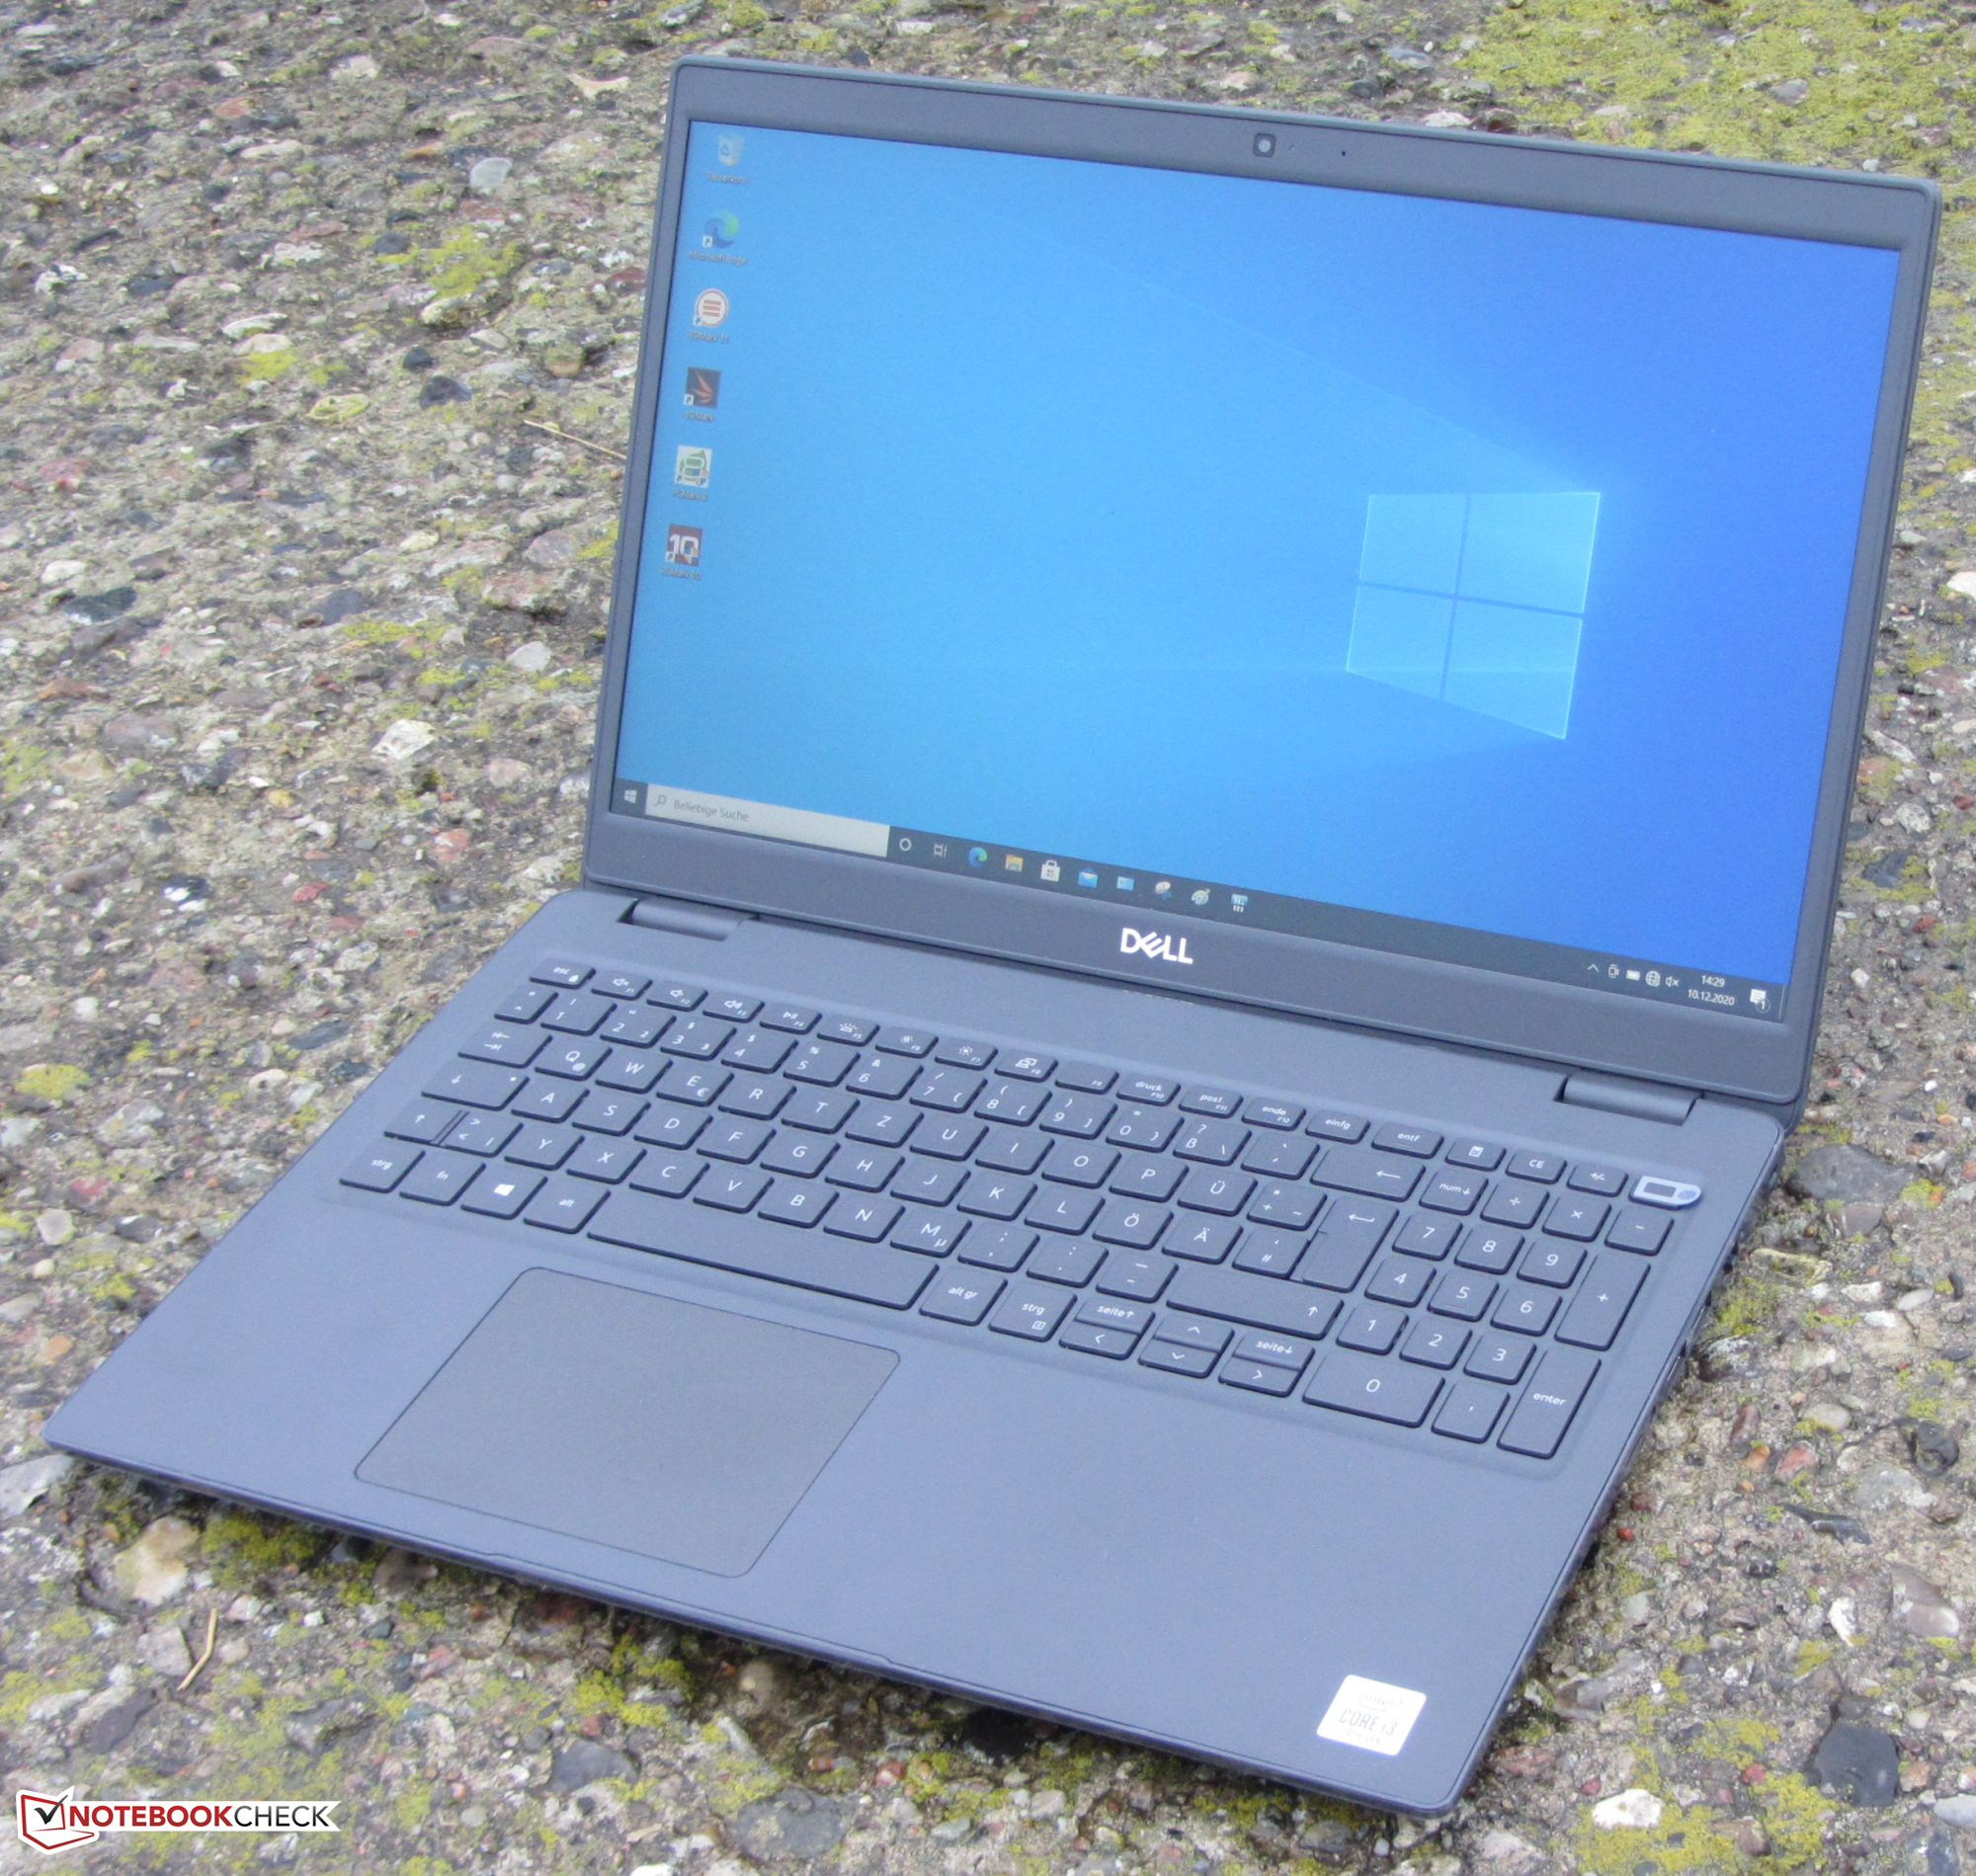
Dell Latitude 15 3510 NK2MC
- 12/18/2020 v7 (old)
Sascha Mölck
Price comparison
