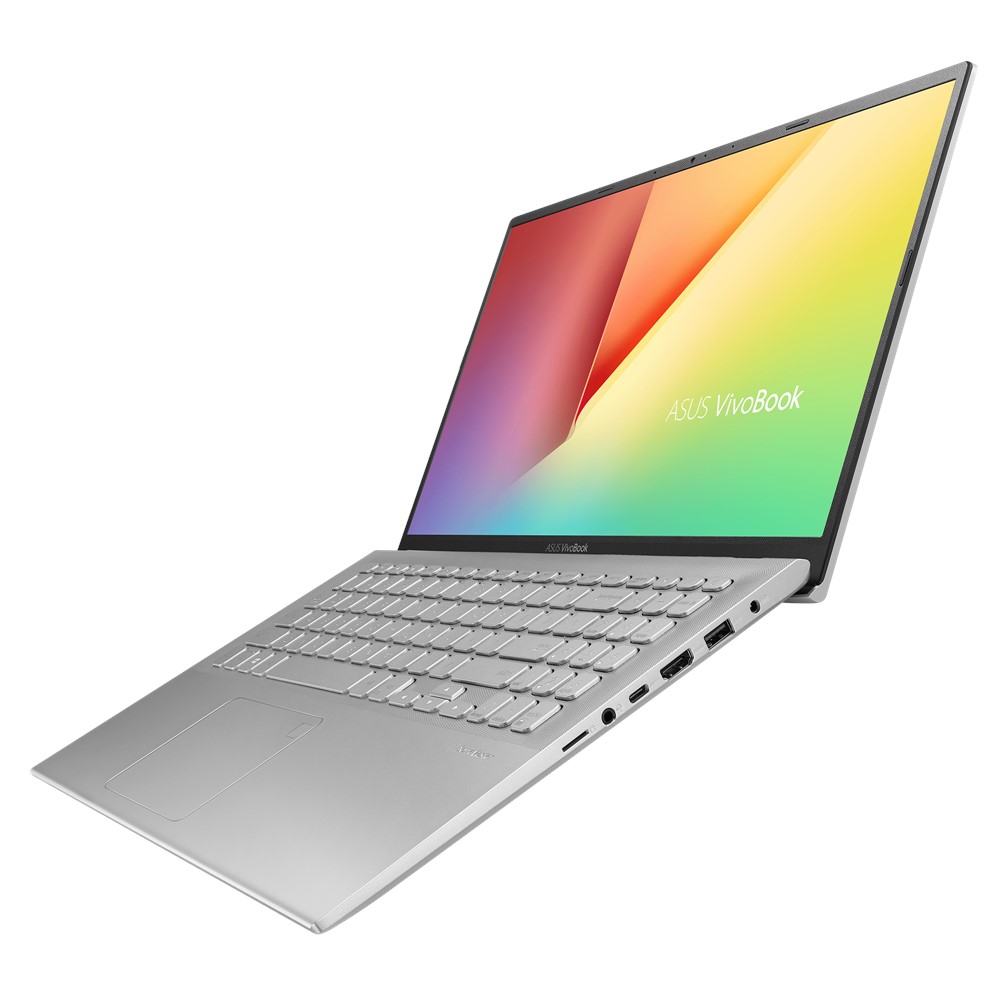
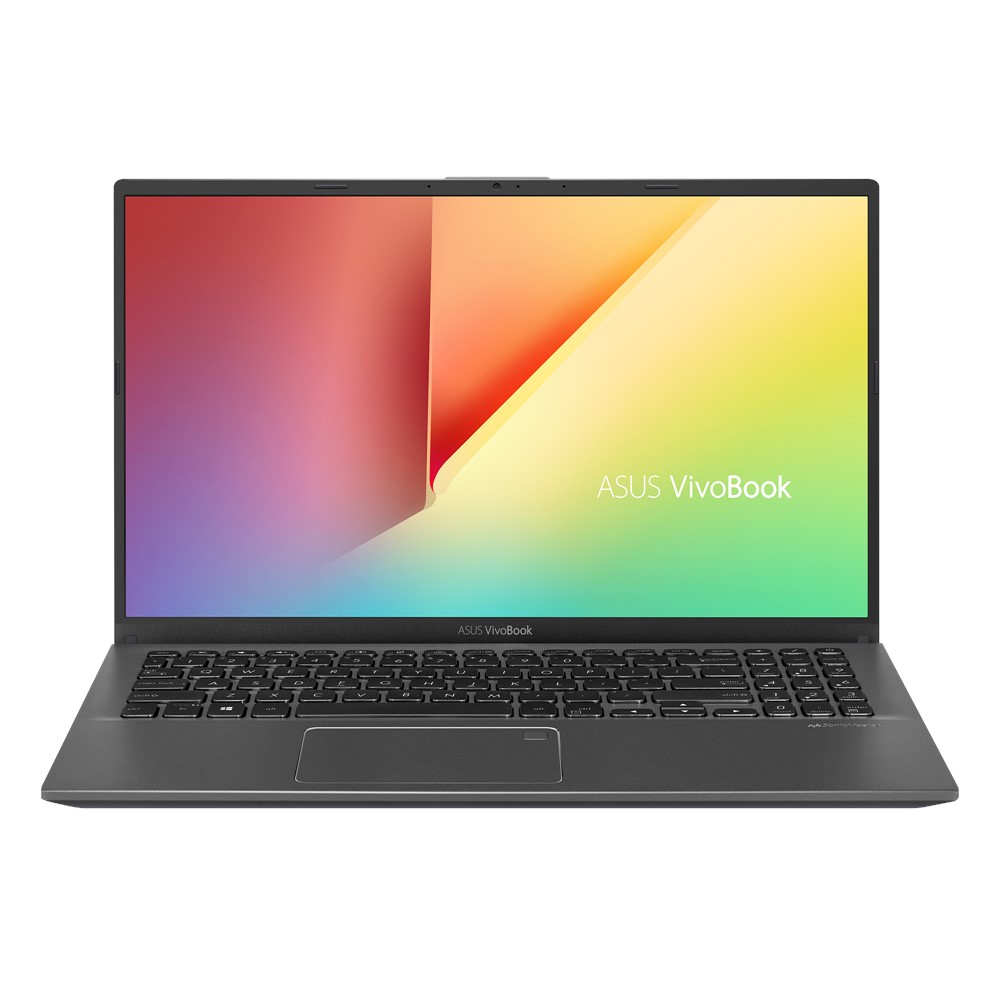
Recensione del Laptop Asus Vivobook 15 F512DA: AMD Ryzen 3 a $400
Punteggio | Data | Modello | Peso | Altezza | Dimensione | Risoluzione | Prezzo |
|---|---|---|---|---|---|---|---|
| 73.1 % v7 (old) | 04/2020 | Asus Vivobook 15 F512DA-SH31 R3 3200U, Vega 3 | 1.8 kg | 19.9 mm | 15.60" | 1920x1080 | |
| 79.4 % v7 (old) | 03/2020 | Lenovo Ideapad S340-15IIL i7-1065G7, Iris Plus Graphics G7 (Ice Lake 64 EU) | 1.8 kg | 17.9 mm | 15.60" | 1920x1080 | |
| 78.4 % v7 (old) | 11/2019 | Acer Aspire 5 A515-43-R6WW R5 3500U, Vega 8 | 1.8 kg | 18 mm | 15.60" | 1920x1080 | |
| 77.6 % v6 (old) | 06/2019 | Dell Inspiron 15 3585 (2300U, Vega 6) R3 2300U, Vega 6 | 1.9 kg | 20 mm | 15.60" | 1920x1080 | |
| 85.2 % v7 (old) | 03/2020 | Huawei MateBook D 15-53010TUY R5 3500U, Vega 8 | 1.5 kg | 16.9 mm | 15.60" | 1920x1080 |

| SD Card Reader | |
| average JPG Copy Test (av. of 3 runs) | |
| Dell XPS 15 9570 Core i9 UHD (Toshiba Exceria Pro SDXC 64 GB UHS-II) | |
| Lenovo Ideapad S340-15IIL (Toshiba Exceria Pro SDXC 64 GB UHS-II) | |
| Dell Inspiron 15 3585 (2300U, Vega 6) (Toshiba Exceria Pro SDXC 64 GB UHS-II) | |
| Asus Vivobook 15 F512DA-SH31 (Toshiba Exceria Pro M501 64 GB UHS-II) | |
| maximum AS SSD Seq Read Test (1GB) | |
| Dell XPS 15 9570 Core i9 UHD (Toshiba Exceria Pro SDXC 64 GB UHS-II) | |
| Lenovo Ideapad S340-15IIL (Toshiba Exceria Pro SDXC 64 GB UHS-II) | |
| Asus Vivobook 15 F512DA-SH31 (Toshiba Exceria Pro M501 64 GB UHS-II) | |
| Dell Inspiron 15 3585 (2300U, Vega 6) (Toshiba Exceria Pro SDXC 64 GB UHS-II) | |


| |||||||||||||||||||||||||
Distribuzione della luminosità: 89 %
Al centro con la batteria: 216.3 cd/m²
Contrasto: 294:1 (Nero: 0.86 cd/m²)
ΔE ColorChecker Calman: 4.83 | ∀{0.5-29.43 Ø4.72}
calibrated: 3.78
ΔE Greyscale Calman: 4.6 | ∀{0.09-98 Ø4.97}
58.1% sRGB (Argyll 1.6.3 3D)
36.9% AdobeRGB 1998 (Argyll 1.6.3 3D)
40% AdobeRGB 1998 (Argyll 3D)
58.2% sRGB (Argyll 3D)
38.71% Display P3 (Argyll 3D)
Gamma: 2.34
CCT: 6841 K
| Asus Vivobook 15 F512DA-SH31 AU Optronics B156HAN02.1, IPS, 15.6", 1920x1080 | Lenovo Ideapad S340-15IIL BOE CQ NV156FHM-T03, IPS, 15.6", 1920x1080 | Acer Aspire 5 A515-43-R6WW CEC PANDA LM156LF-CL07, IPS, 15.6", 1920x1080 | Dell Inspiron 15 3585 (2300U, Vega 6) BOE0802, TN, 15.6", 1920x1080 | Asus ZenBook 15 UX534FTC-A8190T BOE CQ NV156FHM-N63, IPS, 15.6", 1920x1080 | Huawei MateBook D 15-53010TUY AU Optronics AUO28ED, IPS, 15.6", 1920x1080 | |
|---|---|---|---|---|---|---|
| Display | 3% | 2% | 1% | 58% | 5% | |
| Display P3 Coverage (%) | 38.71 | 40.43 4% | 39.53 2% | 39.22 1% | 65 68% | 40.49 5% |
| sRGB Coverage (%) | 58.2 | 58.8 1% | 59.5 2% | 58.9 1% | 86.2 48% | 60.9 5% |
| AdobeRGB 1998 Coverage (%) | 40 | 41.77 4% | 40.84 2% | 40.52 1% | 62.9 57% | 41.84 5% |
| Response Times | -24% | 8% | 26% | -17% | -13% | |
| Response Time Grey 50% / Grey 80% * (ms) | 36 ? | 46.4 ? -29% | 36 ? -0% | 39 ? -8% | 45 ? -25% | 43.6 ? -21% |
| Response Time Black / White * (ms) | 29.6 ? | 35.2 ? -19% | 25 ? 16% | 12 ? 59% | 32 ? -8% | 31.2 ? -5% |
| PWM Frequency (Hz) | 178 ? | 250 ? | ||||
| Screen | 23% | 35% | -22% | 67% | 58% | |
| Brightness middle (cd/m²) | 252.8 | 320.8 27% | 250 -1% | 225 -11% | 299 18% | 271 7% |
| Brightness (cd/m²) | 237 | 309 30% | 228 -4% | 213 -10% | 280 18% | 256 8% |
| Brightness Distribution (%) | 89 | 87 -2% | 83 -7% | 88 -1% | 89 0% | 90 1% |
| Black Level * (cd/m²) | 0.86 | 0.27 69% | 0.205 76% | 0.535 38% | 0.21 76% | 0.15 83% |
| Contrast (:1) | 294 | 1188 304% | 1220 315% | 421 43% | 1424 384% | 1807 515% |
| Colorchecker dE 2000 * | 4.83 | 7.68 -59% | 5.65 -17% | 10.37 -115% | 4.76 1% | 4.7 3% |
| Colorchecker dE 2000 max. * | 16.38 | 21.97 -34% | 13.7 16% | 19.75 -21% | 9 45% | 20.4 -25% |
| Colorchecker dE 2000 calibrated * | 3.78 | 4.65 -23% | 3.89 -3% | 4.6 -22% | ||
| Greyscale dE 2000 * | 4.6 | 7.3 -59% | 6.32 -37% | 12.09 -163% | 3.53 23% | 1.6 65% |
| Gamma | 2.34 94% | 2.12 104% | 2.45 90% | 2.72 81% | 2.3 96% | 2.17 101% |
| CCT | 6841 95% | 6213 105% | 7287 89% | 13335 49% | 7228 90% | 6649 98% |
| Color Space (Percent of AdobeRGB 1998) (%) | 36.9 | 37.8 2% | 38 3% | 37 0% | 56 52% | 38.5 4% |
| Color Space (Percent of sRGB) (%) | 58.1 | 58.3 0% | 59 2% | 59 2% | 86 48% | 60.6 4% |
| Media totale (Programma / Settaggio) | 1% /
14% | 15% /
25% | 2% /
-12% | 36% /
54% | 17% /
40% |
* ... Meglio usare valori piccoli
Tempi di risposta del Display
| ↔ Tempi di risposta dal Nero al Bianco | ||
|---|---|---|
| 29.6 ms ... aumenta ↗ e diminuisce ↘ combinato | ↗ 18 ms Incremento | 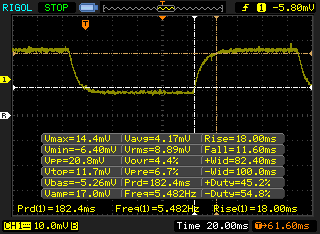 |
| ↘ 11.6 ms Calo | ||
| Lo schermo mostra tempi di risposta relativamente lenti nei nostri tests e potrebbe essere troppo lento per i gamers. In confronto, tutti i dispositivi di test variano da 0.1 (minimo) a 240 (massimo) ms. » 79 % di tutti i dispositivi è migliore. Questo significa che i tempi di risposta rilevati sono peggiori rispetto alla media di tutti i dispositivi testati (19.8 ms). | ||
| ↔ Tempo di risposta dal 50% Grigio all'80% Grigio | ||
| 36 ms ... aumenta ↗ e diminuisce ↘ combinato | ↗ 20 ms Incremento | 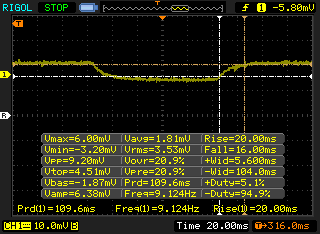 |
| ↘ 16 ms Calo | ||
| Lo schermo mostra tempi di risposta lenti nei nostri tests e sarà insoddisfacente per i gamers. In confronto, tutti i dispositivi di test variano da 0.165 (minimo) a 636 (massimo) ms. » 50 % di tutti i dispositivi è migliore. Questo significa che i tempi di risposta rilevati sono peggiori rispetto alla media di tutti i dispositivi testati (31 ms). | ||
Sfarfallio dello schermo / PWM (Pulse-Width Modulation)
| flickering dello schermo / PWM non rilevato | 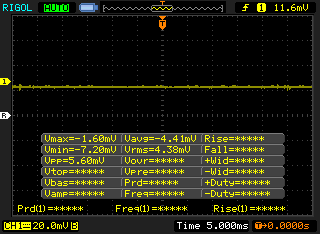 | ||
In confronto: 52 % di tutti i dispositivi testati non utilizza PWM per ridurre la luminosita' del display. Se è rilevato PWM, una media di 7781 (minimo: 5 - massimo: 343500) Hz è stata rilevata. | |||
| Cinebench R11.5 | |
| CPU Single 64Bit | |
| Dell XPS 13 7390 2-in-1 Core i3 | |
| Dell Inspiron 15 5000 5585 | |
| Chuwi LapBook Plus | |
| CPU Multi 64Bit | |
| Dell Inspiron 15 5000 5585 | |
| Dell XPS 13 7390 2-in-1 Core i3 | |
| Chuwi LapBook Plus | |
| wPrime 2.10 - 1024m | |
| Chuwi LapBook Plus | |
| HP ProBook x360 11 G4 | |
| Intel NUC5i3RYK | |
| Media AMD Ryzen 3 3200U (n=1) | |
| Dell XPS 13 7390 2-in-1 Core i3 | |
* ... Meglio usare valori piccoli
| PCMark 8 Home Score Accelerated v2 | 2742 punti | |
| PCMark 8 Work Score Accelerated v2 | 4239 punti | |
| PCMark 10 Score | 3028 punti | |
Aiuto | ||
| DPC Latencies / LatencyMon - interrupt to process latency (max), Web, Youtube, Prime95 | |
| Asus Vivobook 15 F512DA-SH31 | |
* ... Meglio usare valori piccoli
| Asus Vivobook 15 F512DA-SH31 SanDisk X600 SD9SN8W-128G | Lenovo Ideapad S340-15IIL Intel SSD 660p SSDPEKNW512G8 | Acer Aspire 5 A515-43-R6WW Intel SSD 660p 1TB SSDPEKNW010T8 | Dell Inspiron 15 3585 (2300U, Vega 6) Toshiba BG3 KBG30ZMS256G | Asus ZenBook 15 UX534FTC-A8190T Samsung SSD PM981 MZVLB1T0HALR | Huawei MateBook D 15-53010TUY Samsung SSD PM981 MZVLB256HAHQ | |
|---|---|---|---|---|---|---|
| AS SSD | 444% | 357% | 153% | 773% | 530% | |
| Seq Read (MB/s) | 341.4 | 1447 324% | 1358 298% | 1291 278% | 2643 674% | 2613 665% |
| Seq Write (MB/s) | 134.2 | 926 590% | 1300 869% | 688 413% | 1533 1042% | 1549 1054% |
| 4K Read (MB/s) | 27.83 | 40.06 44% | 44.88 61% | 21.87 -21% | 49.12 77% | 47.15 69% |
| 4K Write (MB/s) | 54.9 | 97.9 78% | 77.5 41% | 35.62 -35% | 134.7 145% | 111.6 103% |
| 4K-64 Read (MB/s) | 217.1 | 323.7 49% | 586 170% | 632 191% | 1028 374% | 748 245% |
| 4K-64 Write (MB/s) | 68.1 | 791 1062% | 738 984% | 221.2 225% | 1353 1887% | 1275 1772% |
| Access Time Read * (ms) | 0.153 | 0.06 61% | 0.33 -116% | 0.033 78% | 0.062 59% | |
| Access Time Write * (ms) | 1.075 | 0.144 87% | 0.057 95% | 0.234 78% | 0.028 97% | 0.042 96% |
| Score Read (Points) | 279 | 508 82% | 767 175% | 783 181% | 1342 381% | 1057 279% |
| Score Write (Points) | 136 | 982 622% | 945 595% | 326 140% | 1641 1107% | 1542 1034% |
| Score Total (Points) | 559 | 1738 211% | 2115 278% | 1489 166% | 3622 548% | 3097 454% |
| Copy ISO MB/s (MB/s) | 115.9 | 943 714% | 432.6 273% | 2226 1821% | ||
| Copy Program MB/s (MB/s) | 44.51 | 612 1275% | 95.6 115% | 506 1037% | ||
| Copy Game MB/s (MB/s) | 74.3 | 826 1012% | 263.4 255% | 1230 1555% | ||
| CrystalDiskMark 5.2 / 6 | 198% | 204% | 96% | 395% | 314% | |
| Write 4K (MB/s) | 65.2 | 130.8 101% | 114.9 76% | 87.3 34% | 138.1 112% | 134.8 107% |
| Read 4K (MB/s) | 31.22 | 54.8 76% | 52.7 69% | 23.54 -25% | 45.89 47% | 41.68 34% |
| Write Seq (MB/s) | 284.8 | 978 243% | 1361 378% | 824 189% | 2147 654% | 1651 480% |
| Read Seq (MB/s) | 497.5 | 1627 227% | 1385 178% | 715 44% | 2188 340% | 2300 362% |
| Write 4K Q32T1 (MB/s) | 164 | 450.1 174% | 181.1 10% | 147.8 -10% | 427.8 161% | 260 59% |
| Read 4K Q32T1 (MB/s) | 230.2 | 345.9 50% | 340.5 48% | 256.1 11% | 404 75% | 335.1 46% |
| Write Seq Q32T1 (MB/s) | 221.7 | 982 343% | 1519 585% | 733 231% | 2396 981% | 1641 640% |
| Read Seq Q32T1 (MB/s) | 389.7 | 1842 373% | 1515 289% | 1525 291% | 3454 786% | 3452 786% |
| Media totale (Programma / Settaggio) | 321% /
354% | 281% /
289% | 125% /
132% | 584% /
635% | 422% /
439% |
* ... Meglio usare valori piccoli

| 3DMark 11 Performance | 1794 punti | |
| 3DMark Ice Storm Standard Score | 61617 punti | |
| 3DMark Cloud Gate Standard Score | 5975 punti | |
| 3DMark Fire Strike Score | 943 punti | |
| 3DMark Time Spy Score | 340 punti | |
Aiuto | ||
| Dota 2 Reborn | |
| 1280x720 min (0/3) fastest | |
| Acer Aspire 5 A515-54G | |
| Lenovo ThinkBook 15 | |
| Dell XPS 13 9300 i5 FHD | |
| Asus VivoBook S15 S510UA | |
| Lenovo ThinkPad X1 Yoga 20SA000GUS | |
| Intel NUC5i3RYK | |
| Huawei MateBook D 15-53010TUY | |
| HP Pavilion 15-cw1212ng | |
| Asus Vivobook 15 F512DA-SH31 | |
| 1366x768 med (1/3) | |
| Acer Aspire 5 A515-54G | |
| Huawei MateBook D 15-53010TUY | |
| Asus VivoBook S15 S510UA | |
| Lenovo ThinkBook 15 | |
| Lenovo ThinkPad X1 Yoga 20SA000GUS | |
| Dell XPS 13 9300 i5 FHD | |
| HP Pavilion 15-cw1212ng | |
| Asus Vivobook 15 F512DA-SH31 | |
| Intel NUC5i3RYK | |
| basso | medio | alto | ultra | |
|---|---|---|---|---|
| Dota 2 Reborn (2015) | 60.8 | 38.8 | 18.2 | 16.9 |
| X-Plane 11.11 (2018) | 18.3 | 12.3 | 11.1 |
| Asus Vivobook 15 F512DA-SH31 Vega 3, R3 3200U, SanDisk X600 SD9SN8W-128G | Lenovo Ideapad S340-15IIL Iris Plus Graphics G7 (Ice Lake 64 EU), i7-1065G7, Intel SSD 660p SSDPEKNW512G8 | Acer Aspire 5 A515-43-R6WW Vega 8, R5 3500U, Intel SSD 660p 1TB SSDPEKNW010T8 | Dell Inspiron 15 3585 (2300U, Vega 6) Vega 6, R3 2300U, Toshiba BG3 KBG30ZMS256G | Asus ZenBook 15 UX534FTC-A8190T GeForce GTX 1650 Max-Q, i7-10510U, Samsung SSD PM981 MZVLB1T0HALR | Huawei MateBook D 15-53010TUY Vega 8, R5 3500U, Samsung SSD PM981 MZVLB256HAHQ | |
|---|---|---|---|---|---|---|
| Noise | 1% | -7% | -10% | -6% | -1% | |
| off /ambiente * (dB) | 29.2 | 28.5 2% | 30.2 -3% | 30.6 -5% | 30.3 -4% | 29.6 -1% |
| Idle Minimum * (dB) | 29.2 | 28.5 2% | 30.2 -3% | 30.6 -5% | 30.3 -4% | 29.6 -1% |
| Idle Average * (dB) | 29.2 | 28.5 2% | 30.2 -3% | 30.6 -5% | 30.3 -4% | 29.6 -1% |
| Idle Maximum * (dB) | 29.2 | 28.5 2% | 30.2 -3% | 30.6 -5% | 30.9 -6% | 29.6 -1% |
| Load Average * (dB) | 30.5 | 30.3 1% | 34.8 -14% | 36.7 -20% | 31.3 -3% | 30.6 -0% |
| Load Maximum * (dB) | 34 | 35.5 -4% | 39.5 -16% | 41.1 -21% | 38.2 -12% | 33.8 1% |
| Witcher 3 ultra * (dB) | 38.1 |
* ... Meglio usare valori piccoli
Rumorosità
| Idle |
| 29.2 / 29.2 / 29.2 dB(A) |
| Sotto carico |
| 30.5 / 34 dB(A) |
 | ||
30 dB silenzioso 40 dB(A) udibile 50 dB(A) rumoroso |
||
min: | ||
(+) La temperatura massima sul lato superiore è di 33 °C / 91 F, rispetto alla media di 36.8 °C / 98 F, che varia da 21 a 71 °C per questa classe Multimedia.
(±) Il lato inferiore si riscalda fino ad un massimo di 41.4 °C / 107 F, rispetto alla media di 39.1 °C / 102 F
(+) In idle, la temperatura media del lato superiore è di 25.8 °C / 78 F, rispetto alla media deld ispositivo di 31.3 °C / 88 F.
(+) I poggiapolsi e il touchpad sono piu' freddi della temperatura della pelle con un massimo di 24.2 °C / 75.6 F e sono quindi freddi al tatto.
(+) La temperatura media della zona del palmo della mano di dispositivi simili e'stata di 28.7 °C / 83.7 F (+4.5 °C / 8.1 F).
Asus Vivobook 15 F512DA-SH31 analisi audio
(±) | potenza degli altiparlanti media ma buona (78.6 dB)
Bassi 100 - 315 Hz
(±) | bassi ridotti - in media 13.6% inferiori alla media
(±) | la linearità dei bassi è media (13.9% delta rispetto alla precedente frequenza)
Medi 400 - 2000 Hz
(+) | medi bilanciati - solo only 3.7% rispetto alla media
(+) | medi lineari (5% delta rispetto alla precedente frequenza)
Alti 2 - 16 kHz
(+) | Alti bilanciati - appena 3% dalla media
(+) | alti lineari (6.2% delta rispetto alla precedente frequenza)
Nel complesso 100 - 16.000 Hz
(±) | la linearità complessiva del suono è media (18.9% di differenza rispetto alla media
Rispetto alla stessa classe
» 59% di tutti i dispositivi testati in questa classe è stato migliore, 7% simile, 33% peggiore
» Il migliore ha avuto un delta di 5%, medio di 17%, peggiore di 45%
Rispetto a tutti i dispositivi testati
» 44% di tutti i dispositivi testati in questa classe è stato migliore, 8% similare, 48% peggiore
» Il migliore ha avuto un delta di 4%, medio di 24%, peggiore di 134%
Apple MacBook 12 (Early 2016) 1.1 GHz analisi audio
(+) | gli altoparlanti sono relativamente potenti (83.6 dB)
Bassi 100 - 315 Hz
(±) | bassi ridotti - in media 11.3% inferiori alla media
(±) | la linearità dei bassi è media (14.2% delta rispetto alla precedente frequenza)
Medi 400 - 2000 Hz
(+) | medi bilanciati - solo only 2.4% rispetto alla media
(+) | medi lineari (5.5% delta rispetto alla precedente frequenza)
Alti 2 - 16 kHz
(+) | Alti bilanciati - appena 2% dalla media
(+) | alti lineari (4.5% delta rispetto alla precedente frequenza)
Nel complesso 100 - 16.000 Hz
(+) | suono nel complesso lineare (10.2% differenza dalla media)
Rispetto alla stessa classe
» 7% di tutti i dispositivi testati in questa classe è stato migliore, 2% simile, 91% peggiore
» Il migliore ha avuto un delta di 5%, medio di 18%, peggiore di 53%
Rispetto a tutti i dispositivi testati
» 5% di tutti i dispositivi testati in questa classe è stato migliore, 1% similare, 94% peggiore
» Il migliore ha avuto un delta di 4%, medio di 24%, peggiore di 134%
| Off / Standby | |
| Idle | |
| Sotto carico |
|
Leggenda:
min: | |
| Asus Vivobook 15 F512DA-SH31 R3 3200U, Vega 3, SanDisk X600 SD9SN8W-128G, IPS, 1920x1080, 15.6" | Lenovo Ideapad S340-15IIL i7-1065G7, Iris Plus Graphics G7 (Ice Lake 64 EU), Intel SSD 660p SSDPEKNW512G8, IPS, 1920x1080, 15.6" | Acer Aspire 5 A515-43-R6WW R5 3500U, Vega 8, Intel SSD 660p 1TB SSDPEKNW010T8, IPS, 1920x1080, 15.6" | Dell Inspiron 15 3585 (2300U, Vega 6) R3 2300U, Vega 6, Toshiba BG3 KBG30ZMS256G, TN, 1920x1080, 15.6" | Asus ZenBook 15 UX534FTC-A8190T i7-10510U, GeForce GTX 1650 Max-Q, Samsung SSD PM981 MZVLB1T0HALR, IPS, 1920x1080, 15.6" | Huawei MateBook D 15-53010TUY R5 3500U, Vega 8, Samsung SSD PM981 MZVLB256HAHQ, IPS, 1920x1080, 15.6" | |
|---|---|---|---|---|---|---|
| Power Consumption | -19% | -3% | -37% | -65% | -33% | |
| Idle Minimum * (Watt) | 3.2 | 3.8 -19% | 3.7 -16% | 6.3 -97% | 2.8 13% | 5.2 -63% |
| Idle Average * (Watt) | 6.8 | 6.9 -1% | 6.2 9% | 9.2 -35% | 7.7 -13% | 8.8 -29% |
| Idle Maximum * (Watt) | 7.7 | 7.7 -0% | 8.4 -9% | 9.6 -25% | 9.4 -22% | 10.2 -32% |
| Load Average * (Watt) | 30.3 | 43.3 -43% | 31.1 -3% | 38 -25% | 57 -88% | 37.5 -24% |
| Witcher 3 ultra * (Watt) | 28.2 | 40.4 -43% | 62 -120% | |||
| Load Maximum * (Watt) | 44.4 | 47.5 -7% | 43.1 3% | 46 -4% | 116 -161% | 50.9 -15% |
* ... Meglio usare valori piccoli
| Asus Vivobook 15 F512DA-SH31 R3 3200U, Vega 3, 37 Wh | Lenovo Ideapad S340-15IIL i7-1065G7, Iris Plus Graphics G7 (Ice Lake 64 EU), 36 Wh | Acer Aspire 5 A515-43-R6WW R5 3500U, Vega 8, 48 Wh | Dell Inspiron 15 3585 (2300U, Vega 6) R3 2300U, Vega 6, 42 Wh | Asus ZenBook 15 UX534FTC-A8190T i7-10510U, GeForce GTX 1650 Max-Q, 71 Wh | Huawei MateBook D 15-53010TUY R5 3500U, Vega 8, 42 Wh | |
|---|---|---|---|---|---|---|
| Autonomia della batteria | -28% | 30% | -12% | 107% | 30% | |
| WiFi v1.3 (h) | 6 | 4.3 -28% | 7.8 30% | 5.3 -12% | 12.4 107% | 7.8 30% |
| Reader / Idle (h) | 10 | 17.7 | 7.3 | 27.2 | ||
| Load (h) | 1.1 | 2.2 | 1.8 | 2.4 | 1.3 |
Pro
Contro
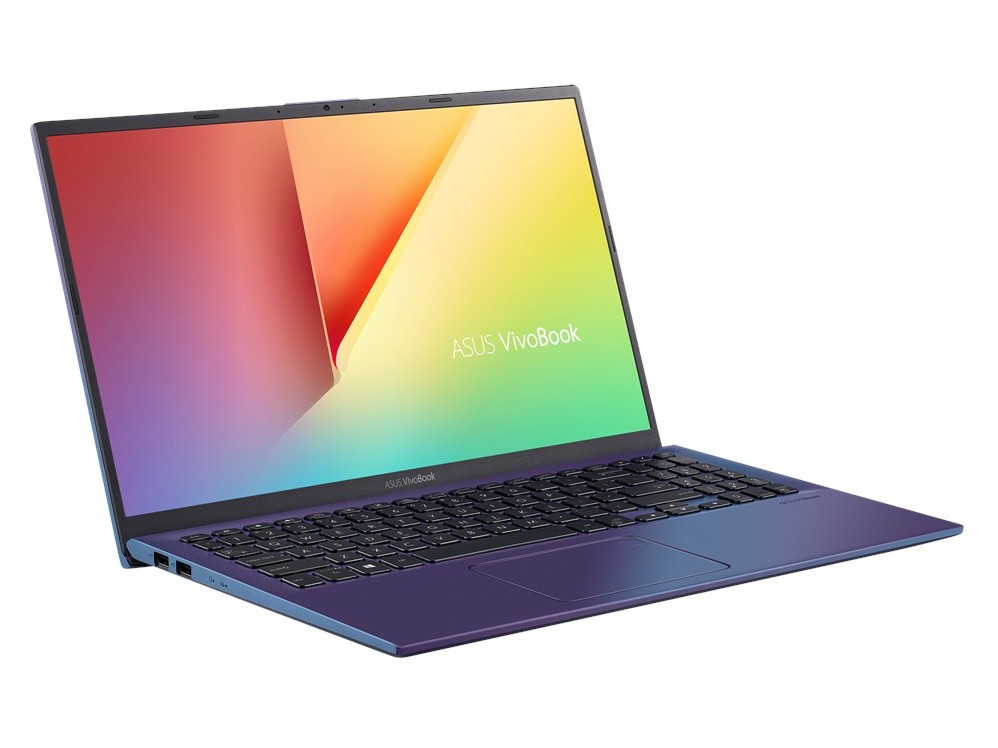
La nostra configurazione Ryzen 3 viene venduta al dettaglio ad un prezzo inferiore rispetto alla configurazione Intel Core i3, pur offrendo essenzialmente le stesse prestazioni. Questo è un buon esempio miglior rapporto prestazioni/prezzo di AMD rispetto a quelle di Intel anche in termini di budget. Gli svantaggi includono i soli 4 GB di RAM e lo spazio di archiviazione ridotto, ma questo VivoBook è sorprendentemente facile da manutenere e aggiornare per dare al sistema sia gambe più lunghe che un prezzo base più contenuto.
Se siete disposti a spendere circa 200 dollari in più, vi consigliamo invece di dare un'occhiata al Huawei MateBook D 15 alimentato da AMD, soprattutto se avete intenzione di viaggiare molto con il portatile. Il display fioco del VivoBook lo rende difficile da usare nella maggior parte delle condizioni all'aperto. Se il vostro lavoro d'ufficio e i flussi video sono per lo più all'interno, allora il VivoBook di base può portare a termine il lavoro. Assicuratevi di controllare che il vostro wireless funzioni senza problemi, poiché abbiamo riscontrato problemi sulla nostra unità di prova.
Asus Vivobook 15 F512DA-SH31
- 04/20/2020 v7 (old)
Allen Ngo
