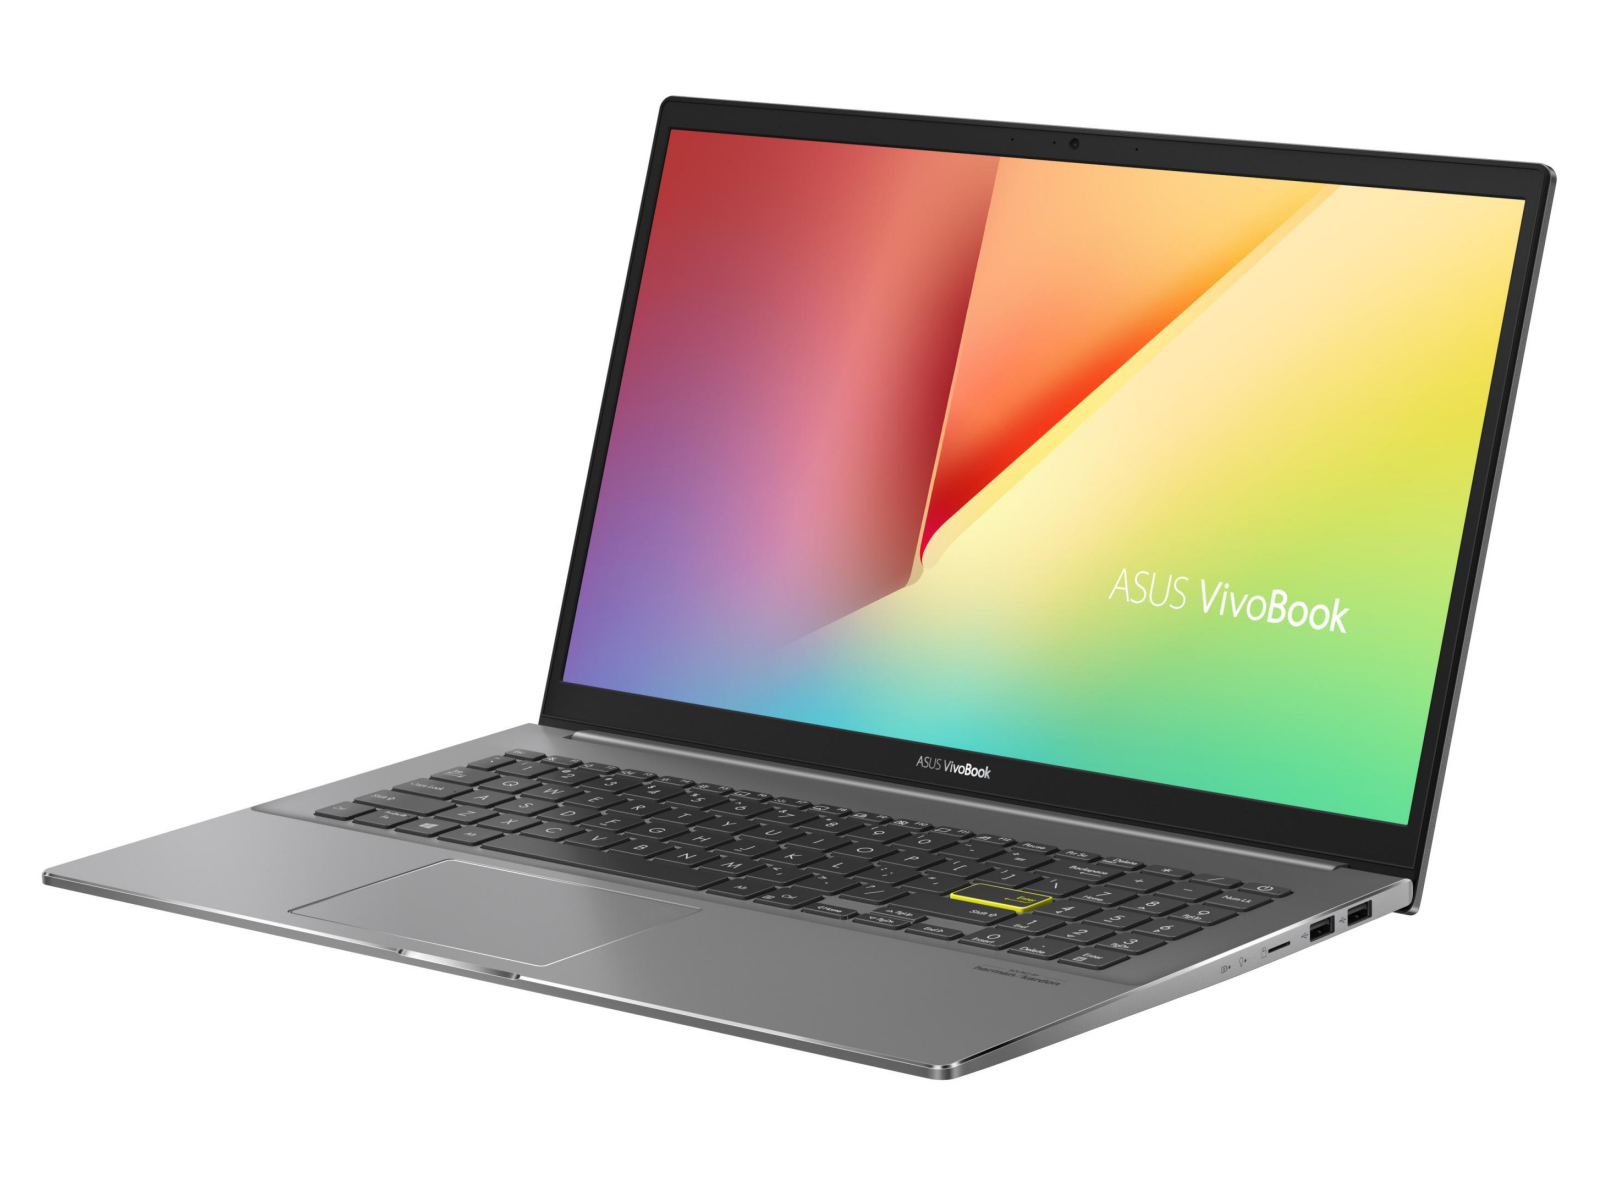
Recensione dell'Asus VivoBook S15 S533EQ: Elegante tuttofare con i punti deboli nelle dotazioni
Confronto con i possibili concorrenti
Punteggio | Data | Modello | Peso | Altezza | Dimensione | Risoluzione | Prezzo |
|---|---|---|---|---|---|---|---|
| 83.4 % v7 (old) | 12/2020 | Asus VivoBook S15 S533EQ-BQ002T i7-1165G7, GeForce MX350 | 1.8 kg | 16.1 mm | 15.60" | 1920x1080 | |
| 83 % v7 (old) | 07/2020 | Lenovo IdeaPad 5 15IIL05 i5-1035G1, GeForce MX350 | 1.7 kg | 17.9 mm | 15.60" | 1920x1080 | |
| 87.7 % v7 (old) | 12/2020 | Schenker Vision 15 i7-1165G7, Iris Xe G7 96EUs | 1.7 kg | 15 mm | 15.60" | 1920x1080 | |
| 81.7 % v7 (old) | 10/2020 | Samsung Galaxy Book Ion Aura Silver i7-10510U, GeForce MX250 | 1.3 kg | 15 mm | 15.60" | 1920x1080 |
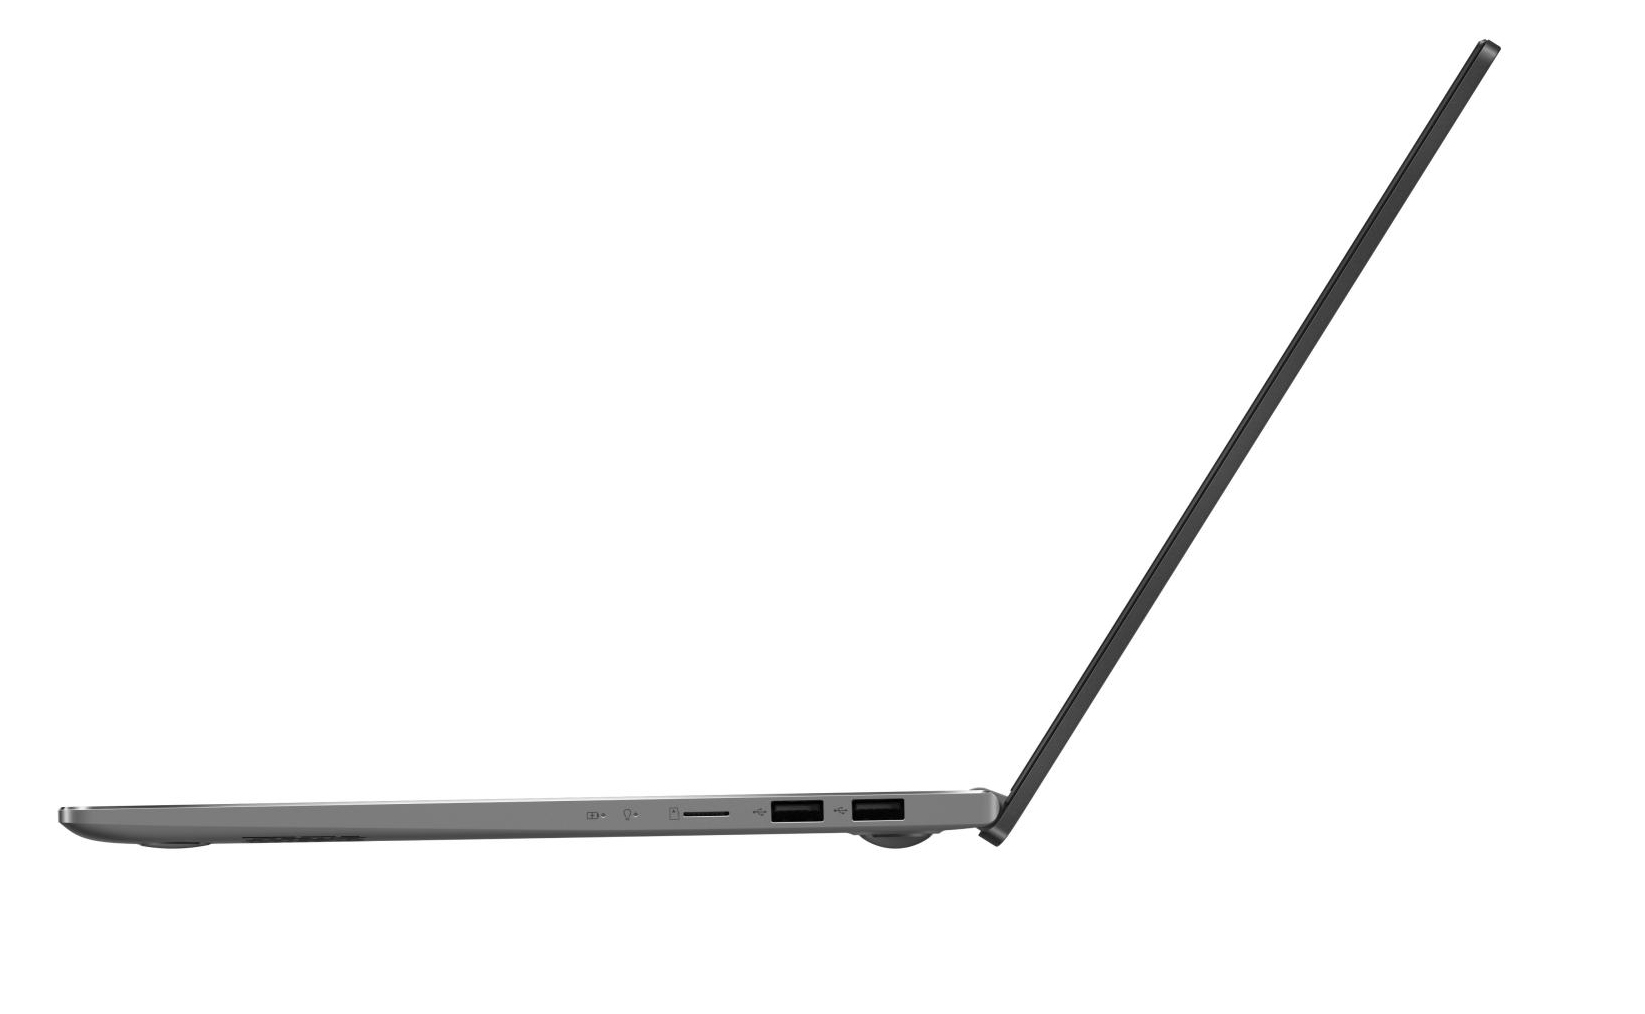

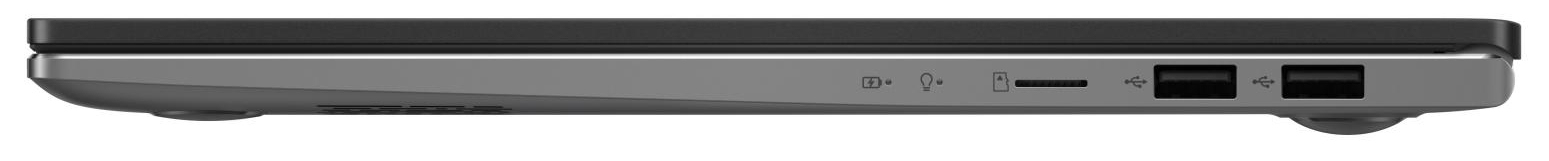
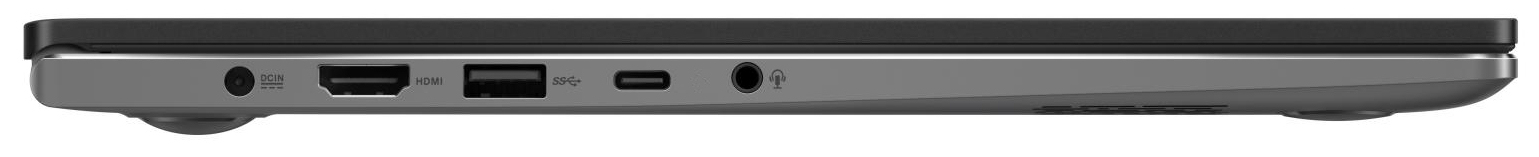
Configurazione delle porte
| SD Card Reader | |
| average JPG Copy Test (av. of 3 runs) | |
| Media della classe Multimedia (23 - 531, n=36, ultimi 2 anni) | |
| Samsung Galaxy Book Ion Aura Silver (Toshiba Exceria Pro M501 microSDXC 64GB) | |
| Asus VivoBook S15 S533EQ-BQ002T (Toshiba Exceria Pro M501 microSDXC 64GB) | |
| Lenovo IdeaPad 5 15IIL05 (Toshiba Exceria Pro SDXC 64 GB UHS-II) | |
| maximum AS SSD Seq Read Test (1GB) | |
| Media della classe Multimedia (37.3 - 1455, n=35, ultimi 2 anni) | |
| Samsung Galaxy Book Ion Aura Silver (Toshiba Exceria Pro M501 microSDXC 64GB) | |
| Lenovo IdeaPad 5 15IIL05 (Toshiba Exceria Pro SDXC 64 GB UHS-II) | |
| Asus VivoBook S15 S533EQ-BQ002T (Toshiba Exceria Pro M501 microSDXC 64GB) | |


| |||||||||||||||||||||||||
Distribuzione della luminosità: 84 %
Al centro con la batteria: 291 cd/m²
Contrasto: 563:1 (Nero: 0.51 cd/m²)
ΔE ColorChecker Calman: 4.72 | ∀{0.5-29.43 Ø4.71}
calibrated: 3.74
ΔE Greyscale Calman: 2.2 | ∀{0.09-98 Ø4.96}
58% sRGB (Argyll 1.6.3 3D)
37% AdobeRGB 1998 (Argyll 1.6.3 3D)
40.33% AdobeRGB 1998 (Argyll 3D)
58.5% sRGB (Argyll 3D)
39.01% Display P3 (Argyll 3D)
Gamma: 2.51
CCT: 6758 K
| Asus VivoBook S15 S533EQ-BQ002T Panda LM156LF-5L04, IPS, 1920x1080, 15.6" | Lenovo IdeaPad 5 15IIL05 AU Optronics B156HAN02.1, IPS, 1920x1080, 15.6" | Schenker Vision 15 BOE08F5, IPS, 1920x1080, 15.6" | Samsung Galaxy Book Ion Aura Silver BOE0889, QLED, 1920x1080, 15.6" | |
|---|---|---|---|---|
| Display | -4% | 72% | 114% | |
| Display P3 Coverage (%) | 39.01 | 37.63 -4% | 69.3 78% | 99.1 154% |
| sRGB Coverage (%) | 58.5 | 56.5 -3% | 94 61% | 99.9 71% |
| AdobeRGB 1998 Coverage (%) | 40.33 | 38.88 -4% | 70.8 76% | 87.3 116% |
| Response Times | -6% | -51% | -18% | |
| Response Time Grey 50% / Grey 80% * (ms) | 38 ? | 42 ? -11% | 60 ? -58% | 49 ? -29% |
| Response Time Black / White * (ms) | 27 ? | 27 ? -0% | 39 ? -44% | 29 ? -7% |
| PWM Frequency (Hz) | ||||
| Screen | 2% | 52% | 67% | |
| Brightness middle (cd/m²) | 287 | 340 18% | 478 67% | 467 63% |
| Brightness (cd/m²) | 261 | 325 25% | 462 77% | 437 67% |
| Brightness Distribution (%) | 84 | 88 5% | 94 12% | 91 8% |
| Black Level * (cd/m²) | 0.51 | 0.27 47% | 0.27 47% | 0.27 47% |
| Contrast (:1) | 563 | 1259 124% | 1770 214% | 1730 207% |
| Colorchecker dE 2000 * | 4.72 | 6.62 -40% | 3.2 32% | 3.39 28% |
| Colorchecker dE 2000 max. * | 17.94 | 21.05 -17% | 8.4 53% | 6.27 65% |
| Colorchecker dE 2000 calibrated * | 3.74 | 4.71 -26% | 2 47% | |
| Greyscale dE 2000 * | 2.2 | 4.61 -110% | 4.5 -105% | 2.17 1% |
| Gamma | 2.51 88% | 2.74 80% | 2.16 102% | 2.45 90% |
| CCT | 6758 96% | 6262 104% | 6788 96% | 6488 100% |
| Color Space (Percent of AdobeRGB 1998) (%) | 37 | 36 -3% | 63.1 71% | 78 111% |
| Color Space (Percent of sRGB) (%) | 58 | 56 -3% | 93.6 61% | 100 72% |
| Media totale (Programma / Settaggio) | -3% /
-0% | 24% /
43% | 54% /
65% |
* ... Meglio usare valori piccoli
Tempi di risposta del Display
| ↔ Tempi di risposta dal Nero al Bianco | ||
|---|---|---|
| 27 ms ... aumenta ↗ e diminuisce ↘ combinato | ↗ 15 ms Incremento | 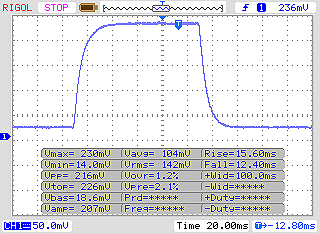 |
| ↘ 12 ms Calo | ||
| Lo schermo mostra tempi di risposta relativamente lenti nei nostri tests e potrebbe essere troppo lento per i gamers. In confronto, tutti i dispositivi di test variano da 0.1 (minimo) a 240 (massimo) ms. » 67 % di tutti i dispositivi è migliore. Questo significa che i tempi di risposta rilevati sono peggiori rispetto alla media di tutti i dispositivi testati (19.8 ms). | ||
| ↔ Tempo di risposta dal 50% Grigio all'80% Grigio | ||
| 38 ms ... aumenta ↗ e diminuisce ↘ combinato | ↗ 19 ms Incremento | 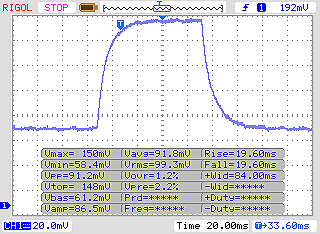 |
| ↘ 19 ms Calo | ||
| Lo schermo mostra tempi di risposta lenti nei nostri tests e sarà insoddisfacente per i gamers. In confronto, tutti i dispositivi di test variano da 0.165 (minimo) a 636 (massimo) ms. » 55 % di tutti i dispositivi è migliore. Questo significa che i tempi di risposta rilevati sono peggiori rispetto alla media di tutti i dispositivi testati (31 ms). | ||
Sfarfallio dello schermo / PWM (Pulse-Width Modulation)
| flickering dello schermo / PWM non rilevato | 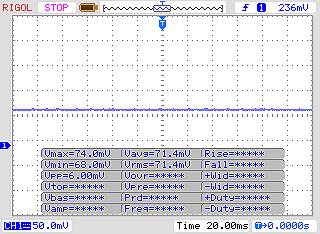 | ||
In confronto: 52 % di tutti i dispositivi testati non utilizza PWM per ridurre la luminosita' del display. Se è rilevato PWM, una media di 7754 (minimo: 5 - massimo: 343500) Hz è stata rilevata. | |||
| Cinebench R15 | |
| CPU Single 64Bit | |
| Media della classe Multimedia (184.8 - 326, n=58, ultimi 2 anni) | |
| Schenker Vision 15 | |
| Asus VivoBook S15 S533EQ-BQ002T | |
| Media Intel Core i7-1165G7 (115 - 230, n=78) | |
| Samsung Galaxy Book Ion Aura Silver | |
| Lenovo IdeaPad 5 15IIL05 | |
| CPU Multi 64Bit | |
| Media della classe Multimedia (856 - 5224, n=60, ultimi 2 anni) | |
| Schenker Vision 15 | |
| Asus VivoBook S15 S533EQ-BQ002T (Leistungsmodus) | |
| Asus VivoBook S15 S533EQ-BQ002T | |
| Media Intel Core i7-1165G7 (553 - 1027, n=86) | |
| Lenovo IdeaPad 5 15IIL05 | |
| Samsung Galaxy Book Ion Aura Silver | |
| Blender - v2.79 BMW27 CPU | |
| Samsung Galaxy Book Ion Aura Silver | |
| Media Intel Core i7-1165G7 (468 - 1138, n=80) | |
| Lenovo IdeaPad 5 15IIL05 | |
| Asus VivoBook S15 S533EQ-BQ002T | |
| Schenker Vision 15 | |
| Asus VivoBook S15 S533EQ-BQ002T (Leistungsmodus) | |
| Media della classe Multimedia (100 - 557, n=57, ultimi 2 anni) | |
| 7-Zip 18.03 | |
| 7z b 4 -mmt1 | |
| Media della classe Multimedia (3666 - 7545, n=55, ultimi 2 anni) | |
| Asus VivoBook S15 S533EQ-BQ002T (Leistungsmodus) | |
| Asus VivoBook S15 S533EQ-BQ002T | |
| Media Intel Core i7-1165G7 (4478 - 5507, n=80) | |
| Schenker Vision 15 | |
| Samsung Galaxy Book Ion Aura Silver | |
| Lenovo IdeaPad 5 15IIL05 | |
| 7z b 4 | |
| Media della classe Multimedia (26062 - 130368, n=54, ultimi 2 anni) | |
| Schenker Vision 15 | |
| Asus VivoBook S15 S533EQ-BQ002T (Leistungsmodus) | |
| Asus VivoBook S15 S533EQ-BQ002T | |
| Media Intel Core i7-1165G7 (15347 - 27405, n=80) | |
| Lenovo IdeaPad 5 15IIL05 | |
| Samsung Galaxy Book Ion Aura Silver | |
| Cinebench R20 | |
| CPU (Single Core) | |
| Media della classe Multimedia (425 - 853, n=56, ultimi 2 anni) | |
| Asus VivoBook S15 S533EQ-BQ002T | |
| Asus VivoBook S15 S533EQ-BQ002T (Leistungsmodus) | |
| Media Intel Core i7-1165G7 (442 - 589, n=81) | |
| Schenker Vision 15 | |
| Samsung Galaxy Book Ion Aura Silver | |
| Lenovo IdeaPad 5 15IIL05 | |
| CPU (Multi Core) | |
| Media della classe Multimedia (1887 - 12912, n=56, ultimi 2 anni) | |
| Asus VivoBook S15 S533EQ-BQ002T (Leistungsmodus) | |
| Asus VivoBook S15 S533EQ-BQ002T | |
| Schenker Vision 15 | |
| Media Intel Core i7-1165G7 (1060 - 2657, n=81) | |
| Lenovo IdeaPad 5 15IIL05 | |
| Samsung Galaxy Book Ion Aura Silver | |
| Geekbench 5.5 | |
| Single-Core | |
| Media della classe Multimedia (805 - 2974, n=55, ultimi 2 anni) | |
| Schenker Vision 15 | |
| Asus VivoBook S15 S533EQ-BQ002T | |
| Asus VivoBook S15 S533EQ-BQ002T | |
| Media Intel Core i7-1165G7 (1302 - 1595, n=77) | |
| Samsung Galaxy Book Ion Aura Silver | |
| Lenovo IdeaPad 5 15IIL05 | |
| Multi-Core | |
| Media della classe Multimedia (4652 - 20422, n=55, ultimi 2 anni) | |
| Schenker Vision 15 | |
| Media Intel Core i7-1165G7 (3078 - 5926, n=77) | |
| Asus VivoBook S15 S533EQ-BQ002T | |
| Asus VivoBook S15 S533EQ-BQ002T | |
| Lenovo IdeaPad 5 15IIL05 | |
| Samsung Galaxy Book Ion Aura Silver | |
| HWBOT x265 Benchmark v2.2 - 4k Preset | |
| Media della classe Multimedia (5.26 - 36.1, n=55, ultimi 2 anni) | |
| Schenker Vision 15 | |
| Asus VivoBook S15 S533EQ-BQ002T (Leistungsmodus) | |
| Lenovo IdeaPad 5 15IIL05 | |
| Media Intel Core i7-1165G7 (1.39 - 8.47, n=80) | |
| Asus VivoBook S15 S533EQ-BQ002T | |
| Samsung Galaxy Book Ion Aura Silver | |
| LibreOffice - 20 Documents To PDF | |
| Samsung Galaxy Book Ion Aura Silver | |
| Lenovo IdeaPad 5 15IIL05 | |
| Media della classe Multimedia (23.9 - 146.7, n=56, ultimi 2 anni) | |
| Media Intel Core i7-1165G7 (21.5 - 88.1, n=78) | |
| Schenker Vision 15 | |
| Asus VivoBook S15 S533EQ-BQ002T | |
| Asus VivoBook S15 S533EQ-BQ002T (Leistungsmodus) | |
| R Benchmark 2.5 - Overall mean | |
| Lenovo IdeaPad 5 15IIL05 | |
| Samsung Galaxy Book Ion Aura Silver | |
| Media Intel Core i7-1165G7 (0.552 - 1.002, n=80) | |
| Asus VivoBook S15 S533EQ-BQ002T (Leistungsmodus) | |
| Schenker Vision 15 | |
| Asus VivoBook S15 S533EQ-BQ002T | |
| Media della classe Multimedia (0.3604 - 0.947, n=55, ultimi 2 anni) | |
* ... Meglio usare valori piccoli
| PCMark 8 Home Score Accelerated v2 | 4141 punti | |
| PCMark 8 Creative Score Accelerated v2 | 4792 punti | |
| PCMark 8 Work Score Accelerated v2 | 5681 punti | |
| PCMark 10 Score | 5306 punti | |
Aiuto | ||
| DPC Latencies / LatencyMon - interrupt to process latency (max), Web, Youtube, Prime95 | |
| Schenker Vision 15 | |
| Samsung Galaxy Book Ion Aura Silver | |
| Lenovo IdeaPad 5 15IIL05 | |
| Asus VivoBook S15 S533EQ-BQ002T | |
* ... Meglio usare valori piccoli

| Asus VivoBook S15 S533EQ-BQ002T Intel SSD 660p 1TB SSDPEKNW010T8 | Lenovo IdeaPad 5 15IIL05 SK hynix BC511 HFM512GDHTNI-87A0B | Schenker Vision 15 Samsung SSD 980 Pro 1TB MZ-V8P1T0BW | Samsung Galaxy Book Ion Aura Silver WDC PC SN730 SDBQNTY-512GB | Media Intel SSD 660p 1TB SSDPEKNW010T8 | Media della classe Multimedia | |
|---|---|---|---|---|---|---|
| CrystalDiskMark 5.2 / 6 | -21% | 107% | 20% | -17% | 62% | |
| Write 4K (MB/s) | 214.4 | 159.7 -26% | 238.1 11% | 196.3 -8% | 144.5 ? -33% | 166.3 ? -22% |
| Read 4K (MB/s) | 58.5 | 48.31 -17% | 79.2 35% | 54.2 -7% | 54.1 ? -8% | 68.5 ? 17% |
| Write Seq (MB/s) | 1678 | 1038 -38% | 4139 147% | 2194 31% | 1445 ? -14% | 2667 ? 59% |
| Read Seq (MB/s) | 1648 | 1158 -30% | 4133 151% | 2508 52% | 1446 ? -12% | 3134 ? 90% |
| Write 4K Q32T1 (MB/s) | 644 | 493.9 -23% | 697 8% | 423.8 -34% | 427 ? -34% | 468 ? -27% |
| Read 4K Q32T1 (MB/s) | 600 | 522 -13% | 758 26% | 547 -9% | 456 ? -24% | 587 ? -2% |
| Write Seq Q32T1 (MB/s) | 1760 | 1028 -42% | 5187 195% | 2705 54% | 1650 ? -6% | 4667 ? 165% |
| Read Seq Q32T1 (MB/s) | 1853 | 2280 23% | 7117 284% | 3405 84% | 1728 ? -7% | 5884 ? 218% |
| AS SSD | -8% | 130% | 20% | -9% | 78% | |
| Seq Read (MB/s) | 1754 | 1625 -7% | 5427 209% | 2901 65% | 1456 ? -17% | 4507 ? 157% |
| Seq Write (MB/s) | 1567 | 860 -45% | 3886 148% | 2289 46% | 1404 ? -10% | 3049 ? 95% |
| 4K Read (MB/s) | 53 | 52.1 -2% | 72.9 38% | 46.57 -12% | 48.7 ? -8% | 62.1 ? 17% |
| 4K Write (MB/s) | 167.9 | 131.3 -22% | 219.3 31% | 137.1 -18% | 131.6 ? -22% | 184.7 ? 10% |
| 4K-64 Read (MB/s) | 586 | 797 36% | 2209 277% | 772 32% | 586 ? 0% | 1094 ? 87% |
| 4K-64 Write (MB/s) | 858 | 769 -10% | 2265 164% | 1245 45% | 788 ? -8% | 2218 ? 159% |
| Access Time Read * (ms) | 0.097 | 0.063 35% | 0.033 66% | 0.142 -46% | 0.07236 ? 25% | 0.06235 ? 36% |
| Access Time Write * (ms) | 0.038 | 0.032 16% | 0.02 47% | 0.028 26% | 0.07731 ? -103% | 0.07359 ? -94% |
| Score Read (Points) | 815 | 1012 24% | 2825 247% | 1108 36% | 780 ? -4% | 1607 ? 97% |
| Score Write (Points) | 1182 | 986 -17% | 2873 143% | 1611 36% | 1060 ? -10% | 2707 ? 129% |
| Score Total (Points) | 2421 | 2492 3% | 7069 192% | 3266 35% | 2252 ? -7% | 5075 ? 110% |
| Copy ISO MB/s (MB/s) | 1477 | 638 -57% | 2775 88% | 1597 8% | 1469 ? -1% | 2850 ? 93% |
| Copy Program MB/s (MB/s) | 495.3 | 290.2 -41% | 662 34% | 494.8 0% | 484 ? -2% | 839 ? 69% |
| Copy Game MB/s (MB/s) | 719 | 525 -27% | 1655 130% | 879 22% | 997 ? 39% | 1669 ? 132% |
| Media totale (Programma / Settaggio) | -15% /
-13% | 119% /
121% | 20% /
20% | -13% /
-12% | 70% /
73% |
* ... Meglio usare valori piccoli
Carico di lettura continuo: DiskSpd Read Loop, Queue Depth 8
| 3DMark 11 Performance | 6645 punti | |
| 3DMark Ice Storm Standard Score | 74675 punti | |
| 3DMark Cloud Gate Standard Score | 17289 punti | |
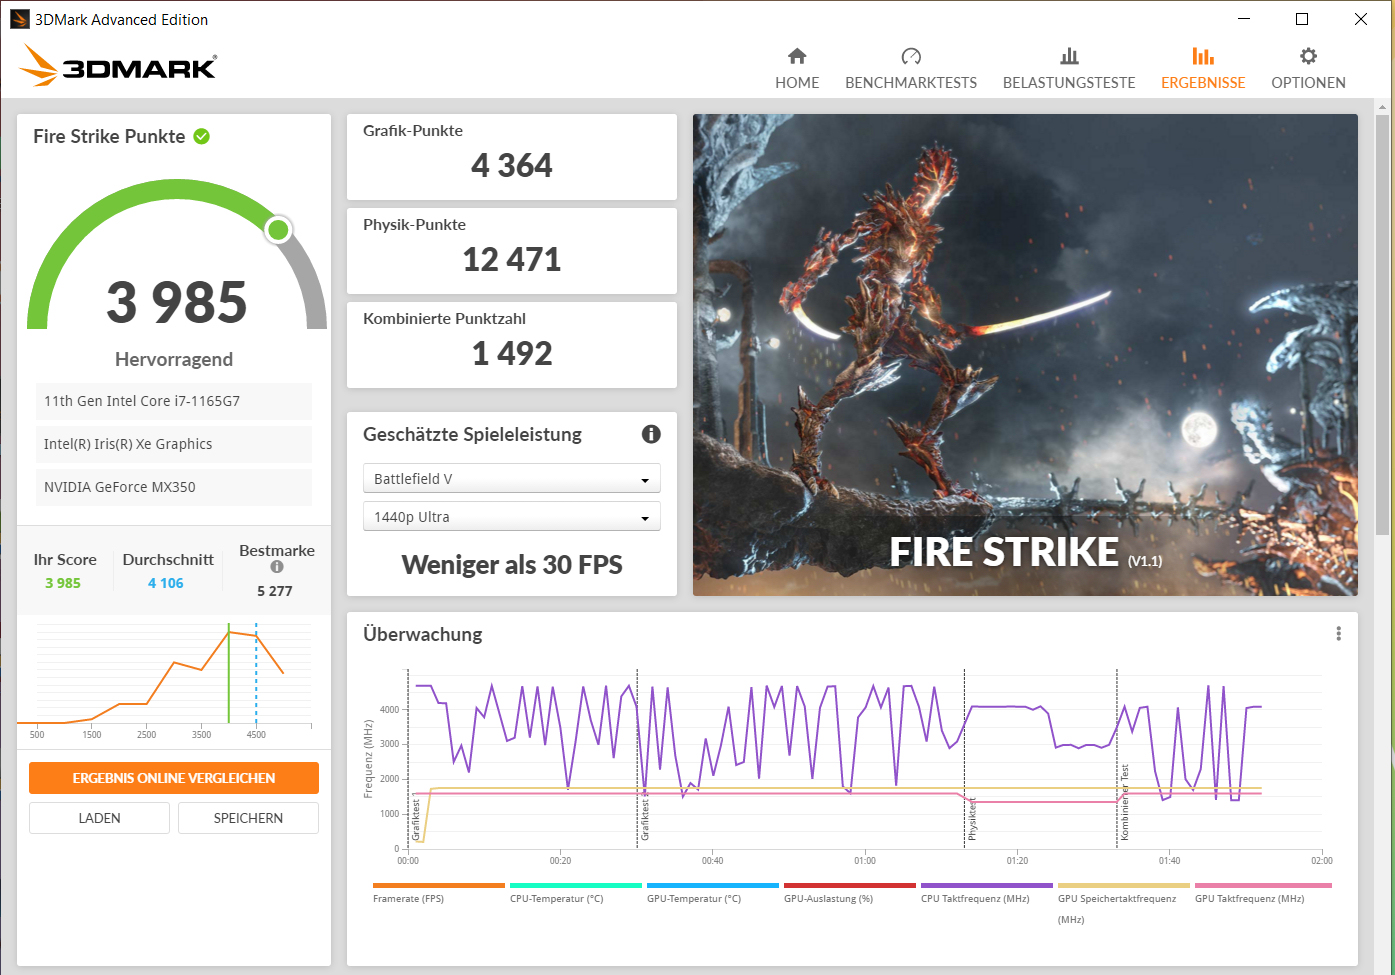
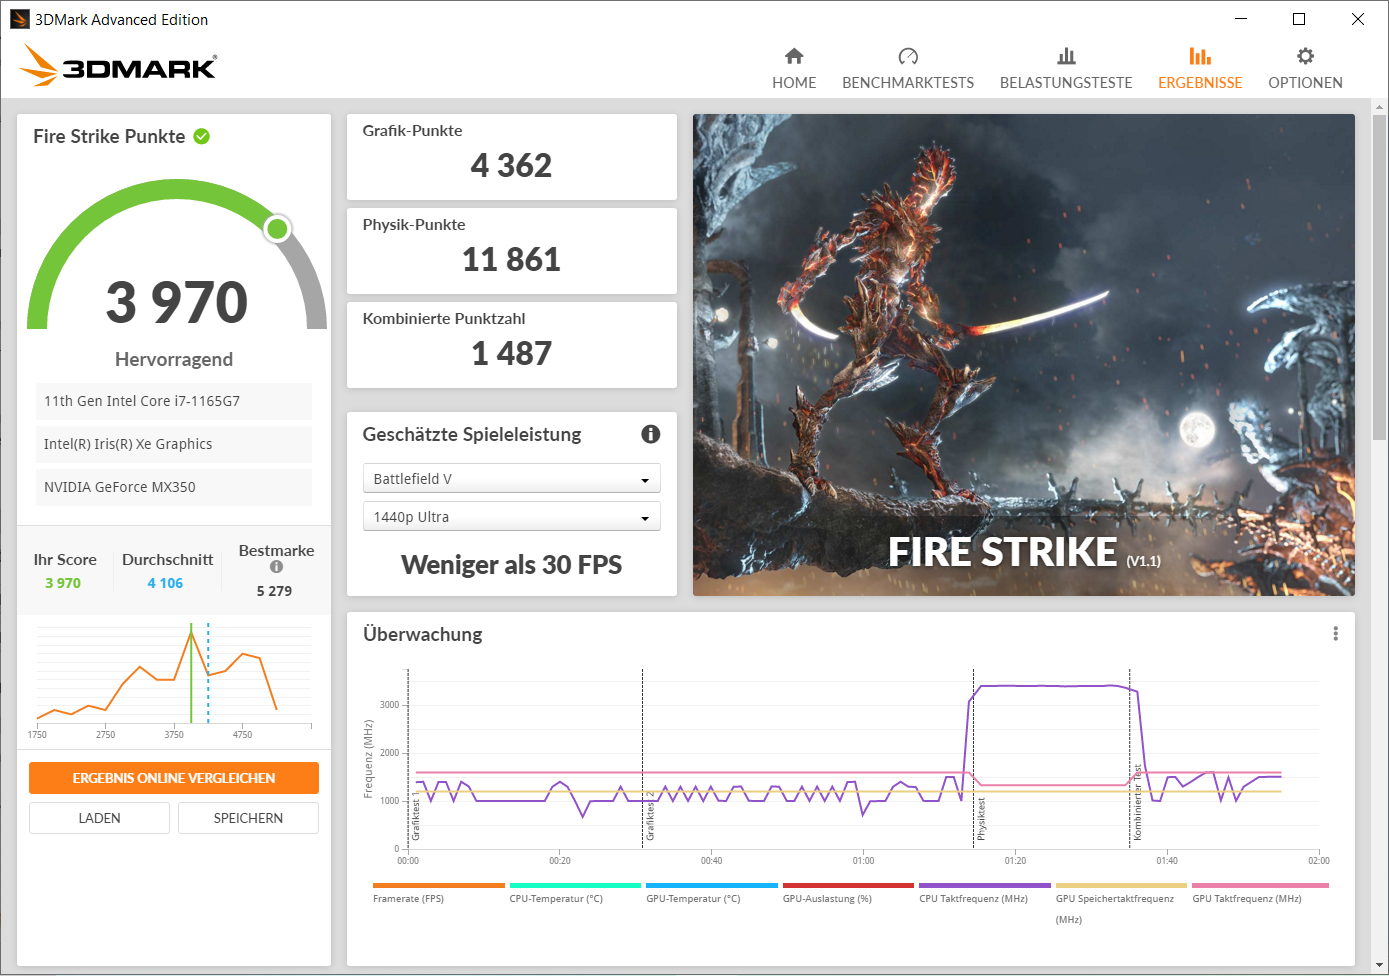
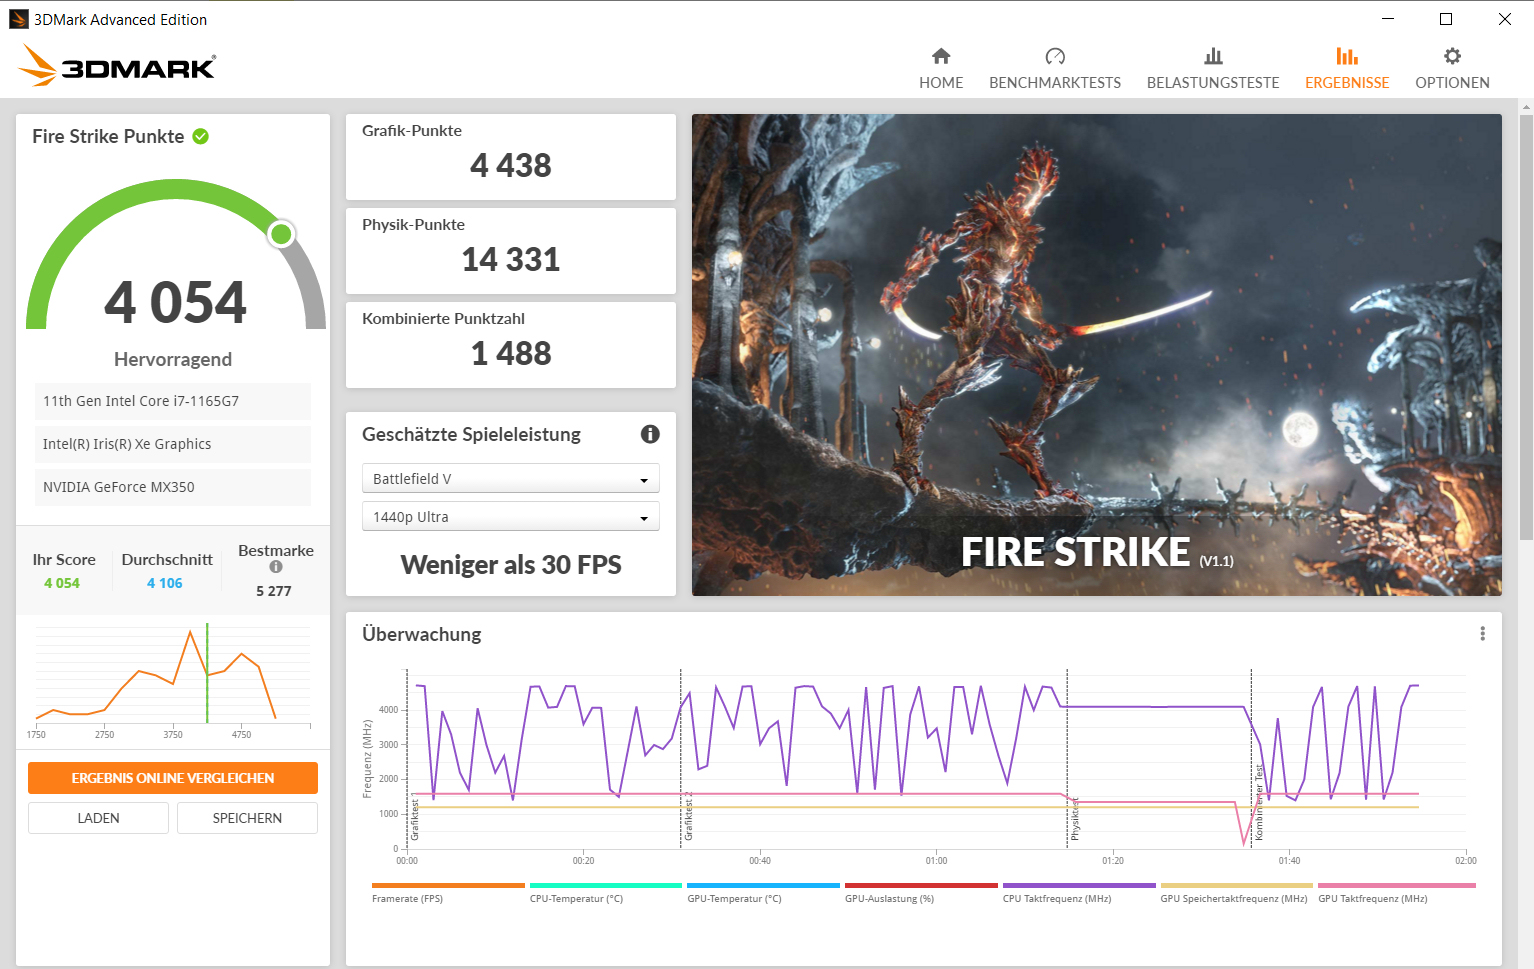
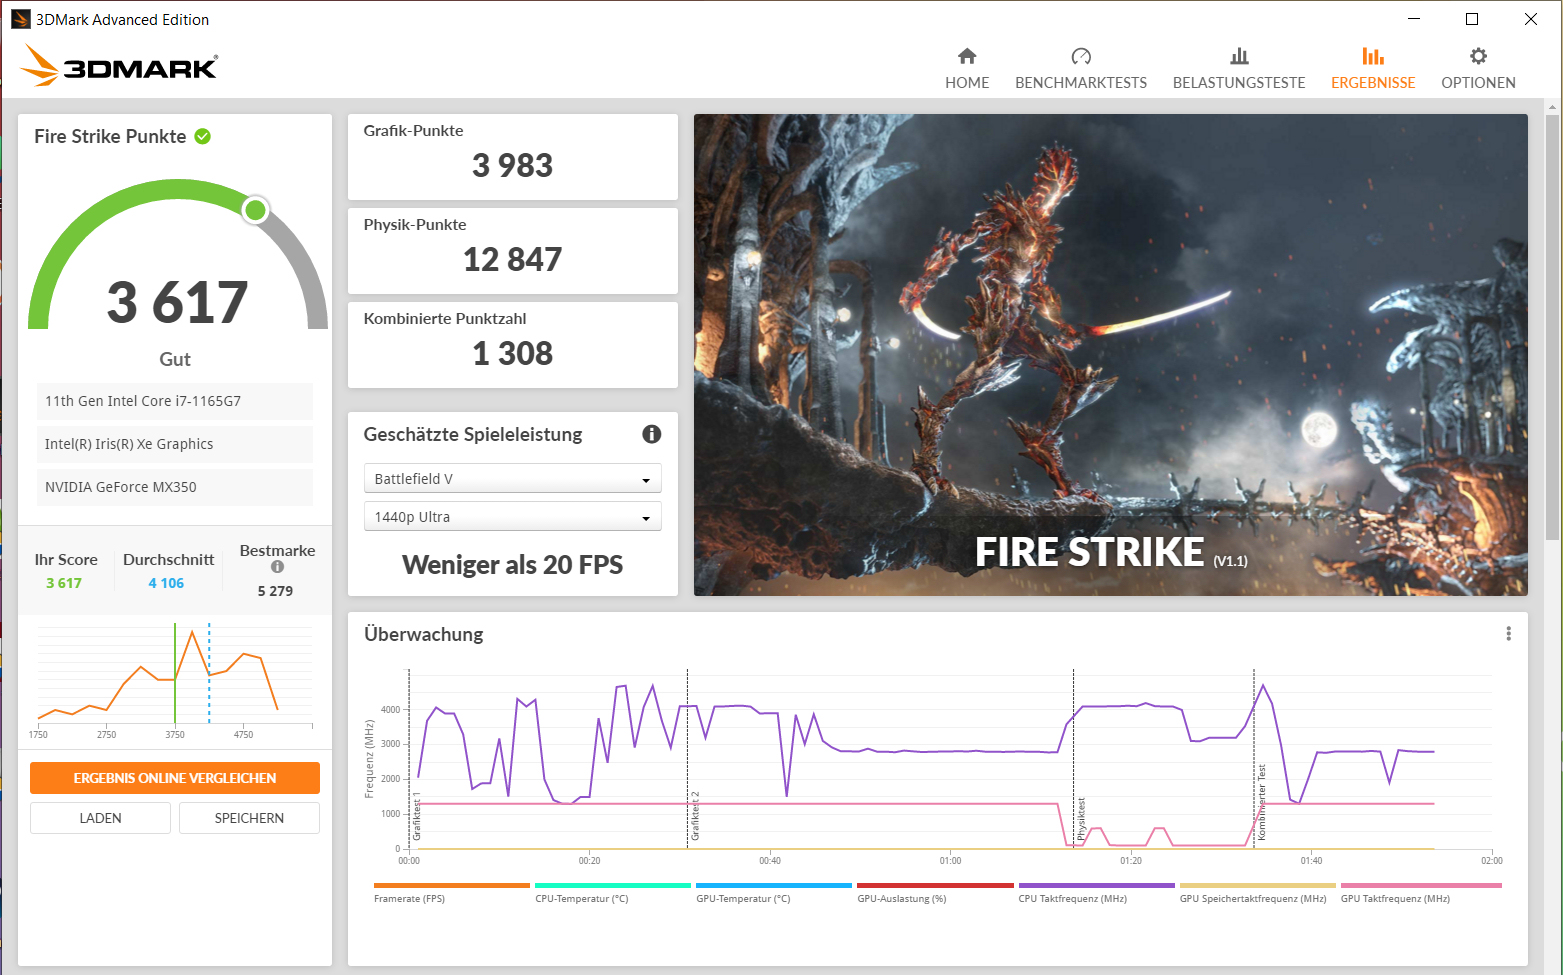
| 3DMark Fire Strike Score | 3985 punti | |
| 3DMark Time Spy Score | 1485 punti | |
Aiuto | ||
| 3DMark | |
| 1920x1080 Fire Strike Graphics | |
| Media della classe Multimedia (2328 - 48907, n=57, ultimi 2 anni) | |
| Schenker Vision 15 | |
| Lenovo IdeaPad 5 15IIL05 | |
| Asus VivoBook S15 S533EQ-BQ002T (Leistungsmodus) | |
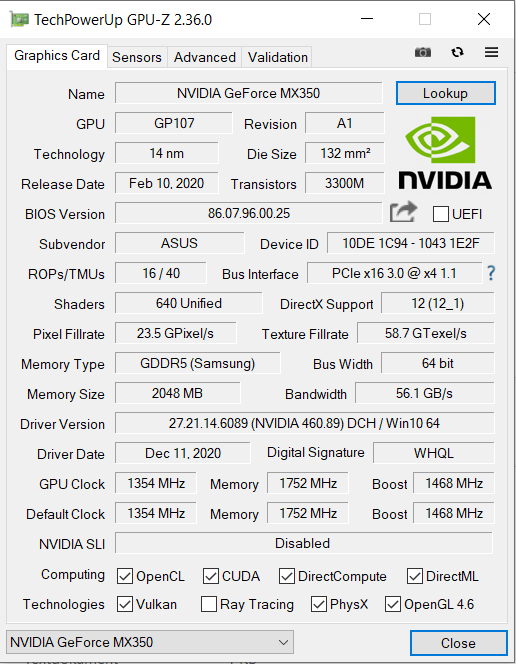
| Media NVIDIA GeForce MX350 (3999 - 4656, n=14) | |
| Asus VivoBook S15 S533EQ-BQ002T | |
| Samsung Galaxy Book Ion Aura Silver | |
| 1280x720 Cloud Gate Standard Graphics | |
| Media della classe Multimedia (16765 - 143501, n=32, ultimi 2 anni) | |
| Asus VivoBook S15 S533EQ-BQ002T | |
| Media NVIDIA GeForce MX350 (23194 - 26239, n=9) | |
| Lenovo IdeaPad 5 15IIL05 | |
| Samsung Galaxy Book Ion Aura Silver | |
| 2560x1440 Time Spy Graphics | |
| Media della classe Multimedia (696 - 19403, n=57, ultimi 2 anni) | |
| Schenker Vision 15 | |
| Lenovo IdeaPad 5 15IIL05 | |
| Asus VivoBook S15 S533EQ-BQ002T (Leistungsmodus) | |
| Asus VivoBook S15 S533EQ-BQ002T | |
| Media NVIDIA GeForce MX350 (1123 - 1595, n=12) | |
| Samsung Galaxy Book Ion Aura Silver | |
| The Witcher 3 - 1366x768 Medium Graphics & Postprocessing | |
| Schenker Vision 15 | |
| Media della classe Multimedia (41 - 73, n=2, ultimi 2 anni) | |
| Asus VivoBook S15 S533EQ-BQ002T | |
| Asus VivoBook S15 S533EQ-BQ002T (Leistungsmodus) | |
| Lenovo IdeaPad 5 15IIL05 | |
| Media NVIDIA GeForce MX350 (35.2 - 51.9, n=13) | |
| Samsung Galaxy Book Ion Aura Silver | |
| Dota 2 Reborn - 1920x1080 ultra (3/3) best looking | |
| Media della classe Multimedia (29 - 179.9, n=57, ultimi 2 anni) | |
| Lenovo IdeaPad 5 15IIL05 | |
| Asus VivoBook S15 S533EQ-BQ002T | |
| Asus VivoBook S15 S533EQ-BQ002T (Leistungsmodus) | |
| Media NVIDIA GeForce MX350 (52.3 - 80.6, n=14) | |
| Samsung Galaxy Book Ion Aura Silver | |
| Schenker Vision 15 | |
| X-Plane 11.11 - 1920x1080 med (fps_test=2) | |
| Media della classe Multimedia (18.7 - 177.4, n=54, ultimi 2 anni) | |
| Asus VivoBook S15 S533EQ-BQ002T (Leistungsmodus) | |
| Media NVIDIA GeForce MX350 (35.5 - 72.3, n=14) | |
| Asus VivoBook S15 S533EQ-BQ002T | |
| Lenovo IdeaPad 5 15IIL05 | |
| Samsung Galaxy Book Ion Aura Silver | |
| Schenker Vision 15 | |
| F1 2020 - 1920x1080 Medium Preset AF:16x | |
| Schenker Vision 15 | |
| Media NVIDIA GeForce MX350 (48.3 - 49, n=2) | |
| Asus VivoBook S15 S533EQ-BQ002T (712959) | |
| Serious Sam 4 - 1280x720 Lowest (DX12) | |
| Media NVIDIA GeForce MX350 (67.4 - 107, n=4) | |
| Asus VivoBook S15 S533EQ-BQ002T (Leistungsmodus) | |
| Asus VivoBook S15 S533EQ-BQ002T | |
| Immortals Fenyx Rising - 1280x720 Very Low Preset | |
| Media NVIDIA GeForce MX350 (38 - 47, n=4) | |
| Asus VivoBook S15 S533EQ-BQ002T | |
| Asus VivoBook S15 S533EQ-BQ002T (Leistungsmodus) | |
| Crysis Remastered - 1280x720 Low Preset | |
| Asus VivoBook S15 S533EQ-BQ002T | |
| Media NVIDIA GeForce MX350 (76.2 - 81.5, n=2) | |
| Star Wars Squadrons - 1920x1080 High Preset | |
| Asus VivoBook S15 S533EQ-BQ002T | |
| Media NVIDIA GeForce MX350 (49.5 - 52.9, n=2) | |
| Mafia Definitive Edition - 1280x720 Low Preset | |
| Media NVIDIA GeForce MX350 (45.3 - 49.6, n=2) | |
| Asus VivoBook S15 S533EQ-BQ002T | |
| basso | medio | alto | ultra | |
|---|---|---|---|---|
| The Witcher 3 (2015) | 79.6 | 46.9 | 27 | 15.6 |
| Dota 2 Reborn (2015) | 138 | 120 | 84.1 | 76.3 |
| X-Plane 11.11 (2018) | 74.5 | 52 | 36.5 | |
| F1 2020 (2020) | 98.7 | 48.3 | 33 | 20.3 |
| Death Stranding (2020) | 40.3 | 20.5 | 18.7 | 18.1 |
| Horizon Zero Dawn (2020) | 33 | 18 | 14 | 11 |
| Flight Simulator 2020 (2020) | 36.3 | 14.6 | 8.89 | |
| Crysis Remastered (2020) | 81.5 | 30.4 | 9.22 | |
| Serious Sam 4 (2020) | 67.4 | 12.8 | 8.05 | |
| Mafia Definitive Edition (2020) | 45.3 | 21.1 | 18.9 | |
| Star Wars Squadrons (2020) | 103 | 60 | 52.9 | 25.2 |
| Watch Dogs Legion (2020) | 36 | 20 | 15 | |
| Assassin´s Creed Valhalla (2020) | 17 | 13 | 6 | |
| Call of Duty Black Ops Cold War (2020) | 43 | 14.4 | 13.4 | |
| Yakuza Like a Dragon (2020) | 62.7 | 20.7 | 20.5 | 18 |
| Immortals Fenyx Rising (2020) | 38 | 14 | 10 | |
| Cyberpunk 2077 1.0 (2020) | 19 | 10.5 | 6.93 |
Rumorosità
| Idle |
| 25 / 25 / 25 dB(A) |
| Sotto carico |
| 39.5 / 41.6 dB(A) |
 | ||
30 dB silenzioso 40 dB(A) udibile 50 dB(A) rumoroso |
||
min: | ||
(+) La temperatura massima sul lato superiore è di 38.1 °C / 101 F, rispetto alla media di 36.8 °C / 98 F, che varia da 21 a 71 °C per questa classe Multimedia.
(±) Il lato inferiore si riscalda fino ad un massimo di 41.3 °C / 106 F, rispetto alla media di 39.1 °C / 102 F
(+) In idle, la temperatura media del lato superiore è di 23.9 °C / 75 F, rispetto alla media deld ispositivo di 31.3 °C / 88 F.
(±) Riproducendo The Witcher 3, la temperatura media per il lato superiore e' di 34.6 °C / 94 F, rispetto alla media del dispositivo di 31.3 °C / 88 F.
(+) I poggiapolsi e il touchpad raggiungono la temperatura massima della pelle (32 °C / 89.6 F) e quindi non sono caldi.
(-) La temperatura media della zona del palmo della mano di dispositivi simili e'stata di 28.7 °C / 83.7 F (-3.3 °C / -5.9 F).
Asus VivoBook S15 S533EQ-BQ002T analisi audio
(±) | potenza degli altiparlanti media ma buona (79.8 dB)
Bassi 100 - 315 Hz
(-) | quasi nessun basso - in media 21.6% inferiori alla media
(±) | la linearità dei bassi è media (11.9% delta rispetto alla precedente frequenza)
Medi 400 - 2000 Hz
(±) | medi elevati - circa 8.3% superiore alla media
(±) | linearità dei medi adeguata (7.5% delta rispetto alla precedente frequenza)
Alti 2 - 16 kHz
(+) | Alti bilanciati - appena 3.5% dalla media
(±) | la linearità degli alti è media (7.4% delta rispetto alla precedente frequenza)
Nel complesso 100 - 16.000 Hz
(±) | la linearità complessiva del suono è media (20% di differenza rispetto alla media
Rispetto alla stessa classe
» 66% di tutti i dispositivi testati in questa classe è stato migliore, 8% simile, 26% peggiore
» Il migliore ha avuto un delta di 5%, medio di 17%, peggiore di 45%
Rispetto a tutti i dispositivi testati
» 51% di tutti i dispositivi testati in questa classe è stato migliore, 8% similare, 41% peggiore
» Il migliore ha avuto un delta di 4%, medio di 23%, peggiore di 134%
| Off / Standby | |
| Idle | |
| Sotto carico |
|
Leggenda:
min: | |
Pro
Contro
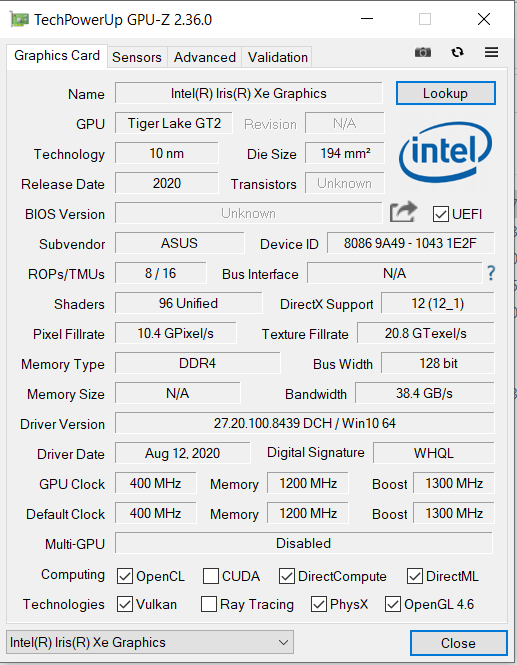
Grazie al Core i7-1165G7 e alla GPU GeForce MX350, il VivoBook offre prestazioni sufficienti per tutti gli scenari di utilizzo più comuni. Le applicazioni ad alta intensità di grafica traggono vantaggio dalla MX350. Se le massime prestazioni grafiche non sono un requisito fondamentale, si può ricorrere a un modello VivoBook più economico senza dGPU. La differenza di prestazioni tra l'MX350 e la iGPU Intel non è molto grande.
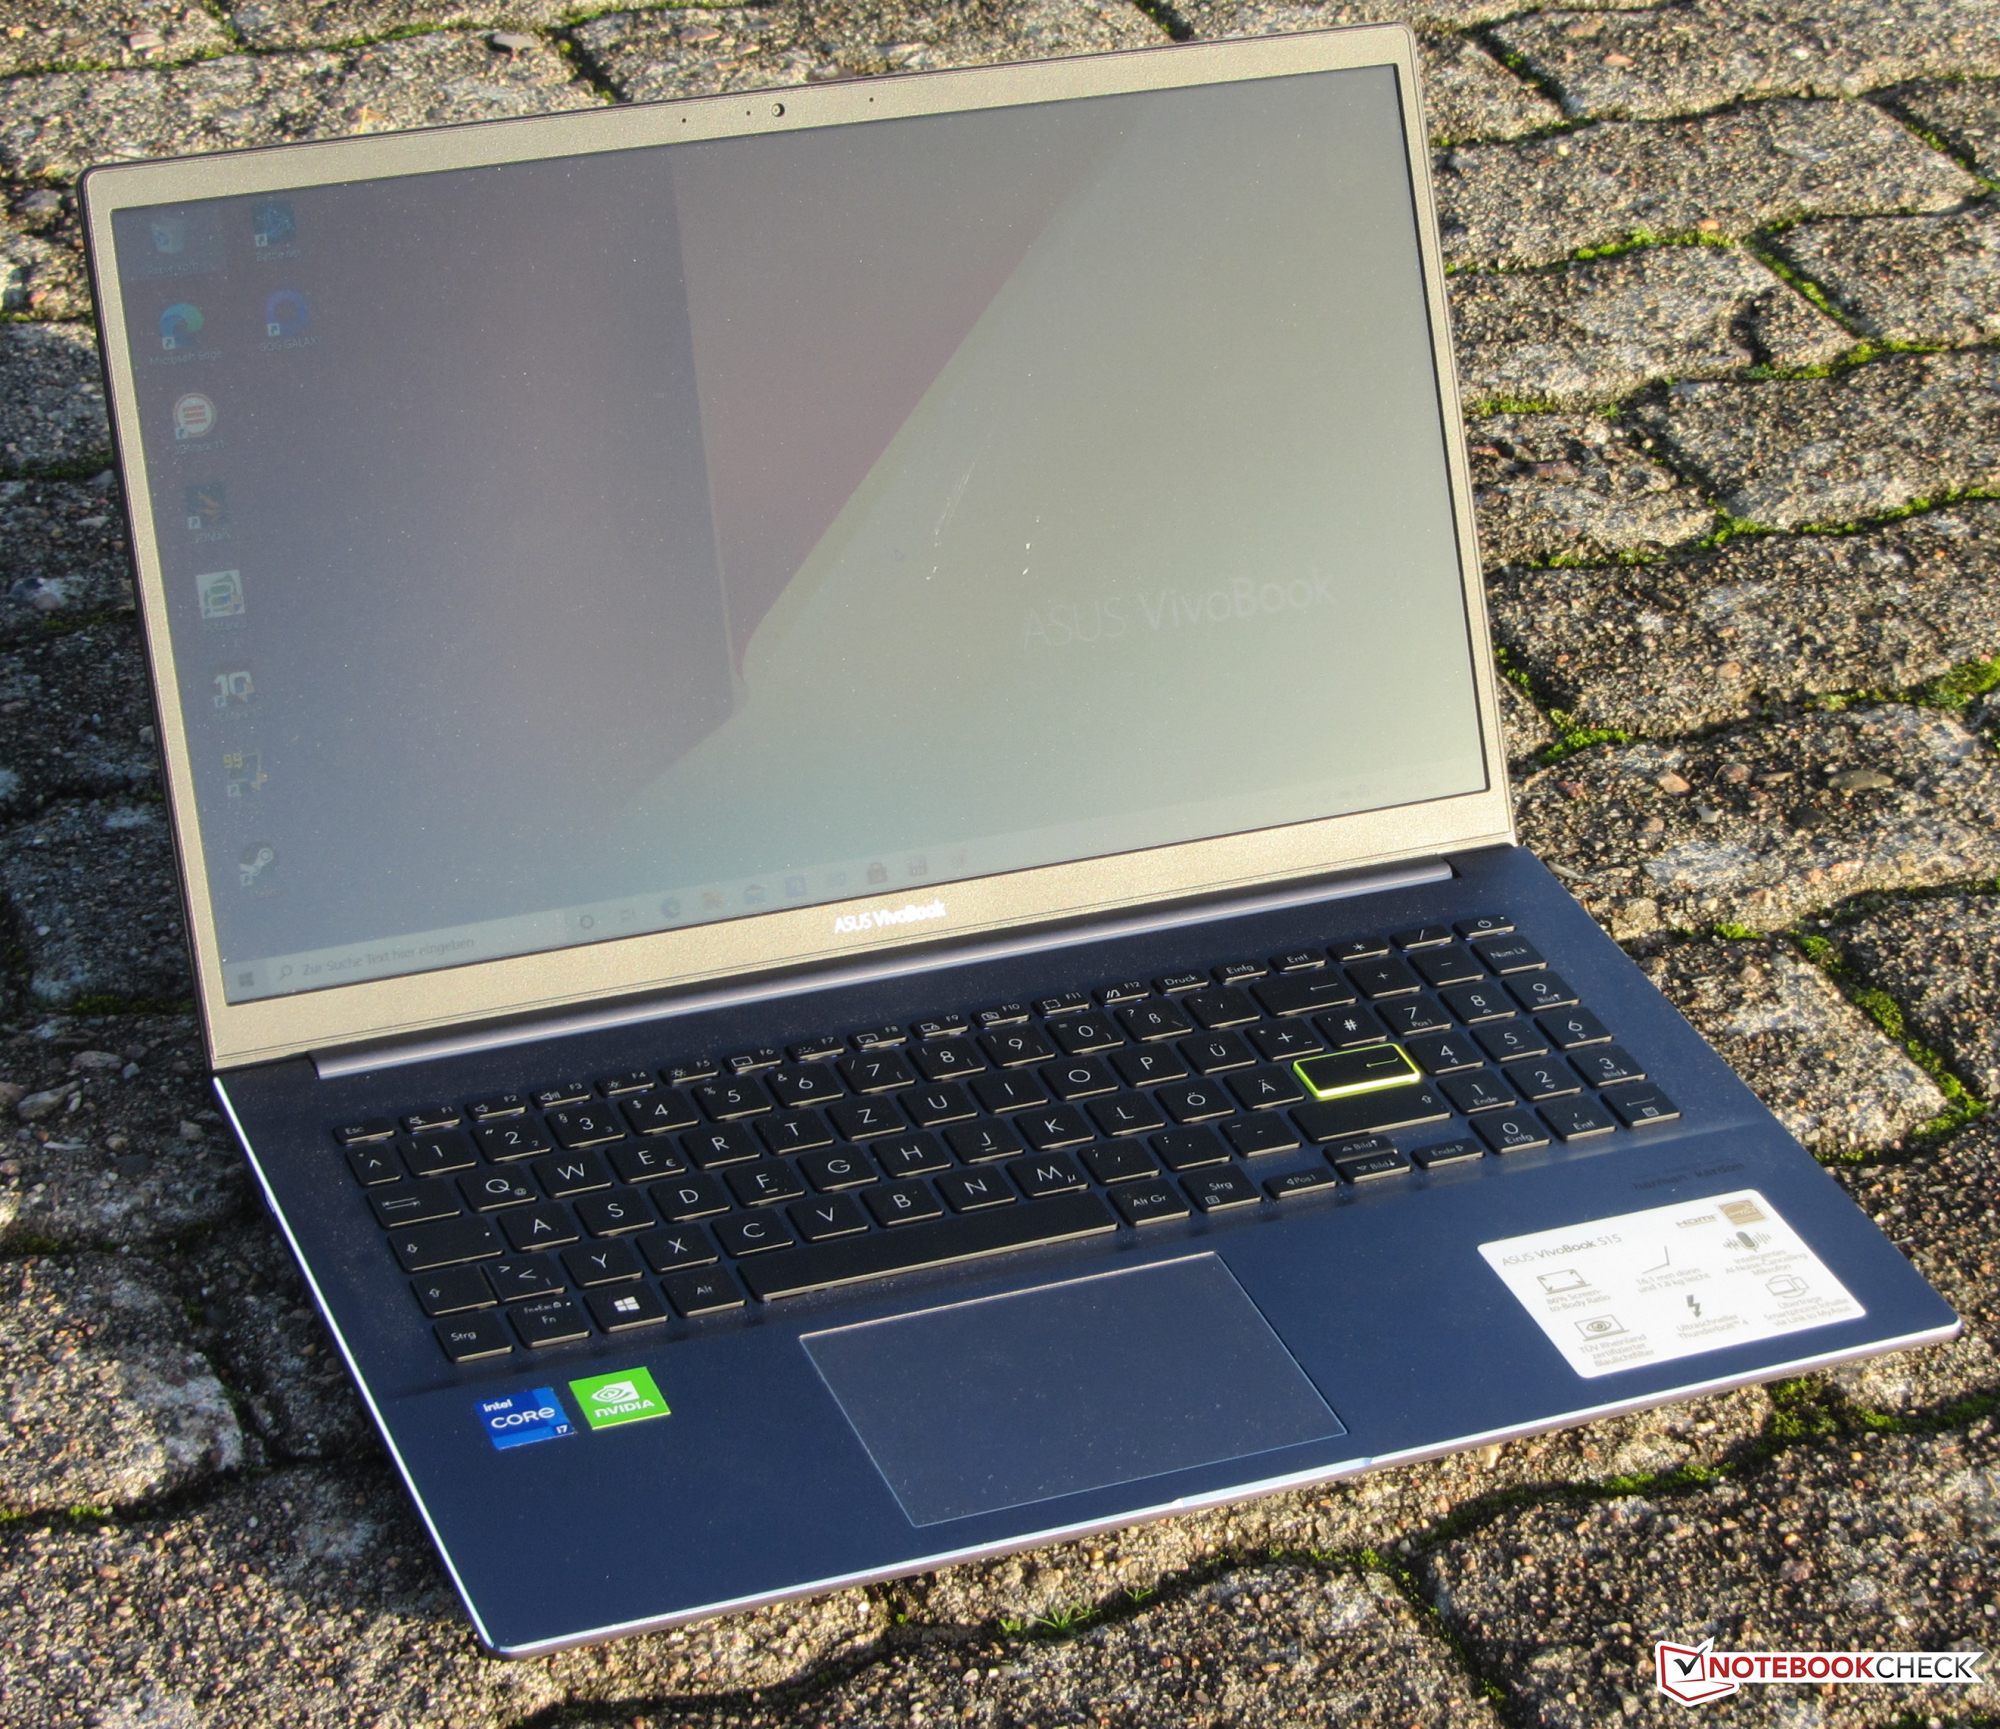
Con il VivoBook S15 S533EQ, Asus ha nella sua linea un elegante ed elegante tuttofare da 15,6 pollici che è stato dotato di un display insoddisfacente.
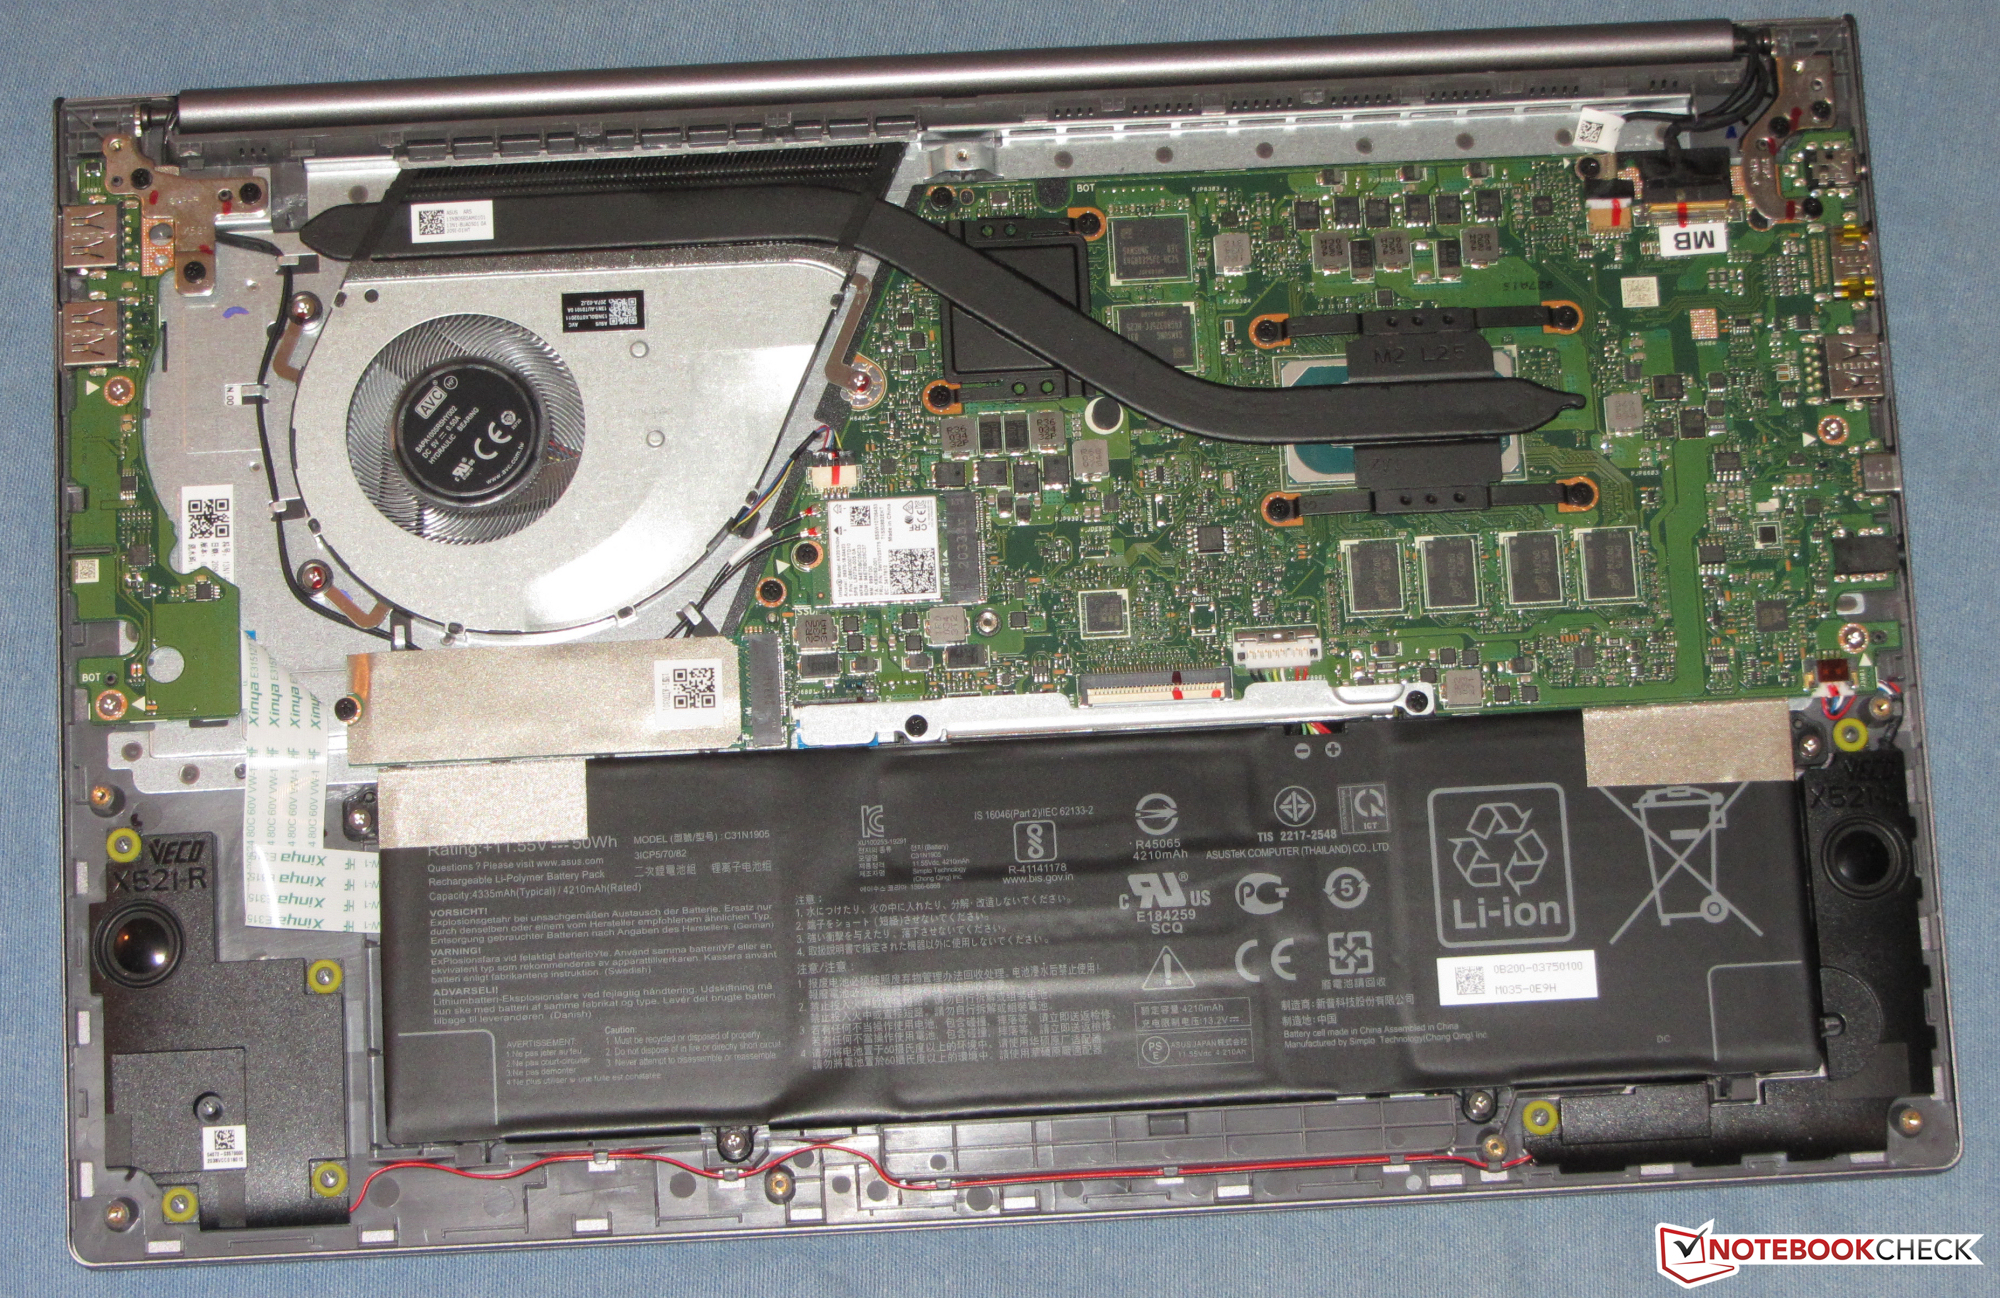
L'hardware è supportato da 16 GB di memoria (modalità dual-channel) e da un SSD NVMe da 1 TB. Un'espansione della RAM saldata non sarebbe possibile, ma l'SSD potrebbe essere sostituito, se necessario, con un modello di maggiore capacità/veloce. Quest'ultimo potrebbe essere interessante, dato che Asus ha installato un modello relativamente lento.
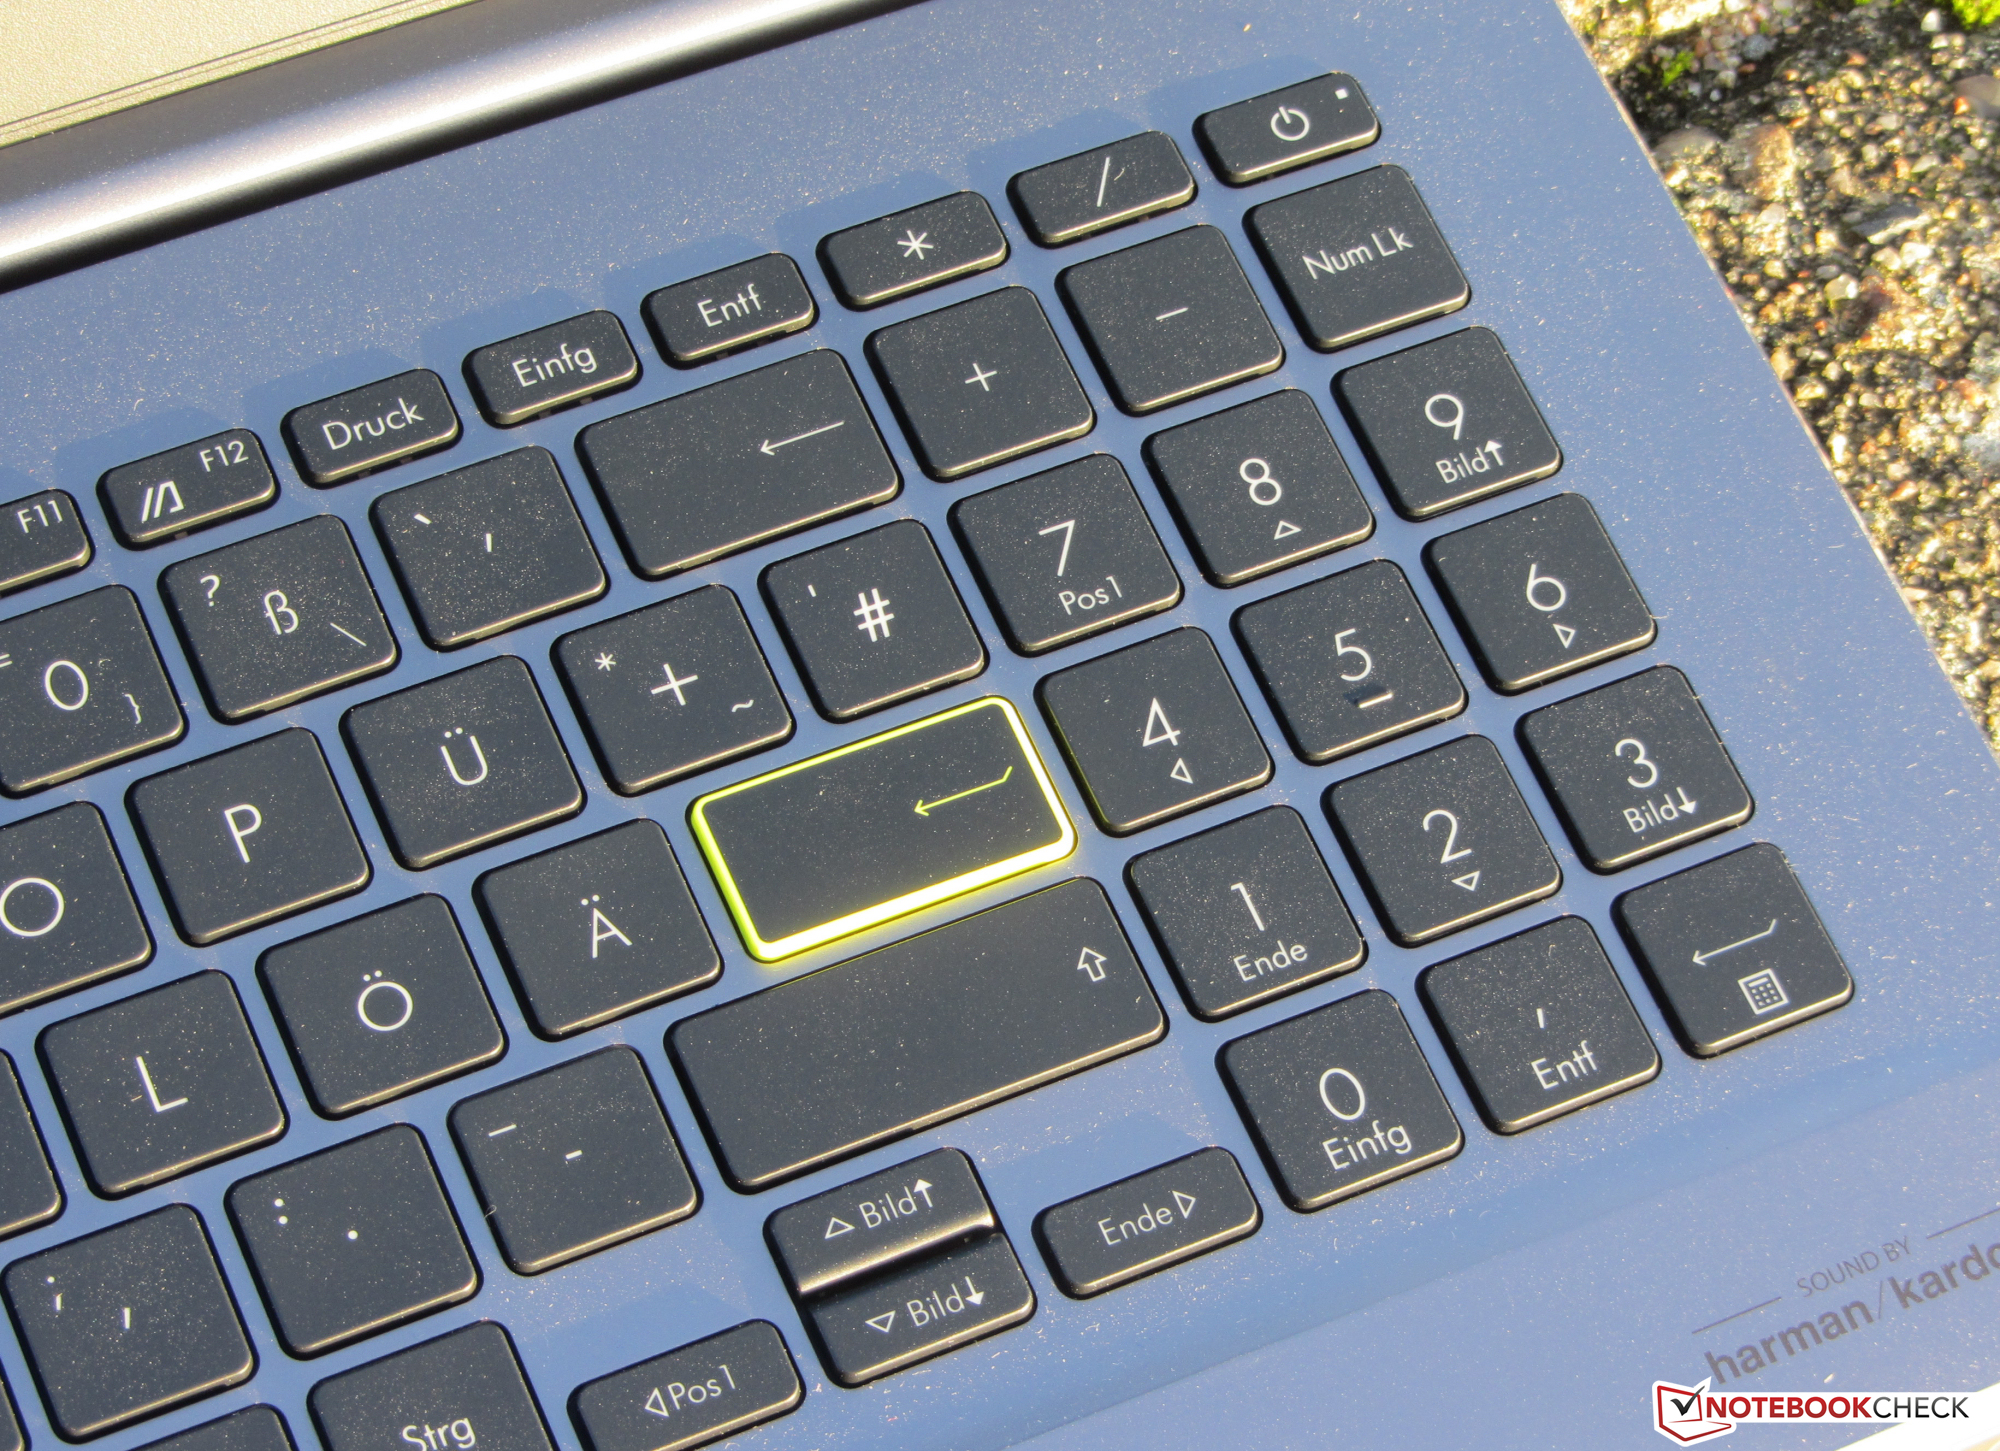
Il display (Full HD, IPS) si fa notare con angoli di visualizzazione stabili, una superficie opaca e una discreta riproduzione dei colori. Luminosità, contrasto e copertura dello spazio colore sono però deludenti. Un portatile da 1.300 euro (~$1.587) deve offrire molto di più. La tastiera retroilluminata si è dimostrata adatta all'uso quotidiano. La durata della batteria è molto buona.
Questo portatile può essere alimentato sia tramite l'adattatore di alimentazione proprietario incluso che tramite un caricatore USB. La porta USB Type-C (Thunderbolt 4; DisplayPort via USB-C, Power Delivery) lo rende possibile. Quest'ultima permette anche il collegamento di una soluzione di docking o di una GPU esterna.
Asus VivoBook S15 S533EQ-BQ002T
- 12/26/2020 v7 (old)
Sascha Mölck
Price comparison
