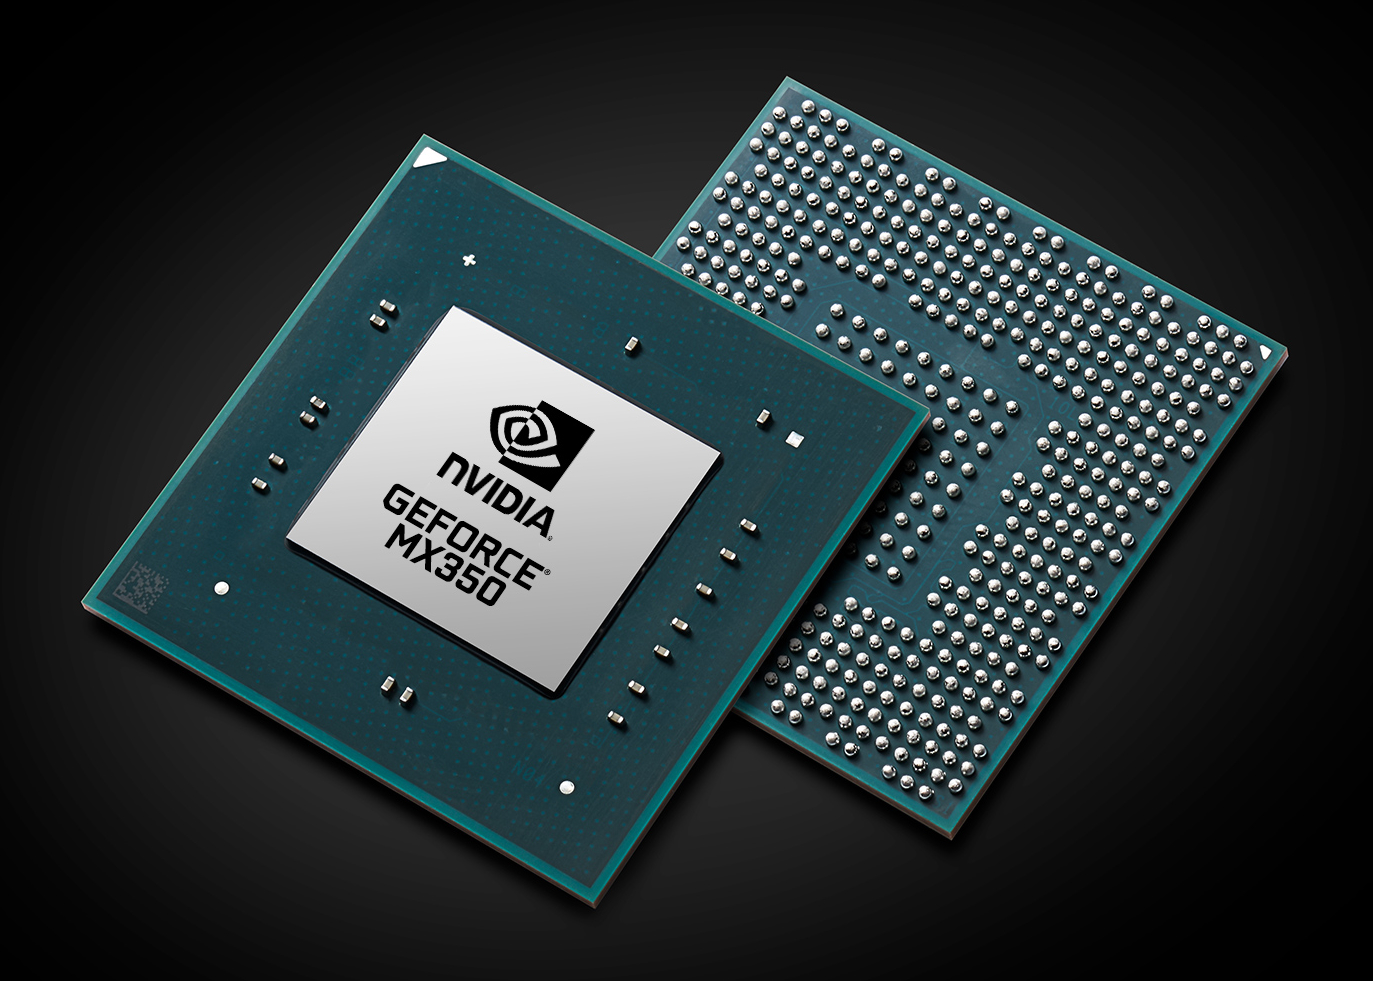
Recensioni Notebook con NVIDIA GeForce MX350 la scheda grafica
Recensione del Lenovo V17 G2: un portatile da 17 pollici con un MX350 poco gratificante
Con il suo display da 17 pollici, la grafica Nvidia e la CPU Core i7 di Intel, il V17 G2 di Lenovo è adatto per le attività d'ufficio e multimediali, compresi i giochi semplici. La nostra recensione mostra se il sovrapprezzo per l'equipaggiamento top vale la pena per questo portatile altrimenti conveniente.
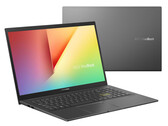
Intel Core i7-1165G7, NVIDIA GeForce MX350, 17.3", 2.2 kgRecensioen del laptop Asus Vivobook 15 K513EQ OLED: L'alternativa Lenovo IdeaPad
Il VivoBook 15 K513 offre un ottimo rapporto qualità/prezzo con il suo display OLED, la CPU Intel di 11a generazione e la grafica discreta Nvidia, il tutto per meno di 950 dollari. Anche se solido sulla carta, alcuni angoli tagliati gli impediscono di raggiungere gli stessi livelli di uno ZenBook.
Intel Core i7-1165G7, NVIDIA GeForce MX350, 15.6", 1.6 kgRecensione del portatile Xiaomi Mi NoteBook 14 Horizon Edition: Taglio dei costi non fatto bene
Con il Mi NoteBook 14 Horizon Edition, Xiaomi mira ad abbassare il punto di ingresso per un portatile multimediale capace. Mentre il prezzo sembra giusto per un dispositivo Core i7 Comet Lake con grafica discreta Nvidia MX350, bisogna accettare diversi compromessi. Come influenzano l'uso complessivo? Scopriamolo.
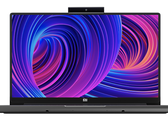
Intel Core i7-10510U, NVIDIA GeForce MX350, 14", 1.4 kgRecensione dell'Honor MagicBook Pro: compatto tuttofare da 16,1" con una buona durata della batteria
Il MagicBook Pro offre un livello di equipaggiamento completo: un processore Core i5, una GPU GeForce MX350, 16 GB di memoria di lavoro (modalità dual-channel), un SSD NVMe e un display IPS opaco. Tutto questo è accompagnato da una durata della batteria molto buona.
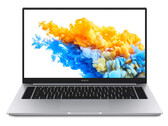
Intel Core i5-10210U, NVIDIA GeForce MX350, 16.1", 1.7 kgRecensione del portatile Dell Inspiron 14 7400: Computer portatile da ufficio con una CPU Tiger Lake
L'Inspiron 14 7400 è piccolo e leggero. Viene anche fornito con un display superbo. In combinazione con una CPU Tiger Lake e Nvidia GeForce MX350, l'Inspiron 14 può essere un ottimo portatile da ufficio. Ma lo è? Leggete la nostra recensione per scoprirlo.
Intel Core i7-1165G7, NVIDIA GeForce MX350, 14.5", 1.3 kgAcer Aspire 5 A517-52G-79Z5: Intel Core i7-1165G7, 17.30", 2.2 kg
recensione » Recensione del portatile Acer Aspire 5 A517: Attraente 17.3 pollici con CPU Tiger Lake e GPU MX350
Asus VivoBook S15 S533EQ-BQ002T: Intel Core i7-1165G7, 15.60", 1.8 kg
recensione » Recensione dell'Asus VivoBook S15 S533EQ: Elegante tuttofare con i punti deboli nelle dotazioni
Huawei MateBook 14 2020 Intel: Intel Core i7-10510U, 14.00", 1.5 kg
recensione » Recensione del Laptop Huawei MateBook 14 2020: il formato a conchiglia 3:2 convince sia con le CPU Intel che con quelle AMD
HP Envy 13-ba0001ng: Intel Core i7-10510U, 13.30", 1.3 kg
recensione » Recensione del Laptop HP Envy 13: Elegante case in metallo e prestazioni solide
Lenovo Yoga Slim 7-14IIL05: Intel Core i7-1065G7, 14.00", 1.4 kg
recensione » Recensione del Laptop Lenovo Yoga Slim 7 14 - Senza GPU Nvidia contro AMD
Lenovo IdeaPad 5 15IIL05: Intel Core i5-1035G1, 15.60", 1.7 kg
recensione » Recensione del Lenovo IdeaPad 5 15IIL05: buone prestazioni ed ampia autonomia - grazie alla batteria da 70-Wh
MSI Prestige 14 A10RD: Intel Core i7-10510U, 14.00"
recensione » Recensione delle schede Nvidia GeForce MX330 ed MX350: architettura nota - nome nuovo
Acer Aspire 5 A514-54G, i3-1115G4 MX350: Intel Core i3-1115G4, 14.00", 1.7 kg
Recensioni esterne » Acer Aspire 5 A514-54G, i3-1115G4 MX350
Acer Aspire 5 A515-56G-78TR: Intel Core i7-1165G7, 15.60", 1.7 kg
Recensioni esterne » Acer Aspire 5 A515-56G-78TR
MSI Modern 14 B10RBSW-257XFR: Intel Core i7-10510U, 14.00", 1.3 kg
Recensioni esterne » MSI Modern 14 B10RBSW-257XFR
Lenovo V17 G2 ITL-82NX00EUGE: Intel Core i7-1165G7, 17.30", 2.2 kg
Recensioni esterne » Lenovo V17 G2 ITL-82NX00EUGE
Acer Aspire 5 A514-54G-743J: Intel Core i7-1165G7, 14.00", 1.7 kg
Recensioni esterne » Acer Aspire 5 A514-54G-743J
Dell Vostro 15 3510, i7-1165G7 MX350: Intel Core i7-1165G7, 15.60", 1.7 kg
Recensioni esterne » Dell Vostro 15 3510, i7-1165G7 MX350
Asus Vivobook 15 K513EQ: Intel Core i7-1165G7, 15.60", 1.6 kg
Recensioni esterne » Asus Vivobook 15 K513EQ
Asus VivoBook 14 S433JQ-EB166: Intel Core i5-1035G1, 14.00", 1.5 kg
Recensioni esterne » Asus VivoBook 14 S433JQ-EB166
Asus VivoBook S14 S433JQ-EB166T: Intel Core i5-1035G1, 14.00", 1.4 kg
Recensioni esterne » Asus VivoBook S14 S433JQ-EB166T
Acer Aspire 5 A514-54G-58R8: Intel Core i5-1135G7, 14.00", 1.7 kg
Recensioni esterne » Acer Aspire 5 A514-54G-58R8
Asus VivoBook Ultra 14 K413EQ-EK115T: Intel Core i7-1165G7, 14.00"
Recensioni esterne » Asus VivoBook Ultra 14 K413EQ-EK115T
HP Pavilion 14-dv0006ns: Intel Core i5-1135G7, 14.00", 1.4 kg
Recensioni esterne » HP Pavilion 14-dv0006ns
Acer Swift 5 SF514-55GT-72L0: Intel Core i7-1165G7, 14.00", 1.1 kg
Recensioni esterne » Acer Swift 5 SF514-55GT-72L0
Honor MagicBook Pro 10210U: Intel Core i5-10210U, 16.10", 1.7 kg
Recensioni esterne » Honor MagicBook Pro 10210U
Asus VivoBook S14 S433JQ-EB163: Intel Core i5-1035G1, 14.00", 1.4 kg
Recensioni esterne » Asus VivoBook S14 S433JQ-EB163
Acer Aspire 5 A515-56G-51YF: Intel Core i5-1135G7, 15.60", 1.7 kg
Recensioni esterne » Acer Aspire 5 A515-56G-51YF
Lenovo IdeaPad Slim 7 14IIL05-82A4000MUS: Intel Core i5-1035G1, 14.00", 1.5 kg
Recensioni esterne » Lenovo IdeaPad Slim 7 14IIL05-82A4000MUS
Lenovo Yoga Slim 7 14IIL05-82A10076GE: Intel Core i5-1035G1, 14.00", 1.5 kg
Recensioni esterne » Lenovo Yoga Slim 7 14IIL05-82A10076GE
MSI Modern 14 B10RBSW-064XES: Intel Core i7-10510U, 14.00", 1.3 kg
Recensioni esterne » MSI Modern 14 B10RBSW-064XES
Acer Swift 5 SF514-55GT-79BM: Intel Core i7-1165G7, 14.00", 1 kg
Recensioni esterne » Acer Swift 5 SF514-55GT-79BM
Asus VivoBook S15 S533EQ-BQ002T: Intel Core i7-1165G7, 15.60", 1.8 kg
Recensioni esterne » Asus VivoBook S15 S533EQ-BQ002T
Acer Book RS Porsche Design AP714-51GT-71A4: Intel Core i7-1165G7, 14.00", 1.3 kg
Recensioni esterne » Acer Book RS Porsche Design AP714-51GT-71A4
Lenovo Ideapad Slim 5 14IIL05: Intel Core i7-1065G7, 14.00", 1.6 kg
Recensioni esterne » Lenovo Ideapad Slim 5 14IIL05
Huawei MateBook 14 2020 Intel: Intel Core i7-10510U, 14.00", 1.5 kg
Recensioni esterne » Huawei MateBook 14 2020 Intel
HP Envy 13-ba0004ns: Intel Core i7-10510U, 13.30", 1.3 kg
Recensioni esterne » HP Envy 13-ba0004ns
Asus VivoBook S14 S433JQ i5-1035G1: Intel Core i5-1035G1, 14.00", 1.5 kg
Recensioni esterne » Asus VivoBook S14 S433JQ i5-1035G1
Lenovo Ideapad Slim 5i 15IIL05-81YK003SHH: Intel Core i7-1065G7, 15.60", 1.7 kg
Recensioni esterne » Lenovo Ideapad Slim 5i 15IIL05-81YK003SHH
Xiaomi RedmiBook 16 i7-1065G7, MX350: Intel Core i7-1065G7, 16.10", 1.8 kg
Recensioni esterne » Xiaomi RedmiBook 16 i7-1065G7, MX350
Huawei MateBook 14 KLVC-WFE9L: Intel Core i7-10510U, 14.00", 1.5 kg
Recensioni esterne » Huawei MateBook 14 KLVC-WFE9L
Huawei MateBook 14 (2020): Intel Core i5-10210U, 14.00", 1.5 kg
Recensioni esterne » Huawei MateBook 14 (2020)
Asus ZenBook 14 Q407IQ: AMD Ryzen 5 4500U, 14.00", 1.2 kg
Recensioni esterne » Asus ZenBook 14 Q407IQ
Lenovo IdeaPad 5 15IIL05: Intel Core i5-1035G1, 15.60", 1.7 kg
Recensioni esterne » Lenovo IdeaPad 5 15IIL05
Lenovo Yoga Slim 7-14IIL05: Intel Core i7-1065G7, 14.00", 1.4 kg
Recensioni esterne » Lenovo Yoga Slim 7-14IIL05
HP Envy 13-ba0005ns: Intel Core i7-10510U, 13.30", 1.3 kg
Recensioni esterne » HP Envy 13-ba0005ns
Acer Swift 5 SF514-54GT-72NT: Intel Core i7-1065G7, 14.00", 1 kg
Recensioni esterne » Acer Swift 5 SF514-54GT-72NT
Acer Aspire A514-53G-55A8: Intel Core i5-1035G1, 14.00", 1.6 kg
Recensioni esterne » Acer Aspire A514-53G-55A8
Xiaomi Mi NoteBook 14 Horizon Edition: Intel Core i7-10510U, 14.00", 1.4 kg
Recensioni esterne » Xiaomi Mi NoteBook 14 Horizon, i7-10510U
Acer Swift 3 SF313-52G-54JU: Intel Core i5-1035G1, 13.50", 1.2 kg
Recensioni esterne » Acer Swift 3 SF313-52G-54JU
Asus ZenBook 14 UM433IQ-A5026T: AMD Ryzen 7 4700U, 14.00", 1.2 kg
Recensioni esterne » Asus ZenBook 14 UM433IQ-A5026T
Honor MagicBook Pro 10210U: Intel Core i5-10210U, 16.10", 1.7 kg
» Honor MagicBook Pro con AMD o Intel/Nvidia?
Dell Inspiron 14 7400-VY8JW: Intel Core i7-1165G7, 14.50", 1.3 kg
» Dell Inspiron 14 7400: il processore Tiger Lake più un buon schermo equivalgono a un ottimo portatile
Asus VivoBook S15 S533EQ-BQ002T: Intel Core i7-1165G7, 15.60", 1.8 kg
» L'Asus VivoBook S15 S533EQ è dotato di una porta Thunderbolt 4
Huawei MateBook 14 2020 Intel: Intel Core i7-10510U, 14.00", 1.5 kg
» La CPU Comet Lake obsoleta nel MateBook 14 di Huawei è convincente solo quando si tratta di durata della batteria
Lenovo Yoga Slim 7-14IIL05: Intel Core i7-1065G7, 14.00", 1.4 kg
» Il Lenovo Yoga Slim 7 14 con la GPU Nvidia è migliore per il gaming