
Recensione Completa del Portatile Apple MacBook Pro 13 (fine 2016, 2 GHz i5, senza Touch Bar)
Intel Core i5-6360U | Intel Iris Graphics 540 | 13.30" | 1.4 kg
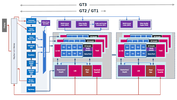
L'Intel Iris Graphics 540 (GT3e) è una scheda grafica integrata della generazione Skylake. Come successore della HD Graphics 6000 (Broadwell), la Iris Graphics 540 si trova su CPUs da 15-watt ed offre 64 MB di memoria eDRAM dedicata. Inoltre, la cosiddetta versione GT3e sfrutta 48 Execution Units (EUs) con clock fino a 1050 MHz (in base al modello di CPU). Oltre alla cache eDRAM, l'Iris 540 è in grado di accedere alla memoria principale (2x 64bit DDR3L-1600 / DDR4-2133).
Rispetto alla Iris Graphics 550 della serie da 28-watt, la Iris Graphics 540 differisce solo per il suo clock massimo leggermente inferiore ed un TDP dimezzato, che limita l'utilizzo del Turbo Boost in alcune situazioni.
Performance
Le esatte prestazioni della Iris Graphics 540 dipendono da vari fattori come la configurazione della memoria (DDR3/DDR4) e il clock rate massimo del singolo modello. La versione più veloce (Core i7-6650U) dovrebbe essere leggermente avanti ad una GeForce 920M dedicata ed essere in grado di gestire i giochi attuali (2015) con settaggi medi o bassi.
Features
Il motore video rielaborato ora decodifica H.265/HEVC completamente con l'hardware e quindi è molto più efficiente rispetto a prima. E' possibile collegare displays tramite DP 1.2 / eDP 1.3 (max. 3840 x 2160 @ 60 Hz), mentre l'HDMI è limitata alla vecchia versione 1.4a (max. 3840 x 2160 @ 30 Hz). Tuttavia, l'HDMI 2.0 può essere aggiunto utilizzando un converter DisplayPort. Possono essere controllati fino a tre displays simultaneamente.
Consumo energetico
L'Iris Graphics 540 si trova su processori mobile con TDP da 15 W e di conseguenza è adatta a portatili compatti ed ultrabooks.
Gen. 9 Serie
| |||||||||||||||||||||||||||||||||||||||||||
| Nome in codice | Skylake GT3e | ||||||||||||||||||||||||||||||||||||||||||
| Architettura | Gen. 9 Skylake | ||||||||||||||||||||||||||||||||||||||||||
| Pipelines | 48 - unified | ||||||||||||||||||||||||||||||||||||||||||
| Velocità del core | 300 - 1050 (Boost) MHz | ||||||||||||||||||||||||||||||||||||||||||
| Larghezza del bus di memoria | eDRAM + 64/128 Bit | ||||||||||||||||||||||||||||||||||||||||||
| Tipo di memoria | eDRAM | ||||||||||||||||||||||||||||||||||||||||||
| Max. quantità di memoria | 64 MB | ||||||||||||||||||||||||||||||||||||||||||
| Memoria condivisa | si | ||||||||||||||||||||||||||||||||||||||||||
| API | DirectX 12_1, OpenGL 4.4 | ||||||||||||||||||||||||||||||||||||||||||
| tecnologia | 14 nm | ||||||||||||||||||||||||||||||||||||||||||
| Caratteristiche | QuickSync | ||||||||||||||||||||||||||||||||||||||||||
| Data dell'annuncio | 01.09.2015 | ||||||||||||||||||||||||||||||||||||||||||
| ||||||||||||||||||||||||
I seguenti benchmarks deirivano dai benchmarks dei portatili recensiti. Le prestazioni dipendono dalla scheda grafica utilizzata, dal clock rate, dal processore, dai settaggi di sistema, dai drivers, e dai sistemi operativi. Quindi i risultati non sono rappresentativi per i portatili con questa GPU. Per informazioni dettagliate sui risultati del benchmark, cliccate sul numero di fps.


Per conoscere altri giochi che potrebbero essere utilizzabili e per una lista completa di tutti i giochi e delle schede grafiche visitate la nostra Gaming List

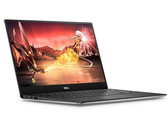
HP Spectre 13-4200ns x360: Intel Core i7-6560U, 13.30", 1.4 kg
Recensioni esterne » HP Spectre 13-4200ns x360
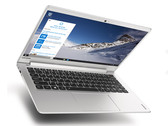
Lenovo IdeaPad 710S-13ISK 80SW00ADSP: Intel Core i7-6560U, 13.30", 1.1 kg
Recensioni esterne » Lenovo IdeaPad 710S-13ISK 80SW00ADSP
HP Envy 15-as000nt: Intel Core i5-6260U, 15.60", 1.9 kg
Recensioni esterne » HP Envy 15-as000nt
HP Envy 15-aq003ng x360: Intel Core i7-6560U, 15.60", 2.2 kg
Recensioni esterne » HP Envy 15-aq003ng x360
HP Envy 15-aq004ur x360: Intel Core i7-6560U, 15.60", 2.2 kg
Recensioni esterne » HP Envy 15-aq004ur x360
Apple MacBook Pro 13 2016: Intel Core i5-6360U, 13.30", 1.4 kg
Recensioni esterne » Apple MacBook Pro 13 Retina 2016
Lenovo IdeaPad 710S-13ISK: Intel Core i7-6560U, 13.30", 1.2 kg
Recensioni esterne » Lenovo IdeaPad 710S-13ISK
HP Envy 15-as006ur: Intel Core i7-6560U, 15.60", 2 kg
Recensioni esterne » HP Envy 15-as006ur
HP Spectre x360 15-ap003ng: Intel Core i7-6560U, 15.60", 1.8 kg
Recensioni esterne » HP Spectre x360 15-ap003ng
HP Envy 15-as005n: Intel Core i7-6560U, 15.60", 2.2 kg
Recensioni esterne » HP Envy 15-as005n
HP Spectre x360 13-4204ng: Intel Core i7-6560U, 13.30", 1.5 kg
Recensioni esterne » HP Spectre x360 13-4204ng
HP Spectre x360 15-ap006ng: Intel Core i7-6560U, 15.60", 1.8 kg
Recensioni esterne » HP Spectre x360 15-ap006ng
HP Envy 15-as006ng: Intel Core i5-6260U, 15.60", 2 kg
Recensioni esterne » HP Envy 15-as006ng
HP Spectre 13-4204nf x360: Intel Core i7-6560U, 13.30", 1.4 kg
Recensioni esterne » HP Spectre 13-4204nf x360
HP Spectre x360 13-4230ng: Intel Core i7-6560U, 13.30", 1.5 kg
Recensioni esterne » HP Spectre x360 13-4230ng
HP Envy x360 15-aq005na: Intel Core i7-6560U, 15.60", 2.2 kg
Recensioni esterne » HP Envy x360 15-aq005na
HP Envy x360 15-aq055na: Intel Core i7-6560U, 15.60", 2.2 kg
Recensioni esterne » HP Envy x360 15-aq055na
Lenovo Ideapad 710S-13ISK-80SW0027UK: Intel Core i7-6560U, 13.30", 1.2 kg
Recensioni esterne » Lenovo Ideapad 710S-13ISK-80SW0027UK
HP Spectre x360 13-4203ng: Intel Core i7-6560U, 13.30", 1.5 kg
Recensioni esterne » HP Spectre x360 13-4203ng
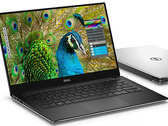
Dell XPS 13 2016 9350 (FHD, i7-6560U) : Intel Core i7-6560U, 13.30", 1.2 kg
Recensioni esterne » Dell XPS 13 2016 9350 (FHD, i7-6560U)
Lenovo Ideapad 710S-13ISK-80SW001EGE: Intel Core i5-6260U, 13.30", 1.2 kg
Recensioni esterne » Lenovo Ideapad 710S-13ISK-80SW001EGE
Acer Aspire V3-372T-55G1: Intel Core i5-6267U, 13.00", 1.7 kg
Recensioni esterne » Acer Aspire V3-372T-55G1
Dell XPS 13 9350 WQXGA: Intel Core i7-6560U, 13.30", 1.3 kg
Recensioni esterne » Dell XPS 13 9350 WQXGA
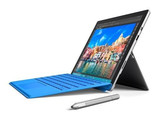
Microsoft Surface Pro 4 Core i7: Intel Core i7-6650U, 12.30", 1.1 kg
Recensioni esterne » Microsoft Surface Pro 4 Core i7
Posizione approssimativa dell'adattatore grafico
I nostri Top 10
» Top 10 Portatili Multimedia
» Top 10 Portatili Gaming
» Top 10 Portatili Gaming Leggeri
» Top 10 Portatili da Ufficio e Business economici
» Top 10 Portatili Premium da Ufficio/Business
» Top 10 Portatili sotto i 300 Euro
» Top 10 Portatili sotto i 500 Euro
» Top 10 dei Portatili Workstation
» Top 10 Subnotebooks
» Top 10 Ultrabooks
» Top 10 Convertibili
» Top 10 Tablets
» Top 10 Tablets Windows
» Top 10 Smartphones