Notebookcheck Logo

NVIDIA Quadro P5200

NVIDIA Quadro P5200

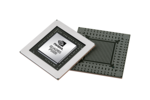
La Nvidia Quadro P5200 è una scheda grafica mobile high-end per portatili. E' simile alla GeForce GTX 1070 consumer (Laptop), si basa su un chip GP104 ridotto con 2048 shaders. La Quadro P5200 è il successore della Quadro P5000 e tecnicamente è solo una variante con un clock leggermente più elevato. Ci saranno una variante normale (Max-P) ed una più lenta ma più efficiente (Max-Q) della scheda. I 16 GB di GDDR5 hanno un clock da 3,6 GHz con una banda di memoria da 230 GB/s.

Le GPUs Quadro offrono drivers certificati che sono ottimizzati per stabilità e prestazioni con le applicazioni professionali (CAD, DCC, applicazioni mediche, prospettiva e visualizzazione). Le performance in questi settori sono pertanto nettamente migliori rispetto alle corrispondenti GPUs consumer.

Performance

Le performance teoriche dovrebbero essere leggermente superiori rispetto alla vecchia Quadro P5000. Sebbene l'incremento della velocità non sia ancora conosciuto, il consumo dovrebbe essere molto più elevato, il che dovrebbe comportare anche prestazioni nettamente migliorate. Nvidia dichiara un picco di prestazioni teorico di 8,9 GFLOPS (Single Precision).

Consumo Energetico

Il consumo energetico della Quadro P5200 dichiarato da Nvidia è di 150 Watt (Max-P) e dovrebbe essere di 100 - 110 Watt per la variante Max-Q. Pertanto, è molto più elevato rispetto alle versioni Quadro P5000 (100 Watt e 80 Watt). La scheda è stata annunciata inizialmente nell'HP Z VR Backpack G1, ma non sappiamo per ora quale variante è utilizzata.

Quadro P Serie

Quadro P5200 2560 @ 1.32 - 1.57 GHz256 Bit @ 7216 MHz
Quadro P4200 2304 @ 1.22 - 1.48 GHz256 Bit @ 7132 MHz
Quadro P5000 2048 @ 1.16 - 1.51 GHz256 Bit @ 6006 MHz
Quadro P5000 Max-Q 2048 @ 1.1 - 1.37 GHz256 Bit @ 6006 MHz
Quadro P4000 1792 @ 1.2 - 1.23 GHz256 Bit @ 6006 MHz
Quadro P4000 Max-Q 1792 @ 1.11 - 1.24 GHz256 Bit @ 6006 MHz
Quadro P3200 1792 @ 0.71 - 1.23 GHz192 Bit @ 7008 MHz
Quadro P3000 1280 @ 1.09 - 1.22 GHz192 Bit @ 7008 MHz
Quadro P3000 Max-Q 1280 @ 1.08 - 1.24 GHz192 Bit @ 7008 MHz
Quadro P2000 768 @ 1.22 - 1.47 GHz128 Bit @ 6008 MHz
Quadro P2000 Max-Q 768 @ 1.22 - 1.47 GHz128 Bit @ 6008 MHz
Quadro P1000 512 @ 1.49 - 1.52 GHz128 Bit @ 6008 MHz
Quadro P620 512 @ 1.18 - 1.44 GHz128 Bit @ 6000 MHz
ArchitetturaPascal
Pipelines2560 - unified
Velocità del core1316 - 1569 (Boost) MHz
Velocità della memoria7216 MHz
Larghezza del bus di memoria256 Bit
Tipo di memoriaGDDR5
Max. quantità di memoria16 GB
Memoria condivisano
APIDirectX 12_1, Shader 5.0, OpenGL 4.5
Consumo di corrente150 Watt
tecnologia16 nm
CaratteristicheOptimus, PhysX, 3D Vision Pro, nView, Optimus
Dimensione del portatilegrande
Data dell'annuncio11.01.2017

Benchmark

Performance Rating - 3DMark 11 + Fire Strike + Time Spy
8.4 pt (25%)
3DMark - 3DMark Cloud Gate Score
min: 39077     media: 43444     media: 43443.5 (46%)     massimo: 47810 Points
3DMark - 3DMark Cloud Gate Graphics
min: 105184     media: 106328     media: 106328 (28%)     massimo: 107472 Points
3DMark - 3DMark Fire Strike Standard Score
min: 16528     media: 16626     media: 16625.5 (29%)     massimo: 16723 Points
3DMark - 3DMark Fire Strike Standard Graphics
min: 18390     media: 18467     media: 18467 (21%)     massimo: 18544 Points
3DMark 11 - 3DM11 Performance Score
min: 21204     media: 21715     media: 21715 (30%)     massimo: 22226 Points
3DMark 11 - 3DM11 Performance GPU
min: 24934     media: 25100     media: 25100 (22%)     massimo: 25266 Points
3DMark Vantage
3DM Vant. Perf. total +
3DMark Vantage - 3DM Vant. Perf. total
65844 Points (19%)
3DM Vant. Perf. GPU no PhysX +
3DMark Vantage - 3DM Vant. Perf. GPU no PhysX
68614 Points (39%)
62 -100%
...
60439 -12%
62557 -9%
62862 -8%
63088 -8%
63137 -8%
66003 -4%
66376 -3%
66735 -3%
68082 -1%
NVIDIA Quadro P5200
68614
68627 0%
NVIDIA GeForce RTX 2070 Super Max-Q
69136 1%
69467 1%
74008 8%
74946 9%
NVIDIA GeForce RTX 2070 Super Mobile
75429 10%
76250 11%
NVIDIA GeForce RTX 2080 Super Mobile
77180 12%
77533 13%
...
132443 93%
max:
170928 149%
0%
100%
3DMark 06 3DMark 06 - Standard 1280x1024 +
3DMark 06
44390 Points (59%)
SPECviewperf 12
specvp12 sw-03 +
SPECviewperf 12 - specvp12 sw-03
min: 199.8     media: 205.9     media: 205.9 (51%)     massimo: 212 fps
specvp12 snx-02 +
SPECviewperf 12 - specvp12 snx-02
min: 213.7     media: 215.8     media: 215.8 (32%)     massimo: 217.9 fps
specvp12 showcase-01 +
specvp12 mediacal-01 +
specvp12 maya-04 +
specvp12 energy-01 +
specvp12 creo-01 +
specvp12 catia-04 +
SPECviewperf 13 specvp13 sw-04 +
SPECviewperf 13 - specvp13 sw-04
min: 178.3     media: 183.8     media: 183.8 (49%)     massimo: 189.2 fps
specvp13 snx-03 +
SPECviewperf 13 - specvp13 snx-03
min: 386.7     media: 391.5     media: 391.5 (43%)     massimo: 396.3 fps
specvp13 showcase-02 +
SPECviewperf 13 - specvp13 showcase-02
min: 74.7     media: 75.1     media: 75.1 (16%)     massimo: 75.5 fps
specvp13 medical-02 +
SPECviewperf 13 - specvp13 medical-02
min: 61.5     media: 61.6     media: 61.6 (13%)     massimo: 61.7 fps
specvp13 maya-05 +
SPECviewperf 13 - specvp13 maya-05
min: 251.9     media: 253.5     media: 253.5 (29%)     massimo: 255 fps
specvp13 energy-02 +
SPECviewperf 13 - specvp13 energy-02
min: 17.14     media: 17.2     media: 17.2 (6%)     massimo: 17.28 fps
specvp13 creo-02 +
specvp13 catia-05 +
SPECviewperf 13 - specvp13 catia-05
min: 291.7     media: 297.1     media: 297.1 (33%)     massimo: 302.4 fps
specvp13 3dsmax-06 +
Cinebench R10 Cinebench R10 Shading (32bit) +
Cinebench R10 - Cinebench R10 Shading (32bit)
min: 6830     media: 6833     media: 6833 (5%)     massimo: 6836 punti
Cinebench R11.5 Cinebench R11.5 OpenGL 64 Bit +
Cinebench R15
Cinebench R15 OpenGL 64 Bit +
Cinebench R15 OpenGL Ref. Match 64 Bit +
Cinebench R15 - Cinebench R15 OpenGL Ref. Match 64 Bit
99.6 % (100%)
ComputeMark v2.1 - ComputeMark v2.1 Result
15892 punti (17%)
Power Consumption - Witcher 3 Power Consumption *
min: 218.9     media: 227.6     media: 227.6 (50%)     massimo: 236.3 Watt
Power Consumption - Witcher 3 ultra Power Efficiency
min: 0.2823     media: 0.3     media: 0.3 (28%)     massimo: 0.2896 fps per Watt
Emissions Witcher 3 Fan Noise +
- Valori di benchmark per questa scheda grafica
- Valori medi di benchmark per questa scheda grafica
* Numeri più piccoli rappresentano prestazioni supeiori

Benchmarks per i giochi

I seguenti benchmarks deirivano dai benchmarks dei portatili recensiti. Le prestazioni dipendono dalla scheda grafica utilizzata, dal clock rate, dal processore, dai settaggi di sistema, dai drivers, e dai sistemi operativi. Quindi i risultati non sono rappresentativi per i portatili con questa GPU. Per informazioni dettagliate sui risultati del benchmark, cliccate sul numero di fps.

basso 1280x720
147  fps    + Confronta
medio 1920x1080
91  fps    + Confronta
alto 1920x1080
84  fps    + Confronta
ultra 1920x1080
72  fps    + Confronta
4K 3840x2160
26  fps    + Confronta
» Giocabile con tutti i portatili testati con dettagli ultra.
F1 2018

F1 2018

2018
basso 1280x720
212  fps    + Confronta
medio 1920x1080
152  fps    + Confronta
alto 1920x1080
125  fps    + Confronta
ultra 1920x1080
83  fps    + Confronta
4K 3840x2160
46  fps    + Confronta
» Giocabile con tutti i portatili testati con dettagli ultra.
basso 1280x720
183.5  fps    + Confronta
medio 1920x1080
110.1  fps    + Confronta
alto 1920x1080
100.4  fps    + Confronta
ultra 1920x1080
77.4  fps    + Confronta
4K 3840x2160
24.1  fps    + Confronta
» Giocabile con tutti i portatili testati con dettagli ultra.
Destiny 2

Destiny 2

2017
basso 1280x720
13  fps    + Confronta
medio 1920x1080
12.7  fps    + Confronta
alto 1920x1080
12.6  fps    + Confronta
ultra 1920x1080
12.2  fps    + Confronta
4K 3840x2160
12.3  fps    + Confronta
» Il Benchmark indica che il gioco non è utilizzabile con i settaggi testati.
basso 1280x720
219  fps    + Confronta
medio 1920x1080
137  fps    + Confronta
alto 1920x1080
106  fps    + Confronta
ultra 1920x1080
84  fps    + Confronta
4K 3840x2160
33  fps    + Confronta
» Giocabile con tutti i portatili testati con dettagli ultra.
Dirt 4

Dirt 4

2017
basso 1280x720
354.1  fps    + Confronta
medio 1920x1080
221.2  fps    + Confronta
alto 1920x1080
126  fps    + Confronta
ultra 1920x1080
84.4  fps    + Confronta
4K 3840x2160
56.8  fps    + Confronta
» Giocabile con tutti i portatili testati con dettagli ultra.
Additional Benchmarks
Medium Preset 4xAF 1366x768
242.3
basso 1280x720
248.5  fps    + Confronta
medio 1920x1080
247  fps    + Confronta
alto 1920x1080
185.8  fps    + Confronta
4K 3840x2160
92.5  fps    + Confronta
» Giocabile con tutti i portatili testati con dettagli alto.
Additional Benchmarks
Performance 1920x1080
249.8
Prey

Prey

2017
basso 1280x720
145  fps    + Confronta
medio 1920x1080
144.6  fps    + Confronta
alto 1920x1080
145  fps    + Confronta
ultra 1920x1080
144.1  fps    + Confronta
4K 3840x2160
60.9  fps    + Confronta
» Giocabile con tutti i portatili testati con dettagli ultra.
Additional Benchmarks
Medium Preset 4xAF FXAA 1366x768
144.4
Overwatch

Overwatch

2016
basso 1280x720
300  fps    + Confronta
medio 1366x768
300  fps    + Confronta
alto 1920x1080
252.2  fps    + Confronta
ultra 1920x1080
174.1  fps    + Confronta
4K 3840x2160
88.7  fps    + Confronta
» Giocabile con tutti i portatili testati con dettagli ultra.
Additional Benchmarks
Medium (Render Scale 100 %) 2xAF FXAA 1920x1080
290
Epic (Render Scale 100 %) 16xAF SMAA 3820x2160
57.4
basso 1280x768
113  fps    + Confronta
medio 1920x1080
99.1  fps    + Confronta
alto 1920x1080
97.8  fps    + Confronta
4K 3840x2160
43.5  fps    + Confronta
» Giocabile con tutti i portatili testati con dettagli alto.
Additional Benchmarks
extreme 3840x2160
56.8
basso 1024x768
289 292.9 ~ 291 fps    + Confronta
medio 1366x768
210.1 220.6 ~ 215 fps    + Confronta
alto 1920x1080
121.5 125.5 ~ 124 fps    + Confronta
ultra 1920x1080
101 105.2 ~ 103 fps    + Confronta
4K 3840x2160
44.9 46.6 ~ 46 fps    + Confronta
» Giocabile con tutti i portatili testati con dettagli ultra.
Fallout 4

Fallout 4

2015
basso 1280x720
241.9  fps    + Confronta
medio 1366x768
236.3  fps    + Confronta
4K 3840x2160
46.8  fps    + Confronta
» Giocabile con tutti i portatili testati con dettagli medio.
basso 1024x768
60  fps    + Confronta
medio 1366x768
60  fps    + Confronta
alto 1920x1080
60  fps    + Confronta
ultra 1920x1080
60  fps    + Confronta
4K 3840x2160
60  fps    + Confronta
» Giocabile con tutti i portatili testati con dettagli ultra.
basso 1280x720
186  fps    + Confronta
medio 1366x768
176  fps    + Confronta
alto 1920x1080
131  fps    + Confronta
ultra 1920x1080
90  fps    + Confronta
4K 3840x2160
50  fps    + Confronta
» Giocabile con tutti i portatili testati con dettagli ultra.
basso 1024x768
303.5 327.2 ~ 315 fps    + Confronta
medio 1366x768
211.6 228.7 ~ 220 fps    + Confronta
alto 1920x1080
116.1 120.2 ~ 118 fps    + Confronta
ultra 1920x1080
63.4 66.7 ~ 65 fps    + Confronta + 📈 Graph
4K 3840x2160
43.9 47.2 ~ 46 fps    + Confronta
» Giocabile con tutti i portatili testati con dettagli ultra.
Thief

Thief

2014
basso 1024x768
149.4  fps    + Confronta
medio 1366x768
145.1  fps    + Confronta
alto 1366x768
145.7  fps    + Confronta
ultra 1920x1080
114.2  fps    + Confronta
» Giocabile con tutti i portatili testati con dettagli ultra.
basso 1024x768
177.5  fps    + Confronta
medio 1366x768
175.2  fps    + Confronta
alto 1366x768
171.6  fps    + Confronta
ultra 1920x1080
119.2  fps    + Confronta
» Giocabile con tutti i portatili testati con dettagli ultra.
basso 1280x720
395 435 ~ 415 fps    + Confronta
medio 1366x768
341.6 375.5 ~ 359 fps    + Confronta
alto 1366x768
315.1 346.5 ~ 331 fps    + Confronta
» Giocabile con tutti i portatili testati con dettagli alto.
basso 1024x768
753  fps    + Confronta
medio 1366x768
346.2  fps    + Confronta
alto 1366x768
296.6  fps    + Confronta
ultra 1920x1080
218.9  fps    + Confronta
» Giocabile con tutti i portatili testati con dettagli ultra.
basso 1024x768
145.1  fps    + Confronta
alto 1366x768
83.5  fps    + Confronta
ultra 1920x1080
85.4  fps    + Confronta
» Giocabile con tutti i portatili testati con dettagli ultra.
basso 1024x768
344.2  fps    + Confronta
medio 1366x768
288.1  fps    + Confronta
alto 1366x768
267.3  fps    + Confronta
ultra 1920x1080
118.8  fps    + Confronta
» Giocabile con tutti i portatili testati con dettagli ultra.
bassomedioaltoultraQHD4K
Shadow of the Tomb Raider14791847226
F1 20182121521258346
Monster Hunter World183.5110.1100.477.424.1
Destiny 21312.712.612.212.3
Middle-earth: Shadow of War2191371068433
Dirt 4354.1221.212684.456.8
Rocket League248.5247185.892.5
Prey145144.6145144.160.9
Overwatch300300252.2174.188.7
Ashes of the Singularity11399.197.843.5
Rise of the Tomb Raider29121512410346
Fallout 4241.9236.346.8
Metal Gear Solid V6060606060
Batman: Arkham Knight1861761319050
The Witcher 33152201186546
Thief149.4145.1145.7114.2
Metro: Last Light177.5175.2171.6119.2
BioShock Infinite415359331
StarCraft II: Heart of the Swarm753346.2296.6218.9
Guild Wars 2145.183.585.4
Sleeping Dogs344.2288.1267.3118.8
< 30 fps
< 60 fps
< 120 fps
≥ 120 fps
1

2
18
1

4
15
1

7
12
1

13
3


3
8
4

Per conoscere altri giochi che potrebbero essere utilizzabili e per una lista completa di tutti i giochi e delle schede grafiche visitate la nostra Gaming List

v1.26
log 17. 23:27:25

#0 no ids found in url (should be separated by "_") +0s ... 0s

#1 not redirecting to Ajax server +0s ... 0s

#2 did not recreate cache, as it is less than 5 days old! Created at Sat, 16 Mar 2024 05:38:32 +0100 +0.001s ... 0.001s

#3 no comparison url found in template nbc.compare_page_1 needed +0.034s ... 0.035s

#4 no comparison url found in template nbc.compare_page_1 needed +0s ... 0.036s

#5 no comparison url found in template nbc.compare_page_1 needed +0s ... 0.036s

#6 no comparison url found in template nbc.compare_page_1 needed +0s ... 0.036s

#7 no comparison url found in template nbc.compare_page_1 needed +0s ... 0.036s

#8 no comparison url found in template nbc.compare_page_1 needed +0s ... 0.037s

#9 no comparison url found in template nbc.compare_page_1 needed +0s ... 0.037s

#10 no comparison url found in template nbc.compare_page_1 needed +0s ... 0.037s

#11 no comparison url found in template nbc.compare_page_1 needed +0s ... 0.037s

#12 no comparison url found in template nbc.compare_page_1 needed +0s ... 0.037s

#13 no comparison url found in template nbc.compare_page_1 needed +0s ... 0.038s

#14 no comparison url found in template nbc.compare_page_1 needed +0s ... 0.038s

#15 composed specs +0s ... 0.038s

#16 did output specs +0s ... 0.038s

#17 start showIntegratedCPUs +0s ... 0.038s

#18 getting avg benchmarks for device 8094 +0.03s ... 0.068s

#19 got single benchmarks 8094 +0.016s ... 0.084s

#20 got avg benchmarks for devices +0s ... 0.084s

#21 min, max, avg, median took s +0.734s ... 0.818s

#22 before gaming benchmark output +0s ... 0.818s

#23 Got 106 rows for game benchmarks. +0.008s ... 0.826s

#24 composed SQL query for gamebenchmarks +0s ... 0.826s

#25 got data and put it in $dataArray +0.018s ... 0.844s

#26 benchmarks composed for output. +0.861s ... 1.705s

#27 no comparison url found in template nbc.compare_page_1 needed +0.003s ... 1.708s

#28 return log +0s ... 1.708s

Please share our article, every link counts!

Classe 0

Arc A380

Classe 1

GeForce RTX 2080 Super Mobile

Classe 2

M1 Max 32-Core GPU *
GeForce RTX 2070 Super Mobile
M1 Max 24-Core GPU *
Radeon RX 5700M *
M1 Pro 16-Core GPU *
Radeon PRO W6600M *
GeForce RTX 2070 Super Max-Q
M1 Pro 14-Core GPU *
Quadro P4200
Quadro P5000 Max-Q *
GeForce RTX 3050 4GB Laptop GPU
Quadro P4000 Max-Q
Radeon RX 580X (Laptop) *
Radeon RX 580 (Laptop)
Radeon Pro 5300M
Radeon RX 5300M
Quadro P3000 Max-Q *
Radeon Pro WX 7100 *
Radeon RX 570X (Laptop) *
Radeon RX 570 (Laptop) *
Radeon RX 470 (Laptop) *

Classe 3

GeForce GTX 1050 Ti Mobile
Radeon 680M
Quadro P2000 Max-Q
Radeon R9 M395X
GeForce GTX 1050 Ti Max-Q *
WX Vega M GL
Radeon R9 M485X
GeForce GTX 1050 Max-Q *
Radeon 660M
Radeon RX 560X (Laptop)
Radeon RX 560 (Laptop)
Radeon Pro 560X
Radeon Pro 560
Radeon Pro 460
Radeon Pro WX 4130 *
Quadro P620 *
Radeon RX 550X (Laptop)
Radeon Pro 555X
Radeon Pro 555
Radeon Pro 455
Quadro P600
Radeon RX 540X *
Radeon Pro WX 2100 *
Radeon Pro WX 3100 *
Radeon Pro 450
Radeon 630
Radeon 540X *
Quadro P520
Quadro P500 *
Iris Plus Graphics G7 (Ice Lake 64 EU) *
Vega 10 *
Iris Pro Graphics 580
Vega 9
FirePro W5130M
UHD Graphics Xe G4 48EUs *
UHD Graphics 32EUs
UHD Graphics Xe 32EUs (Tiger Lake-H) *
UHD Graphics 750
Vega 7
Radeon R7 M465
Vega 8
Iris Plus Graphics G4 (Ice Lake 48 EU)
Quadro M600M
FirePro W4190M
Radeon R7 M445
UHD Graphics 24EUs (Alder Lake-N) *
Radeon R7 M340
Radeon 610M *
UHD Graphics G1 (Ice Lake 32 EU)
UHD Graphics Xe 16EUs (Tiger Lake-H) *
Radeon R5 (Bristol Ridge)
Adreno 690 *
Adreno 685 *
Adreno 680 *

Classe 4

UHD Graphics 730
Radeon R5 M315 *
Radeon R5 M420 *
UHD Graphics 617
UHD Graphics 615
Radeon R4 (Stoney Ridge)
Radeon R2 (Stoney Ridge)
HD Graphics (Broadwell)

Classe 5

Posizione approssimativa dell'adattatore grafico

> Recensioni e prove di notebook, tablets e smartphones > Info Techniche / Tips > Confronto delle schede video > NVIDIA > NVIDIA Quadro P5200
Klaus Hinum, 2017-12-28 (Update: 2017-12-28)