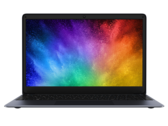
Recensione del computer portatile Chuwi HeroBook 14 (Atom x5-E8000, FHD)
Intel Atom x5-E8000 | Intel HD Graphics 400 (Braswell) | 14.00" | 1.5 kg
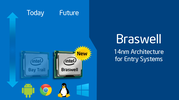
L'Intel HD Graphics 400 (Braswell) è una scheda grafica integrata nei SoCs low end della serie Braswell (modelli 2016 Celeron). Si basa sulla stessa architettura della GPU integrata delle schede grafiche Broadwell (es. HD Graphics 5300), ma offre meno shader cores e velocità clock inferiori.
E' una scheda Intel HD Graphics (Braswell) rinominata che include il più veloce modello 16 dei SoCs Pentium. Guardate la pagina della scheda grafica Intel HD Graphics Braswell per i benchmarks.
Le performance dipendono dal processore (diverse velocità boost per la GPU) e dalla memoria usata.
Le prestazioni gaming sono adatte solo per i giochi più datati e meno pesanti. Spesso anche il processore ha prestazioni gaming limitate (es. nel dual-core N3000).
Il SoC integra anche un motore video per la decodifica che dovrebbe essere in grado di gestire i videos 4K H.265.
HD Graphics Serie
| ||||||||||||||||||||||||||||||||||||||||||||||||||||||||||||||||||||||
| Nome in codice | Braswell | |||||||||||||||||||||||||||||||||||||||||||||||||||||||||||||||||||||
| Architettura | Gen. 8 | |||||||||||||||||||||||||||||||||||||||||||||||||||||||||||||||||||||
| Pipelines | 12 - unified | |||||||||||||||||||||||||||||||||||||||||||||||||||||||||||||||||||||
| Velocità del core | 320 - 640 (Boost) MHz | |||||||||||||||||||||||||||||||||||||||||||||||||||||||||||||||||||||
| Larghezza del bus di memoria | 64/128 Bit | |||||||||||||||||||||||||||||||||||||||||||||||||||||||||||||||||||||
| Memoria condivisa | si | |||||||||||||||||||||||||||||||||||||||||||||||||||||||||||||||||||||
| API | DirectX 11.2, Shader 5.0 | |||||||||||||||||||||||||||||||||||||||||||||||||||||||||||||||||||||
| tecnologia | 14 nm | |||||||||||||||||||||||||||||||||||||||||||||||||||||||||||||||||||||
| Data dell'annuncio | 01.04.2016 | |||||||||||||||||||||||||||||||||||||||||||||||||||||||||||||||||||||
| ||||||||||||||||
I seguenti benchmarks deirivano dai benchmarks dei portatili recensiti. Le prestazioni dipendono dalla scheda grafica utilizzata, dal clock rate, dal processore, dai settaggi di sistema, dai drivers, e dai sistemi operativi. Quindi i risultati non sono rappresentativi per i portatili con questa GPU. Per informazioni dettagliate sui risultati del benchmark, cliccate sul numero di fps.


| basso | medio | alto | ultra | QHD | 4K | |
|---|---|---|---|---|---|---|
| Farming Simulator 19 | 14.1 | |||||
| Team Fortress 2 | 18.5 | 16 | ||||
| Rocket League | 12.7 | |||||
| Prey | 6.8 | |||||
| Resident Evil 7 | 10.7 | |||||
| Farming Simulator 17 | 20.9 | 5.8 | ||||
| Civilization 6 | 9.7 | |||||
| Overwatch | 15 | 10 | ||||
| Rise of the Tomb Raider | 5.3 | |||||
| Rainbow Six Siege | 7.3 | 3.2 | ||||
| FIFA 16 | 36.5 | 14.2 | 9 | |||
| World of Warships | 13 | 8 | ||||
| Metal Gear Solid V | 13.3 | |||||
| Dota 2 Reborn | 21.3 | 11.4 | ||||
| The Witcher 3 | 8.5 | 5.6 | ||||
| Dirt Rally | 40.1 | 11.7 | ||||
| GTA V | 14.3 | |||||
| Dragon Age: Inquisition | 5.4 | 2.9 | ||||
| F1 2014 | 27 | 16 | ||||
| Alien: Isolation | 12 | 7 | ||||
| Sims 4 | 37 | 7.6 | ||||
| Risen 3: Titan Lords | 6.5 | 4.8 | ||||
| GRID: Autosport | 28.9 | 12.5 | ||||
| X-Plane 10.25 | 11.8 | |||||
| Battlefield 4 | 16.2 | 12.3 | 7.9 | |||
| Dead Trigger 2 | 30 | |||||
| F1 2013 | 28 | 17 | ||||
| Asphalt 8: Airborne | 30 | 30 | ||||
| GRID 2 | 19.9 | 12.5 | ||||
| BioShock Infinite | 18 | 9 | 6.23 | 1.8 | ||
| Tomb Raider | 24.8 | 10.2 | ||||
| Dead Space 3 | 21.1 | 10.8 | 8.7 | |||
| Counter-Strike: GO | 10.5 | |||||
| Diablo III | 18.3 | |||||
| Anno 2070 | 27.7 | |||||
| The Elder Scrolls V: Skyrim | 19.8 | 9.5 | ||||
| Deus Ex Human Revolution | 18.4 | 11.3 | ||||
| Dirt 3 | 29.4 | 14.3 | 12.5 | |||
| StarCraft 2 | 34.5 | 8.8 | 5.6 | |||
| Trackmania Nations Forever | 74 | 24 | 9.9 | |||
| basso | medio | alto | ultra | QHD | 4K | < 30 fps < 60 fps < 120 fps ≥ 120 fps | 33 5 1 | 23 | 8 2 | 3 | | |
Per conoscere altri giochi che potrebbero essere utilizzabili e per una lista completa di tutti i giochi e delle schede grafiche visitate la nostra Gaming List

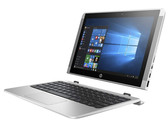
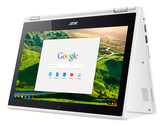
HP Stream 14-ax002ng: Intel Celeron N3060, 14.00", 1.4 kg
recensione » Recensione del Portatile HP Stream 14 (N3060, HD400)
Asus Transformer Book T102HA-GR022T: Intel Atom x5-Z8350, 10.10", 0.8 kg
recensione » Recensione breve del Convertibile Asus Transformer Book T102HA (x5-Z8350, 4 GB, 128 GB)
Lenovo Ideapad 110S-11IBR: Intel Celeron N3060, 11.60", 1.1 kg
recensione » Recensione breve del Subnotebook Lenovo IdeaPad 110S (N3060, 32 GB)
Asus VivoBook E200HA-FD0041TS: Intel Atom x5-Z8350, 11.60", 1 kg
recensione » Recensione breve delSubnotebook Asus VivoBook E200HA (x5-Z8350, 32 GB)
Lenovo IdeaPad Miix 320-10ICR Pro LTE: Intel Atom x5-Z8350, 10.10", 1 kg
recensione » Recensione breve del Convertibile Lenovo IdeaPad Miix 320 Pro (x5-Z8350, LTE, 128 GB)
Lenovo Yoga Book Android YB1-X90F: Intel Atom x5-Z8550, 10.10", 0.7 kg
recensione » Recensione breve del Convertibile Lenovo Yoga Book Android YB1-X90F
Lenovo Yoga Book 2016 Windows 64GB LTE: Intel Atom x5-Z8550, 10.10", 0.7 kg
recensione » Recensione breve del Convertibile Lenovo Yoga Book 2016 Windows 64GB LTE
HP 250 G5 Y1V08UT: Intel Celeron N3060, 15.60", 2 kg
recensione » Recensione breve del Portatile HP 250 G5 Y1V08UT (Celeron N3060, HD)
Samsung Chromebook Connect XE501C13-AD2BR: Intel Celeron N3060, 11.60", 1.2 kg
Recensioni esterne » Samsung Chromebook Connect XE501C13-AD2BR
Acer Aspire 3 A315-33-C876: Intel Celeron N3060, 15.60", 2.1 kg
Recensioni esterne » Acer Aspire 3 A315-33-C876
Chuwi HeroBook 14: Intel Atom x5-E8000, 14.00", 1.5 kg
Recensioni esterne » Chuwi HeroBook 14
HP Stream 14-cb099ns: Intel Celeron N3060, 14.00", 1.5 kg
Recensioni esterne » HP Stream 14-cb099ns
Dell Chromebook 11 3181 2-in-1: Intel Celeron N3060, 11.60", 1.4 kg
Recensioni esterne » Dell Chromebook 11 3181 2-in-1
Medion Akoya E2215T-MD60689: Intel Atom x5-Z8350, 11.60", 1.1 kg
Recensioni esterne » Medion Akoya E2215T-MD60689
Samsung Chromebook 3 XE500C13-K03US: Intel Celeron N3060, 11.60", 1.1 kg
Recensioni esterne » Samsung Chromebook 3 XE500C13-K03US
Asus E406SA-BV004T: Intel Celeron N3060, 14.00", 1.3 kg
Recensioni esterne » Asus E406SA-BV004T
Acer Aspire 3 A315-33-C3JA: Intel Celeron N3060, 15.60", 2.1 kg
Recensioni esterne » Acer Aspire 3 A315-33-C3JA
HP Stream 11 Pro G3 Z2Z28ES: Intel Celeron N3060, 11.60", 1.2 kg
Recensioni esterne » HP Stream 11 Pro G3 Z2Z28ES
HP Stream 14-ax004nl: Intel Celeron N3060, 14.00", 1.4 kg
Recensioni esterne » HP Stream 14-ax004nl
HP 15-bs510ns: Intel Celeron N3060, 15.60", 2.1 kg
Recensioni esterne » HP 15-bs510ns
Acer Swift 1 SF114-31-C5NW: Intel Celeron N3060, 14.00", 1.4 kg
Recensioni esterne » Acer Swift 1 SF114-31-C5NW
Lenovo Ideapad 110S-11IBR: Intel Celeron N3060, 11.60", 1.1 kg
Recensioni esterne » Lenovo Ideapad 110S-11IBR
Acer Extensa 2519-C8HV: Intel Celeron N3060, 15.60", 2.4 kg
Recensioni esterne » Acer Extensa 2519-C8HV
Medion Akoya S4219-30020605: Intel Celeron N3050, 14.00", 1.6 kg
Recensioni esterne » Medion Akoya S4219-30020605
HP Pavilion x2 10-p012ns: Intel Atom x5-Z8350, 10.10", 1.1 kg
Recensioni esterne » HP Pavilion x2 10-p012ns
Acer Chromebook 15 CB3-532-C8E0: Intel Celeron N3160, 15.60", 2 kg
Recensioni esterne » Acer Chromebook 15 CB3-532-C8E0
Lenovo Yoga 300-11IBR-80M100UUSP: Intel Celeron N3060, 11.60", 1.4 kg
Recensioni esterne » Lenovo Yoga 300-11IBR-80M100UUSP
Lenovo Ideapad 110S-11IBR-80WG00ENSP: Intel Celeron N3060, 11.60", 1.2 kg
Recensioni esterne » Lenovo Ideapad 110S-11IBR-80WG00ENSP
HP Stream 11-aa001ns: Intel Celeron N3060, 11.60", 1.4 kg
Recensioni esterne » HP Stream 11-aa001ns
Medion Akoya S6219-MD60769: Intel Celeron N3060, 15.60", 1.9 kg
Recensioni esterne » Medion Akoya S6219-MD60769
HP 15-bs092NS: Intel Celeron N3060, 15.60", 2.1 kg
Recensioni esterne » HP 15-BS092NS
HP 14-bs002nh: Intel Celeron N3060, 14.00", 1.7 kg
Recensioni esterne » HP 14-bs002nh
Lenovo IdeaPad Miix 320-10ICR Pro LTE: Intel Atom x5-Z8350, 10.10", 1 kg
Recensioni esterne » Lenovo IdeaPad Miix 320-10ICR Pro LTE
Dell Inspiron 15 3552-0514: Intel Celeron N3060, 15.60", 2.1 kg
Recensioni esterne » Dell Inspiron 15 3552-0514
HP Chromebook 11 G5 X0P00EA: Intel Celeron N3060, 11.60", 1.1 kg
Recensioni esterne » HP Chromebook 11 G5 X0P00EA
Lenovo Yoga 300-11IBR-80M100X3SP: Intel Celeron N3060, 11.60", 1.4 kg
Recensioni esterne » Lenovo Yoga 300-11IBR-80M100X3SP
Dell Chromebook 11-3189-7D21X: Intel Celeron N3060, 11.60", 1.5 kg
Recensioni esterne » Dell Chromebook 11-3189-7D21X
HP Stream 14-ax005ns: Intel Celeron N3060, 14.00", 1.4 kg
Recensioni esterne » HP Stream 14-ax005ns
HP Stream 11-y002ns: Intel Celeron N3060, 11.60", 1.2 kg
Recensioni esterne » HP Stream 11-y002ns
Lenovo Ideapad 110-15IBR-80T70057SP: Intel Celeron N3060, 15.60", 2.3 kg
Recensioni esterne » Lenovo Ideapad 110-15IBR-80T70057SP
Dell Chromebook 11 3180-RH02N: Intel Celeron N3060, 11.60", 1.3 kg
Recensioni esterne » Dell Chromebook 11 3180-RH02N
HP Stream 11-y010nr: Intel Celeron N3060, 11.60", 1.2 kg
Recensioni esterne » HP Stream 11-y010nr
Asus Transformer Book Flip TP201SA-FV0010T: Intel Celeron N3060, 11.60", 1.3 kg
Recensioni esterne » Asus Transformer Book Flip TP201SA-FV0010T
Asus D541SA-XO460T: Intel Celeron N3060, 15.60", 1.8 kg
Recensioni esterne » Asus D541SA-XO460T
HP 14-am090nd: Intel Celeron N3060, 14.00", 1.9 kg
Recensioni esterne » HP 14-am090nd
Samsung Chromebook 3 XE500C13-K04US: Intel Celeron N3060, 11.60", 1.1 kg
Recensioni esterne » Samsung Chromebook 3 XE500C13-K04US
Dell Inspiron 14-3451: Intel Celeron N3060, 14.00", 1.8 kg
Recensioni esterne » Dell Inspiron 14-3451
Lenovo IdeaPad 100s-14IBR 80R900K5GE: Intel Celeron N3060, 14.00", 1.5 kg
Recensioni esterne » Lenovo IdeaPad 100S-14IBR-80R900K5GE
HP Stream 11-y072ng: Intel Celeron N3060, 11.60", 1.2 kg
Recensioni esterne » HP Stream 11-y072ng
Asus L402SA: Intel Celeron N3060, 14.00", 1.4 kg
Recensioni esterne » Asus L402SA
Lenovo IdeaPad 100S-14IBR-80R900HXGE: Intel Celeron N3060, 14.10", 1.5 kg
Recensioni esterne » Lenovo IdeaPad 100S-14IBR-80R900HXGE
HP Stream 11-Y000NS: Intel Celeron N3060, 11.60", 1.2 kg
Recensioni esterne » HP Stream 11-Y000NS
Dell Chromebook 11-3180: Intel Celeron N3060, 11.60", 1.3 kg
Recensioni esterne » Dell Chromebook 11-3180
Dell Inspiron 11-3162 2017: Intel Celeron N3060, 11.60", 1.2 kg
Recensioni esterne » Dell Inspiron 11-3162 2017
HP Stream 11-AB001NS x360: Intel Celeron N3060, 11.60", 1.4 kg
Recensioni esterne » HP Stream 11-AB001NS x360
Asus EeeBook E202SA-FD0076T: Intel Celeron N3060, 11.60", 1.3 kg
Recensioni esterne » Asus EeeBook E202SA-FD0076T
Asus Transformer Book Flip TP201SA-FV0019T: Intel Celeron N3060, 11.60", 1.4 kg
Recensioni esterne » Asus Transformer Book Flip TP201SA-FV0019T
Lenovo Yoga Book YB1-X91L: Intel Atom x5-Z8550, 10.10", 0.7 kg
Recensioni esterne » Lenovo Yoga Book YB1-X91L
Acer Swift 1 SF114-31-C24: Intel Celeron N3060, 14.00", 1.6 kg
Recensioni esterne » Acer Swift 1 SF114-31-C24
HP Stream 14-ax003ns: Intel Celeron N3060, 14.00", 1.4 kg
Recensioni esterne » HP Stream 14-ax003ns
Lenovo IdeaPad 110S-11IBR-80WG0060FR: Intel Celeron N3060, 11.60", 1.2 kg
Recensioni esterne » Lenovo IdeaPad 110S-11IBR-80WG0060FR
Lenovo IdeaPad 110-15IBR-80T700BDSP: Intel Celeron N3060, 15.60", 2.2 kg
Recensioni esterne » Lenovo IdeaPad 110-15IBR-80T700BDSP
Dell Chromebook 11-3189: Intel Celeron N3060, 11.60", 1.5 kg
Recensioni esterne » Dell Chromebook 11-3189
Acer Chromebook 14 CB3-431-C0AK: Intel Celeron N3160, 14.00", 1.5 kg
Recensioni esterne » Acer Chromebook 14 CB3-431-C0AK
Acer Swift 1 SF114-31-C534: Intel Celeron N3060, 14.00", 1.6 kg
Recensioni esterne » Acer Swift 1 SF114-31-C534
Asus Eeebook E202SA-FD0078T: Intel Celeron N3060, 11.60", 1.3 kg
Recensioni esterne » Asus Eeebook E202SA-FD0078T
Asus D540SA-XX620T: Intel Celeron N3060, 15.60", 1.9 kg
Recensioni esterne » Asus D540SA-XX620T
Acer Chromebook 11 N7 C731-C8VE: Intel Celeron N3060, 11.60", 1.3 kg
Recensioni esterne » Acer Chromebook 11 N7 C731-C8VE
HP Stream 14-AX001NS: Intel Celeron N3060, 14.00", 1.4 kg
Recensioni esterne » HP Stream 14-AX001NS
Lenovo Ideapad 110S-11IBR-80WG007TGE: Intel Celeron N3060, 11.60", 1.2 kg
Recensioni esterne » Lenovo Ideapad 110S-11IBR-80WG007TGE
Lenovo Yoga A12 Android YB1-Q501F: Intel Atom x5-Z8550, 12.20", 1.1 kg
Recensioni esterne » Lenovo Yoga A12 Android YB1-Q501F
Acer Aspire R3-131T-C7X1: Intel Celeron N3160, 11.60", 1.5 kg
Recensioni esterne » Acer Aspire R3-131T-C7X1
Acer Aspire Switch 10 V SW5-017-196Q: Intel Atom x5-Z8350, 10.10", 1.2 kg
Recensioni esterne » Acer Aspire Switch 10 V SW5-017-196Q
Lenovo N22-20: Intel Celeron N3060, 11.60", 1.2 kg
Recensioni esterne » Lenovo N22-20
Asus D540SA-XX621D: Intel Celeron N3060, 15.60", 2 kg
Recensioni esterne » Asus D540SA-XX621D
HP Stream 14-AX000NF: Intel Celeron N3060, 14.00", 1.4 kg
Recensioni esterne » HP Stream 14-AX000NF
HP Stream 14-ax010nr: Intel Celeron N3060, 14.00", 1.4 kg
Recensioni esterne » HP Stream 14-ax010nr
HP Chromebook 11 G5: Intel Celeron N3060, 11.60", 1.2 kg
Recensioni esterne » HP Chromebook 11 G5
Acer Chromebook 14 CB3-431-C9WH: Intel Celeron N3060, 14.00", 1.6 kg
Recensioni esterne » Acer Chromebook 14 CB3-431-C9WH
Acer Chromebook R11 CB5-132T-C8ZW: Intel Celeron N3060, 11.60", 1.2 kg
Recensioni esterne » Acer Chromebook R11 CB5-132T-C8ZW
Lenovo Yoga Book YB1-X91F: Intel Atom x5-Z8550, 10.10", 0.7 kg
Recensioni esterne » Lenovo Yoga Book YB1-X91F
HP 15-ay042Nns: Intel Celeron N3060, 15.60", 2.5 kg
Recensioni esterne » HP 15-ay042Nns
Asus X540SA-XX311T: Intel Celeron N3060, 15.60", 1.9 kg
Recensioni esterne » Asus X540SA-XX311T
Asus X540SA-XX311D: Intel Celeron N3060, 15.60", 2.4 kg
Recensioni esterne » Asus X540SA-XX311D
Acer Chromebook 15 CB3-532-C47C: Intel Celeron N3060, 15.60", 1.9 kg
Recensioni esterne » Acer Chromebook 15 CB3-532-C47C
HP 17-x000nd: Intel Celeron N3060, 17.30", 2.8 kg
Recensioni esterne » HP 17-x000nd
Lenovo Yoga Book Android YB1-X90F: Intel Atom x5-Z8550, 10.10", 0.7 kg
Recensioni esterne » Lenovo Yoga Book Android YB1-X90F
Acer Chromebook 15 CB5-532-C47C: Intel Celeron N3060, 15.60", 1.9 kg
Recensioni esterne » Acer Chromebook 15 CB5-532-C47C
Acer Chromebook 14 CB3-431-C6UD: Intel Celeron N3160, 14.00", 1.6 kg
Recensioni esterne » Acer Chromebook 14 CB3-431-C6UD
Panasonic Toughpad FZ-A2-A211CA3: Intel Atom x5-Z8550, 10.10", 0.9 kg
Recensioni esterne » Panasonic Toughpad FZ-A2-A211CA3
Lenovo Yoga Book 2016 Windows 64GB LTE: Intel Atom x5-Z8550, 10.10", 0.7 kg
Recensioni esterne » Lenovo Yoga Book 10 inch 2016, Windows 10
HP 250 G5: Intel Celeron N3060, 15.60", 1.7 kg
Recensioni esterne » HP 250 G5
Asus Chromebook C202SA-YS02: Intel Celeron N3060, 11.60", 1.2 kg
Recensioni esterne » Asus Chromebook C202SA-YS02
Posizione approssimativa dell'adattatore grafico
I nostri Top 10
» Top 10 Portatili Multimedia
» Top 10 Portatili Gaming
» Top 10 Portatili Gaming Leggeri
» Top 10 Portatili da Ufficio e Business economici
» Top 10 Portatili Premium da Ufficio/Business
» Top 10 Portatili sotto i 300 Euro
» Top 10 Portatili sotto i 500 Euro
» Top 10 dei Portatili Workstation
» Top 10 Subnotebooks
» Top 10 Ultrabooks
» Top 10 Convertibili
» Top 10 Tablets
» Top 10 Tablets Windows
» Top 10 Smartphones