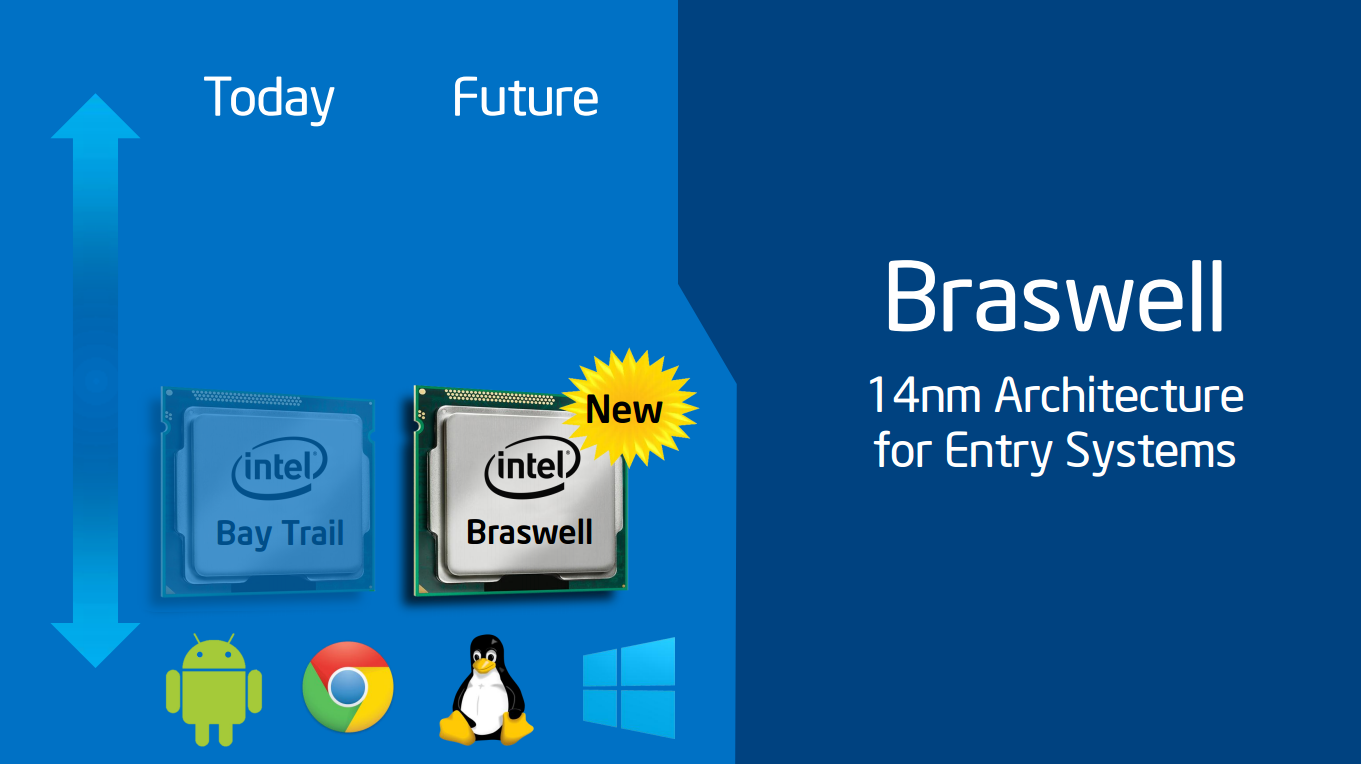
Recensioni Notebook con Intel HD Graphics (Braswell) la scheda grafica
Recensione breve del convertibile HP Pavilion 11-k103ng
Teledipendente. L'HP convertibile da 11.6" offre uno schermo IPS ad alto contrasto e molto spazio di archiviazione, ma l'autonomia è troppo breve.
Intel Celeron N3050, HD Graphics (Braswell), 11.6", 1.5 kgRecensione breve del Subnotebook HP Stream 11-r000ng
Netbook revival? Per circa 200 Euro (~$220) avrete un mini dispositivo Windows con poco spazio di archiviazione ed uno scarso pannello TN. Tuttavia, il prezzo è eccellente per un dispositivo Windows 10 Home (64-bit).
Intel Celeron N3050, HD Graphics (Braswell), 11.6", 1.1 kgRecensione Breve del portatile Asus F540SA-XX087T
Soddisfacente. Un semplice portatile da 15.6" basato su CPU Braswell, il F540SA-XX087T può essere comprato per poco meno di 280 Euro (~$315). Il prezzo include Windows 10 ed un hard drive da 500 GB. Asus ha installato anche una porta USB Type-C in questo portatile low-cost.
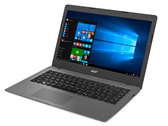
Intel Celeron N3050, HD Graphics (Braswell), 15.6", 1.9 kgRecensione Breve del Portatile Acer Aspire One Cloudbook 14 AO1-431-C6QM
Duratura macchina da scrivere. Questo 14" Acer ha un processore debile ma offre una ottima autonomia. Il prezzo di circa 280 Euro (~$310) ed un anno incluso di licenza Office 365 Personal potrebbe attrarre molti clienti.
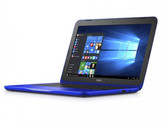
Intel Celeron N3050, HD Graphics (Braswell), 14", 1.6 kgRecensione Breve del Subnotebook Dell Inspiron 11 3162
Duraturo. Il piccolo portatile Dell aggiunge colore alla scrivania e può offrire una buona autonomia. Con 250 Euro (~$284), il portatile è allo stesso livello di prezzo dei suoi concorrenti.
Intel Celeron N3050, HD Graphics (Braswell), 11.6", 1.2 kgLenovo Yoga 300-11IBR: Intel Celeron N3050, 11.60", 1.4 kg
recensione » Recensione Breve del Convertibile Lenovo Yoga 300-11IBR
Lenovo IdeaPad 300S-11IBR: Intel Celeron N3050, 11.60", 1.3 kg
recensione » Recensione Breve del Portatile Lenovo IdeaPad 300S-11IBR
HP Stream 13-c102ng: Intel Celeron N3050, 13.30", 1.5 kg
recensione » Recensione Breve del portatile HP Stream 13-c102ng
Acer Aspire ES1-731-P4A6: Intel Pentium N3700, 17.30", 3 kg
recensione » Recensione Breve del Portatile Acer Aspire ES1-731-P4A6
Acer Aspire One Cloudbook 11 AO1-131-C58K: Intel Celeron N3050, 11.60", 1.2 kg
recensione » Recensione Breve del Portatile Acer Aspire One Cloudbook 11
Toshiba Satellite Radius 11 L10W-C-108: Intel Pentium N3700, 11.60", 1.3 kg
recensione » Recensione Breve del portatile Toshiba Satellite Radius 11 L10W-C-108
Acer Extensa 2519-C7DC: Intel Celeron N3050, 15.60", 2.4 kg
recensione » Recensione breve del portatile Acer Extensa 2519-C7DC
Asus Transformer Book Flip TP200SA-FV0108TS: Intel Celeron N3050, 11.60", 1.2 kg
recensione » Recensione Breve del Convertibile Asus Transformer Book Flip TP200SA (32 GB)
Asus ASUS Transformer Book Flip TP200SA-DH04T: Intel Celeron N3050, 11.60", 1.2 kg
recensione » Recensione breve del convertibile Asus Transformer Book Flip TP200SA
Acer Aspire ES1-331-C5KL: Intel Celeron N3150, 13.30", 1.6 kg
recensione » Recensione breve del Portatile Acer Aspire ES1-331-C5KL
Acer Aspire R11 R3-131T-C122: Intel Celeron N3050, 11.60", 1.4 kg
recensione » Recensione del Convertibile Acer Aspire R11 R3-131T
Acer Aspire ES1-131: Intel Celeron N3050, 11.60", 1.1 kg
recensione » Recensione Breve del portatile Acer Aspire ES1-131
Lenovo N23 Ruggedized 80YS0044NH: Intel Celeron N3160, 11.60", 1.3 kg
Recensioni esterne » Lenovo N23 Ruggedized 80YS0044NH
Asus X540SA-XX106T: Intel Pentium N3700, 15.60", 2 kg
Recensioni esterne » Asus X540SA-XX106T
Lenovo Ideapad 100S-14IBR-80R9003XMH: Intel Celeron N3150, 14.00", 1.5 kg
Recensioni esterne » Lenovo Ideapad 100S-14IBR-80R9003XMH
Acer Extensa 2519-C7L5: Intel Celeron N3160, 15.60", 2 kg
Recensioni esterne » Acer Extensa 2519-C7L5
Acer Chromebook R11 CB5-132T-C9KK: Intel Celeron N3160, 11.60", 1.3 kg
Recensioni esterne » Acer Chromebook R11 CB5-132T-C9KK
Lenovo Ideapad 110-15IBR-80T700JXSP: Intel Celeron N3160, 15.60", 2.3 kg
Recensioni esterne » Lenovo Ideapad 110-15IBR-80T700JXSP
Acer Chromebook 14 CB3-431-C8YS: Intel Celeron N3160, 14.00", 1.7 kg
Recensioni esterne » Acer Chromebook 14 CB3-431-C8YS
Acer Chromebook 11 N7 C731-C28L: Intel Celeron N3160, 11.60", 1.3 kg
Recensioni esterne » Acer Chromebook 11 N7 C731-C28L
Asus Transformer Book Flip TP200SA-FV0111R: Intel Celeron N3050, 11.60", 1.2 kg
Recensioni esterne » Asus Transformer Book Flip TP200SA-FV0111R
Asus F553SA-XX305T: Intel Celeron N3050, 15.60", 2.7 kg
Recensioni esterne » Asus F553SA-XX305T
Acer Aspire ES1-531-C5D9: Intel Celeron N3050, 15.60", 2.4 kg
Recensioni esterne » Acer Aspire ES1-531-C5D9
Acer TravelMate B117-M-C661: Intel Celeron N3150, 11.60", 1.4 kg
Recensioni esterne » Acer TravelMate B117-M-C661
Asus X541SA-XX038D: Intel Celeron N3060, 15.60", 2 kg
Recensioni esterne » Asus X541SA-XX038D
Acer Aspire R11 R3-131T-C9QV: Intel Celeron N3050, 11.60", 1.6 kg
Recensioni esterne » Acer Aspire R11 R3-131T-C9QV
Lenovo Ideapad 100S-14IBR-80R9003MSP: Intel Celeron N3050, 14.00", 2.5 kg
Recensioni esterne » Lenovo Ideapad 100S-14IBR-80R9003MSP
Acer Aspire One Cloudbook 11 AO1-131-C7U3: Intel Celeron N3050, 11.60", 1.2 kg
Recensioni esterne » Acer Aspire One Cloudbook 11 AO1-131-C7U3
Lenovo Ideapad 100S-11IBY-80R90043TX: Intel Celeron N3050, 11.60", 1 kg
Recensioni esterne » Lenovo Ideapad 100S-11IBY-80R90043TX
HP Stream 13-c100ns: Intel Celeron N3050, 13.30", 1.6 kg
Recensioni esterne » HP Stream 13-c100ns
Acer Aspire Z3-700: Intel Pentium N3700, 17.30", 2 kg
Recensioni esterne » Acer Aspire Z3-700
HP Stream 11-r000ns: Intel Celeron N3050, 11.60", 1.8 kg
Recensioni esterne » HP Stream 11-r000ns
HP 15-ac131ns: Intel Celeron N3050, 15.60", 2.2 kg
Recensioni esterne » HP 15-ac131ns
HP 14-AC106NS: Intel Celeron N3050, 14.00", 2 kg
Recensioni esterne » HP 14-AC106NS
Toshiba Satellite L12-C-104: Intel Celeron N3050, 11.60", 2 kg
Recensioni esterne » Toshiba Satellite L12-C-104
Lenovo ThinkPad Yoga 11e 20GB000XMH: Intel Celeron N3150, 11.60", 1.5 kg
Recensioni esterne » Lenovo ThinkPad Yoga 11e 20GB000XMH
Acer Aspire ES1-331-P4HL: Intel Pentium N3700, 13.30", 1.5 kg
Recensioni esterne » Acer Aspire ES1-331-P4HL
Asus X540SA-XX004D: Intel Celeron N3050, 15.60", 1.9 kg
Recensioni esterne » Asus X540SA-XX004D
Asus F540SA-XX110T: Intel Celeron N3050, 15.60", 2 kg
Recensioni esterne » Asus F540SA-XX110T
Acer TravelMate B117-M-C2KX: Intel Celeron N3050, 11.60", 1.4 kg
Recensioni esterne » Acer TravelMate B117-M-C2KX
Asus L202SA-FD0041T: Intel Celeron N3050, 11.60", 1.3 kg
Recensioni esterne » Asus L202SA-FD0041T
Acer Chromebook 14 CB3-431-C5K7: Intel Celeron N3160, 14.00", 1.7 kg
Recensioni esterne » Acer Chromebook 14 CB3-431-C5K7
Asus VivoBook R417SA-WX011T: Intel Celeron N3050, 14.00", 1.7 kg
Recensioni esterne » Asus VivoBook R417SA-WX011T
Asus P2428SA-WO0084D: Intel Celeron N3050, 14.00", 2 kg
Recensioni esterne » Asus P2428SA-WO0084D
Medion Akoya S6219-MD60027: Intel Pentium N3700, 15.60", 1.9 kg
Recensioni esterne » Medion Akoya S6219-MD60027
HP Pavilion 17-g148ng: Intel Pentium N3700, 17.30", 2.8 kg
Recensioni esterne » HP Pavilion 17-g148ng
HP Pavilion 15-ab213ng: Intel Pentium N3700, 15.60", 2.3 kg
Recensioni esterne » HP Pavilion 15-ab213ng
Toshiba Satellite Radius 11 L10W-C-108: Intel Pentium N3700, 11.60", 1.3 kg
Recensioni esterne » Toshiba Satellite Radius 11 L10W-C-108
HP 15-ac002ur: Intel Celeron N3050, 15.60", 2.2 kg
Recensioni esterne » HP 15-ac002ur
Acer Aspire E5-532: Intel Celeron N3050, 15.60", 2.1 kg
Recensioni esterne » Acer Aspire E5-532
Asus A553SA: Intel Pentium N3700, 15.60", 2 kg
Recensioni esterne » Asus A553SA
Asus X553SA-XX207D: Intel Pentium N3700, 15.60", 2 kg
Recensioni esterne » Asus X553SA-XX207D
Acer Aspire ES1-731-C5TV: Intel Celeron N3150, 17.30", 3 kg
Recensioni esterne » Acer Aspire ES1-731-C5TV
HP Pavilion 17-g122ng: Intel Pentium N3700, 17.30", 2.8 kg
Recensioni esterne » HP Pavilion 17-g122ng
Dell Inspiron 11 3162: Intel Celeron N3050, 11.60", 1.2 kg
Recensioni esterne » Dell Inspiron 11 3162
Lenovo Yoga 300-11IBR: Intel Celeron N3050, 11.60", 1.4 kg
Recensioni esterne » Lenovo Yoga 300-11IBR
HP Stream 11-r004nf : Intel Celeron N3050, 11.60", 1.9 kg
Recensioni esterne » HP Stream 11-r004nf
Acer TravelMate B116-M-P6JK: Intel Pentium N3700, 11.60", 1.3 kg
Recensioni esterne » Acer TravelMate B116-M-P6JK
Dell Inspiron 15-3552: Intel Pentium N3700, 15.60", 2.1 kg
Recensioni esterne » Dell Inspiron 15-3552
Asus E402SA-DS01-BL: Intel Celeron N3050, 14.00", 1.5 kg
Recensioni esterne » Asus E402SA-DS01-BL
Asus VivoBook E403SA-US21: Intel Pentium N3700, 14.00", 1.5 kg
Recensioni esterne » Asus VivoBook E403SA-US21
Acer Chromebook 11 CB5-132T-C32M: Intel Celeron N3150, 11.60", 1.2 kg
Recensioni esterne » Acer Chromebook 11 CB5-132T-C32M
Acer Chromebook 14 CB3-431-C5FM: unknown, 14.00", 1.5 kg
Recensioni esterne » Acer Chromebook 14 CB3-431-C5FM
HP Stream 11-r010nr: Intel Celeron N3050, 11.60", 1.2 kg
Recensioni esterne » HP Stream 11-r010nr
Asus Transformer Book Flip TP200SA-FV0110TS: Intel Celeron N3050, 11.60", 1.2 kg
Recensioni esterne » Asus Transformer Book Flip TP200SA-FV0110TS
Acer Chromebook 11 CB5-132T-C8KL: Intel Celeron N3050, 11.60", 1.3 kg
Recensioni esterne » Acer Chromebook 11 CB5-132T-C8KL
Toshiba Satellite Radius 11 L12W-C-10E: Intel Pentium N3700, 11.60", 1.4 kg
Recensioni esterne » Toshiba Satellite Radius 11 L12W-C-10E
Acer Travelmate B116-M-C0YQ: Intel Celeron N3150, 11.60", 1.3 kg
Recensioni esterne » Acer Travelmate B116-M-C0YQ
Asus X540SA-XX048T: Intel Celeron N3050, 15.60", 1.9 kg
Recensioni esterne » Asus X540SA-XX048T
Asus Transformer Book Flip TP200SA-FV0048T: Intel Celeron N3050, 11.60", 1.2 kg
Recensioni esterne » Asus Transformer Book Flip TP200SA-FV0048T
Dell Inspiron 14-3452: Intel Pentium N3700, 14.00", 1.7 kg
Recensioni esterne » Dell Inspiron 14-3452
HP Stream 13-c110nr: Intel Celeron N3050, 13.30", 1.6 kg
Recensioni esterne » HP Stream 13-c110nr
Dell Inspiron 15-3558, Celeron N3050: Intel Celeron N3050, 15.60", 2.3 kg
Recensioni esterne » Dell Inspiron 15-3558, Celeron N3050
Acer Chromebook CB5-132T-C1LK: Intel Celeron N3150, 11.60", 1.3 kg
Recensioni esterne » Acer Chromebook CB5-132T-C1LK
HP 15-ac100ur: Intel Celeron N3050, 15.60", 2.2 kg
Recensioni esterne » HP 15-ac100ur
HP Stream 11-R000UR: Intel Celeron N3050, 11.60", 1.2 kg
Recensioni esterne » HP Stream 11-R000UR
Asus EeeBook E202SA: Intel Celeron N3050, 11.60", 1.2 kg
Recensioni esterne » Asus EeeBook E202SA
Acer Chromebook CB5-132T-C32M: Intel Celeron N3150, 11.60", 1.2 kg
Recensioni esterne » Acer Chromebook CB5-132T-C32M
Acer Aspire ES1-531-P1N8: Intel Pentium N3700, 15.60", 2.4 kg
Recensioni esterne » Acer Aspire ES1-531-P1N8
Acer Aspire ES1-331-C8XF: Intel Celeron N3150, 13.30", 1.5 kg
Recensioni esterne » Acer Aspire ES1-331-C8XF
Asus Transformer Book Flip TP200SA-FV00TS: Intel Celeron N3050, 11.60", 1.2 kg
Recensioni esterne » Asus Transformer Book Flip TP200SA-FV00TS
Acer Aspire One Cloudbook 11 AO1-131-C1G9: Intel Celeron N3050, 11.60", 1.1 kg
Recensioni esterne » Acer Aspire One Cloudbook 11 AO1-131-C1G9
HP Pavilion 11-k000ng x360: Intel Pentium N3700, 11.60", 1.4 kg
Recensioni esterne » HP Pavilion 11-k000ng x360
Acer Extensa 2519-C1Q2: Intel Celeron N3050, 15.60", 2.4 kg
Recensioni esterne » Acer Extensa 2519-C1Q2
Acer Aspire One Cloudbook 14 AO1-431-C1FZ: Intel Celeron N3050, 14.00", 1.6 kg
Recensioni esterne » Acer Aspire One Cloudbook 11 AO1-431-C1FZ
Asus ASUS Transformer Book Flip TP200SA-DH04T: Intel Celeron N3050, 11.60", 1.2 kg
Recensioni esterne » Asus ASUS Transformer Book Flip TP200SA-DH04T
Toshiba Satellite C40-C-10K: Intel Celeron N3050, 14.00", 1.7 kg
Recensioni esterne » Toshiba Satellite C40-C-10K
Acer Aspire R11 R3-131T-C122: Intel Celeron N3050, 11.60", 1.4 kg
Recensioni esterne » Acer Aspire R11 R3-131T-C122
Acer Aspire R3-131-C72X: Intel Celeron N3050, 11.60", 1.6 kg
Recensioni esterne » Acer Aspire R3-131-C72X
Acer Aspire R3-131T: Intel Pentium N3700, 11.60", 1.5 kg
Recensioni esterne » Acer Aspire R3-131T