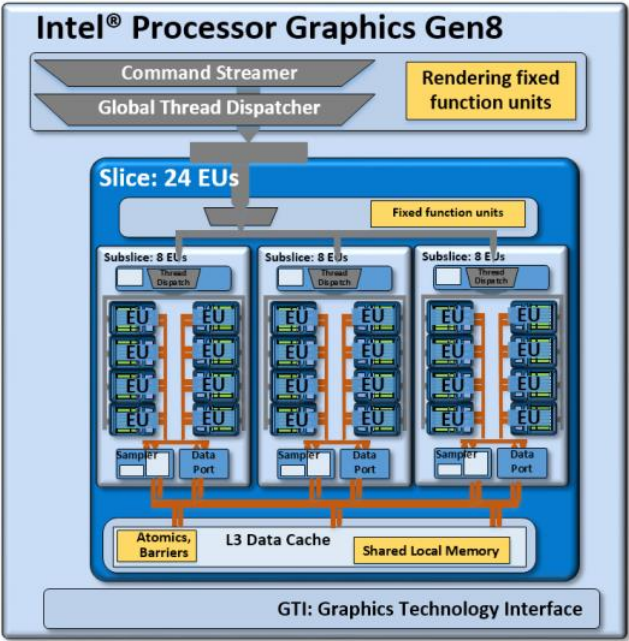
Recensioni Notebook con Intel HD Graphics 5300 la scheda grafica
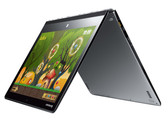
Recensione breve del Convertibile Lenovo Yoga 3 Pro 13 80HE004LGE
Molto margine di miglioramento. Lenovo richiede circa 1.000 Euro per lo Yoga 3 Pro. Avrete un sottile ed attraente convertibile da 13.3" con un display che si piega. Il dispositivo, tuttavia, mostra alcuni punti deboli.
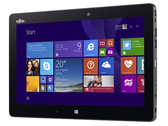
Intel Core M-5Y70, HD Graphics 5300, 13.3", 1.2 kgRecensione Breve del Tablet Fujitsu Stylistic Q665
Business tablet. Lo Stylistic Q665 punta principalmente alle aziende. La sua configurazione e gli accessori disponibili sono pensati per questo gruppo di utenti. Sicuramente non interesserà alla maggioranza degli utenti privati visto il prezzo elevato (da 1200 a 1300 Euro, da ~$1298 a ~$1406).
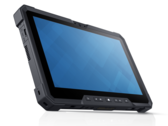
Intel Core M-5Y31, HD Graphics 5300, 11.6", 1.5 kgRecensione breve del tablet Dell Latitude 12 Rugged
Tenace. I dispositivi rugged alcune volte devono lavorare in condizioni estremamente avverse. Il tablet Dell Latitude 12 Rugged si presenta come un robusto cavallo da traino estesamente resistente.
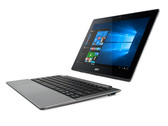
Intel Core M-5Y71, HD Graphics 5300, 11.6", 1.8 kgRecensione breve del convertibile Acer Aspire Switch 11V SW5-173-614T
Rarità. L'hard drive convenzionale nel dock rende questo Acer unico sul mercato. Tuttavia, altre features sono deludenti, pertanto ci sono vari pro e vari contro. Nella sua categoria un pezzo forte o perde la battaglia?
Intel Core M-5Y10c, HD Graphics 5300, 11.6", 1.6 kgRecensione breve del Convertibile HP Elite x2 1011 G1
Prestazioni limitate. HP lancia il suono nuovo business sgaciabile come: "Il dispositivo di cui avete bisogno...",. Di fatto, l'Elite x2 è molto versatile, ma non ottiene un punteggio migliore a causa di qualche piccola pecca nei dettagli.
Intel Core M-5Y51, HD Graphics 5300, 11.6", 1.7 kgAsus Zenbook UX305FA-FC004H: Intel Core M-5Y10, 13.30", 1.3 kg
recensione » Recensione Breve del Subnotebook Asus Zenbook UX305FA
Apple MacBook 12 (Early 2015) 1.1 GHz: Intel Core M-5Y31, 12.00", 0.9 kg
recensione » Recensione completa dell'Apple MacBook 12 (2015) 1.1 GHz
Lenovo Yoga 3 11 80J8001WGE: Intel Core M-5Y10c, 11.60", 1.1 kg
recensione » Recensione Breve del Convertibile Lenovo Yoga 3 11
Apple MacBook 12 (Early 2015) 1.1 GHz: Intel Core M-5Y31, 12.00", 0.9 kg
recensione » Anteprima Portatile Apple MacBook 12 (Inizio 2015)
Asus Transformer Book T300FA-FE001H: Intel Core M-5Y10, 12.50", 1.6 kg
recensione » Recensione breve del Convertibile Asus Transformer Book T300FA
Toshiba Portege Z20t-B-10C: Intel Core M-5Y71, 12.50", 1.5 kg
recensione » Recensione Breve del Convertibile Toshiba Portege Z20t-B
HP EliteBook Folio 1020 G1: Intel Core M-5Y51, 12.50", 1.2 kg
recensione » Recensione Breve dell'Ultrabook HP EliteBook Folio 1020 G1
Asus Transformer Book T300 Chi: Intel Core M-5Y71, 12.50", 1.4 kg
recensione » Recensione breve del Convertibile Asus Transformer Book T300 Chi
Asus ZenBook UX305FA-FB003H: Intel Core M-5Y10, 13.30", 1.3 kg
recensione » Recensione completa del Subnotebook Asus Zenbook UX305
Acer Aspire Switch 12 SW5-271-61X7: Intel Core M-5Y10c, 12.50", 1.5 kg
recensione » Recensione breve del convertibile Acer Aspire Switch 12
Lenovo ThinkPad Helix 2: Intel Core M-5Y71, 11.60", 1.3 kg
recensione » Recensione breve del Tablet Lenovo ThinkPad Helix 2
Dell Latitude 13 7350: Intel Core M-5Y10, 13.30", 1.7 kg
recensione » Recensione Breve del Convertibile Dell Latitude 13 7350
Dell Venue 11 Pro 7140: Intel Core M-5Y10a, 10.80", 1.4 kg
recensione » Recensione breve del tablet convertibile Dell Venue 11 Pro 7140
HP Envy x2 15-c000ng: Intel Core M-5Y10, 15.60", 2.5 kg
recensione » Recensione breve del Convertibile HP Envy x2 15-c000ng
Lenovo Yoga 3 Pro: Intel Core M-5Y70, 13.30", 1.2 kg
recensione » Recensione breve del Convertibile Lenovo Yoga 3 Pro
recensione » Prime Impressioni: recensione Lenovo Yoga 3 Pro
Fujitsu Stylistic Q665: Intel Core M-5Y31, 11.60", 1.5 kg
Recensioni esterne » Fujitsu Stylistic Q665
Asus UX305FA-FB033H: Intel Core M-5Y71, 13.30", 1.2 kg
Recensioni esterne » Asus UX305FA-FB033H
Acer Aspire Switch 11V SW5-173-63NV: Intel Core M-5Y10c, 11.60", 1.6 kg
Recensioni esterne » Acer Aspire Switch 11V SW5-173-63NV
HP EliteBook Folio 1020, Core M-5Y71: Intel Core M-5Y71, 12.50", 1.7 kg
Recensioni esterne » HP EliteBook Folio 1020, Core M-5Y71
Asus UX305FA-FB012H: Intel Core M-5Y10c, 13.30", 1.2 kg
Recensioni esterne » Asus UX305FA-FB012H
Lenovo ThinkPad Helix-20CG0019GE: Intel Core M-5Y71, 11.60", 1.4 kg
Recensioni esterne » Lenovo ThinkPad Helix-20CG0019GE
Toshiba Portege Z20t-B-10E: Intel Core M-5Y31, 12.50", 1.5 kg
Recensioni esterne » Toshiba Portege Z20t-B-10E
Dell Latitude 12 Rugged Tablet: Intel Core M-5Y71, 11.60", 1.8 kg
Recensioni esterne » Dell Latitude 12 Rugged Tablet
Acer Aspire Switch 11V-SW5-173-62J8: Intel Core M-5Y10c, 11.60", 1.5 kg
Recensioni esterne » Acer Aspire Switch 11V-SW5-173-62J8
Toshiba Portege Z20t-B-10C: Intel Core M-5Y71, 12.50", 1.5 kg
Recensioni esterne » Toshiba Portege Z20t-B-10C
HP Elite x2 1011 G1: Intel Core M-5Y51, 11.60", 1.7 kg
Recensioni esterne » HP Elite x2 1011 G1
Lenovo ThinkPad Helix-20CG001BMH: Intel Core M-5Y71, 11.60", 1.7 kg
Recensioni esterne » Lenovo ThinkPad Helix-20CG001BMH
Toshiba Portege Z20t-B-107: Intel Core M-5Y51, 12.50", 1.6 kg
Recensioni esterne » Toshiba Portege Z20t-B-107
Acer Aspire Switch 11 V SW5-173: Intel Core M-5Y10c, 11.60", 1.5 kg
Recensioni esterne » Acer Aspire Switch 11 V SW5-173
Asus Zenbook UX305FA-FB033H: Intel Core M-5Y71, 13.30", 1.2 kg
Recensioni esterne » Asus Zenbook UX305FA-FB033H
Toshiba Portege Z20t-B-10: Intel Core M-5Y71, 12.50", 1.5 kg
Recensioni esterne » Toshiba Portege Z20t-B-10
HP EliteBook Folio 1020 G1: Intel Core M-5Y51, 12.50", 1.2 kg
Recensioni esterne » HP EliteBook Folio 1020 G1
Toshiba Portege Z20t-B-10G: Intel Core M-5Y51, 12.50", 1.5 kg
Recensioni esterne » Toshiba Portege Z20t-B-10G
Asus UX305FA-FB041H: Intel Core M-5Y10, 13.30", 1.2 kg
Recensioni esterne » Asus UX305FA-FB041H
Lenovo ThinkPad Helix 2-20CHS02A00: Intel Core M-5Y70, 11.60", 1.4 kg
Recensioni esterne » Lenovo ThinkPad Helix 2-20CHS02A00
HP Pavilion 11-n108TU x360: Intel Core M-5Y10c, 11.60", 1.4 kg
Recensioni esterne » HP Pavilion 11-n108TU x360
Toshiba Portege Z20t-B-103: Intel Core M-5Y51, 12.50", 1.6 kg
Recensioni esterne » Toshiba Portege Z20t-B-103
Asus Transformer Book T300FA-FE001H: Intel Core M-5Y10, 12.50", 1.6 kg
Recensioni esterne » Asus Transformer Book T300FA-FE001H
Lenovo Yoga 3 11 80J8001WGE: Intel Core M-5Y10c, 11.60", 1.1 kg
Recensioni esterne » Lenovo Yoga 3 11 80J8001WGE
HP Elite x2 1011 G1-L8D67UT: Intel Core M-5Y71, 11.60", 0.9 kg
Recensioni esterne » HP Elite x2 1011 G1-L8D67UT
Lenovo Yoga 3 11: Intel Core M-5Y10c, 11.60", 1.2 kg
Recensioni esterne » Lenovo Yoga 3 11
Dell Venue 11 Pro 7140: Intel Core M-5Y10a, 10.80", 1.4 kg
Recensioni esterne » Dell Venue 11 Pro 7140
Asus Transformer Book T300 Chi: Intel Core M-5Y71, 12.50", 1.4 kg
Recensioni esterne » Asus Transformer Book T300 Chi
Samsung 930X2K-K02US: Intel Core M-5Y31, 12.20", 0.9 kg
Recensioni esterne » Samsung 930X2K-K02US
Asus Zenbook UX305FA-FC007H: Intel Core M-5Y10, 13.30", 1.2 kg
Recensioni esterne » Asus Zenbook UX305FA-FC007H
Apple MacBook 12 (Early 2015) 1.1 GHz: Intel Core M-5Y31, 12.00", 0.9 kg
Recensioni esterne » Apple MacBook 12 (Early 2015) 1.1 GHz
HP Envy x2 15-c000ng: Intel Core M-5Y10, 15.60", 2.5 kg
Recensioni esterne » HP Envy x2 15-c000ng
Acer Aspire Switch 12 SW5-271-61X7: Intel Core M-5Y10c, 12.50", 1.5 kg
Recensioni esterne » Acer Aspire Switch 12 SW5-271-61X7
Asus Zenbook UX305FA-ASM1: Intel Core M-5Y10, 13.30", 1.3 kg
Recensioni esterne » Asus Zenbook UX305FA-ASM1
Asus Zenbook UX305FA-FC008H: Intel Core M-5Y10, 13.30", 1.2 kg
Recensioni esterne » Asus Zenbook UX305FA-FC008H
Lenovo ThinkPad Helix 2: Intel Core M-5Y71, 11.60", 1.3 kg
Recensioni esterne » Lenovo ThinkPad Helix 2
Toshiba Portege Z20t-B2112: Intel Core M-5Y71, 12.50", 1.5 kg
Recensioni esterne » Toshiba Portege Z20t-B2112
Acer Aspire Switch 12: Intel Core M-5Y10a, 12.00", 1.2 kg
Recensioni esterne » Acer Aspire Switch 12
HP Envy X2-j001nf: Intel Core M-5Y10, 13.30", 1.8 kg
Recensioni esterne » HP Envy X2-j001nf
Dell Latitude 13 7350: Intel Core M-5Y10, 13.30", 1.7 kg
Recensioni esterne » Dell Latitude 13 7350
Asus Transformer Book T300FA-FE010H: Intel Core M-5Y10a, 13.30", 1.5 kg
Recensioni esterne » Asus Transformer Book T300FA-FE010H
HP Elitebook Folio 1020: Intel Core M-5Y51, 12.50", 1 kg
Recensioni esterne » HP Elitebook Folio 1020
HP Envy X2-j001ng: Intel Core M-5Y70, 13.30", 1.8 kg
Recensioni esterne » HP Envy X2-j001ng
Lenovo Yoga 3 Pro: Intel Core M-5Y70, 13.30", 1.2 kg
Recensioni esterne » Lenovo Yoga 3 Pro
Asus ZenBook UX305FA-FB003H: Intel Core M-5Y10, 13.30", 1.3 kg
Recensioni esterne » Asus ZenBook UX305