Notebookcheck Logo

NVIDIA GeForce GT 335M
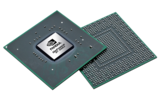
NVIDIA GeForce GT 335M

La Nvidia GeForce GT 335M è una scheda grafica di media classe per portatili gaming. Si basa sul core GT215 (come la GTS 350M ad esempio) ma sfrutta solo 72 shader cores e 24 unità Texture Mapping. Di conseguenza, la GT 335M offre una quantità di shaders significativamente superiore rispetto alla GT 330M, ma a causa della velocità clock limitata, le prestazioni non sono molto migliori. In confronto ai modelli GTS, la GT 335M non supporta la GDDR5.

Le prestazioni 3D della GT335M sono sui livelli della Mobility Radeon HD 5650 di media classe. Di conseguenza, la GPU è abbastanza veloce per tutti i giochi del 2010. I giochi pesanti come Metro 2033, Battlefield BC2 o Crysis girano in modo fluido solo con dettagli medio bassi. I giochi meno esigenti come Call of Duty MW2 o Sims 3 possono essere giocati ance con settaggio di livello elevato (guardate i Benchmarks di seguito).

Come le altre schede GeForce 300M, la GT335M offre il Purevideo HD (VP4) per accelerare la decodifica di video HD. Questo significa che la GPU offre la piena decodifica di video MPEG-1, MPEG-2, MPEG-4 ASP, VC-1/WMV9 ed H.264.

Inoltre, CUDA, OpenCL, e DirectX Compute consentono l'utilizzo dei cores per le operazioni generali (es., codifica di videos).

GeForce GT 300M Serie

GeForce GT 335M 72 @ 0.45 GHz128 Bit @ 1066 MHz
GeForce GT 330M 48 @ 0.58 GHz128 Bit @ 1066 MHz
GeForce GT 325M 48 @ 0.45 GHz128 Bit @ 1066 MHz
GeForce GT 320M 24 @ 0.5 GHz128 Bit @ 790 MHz
Nome in codiceN11P-GS1
ArchitetturaGT200
Pipelines72 - unified
Velocità del core450 MHz
Velocità de Shader1080 MHz
Velocità della memoria1066 MHz
Larghezza del bus di memoria128 Bit
Tipo di memoriaDDR3, GDDR3
Max. quantità di memoria1024 MB
Memoria condivisano
APIDirectX 10.1, Shader 4.1
tecnologia40 nm
CaratteristicheDirectX Compute Support (Windows 7), CUDA, OpenCL, HybridPower, PhysX, SLI, Powermizer 8.0, MXM 3.0 Type-B, 72 Shader, 24 Texture Mapping Units, 8 Render Output Units
Dimensione del portatilemisura media
Data dell'annuncio07.01.2010
Informazioni223 GFlops
Link alla pagina del produttorewww.nvidia.com

Benchmark

3DMark Vantage
3DM Vant. Perf. total +
3DMark Vantage - 3DM Vant. Perf. total
min: 2697     media: 3015     media: 3106 (1%)     massimo: 3234 Points
3DM Vant. Perf. GPU no PhysX +
3DMark Vantage - 3DM Vant. Perf. GPU no PhysX
min: 2592     media: 2624     media: 2633 (1%)     massimo: 2651 Points
62 -98%
...
2322 -12%
ATI Mobility Radeon HD 5165
2362 -10%
2392 -9%
2441 -7%
2453 -7%
2478 -6%
2527 -4%
2552 -3%
AMD Radeon HD 6755G2
2593 -1%
NVIDIA GeForce GT 335M
2624
2674 2%
2711 3%
AMD Radeon HD 6540G2
2731 4%
AMD Radeon HD 6680G2
2800 7%
2801 7%
2803 7%
2865 9%
2914 11%
2927 12%
...
132443 4947%
max:
170928 6414%
0%
100%
3DMark 2001SE - 3DMark 2001 - Standard
min: 17887     media: 18184     media: 18184 (19%)     massimo: 18481 Points
3DMark 03 - 3DMark 03 - Standard
min: 15146     media: 17170     media: 16836.5 (9%)     massimo: 19526 Points
3DMark 05 - 3DMark 05 - Standard
min: 9798     media: 12228     media: 13115 (14%)     massimo: 13782 Points
3DMark 06 3DMark 06 - Standard 1366x768 +
3DMark 06
7700 Points (10%)
3DMark 06 - Standard 1280x1024 +
3DMark 06
min: 5958     media: 6544     media: 6892 (9%)     massimo: 6950 Points
3DMark 06 - Standard 1280x800 +
3DMark 06
7520 Points (10%)
3DMark 06 - Standard 1280x768 +
3DMark 06
min: 6462     media: 6995     media: 6973 (9%)     massimo: 7549 Points
Windows 7 Experience Index - Win7 Gaming graphics
min: 6.2     media: 6.3     media: 6.2 (78%)     massimo: 6.5 Points
Windows 7 Experience Index - Win7 Graphics
min: 3.2     media: 5     media: 4.5 (57%)     massimo: 6.5 Points
Cinebench R10 Cinebench R10 Shading (32bit) +
Cinebench R10 - Cinebench R10 Shading (32bit)
min: 2446     media: 3580     media: 3790.5 (3%)     massimo: 4294 punti
Cinebench R11.5 Cinebench R11.5 OpenGL 64 Bit +
Cinebench R11.5 - Cinebench R11.5 OpenGL 64 Bit
min: 16.12     media: 17.2     media: 17.6 (6%)     massimo: 18.47 fps
- Valori di benchmark per questa scheda grafica
- Valori medi di benchmark per questa scheda grafica
* Numeri più piccoli rappresentano prestazioni supeiori

Benchmarks per i giochi

I seguenti benchmarks deirivano dai benchmarks dei portatili recensiti. Le prestazioni dipendono dalla scheda grafica utilizzata, dal clock rate, dal processore, dai settaggi di sistema, dai drivers, e dai sistemi operativi. Quindi i risultati non sono rappresentativi per i portatili con questa GPU. Per informazioni dettagliate sui risultati del benchmark, cliccate sul numero di fps.

Fifa 11

Fifa 11

2010
basso 800x600
308  fps    + Confronta + 📈 Graph
medio 1024x768
153  fps    + Confronta + 📈 Graph
alto 1360x768
98.2  fps    + Confronta + 📈 Graph
» Giocabile con tutti i portatili testati con dettagli alto.
basso 1024x768
164  fps    + Confronta + 📈 Graph
medio 1360x768
45.4  fps    + Confronta + 📈 Graph
alto 1360x768
30.6  fps    + Confronta + 📈 Graph
ultra 1920x1080
16.1  fps    + Confronta + 📈 Graph
» Giocabile con tutti i portatili testati con dettagli medio.
basso 800x600
29.1  fps    + Confronta
medio 1360x768
24  fps    + Confronta
» Il Benchmark indica che il gioco non è utilizzabile con i settaggi testati.
basso 1024x768
55  fps    + Confronta
medio 1366x768
32.4 34.9 35.4 ~ 34 fps    + Confronta + 📈 Graph
alto 1366x768
24.2 24.3 24.4 ~ 24 fps    + Confronta + 📈 Graph
» Giocabile con tutti i portatili testati con dettagli basso.
basso 800x600
65.2 123 ~ 94 fps    + Confronta
medio 1024x768
36 38.6 39.4 42 ~ 39 fps    + Confronta + 📈 Graph
alto 1366x768
30.9 33.2 34.7 35.6 ~ 34 fps    + Confronta + 📈 Graph
» Giocabile con tutti i portatili testati con dettagli medio.
Risen

Risen

2009
basso 800x600
51.6 61.9 ~ 57 fps    + Confronta
medio 1024x768
29 29.4 33.6 ~ 31 fps    + Confronta + 📈 Graph
alto 1366x768
21.2 21.2 23.2 ~ 22 fps    + Confronta + 📈 Graph
» Giocabile con tutti i portatili testati con dettagli basso.
Need for Speed Shift

Need for Speed Shift

2009
medio 1024x768
23.5 31.2 32.3 ~ 29 fps    + Confronta + 📈 Graph
alto 1366x768
28.2 29.5 30.2 ~ 29 fps    + Confronta + 📈 Graph
» Il Benchmark indica che il gioco non è utilizzabile con i settaggi testati.
Colin McRae: DIRT 2

Colin McRae: DIRT 2

2009
basso 800x600
42.5 67.9 ~ 55 fps    + Confronta
medio 1024x768
32.4 34.8 46.8 49.2 ~ 41 fps    + Confronta
alto 1360x768
26.8 30.2 31.7 33.1 ~ 30 fps    + Confronta
» Giocabile con la maggior parte dei portatili testati con dettagli medio.
Anno 1404

Anno 1404

2009
basso 1024x768
51.7 57.8 107.8 ~ 72 fps    + Confronta + 📈 Graph
ultra 1280x1024
23.5 24.8 24.8 ~ 24 fps    + Confronta + 📈 Graph
» Giocabile con tutti i portatili testati con dettagli basso.
F.E.A.R. 2

F.E.A.R. 2

2009
basso 800x600
75.5 144.5 ~ 110 fps    + Confronta
medio 1024x768
46.9 47.2 62.6 63.6 ~ 55 fps    + Confronta + 📈 Graph
alto 1280x1024
36.8 36.9 39.4 39.6 ~ 38 fps    + Confronta + 📈 Graph
» Giocabile con tutti i portatili testati con dettagli alto.
Far Cry 2

Far Cry 2

2008
basso 640x480
51.2  fps    + Confronta
alto 1024x768
31.1  fps    + Confronta
» Giocabile con tutti i portatili testati con dettagli basso.
Crysis - GPU Benchmark

Crysis - GPU Benchmark

2007
basso 1024x768
58.3 73.2 ~ 66 fps    + Confronta
medio 1024x768
28 34.8 43.4 43.8 ~ 38 fps    + Confronta
alto 1024x768
22.5 22.7 24.9 25.2 26.1 ~ 24 fps    + Confronta
» Giocabile con la maggior parte dei portatili testati con dettagli medio.
Crysis - CPU Benchmark

Crysis - CPU Benchmark

2007
basso 1024x768
71 84.6 ~ 78 fps    + Confronta
medio 1024x768
26.9 30 42.6 42.9 ~ 36 fps    + Confronta
alto 1024x768
20.7 21.3 22.3 22.6 23.1 ~ 22 fps    + Confronta
» Giocabile con la maggior parte dei portatili testati con dettagli medio.
Call of Juarez Benchmark

Call of Juarez Benchmark

2006
alto 1024x768
17.3  fps    + Confronta
» Il Benchmark indica che il gioco non è utilizzabile con i settaggi testati.
bassomedioaltoultraQHD4K
Fifa 1130815398.2
StarCraft 216445.430.616.1
Metro 203329.124
Battlefield: Bad Company 2553424
CoD Modern Warfare 2943934
Risen573122
Need for Speed Shift2929
Colin McRae: DIRT 2554130
Anno 14047224
F.E.A.R. 21105538
Far Cry 251.231.1
Crysis - GPU Benchmark663824
Crysis - CPU Benchmark783622
Call of Juarez Benchmark17.3
< 30 fps
< 60 fps
< 120 fps
≥ 120 fps
1
4
5
2
2
8

1
6
5
1
2


Per conoscere altri giochi che potrebbero essere utilizzabili e per una lista completa di tutti i giochi e delle schede grafiche visitate la nostra Gaming List

v1.26
log 15. 12:08:01

#0 no ids found in url (should be separated by "_") +0s ... 0s

#1 not redirecting to Ajax server +0s ... 0s

#2 did not recreate cache, as it is less than 5 days old! Created at Wed, 13 Mar 2024 05:40:26 +0100 +0.001s ... 0.001s

#3 no comparison url found in template nbc.compare_page_1 needed +0.034s ... 0.035s

#4 no comparison url found in template nbc.compare_page_1 needed +0s ... 0.035s

#5 no comparison url found in template nbc.compare_page_1 needed +0s ... 0.036s

#6 composed specs +0s ... 0.036s

#7 did output specs +0s ... 0.036s

#8 start showIntegratedCPUs +0s ... 0.036s

#9 getting avg benchmarks for device 1599 +0.013s ... 0.049s

#10 got single benchmarks 1599 +0.033s ... 0.082s

#11 got avg benchmarks for devices +0s ... 0.082s

#12 min, max, avg, median took s +0.385s ... 0.467s

#13 before gaming benchmark output +0s ... 0.467s

#14 Got 91 rows for game benchmarks. +0.01s ... 0.477s

#15 composed SQL query for gamebenchmarks +0s ... 0.477s

#16 got data and put it in $dataArray +0.008s ... 0.484s

#17 benchmarks composed for output. +0.346s ... 0.831s

#18 no comparison url found in template nbc.compare_page_1 needed +0.003s ... 0.834s

#19 return log +0s ... 0.834s

Recensioni Notebook con NVIDIA GeForce GT 335M la scheda grafica

Asus N53JN-SX031V: Intel Core i5-450M, 15.60", 2.7 kg
  Recensioni esterne » Asus N53JN-SX031V

LG R590-T.ARR7A3: Intel Core i7-820QM, 15.60", 2.7 kg
  Recensioni esterne » LG R590-T.ARR7A3

Asus NX90JQ-YZ068Z: Intel Core i7-740QM, 18.40", 4.4 kg
  Recensioni esterne » Asus NX90JQ-YZ068Z

Asus N82JQ-VX046V: Intel Core i7-720QM, 14.00", 2.4 kg
  Recensioni esterne » Asus N82JQ-VX046V

Asus NX90JQ-YZ014V: Intel Core i7-720QM, 18.40", 4.4 kg
  Recensioni esterne » Asus NX90JQ-YZ014V

Asus N82JV-VX020V: Intel Core i5-520M, 14.00", 2.3 kg
  Recensioni esterne » Asus N82JV-VX020V

Asus N82JV-X1: Intel Core i5-450M, 14.10", 2.3 kg
  Recensioni esterne » Asus N82JV-X1

Asus K42JV-X1: Intel Core i5-450M, 14.00", 2.2 kg
  Recensioni esterne » Asus K42JV-X1

Asus K42JV-VX054V: Intel Core i5-540M, 14.00", 2.2 kg
  Recensioni esterne » Asus K42JV-VX054V

Asus N53JN: Intel Core i5-520M, 15.60", 2.7 kg
  Recensioni esterne » Asus N53JN

Asus N73JN: Intel Core i5-450M, 17.30", 3.4 kg
  Recensioni esterne » Asus N73JN

SCHENKER QMG6: Intel Core i7-620M, 15.60", 2.6 kg
  Recensioni esterne » mySN QMG6

Asus NX90JQ-YZ041V: Intel Core i7-720QM, 18.40", 3.4 kg
  Recensioni esterne » Asus NX90JQ-YZ041V

Asus NX90J: Intel Core i7-720QM, 18.40", 4.8 kg
  Recensioni esterne » Asus NX90J

Asus N82JQ-A1: Intel Core i7-720QM, 14.00", 2.4 kg
  Recensioni esterne » Asus N82JQ-A1

Alienware M11x R2: Intel Core i5-520UM, 11.60", 2 kg
  Recensioni esterne » Alienware M11x R2

Asus N82JV: Intel Core i7-620M, 14.00", 2.3 kg
  Recensioni esterne » Asus N82JV

Alienware M11x: Intel Core 2 Duo SU7300, 11.60", 2 kg
  Recensioni esterne » Alienware M11x

Please share our article, every link counts!

Classe 0

Arc A380

Classe 1

GeForce RTX 2080 Super Mobile

Classe 2

M1 Max 32-Core GPU *
GeForce RTX 2070 Super Mobile
M1 Max 24-Core GPU *
Radeon RX 5700M *
M1 Pro 16-Core GPU *
Radeon PRO W6600M *
GeForce RTX 2070 Super Max-Q
M1 Pro 14-Core GPU *
Quadro P4200
Quadro P5000 Max-Q *
GeForce RTX 3050 4GB Laptop GPU
Quadro P4000 Max-Q
Radeon RX 580X (Laptop) *
Radeon RX 580 (Laptop)
Radeon Pro 5300M
Radeon RX 5300M
Quadro P3000 Max-Q *
Radeon Pro WX 7100 *
Radeon RX 570X (Laptop) *
Radeon RX 570 (Laptop) *
Radeon RX 470 (Laptop) *

Classe 3

GeForce GTX 1050 Ti Mobile
Radeon 680M
Quadro P2000 Max-Q
Radeon R9 M395X
GeForce GTX 1050 Ti Max-Q *
WX Vega M GL
Radeon R9 M485X
GeForce GTX 1050 Max-Q *
Radeon 660M
Radeon RX 560X (Laptop)
Radeon RX 560 (Laptop)
Radeon Pro 560X
Radeon Pro 560
Radeon Pro 460
Radeon Pro WX 4130 *
Quadro P620 *
Radeon RX 550X (Laptop)
Radeon Pro 555X
Radeon Pro 555
Radeon Pro 455
Quadro P600
Radeon RX 540X *
Radeon Pro WX 2100 *
Radeon Pro WX 3100 *
Radeon Pro 450
Radeon 630
Radeon 540X *
Quadro P520
Quadro P500 *
Iris Plus Graphics G7 (Ice Lake 64 EU) *
Vega 10 *
Iris Pro Graphics 580
Vega 9
FirePro W5130M
UHD Graphics Xe G4 48EUs *
UHD Graphics 32EUs
UHD Graphics Xe 32EUs (Tiger Lake-H) *
UHD Graphics 750
Vega 7
Radeon R7 M465
Vega 8
Iris Plus Graphics G4 (Ice Lake 48 EU)
Quadro M600M
FirePro W4190M
Radeon R7 M445
UHD Graphics 24EUs (Alder Lake-N) *
Radeon R7 M340
Radeon 610M *
UHD Graphics G1 (Ice Lake 32 EU)
UHD Graphics Xe 16EUs (Tiger Lake-H) *
Radeon R5 (Bristol Ridge)
Adreno 690 *
Adreno 685 *
Adreno 680 *

Classe 4

UHD Graphics 730
Radeon R5 M315 *
Radeon R5 M420 *
UHD Graphics 617
UHD Graphics 615
Radeon R4 (Stoney Ridge)
Radeon R2 (Stoney Ridge)
HD Graphics (Broadwell)

Classe 5

Posizione approssimativa dell'adattatore grafico

> Recensioni e prove di notebook, tablets e smartphones > Info Techniche / Tips > Confronto delle schede video > NVIDIA > NVIDIA GeForce GT 335M
Klaus Hinum, 2010-10- 9 (Update: 2014-09-19)