Notebookcheck Logo

Intel Arc A730M

Intel A730M

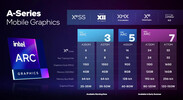
Intel Arc A730M (ID dispositivo 5691) è una scheda grafica mobile dedicata di fascia medio-bassa per computer portatili basata sulla microarchitettura Xe HPG. Utilizza il chip ACM-G10 e offre 24 dei 32 core Xe (384 ALU), 24 unità di ray tracing e un bus di memoria a 192 bit per 12 GB di memoria grafica GDDR6. I core possono avere un clock da 300 MHz (modalità a bassa frequenza) a 1100 MHz (alta frequenza) o in brevi raffiche a 2050 MHz (Turbo). Il chip integra 21,7 miliardi di transistor, utilizza un pacchetto BGA2660 (saldato) e il die misura 406 mm2.

Le prestazioni dell'Arc A730M non sono ancora note. Il consumo energetico è simile a quello di una RTX 3060 e quindi vediamo le prestazioni leggermente inferiori a una RTX 3060 mobile.

Il chip integra anche due motori multimediali per la codifica e la decodifica VP9, AVC, HEVC e AV1 8k. I 4 display pipe supportano fino a 4x 4k120 HDR tramite DMI 2.0B o DisplayPort 2.0 10G.

L'A730M è prodotto in 6 nm presso TSMC (processo N6) e supporta la condivisione dinamica dell'energia (utilizzando Deep Link) con le CPU Intel di 12a generazione (Alder Lake).

Arc Serie

Arc A770 4096 @ 2.1 - 2.4 GHz256 Bit @ 16000 MHz
Arc A750 3584 @ 2.05 - 2.4 GHz256 Bit @ 16000 MHz
Arc A580 3072 @ 1.7 - 2 GHz256 Bit @ 16000 MHz
A770M 512 @ 1.65 GHz256 Bit @ 16000 MHz
A730M 384 @ 1.1 GHz192 Bit @ 14000 MHz
A570M 16 @ 0.9 - 1.3 GHz128 Bit @ 14000 MHz
A550M 16 @ 0.9 - 2.01 GHz128 Bit @ 14000 MHz
A530M 12 @ 0.9 - 1.3 GHz128 Bit @ 14000 MHz
A370M 8 @ 1.55 GHz64 Bit @ 14000 MHz
Arc A380 1024 @ 2 GHz96 Bit @ 15500 MHz
A310 6 @ 2 GHz64 Bit @ 15500 MHz
A350M 6 @ 1.15 GHz64 Bit @ 14000 MHz
Nome in codiceAlchemist
ArchitetturaXe HPG
Pipelines384 - unified
Raytracing Cores24
Velocità del core1100 MHz
CacheL1: 4.5 MB, L2: 16 MB
Velocità della memoria14000 MHz
Larghezza del bus di memoria192 Bit
Tipo di memoriaGDDR6
Max. quantità di memoria12 GB
Memoria condivisano
Memory Bandwidth336 GB/s
APIDirectX 12_2, OpenGL 4.6, Vulkan 1.3
Consumo di corrente120 Watt (80 - 120 Watt TGP)
Transistor Count21.7 Billion
Die Size 406 mm²
tecnologia6 nm
PCIe4 16x
Displays4 Displays (max.), HDMI 2.0b, DisplayPort 2.0 10G Ready
Dimensione del portatilemisura media
Data dell'annuncio30.03.2022
Link alla pagina del produttoreark.intel.com

Benchmark

Performance Rating - 3DMark 11 + Fire Strike + Time Spy
9.7 pt (29%)
3DMark - 3DMark Time Spy Score
min: 7653     media: 9041     media: 8919.5 (26%)     massimo: 10670 Points
3DMark - 3DMark Time Spy Graphics
min: 7212     media: 8798     media: 8813 (23%)     massimo: 10352 Points
3DMark - 3DMark Ice Storm Unlimited Graphics
467230 Points (53%)
3DMark - 3DMark Cloud Gate Score
min: 42200     media: 44782     media: 45257 (48%)     massimo: 46415 Points
3DMark - 3DMark Cloud Gate Graphics
min: 75370     media: 86896     media: 83396 (22%)     massimo: 105420 Points
3DMark - 3DMark Fire Strike Standard Score
min: 16910     media: 18480     media: 18213.5 (32%)     massimo: 20584 Points
3DMark - 3DMark Fire Strike Standard Graphics
min: 19850     media: 21265     media: 21294 (24%)     massimo: 22620 Points
3DMark - 3DMark Ice Storm Graphics
min: 131746     media: 207940     media: 134036 (16%)     massimo: 358039 Points
3DMark 11 - 3DM11 Performance Score
min: 23160     media: 24539     media: 24285.5 (34%)     massimo: 26424 Points
3DMark 11 - 3DM11 Performance GPU
min: 24928     media: 28692     media: 29144 (25%)     massimo: 31551 Points
3DMark Vantage
3DM Vant. Perf. total +
3DMark Vantage - 3DM Vant. Perf. total
min: 62916     media: 63380     media: 63380 (18%)     massimo: 63844 Points
3DM Vant. Perf. GPU no PhysX +
3DMark Vantage - 3DM Vant. Perf. GPU no PhysX
min: 64146     media: 66003     media: 66003 (37%)     massimo: 67860 Points
3DMark 05 - 3DMark 05 - Standard
43138 Points (47%)
3DMark 06 3DMark 06 - Standard 1280x1024 +
3DMark 06
min: 43017     media: 44798     media: 44798 (59%)     massimo: 46579 Points
SPECviewperf 12
specvp12 sw-03 +
specvp12 snx-02 +
specvp12 showcase-01 +
specvp12 mediacal-01 +
specvp12 maya-04 +
specvp12 energy-01 +
SPECviewperf 12 - specvp12 energy-01
1.8 fps (2%)
specvp12 creo-01 +
specvp12 catia-04 +
specvp12 3dsmax-05 +
SPECviewperf 13 specvp13 sw-04 +
SPECviewperf 13 - specvp13 sw-04
63.8 fps (17%)
specvp13 snx-03 +
SPECviewperf 13 - specvp13 snx-03
2.3 fps (0%)
specvp13 showcase-02 +
specvp13 medical-02 +
specvp13 maya-05 +
SPECviewperf 13 - specvp13 maya-05
230 fps (26%)
specvp13 energy-02 +
SPECviewperf 13 - specvp13 energy-02
8.1 fps (3%)
specvp13 creo-02 +
SPECviewperf 13 - specvp13 creo-02
72.9 fps (11%)
specvp13 catia-05 +
specvp13 3dsmax-06 +
SPECviewperf 2020 specvp2020 solidworks-05 1080p +
SPECviewperf 2020 - specvp2020 solidworks-05 1080p
min: 29.92     media: 61.5     media: 61.5 (12%)     massimo: 93.1 fps
specvp2020 snx-04 1080p +
SPECviewperf 2020 - specvp2020 snx-04 1080p
min: 2.54     media: 2.7     media: 2.7 (0%)     massimo: 2.93 fps
specvp2020 medical-03 1080p +
SPECviewperf 2020 - specvp2020 medical-03 1080p
min: 23.48     media: 24     media: 24 (25%)     massimo: 24.6 fps
specvp2020 maya-06 1080p +
SPECviewperf 2020 - specvp2020 maya-06 1080p
min: 123.11     media: 173.1     media: 173.1 (25%)     massimo: 223.03 fps
specvp2020 energy-03 1080p +
SPECviewperf 2020 - specvp2020 energy-03 1080p
min: 14.1     media: 23     media: 23 (19%)     massimo: 31.88 fps
specvp2020 creo-03 1080p +
SPECviewperf 2020 - specvp2020 creo-03 1080p
min: 51.98     media: 54.5     media: 54.5 (27%)     massimo: 57 fps
specvp2020 catia-06 1080p +
SPECviewperf 2020 - specvp2020 catia-06 1080p
min: 19.92     media: 20.3     media: 20.3 (13%)     massimo: 20.7 fps
specvp2020 3dsmax-07 1080p +
SPECviewperf 2020 - specvp2020 3dsmax-07 1080p
min: 47.41     media: 47.5     media: 47.5 (22%)     massimo: 47.5 fps
specvp2020 solidworks-05 4k +
specvp2020 snx-04 4k +
specvp2020 medical-03 4k +
specvp2020 maya-06 4k +
specvp2020 energy-03 4k +
specvp2020 creo-03 4k +
SPECviewperf 2020 - specvp2020 creo-03 4k
41.7 fps (20%)
specvp2020 catia-06 4k +
SPECviewperf 2020 - specvp2020 catia-06 4k
26.4 fps (17%)
specvp2020 3dsmax-07 4k +
SPECviewperf 2020 - specvp2020 3dsmax-07 4k
25.8 fps (11%)
Cinebench R10 Cinebench R10 Shading (32bit) +
Cinebench R10 - Cinebench R10 Shading (32bit)
min: 15298     media: 16779     media: 16778.5 (12%)     massimo: 18259 punti
Cinebench R11.5 Cinebench R11.5 OpenGL 64 Bit +
Cinebench R11.5 - Cinebench R11.5 OpenGL 64 Bit
min: 127.86     media: 129     media: 129 (45%)     massimo: 130.14 fps
Cinebench R15
Cinebench R15 OpenGL 64 Bit +
Cinebench R15 - Cinebench R15 OpenGL 64 Bit
min: 196.3     media: 197.6     media: 196.4 (11%)     massimo: 200 fps
Cinebench R15 OpenGL Ref. Match 64 Bit +
Cinebench R15 - Cinebench R15 OpenGL Ref. Match 64 Bit
97.8 % (98%)
GFXBench - GFXBench 5.0 4K Aztec Ruins High Tier Offscreen
84.3 fps (34%)
GFXBench - GFXBench 5.0 Aztec Ruins High Tier Offscreen
187 fps (34%)
3.3 -98%
...
110.2 -41%
Apple M3 10-Core GPU
118.5 -37%
Apple M1 Pro 14-Core GPU
147 -21%
153 -18%
161.4 -14%
Apple M1 Pro 16-Core GPU
166 -11%
178.7 -4%
181.1 -3%
185.4 -1%
Intel Arc A730M
187
208 11%
210.6 13%
219.7 17%
Apple M1 Max 24-Core GPU
240 28%
242.3 30%
248.5 33%
261.5 40%
288.5 54%
Apple M1 Max 32-Core GPU
309.4 65%
...
536 187%
0%
100%
GFXBench - GFXBench 5.0 Aztec Ruins Normal Tier Offscreen
448 fps (33%)
Basemark GPU 1.2 - Basemark GPU 1.2 Vulkan Official Medium Offscreen 1080
104.6 fps (1%)
Basemark GPU 1.2 - Basemark GPU 1.2 Vulkan Official High Offscreen 2160
3.6 fps (1%)
Geekbench 6.2 - Geekbench 6.2 GPU OpenCL
min: 74442     media: 74865     media: 74865 (22%)     massimo: 75288 punti
Geekbench 6.2 - Geekbench 6.2 GPU Vulkan
min: 74820     media: 75687     media: 75686.5 (25%)     massimo: 76553 punti
ComputeMark v2.1 - ComputeMark v2.1 Result
min: 12878     media: 14039     media: 14038.5 (15%)     massimo: 15199 punti
Power Consumption - Furmark Stress Test Power Consumption - external Monitor *
min: 131.6     media: 149.8     media: 140 (20%)     massimo: 177.9 Watt
0153045607590105120135150165180195210Tooltip
Power Consumption - The Witcher 3 Power Consumption - external Monitor *
min: 145.7     media: 154.4     media: 149 (21%)     massimo: 168.6 Watt
0102030405060708090100110120130140150160170180Tooltip
Power Consumption - Witcher 3 Power Consumption *
min: 155.6     media: 160.8     media: 160.8 (35%)     massimo: 166 Watt
0153045607590105120135150165180195Tooltip
Power Consumption - Witcher 3 ultra Power Efficiency
0.3 fps per Watt (32%)
Power Consumption - Witcher 3 ultra Power Efficiency - external Monitor
0.3 fps per Watt (28%)
Emissions Witcher 3 Fan Noise +
Emissions - Witcher 3 Fan Noise
min: 40.5     media: 47.1     media: 50 (80%)     massimo: 50.65 dB(A)
- Valori di benchmark per questa scheda grafica
- Valori medi di benchmark per questa scheda grafica
* Numeri più piccoli rappresentano prestazioni supeiori

Benchmarks per i giochi

I seguenti benchmarks deirivano dai benchmarks dei portatili recensiti. Le prestazioni dipendono dalla scheda grafica utilizzata, dal clock rate, dal processore, dai settaggi di sistema, dai drivers, e dai sistemi operativi. Quindi i risultati non sono rappresentativi per i portatili con questa GPU. Per informazioni dettagliate sui risultati del benchmark, cliccate sul numero di fps.

Horizon Forbidden West

Horizon Forbidden West

2024
basso 1920x1080
44  fps    + Confronta + 📈 Graph
medio 1920x1080
42.4  fps    + Confronta + 📈 Graph
alto 1920x1080
25.6  fps    + Confronta + 📈 Graph
ultra 1920x1080
22.6  fps    + Confronta + 📈 Graph
QHD 2560x1440
18.4  fps    + Confronta + 📈 Graph
» Giocabile con tutti i portatili testati con dettagli medio.
Additional Benchmarks
Very Low Preset 1280x720
54.8
Alone in the Dark

Alone in the Dark

2024
basso 1920x1080
108.4  fps    + Confronta + 📈 Graph
medio 1920x1080
95.9  fps    + Confronta + 📈 Graph
alto 1920x1080
90.4  fps    + Confronta + 📈 Graph
ultra 1920x1080
57.2  fps    + Confronta + 📈 Graph
QHD 2560x1440
30.1  fps    + Confronta + 📈 Graph
» Giocabile con tutti i portatili testati con dettagli ultra.
Additional Benchmarks
Low Preset 1280x720
103.8
Last Epoch

Last Epoch

2024
basso 1920x1080
162.7  fps    + Confronta + 📈 Graph
medio 1920x1080
131.4  fps    + Confronta + 📈 Graph
alto 1920x1080
111.2  fps    + Confronta + 📈 Graph
ultra 1920x1080
88.5  fps    + Confronta + 📈 Graph
QHD 2560x1440
58.6  fps    + Confronta + 📈 Graph
4K 3840x2160
27.5  fps    + Confronta + 📈 Graph
» Giocabile con tutti i portatili testati con dettagli ultra.
Additional Benchmarks
Very Low Preset 1280x720
182.7
Skull & Bones

Skull & Bones

2024
basso 1920x1080
medio 1920x1080
alto 1920x1080
ultra 1920x1080
QHD 2560x1440
4K 3840x2160
3840x2160
» Giocabile con tutti i portatili testati con dettagli ultra.
Additional Benchmarks
Low Preset TAA 1280x720
69
Helldivers 2

Helldivers 2

2024
basso 1920x1080
79.6  fps    + Confronta + 📈 Graph
medio 1920x1080
62.4  fps    + Confronta + 📈 Graph
alto 1920x1080
57.8  fps    + Confronta + 📈 Graph
ultra 1920x1080
55.9  fps    + Confronta + 📈 Graph
QHD 2560x1440
36.9  fps    + Confronta + 📈 Graph
4K 3840x2160
17.9  fps    + Confronta + 📈 Graph
» Giocabile con tutti i portatili testati con dettagli ultra.
Additional Benchmarks
Low Preset 1280x720
97.8
Enshrouded

Enshrouded

2024
basso 1920x1080
54.9  fps    + Confronta + 📈 Graph
medio 1920x1080
49.8  fps    + Confronta + 📈 Graph
alto 1920x1080
42.5  fps    + Confronta + 📈 Graph
ultra 1920x1080
36.1  fps    + Confronta + 📈 Graph
QHD 2560x1440
26.2  fps    + Confronta + 📈 Graph
4K 3840x2160
11.8  fps    + Confronta + 📈 Graph
3840x2160
18.8  fps    + Confronta + 📈 Graph
» Giocabile con tutti i portatili testati con dettagli ultra.
Additional Benchmarks
Max. Performance 1280x720
89.3
Palworld

Palworld

2024
basso 1920x1080
80.1  fps    + Confronta + 📈 Graph
medio 1920x1080
67.4  fps    + Confronta + 📈 Graph
alto 1920x1080
53.8  fps    + Confronta + 📈 Graph
ultra 1920x1080
50.7  fps    + Confronta + 📈 Graph
QHD 2560x1440
36.5  fps    + Confronta + 📈 Graph
4K 3840x2160
18.9  fps    + Confronta + 📈 Graph
» Giocabile con tutti i portatili testati con dettagli ultra.
Additional Benchmarks
Very Low Preset 1280x720
103.5
Prince of Persia The Lost Crown

Prince of Persia The Lost Crown

2024
medio 1920x1080
347  fps    + Confronta + 📈 Graph
alto 1920x1080
333  fps    + Confronta + 📈 Graph
ultra 1920x1080
316  fps    + Confronta + 📈 Graph
QHD 2560x1440
215  fps    + Confronta + 📈 Graph
4K 3840x2160
116.1  fps    + Confronta + 📈 Graph
» Giocabile con tutti i portatili testati con dettagli ultra.
Ready or Not

Ready or Not

2023
basso 1920x1080
128.7  fps    + Confronta + 📈 Graph
medio 1920x1080
112.9  fps    + Confronta + 📈 Graph
alto 1920x1080
93.6  fps    + Confronta + 📈 Graph
ultra 1920x1080
69.3  fps    + Confronta + 📈 Graph
QHD 2560x1440
42.8  fps    + Confronta + 📈 Graph
4K 3840x2160
15  fps    + Confronta + 📈 Graph
» Giocabile con tutti i portatili testati con dettagli ultra.
The Finals

The Finals

2023
basso 1920x1080
144.7  fps    + Confronta + 📈 Graph
medio 1920x1080
109.2  fps    + Confronta + 📈 Graph
alto 1920x1080
97  fps    + Confronta + 📈 Graph
ultra 1920x1080
77.4  fps    + Confronta + 📈 Graph
QHD 2560x1440
48.9  fps    + Confronta + 📈 Graph
4K 3840x2160
22.7  fps    + Confronta + 📈 Graph
» Giocabile con tutti i portatili testati con dettagli ultra.
Additional Benchmarks
Low Preset 1280x720
166.3
Avatar Frontiers of Pandora

Avatar Frontiers of Pandora

2023
basso 1920x1080
45  fps    + Confronta
medio 1920x1080
40  fps    + Confronta
alto 1920x1080
33  fps    + Confronta
ultra 1920x1080
24  fps    + Confronta
QHD 2560x1440
15  fps    + Confronta
4K 3840x2160
5.7  fps    + Confronta
» Giocabile con tutti i portatili testati con dettagli medio.
Additional Benchmarks
Low Preset TAA 1280x720
63
Call of Duty Modern Warfare 3 2023

Call of Duty Modern Warfare 3 2023

2023
basso 1920x1080
medio 1920x1080
alto 1920x1080
ultra 1920x1080
QHD 2560x1440
» Giocabile con tutti i portatili testati con dettagli alto.
Additional Benchmarks
Minimum Preset 1280x720
118
EA Sports WRC

EA Sports WRC

2023
basso 1920x1080
65.9  fps    + Confronta + 📈 Graph
medio 1920x1080
48.8  fps    + Confronta + 📈 Graph
alto 1920x1080
42.9  fps    + Confronta + 📈 Graph
ultra 1920x1080
40.2  fps    + Confronta + 📈 Graph
QHD 2560x1440
27.8  fps    + Confronta + 📈 Graph
» Giocabile con tutti i portatili testati con dettagli ultra.
Additional Benchmarks
Ultra Low Preset LowAA 1280x720
113.3
Alan Wake 2

Alan Wake 2

2023
basso 1920x1080
34 42.5 ~ 38 fps    + Confronta + 📈 Graph
medio 1920x1080
32.6 38.2 ~ 35 fps    + Confronta + 📈 Graph
alto 1920x1080
31.3 35.7 ~ 34 fps    + Confronta + 📈 Graph
QHD 2560x1440
11.6  fps    + Confronta + 📈 Graph
4K 3840x2160
6.3  fps    + Confronta + 📈 Graph
» Giocabile con la maggior parte dei portatili testati con dettagli basso.
Additional Benchmarks
Low Preset 1280x720
45.3
56.3
Lords of the Fallen

Lords of the Fallen

2023
basso 1920x1080
45.1 47.3 ~ 46 fps    + Confronta + 📈 Graph
medio 1920x1080
40.1 40.6 ~ 40 fps    + Confronta + 📈 Graph
alto 1920x1080
32 36.8 ~ 34 fps    + Confronta + 📈 Graph
ultra 1920x1080
23.8 35.4 ~ 30 fps    + Confronta + 📈 Graph
4K 3840x2160
3.5  fps    + Confronta + 📈 Graph
» Giocabile con tutti i portatili testati con dettagli medio.
Additional Benchmarks
Low Preset 1280x720
68.5
84.1
Total War Pharaoh

Total War Pharaoh

2023
basso 1920x1080
207.4 259.8 ~ 234 fps    + Confronta
medio 1920x1080
121.7 156.3 ~ 139 fps    + Confronta
alto 1920x1080
74.9 93.1 ~ 84 fps    + Confronta
ultra 1920x1080
60.9 73.3 ~ 67 fps    + Confronta
QHD 2560x1440
4K 3840x2160
» Giocabile con tutti i portatili testati con dettagli ultra.
Additional Benchmarks
Low Preset 1280x720
355.6
317.4
Assassin's Creed Mirage

Assassin's Creed Mirage

2023
basso 1920x1080
60 65 ~ 63 fps    + Confronta
medio 1920x1080
55 56 ~ 56 fps    + Confronta
alto 1920x1080
54 55 ~ 55 fps    + Confronta
ultra 1920x1080
44 53 ~ 49 fps    + Confronta
QHD 2560x1440
38  fps    + Confronta
4K 3840x2160
21  fps    + Confronta
» Giocabile con tutti i portatili testati con dettagli ultra.
Additional Benchmarks
Low Preset (Adaptive Quality Off) 1280x720
79
59
EA Sports FC 24

EA Sports FC 24

2023
ultra 1920x1080
121.8  fps    + Confronta + 📈 Graph
» Giocabile con tutti i portatili testati con dettagli ultra.
Counter-Strike 2

Counter-Strike 2

2023
basso 1920x1080
169  fps    + Confronta + 📈 Graph
medio 1920x1080
154.9  fps    + Confronta + 📈 Graph
alto 1920x1080
113.9  fps    + Confronta + 📈 Graph
ultra 1920x1080
81.7  fps    + Confronta + 📈 Graph
QHD 2560x1440
52.8  fps    + Confronta + 📈 Graph
4K 3840x2160
14.2  fps    + Confronta + 📈 Graph
» Giocabile con tutti i portatili testati con dettagli ultra.
Additional Benchmarks
Low Preset 1280x720
157.1
Cyberpunk 2077 2.0 Phantom Liberty

Cyberpunk 2077 2.0 Phantom Liberty

2023
basso 1920x1080
71.6 83.9 ~ 78 fps    + Confronta
medio 1920x1080
57 68.9 ~ 63 fps    + Confronta
alto 1920x1080
50 58.3 ~ 54 fps    + Confronta
ultra 1920x1080
38.4 47.7 ~ 43 fps    + Confronta
4K 3840x2160
11.5  fps    + Confronta
» Giocabile con tutti i portatili testati con dettagli ultra.
Additional Benchmarks
Low Preset (FSR off) 1280x720
110.5
102
Ray Tracing Ultra Preset (DLSS off) 1920x1080
14.2
Lies of P

Lies of P

2023
basso 1920x1080
97 97.6 ~ 97 fps    + Confronta + 📈 Graph
medio 1920x1080
85.8 105.4 ~ 96 fps    + Confronta + 📈 Graph
alto 1920x1080
75.1 84.7 ~ 80 fps    + Confronta + 📈 Graph
ultra 1920x1080
67 75.5 ~ 71 fps    + Confronta + 📈 Graph
4K 3840x2160
22.9  fps    + Confronta + 📈 Graph
» Giocabile con tutti i portatili testati con dettagli ultra.
Additional Benchmarks
Low Preset 1280x720
156.3
104
The Crew Motorfest

The Crew Motorfest

2023
basso 1920x1080
60  fps    + Confronta
medio 1920x1080
57  fps    + Confronta
alto 1920x1080
50  fps    + Confronta
ultra 1920x1080
46  fps    + Confronta
» Giocabile con tutti i portatili testati con dettagli ultra.
Additional Benchmarks
Low Preset 1280x720
60
Starfield

Starfield

2023
basso 1920x1080
34  fps    + Confronta + 📈 Graph
medio 1920x1080
30.1  fps    + Confronta + 📈 Graph
alto 1920x1080
24.8  fps    + Confronta + 📈 Graph
ultra 1920x1080
22  fps    + Confronta + 📈 Graph
» Il Benchmark indica che il gioco non è utilizzabile con i settaggi testati.
Additional Benchmarks
Low Preset 1280x720
39.7
basso 1920x1080
70.9  fps    + Confronta + 📈 Graph
medio 1920x1080
64.3  fps    + Confronta + 📈 Graph
alto 1920x1080
63.9  fps    + Confronta + 📈 Graph
ultra 1920x1080
58.5  fps    + Confronta + 📈 Graph
4K 3840x2160
25.2  fps    + Confronta + 📈 Graph
» Giocabile con tutti i portatili testati con dettagli ultra.
Additional Benchmarks
Low Preset 1280x720
65.5
basso 1920x1080
19.1  fps    + Confronta + 📈 Graph
alto 1920x1080
16.3  fps    + Confronta + 📈 Graph
» Il Benchmark indica che il gioco non è utilizzabile con i settaggi testati.
Additional Benchmarks
Low 1280x720
42.1
basso 1920x1080
78 95.3 ~ 87 fps    + Confronta + 📈 Graph
medio 1920x1080
74.1 84.9 ~ 80 fps    + Confronta + 📈 Graph
alto 1920x1080
70.4 76.8 ~ 74 fps    + Confronta + 📈 Graph
ultra 1920x1080
23.9 59.2 ~ 42 fps    + Confronta + 📈 Graph
» Giocabile con la maggior parte dei portatili testati con dettagli ultra.
Additional Benchmarks
Low Preset 1280x720
140.7
124.5
basso 1920x1080
74.6 85.6 ~ 80 fps    + Confronta + 📈 Graph
medio 1920x1080
57.3 63 ~ 60 fps    + Confronta + 📈 Graph
alto 1920x1080
55.1 70.7 ~ 63 fps    + Confronta + 📈 Graph
ultra 1920x1080
52.8 59.7 ~ 56 fps    + Confronta + 📈 Graph
4K 3840x2160
8.9  fps    + Confronta + 📈 Graph
» Giocabile con tutti i portatili testati con dettagli ultra.
Additional Benchmarks
Low Preset 1280x720
124.1
basso 1920x1080
53.2 55.4 ~ 54 fps    + Confronta + 📈 Graph
medio 1920x1080
44.9 50.7 ~ 48 fps    + Confronta + 📈 Graph
alto 1920x1080
34.3 42.5 ~ 38 fps    + Confronta + 📈 Graph
ultra 1920x1080
30.6 42.1 ~ 36 fps    + Confronta + 📈 Graph
» Giocabile con la maggior parte dei portatili testati con dettagli ultra.
Additional Benchmarks
Very Low Preset 1280x720
67.8
90.3
Very High Preset + Very High Raytracing TAA 1920x1080
35.9
F1 23

F1 23

2023
basso 1920x1080
164.9 184.3 ~ 175 fps    + Confronta
medio 1920x1080
150.3 160.9 ~ 156 fps    + Confronta
alto 1920x1080
109.6 112 ~ 111 fps    + Confronta
ultra 1920x1080
32.7 33.1 ~ 33 fps    + Confronta
4K 3840x2160
2.2  fps    + Confronta
» Giocabile con tutti i portatili testati con dettagli alto.
Additional Benchmarks
Ultra Low Preset TAA 1280x720
232
226
Diablo 4

Diablo 4

2023
basso 1920x1080
129.7 146.2 ~ 138 fps    + Confronta + 📈 Graph
medio 1920x1080
115.6 131.6 ~ 124 fps    + Confronta + 📈 Graph
alto 1920x1080
104.5 118.4 ~ 111 fps    + Confronta + 📈 Graph
ultra 1920x1080
83.2 87.8 ~ 86 fps    + Confronta + 📈 Graph
4K 3840x2160
30.4  fps    + Confronta + 📈 Graph
» Giocabile con tutti i portatili testati con dettagli ultra.
Additional Benchmarks
Low Preset 1280x720
195.2
basso 1920x1080
44 50.7 ~ 47 fps    + Confronta + 📈 Graph
medio 1920x1080
39.4 45.7 ~ 43 fps    + Confronta + 📈 Graph
alto 1920x1080
36.7 41.3 ~ 39 fps    + Confronta + 📈 Graph
ultra 1920x1080
34.7 38.2 ~ 36 fps    + Confronta + 📈 Graph
4K 3840x2160
11.6  fps    + Confronta + 📈 Graph
» Giocabile con la maggior parte dei portatili testati con dettagli ultra.
Additional Benchmarks
Low Preset 1280x720
85.7
73.9
Epic Preset + Ray Tracing 1920x1080
27.2
Dead Island 2

Dead Island 2

2023
basso 1920x1080
147.1  fps    + Confronta + 📈 Graph
medio 1920x1080
120.5  fps    + Confronta + 📈 Graph
alto 1920x1080
93.4  fps    + Confronta + 📈 Graph
ultra 1920x1080
74  fps    + Confronta + 📈 Graph
4K 3840x2160
26.1  fps    + Confronta + 📈 Graph
» Giocabile con tutti i portatili testati con dettagli ultra.
Additional Benchmarks
Low Preset Low TAA 1280x720
100.5
The Last of Us

The Last of Us

2023
basso 1920x1080
34.3  fps    + Confronta + 📈 Graph
medio 1920x1080
32.2  fps    + Confronta + 📈 Graph
alto 1920x1080
31.3  fps    + Confronta + 📈 Graph
ultra 1920x1080
28.7  fps    + Confronta + 📈 Graph
» Il Benchmark indica che il gioco non è utilizzabile con i settaggi testati.
Additional Benchmarks
Low Preset 1280x720
60.7
basso 1920x1080
86.4 100.9 ~ 94 fps    + Confronta + 📈 Graph
medio 1920x1080
64.9 75.1 ~ 70 fps    + Confronta + 📈 Graph
alto 1920x1080
60 68.6 ~ 64 fps    + Confronta + 📈 Graph
ultra 1920x1080
41.3 46.1 ~ 44 fps    + Confronta + 📈 Graph
4K 3840x2160
9.9  fps    + Confronta + 📈 Graph
» Giocabile con tutti i portatili testati con dettagli ultra.
Additional Benchmarks
Prioritize Performance Preset 1280x720
105.1
114.1
basso 1920x1080
93.6 111.3 ~ 102 fps    + Confronta
medio 1920x1080
83.5 90.6 ~ 87 fps    + Confronta
alto 1920x1080
50.5 74 ~ 62 fps    + Confronta
ultra 1920x1080
48.8 72.8 ~ 61 fps    + Confronta
4K 3840x2160
» Giocabile con tutti i portatili testati con dettagli ultra.
Additional Benchmarks
Minimum Settings 1280x720
188.9
177.7
basso 1920x1080
53.1 54.5 ~ 54 fps    + Confronta + 📈 Graph
medio 1920x1080
35.2 39.3 ~ 37 fps    + Confronta + 📈 Graph
alto 1920x1080
34.9 35.8 ~ 35 fps    + Confronta + 📈 Graph
ultra 1920x1080
31.1 34.2 ~ 33 fps    + Confronta + 📈 Graph
4K 3840x2160
15.4  fps    + Confronta + 📈 Graph
» Giocabile con tutti i portatili testati con dettagli medio.
Additional Benchmarks
Ultra Low Preset 1280x720
68.3
75.6
basso 1920x1080
37.9 100.1 ~ 69 fps    + Confronta + 📈 Graph
medio 1920x1080
30.5 73.3 ~ 52 fps    + Confronta + 📈 Graph
alto 1920x1080
29.6 51.1 ~ 40 fps    + Confronta + 📈 Graph
ultra 1920x1080
29.3 37.5 ~ 33 fps    + Confronta + 📈 Graph
4K 3840x2160
27.8  fps    + Confronta + 📈 Graph
» Giocabile con la maggior parte dei portatili testati con dettagli alto.
Additional Benchmarks
Low Preset 1280x720
38.3
147
Returnal

Returnal

2023
basso 1920x1080
55 62 ~ 59 fps    + Confronta
medio 1920x1080
53 60 ~ 57 fps    + Confronta
alto 1920x1080
49 54 ~ 52 fps    + Confronta
ultra 1920x1080
40 41 ~ 41 fps    + Confronta
4K 3840x2160
» Giocabile con tutti i portatili testati con dettagli ultra.
Additional Benchmarks
Low Preset 1280x720
75
70
Epic Preset + Epic Ray-Tracing 1920x1080
30
basso 1920x1080
69.6  fps    + Confronta + 📈 Graph
medio 1920x1080
48.6  fps    + Confronta + 📈 Graph
alto 1920x1080
43.7  fps    + Confronta + 📈 Graph
ultra 1920x1080
34.3  fps    + Confronta + 📈 Graph
» Giocabile con tutti i portatili testati con dettagli alto.
Additional Benchmarks
Low Preset Low TAA 1280x720
105.6
Ultra Preset + Full Ray Tracing High TAA 1920x1080
23.4
basso 1920x1080
48.2 54.4 ~ 51 fps    + Confronta + 📈 Graph
medio 1920x1080
46.7 52 ~ 49 fps    + Confronta + 📈 Graph
alto 1920x1080
42.2 48.2 ~ 45 fps    + Confronta + 📈 Graph
ultra 1920x1080
41.3 46.1 ~ 44 fps    + Confronta + 📈 Graph
» Giocabile con tutti i portatili testati con dettagli ultra.
Additional Benchmarks
Low Preset TAA 1280x720
68
72.7
basso 1920x1080
126.2  fps    + Confronta + 📈 Graph
medio 1920x1080
102.8  fps    + Confronta + 📈 Graph
alto 1920x1080
51.2  fps    + Confronta + 📈 Graph
ultra 1920x1080
44.4  fps    + Confronta + 📈 Graph
» Giocabile con tutti i portatili testati con dettagli ultra.
Additional Benchmarks
Low Preset / Off 1280x720
165.7
RT Ultra Preset / On FXAA 1920x1080
20.2
basso 1920x1080
147.9  fps    + Confronta + 📈 Graph
medio 1920x1080
110.1  fps    + Confronta + 📈 Graph
alto 1920x1080
80.9  fps    + Confronta + 📈 Graph
ultra 1920x1080
64.7  fps    + Confronta + 📈 Graph
» Giocabile con tutti i portatili testati con dettagli ultra.
Additional Benchmarks
Low Preset 1280x720
216
basso 1920x1080
80.2 109.8 ~ 95 fps    + Confronta
medio 1920x1080
72.6 83.2 ~ 78 fps    + Confronta
alto 1920x1080
67.9 78 ~ 73 fps    + Confronta
ultra 1920x1080
47.5 54.5 ~ 51 fps    + Confronta
4K 3840x2160
» Giocabile con tutti i portatili testati con dettagli ultra.
Additional Benchmarks
Low Preset (without FSR Upscaling) 1280x720
110.2
104
basso 1920x1080
59.8  fps    + Confronta + 📈 Graph
medio 1920x1080
52.5  fps    + Confronta + 📈 Graph
alto 1920x1080
44.7  fps    + Confronta + 📈 Graph
ultra 1920x1080
37.9  fps    + Confronta + 📈 Graph
» Giocabile con tutti i portatili testati con dettagli ultra.
Additional Benchmarks
Low Preset 1280x720
67.6
basso 1920x1080
60.5  fps    + Confronta + 📈 Graph
medio 1920x1080
58  fps    + Confronta + 📈 Graph
alto 1920x1080
53.4  fps    + Confronta + 📈 Graph
ultra 1920x1080
51.4  fps    + Confronta + 📈 Graph
» Giocabile con tutti i portatili testati con dettagli ultra.
Additional Benchmarks
Very Low Preset 1280x720
82.9
Very High Preset + Ray-Tracing TAA 1920x0180
36.3
basso 1920x1080
77  fps    + Confronta
medio 1920x1080
65  fps    + Confronta
alto 1920x1080
56  fps    + Confronta
ultra 1920x1080
55  fps    + Confronta
» Giocabile con tutti i portatili testati con dettagli ultra.
Additional Benchmarks
Basic Quality Preset T2X SMAA 1280x720
97
basso 1920x1080
31.3  fps    + Confronta + 📈 Graph
medio 1920x1080
35.3  fps    + Confronta + 📈 Graph
alto 1920x1080
27.6  fps    + Confronta + 📈 Graph
ultra 1920x1080
26.7  fps    + Confronta + 📈 Graph
» Giocabile con tutti i portatili testati con dettagli medio.
basso 1920x1080
67.8  fps    + Confronta + 📈 Graph
medio 1920x1080
58.3  fps    + Confronta + 📈 Graph
alto 1920x1080
43.6  fps    + Confronta + 📈 Graph
ultra 1920x1080
33.2  fps    + Confronta + 📈 Graph
4K 3840x2160
12.9  fps    + Confronta + 📈 Graph
» Giocabile con tutti i portatili testati con dettagli alto.
Additional Benchmarks
Low Preset 1280x720
68.6
medio 1920x1080
58.9  fps    + Confronta + 📈 Graph
alto 1920x1080
47.5  fps    + Confronta + 📈 Graph
ultra 1920x1080
38.1  fps    + Confronta + 📈 Graph
QHD 2560x1440
24.8  fps    + Confronta + 📈 Graph
» Giocabile con tutti i portatili testati con dettagli ultra.
F1 22

F1 22

2022
basso 1920x1080
152  fps    + Confronta
medio 1920x1080
124 135.8 ~ 130 fps    + Confronta
alto 1920x1080
104 104.6 ~ 104 fps    + Confronta
ultra 1920x1080
35 36.2 ~ 36 fps    + Confronta
QHD 2560x1440
7.2 23.4 ~ 15 fps    + Confronta
4K 3840x2160
2  fps    + Confronta
» Giocabile con la maggior parte dei portatili testati con dettagli ultra.
Additional Benchmarks
Ultra Low Preset 16xAF TAA 1280x720
218
medio 1920x1080
135.8  fps    + Confronta + 📈 Graph
alto 1920x1080
121.5  fps    + Confronta + 📈 Graph
ultra 1920x1080
111.9  fps    + Confronta + 📈 Graph
QHD 2560x1440
71.4  fps    + Confronta + 📈 Graph
» Giocabile con tutti i portatili testati con dettagli ultra.
medio 1920x1080
85.4  fps    + Confronta + 📈 Graph
alto 1920x1080
83.6  fps    + Confronta + 📈 Graph
ultra 1920x1080
83.3  fps    + Confronta + 📈 Graph
QHD 2560x1440
52.3  fps    + Confronta + 📈 Graph
» Giocabile con tutti i portatili testati con dettagli ultra.
Additional Benchmarks
Highest Settings + Maximum Ray Tracing 1920x1080
83
basso 1920x1080
medio 1920x1080
86.6 105.4 ~ 96 fps    + Confronta
alto 1920x1080
64.6 67 ~ 66 fps    + Confronta
ultra 1920x1080
52 54.6 ~ 53 fps    + Confronta
QHD 2560x1440
35.5  fps    + Confronta
4K 3840x2160
» Giocabile con tutti i portatili testati con dettagli ultra.
Additional Benchmarks
Lowest Preset (DX12) 1280x720
170.9
basso 1920x1080
70.5  fps    + Confronta
medio 1920x1080
57.5 71 ~ 64 fps    + Confronta
alto 1920x1080
50.4 57.5 ~ 54 fps    + Confronta
ultra 1920x1080
47 57.4 ~ 52 fps    + Confronta
QHD 2560x1440
30.9  fps    + Confronta
» Giocabile con tutti i portatili testati con dettagli ultra.
Additional Benchmarks
Low Preset 1280x720
104.2
Ray Tracing Ultra Preset (DLSS off) 1920x1080
19
Elex 2

Elex 2

2022
medio 1920x1080
49.7  fps    + Confronta + 📈 Graph
alto 1920x1080
48.8  fps    + Confronta + 📈 Graph
ultra 1920x1080
43.3  fps    + Confronta + 📈 Graph
QHD 2560x1440
36.5  fps    + Confronta + 📈 Graph
» Giocabile con tutti i portatili testati con dettagli ultra.
basso 1920x1080
114  fps    + Confronta
medio 1920x1080
97.8 109 ~ 103 fps    + Confronta
alto 1920x1080
86.2 91 ~ 89 fps    + Confronta
ultra 1920x1080
70 71 ~ 71 fps    + Confronta
QHD 2560x1440
56.9  fps    + Confronta
4K 3840x2160
34.7  fps    + Confronta
» Giocabile con tutti i portatili testati con dettagli ultra.
Additional Benchmarks
Low Preset 1280x720
119
medio 1920x1080
59.9  fps    + Confronta + 📈 Graph
alto 1920x1080
59.7  fps    + Confronta + 📈 Graph
ultra 1920x1080
56.9  fps    + Confronta + 📈 Graph
QHD 2560x1440
46.2  fps    + Confronta + 📈 Graph
» Giocabile con tutti i portatili testati con dettagli ultra.
medio 1920x1080
60.9  fps    + Confronta + 📈 Graph
alto 1920x1080
51.2  fps    + Confronta + 📈 Graph
QHD 2560x1440
35.6  fps    + Confronta + 📈 Graph
» Giocabile con tutti i portatili testati con dettagli alto.
Additional Benchmarks
High Quality Raytracing 1920x1080
20.3
medio 1920x1080
103  fps    + Confronta
alto 1920x1080
99  fps    + Confronta
ultra 1920x1080
83  fps    + Confronta
QHD 2560x1440
55  fps    + Confronta
» Giocabile con tutti i portatili testati con dettagli ultra.
basso 1920x1080
56  fps    + Confronta + 📈 Graph
medio 1920x1080
53.1 55.6 ~ 54 fps    + Confronta + 📈 Graph
alto 1920x1080
44.9 49.9 ~ 47 fps    + Confronta + 📈 Graph
ultra 1920x1080
36.9 39.8 ~ 38 fps    + Confronta + 📈 Graph
QHD 2560x1440
30.7  fps    + Confronta + 📈 Graph
4K 3840x2160
21.2  fps    + Confronta + 📈 Graph
» Giocabile con tutti i portatili testati con dettagli ultra.
Additional Benchmarks
Low Preset 1280x720
53.7
medio 1920x1080
67.2  fps    + Confronta + 📈 Graph
alto 1920x1080
59.8  fps    + Confronta + 📈 Graph
ultra 1920x1080
56.2  fps    + Confronta + 📈 Graph
QHD 2560x1440
42.3  fps    + Confronta + 📈 Graph
» Giocabile con tutti i portatili testati con dettagli ultra.
medio 1920x1080
136.6  fps    + Confronta + 📈 Graph
alto 1920x1080
110.8  fps    + Confronta + 📈 Graph
ultra 1920x1080
107.2  fps    + Confronta + 📈 Graph
QHD 2560x1440
80.5  fps    + Confronta + 📈 Graph
» Giocabile con tutti i portatili testati con dettagli ultra.
medio 1920x1080
86  fps    + Confronta
alto 1920x1080
80  fps    + Confronta
ultra 1920x1080
50  fps    + Confronta
QHD 2560x1440
41  fps    + Confronta
» Giocabile con tutti i portatili testati con dettagli ultra.
medio 1920x1080
60  fps    + Confronta
alto 1920x1080
51  fps    + Confronta
ultra 1920x1080
47  fps    + Confronta
QHD 2560x1440
34  fps    + Confronta
» Giocabile con tutti i portatili testati con dettagli ultra.
medio 1920x1080
81  fps    + Confronta
alto 1920x1080
76  fps    + Confronta
ultra 1920x1080
73  fps    + Confronta
QHD 2560x1440
52  fps    + Confronta
» Giocabile con tutti i portatili testati con dettagli ultra.
Additional Benchmarks
Ultra Preset + Ultra Ray-Tracing 1920x1080
37
medio 1920x1080
132.9  fps    + Confronta + 📈 Graph
alto 1920x1080
115.4  fps    + Confronta + 📈 Graph
ultra 1920x1080
105.9  fps    + Confronta + 📈 Graph
QHD 2560x1440
68.3  fps    + Confronta + 📈 Graph
» Giocabile con tutti i portatili testati con dettagli ultra.
Far Cry 6

Far Cry 6

2021
basso 1280x720
medio 1920x1080
87 93.4 ~ 90 fps    + Confronta + 📈 Graph
alto 1920x1080
75 79.9 ~ 77 fps    + Confronta + 📈 Graph
ultra 1920x1080
62.4 65 ~ 64 fps    + Confronta + 📈 Graph
QHD 2560x1440
47  fps    + Confronta
4K 3840x2160
» Giocabile con tutti i portatili testati con dettagli ultra.
Additional Benchmarks
Low Graphics Quality 1920x1080
111.8
Ultra Graphics Quality + HD Textures + DXR TAA 1920x1080
53
medio 1920x1080
116.7  fps    + Confronta + 📈 Graph
alto 1920x1080
98.6  fps    + Confronta + 📈 Graph
QHD 2560x1440
67.5  fps    + Confronta + 📈 Graph
» Giocabile con tutti i portatili testati con dettagli alto.
Deathloop

Deathloop

2021
medio 1920x1080
76.2  fps    + Confronta + 📈 Graph
alto 1920x1080
65.5  fps    + Confronta + 📈 Graph
ultra 1920x1080
54.6  fps    + Confronta + 📈 Graph
QHD 2560x1440
37  fps    + Confronta + 📈 Graph
» Giocabile con tutti i portatili testati con dettagli ultra.
F1 2021

F1 2021

2021
basso 1280x720
317  fps    + Confronta
medio 1920x1080
227  fps    + Confronta
alto 1920x1080
179.2  fps    + Confronta
ultra 1920x1080
75.3  fps    + Confronta
QHD 2560x1440
55.5  fps    + Confronta
4K 3840x2160
26.8  fps    + Confronta
» Giocabile con tutti i portatili testati con dettagli ultra.
Days Gone

Days Gone

2021
medio 1920x1080
80.2  fps    + Confronta + 📈 Graph
alto 1920x1080
76  fps    + Confronta + 📈 Graph
ultra 1920x1080
58.2  fps    + Confronta + 📈 Graph
QHD 2560x1440
42  fps    + Confronta + 📈 Graph
» Giocabile con tutti i portatili testati con dettagli ultra.
ultra 1920x1080
88.5  fps    + Confronta + 📈 Graph
QHD 2560x1440
81.9  fps    + Confronta + 📈 Graph
» Giocabile con tutti i portatili testati con dettagli ultra.
medio 1920x1080
119.9  fps    + Confronta + 📈 Graph
alto 1920x1080
107.8  fps    + Confronta + 📈 Graph
ultra 1920x1080
93.3  fps    + Confronta + 📈 Graph
QHD 2560x1440
61.1  fps    + Confronta + 📈 Graph
» Giocabile con tutti i portatili testati con dettagli ultra.
Additional Benchmarks
Ray Tracing Preset 1920x1080
56.2
Outriders

Outriders

2021
medio 1920x1080
90  fps    + Confronta + 📈 Graph
alto 1920x1080
76.1  fps    + Confronta + 📈 Graph
ultra 1920x1080
69  fps    + Confronta + 📈 Graph
QHD 2560x1440
43.9  fps    + Confronta + 📈 Graph
» Giocabile con tutti i portatili testati con dettagli ultra.
Hitman 3

Hitman 3

2021
medio 1920x1080
123  fps    + Confronta
alto 1920x1080
109  fps    + Confronta
ultra 1920x1080
102  fps    + Confronta
QHD 2560x1440
65  fps    + Confronta
» Giocabile con tutti i portatili testati con dettagli ultra.
medio 1920x1080
51.3  fps    + Confronta + 📈 Graph
alto 1920x1080
47.3  fps    + Confronta + 📈 Graph
ultra 1920x1080
46.1  fps    + Confronta + 📈 Graph
QHD 2560x1440
39.4  fps    + Confronta + 📈 Graph
» Giocabile con tutti i portatili testati con dettagli ultra.
medio 1920x1080
64  fps    + Confronta
alto 1920x1080
54  fps    + Confronta
ultra 1920x1080
48  fps    + Confronta
QHD 2560x1440
37  fps    + Confronta
» Giocabile con tutti i portatili testati con dettagli ultra.
Dirt 5

Dirt 5

2020
medio 1920x1080
80.6  fps    + Confronta
alto 1920x1080
64.5  fps    + Confronta
ultra 1920x1080
54  fps    + Confronta
QHD 2560x1440
44.2  fps    + Confronta
» Giocabile con tutti i portatili testati con dettagli ultra.
medio 1920x1080
85  fps    + Confronta
alto 1920x1080
75  fps    + Confronta
ultra 1920x1080
48  fps    + Confronta
QHD 2560x1440
35  fps    + Confronta
» Giocabile con tutti i portatili testati con dettagli ultra.
Additional Benchmarks
Ultra Preset + Ultra Ray Tracing (DX12) 1920x1080
28
medio 1920x1080
167.1  fps    + Confronta + 📈 Graph
alto 1920x1080
149.4  fps    + Confronta + 📈 Graph
ultra 1920x1080
140.6  fps    + Confronta + 📈 Graph
QHD 2560x1440
97.4  fps    + Confronta + 📈 Graph
» Giocabile con tutti i portatili testati con dettagli ultra.
medio 1920x1080
55.4  fps    + Confronta + 📈 Graph
alto 1920x1080
52.7  fps    + Confronta + 📈 Graph
QHD 2560x1440
36.9  fps    + Confronta + 📈 Graph
» Giocabile con tutti i portatili testati con dettagli alto.
medio 1920x1080
72.7  fps    + Confronta
alto 1920x1080
54.8  fps    + Confronta
ultra 1920x1080
42.5  fps    + Confronta
QHD 2560x1440
34.7  fps    + Confronta
» Giocabile con tutti i portatili testati con dettagli ultra.
medio 1920x1080
125.4  fps    + Confronta + 📈 Graph
alto 1920x1080
60.7  fps    + Confronta + 📈 Graph
ultra 1920x1080
50.1  fps    + Confronta + 📈 Graph
QHD 2560x1440
34.8  fps    + Confronta + 📈 Graph
» Giocabile con tutti i portatili testati con dettagli ultra.
basso 1280x720
69.3  fps    + Confronta + 📈 Graph
medio 1920x1080
44.2  fps    + Confronta + 📈 Graph
alto 1920x1080
33.7  fps    + Confronta + 📈 Graph
ultra 1920x1080
25.7  fps    + Confronta + 📈 Graph
» Giocabile con tutti i portatili testati con dettagli medio.
Additional Benchmarks
Low-End TAAAA 1920x1080
54.5
medio 1920x1080
89.8  fps    + Confronta + 📈 Graph
alto 1920x1080
82.9  fps    + Confronta + 📈 Graph
ultra 1920x1080
81.9  fps    + Confronta + 📈 Graph
QHD 2560x1440
60  fps    + Confronta + 📈 Graph
» Giocabile con tutti i portatili testati con dettagli ultra.
F1 2020

F1 2020

2020
basso 1280x720
225  fps    + Confronta
medio 1920x1080
152.7  fps    + Confronta
alto 1920x1080
127.3  fps    + Confronta
ultra 1920x1080
87.9  fps    + Confronta
QHD 2560x1440
66.3  fps    + Confronta
4K 3840x2160
39.5  fps    + Confronta
» Giocabile con tutti i portatili testati con dettagli ultra.
medio 1920x1080
147  fps    + Confronta
alto 1920x1080
99.2  fps    + Confronta
ultra 1920x1080
79.7  fps    + Confronta
QHD 2560x1440
52  fps    + Confronta
» Giocabile con tutti i portatili testati con dettagli ultra.
medio 1920x1080
112.4  fps    + Confronta + 📈 Graph
alto 1920x1080
104.2  fps    + Confronta + 📈 Graph
ultra 1920x1080
101.7  fps    + Confronta + 📈 Graph
QHD 2560x1440
70.9  fps    + Confronta + 📈 Graph
» Giocabile con tutti i portatili testati con dettagli ultra.
medio 1920x1080
88.2  fps    + Confronta + 📈 Graph
alto 1920x1080
72.3  fps    + Confronta + 📈 Graph
QHD 2560x1440
50.1  fps    + Confronta + 📈 Graph
» Giocabile con tutti i portatili testati con dettagli alto.
basso 1280x720
medio 1920x1080
alto 1920x1080
ultra 1920x1080
4K 3840x2160
» Giocabile con tutti i portatili testati con dettagli ultra.
Additional Benchmarks
Very Low Overall Quality (DX11) 1920x1080
91.9
Control

Control

2019
basso 1280x720
145.7  fps    + Confronta + 📈 Graph
medio 1920x1080
66  fps    + Confronta + 📈 Graph
alto 1920x1080
51.1  fps    + Confronta + 📈 Graph
» Giocabile con tutti i portatili testati con dettagli alto.
Additional Benchmarks
High Quality Preset & High Ray Tracing Preset (DX12) 1920x1080
34.8
basso 1280x720
medio 1920x1080
alto 1920x1080
ultra 1920x1080
4K 3840x2160
» Giocabile con tutti i portatili testati con dettagli ultra.
basso 1280x720
80.5  fps    + Confronta
medio 1920x1080
55.6  fps    + Confronta
alto 1920x1080
40.6  fps    + Confronta
ultra 1920x1080
32.1  fps    + Confronta
4K 3840x2160
20.5  fps    + Confronta
» Giocabile con tutti i portatili testati con dettagli alto.
basso 1280x720
medio 1920x1080
alto 1920x1080
ultra 1920x1080
4K 3840x2160
» Giocabile con tutti i portatili testati con dettagli ultra.
Additional Benchmarks
Lowest Preset 1920x1080
102.4
Strange Brigade

Strange Brigade

2018
basso 1280x720
377 433 ~ 405 fps    + Confronta
medio 1920x1080
167.8 178.2 206 ~ 184 fps    + Confronta
alto 1920x1080
140 148.8 171.3 ~ 153 fps    + Confronta
ultra 1920x1080
116.6 124.1 137.7 ~ 126 fps    + Confronta
4K 3840x2160
54.1  fps    + Confronta
» Giocabile con tutti i portatili testati con dettagli ultra.
Far Cry 5

Far Cry 5

2018
basso 1280x720
medio 1920x1080
92 93 ~ 93 fps    + Confronta + 📈 Graph
alto 1920x1080
83 88 ~ 86 fps    + Confronta + 📈 Graph
ultra 1920x1080
78 84 ~ 81 fps    + Confronta + 📈 Graph
4K 3840x2160
» Giocabile con tutti i portatili testati con dettagli ultra.
Additional Benchmarks
Low Preset TAA 1920x1080
105
basso 1280x720
27.3 57.3 70.7 ~ 52 fps    + Confronta
medio 1920x1080
15.9 47.1 55.8 ~ 40 fps    + Confronta
alto 1920x1080
14.4 38.6 47.6 ~ 34 fps    + Confronta
4K 3840x2160
» Giocabile con la maggior parte dei portatili testati con dettagli medio.
basso 1280x720
98.5 109.5 ~ 104 fps    + Confronta
medio 1920x1080
67.9 71 78 ~ 72 fps    + Confronta
alto 1920x1080
41.1 41.6 49.7 ~ 44 fps    + Confronta
QHD 2560x1440
4K 3840x2160
» Giocabile con tutti i portatili testati con dettagli alto.
basso 1280x720
102.2 109.3 111.8 ~ 108 fps    + Confronta
medio 1366x768
94.2 101.6 121.6 ~ 106 fps    + Confronta
alto 1920x1080
90.4 96.5 96.8 ~ 95 fps    + Confronta
ultra 1920x1080
80.4 87.1 91.9 ~ 86 fps    + Confronta
4K 3840x2160
60.6  fps    + Confronta
» Giocabile con tutti i portatili testati con dettagli ultra.
basso 1024x768
267.3  fps    + Confronta
medio 1366x768
190.3 212 ~ 201 fps    + Confronta
alto 1920x1080
106.9 114 ~ 110 fps    + Confronta
ultra 1920x1080
39.8 49.4 ~ 45 fps    + Confronta + 📈 Graph
» Giocabile con tutti i portatili testati con dettagli ultra.
GTA V

GTA V

2015
basso 1024x768
177.4  fps    + Confronta
medio 1366x768
159.4 165.9 170.6 ~ 165 fps    + Confronta
alto 1920x1080
94.3 100.3 101.1 ~ 99 fps    + Confronta
ultra 1920x1080
40.1 42.8 43.1 ~ 42 fps    + Confronta
4K 3840x2160
34.2  fps    + Confronta
» Giocabile con tutti i portatili testati con dettagli ultra.
Additional Benchmarks
Highest Settings possible 16xAF 4xMSAA + FXAA 3840x2160
11.3
Normal/Off 4xAF 1920x1080
168.5
160.4
168.4
Lowest Settings possible 1920x1080
168.6
176.8
bassomedioaltoultraQHD4K
Horizon Forbidden West4442.425.622.618.4
Alone in the Dark108.495.990.457.230.1
Last Epoch162.7131.4111.288.558.627.5
Skull & Bones585345362917
Helldivers 279.662.457.855.936.917.9
Enshrouded54.949.842.536.126.211.8
Palworld80.167.453.850.736.518.9
Prince of Persia The Lost Crown347333316215116.1
Ready or Not128.7112.993.669.342.815
The Finals144.7109.29777.448.922.7
Avatar Frontiers of Pandora45403324155.7
Call of Duty Modern Warfare 3 20239686672917
EA Sports WRC65.948.842.940.227.8
Alan Wake 238353411.66.3
Lords of the Fallen464034303.51
Total War Pharaoh234139846753.327.3
Assassin's Creed Mirage635655493821
EA Sports FC 24121.8
Counter-Strike 2169154.9113.981.752.814.2
Cyberpunk 2077 2.0 Phantom Liberty7863544311.5
Lies of P9796807122.9
The Crew Motorfest60575046
Starfield3430.124.822
Armored Core 670.964.363.958.525.2
Immortals of Aveum19.116.3
Atlas Fallen87807442
Baldur's Gate 3806063568.91
Ratchet & Clank Rift Apart54483836
F1 23175156111332.15
Diablo 41381241118630.4
Star Wars Jedi Survivor4743393611.6
Dead Island 2147.1120.593.47426.1
The Last of Us34.332.231.328.7
Resident Evil 4 Remake947064449.89
Company of Heroes 310287626115.8
Sons of the Forest5437353315.4
Atomic Heart6952403327.8
Returnal5957524115
Hogwarts Legacy69.648.643.734.3
Dead Space Remake51494544
The Witcher 3 v4.00126.2102.851.244.4
High On Life147.9110.180.964.7
The Callisto Protocol9578735121
Need for Speed Unbound59.852.544.737.9
Spider-Man Miles Morales60.55853.451.4
Call of Duty Modern Warfare 2 202277655655
Uncharted Legacy of Thieves Collection31.335.327.626.7
A Plague Tale Requiem67.858.343.633.212.9
The Quarry58.947.538.124.8
F1 2215213010436151.97
Vampire Bloodhunt135.8121.5111.971.4
Ghostwire Tokyo85.483.683.352.3
Tiny Tina's Wonderlands133.496665335.517.2
Cyberpunk 2077 1.670.564545230.9
Elex 249.748.843.336.5
GRID Legends114103897156.934.7
Elden Ring59.959.756.946.2
Dying Light 260.951.235.6
Rainbow Six Extraction103998355
God of War5654473830.721.2
Halo Infinite67.259.856.242.3
Farming Simulator 22136.6110.8107.280.5
Forza Horizon 586805041
Riders Republic60514734
Guardians of the Galaxy81767352
Back 4 Blood132.9115.4105.968.3
Far Cry 6100.19077644726.3
Alan Wake Remastered116.798.667.5
Deathloop76.265.554.637
F1 2021317227179.275.355.526.8
Days Gone80.27658.242
Mass Effect Legendary Edition88.581.9
Resident Evil Village119.9107.893.361.1
Outriders9076.16943.9
Hitman 312310910265
Yakuza Like a Dragon51.347.346.139.4
Assassin´s Creed Valhalla64544837
Dirt 580.664.55444.2
Watch Dogs Legion85754835
Star Wars Squadrons167.1149.4140.697.4
Mafia Definitive Edition55.452.736.9
Serious Sam 472.754.842.534.7
Crysis Remastered125.460.750.134.8
Flight Simulator 202069.344.233.725.7
Death Stranding89.882.981.960
F1 2020225152.7127.387.966.339.5
Gears Tactics14799.279.752
Doom Eternal112.4104.2101.770.9
Hunt Showdown88.272.350.1
Borderlands 393.279.367.75721.2
Control145.76651.1
Far Cry New Dawn9884817439
Metro Exodus80.555.640.632.120.5
Shadow of the Tomb Raider101.769.567.960.927.7
Strange Brigade40518415312654.1
Far Cry 511793868135
X-Plane 11.1152403411.3
Final Fantasy XV Benchmark104724433.721.8
Dota 2 Reborn108106958660.6
The Witcher 3267.320111045
GTA V177.4165994234.2
< 30 fps
< 60 fps
< 120 fps
≥ 120 fps
1
17
31
18

31
47
20
4
41
48
6
7
50
31
4
9
37
11
1
37
7
2

Per conoscere altri giochi che potrebbero essere utilizzabili e per una lista completa di tutti i giochi e delle schede grafiche visitate la nostra Gaming List

v1.26
log 25. 21:19:57

#0 no ids found in url (should be separated by "_") +0s ... 0s

#1 not redirecting to Ajax server +0s ... 0s

#2 did not recreate cache, as it is less than 5 days old! Created at Thu, 25 Apr 2024 05:40:10 +0200 +0.001s ... 0.001s

#3 no comparison url found in template nbc.compare_page_1 needed +0.057s ... 0.058s

#4 no comparison url found in template nbc.compare_page_1 needed +0s ... 0.058s

#5 no comparison url found in template nbc.compare_page_1 needed +0s ... 0.059s

#6 no comparison url found in template nbc.compare_page_1 needed +0s ... 0.059s

#7 no comparison url found in template nbc.compare_page_1 needed +0s ... 0.059s

#8 no comparison url found in template nbc.compare_page_1 needed +0s ... 0.059s

#9 no comparison url found in template nbc.compare_page_1 needed +0s ... 0.06s

#10 no comparison url found in template nbc.compare_page_1 needed +0s ... 0.06s

#11 no comparison url found in template nbc.compare_page_1 needed +0s ... 0.06s

#12 no comparison url found in template nbc.compare_page_1 needed +0s ... 0.06s

#13 no comparison url found in template nbc.compare_page_1 needed +0s ... 0.06s

#14 composed specs +0s ... 0.06s

#15 did output specs +0s ... 0.06s

#16 start showIntegratedCPUs +0s ... 0.06s

#17 getting avg benchmarks for device 11311 +0.029s ... 0.089s

#18 got single benchmarks 11311 +0.02s ... 0.109s

#19 got avg benchmarks for devices +0s ... 0.109s

#20 min, max, avg, median took s +1.03s ... 1.139s

#21 before gaming benchmark output +0s ... 1.139s

#22 Got 594 rows for game benchmarks. +0.083s ... 1.222s

#23 composed SQL query for gamebenchmarks +0s ... 1.222s

#24 got data and put it in $dataArray +0.062s ... 1.285s

#25 benchmarks composed for output. +3.985s ... 5.27s

#26 no comparison url found in template nbc.compare_page_1 needed +0.009s ... 5.279s

#27 return log +0s ... 5.279s

Please share our article, every link counts!

Classe 1

GeForce RTX 2080 Super Mobile

Classe 2

M1 Max 32-Core GPU *
GeForce RTX 2070 Super Mobile
M1 Max 24-Core GPU *
Radeon RX 5700M *
M1 Pro 16-Core GPU *
Radeon PRO W6600M *
GeForce RTX 2070 Super Max-Q
M1 Pro 14-Core GPU *
Quadro P4200
Quadro P5000 Max-Q *
GeForce RTX 3050 4GB Laptop GPU
Quadro P4000 Max-Q
Radeon RX 580X (Laptop) *
Radeon RX 580 (Laptop)
Radeon Pro 5300M
Radeon RX 5300M
Quadro P3000 Max-Q *
Radeon Pro WX 7100 *
Radeon RX 570X (Laptop) *
Radeon RX 570 (Laptop) *
Radeon RX 470 (Laptop) *

Classe 3

GeForce GTX 1050 Ti Mobile
Radeon 680M
Quadro P2000 Max-Q
Radeon R9 M395X
GeForce GTX 1050 Ti Max-Q *
WX Vega M GL
Radeon R9 M485X
GeForce GTX 1050 Max-Q *
Radeon 660M
Radeon RX 560X (Laptop)
Radeon RX 560 (Laptop)
Radeon Pro 560X
Radeon Pro 560
Radeon Pro 460
Radeon Pro WX 4130 *
Quadro P620 *
Radeon RX 550X (Laptop)
Radeon Pro 555X
Radeon Pro 555
Radeon Pro 455
Quadro P600
Radeon RX 540X *
Radeon Pro WX 2100 *
Radeon Pro WX 3100 *
Radeon Pro 450
Radeon 630
Radeon 540X *
Quadro P520
Quadro P500 *
Iris Plus Graphics G7 (Ice Lake 64 EU) *
Vega 10 *
Iris Pro Graphics 580
Vega 9
FirePro W5130M
UHD Graphics Xe G4 48EUs *
UHD Graphics 32EUs
UHD Graphics Xe 32EUs (Tiger Lake-H) *
UHD Graphics 750
Vega 7
Radeon R7 M465
Vega 8
Iris Plus Graphics G4 (Ice Lake 48 EU)
Quadro M600M
FirePro W4190M
Radeon R7 M445
UHD Graphics 24EUs (Alder Lake-N) *
Radeon R7 M340
Radeon 610M *
UHD Graphics G1 (Ice Lake 32 EU)
UHD Graphics Xe 16EUs (Tiger Lake-H) *
Radeon R5 (Bristol Ridge)
Adreno 690 *
Adreno 685 *
Adreno 680 *

Classe 4

UHD Graphics 730
Radeon R5 M315 *
Radeon R5 M420 *
UHD Graphics 617
UHD Graphics 615
Radeon R4 (Stoney Ridge)
Radeon R2 (Stoney Ridge)
HD Graphics (Broadwell)

Classe 5

Posizione approssimativa dell'adattatore grafico

> Recensioni e prove di notebook, tablets e smartphones > Info Techniche / Tips > Confronto delle schede video > Intel > Intel A730M
Klaus Hinum, 2023-11-27 (Update: 2023-11-27)