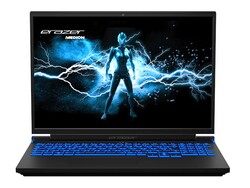
Recensione del portatile Medion Erazer Major X10: Debutto dell'Intel Arc A730M

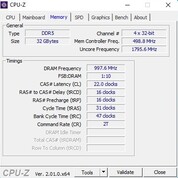
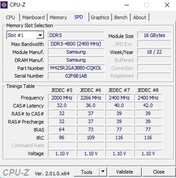
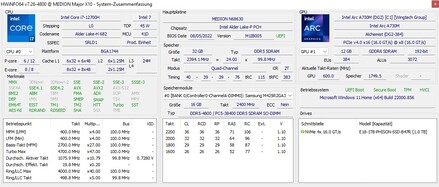
L'Erazer Major X10 costa circa 1.700 euro (1.728 dollari) ed è disponibile sul negozio online di Medion https://www.medion.com/de/shop/p/core-gaming-notebooks-medion-erazer-major-x10-intel-core-i7-12700h-windows-11-home-40-6-cm-16-0--qhd-display-100-srgb-mit-165-hz-intel-arc-a730m-1-tb-pcie-ssd-32-gb-ram-high-end-gaming-notebook-30034414A1. Per questo prezzo, non si ottengono solo 32 GB di RAM a doppio canale (2 x 16 GB DDR5-4800), ma anche 1 TB di memoria NVMe. Il portatile è dotato di Core i7-12700H, un processore a 14 core molto popolare nei portatili da gioco. Come accennato all'inizio, l'elaborazione grafica impegnativa è gestita dalla Arc A730M di Intel, una GPU di fascia media progettata principalmente per competere con la GeForce RTX 3060 e la Radeon RX 6600M. Il portatile è inoltre dotato di un display opaco a 165 Hz con un rapporto di aspetto 16:10 e una risoluzione di 2.560 x 1.600. Windows 11 Home completa il pacchetto complessivo.
Il Major X10 è in concorrenza con altri portatili da gioco di fascia media, come Asus TUF F17 FX707Z-HX011W, l'Acer Nitro 5 AN517-55-738R (entrambi con RTX 3060; uno con un TGP superiore e l'altro con un TGP medio) e il HP Omen 16-c0077ng (RX 6600M). Il presumibilmente più lento Dell Inspiron 16 Plus 7620 con GeForce RTX 3050 Ti è ugualmente incluso nelle tabelle di confronto. Spiegheremo il perché più avanti nella recensione.
I nostri Top 10
» Top 10 Portatili Multimedia
» Top 10 Portatili Gaming
» Top 10 Portatili Gaming Leggeri
» Top 10 Portatili da Ufficio e Business economici
» Top 10 Portatili Premium da Ufficio/Business
» Top 10 Portatili sotto i 300 Euro
» Top 10 Portatili sotto i 500 Euro
» Top 10 dei Portatili Workstation
» Top 10 Subnotebooks
» Top 10 Ultrabooks
» Top 10 Convertibili
» Top 10 Tablets
» Top 10 Tablets Windows
» Top 10 Smartphones
Potenziali concorrenti a confronto
Punteggio | Data | Modello | Peso | Altezza | Dimensione | Risoluzione | Prezzo |
|---|---|---|---|---|---|---|---|
| 85 % v7 (old) | 09/2022 | Medion Erazer Major X10 i7-12700H, A730M | 2.5 kg | 31 mm | 16.00" | 2560x1600 | |
| 84.1 % v7 (old) | 04/2022 | Asus TUF Gaming F17 FX707Z-HX011W i7-12700H, GeForce RTX 3060 Laptop GPU | 2.5 kg | 25 mm | 17.30" | 1920x1080 | |
| 83.9 % v7 (old) | 08/2022 | Acer Nitro 5 AN517-55-738R i7-12700H, GeForce RTX 3060 Laptop GPU | 3.1 kg | 28.6 mm | 17.30" | 1920x1080 | |
| 87.4 % v7 (old) | 08/2022 | Dell Inspiron 16 Plus 7620 i7-12700H, GeForce RTX 3050 Ti Laptop GPU | 2.1 kg | 18.99 mm | 16.00" | 3072x1920 | |
| 86 % v7 (old) | 04/2022 | HP Omen 16-c0077ng R7 5800H, Radeon RX 6600M | 2.3 kg | 26 mm | 16.10" | 2560x1440 |
Telaio
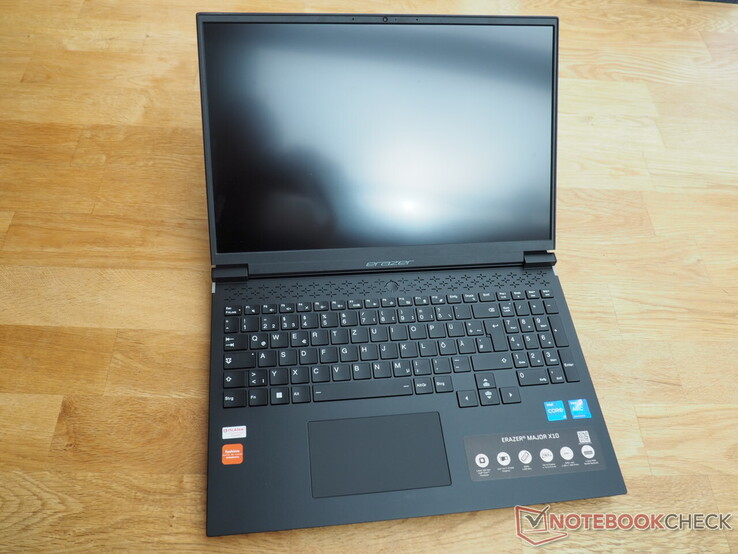
Dal punto di vista estetico, il Major X10 ricorda la serie Legion di Lenovo. Medion ha scelto di utilizzare uno chassis nero opaco con un coperchio in alluminio. A nostro avviso, lo chassis è solido, anche se la sezione di base può flettersi in alcuni punti quando si applica una forza maggiore e il coperchio potrebbe essere un po' più solido (come nel caso della maggior parte dei portatili). Il display può essere aperto fino a 180°, cosa piuttosto insolita per un portatile. Le cerniere fanno il loro lavoro senza problemi. Ad esempio, il dispositivo può essere facilmente aperto con una sola mano. Medion ha dotato il portatile di numerosi elementi di illuminazione per renderlo attraente per i giocatori. Oltre alla tastiera, spiccano il logo sul coperchio e il mirino sul retro dei lati. Le prese d'aria sopra la tastiera presentano un disegno a croce per completare l'estetica complessiva.
Il Major X10 è caratterizzato da un'ottima finitura. Sulla nostra unità in prova, tutte le superfici sono unite in modo ordinato. Con un peso di 2,5 kg, il dispositivo da 16 pollici non è né leggero né particolarmente pesante per un portatile da gioco. Per fare un confronto, l'Asus TUF F17, leggermente più grande, e l'Acer Nitro 5 AN517 pesano rispettivamente 2,5 kg e 3,1 kg, mentre i concorrenti da 16 pollici Omen 16 e Inspiron 16 Plus sono marginalmente più leggeri, rispettivamente 2,3 kg e 2,1 kg. Secondo il produttore, il Major X10 ha uno spessore di 2,7 cm (1,06") senza i piedini e di 3,1 cm (1,22") con questi ultimi.
Caratteristiche
Interfacce
Se non vi dispiace non avere una porta Thunderbolt e un lettore di schede, sarete soddisfatti della selezione di porte del portatile. Ci sono tre porte USB di tipo A e due di tipo C (compatibili con DisplayPort) e tutte, tranne una, supportano lo standard 3.2 Gen 2. Il portatile è dotato anche di un jack audio combinato (cuffie e microfono) e di una porta per la connessione a Internet. Il portatile è dotato anche di un jack audio combinato (cuffie e microfono), una porta Ethernet RJ45 e un'uscita HDMI 2.0. Poiché le porte più importanti sono situate sul retro del portatile, non dovrete preoccuparvi che i vostri movimenti siano fortemente limitati mentre giocate con un mouse esterno.
Connettività
Non ci sono state sorprese durante il nostro test Wi-Fi (laptop a 1 m di distanza dal nostro router di riferimento Asus AXE11000). Il modulo Intel Wi-Fi 6 AX201 all'interno del dispositivo offre velocità di trasferimento elevate, in linea con le aspettative.
| Networking | |
| iperf3 receive AXE11000 | |
| Medion Erazer Major X10 | |
| Media della classe Gaming (680 - 1745, n=115, ultimi 2 anni) | |
| Media Intel Wi-Fi 6 AX201 (390 - 1734, n=79) | |
| iperf3 transmit AXE11000 | |
| Medion Erazer Major X10 | |
| Media Intel Wi-Fi 6 AX201 (438 - 1715, n=74) | |
| Media della classe Gaming (469 - 1862, n=115, ultimi 2 anni) | |
Webcam
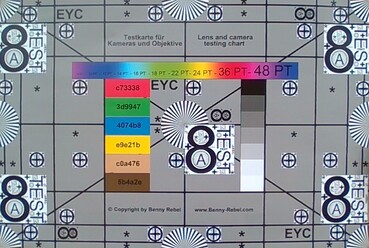
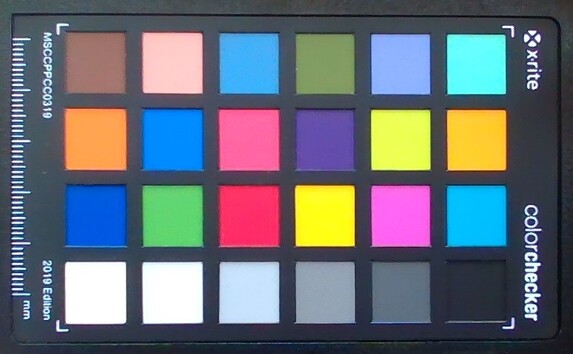
Medion avrebbe bisogno di una webcam migliore. Sebbene la webcam sia leggermente più nitida e più veloce rispetto a quella di molti concorrenti, manca di accuratezza dei colori, come molte webcam integrate nei computer portatili.
Accessori
L'unità in prova era dotata solo di un alimentatore da 300 watt che misura circa 20 x 9 x 2 cm (7,9 x 3,5 x 0,8").
Manutenzione
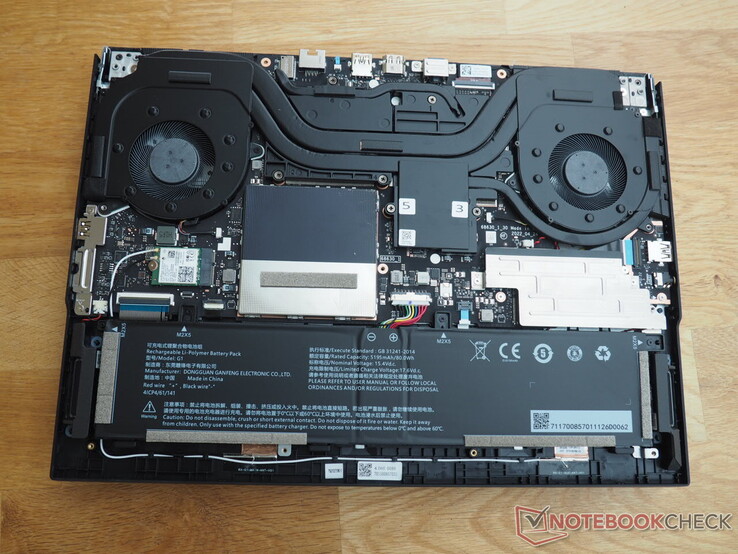
È possibile accedere all'interno del dispositivo per la manutenzione come nella maggior parte dei portatili da gioco. Dopo aver rimosso le 11 viti Phillips dal fondo, è possibile sollevare il coperchio inferiore del portatile. Poiché ci sono delle clip che tengono il coperchio in posizione, è necessario applicare una buona dose di forza utilizzando uno strumento piatto. All'interno dello chassis si trovano due slot SODIMM, due slot M.2 (entrambi situati sotto un coperchio), il modulo wireless e la batteria. Il sistema di raffreddamento è costituito da due ventole che condividono diverse heat pipe.
Garanzia
L'Erazer Major X10 è dotato di una garanzia di 24 mesi.
Dispositivi di ingresso
Tastiera
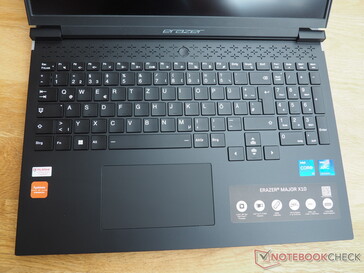
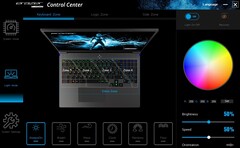
Il portatile da 16 pollici è dotato di una tastiera chiclet con un tastierino numerico completo i cui tasti sono leggermente più stretti rispetto al resto. A differenza di molti altri produttori, Medion ha deciso di utilizzare tasti freccia di dimensioni decenti invece di quelli minuscoli: alcuni giocatori ne saranno felici. Ci piace anche il layout della tastiera, che aderisce per lo più al design QWERTZ standard. Uno dei punti di forza è l'illuminazione RGB a quattro zone con livelli di luminosità regolabili. Sono disponibili diverse modalità per personalizzare l'illuminazione. La tastiera è piacevole da usare per un portatile da gioco, cioè offre un feedback sufficiente.
Touchpad
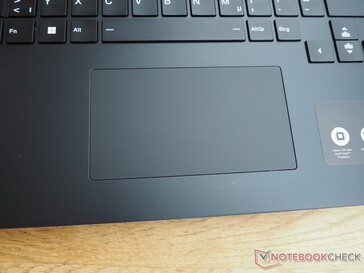
Anche per quanto riguarda il touchpad non c'è molto da lamentarsi. Misura circa 12 x 6,5 cm (4,7 x 2,6"), permette alle dita di scivolare su di esso senza sforzo grazie alla sua superficie abbastanza liscia e non presenta alcun problema (ad esempio con la precisione, i gesti). Solo le aree per il clic nella parte inferiore sono risultate un po' troppo fragili per i nostri gusti, nonostante siano sufficientemente robuste.
Display
Il display di altissimo livello è una caratteristica eccezionale del dispositivo. Al momento, i pannelli 16:10 stanno diventando sempre più popolari anche nei portatili da gioco. Medion segue questa tendenza.
| |||||||||||||||||||||||||
Distribuzione della luminosità: 82 %
Al centro con la batteria: 489 cd/m²
Contrasto: 1223:1 (Nero: 0.4 cd/m²)
ΔE ColorChecker Calman: 2.08 | ∀{0.5-29.43 Ø4.76}
calibrated: 1.27
ΔE Greyscale Calman: 2.6 | ∀{0.09-98 Ø5}
72.5% AdobeRGB 1998 (Argyll 3D)
98% sRGB (Argyll 3D)
70.4% Display P3 (Argyll 3D)
Gamma: 2.205
CCT: 6797 K
| Medion Erazer Major X10 AUO B160QAN03.H, IPS, 2560x1600, 16" | Asus TUF Gaming F17 FX707Z-HX011W AU Optronics B173HAN04.9 (AUO4B9D), IPS, 1920x1080, 17.3" | Acer Nitro 5 AN517-55-738R B173HAN04.0, IPS, 1920x1080, 17.3" | Dell Inspiron 16 Plus 7620 BOE NE16N41, IPS, 3072x1920, 16" | HP Omen 16-c0077ng BOE09E5, IPS, 2560x1440, 16.1" | |
|---|---|---|---|---|---|
| Display | -42% | -15% | 1% | -2% | |
| Display P3 Coverage (%) | 70.4 | 40.2 -43% | 58.9 -16% | 70.8 1% | 68.8 -2% |
| sRGB Coverage (%) | 98 | 59.7 -39% | 86.4 -12% | 99.5 2% | 96.9 -1% |
| AdobeRGB 1998 Coverage (%) | 72.5 | 41.5 -43% | 60.5 -17% | 73.2 1% | 71.1 -2% |
| Response Times | -273% | 16% | -256% | -25% | |
| Response Time Grey 50% / Grey 80% * (ms) | 13.9 ? | 39.2 ? -182% | 6 ? 57% | 38 ? -173% | 13 ? 6% |
| Response Time Black / White * (ms) | 6.4 ? | 29.6 ? -363% | 8 ? -25% | 28 ? -338% | 10 ? -56% |
| PWM Frequency (Hz) | |||||
| Screen | -66% | -36% | 9% | -30% | |
| Brightness middle (cd/m²) | 489 | 287 -41% | 286 -42% | 288.9 -41% | 297 -39% |
| Brightness (cd/m²) | 436 | 268 -39% | 278 -36% | 276 -37% | 283 -35% |
| Brightness Distribution (%) | 82 | 89 9% | 89 9% | 92 12% | 91 11% |
| Black Level * (cd/m²) | 0.4 | 0.17 57% | 0.32 20% | 0.26 35% | 0.22 45% |
| Contrast (:1) | 1223 | 1688 38% | 894 -27% | 1111 -9% | 1350 10% |
| Colorchecker dE 2000 * | 2.08 | 5.1 -145% | 3.05 -47% | 1.88 10% | 3.25 -56% |
| Colorchecker dE 2000 max. * | 4.27 | 8.72 -104% | 5.83 -37% | 4.37 -2% | 6.33 -48% |
| Colorchecker dE 2000 calibrated * | 1.27 | 5.1 -302% | 3.13 -146% | 0.42 67% | 1.11 13% |
| Greyscale dE 2000 * | 2.6 | 4.24 -63% | 3.17 -22% | 1.4 46% | 6.97 -168% |
| Gamma | 2.205 100% | 2.44 90% | 2.29 96% | 2.3 96% | 2.3 96% |
| CCT | 6797 96% | 6008 108% | 6916 94% | 6634 98% | 6050 107% |
| Media totale (Programma / Settaggio) | -127% /
-90% | -12% /
-24% | -82% /
-30% | -19% /
-23% |
* ... Meglio usare valori piccoli
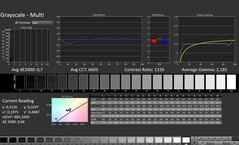
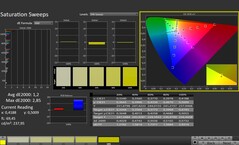
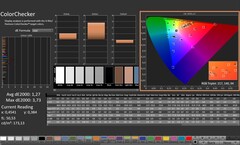
Il display da 165 Hz di AUO (modello B160QAN03.H) è eccezionale sotto quasi tutti i punti di vista. In primo luogo, supera la concorrenza per quanto riguarda la luminosità di picco. Il pannello ha una buona luminosità media di picco di 436 cd/m², che rende il Major X10 adatto all'uso esterno. Per fare un confronto, i concorrenti non raggiungono nemmeno i 300 cd/m².
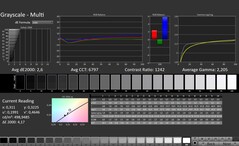
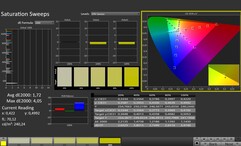
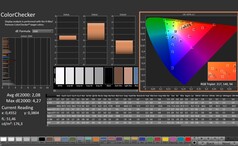
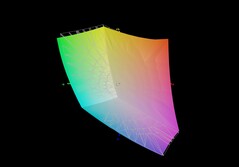
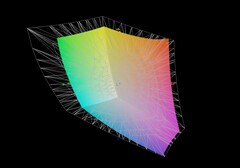
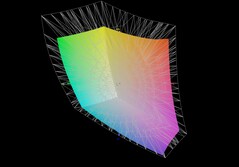
In secondo luogo, il rapporto di contrasto di 1.233:1 è eccellente per un pannello IPS. Tuttavia, è sufficiente per posizionare il portatile a metà del nostro gruppo di confronto. Detto questo, il display è già abbastanza preciso nei colori fin dall'inizio, come dimostrano le misurazioni effettuate con CalMan (vedi screenshot). La copertura dei colori dovrebbe essere in grado di soddisfare la maggior parte dei consumatori: il 98% di copertura sRGB è più che adeguato per un notebook da gioco. Inoltre, lo schermo è in grado di coprire fino al 73% dello spazio colore AdobeRGB e al 70% dello spazio colore P3.
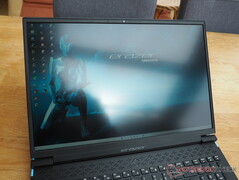
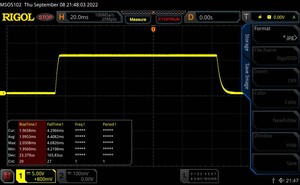
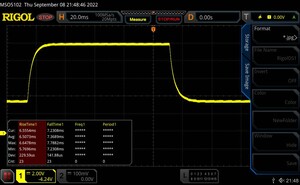
L'angolo di visione è tipico di un pannello IPS. Il nostro dispositivo di misurazione ha riportato tempi di risposta di 6 ms (da nero a bianco) e 14 ms (da grigio a grigio), che non sono male rispetto agli altri portatili del nostro confronto. Tuttavia, è un po' spiacevole che ci sia un evidente bagliore IPS intorno ai bordi. La nostra unità di prova aveva una distribuzione della luminosità di appena l'82%.
Tempi di risposta del Display
| ↔ Tempi di risposta dal Nero al Bianco | ||
|---|---|---|
| 6.4 ms ... aumenta ↗ e diminuisce ↘ combinato | ↗ 2 ms Incremento | |
| ↘ 4.4 ms Calo | ||
| Lo schermo ha mostrato valori di risposta molto veloci nei nostri tests ed è molto adatto per i gaming veloce. In confronto, tutti i dispositivi di test variano da 0.1 (minimo) a 240 (massimo) ms. » 19 % di tutti i dispositivi è migliore. Questo significa che i tempi di risposta rilevati sono migliori rispettto alla media di tutti i dispositivi testati (20.1 ms). | ||
| ↔ Tempo di risposta dal 50% Grigio all'80% Grigio | ||
| 13.9 ms ... aumenta ↗ e diminuisce ↘ combinato | ↗ 6.5 ms Incremento | |
| ↘ 7.4 ms Calo | ||
| Lo schermo mostra buoni tempi di risposta durante i nostri tests, ma potrebbe essere troppo lento per i gamers competitivi. In confronto, tutti i dispositivi di test variano da 0.165 (minimo) a 636 (massimo) ms. » 27 % di tutti i dispositivi è migliore. Questo significa che i tempi di risposta rilevati sono migliori rispettto alla media di tutti i dispositivi testati (31.5 ms). | ||
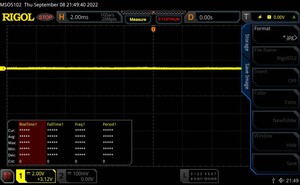
Sfarfallio dello schermo / PWM (Pulse-Width Modulation)
| flickering dello schermo / PWM non rilevato | |||
In confronto: 53 % di tutti i dispositivi testati non utilizza PWM per ridurre la luminosita' del display. Se è rilevato PWM, una media di 8023 (minimo: 5 - massimo: 343500) Hz è stata rilevata. | |||
Prestazioni
Sebbene 32 GB di RAM e 12 GB di VRAM facciano pensare alla fascia alta, classificheremmo il Major X10 solo come una macchina di fascia media a causa delle sue prestazioni grafiche non proprio stellari (analisi più approfondita in seguito). Al prezzo di 1.700 euro (1.728 dollari), il pacchetto complessivo non può essere considerato un grande affare.
Condizioni di prova
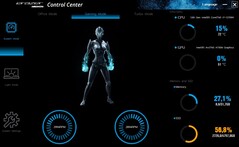
È possibile scegliere tra tre profili nel software Control Center preinstallato. Se non diversamente indicato, le misurazioni sono state effettuate con il Major X10 in modalità Gaming, che dovrebbe essere simile alla modalità Performance di altri portatili. Le impostazioni PL1 e PL2 dei vari profili sono riportate nella tabella seguente.
Processore
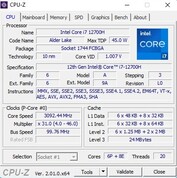
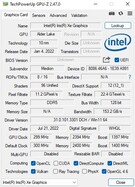
Il Core i7-12700H presente in questo portatile Medion è un processore a 10 nm di ultima generazione della linea Alder Lake di Intel. L'opzione di fascia alta offre 6 core per le prestazioni e 8 per l'efficienza e può gestire fino a 20 thread in parallelo grazie all'Hyper-Threading. Nella nostra serie di test sulla CPU, il Major X10 si è comportato bene anche senza la modalità Turbo attivata. Durante il ciclo Cinebench R15, le sue prestazioni si sono assestate su un livello abbastanza costante, leggermente superiore a quello dei rivali del 12700H. Anche il Ryzen 7 5800H dell'HP Omen 16 non può eguagliare questo livello di prestazioni.
Cinebench R15 Multi Sustained Load
* ... Meglio usare valori piccoli
AIDA64: FP32 Ray-Trace | FPU Julia | CPU SHA3 | CPU Queen | FPU SinJulia | FPU Mandel | CPU AES | CPU ZLib | FP64 Ray-Trace | CPU PhotoWorxx
| Performance rating | |
| Media della classe Gaming | |
| HP Omen 16-c0077ng | |
| Dell Inspiron 16 Plus 7620 | |
| Media Intel Core i7-12700H | |
| Medion Erazer Major X10 | |
| Acer Nitro 5 AN517-55-738R | |
| Asus TUF Gaming F17 FX707Z-HX011W | |
| AIDA64 / FP32 Ray-Trace | |
| Media della classe Gaming (7192 - 85542, n=133, ultimi 2 anni) | |
| HP Omen 16-c0077ng | |
| Dell Inspiron 16 Plus 7620 | |
| Media Intel Core i7-12700H (2585 - 17957, n=64) | |
| Acer Nitro 5 AN517-55-738R | |
| Medion Erazer Major X10 | |
| Asus TUF Gaming F17 FX707Z-HX011W | |
| AIDA64 / FPU Julia | |
| Media della classe Gaming (35040 - 238426, n=133, ultimi 2 anni) | |
| HP Omen 16-c0077ng | |
| Dell Inspiron 16 Plus 7620 | |
| Media Intel Core i7-12700H (12439 - 90760, n=64) | |
| Acer Nitro 5 AN517-55-738R | |
| Medion Erazer Major X10 | |
| Asus TUF Gaming F17 FX707Z-HX011W | |
| AIDA64 / CPU SHA3 | |
| Media della classe Gaming (1728 - 9817, n=133, ultimi 2 anni) | |
| HP Omen 16-c0077ng | |
| Media Intel Core i7-12700H (833 - 4242, n=64) | |
| Dell Inspiron 16 Plus 7620 | |
| Acer Nitro 5 AN517-55-738R | |
| Medion Erazer Major X10 | |
| Asus TUF Gaming F17 FX707Z-HX011W | |
| AIDA64 / CPU Queen | |
| Media della classe Gaming (49785 - 173351, n=133, ultimi 2 anni) | |
| Asus TUF Gaming F17 FX707Z-HX011W | |
| HP Omen 16-c0077ng | |
| Acer Nitro 5 AN517-55-738R | |
| Medion Erazer Major X10 | |
| Media Intel Core i7-12700H (57923 - 103202, n=63) | |
| Dell Inspiron 16 Plus 7620 | |
| AIDA64 / FPU SinJulia | |
| Media della classe Gaming (4424 - 33636, n=133, ultimi 2 anni) | |
| HP Omen 16-c0077ng | |
| Medion Erazer Major X10 | |
| Acer Nitro 5 AN517-55-738R | |
| Media Intel Core i7-12700H (3249 - 9939, n=64) | |
| Dell Inspiron 16 Plus 7620 | |
| Asus TUF Gaming F17 FX707Z-HX011W | |
| AIDA64 / FPU Mandel | |
| Media della classe Gaming (17585 - 128721, n=133, ultimi 2 anni) | |
| HP Omen 16-c0077ng | |
| Dell Inspiron 16 Plus 7620 | |
| Media Intel Core i7-12700H (7135 - 44760, n=64) | |
| Acer Nitro 5 AN517-55-738R | |
| Medion Erazer Major X10 | |
| Asus TUF Gaming F17 FX707Z-HX011W | |
| AIDA64 / CPU AES | |
| HP Omen 16-c0077ng | |
| Media della classe Gaming (19065 - 247074, n=133, ultimi 2 anni) | |
| Media Intel Core i7-12700H (31839 - 144360, n=64) | |
| Dell Inspiron 16 Plus 7620 | |
| Acer Nitro 5 AN517-55-738R | |
| Medion Erazer Major X10 | |
| Asus TUF Gaming F17 FX707Z-HX011W | |
| AIDA64 / CPU ZLib | |
| Media della classe Gaming (373 - 2531, n=133, ultimi 2 anni) | |
| Dell Inspiron 16 Plus 7620 | |
| Media Intel Core i7-12700H (305 - 1171, n=64) | |
| Medion Erazer Major X10 | |
| Acer Nitro 5 AN517-55-738R | |
| HP Omen 16-c0077ng | |
| Asus TUF Gaming F17 FX707Z-HX011W | |
| AIDA64 / FP64 Ray-Trace | |
| Media della classe Gaming (3856 - 45446, n=133, ultimi 2 anni) | |
| HP Omen 16-c0077ng | |
| Dell Inspiron 16 Plus 7620 | |
| Media Intel Core i7-12700H (1437 - 9692, n=64) | |
| Acer Nitro 5 AN517-55-738R | |
| Medion Erazer Major X10 | |
| Asus TUF Gaming F17 FX707Z-HX011W | |
| AIDA64 / CPU PhotoWorxx | |
| Media della classe Gaming (10805 - 62916, n=133, ultimi 2 anni) | |
| Medion Erazer Major X10 | |
| Dell Inspiron 16 Plus 7620 | |
| Media Intel Core i7-12700H (12863 - 52207, n=64) | |
| Asus TUF Gaming F17 FX707Z-HX011W | |
| HP Omen 16-c0077ng | |
| Acer Nitro 5 AN517-55-738R | |
Prestazioni del sistema
In termini di prestazioni di sistema, il portatile da 16 pollici ha conquistato il terzo posto nel nostro confronto con un eccellente punteggio di 6.830 in PCMark. In base alle nostre impressioni soggettive, il sistema operativo è reattivo e fluido.
CrossMark: Overall | Productivity | Creativity | Responsiveness
| PCMark 10 / Score | |
| Media della classe Gaming (5776 - 10060, n=113, ultimi 2 anni) | |
| HP Omen 16-c0077ng | |
| Dell Inspiron 16 Plus 7620 | |
| Media Intel Core i7-12700H, Intel Arc A730M (6830 - 6845, n=2) | |
| Medion Erazer Major X10 | |
| Acer Nitro 5 AN517-55-738R | |
| Asus TUF Gaming F17 FX707Z-HX011W | |
| PCMark 10 / Essentials | |
| Medion Erazer Major X10 | |
| Media Intel Core i7-12700H, Intel Arc A730M (10529 - 11116, n=2) | |
| Media della classe Gaming (8810 - 12600, n=117, ultimi 2 anni) | |
| HP Omen 16-c0077ng | |
| Dell Inspiron 16 Plus 7620 | |
| Acer Nitro 5 AN517-55-738R | |
| Asus TUF Gaming F17 FX707Z-HX011W | |
| PCMark 10 / Productivity | |
| Media della classe Gaming (6662 - 16716, n=115, ultimi 2 anni) | |
| HP Omen 16-c0077ng | |
| Acer Nitro 5 AN517-55-738R | |
| Dell Inspiron 16 Plus 7620 | |
| Medion Erazer Major X10 | |
| Media Intel Core i7-12700H, Intel Arc A730M (7070 - 7260, n=2) | |
| Asus TUF Gaming F17 FX707Z-HX011W | |
| PCMark 10 / Digital Content Creation | |
| Media della classe Gaming (7440 - 19351, n=115, ultimi 2 anni) | |
| Media Intel Core i7-12700H, Intel Arc A730M (10714 - 11691, n=2) | |
| Medion Erazer Major X10 | |
| HP Omen 16-c0077ng | |
| Asus TUF Gaming F17 FX707Z-HX011W | |
| Dell Inspiron 16 Plus 7620 | |
| Acer Nitro 5 AN517-55-738R | |
| CrossMark / Overall | |
| Media della classe Gaming (1247 - 2344, n=113, ultimi 2 anni) | |
| Media Intel Core i7-12700H, Intel Arc A730M (n=1) | |
| Acer Nitro 5 AN517-55-738R | |
| Dell Inspiron 16 Plus 7620 | |
| Asus TUF Gaming F17 FX707Z-HX011W | |
| CrossMark / Productivity | |
| Media della classe Gaming (1299 - 2211, n=113, ultimi 2 anni) | |
| Media Intel Core i7-12700H, Intel Arc A730M (n=1) | |
| Acer Nitro 5 AN517-55-738R | |
| Dell Inspiron 16 Plus 7620 | |
| Asus TUF Gaming F17 FX707Z-HX011W | |
| CrossMark / Creativity | |
| Media della classe Gaming (1275 - 2729, n=113, ultimi 2 anni) | |
| Asus TUF Gaming F17 FX707Z-HX011W | |
| Media Intel Core i7-12700H, Intel Arc A730M (n=1) | |
| Dell Inspiron 16 Plus 7620 | |
| Acer Nitro 5 AN517-55-738R | |
| CrossMark / Responsiveness | |
| Media Intel Core i7-12700H, Intel Arc A730M (n=1) | |
| Acer Nitro 5 AN517-55-738R | |
| Media della classe Gaming (1030 - 2330, n=113, ultimi 2 anni) | |
| Dell Inspiron 16 Plus 7620 | |
| Asus TUF Gaming F17 FX707Z-HX011W | |
| PCMark 10 Score | 6830 punti | |
Aiuto | ||
| AIDA64 / Memory Copy | |
| Media della classe Gaming (21750 - 108104, n=133, ultimi 2 anni) | |
| Medion Erazer Major X10 | |
| Dell Inspiron 16 Plus 7620 | |
| Media Intel Core i7-12700H (25615 - 80511, n=64) | |
| Asus TUF Gaming F17 FX707Z-HX011W | |
| Acer Nitro 5 AN517-55-738R | |
| HP Omen 16-c0077ng | |
| AIDA64 / Memory Read | |
| Media della classe Gaming (22956 - 104349, n=133, ultimi 2 anni) | |
| Medion Erazer Major X10 | |
| Asus TUF Gaming F17 FX707Z-HX011W | |
| Dell Inspiron 16 Plus 7620 | |
| Media Intel Core i7-12700H (25586 - 79442, n=64) | |
| HP Omen 16-c0077ng | |
| Acer Nitro 5 AN517-55-738R | |
| AIDA64 / Memory Write | |
| Media della classe Gaming (22297 - 133486, n=133, ultimi 2 anni) | |
| Medion Erazer Major X10 | |
| Asus TUF Gaming F17 FX707Z-HX011W | |
| Dell Inspiron 16 Plus 7620 | |
| Media Intel Core i7-12700H (23679 - 88660, n=64) | |
| Acer Nitro 5 AN517-55-738R | |
| HP Omen 16-c0077ng | |
| AIDA64 / Memory Latency | |
| Media della classe Gaming (59.5 - 259, n=133, ultimi 2 anni) | |
| Dell Inspiron 16 Plus 7620 | |
| HP Omen 16-c0077ng | |
| Media Intel Core i7-12700H (76.2 - 133.9, n=62) | |
| Asus TUF Gaming F17 FX707Z-HX011W | |
| Acer Nitro 5 AN517-55-738R | |
* ... Meglio usare valori piccoli
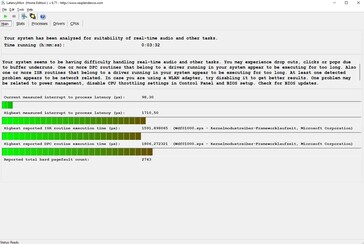
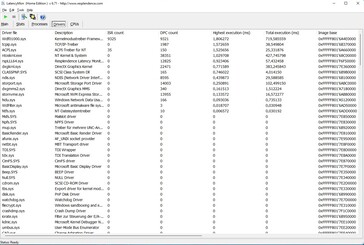
Latenza DPC
| DPC Latencies / LatencyMon - interrupt to process latency (max), Web, Youtube, Prime95 | |
| Asus TUF Gaming F17 FX707Z-HX011W | |
| HP Omen 16-c0077ng | |
| Medion Erazer Major X10 | |
| Acer Nitro 5 AN517-55-738R | |
| Dell Inspiron 16 Plus 7620 | |
* ... Meglio usare valori piccoli
Memoria di massa
Il Major X10 ospita un'unità SSD NVMe con una velocità superiore alla media che renderà nervosi i concorrenti. Ha un'eccellente velocità di lettura e scrittura sequenziale, rispettivamente di oltre 5.000 MB/s e 4.000 MB/s (ottenuta con AS SSD Benchmark). È presente anche un secondo slot PCIe M.2 che consente di espandere comodamente lo spazio di archiviazione se necessario in futuro.
| Drive Performance rating - Percent | |
| Medion Erazer Major X10 | |
| Media della classe Gaming | |
| Acer Nitro 5 AN517-55-738R | |
| HP Omen 16-c0077ng | |
| Asus TUF Gaming F17 FX707Z-HX011W | |
| Dell Inspiron 16 Plus 7620 | |
* ... Meglio usare valori piccoli
Sustained Performance Read: DiskSpd Read Loop, Queue Depth 8
Scheda grafica
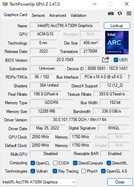
Siamo arrivati alla parte più interessante del Major X10: la sua scheda grafica. È la prima volta che un Intel Arc A730M (24 core Xe e 24 unità Ray Tracing) approda sul nostro testbench. La GPU Intel ha ottime prestazioni quando si tratta di benchmark grafici sintetici. Nei test 3DMark, supera in modo significativo la RTX 3050 Ti di GeForce ed è allo stesso livello della RTX 3060 di GeForce e della Radeon RX 6600M. Con la modalità Turbo attivata, il laptop Medion è stato in grado di ottenere quasi il 20% di prestazioni in più dalla GPU e di superare in velocità gli altri dispositivi del nostro confronto. Ulteriori risultati dei benchmark sono disponibili nella la nostra pagina sull'Arc A730M.
| 3DMark Performance rating - Percent | |
| Media della classe Gaming | |
| Medion Erazer Major X10 Turbo Mode | |
| HP Omen 16-c0077ng -1! | |
| Asus TUF Gaming F17 FX707Z-HX011W -1! | |
| Media Intel Arc A730M | |
| Acer Nitro 5 AN517-55-738R | |
| Medion Erazer Major X10 | |
| Dell Inspiron 16 Plus 7620 -1! | |
| 3DMark 11 - 1280x720 Performance GPU | |
| Media della classe Gaming (16033 - 80022, n=129, ultimi 2 anni) | |
| HP Omen 16-c0077ng | |
| Medion Erazer Major X10 Turbo Mode | |
| Asus TUF Gaming F17 FX707Z-HX011W | |
| Media Intel Arc A730M (24928 - 31551, n=4) | |
| Acer Nitro 5 AN517-55-738R | |
| Medion Erazer Major X10 | |
| Dell Inspiron 16 Plus 7620 | |
| 3DMark | |
| 1920x1080 Fire Strike Graphics | |
| Media della classe Gaming (12242 - 62849, n=141, ultimi 2 anni) | |
| HP Omen 16-c0077ng | |
| Asus TUF Gaming F17 FX707Z-HX011W | |
| Medion Erazer Major X10 Turbo Mode | |
| Acer Nitro 5 AN517-55-738R | |
| Media Intel Arc A730M (19850 - 22620, n=4) | |
| Medion Erazer Major X10 | |
| Dell Inspiron 16 Plus 7620 | |
| 2560x1440 Time Spy Graphics | |
| Media della classe Gaming (4310 - 25984, n=138, ultimi 2 anni) | |
| Medion Erazer Major X10 Turbo Mode | |
| Asus TUF Gaming F17 FX707Z-HX011W | |
| Media Intel Arc A730M (7212 - 10352, n=4) | |
| Medion Erazer Major X10 | |
| Acer Nitro 5 AN517-55-738R | |
| HP Omen 16-c0077ng | |
| Dell Inspiron 16 Plus 7620 | |
| 2560x1440 Port Royal Graphics | |
| Media della classe Gaming (984 - 16978, n=78, ultimi 2 anni) | |
| Medion Erazer Major X10 Turbo Mode | |
| Acer Nitro 5 AN517-55-738R | |
| Media Intel Arc A730M (3758 - 5678, n=3) | |
| Medion Erazer Major X10 | |
| 3DMark 06 Standard Score | 46579 punti | |
| 3DMark Vantage P Result | 63844 punti | |
| 3DMark 11 Performance | 24223 punti | |
| 3DMark Ice Storm Standard Score | 119799 punti | |
| 3DMark Cloud Gate Standard Score | 44757 punti | |
| 3DMark Fire Strike Score | 18543 punti | |
| 3DMark Time Spy Score | 9041 punti | |
Aiuto | ||
Prestazioni di gioco
Al contrario, la GPU ha presentato un quadro molto eterogeneo nei benchmark di gioco. Anche se a volte l'Arc A730M è in grado di sfidare la RTX 3060 e la RX 6600M, spesso si aggira intorno al livello di prestazioni della RTX 3050 Ti di GeForce, che di solito si trova in portatili da gioco molto più economici. Nel caso peggiore, l'Arc A730M è addirittura più lento della RTX 3050 Ti. Questo è piuttosto deludente considerando il prezzo e le specifiche della GPU (12 GB contro 4 GB di VRAM). Intel dovrebbe continuare a migliorare il supporto dei driver. Analogamente a quanto abbiamo visto con le iGPU, alcuni giochi sono stati eseguiti con artefatti visivi o altri problemi vari. Abbiamo anche avuto a che fare con occasionali crash. Detto questo, la commutazione grafica sembra funzionare bene. Tutti i giochi utilizzati nei nostri test sono stati assegnati direttamente alla dGPU. Fondamentalmente, l'Arc A730M è più o meno progettato per gli schermi Full HD. A una risoluzione di 1.920 x 1.080, quasi tutti i giochi funzionavano senza problemi con dettagli impostati su alti o altissimi. Nel frattempo, risoluzioni più elevate (come quella nativa di 2.560 x 1.600) portano la GPU Intel ai suoi limiti. Per ulteriori confronti tra le GPU, potete consultare il nostro elenco di giochi https://www.notebookcheck.net/Computer-Games-on-Laptop-Graphics-Cards.13849.0.html.
| The Witcher 3 | |
| 1920x1080 High Graphics & Postprocessing (Nvidia HairWorks Off) | |
| Media della classe Gaming (138 - 424, n=24, ultimi 2 anni) | |
| Asus TUF Gaming F17 FX707Z-HX011W | |
| Acer Nitro 5 AN517-55-738R | |
| HP Omen 16-c0077ng | |
| Medion Erazer Major X10 | |
| Dell Inspiron 16 Plus 7620 | |
| 1920x1080 Ultra Graphics & Postprocessing (HBAO+) | |
| Media della classe Gaming (80.2 - 240, n=36, ultimi 2 anni) | |
| Asus TUF Gaming F17 FX707Z-HX011W | |
| HP Omen 16-c0077ng | |
| Acer Nitro 5 AN517-55-738R | |
| Dell Inspiron 16 Plus 7620 | |
| Medion Erazer Major X10 | |
Abbiamo corso Il Witcher 3sul portatile per un'ora per verificare la tenuta delle prestazioni 3D su un periodo più lungo. Il risultato: non ci sono stati cali di prestazioni o problemi simili.
Witcher 3 FPS graph
| basso | medio | alto | ultra | QHD | |
|---|---|---|---|---|---|
| GTA V (2015) | 165.9 | 100.3 | 42.8 | ||
| The Witcher 3 (2015) | 212 | 114 | 49.4 | ||
| Dota 2 Reborn (2015) | 109.3 | 94.2 | 90.4 | 80.4 | |
| Final Fantasy XV Benchmark (2018) | 71 | 49.7 | |||
| X-Plane 11.11 (2018) | 57.3 | 47.1 | 38.6 | ||
| Far Cry 5 (2018) | 92 | 83 | 78 | ||
| Strange Brigade (2018) | 178.2 | 148.8 | 124.1 | ||
| Hunt Showdown (2020) | 88.2 | 72.3 | 50.1 | ||
| Doom Eternal (2020) | 112.4 | 104.2 | 101.7 | 70.9 | |
| Gears Tactics (2020) | 147 | 99.2 | 79.7 | 52 | |
| Death Stranding (2020) | 89.8 | 82.9 | 81.9 | 60 | |
| Crysis Remastered (2020) | 125.4 | 60.7 | 50.1 | 34.8 | |
| Serious Sam 4 (2020) | 72.7 | 54.8 | 42.5 | 34.7 | |
| Mafia Definitive Edition (2020) | 55.4 | 52.7 | 36.9 | ||
| Star Wars Squadrons (2020) | 167.1 | 149.4 | 140.6 | 97.4 | |
| Watch Dogs Legion (2020) | 85 | 75 | 48 | 35 | |
| Dirt 5 (2020) | 80.6 | 64.5 | 54 | 44.2 | |
| Assassin´s Creed Valhalla (2020) | 64 | 54 | 48 | 37 | |
| Yakuza Like a Dragon (2020) | 51.3 | 47.3 | 46.1 | 39.4 | |
| Hitman 3 (2021) | 123 | 109 | 102 | 65 | |
| Outriders (2021) | 90 | 76.1 | 69 | 43.9 | |
| Resident Evil Village (2021) | 119.9 | 107.8 | 93.3 | 61.1 | |
| Mass Effect Legendary Edition (2021) | 88.5 | 81.9 | |||
| Days Gone (2021) | 80.2 | 76 | 58.2 | 42 | |
| Deathloop (2021) | 76.2 | 65.5 | 54.6 | 37 | |
| Alan Wake Remastered (2021) | 116.7 | 98.6 | 67.5 | ||
| Far Cry 6 (2021) | 87 | 75 | 65 | 47 | |
| Back 4 Blood (2021) | 132.9 | 115.4 | 105.9 | 68.3 | |
| Guardians of the Galaxy (2021) | 81 | 76 | 73 | 52 | |
| Riders Republic (2021) | 60 | 51 | 47 | 34 | |
| Forza Horizon 5 (2021) | 86 | 80 | 50 | 41 | |
| Farming Simulator 22 (2021) | 136.6 | 110.8 | 107.2 | 80.5 | |
| Halo Infinite (2021) | 67.2 | 59.8 | 56.2 | 42.3 | |
| God of War (2022) | 53.1 | 44.9 | 36.9 | 30.7 | |
| Rainbow Six Extraction (2022) | 103 | 99 | 83 | 55 | |
| Dying Light 2 (2022) | 60.9 | 51.2 | 35.6 | ||
| GRID Legends (2022) | 109 | 91 | 71 | 56.9 | |
| Elden Ring (2022) | 59.9 | 59.7 | 56.9 | 46.2 | |
| Cyberpunk 2077 1.6 (2022) | 71 | 57.5 | 57.4 | 30.9 | |
| Elex 2 (2022) | 49.7 | 48.8 | 43.3 | 36.5 | |
| Ghostwire Tokyo (2022) | 85.4 | 83.6 | 83.3 | 52.3 | |
| Tiny Tina's Wonderlands (2022) | 86.6 | 64.6 | 52 | 35.5 | |
| Vampire Bloodhunt (2022) | 135.8 | 121.5 | 111.9 | 71.4 | |
| F1 22 (2022) | 124 | 104 | 35 | 23.4 | |
| The Quarry (2022) | 58.9 | 47.5 | 38.1 | 24.8 |
Emissioni
Emissioni acustiche
Il Major X10 è chiaramente udibile quando funziona in modalità Gaming. I livelli di rumore possono raggiungere i 49-51 dB(A) sotto carico, che molti utenti probabilmente considereranno fastidiosi. Detto questo, altri portatili da gioco possono essere altrettanto rumorosi o addirittura più rumorosi del Major X10. Raccomandiamo quindi di utilizzare delle cuffie. Al minimo, il dispositivo produce da 30 a 31 dB(A) di rumore, che è abbastanza evidente ma non particolarmente silenzioso. Il notebook da 16 pollici raramente è completamente silenzioso, poiché le ventole sono sempre in funzione.
Rumorosità
| Idle |
| 25 / 30 / 31 dB(A) |
| Sotto carico |
| 49 / 51 dB(A) |
 | ||
30 dB silenzioso 40 dB(A) udibile 50 dB(A) rumoroso |
||
min: | ||
| Medion Erazer Major X10 i7-12700H, A730M | Asus TUF Gaming F17 FX707Z-HX011W i7-12700H, GeForce RTX 3060 Laptop GPU | Acer Nitro 5 AN517-55-738R i7-12700H, GeForce RTX 3060 Laptop GPU | Dell Inspiron 16 Plus 7620 i7-12700H, GeForce RTX 3050 Ti Laptop GPU | HP Omen 16-c0077ng R7 5800H, Radeon RX 6600M | |
|---|---|---|---|---|---|
| Noise | 11% | -3% | 4% | -6% | |
| off /ambiente * (dB) | 25 | 24 4% | 25.5 -2% | 23.3 7% | 25 -0% |
| Idle Minimum * (dB) | 25 | 24 4% | 25.5 -2% | 25.7 -3% | 25 -0% |
| Idle Average * (dB) | 30 | 24 20% | 25.5 15% | 26.1 13% | 31.2 -4% |
| Idle Maximum * (dB) | 31 | 24 23% | 27 13% | 30.6 1% | 33.8 -9% |
| Load Average * (dB) | 49 | 42.6 13% | 52.6 -7% | 46.2 6% | 55.4 -13% |
| Witcher 3 ultra * (dB) | 50 | 46.84 6% | 49.2 2% | ||
| Load Maximum * (dB) | 51 | 46.84 8% | 68.2 -34% | 49.4 3% | 56 -10% |
* ... Meglio usare valori piccoli
Temperatura
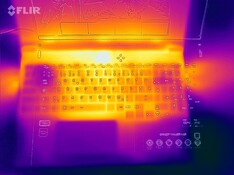
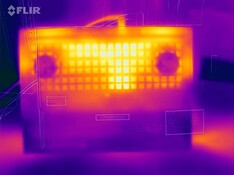
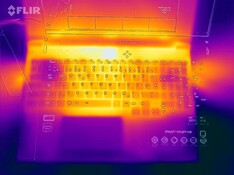
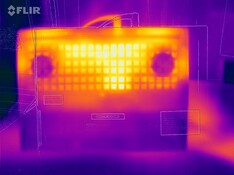
La temperatura del telaio ci ha lasciato sensazioni contrastanti. Da un lato, lo chassis è più caldo dei suoi concorrenti al minimo, raggiungendo i 45°C (113°F) nella parte superiore e i 48°C (118°F) in quella inferiore. D'altra parte, non si scalda troppo quando il dispositivo funziona a pieno carico. Ciononostante, è consigliabile non appoggiare il dispositivo sulle ginocchia durante le sessioni di gioco.
(±) La temperatura massima sul lato superiore è di 45 °C / 113 F, rispetto alla media di 40.4 °C / 105 F, che varia da 21.2 a 68.8 °C per questa classe Gaming.
(-) Il lato inferiore si riscalda fino ad un massimo di 48 °C / 118 F, rispetto alla media di 43.3 °C / 110 F
(±) In idle, la temperatura media del lato superiore è di 32.7 °C / 91 F, rispetto alla media deld ispositivo di 33.9 °C / 93 F.
(-) Riproducendo The Witcher 3, la temperatura media per il lato superiore e' di 40.9 °C / 106 F, rispetto alla media del dispositivo di 33.9 °C / 93 F.
(±) I poggiapolsi e il touchpad possono diventare molto caldi al tatto con un massimo di 38 °C / 100.4 F.
(-) La temperatura media della zona del palmo della mano di dispositivi simili e'stata di 28.8 °C / 83.8 F (-9.2 °C / -16.6 F).
| Medion Erazer Major X10 i7-12700H, A730M | Asus TUF Gaming F17 FX707Z-HX011W i7-12700H, GeForce RTX 3060 Laptop GPU | Acer Nitro 5 AN517-55-738R i7-12700H, GeForce RTX 3060 Laptop GPU | Dell Inspiron 16 Plus 7620 i7-12700H, GeForce RTX 3050 Ti Laptop GPU | HP Omen 16-c0077ng R7 5800H, Radeon RX 6600M | |
|---|---|---|---|---|---|
| Heat | 6% | 1% | 12% | 15% | |
| Maximum Upper Side * (°C) | 45 | 52 -16% | 48.3 -7% | 46 -2% | 40.6 10% |
| Maximum Bottom * (°C) | 48 | 47 2% | 52 -8% | 45.8 5% | 36 25% |
| Idle Upper Side * (°C) | 38 | 31 18% | 34.5 9% | 29.2 23% | 31.3 18% |
| Idle Bottom * (°C) | 39 | 31 21% | 35.8 8% | 31 21% | 36 8% |
* ... Meglio usare valori piccoli
Test da sforzo
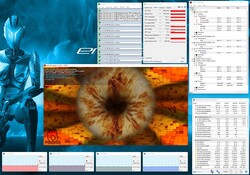
Analogamente al test Witcher 3, l'Arc A730M ha completato lo stress test di un'ora (con FurMark e Prime95) con una temperatura media di circa 65°C (149°F). Nel frattempo, il Core i7-12700H ha superato il test con una temperatura di poco superiore ai 70°C (158°F), un valore assolutamente sicuro per la CPU.
Medion Erazer Major X10 analisi audio
(+) | gli altoparlanti sono relativamente potenti (82 dB)
Bassi 100 - 315 Hz
(-) | quasi nessun basso - in media 16.1% inferiori alla media
(±) | la linearità dei bassi è media (12.9% delta rispetto alla precedente frequenza)
Medi 400 - 2000 Hz
(±) | medi elevati - circa 6.9% superiore alla media
(+) | medi lineari (4.3% delta rispetto alla precedente frequenza)
Alti 2 - 16 kHz
(+) | Alti bilanciati - appena 3.2% dalla media
(+) | alti lineari (6.7% delta rispetto alla precedente frequenza)
Nel complesso 100 - 16.000 Hz
(±) | la linearità complessiva del suono è media (17.5% di differenza rispetto alla media
Rispetto alla stessa classe
» 48% di tutti i dispositivi testati in questa classe è stato migliore, 12% simile, 40% peggiore
» Il migliore ha avuto un delta di 6%, medio di 18%, peggiore di 132%
Rispetto a tutti i dispositivi testati
» 33% di tutti i dispositivi testati in questa classe è stato migliore, 8% similare, 58% peggiore
» Il migliore ha avuto un delta di 4%, medio di 24%, peggiore di 134%
Asus TUF Gaming F17 FX707Z-HX011W analisi audio
(±) | potenza degli altiparlanti media ma buona (79.5 dB)
Bassi 100 - 315 Hz
(±) | bassi ridotti - in media 13.1% inferiori alla media
(±) | la linearità dei bassi è media (9% delta rispetto alla precedente frequenza)
Medi 400 - 2000 Hz
(±) | medi elevati - circa 9.1% superiore alla media
(±) | linearità dei medi adeguata (7.8% delta rispetto alla precedente frequenza)
Alti 2 - 16 kHz
(+) | Alti bilanciati - appena 3.9% dalla media
(±) | la linearità degli alti è media (9.1% delta rispetto alla precedente frequenza)
Nel complesso 100 - 16.000 Hz
(±) | la linearità complessiva del suono è media (20.4% di differenza rispetto alla media
Rispetto alla stessa classe
» 72% di tutti i dispositivi testati in questa classe è stato migliore, 6% simile, 23% peggiore
» Il migliore ha avuto un delta di 6%, medio di 18%, peggiore di 132%
Rispetto a tutti i dispositivi testati
» 53% di tutti i dispositivi testati in questa classe è stato migliore, 8% similare, 39% peggiore
» Il migliore ha avuto un delta di 4%, medio di 24%, peggiore di 134%
Altoparlanti
La qualità del suono del Major X10 è nella media dei portatili da gioco. Come spesso accade, gli altoparlanti mancano di bassi. Pertanto, se si desidera ascoltare musica e video con il portatile, è consigliabile dotarsi di un paio di cuffie.
Gestione dell'alimentazione
Consumo di energia
È difficile capire perché Medion abbia incluso un ingombrante alimentatore da 300 watt con il portatile. Il Major X10 ha utilizzato non più di 220 watt durante il nostro stress test, suggerendo che un caricatore più compatto da 230 watt avrebbe avuto più senso. Sotto carico, il dispositivo consuma da 122 a 220 watt, un valore simile a quello dei laptop dotati di RTX 3060. Tuttavia, l'elevato consumo di energia in idle, da 24 a 36 watt, lo colloca saldamente in fondo al gruppo di confronto.
| Off / Standby | |
| Idle | |
| Sotto carico |
|
Leggenda:
min: | |
| Medion Erazer Major X10 i7-12700H, A730M | Asus TUF Gaming F17 FX707Z-HX011W i7-12700H, GeForce RTX 3060 Laptop GPU | Acer Nitro 5 AN517-55-738R i7-12700H, GeForce RTX 3060 Laptop GPU | Dell Inspiron 16 Plus 7620 i7-12700H, GeForce RTX 3050 Ti Laptop GPU | HP Omen 16-c0077ng R7 5800H, Radeon RX 6600M | Media della classe Gaming | |
|---|---|---|---|---|---|---|
| Power Consumption | 33% | 23% | 43% | 13% | 18% | |
| Idle Minimum * (Watt) | 24 | 6.6 73% | 9.7 60% | 6.8 72% | 12 50% | 13.7 ? 43% |
| Idle Average * (Watt) | 26 | 8.3 68% | 14.6 44% | 9.6 63% | 12.8 51% | 19.5 ? 25% |
| Idle Maximum * (Watt) | 36 | 11.8 67% | 16.7 54% | 17 53% | 18.5 49% | 25.6 ? 29% |
| Load Average * (Watt) | 122 | 119 2% | 166 -36% | 117.5 4% | 190 -56% | 110.3 ? 10% |
| Witcher 3 ultra * (Watt) | 155.6 | 169 -9% | 113.1 27% | 194 -25% | ||
| Load Maximum * (Watt) | 220 | 222 -1% | 235 -7% | 137.4 38% | 200 9% | 257 ? -17% |
* ... Meglio usare valori piccoli
Power consumption Witcher 3 / Stress test
Power consumption with external monitor
Durata della batteria
Nonostante la discreta capacità della batteria (80 Wh), il Major X10 non ha una grande resistenza e spesso rimane indietro rispetto alla concorrenza. Ciononostante, ha avuto una durata piuttosto rispettabile di 6,5 ore quando lo abbiamo utilizzato per navigare in Internet tramite Wi-Fi con una luminosità media dello schermo.
| Medion Erazer Major X10 i7-12700H, A730M, 80 Wh | Asus TUF Gaming F17 FX707Z-HX011W i7-12700H, GeForce RTX 3060 Laptop GPU, 90 Wh | Acer Nitro 5 AN517-55-738R i7-12700H, GeForce RTX 3060 Laptop GPU, 90.61 Wh | Dell Inspiron 16 Plus 7620 i7-12700H, GeForce RTX 3050 Ti Laptop GPU, 86 Wh | HP Omen 16-c0077ng R7 5800H, Radeon RX 6600M, 70 Wh | Media della classe Gaming | |
|---|---|---|---|---|---|---|
| Autonomia della batteria | 109% | 59% | 73% | -9% | 32% | |
| Reader / Idle (h) | 8.2 | 11.7 43% | 18.6 127% | 9.23 ? 13% | ||
| WiFi v1.3 (h) | 6.7 | 8.7 30% | 6.5 -3% | 9.6 43% | 6.1 -9% | 6.7 ? 0% |
| Load (h) | 0.8 | 2.3 187% | 1.9 137% | 1.2 50% | 1.472 ? 84% | |
| H.264 (h) | 7.7 | 5.3 | 7 | 7.93 ? | ||
| Witcher 3 ultra (h) | 1.4 | 0.958 ? |
Pro
Contro
Il verdetto
Troppo costoso per le prestazioni di gioco che offre: ecco come potrebbe essere riassunto in poche parole il Medion Erazer Major X10
Mentre l'Intel Arc A730M si comporta relativamente bene nei benchmark sintetici e combatte bene contro le GeForce RTX 3060 e Radeon RX 6600M, le sue varie debolezze e i suoi limiti prestazionali diventano evidenti nel gioco vero e proprio, con livelli di prestazioni pari o addirittura peggiori di una GeForce RTX 3050 Ti. Pertanto, è difficile raccomandare l'Arc A730M in termini di rapporto qualità-prezzo, soprattutto considerando che la sua efficienza energetica lascia ancora a desiderare
Per il resto, il Major X10 è abbastanza impressionante per la maggior parte. In particolare, lo schermo da 16 pollici offre un motivo convincente per acquistare il portatile grazie al rapporto di aspetto 16:10, all'alta risoluzione (2.560 x 1.600), all'elevata luminosità di picco e all'ottima riproduzione dei colori.
Nel complesso, raccomanderemmo il Major X10 solo ai fan più accaniti di Intel o a coloro che sono estremamente esigenti in fatto di display. Tutti gli altri giocatori che devono o vogliono tenere sotto controllo il loro budget dovrebbero probabilmente dare un'occhiata a un laptop con RTX 3060 o una GPU con prestazioni simili. Medion offre attualmente alcuni dispositivi con tali specifiche (senza contare che spesso sono più economici).
Prezzo e disponibilità
L'Erazer Major X10 con Core i7-12700H, Arc A730M, 32 GB di RAM e 1 TB di memoria SSD costa circa 1.700 euro (1.728 dollari) e può essere acquistato presso il negozio online tedesco Medion. Al momento di questa recensione, il portatile non è ancora disponibile in altre regioni.
Medion Erazer Major X10
- 09/12/2022 v7 (old)
Florian Glaser


