Recensione del Dell Inspiron 16 Plus 7620: Il portatile multimediale che fa tutto
Il Dell Inspiron 16 Plus 7620 del 2022 succede direttamente al 2021 Inspiron 16 Plus 7610 introducendo CPU di 12a generazione e GPU RTX GeForce più veloci per sostituire le CPU di 11a generazione del modello dello scorso anno. Il produttore ha anche rivisto lo chassis per ottenere un aspetto diverso dopo appena un anno di presenza sul mercato della serie.
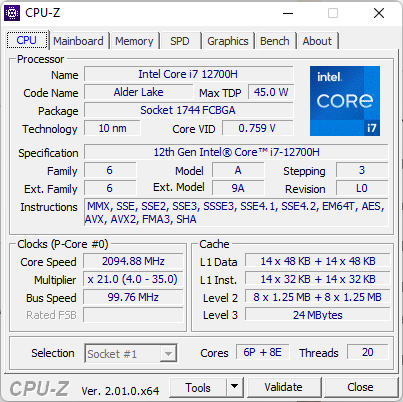
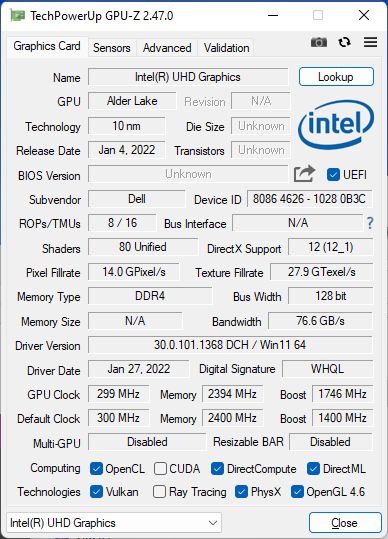
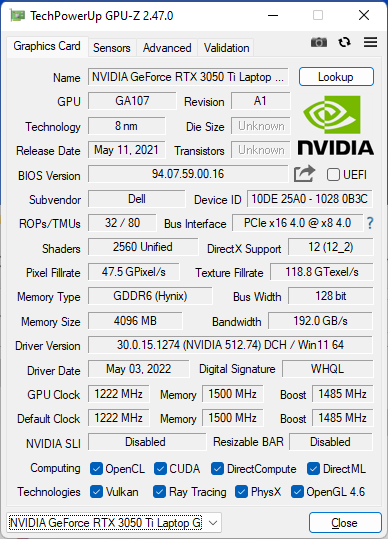
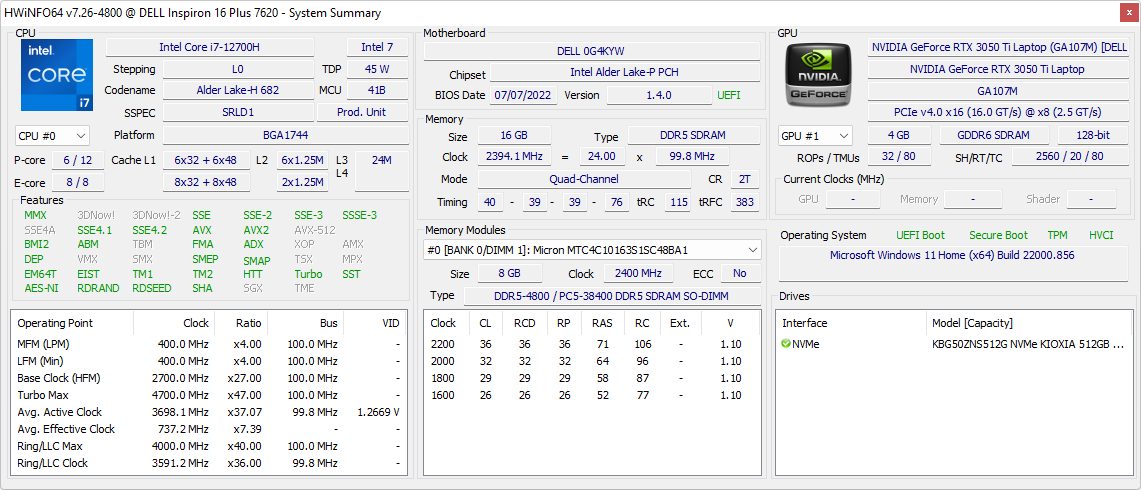
La nostra unità di prova è configurata con CPU Alder Lake-H Core i7-12700H, GPU RTX 3050 Ti da 65 W GeForce e display IPS 16:10 3072 x 1280 per circa 1400 dollari. Sono disponibili anche altre SKU con Core i5-12500H, RTX 3060 da 60 W e schermo touchscreen 1920 x 1200. Esiste anche una versione 2-in-1 del modello, denominata Inspiron 16 Plus 7620 2-in-1.
I concorrenti in questo spazio includono altri portatili multimediali o creator da 16 pollici di fascia media o alta come Lenovo Yoga 7 16IAP7, Huawei MateBook D 16, Acer Swift X, Asus Vivobook Pro 16X, o anche MSI Creator Z16.
Altre recensioni Dell:
Potenziali concorrenti a confronto
Punteggio | Data | Modello | Peso | Altezza | Dimensione | Risoluzione | Prezzo |
|---|---|---|---|---|---|---|---|
| 87.4 % v7 (old) | 08/2022 | Dell Inspiron 16 Plus 7620 i7-12700H, GeForce RTX 3050 Ti Laptop GPU | 2.1 kg | 18.99 mm | 16.00" | 3072x1920 | |
| 86.7 % v7 (old) | 08/2021 | Dell Inspiron 16 Plus 7610 i7-11800H, GeForce RTX 3050 4GB Laptop GPU | 2 kg | 18.99 mm | 16.00" | 3072x1920 | |
| 88.7 % v7 (old) | 08/2022 | Lenovo Yoga 7 16IAP7 i7-1260P, Iris Xe G7 96EUs | 2 kg | 19.2 mm | 16.00" | 2560x1600 | |
| 83.6 % v7 (old) | 07/2022 | Huawei MateBook D 16 2022 i7-12700H, Iris Xe G7 96EUs | 1.7 kg | 18.4 mm | 16.00" | 1920x1200 | |
| 86.2 % v7 (old) | 07/2022 | Acer Swift X SFX16-51G-5388 i5-11320H, GeForce RTX 3050 4GB Laptop GPU | 1.8 kg | 18.9 mm | 16.10" | 1920x1080 | |
v (old) | 12/2021 | Asus Vivobook Pro 16X-M7600QE R9 5900HX, GeForce RTX 3050 Ti Laptop GPU | 1.9 kg | 19 mm | 16.10" | 3840x2400 |
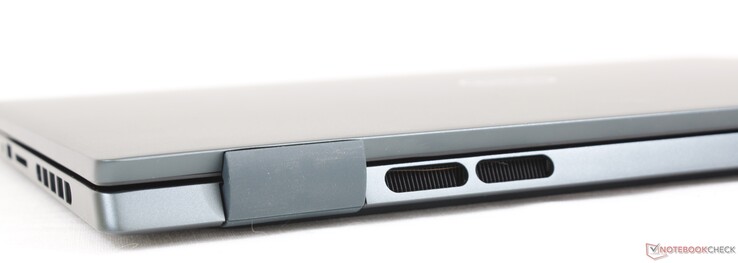
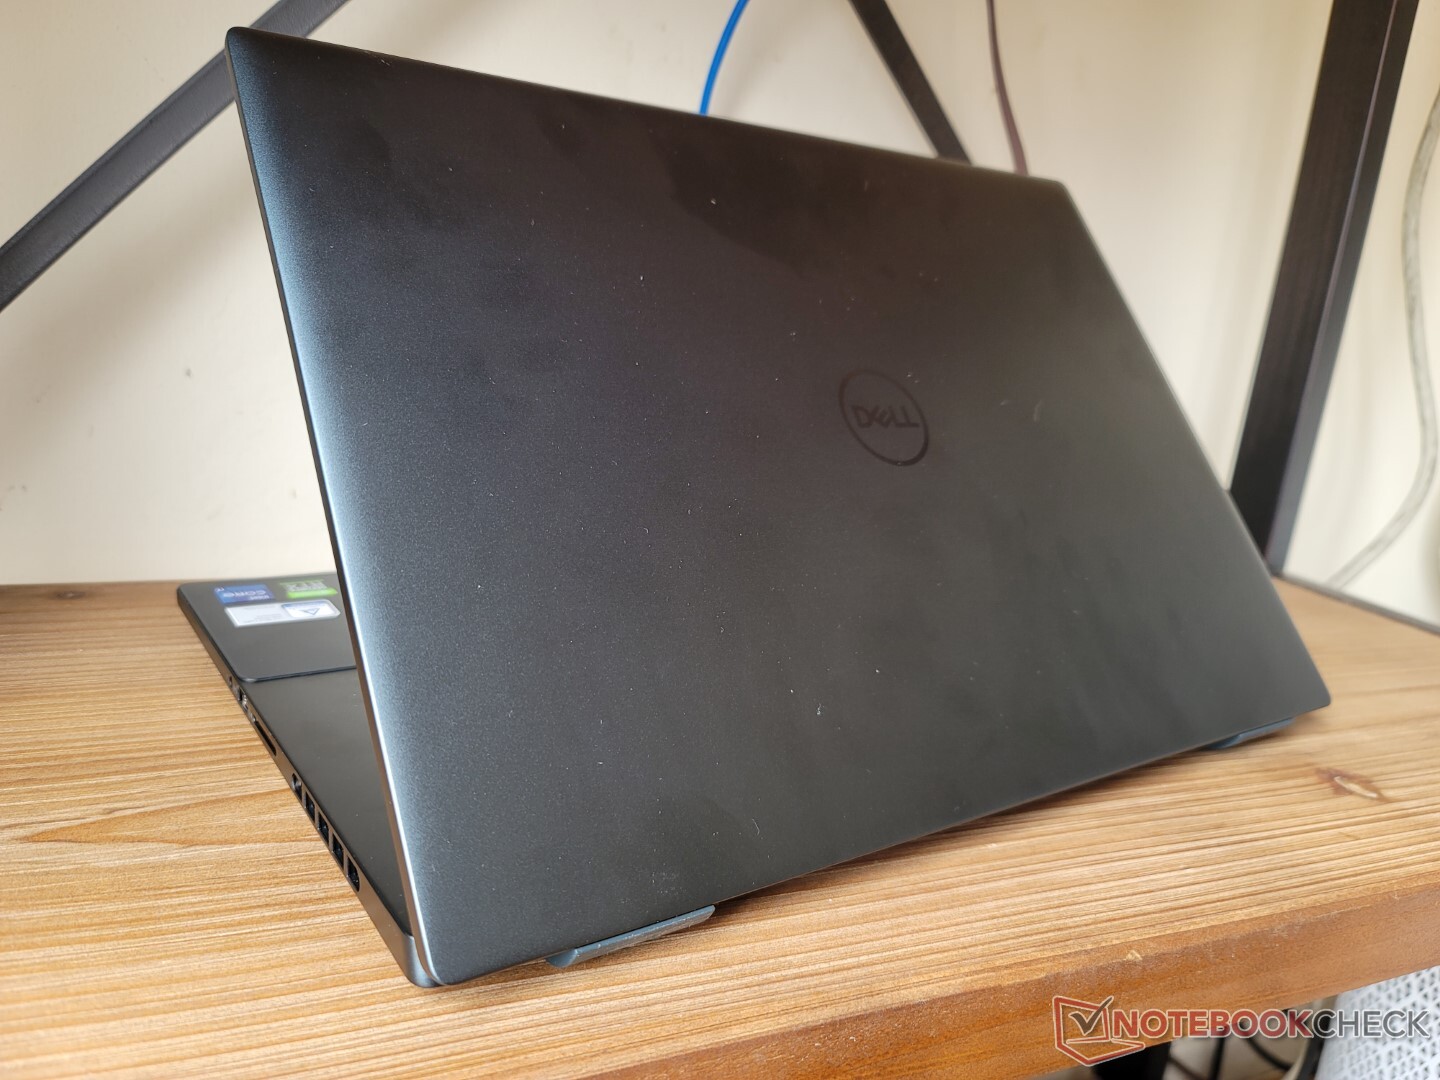
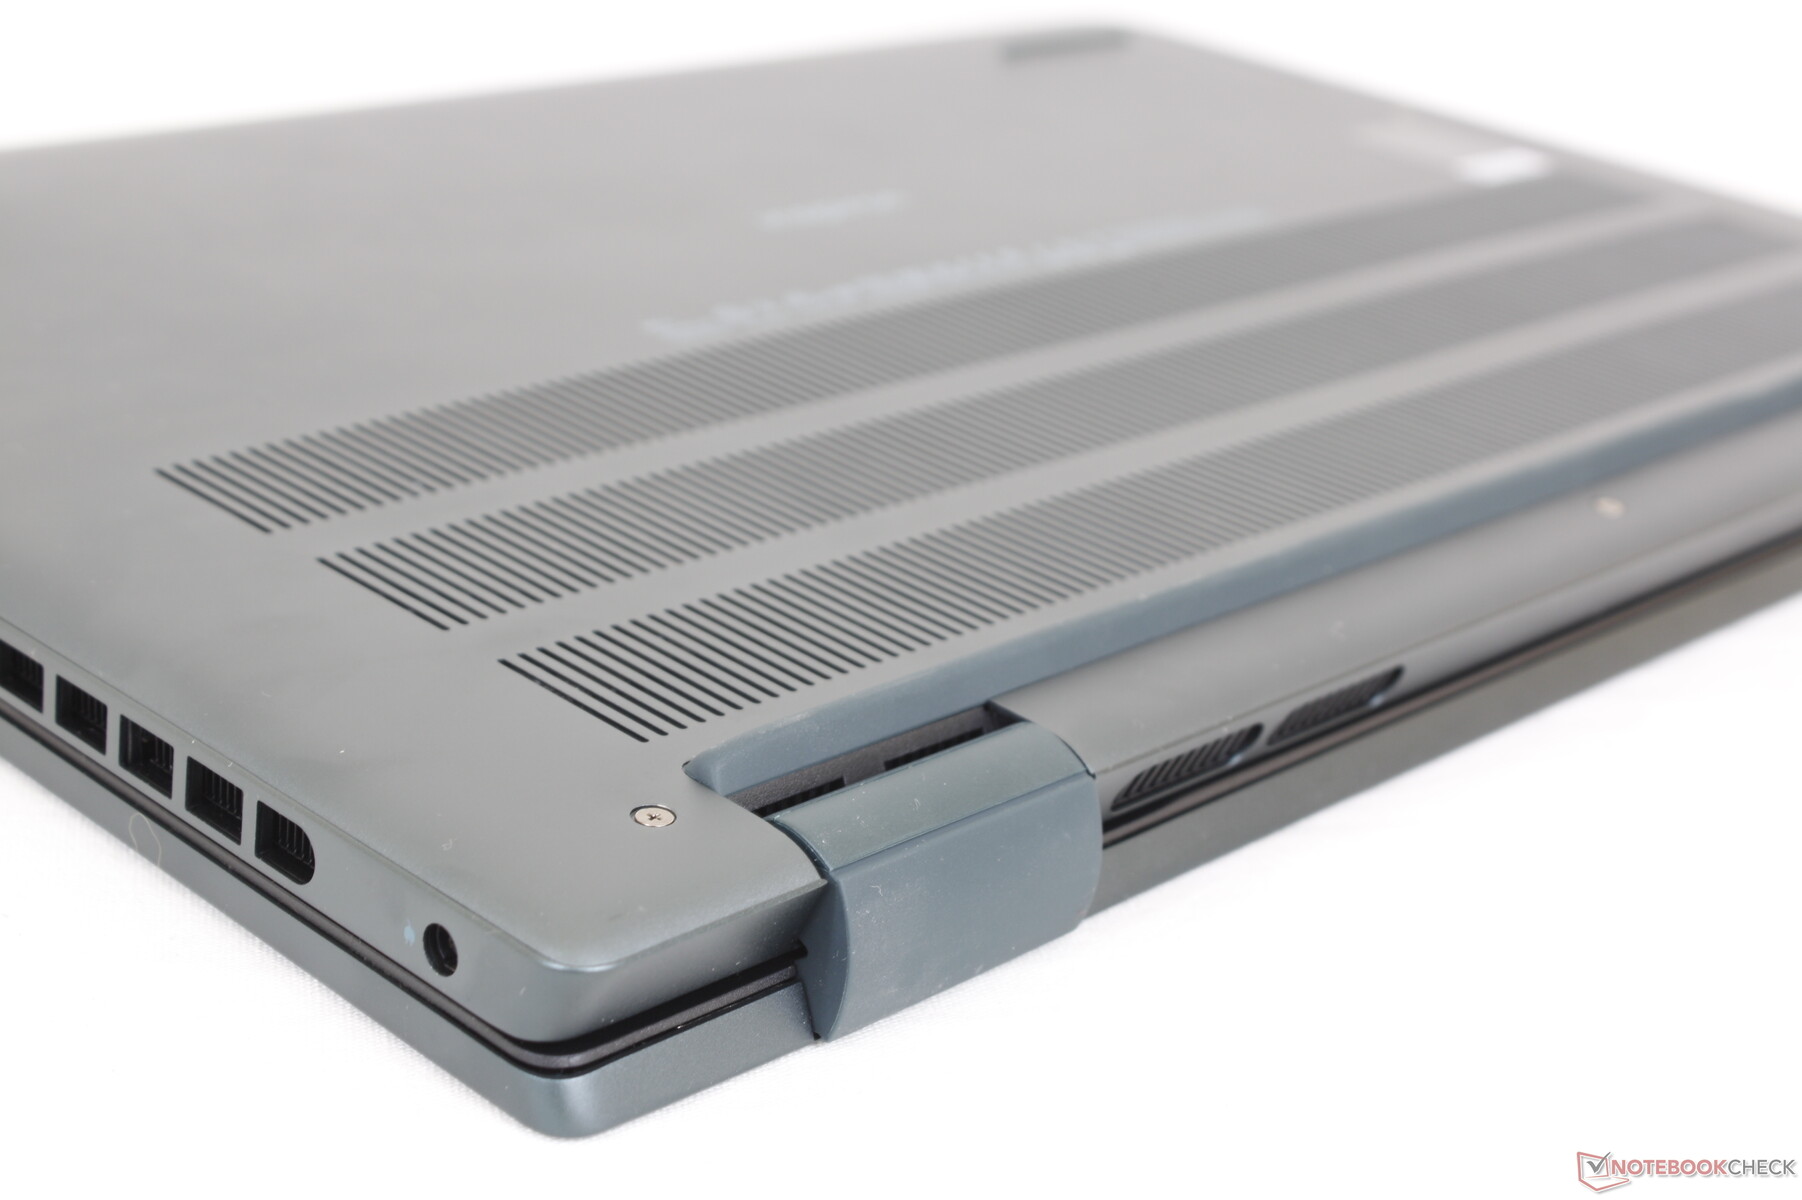
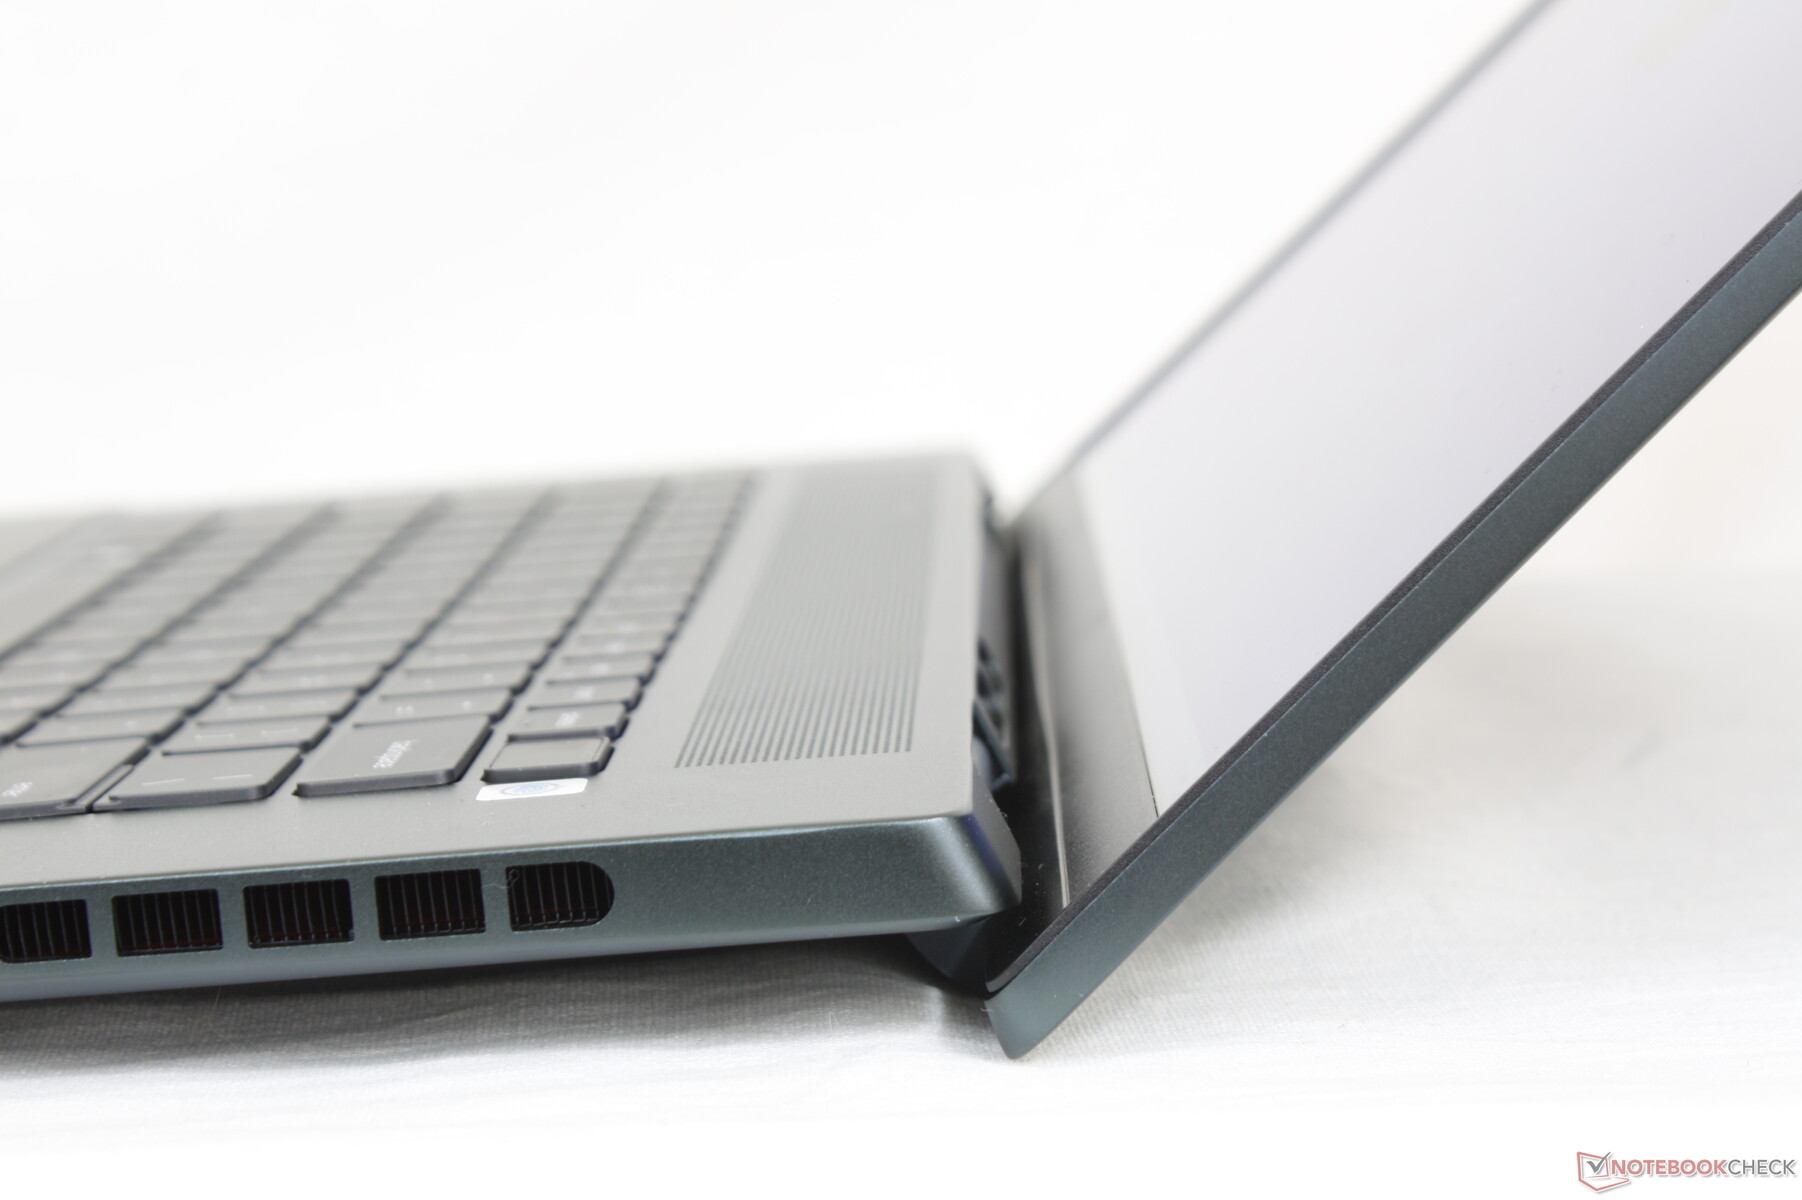
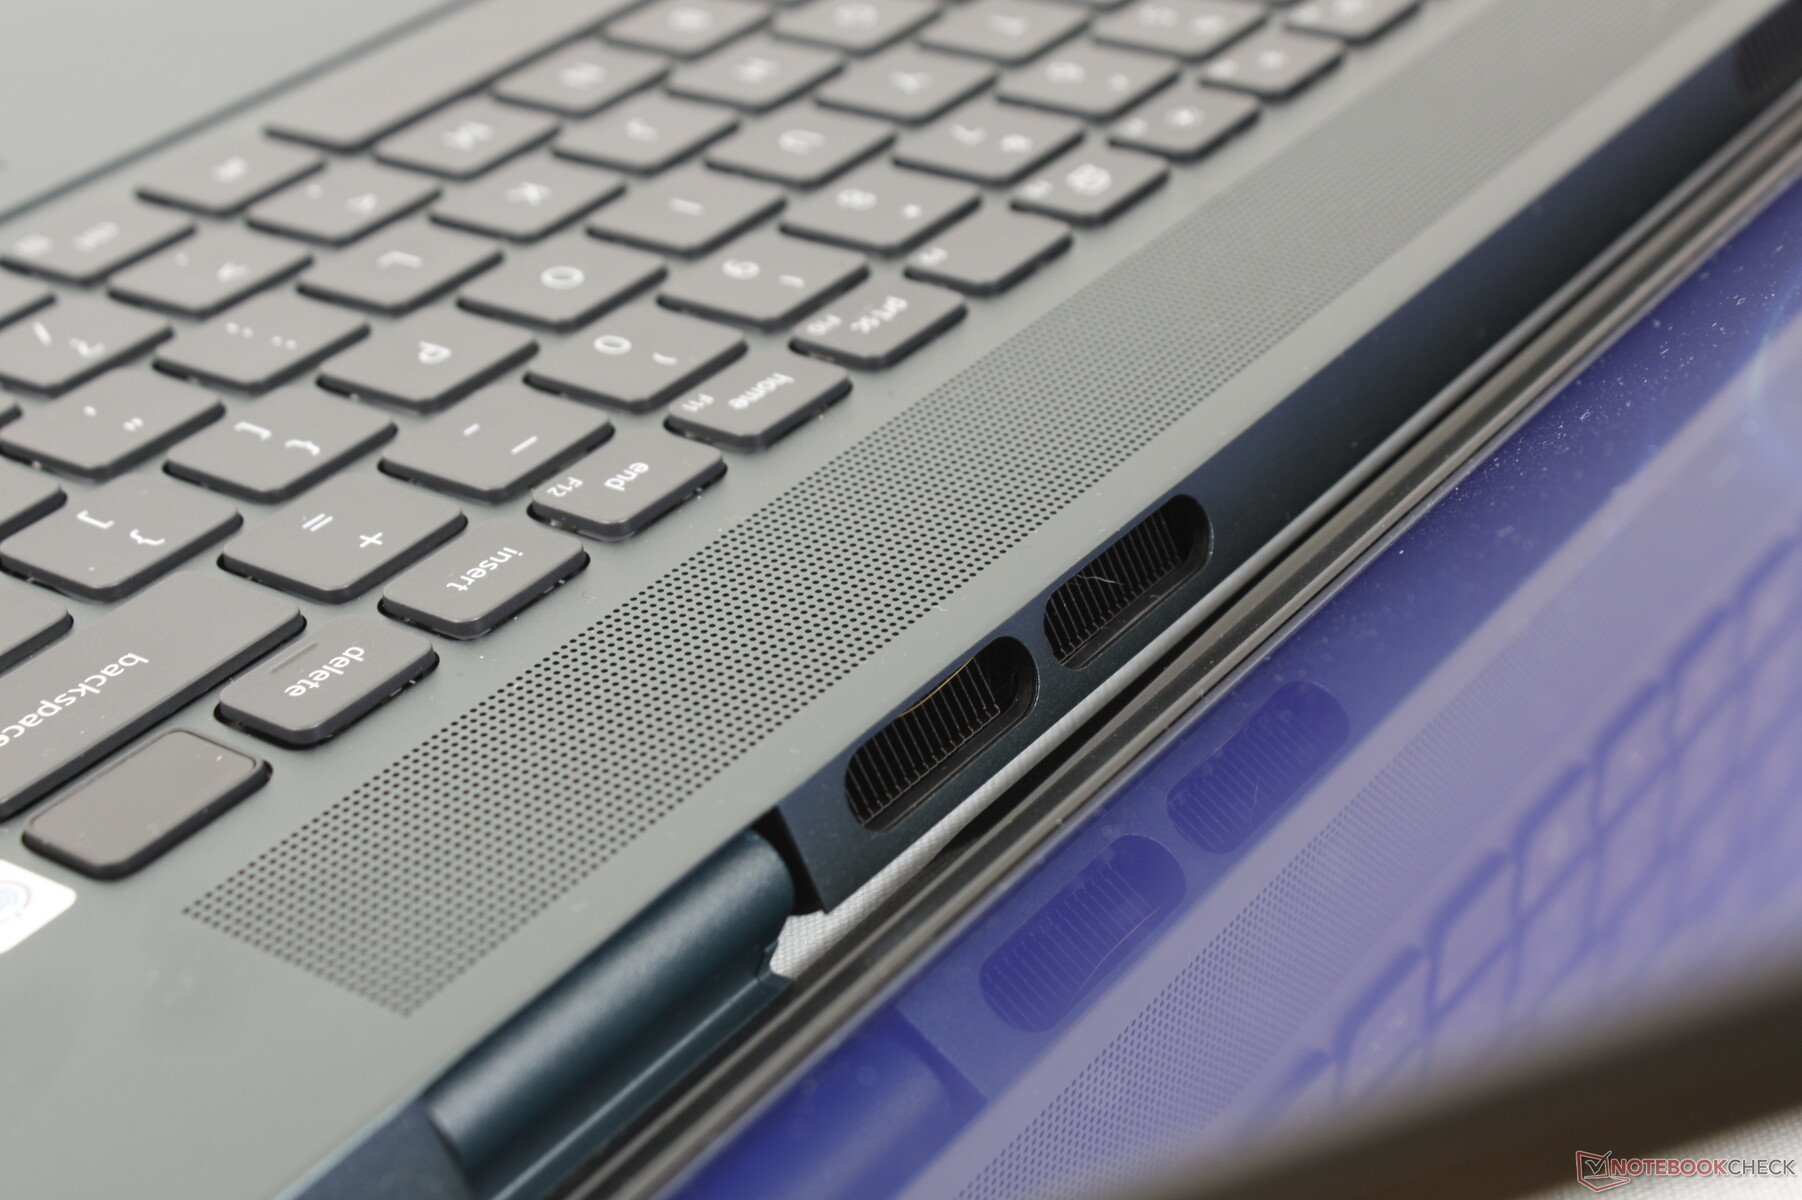
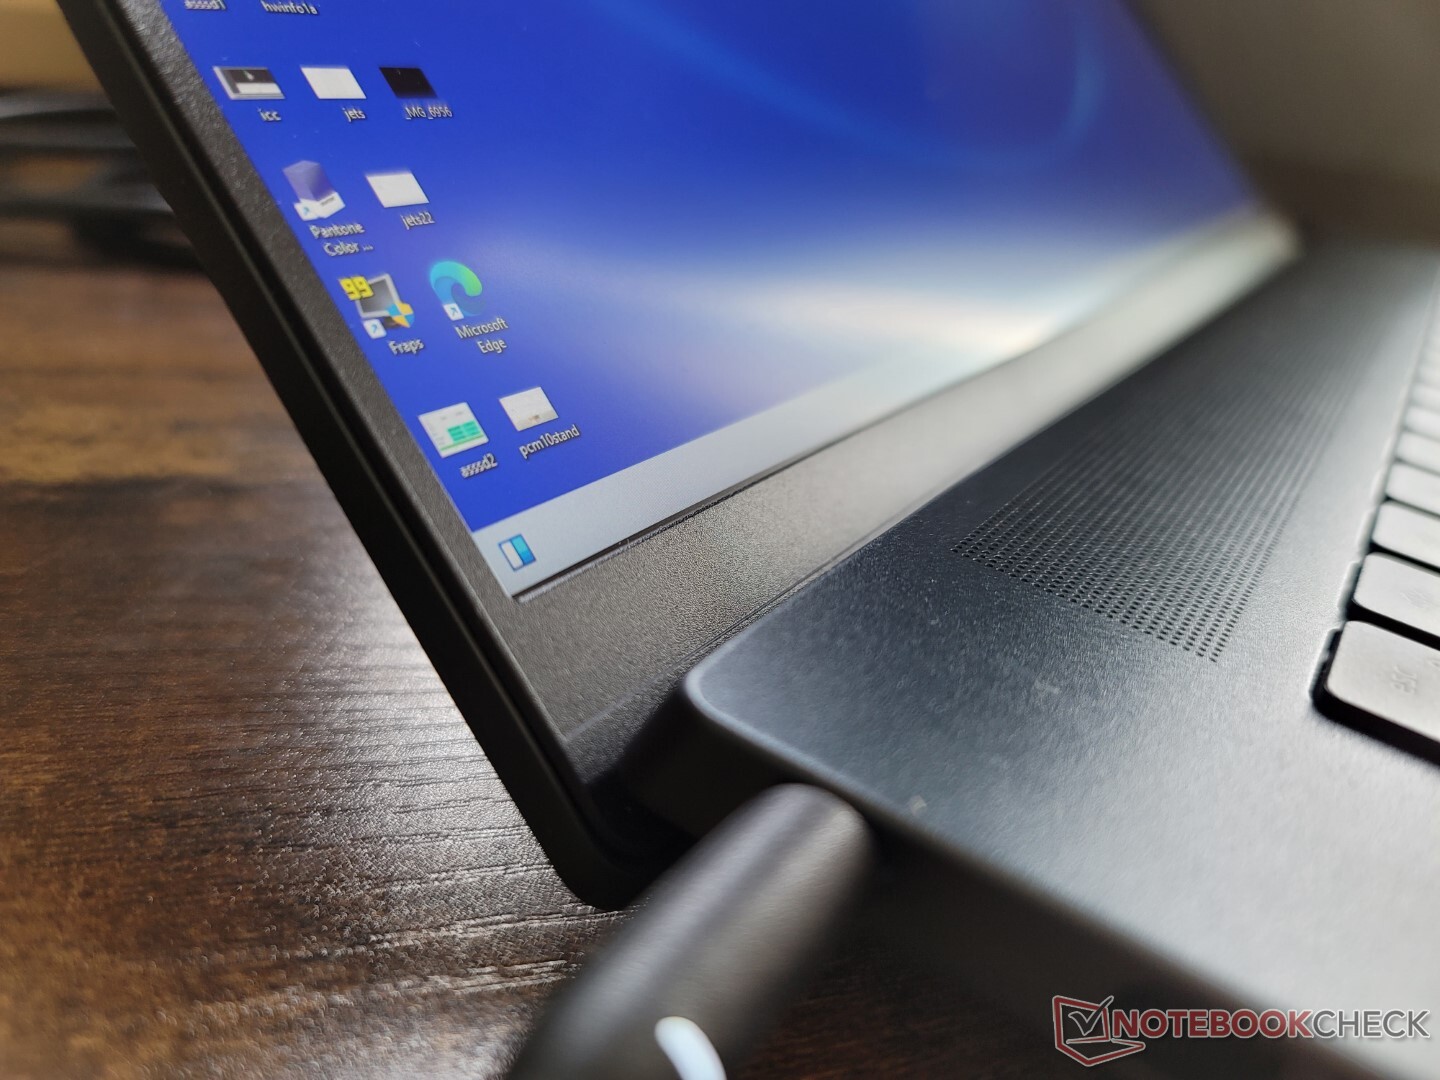
Caso - Toni più scuri
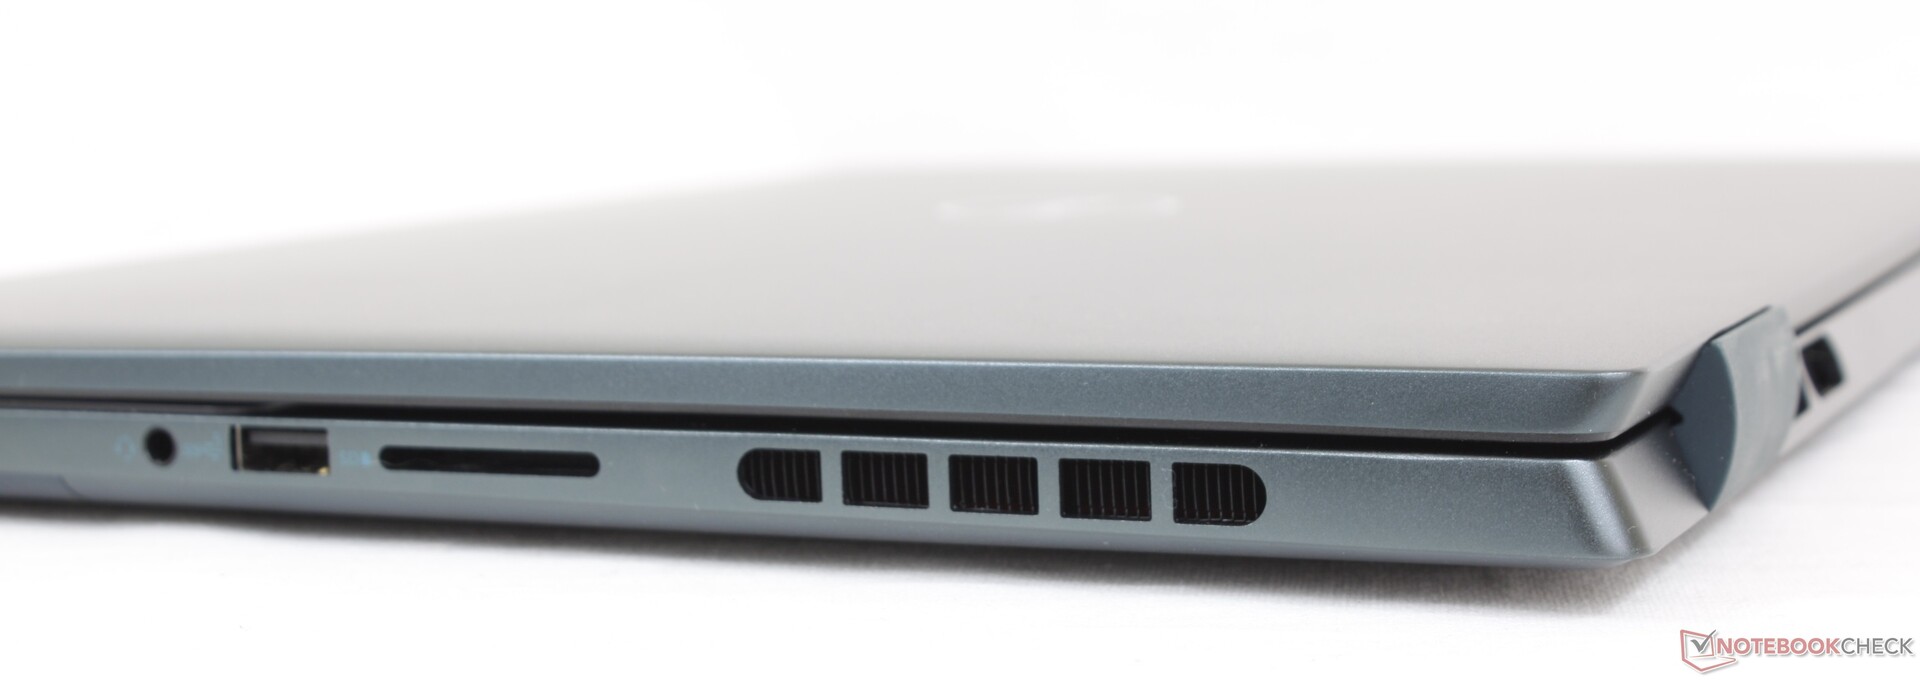
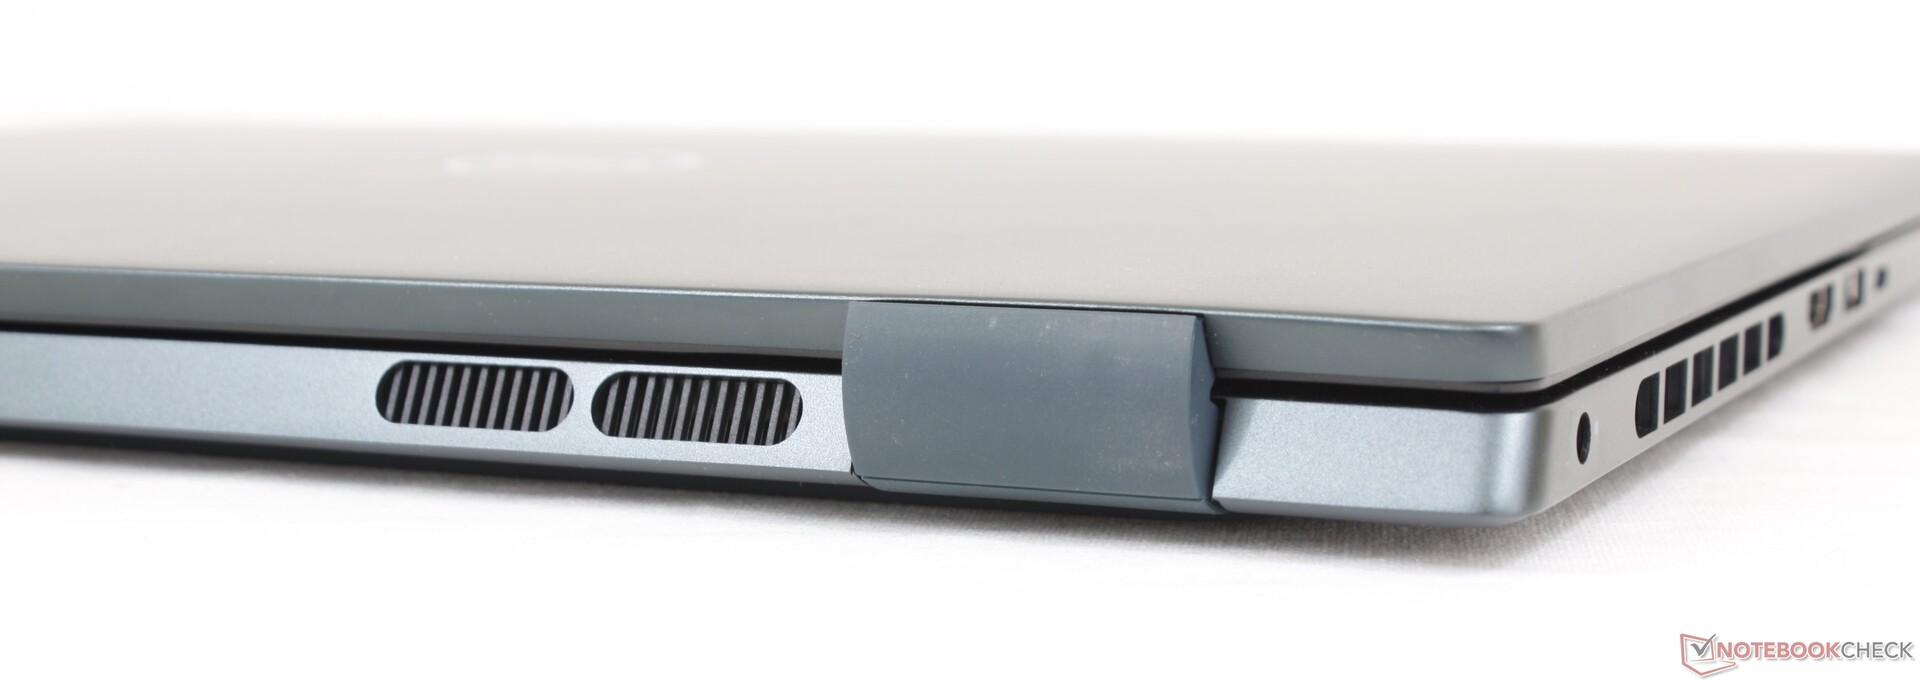
Dal punto di vista visivo, le differenze tra i modelli 2021 e 2022 si notano immediatamente. Le griglie di ventilazione lungo le fiancate e il posteriore, ad esempio, sono ora rispettivamente rettangolari e ovali, anziché circolari. I bordi e gli angoli cromati sono stati eliminati per un aspetto più monocromatico e meno ornato
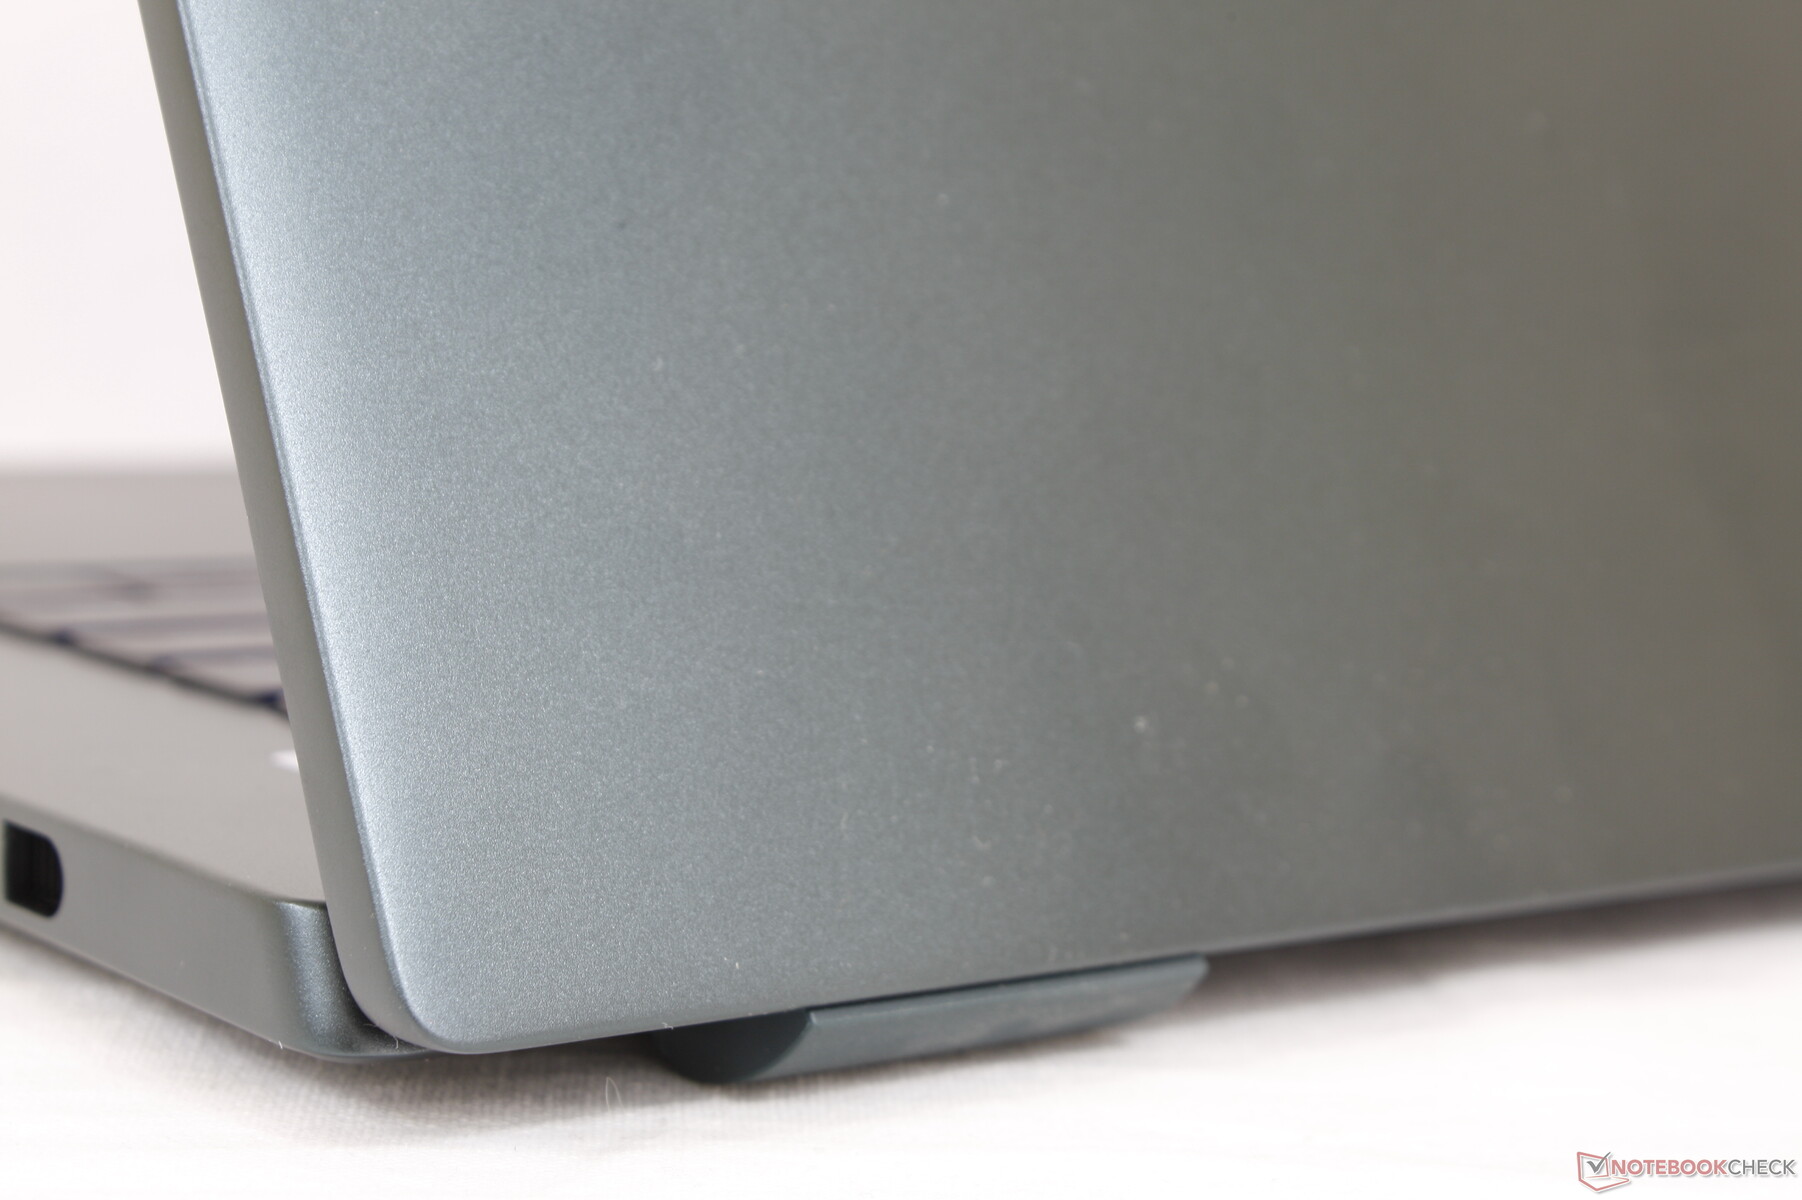
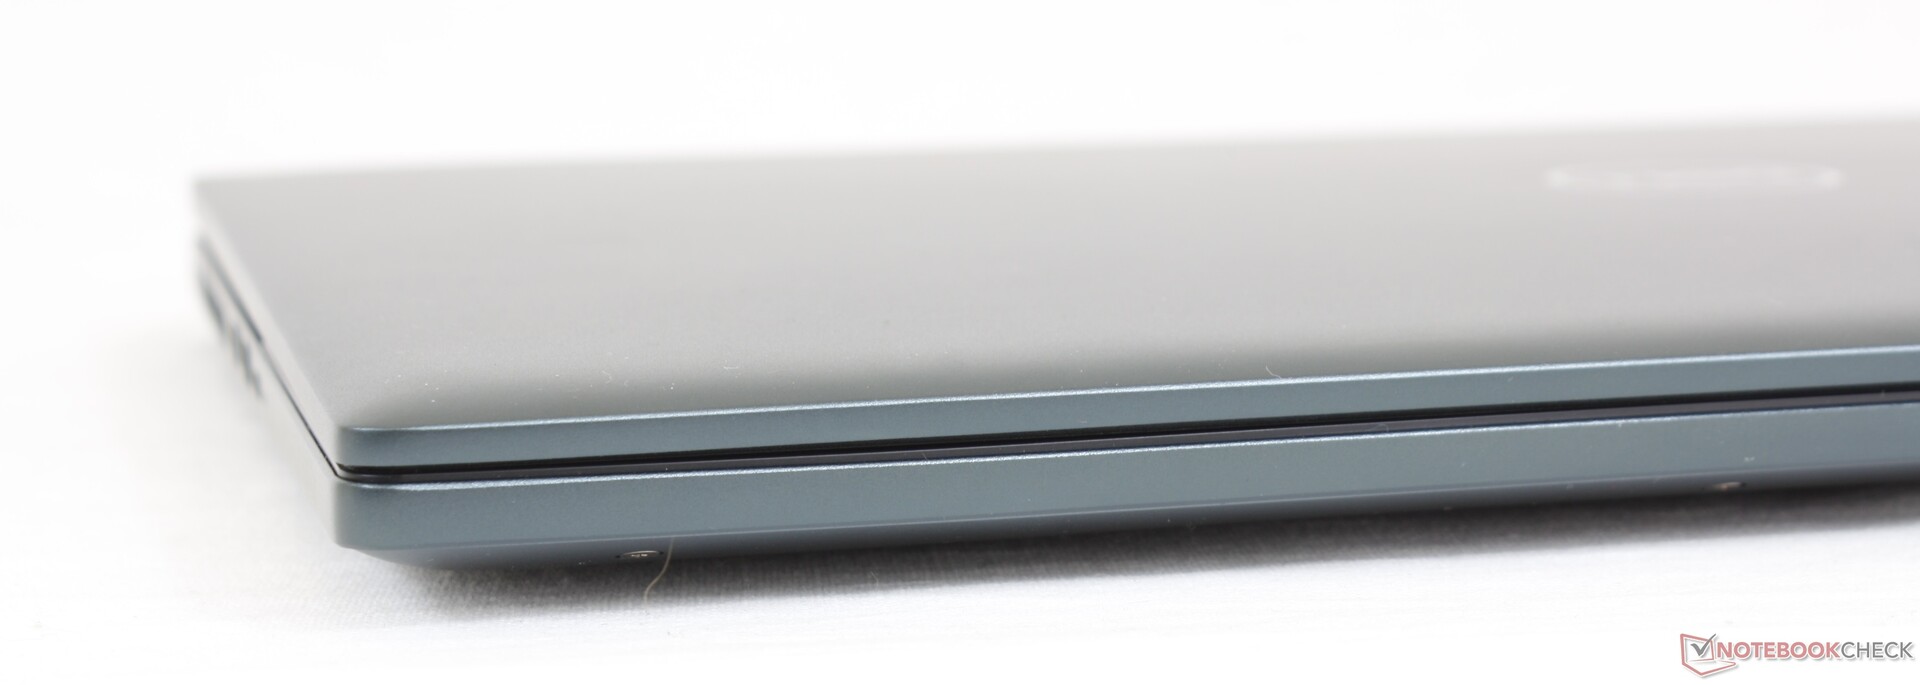
La qualità costruttiva rimane pressoché invariata. La base metallica si contorce e scricchiola un po' di più rispetto ai più costosi XPS o Spectre, soprattutto per quanto riguarda il coperchio. Speravamo che tutti i cambiamenti visivi portassero a un telaio più robusto, ma non sembra essere così. Se avete ancora il modello 2021, con il modello 2022 non vi perderete molto dal punto di vista del design.
Una delle nostre lamentele sull'Inspiron 16 Plus 7610 era il suo peso, che continua ad essere vero anche per il 7620 nonostante la riprogettazione dello chassis. Con un peso compreso tra i 2 e i 2,1 kg, il sistema è più pesante di qualche centinaio di grammi rispetto al 16 pollici Acer Swift X o del Huawei MateBook D 16. Anche il nuovo design non è più piccolo: le dimensioni sono infatti leggermente più grandi rispetto al 7610.
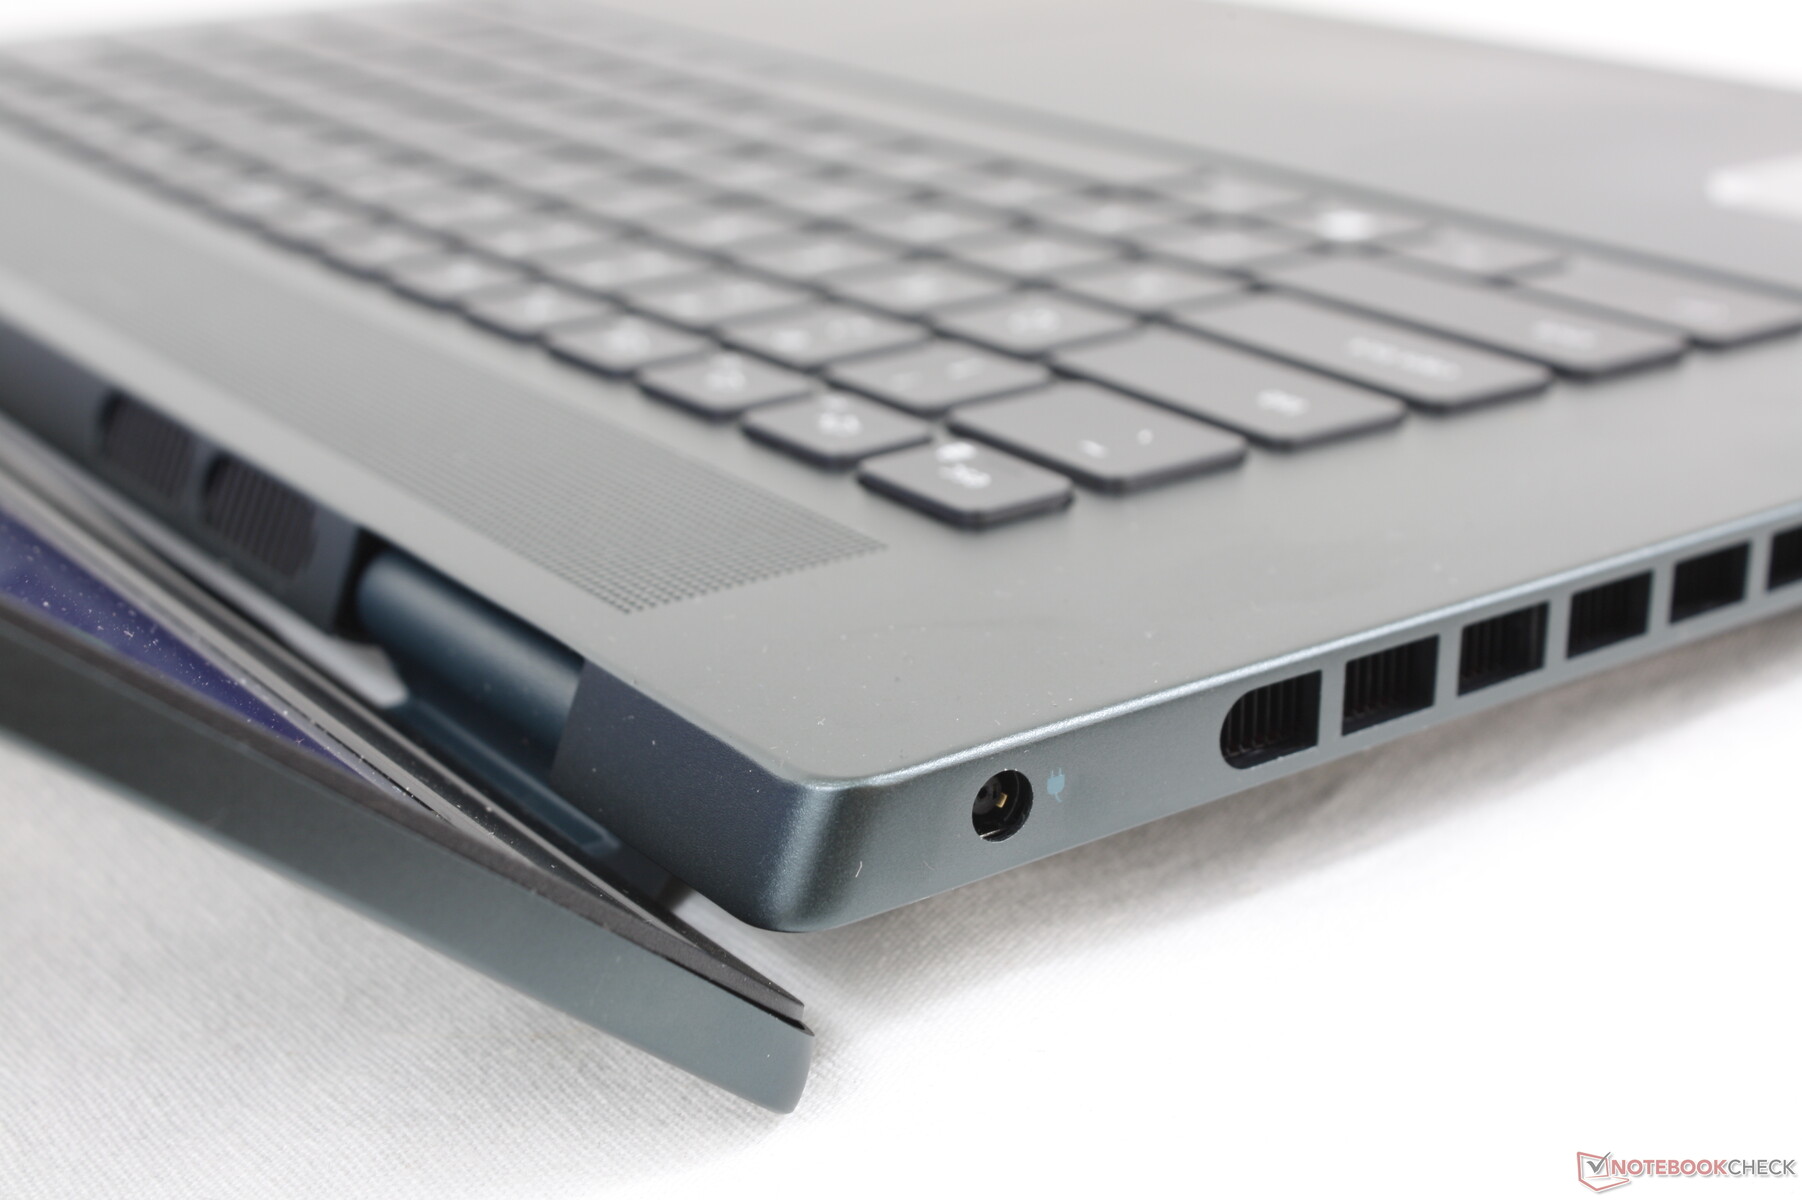
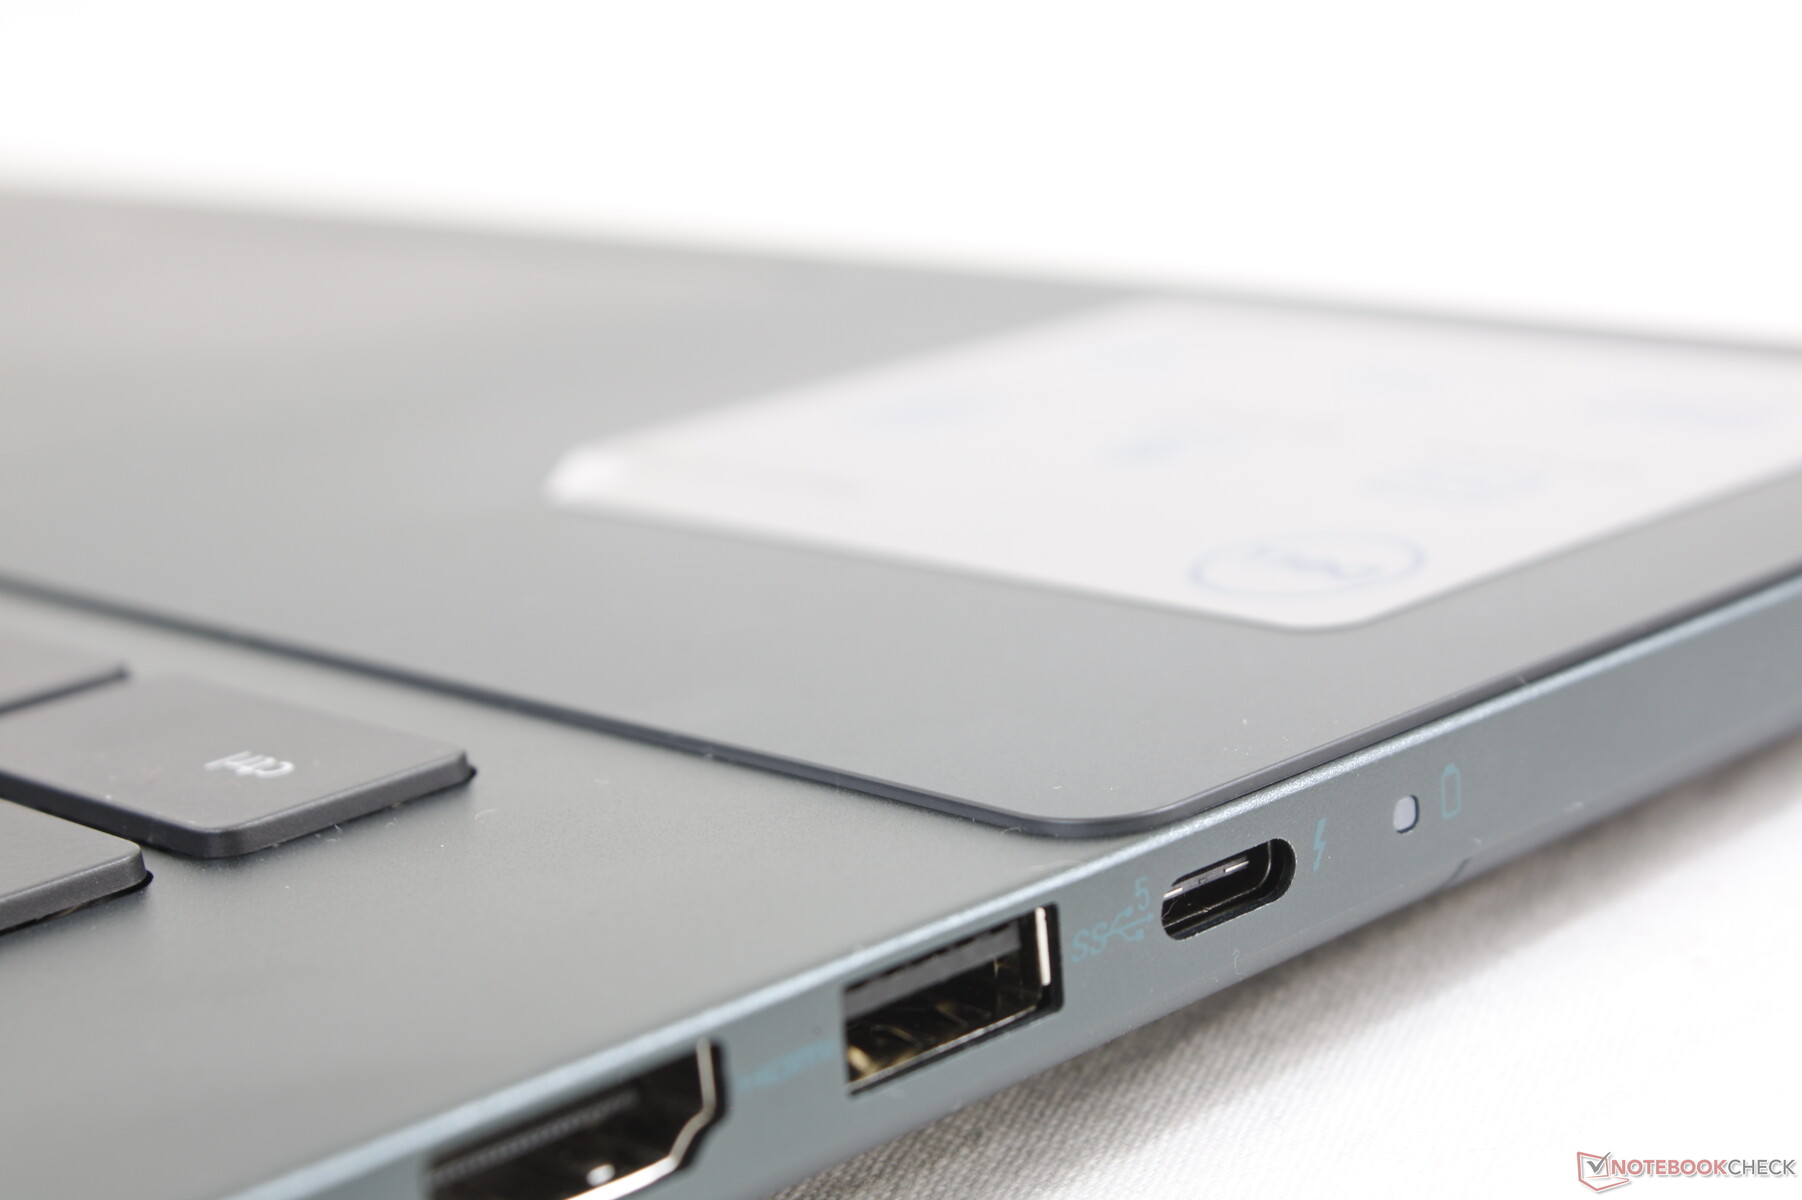
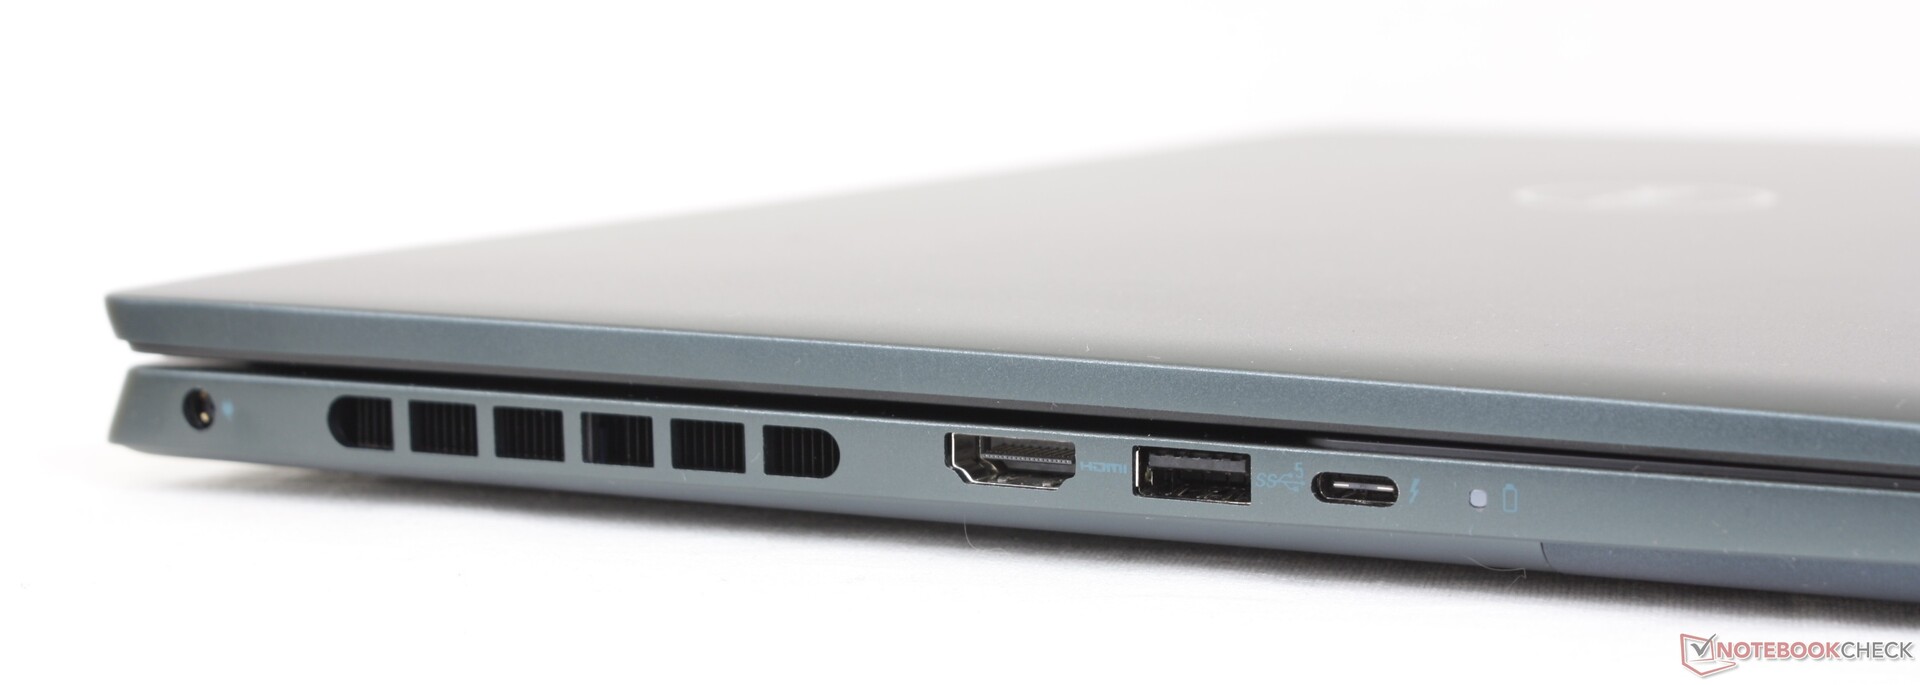
Connettività - Supporto Thunderbolt 4
Il 7620 presenta tutte le stesse porte del 7610, nonostante le modifiche esterne. Una seconda porta USB-C come sul Lenovo Yoga 7 16 Gen 7 sarebbe stata gradita vista la dimensione e il peso dell'unità.
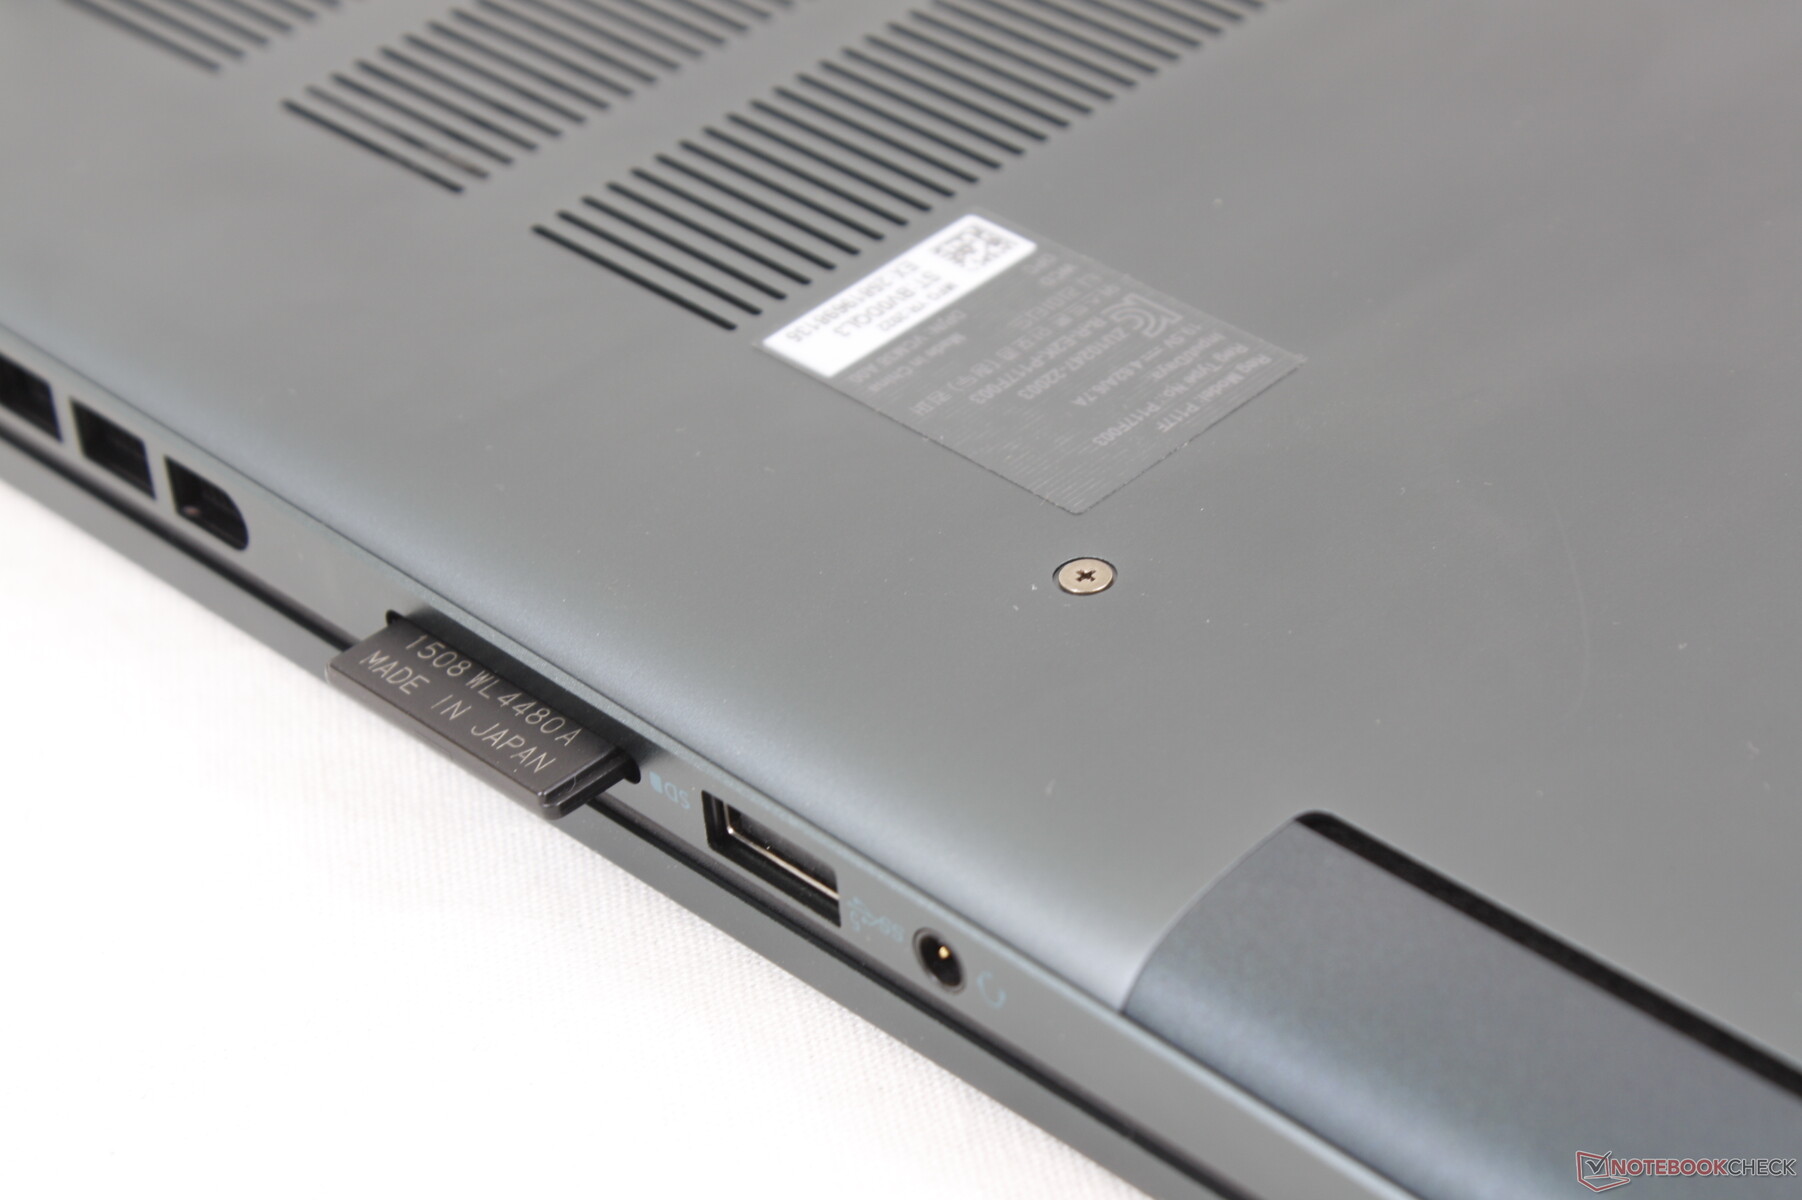
Lettore di schede SD
La velocità di trasferimento con la scheda SD continua a essere molto lenta. È chiaro che Dell vuole che gli utenti passino alla serie serie XPS, più costosa se vogliono prestazioni più veloci con la scheda SD.
Si noti che la SKU RTX 3060 è dotata di un lettore MicroSD anziché di un lettore completo.
| SD Card Reader | |
| average JPG Copy Test (av. of 3 runs) | |
| Dell XPS 15 9520 RTX 3050 Ti (Toshiba Exceria Pro SDXC 64 GB UHS-II) | |
| Lenovo Yoga 7 16IAP7 (Toshiba Exceria Pro SDXC 64 GB UHS-II) | |
| Asus Vivobook Pro 16X-M7600QE (AV Pro SD microSD 128 GB V60) | |
| Dell Inspiron 16 Plus 7620 (Toshiba Exceria Pro SDXC 64 GB UHS-II) | |
| Dell Inspiron 16 Plus 7610 (AV PRO microSD 128 GB V60) | |
| maximum AS SSD Seq Read Test (1GB) | |
| Dell XPS 15 9520 RTX 3050 Ti (Toshiba Exceria Pro SDXC 64 GB UHS-II) | |
| Lenovo Yoga 7 16IAP7 (Toshiba Exceria Pro SDXC 64 GB UHS-II) | |
| Asus Vivobook Pro 16X-M7600QE (AV Pro SD microSD 128 GB V60) | |
| Dell Inspiron 16 Plus 7620 (Toshiba Exceria Pro SDXC 64 GB UHS-II) | |
| Dell Inspiron 16 Plus 7610 (AV PRO microSD 128 GB V60) | |
Comunicazione
Le SKU possono essere configurate con Intel AX201 o AX211 per la connettività Wi-Fi 6 e Wi-Fi 6E, rispettivamente. L'AX211 nella nostra unità ha mostrato eccellenti velocità di ricezione quando è stato accoppiato al nostro router a 6 GHz, ma le velocità di trasmissione non sono state così costanti come ci si aspettava, anche dopo vari tentativi.
| Networking | |
| iperf3 transmit AX12 | |
| Acer Swift X SFX16-51G-5388 | |
| Dell Inspiron 16 Plus 7610 | |
| Asus Vivobook Pro 16X-M7600QE | |
| iperf3 receive AX12 | |
| Acer Swift X SFX16-51G-5388 | |
| Dell Inspiron 16 Plus 7610 | |
| Asus Vivobook Pro 16X-M7600QE | |
| iperf3 receive AXE11000 6GHz | |
| Lenovo Yoga 7 16IAP7 | |
| Dell Inspiron 16 Plus 7620 | |
| iperf3 transmit AXE11000 6GHz | |
| Lenovo Yoga 7 16IAP7 | |
| Dell Inspiron 16 Plus 7620 | |
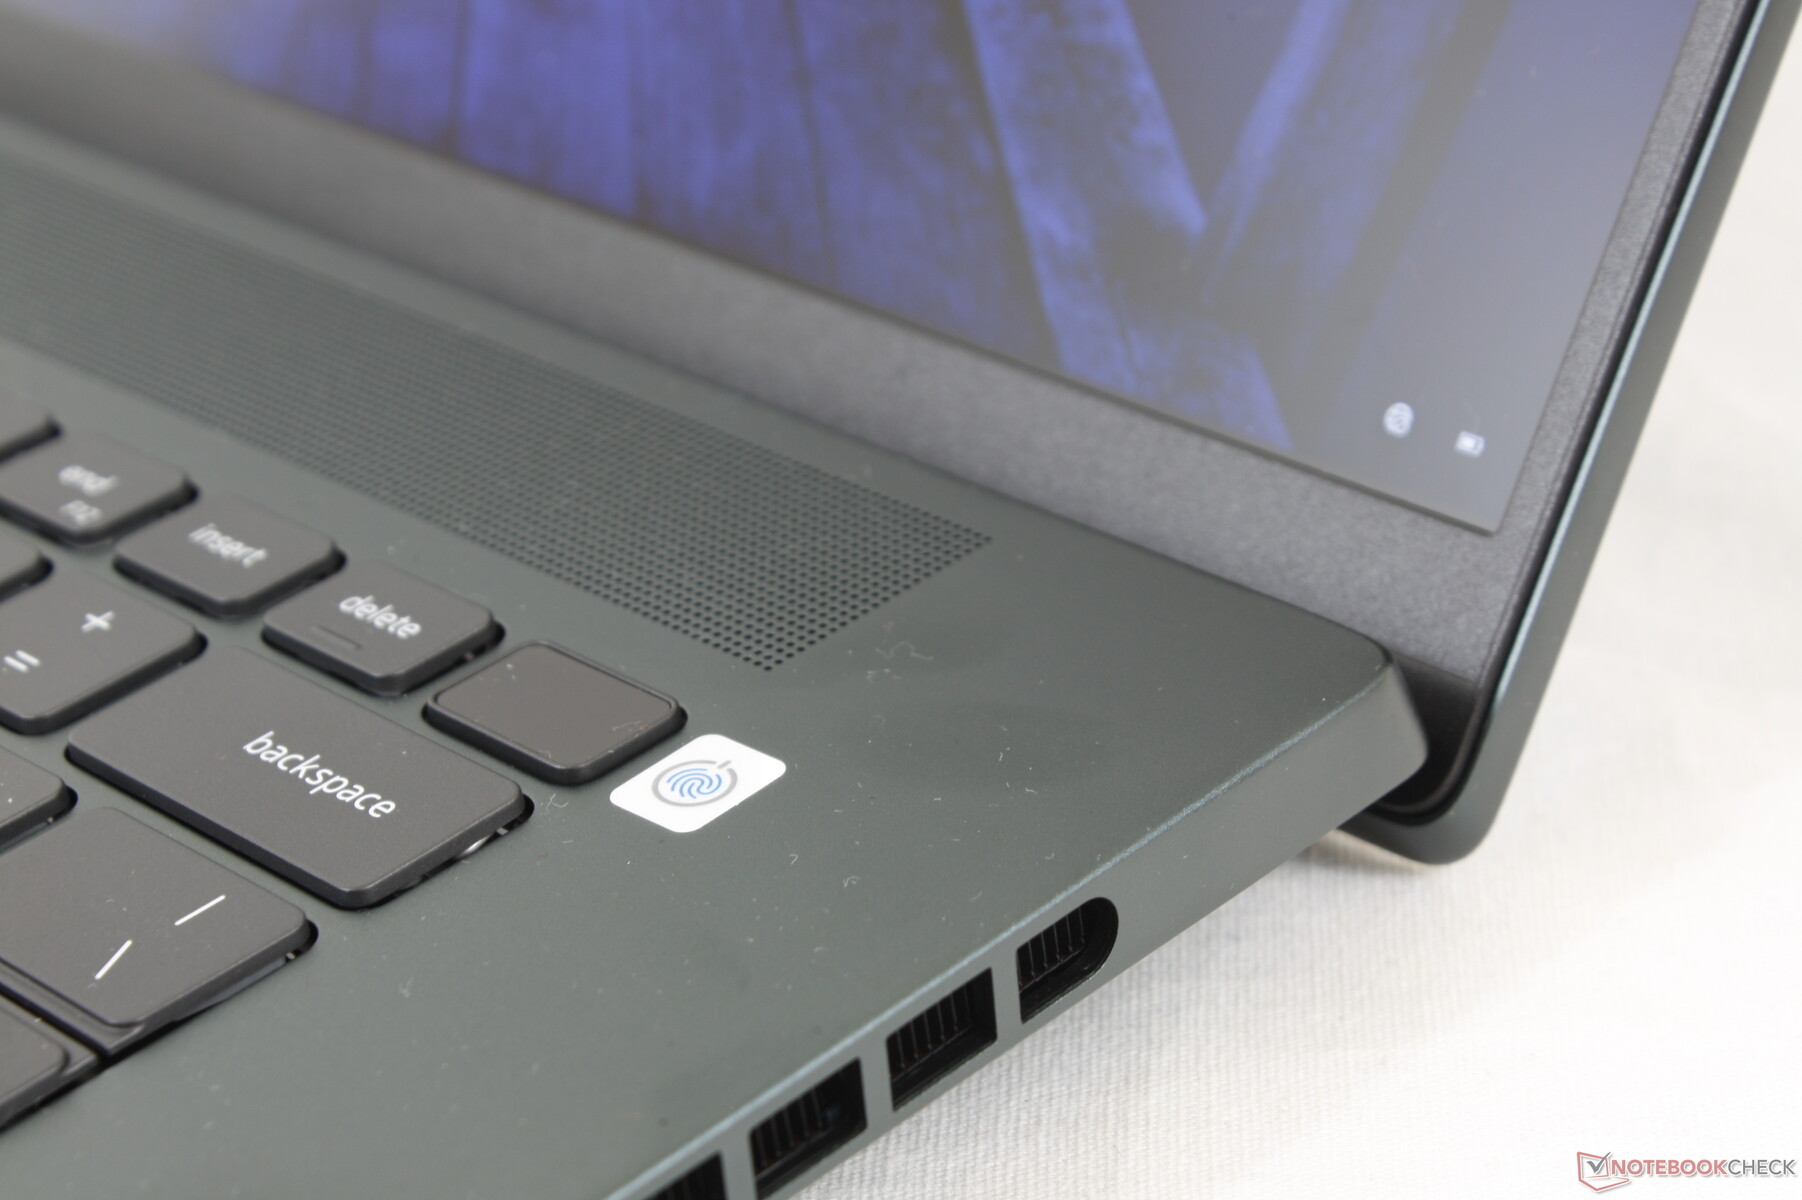
Webcam: ora 2 MP invece di 1 MP
Dell ha aggiornato la webcam da 720p o 1 MP sul modello Inspiron 16 Plus 7610 a 1080p o 2 MP sul modello 7620 per ottenere immagini più nitide. È presente il supporto per Windows Hello e un otturatore fisico della webcam per la privacy.


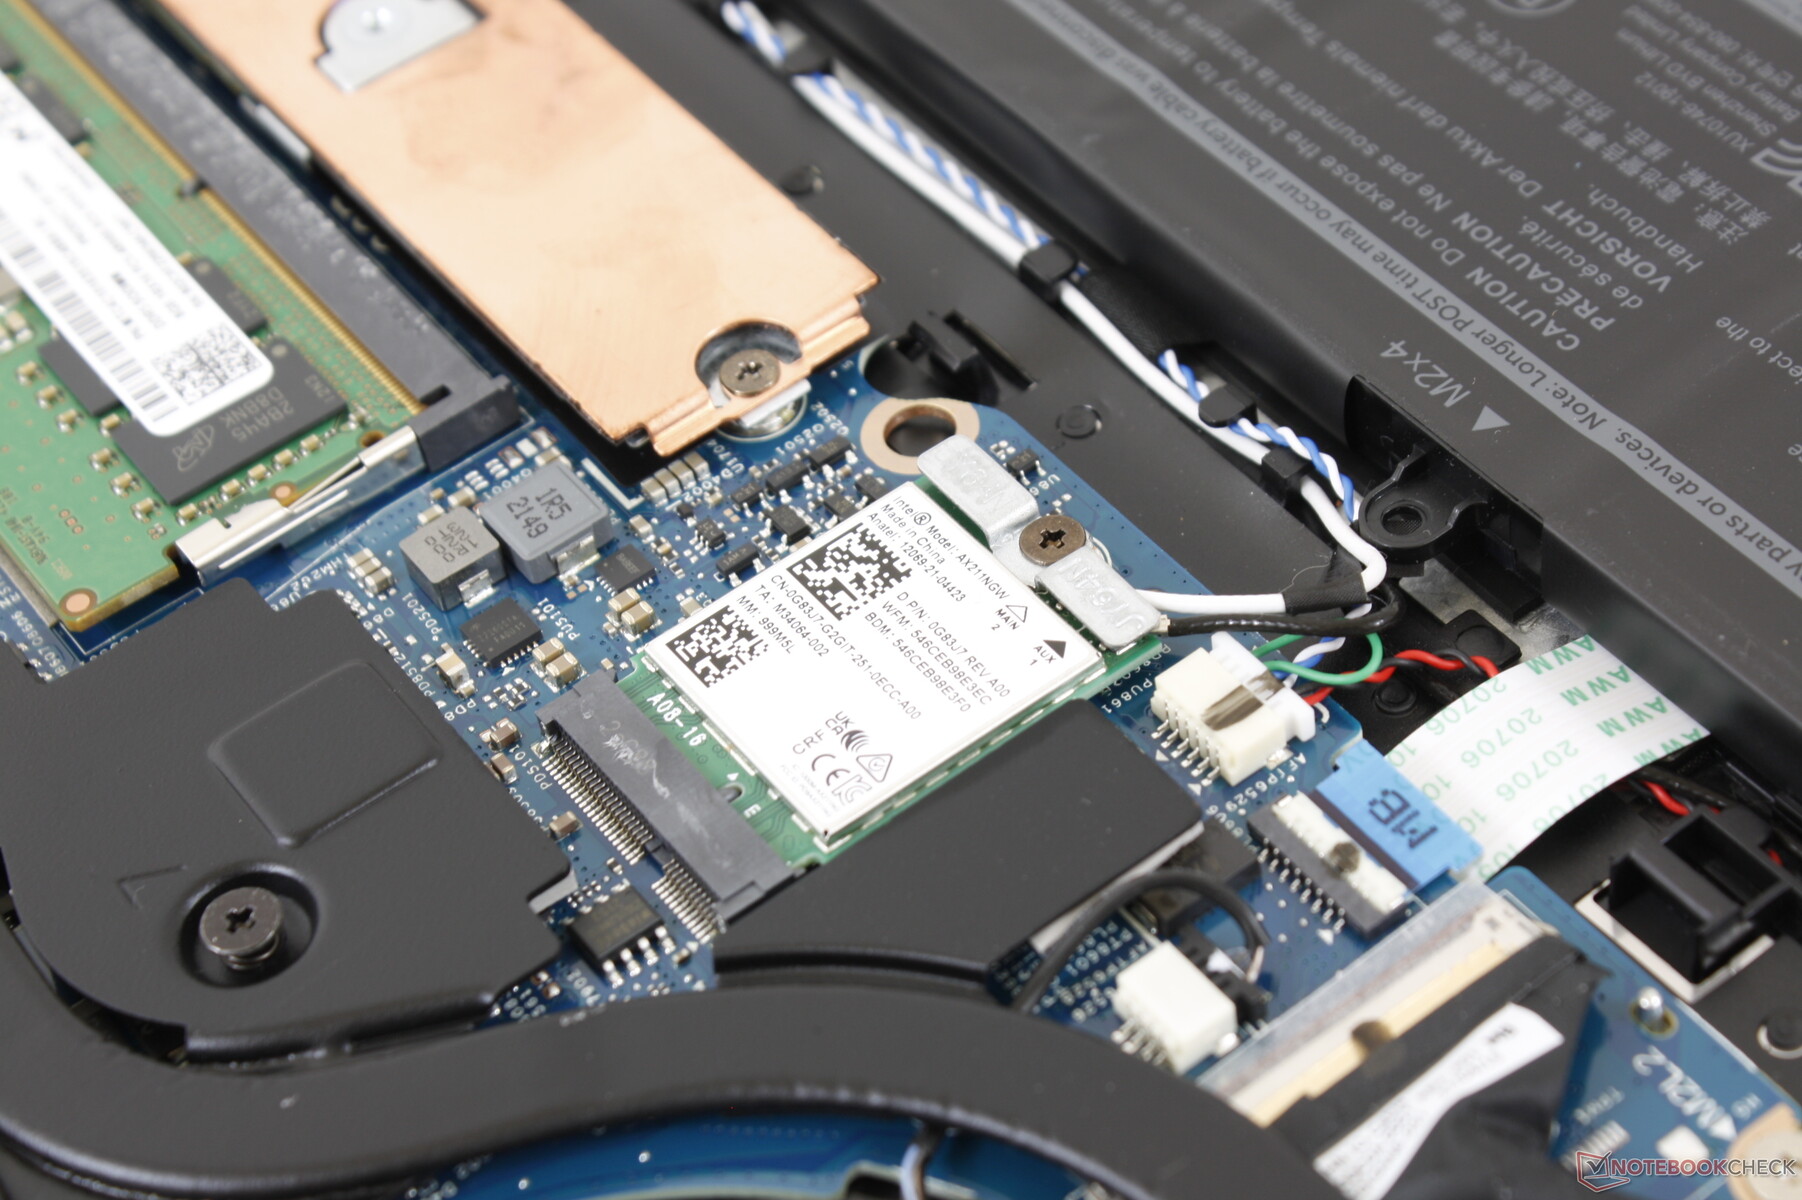
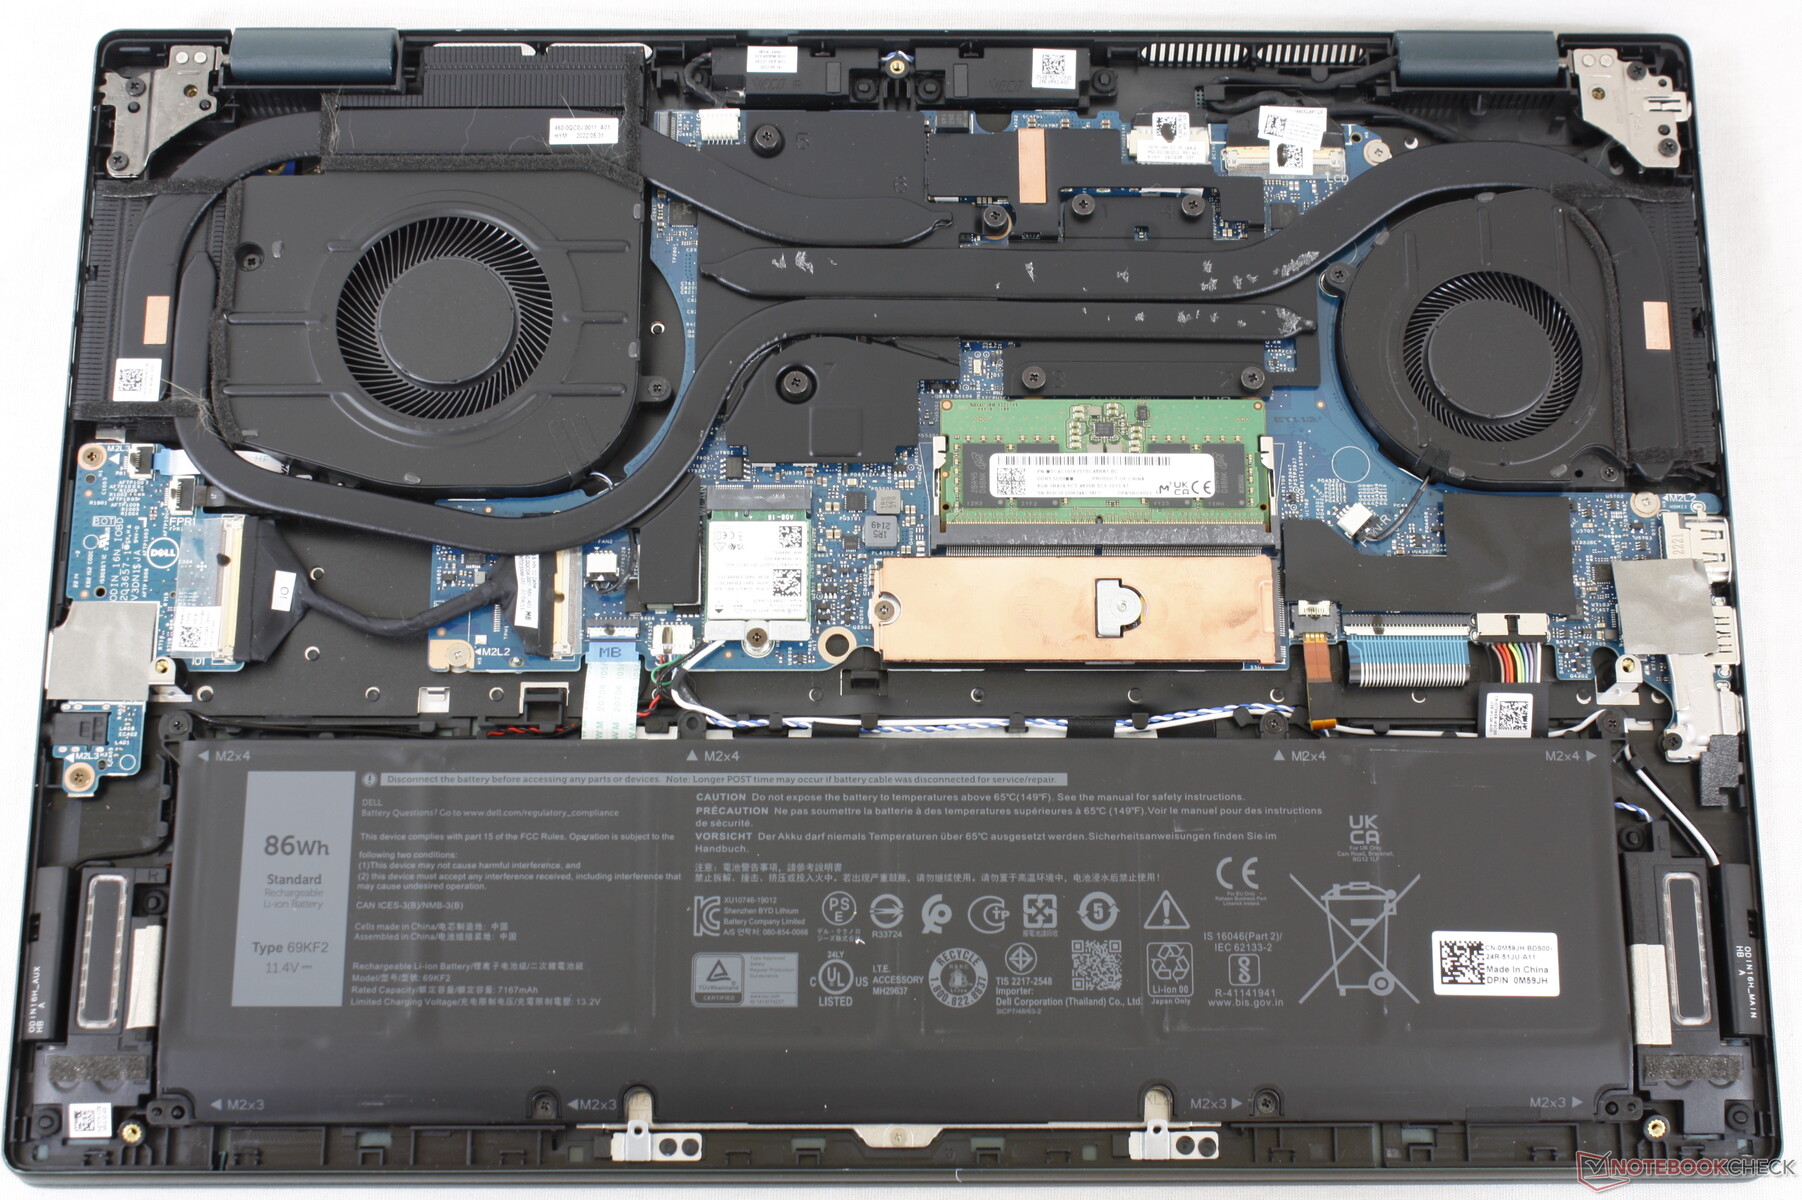
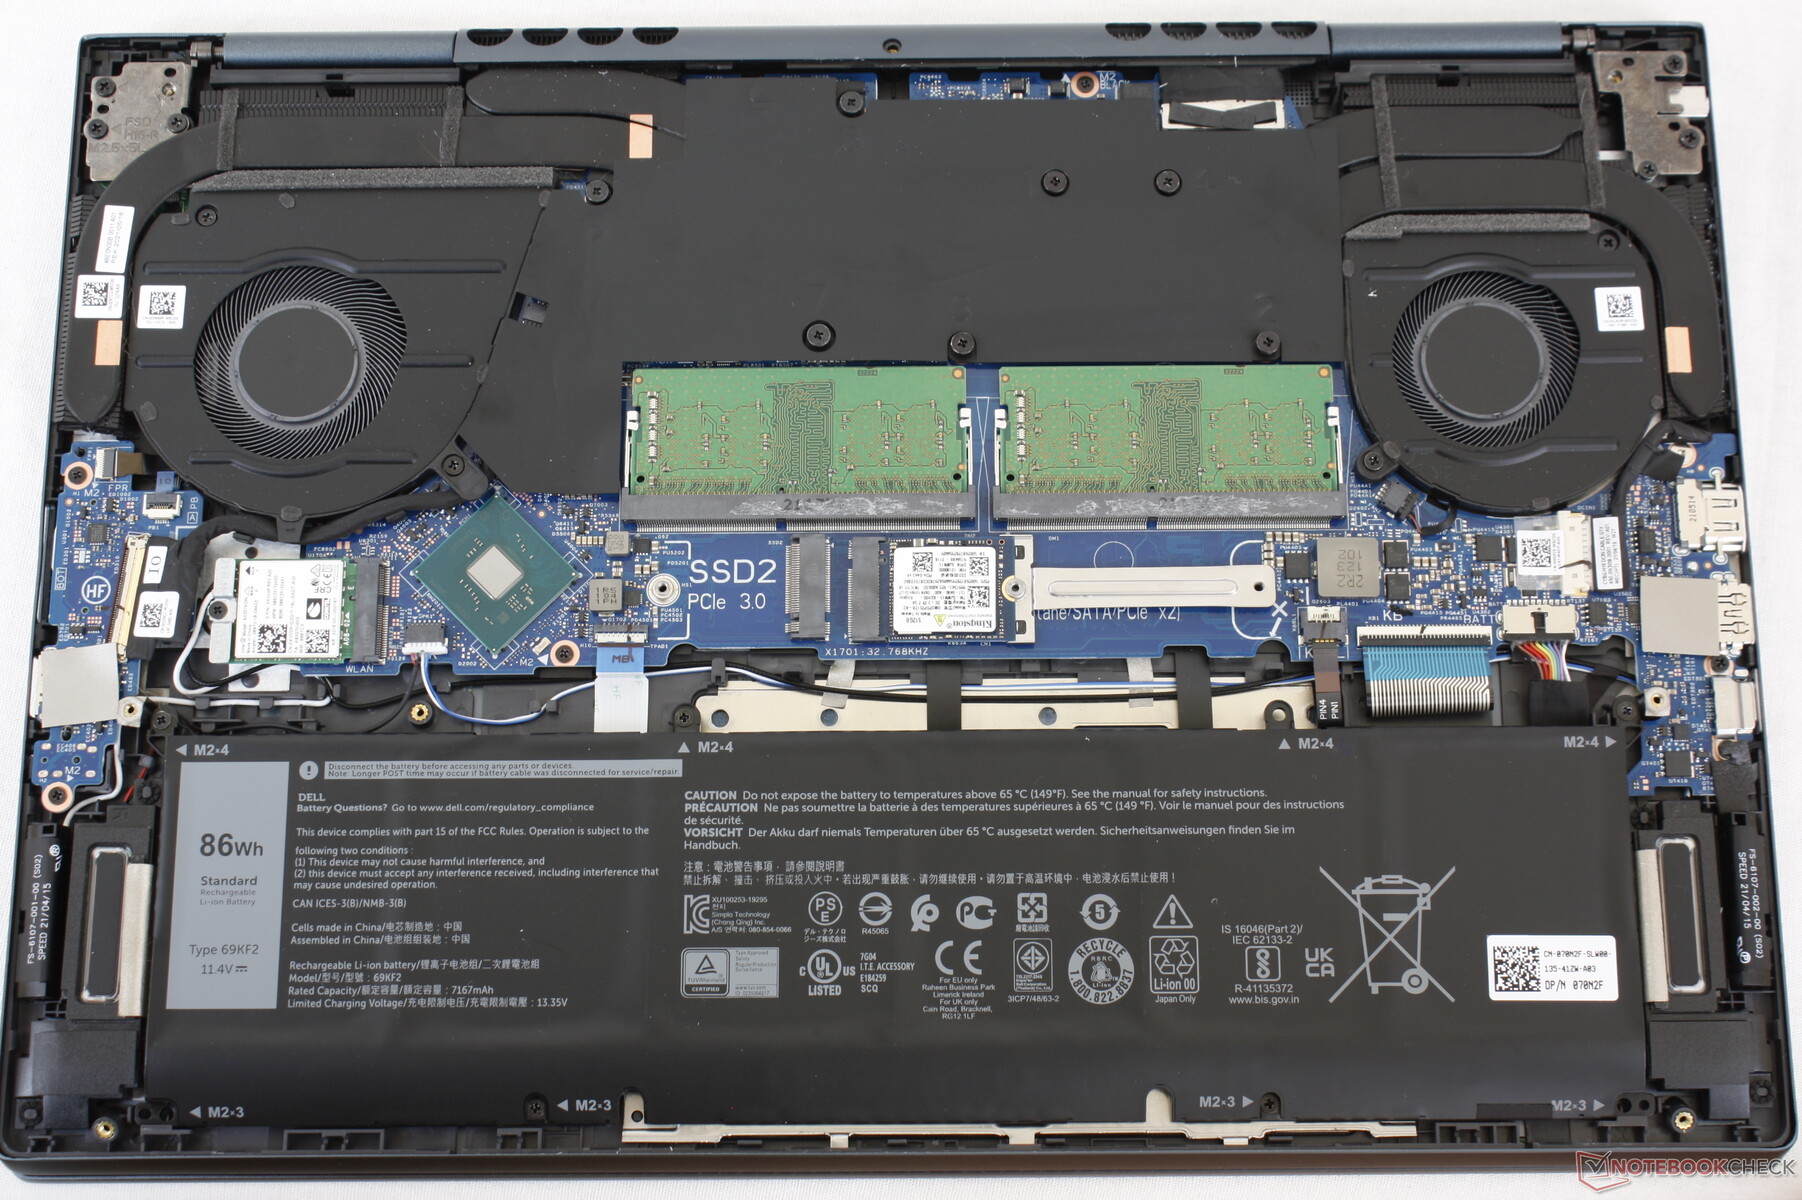
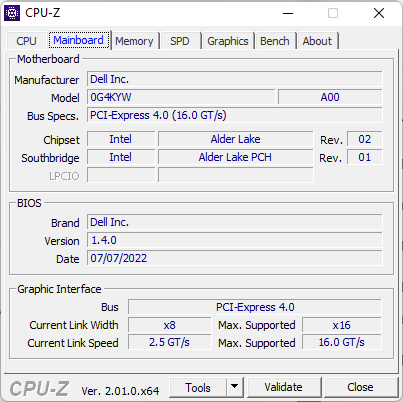
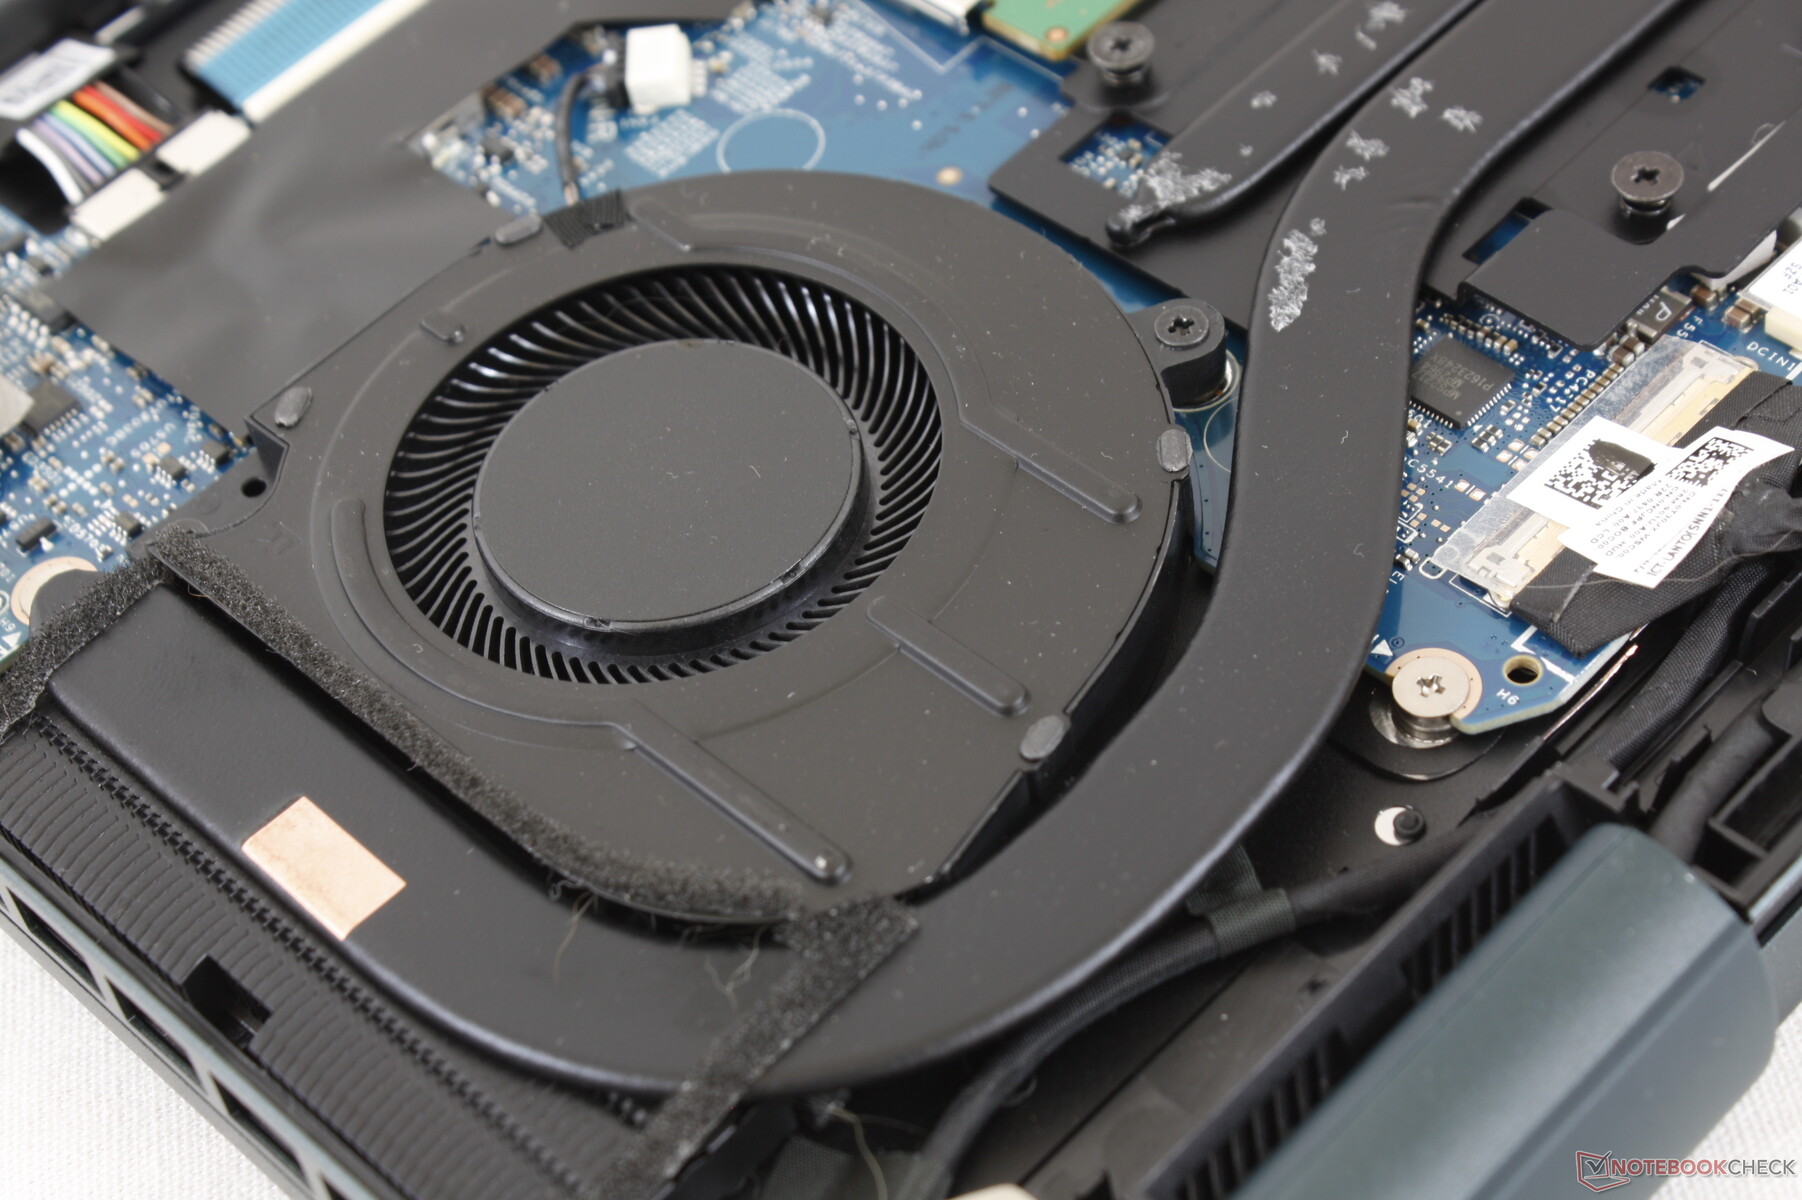
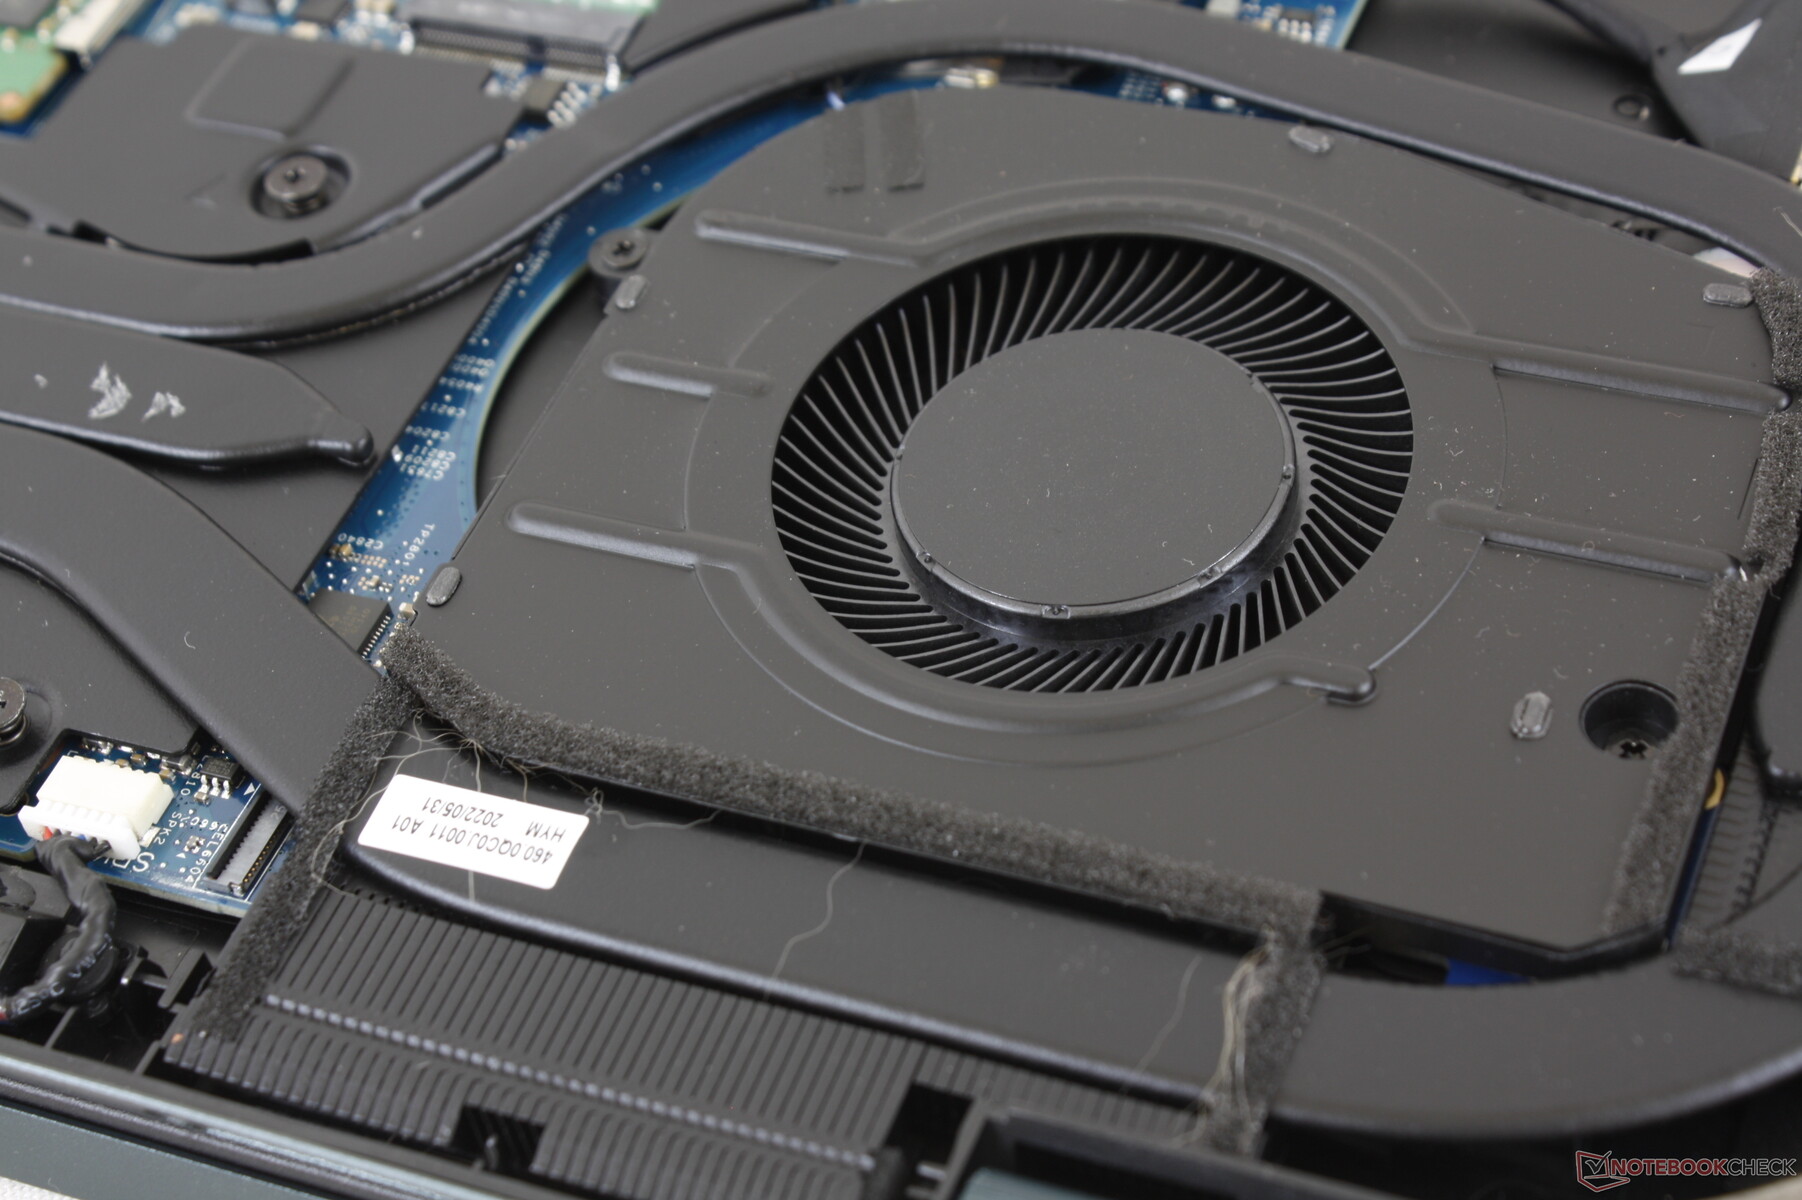
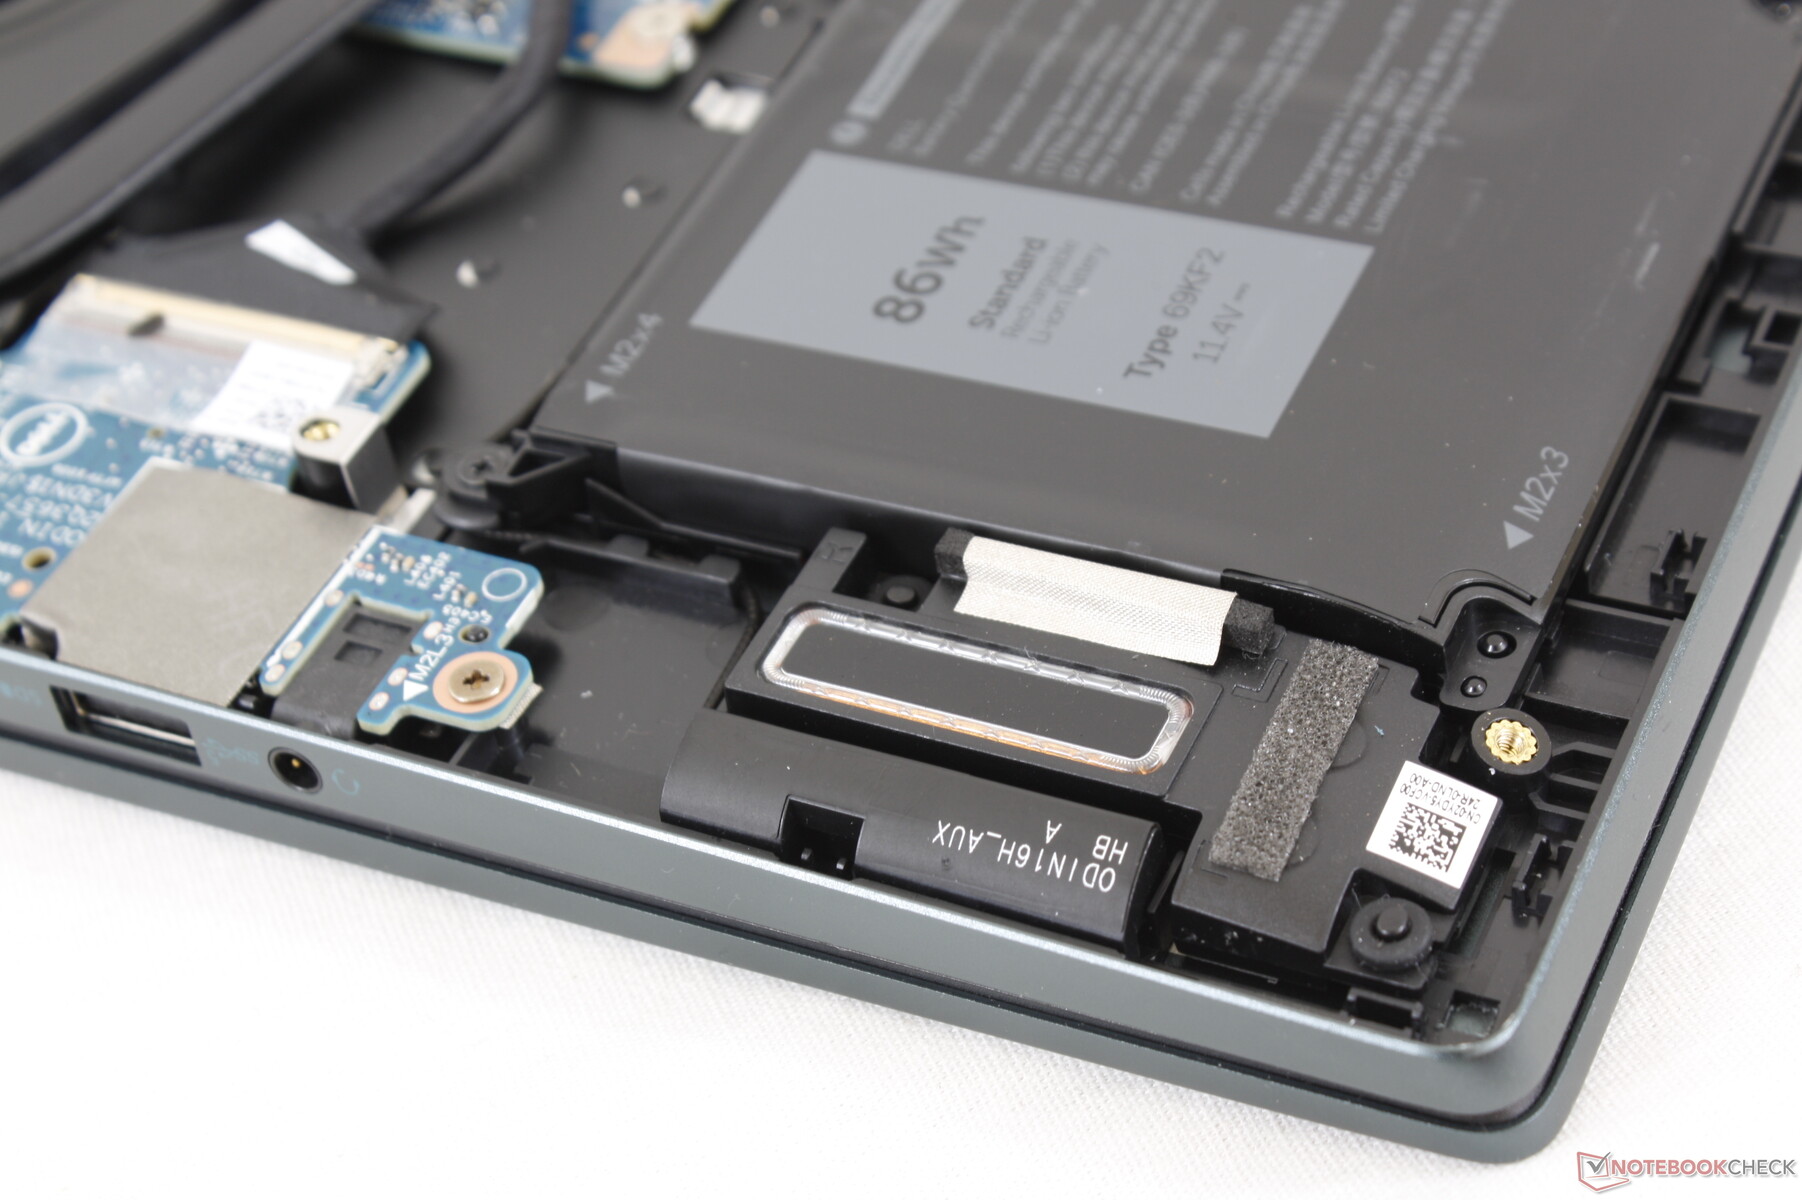
Manutenzione
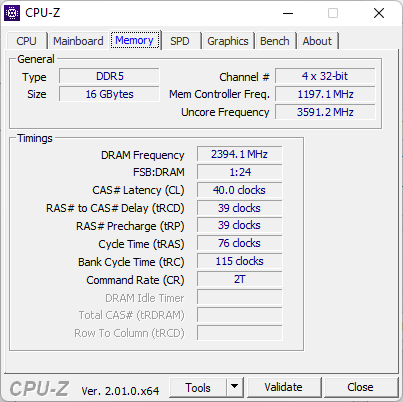
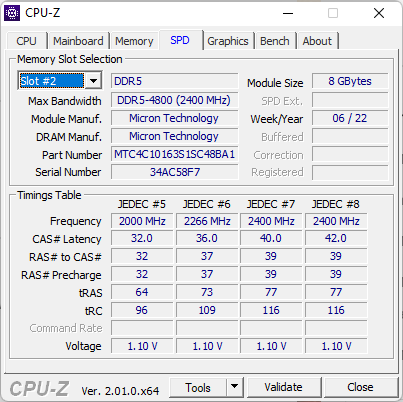
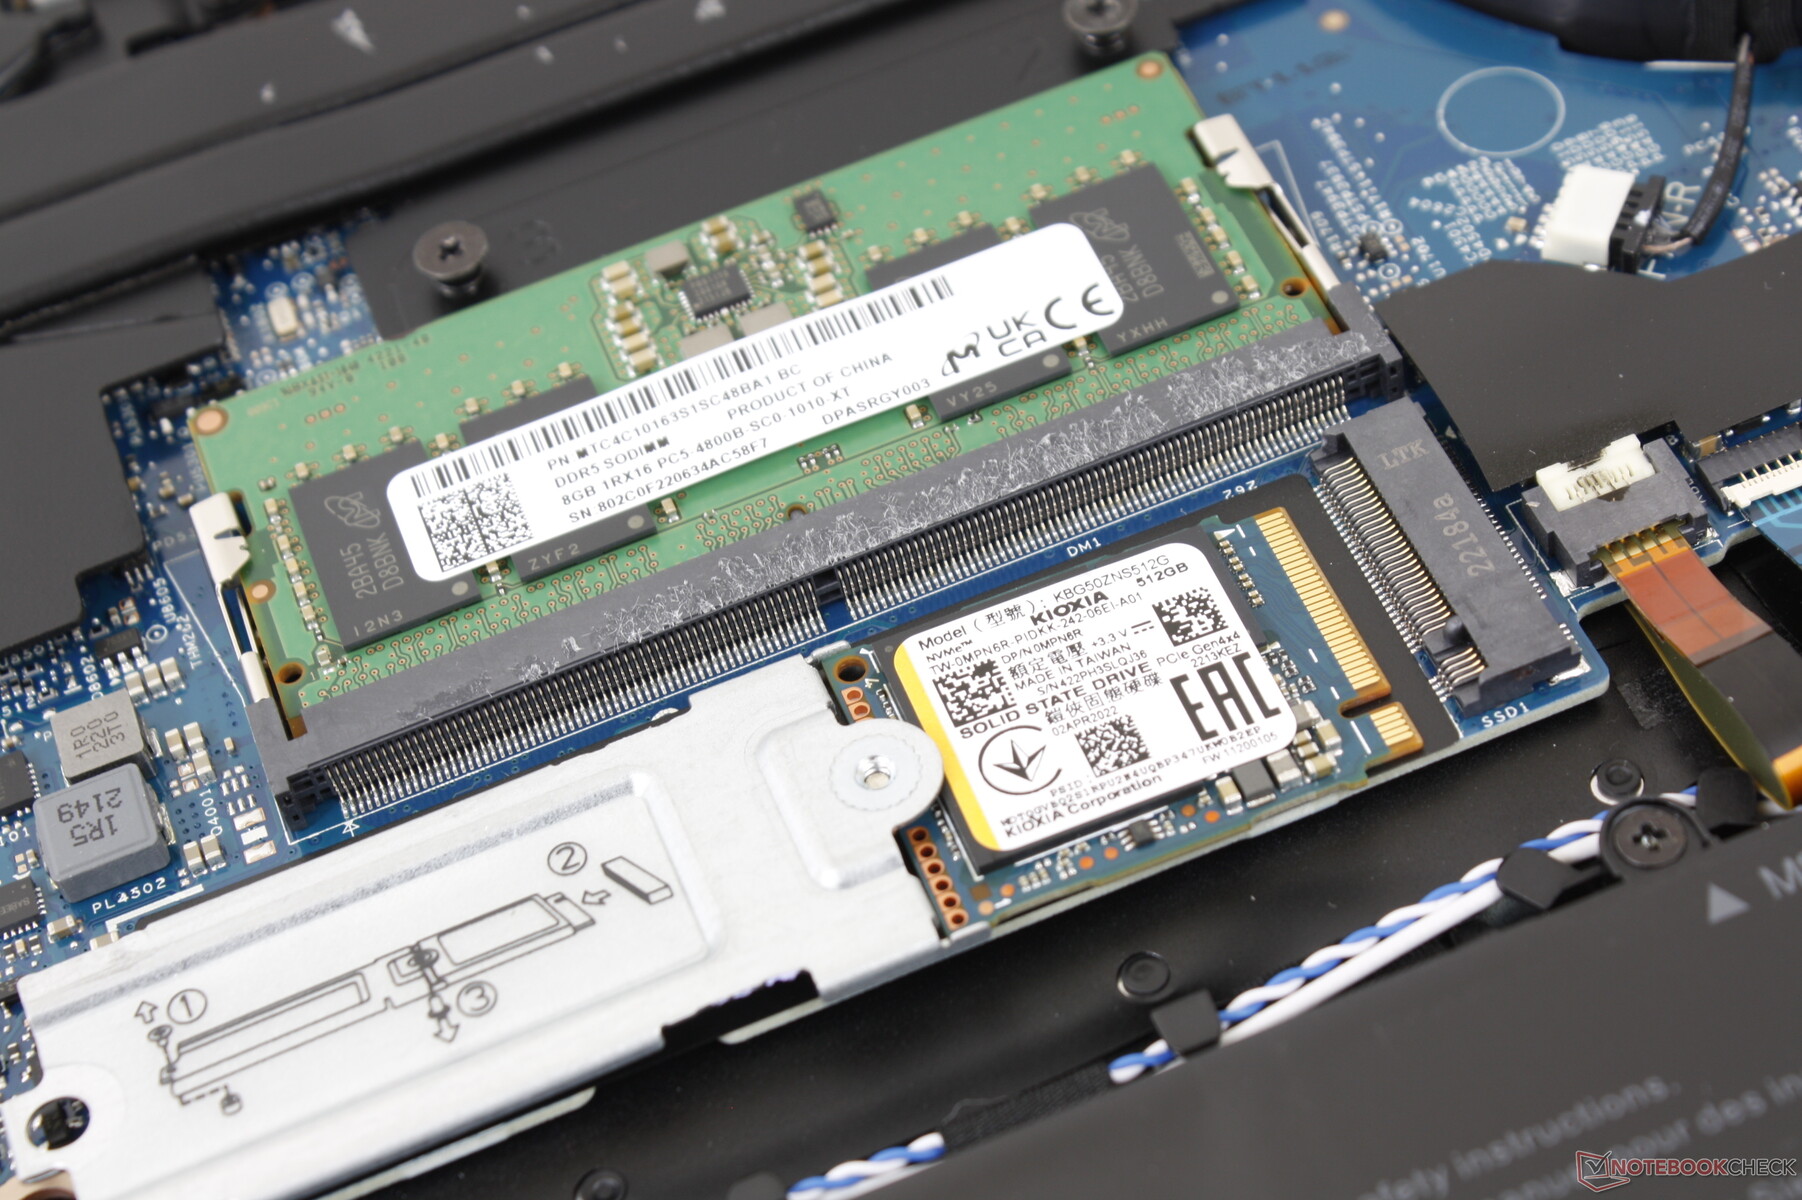
Il pannello inferiore si toglie facilmente con un cacciavite Philips. Una volta all'interno, gli utenti noteranno la nuova soluzione di raffreddamento rispetto al vecchio 7610. Le modifiche hanno rimosso uno slot per SODIMM e uno per SSD M.2 dal 7620, lasciando solo uno slot per SSD e uno per SODIMM, come mostrano le immagini qui sotto. Inoltre, gli utenti che optano per la SKU RTX 3060 avranno a disposizione due slot SODIMM.
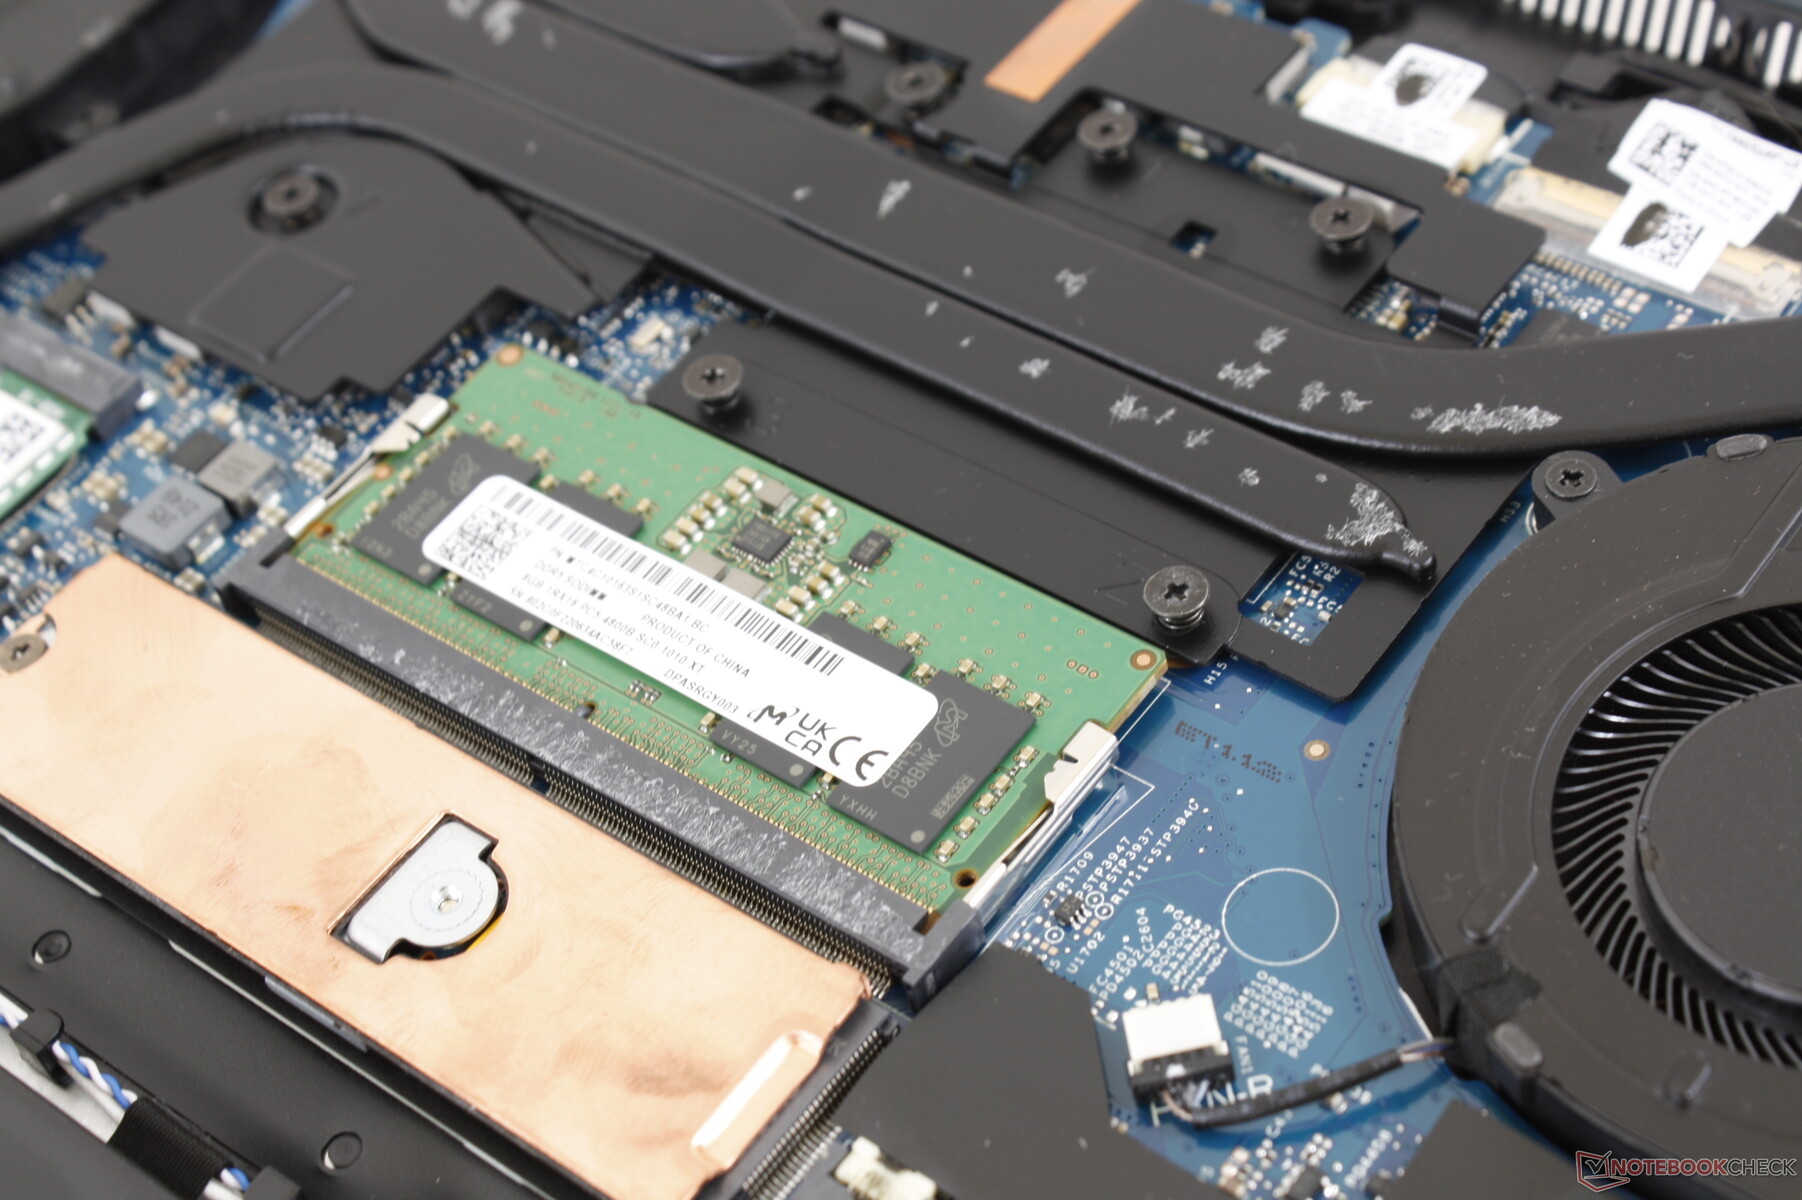
8 GB di RAM sono saldati sulla nostra scheda per un massimo di 40 GB se configurati con un modulo RAM DDR5 rimovibile da 32 GB. Le SKU RTX 3060 possono essere configurate con un massimo di 64 GB poiché dispongono di 2 slot SODIMM e non hanno RAM saldata.
Accessori e garanzia
La confezione non contiene altri extra oltre all'adattatore CA e alla documentazione. La garanzia standard limitata di un anno è valida se acquistata negli Stati Uniti.
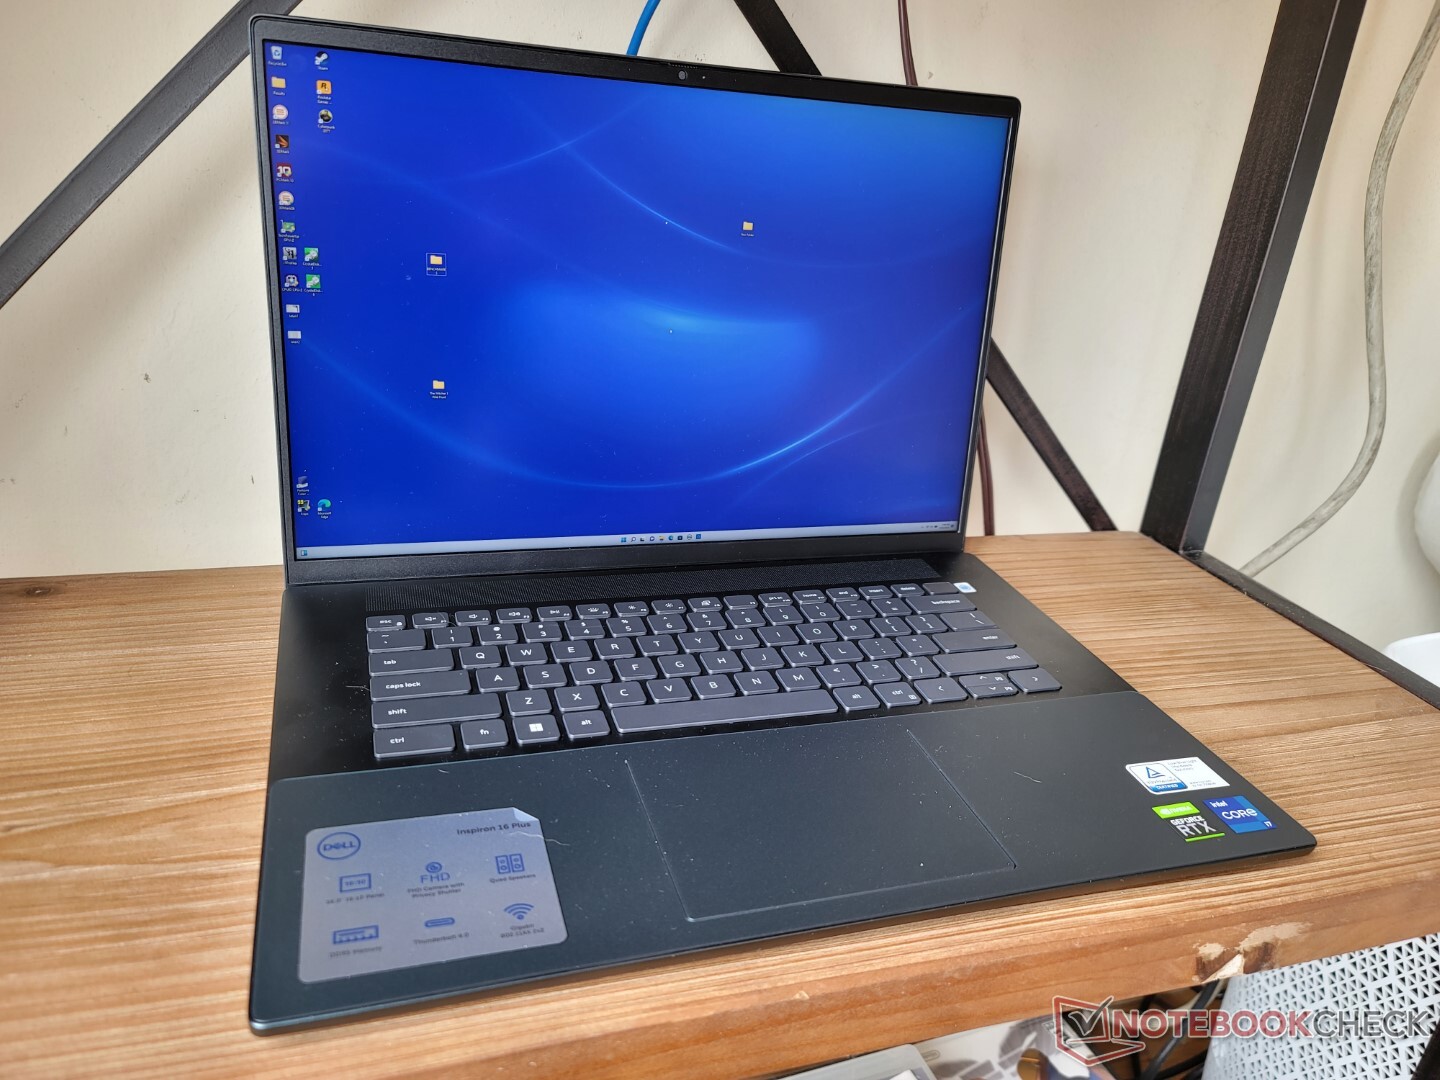
Dispositivi di input: gli stessi dell'Inspiron 16 Plus 7620 2-in-1
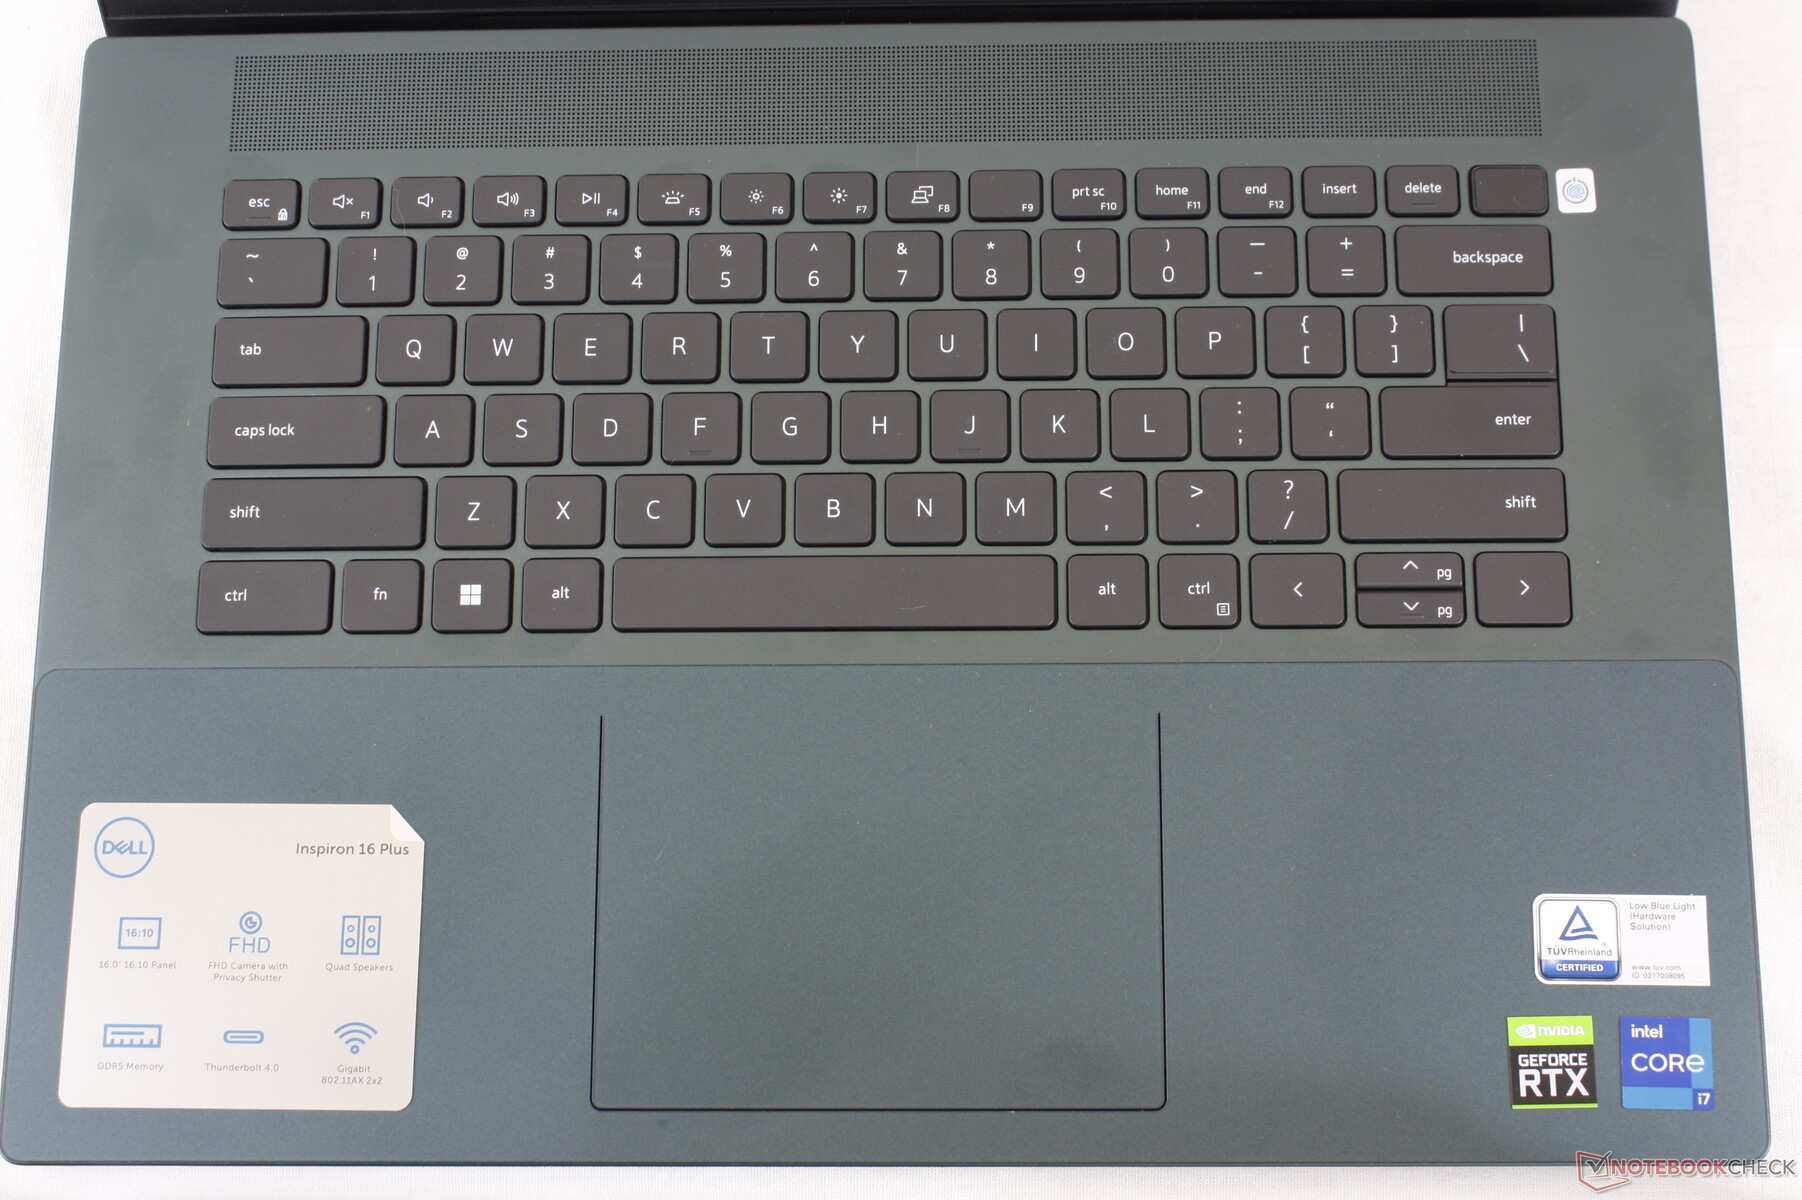
Tastiera
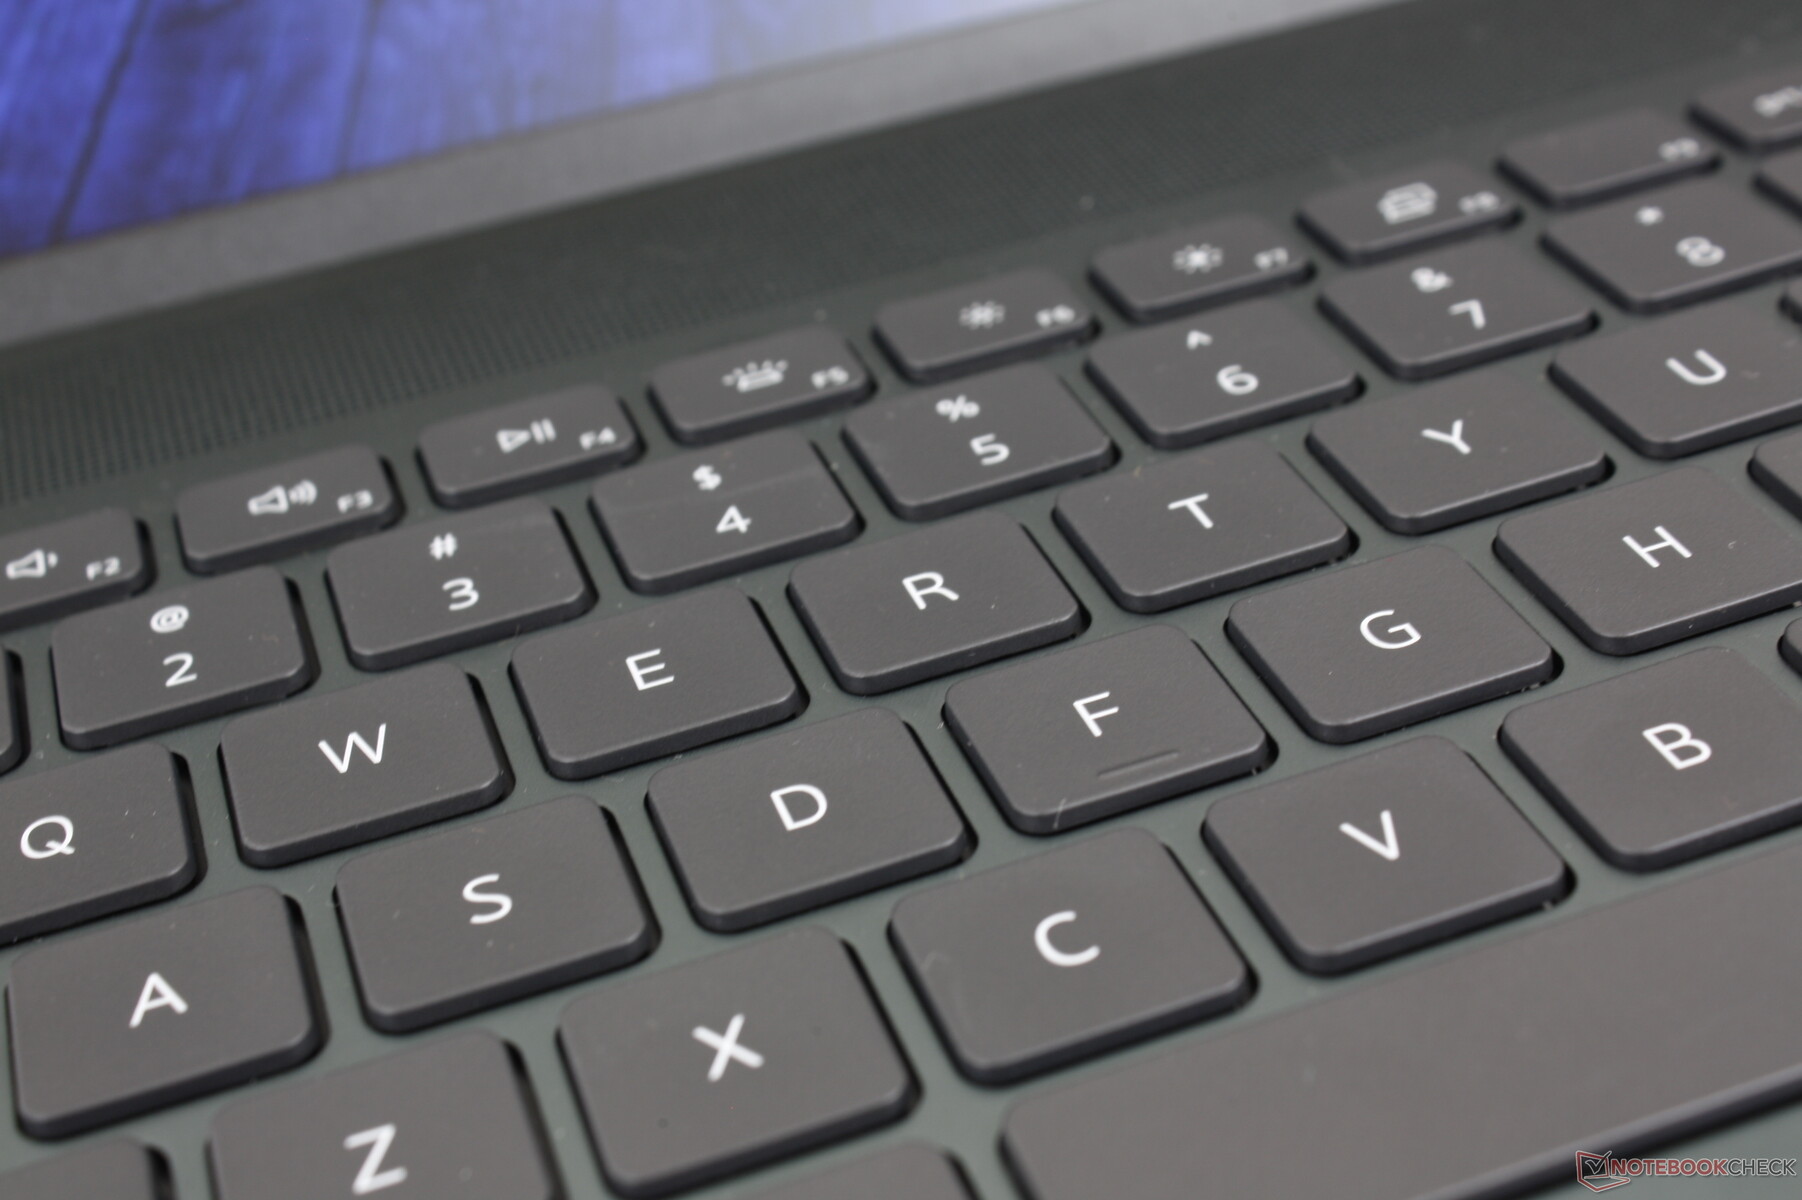
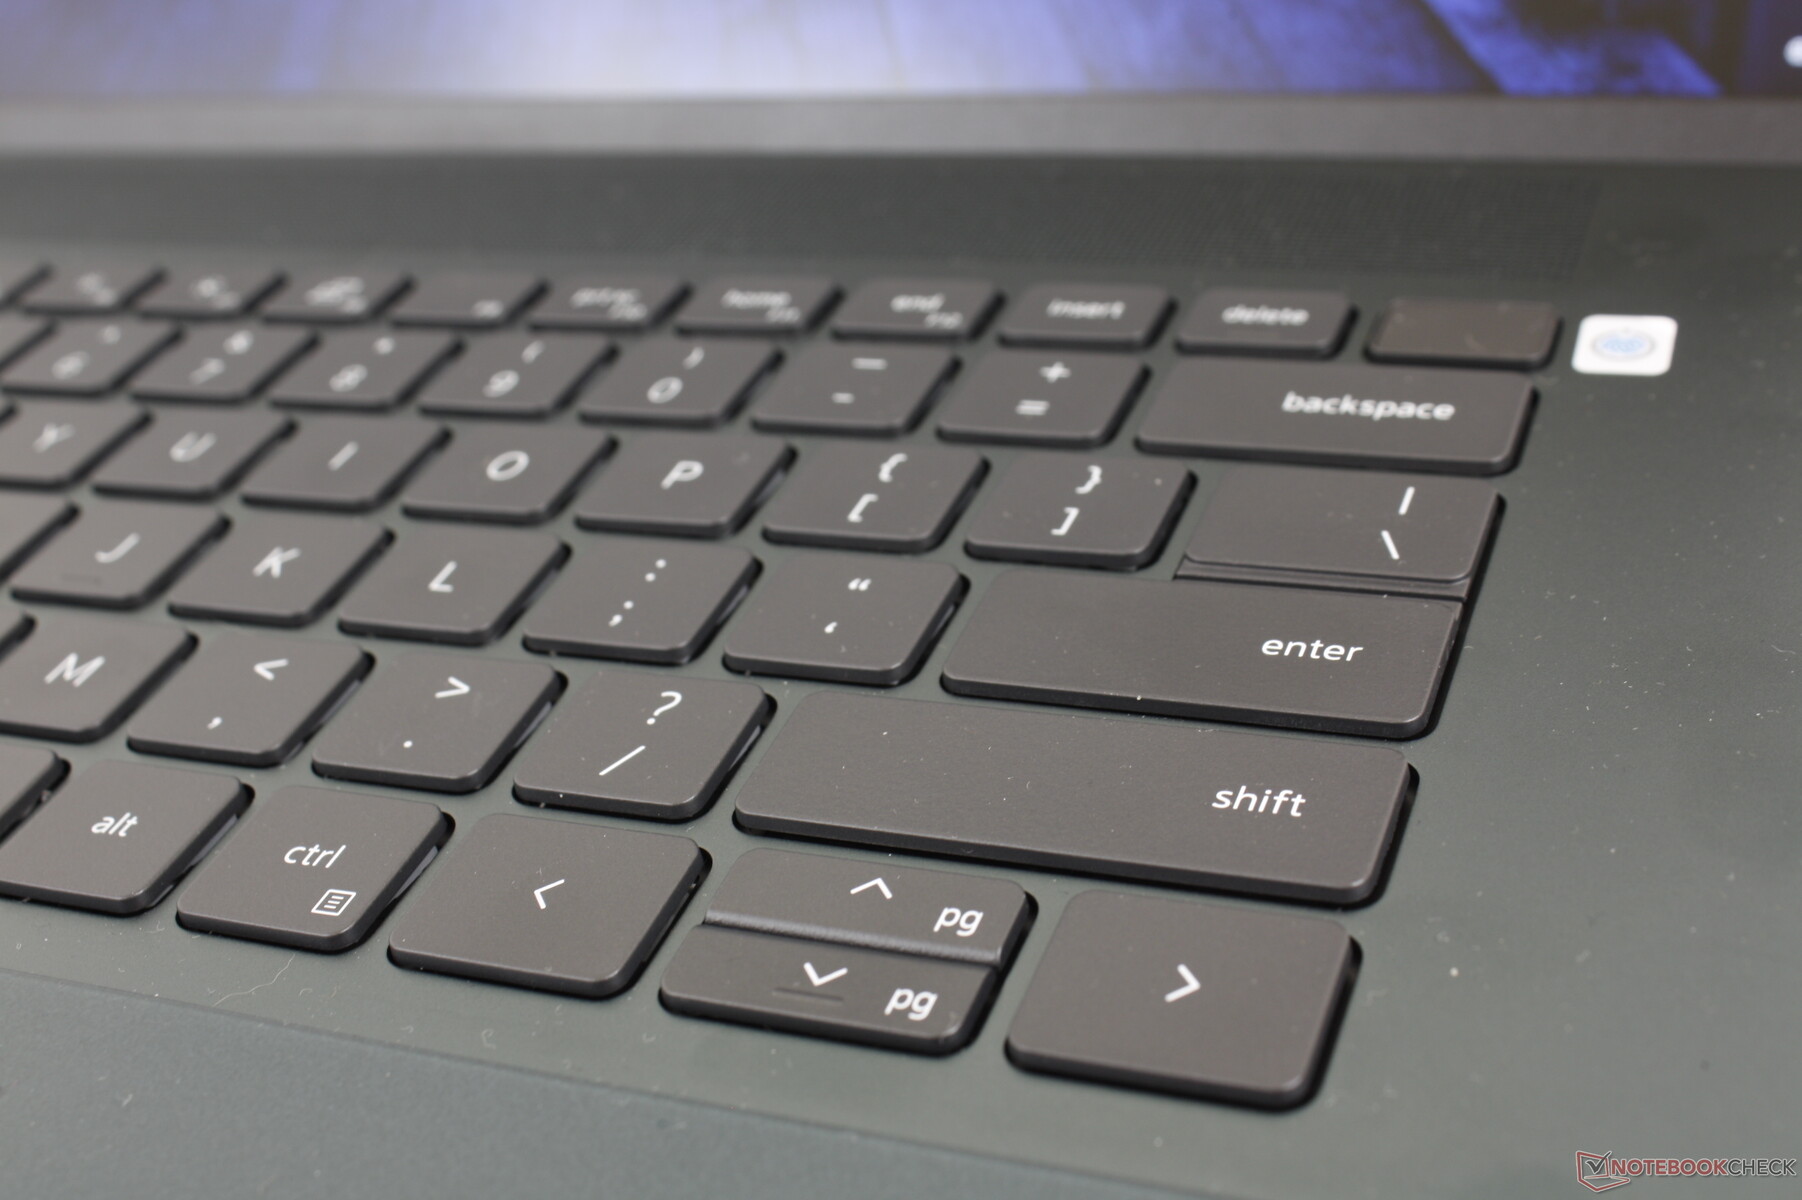
Quest'anno Dell ha rinnovato la tastiera escludendo il tastierino numerico. Per il resto, l'esperienza di digitazione è simile a quella del modelloInspiron 16 Plus 7620 2-in-1 in quanto i tasti sono ancora leggermente più morbidi di quelli dell'LG Gram 16 o della serie HP Spectre.
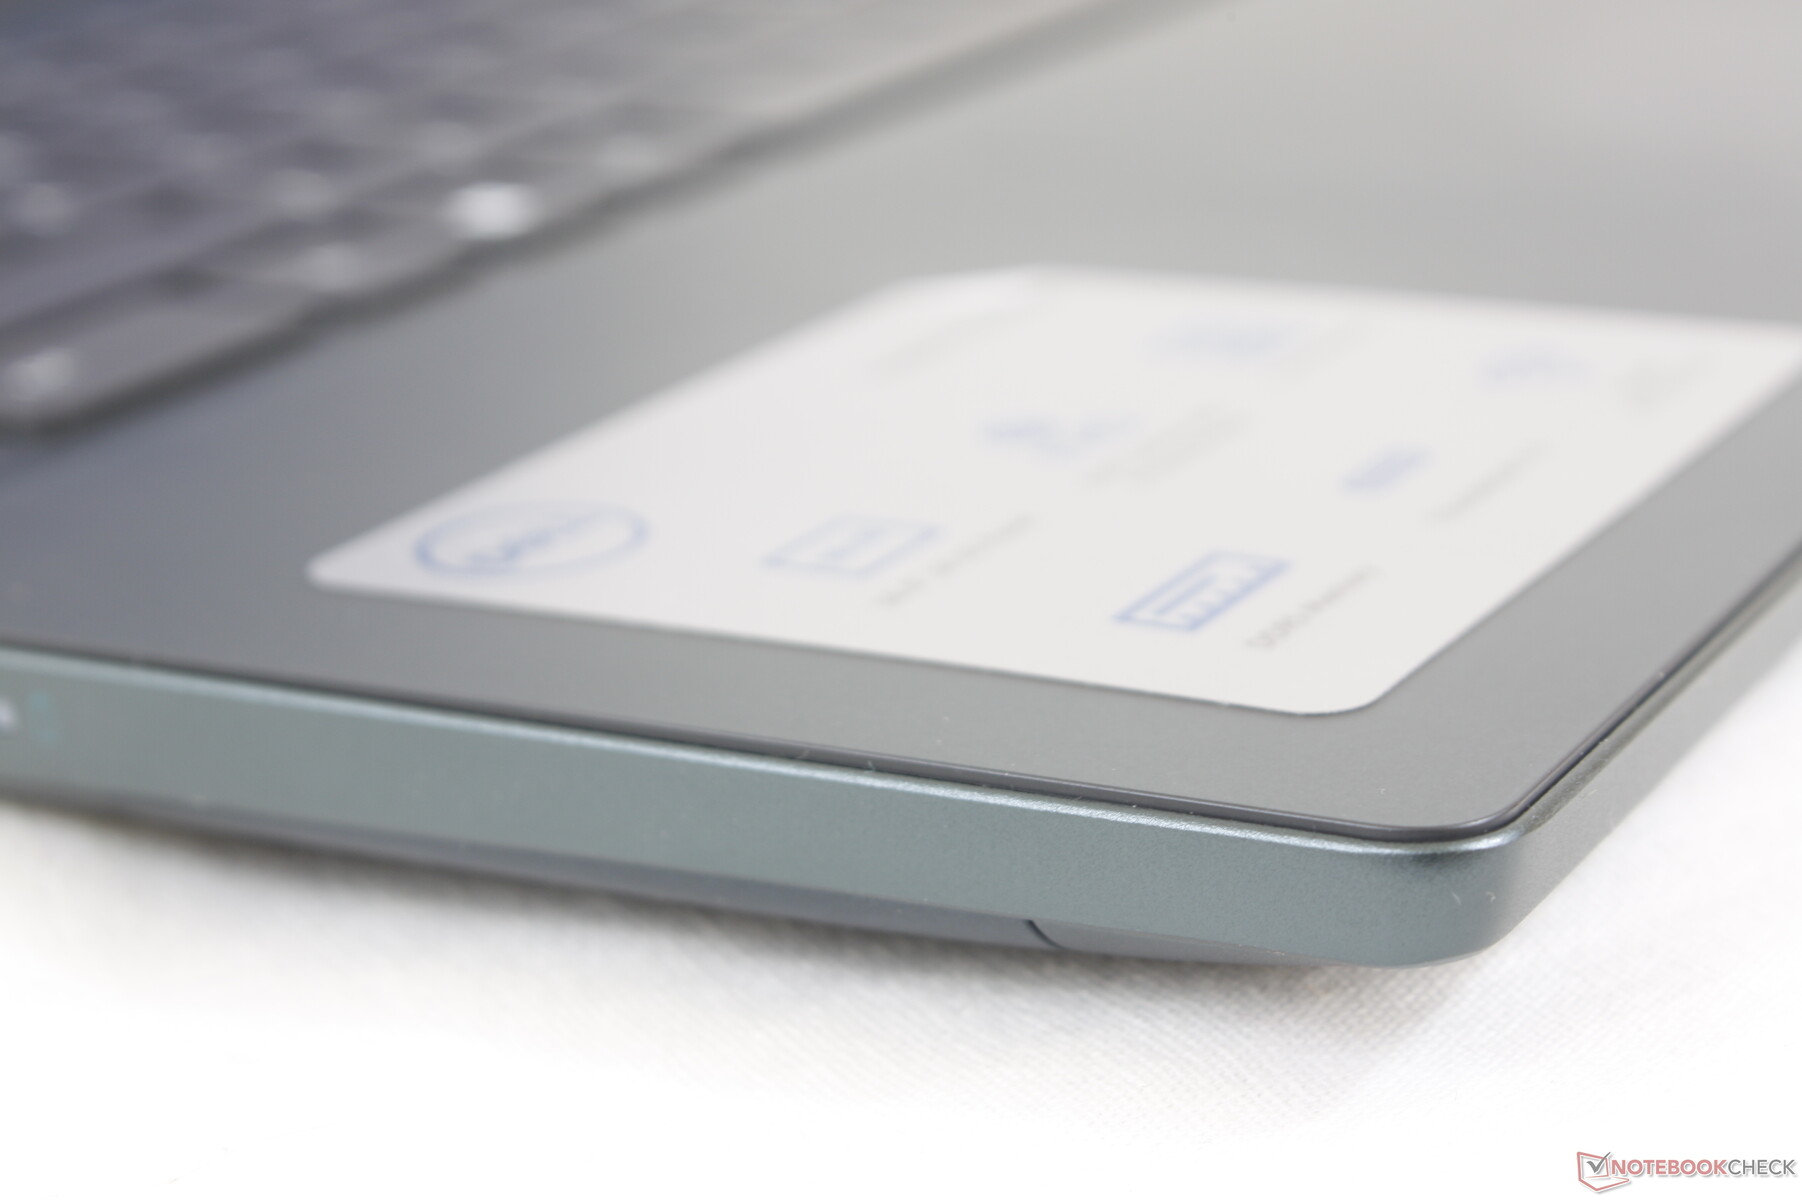
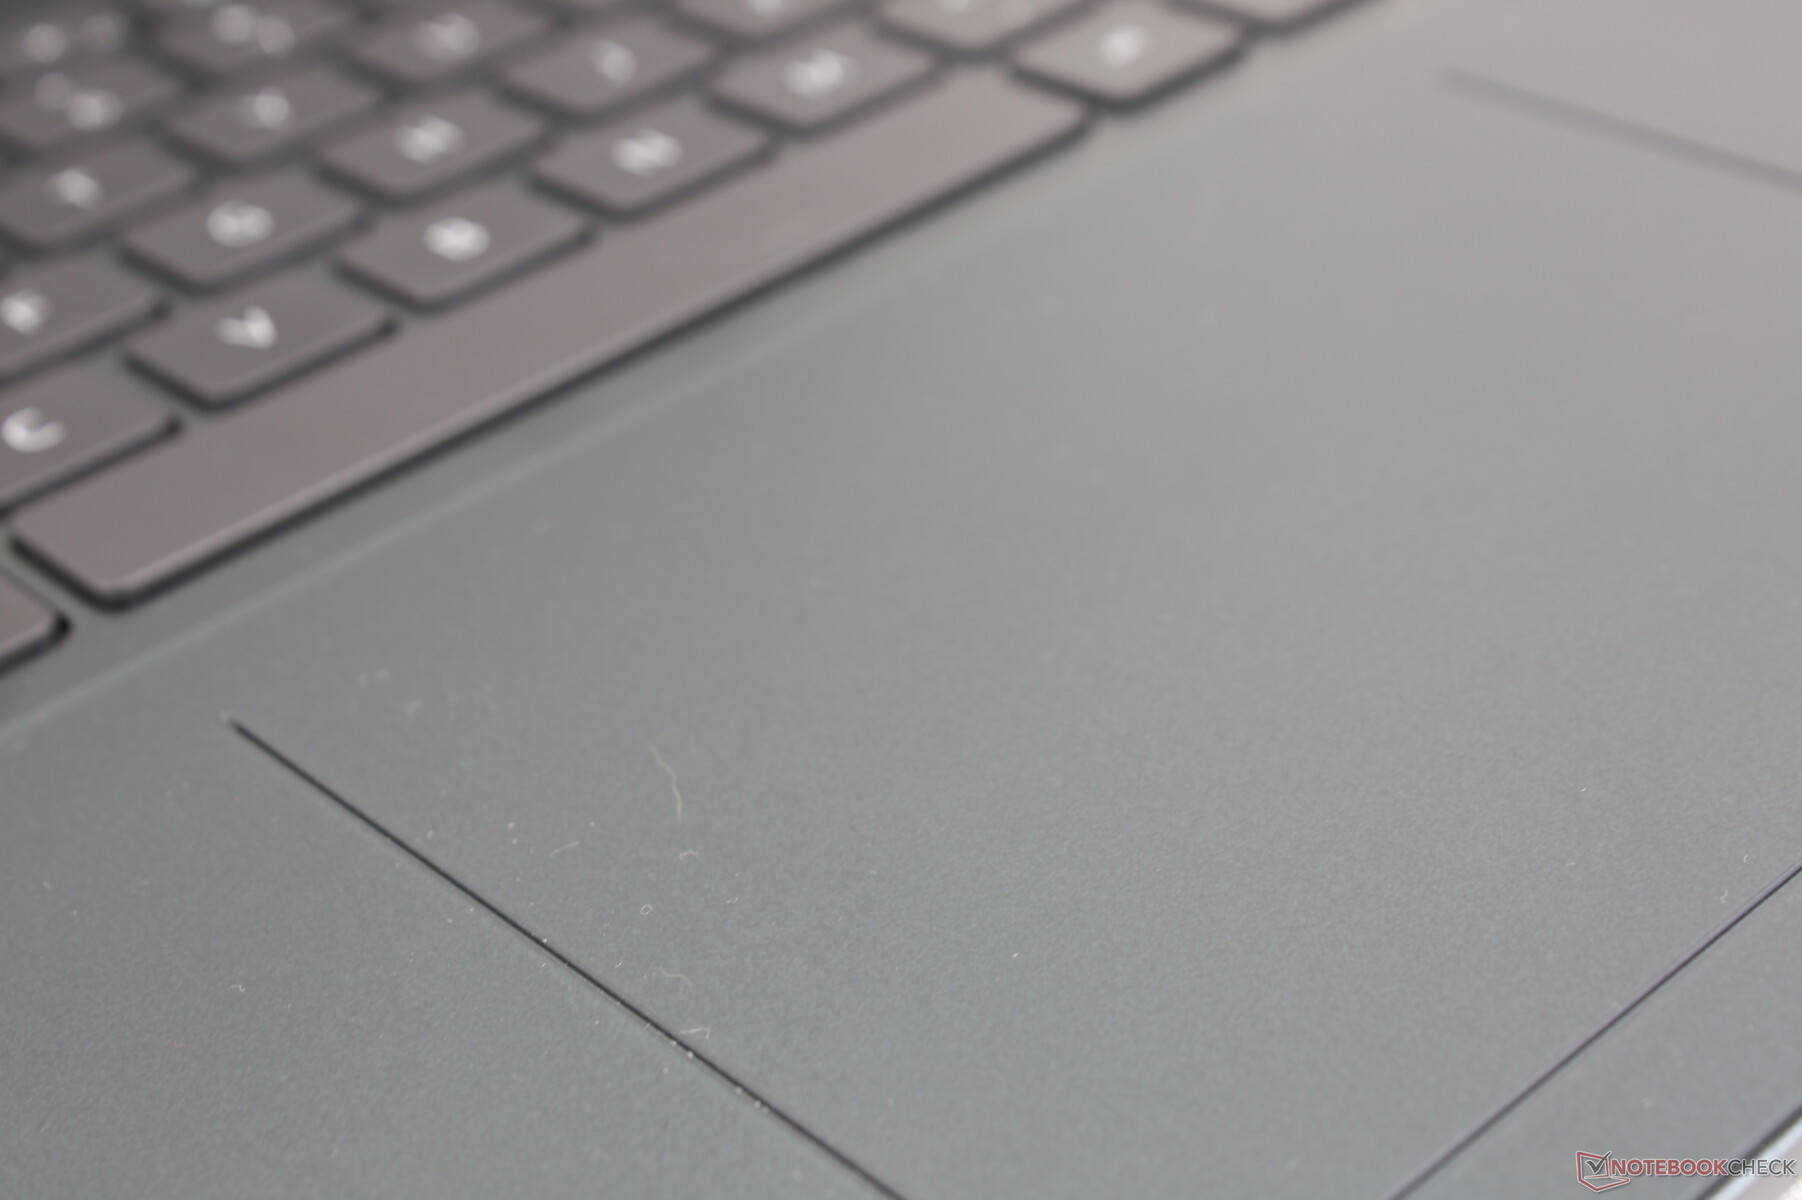
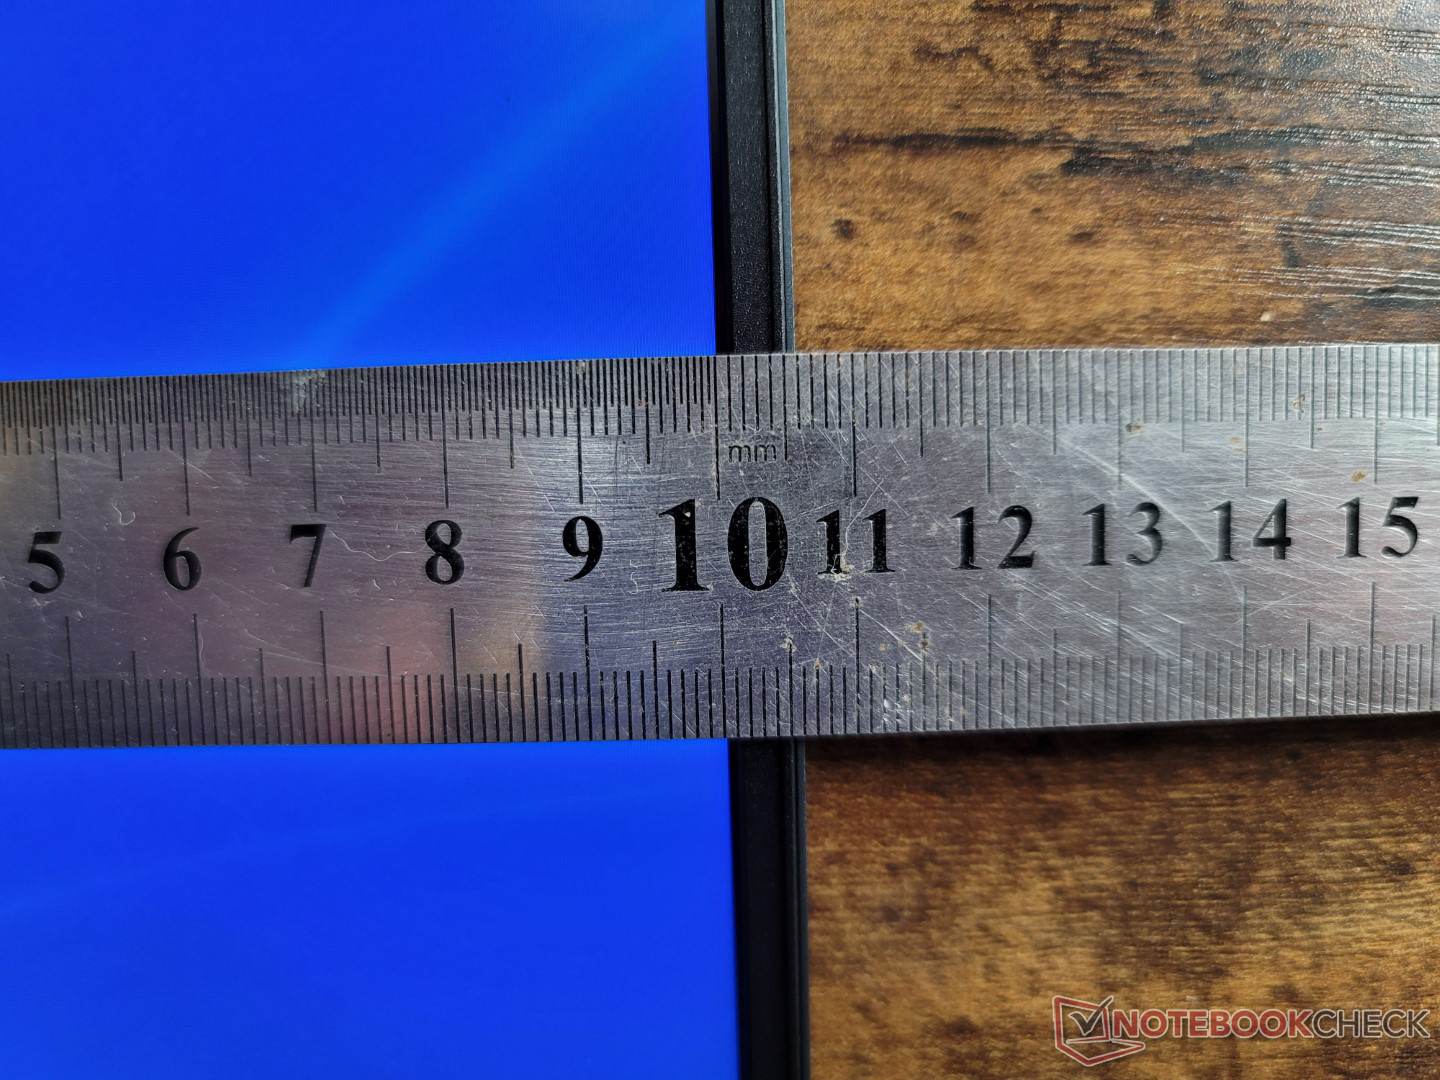
Touchpad
Il clickpad del nostro modello 2022 è più piccolo di quello del modello 2021 (11,5 x 8 cm contro 13,5 x 9 cm) per essere alla pari con quello dell'Inspiron 16 7620 2-in-1. La nuova superficie in Mylar è perfetta per il controllo del cursore, in quanto è liscia quando scivola velocemente ma leggermente appiccicosa quando scivola lentamente per un clic più preciso. Tuttavia, i clic sul clickpad sono ancora più morbidi e spugnosi di quanto vorremmo.
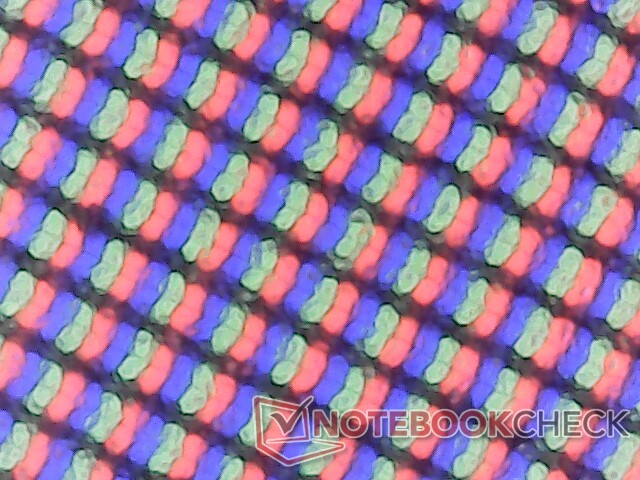
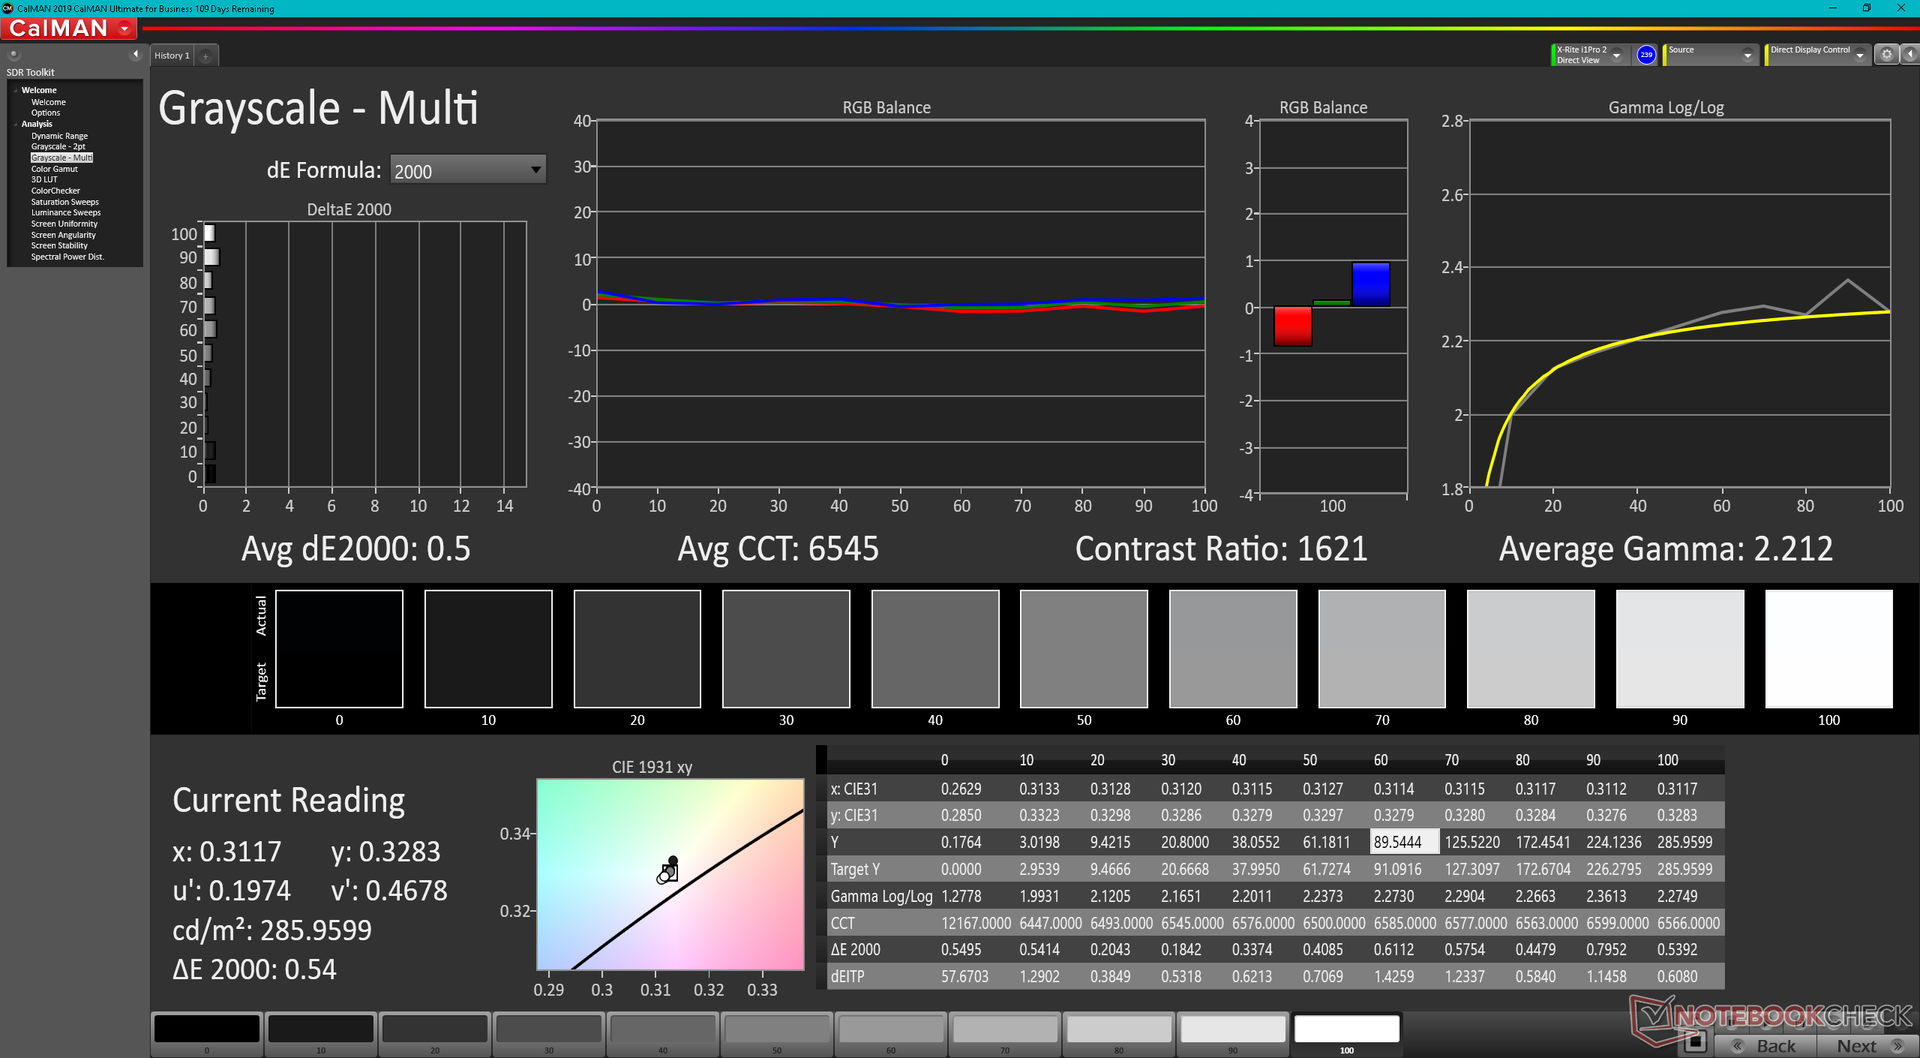
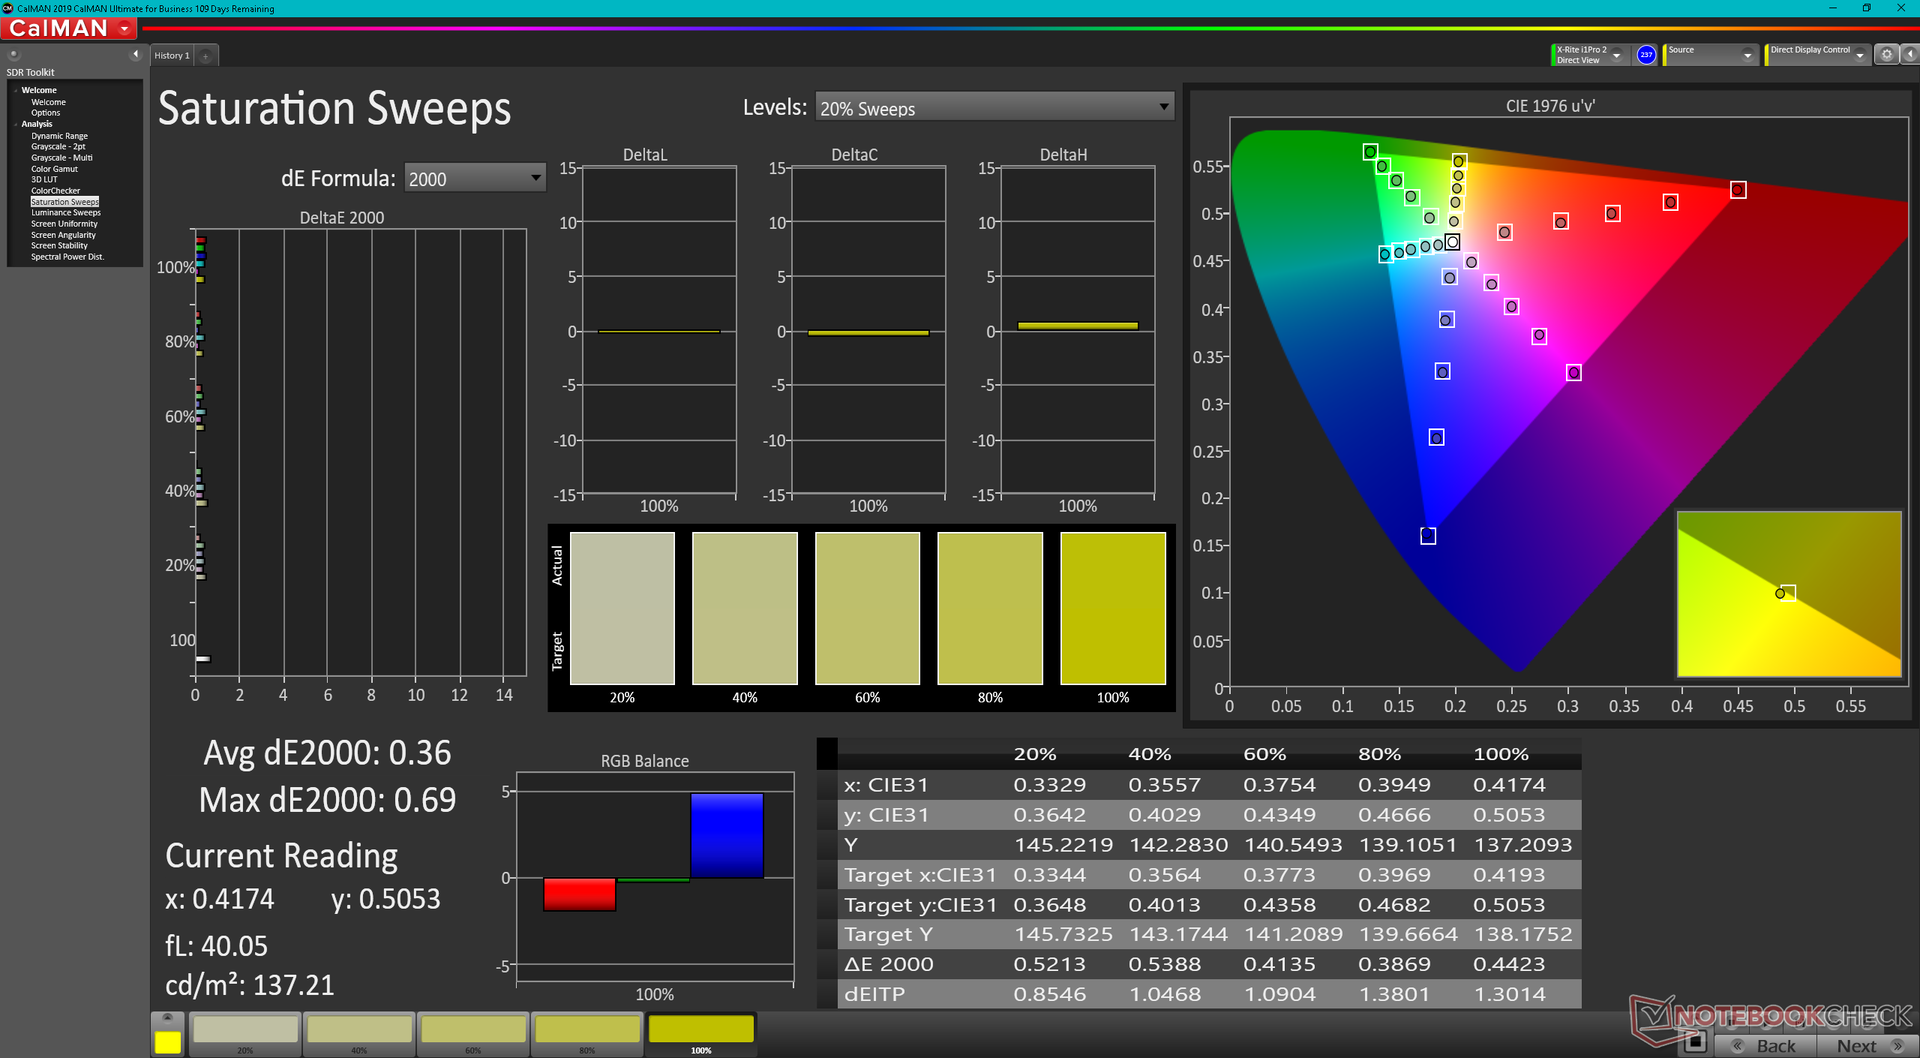
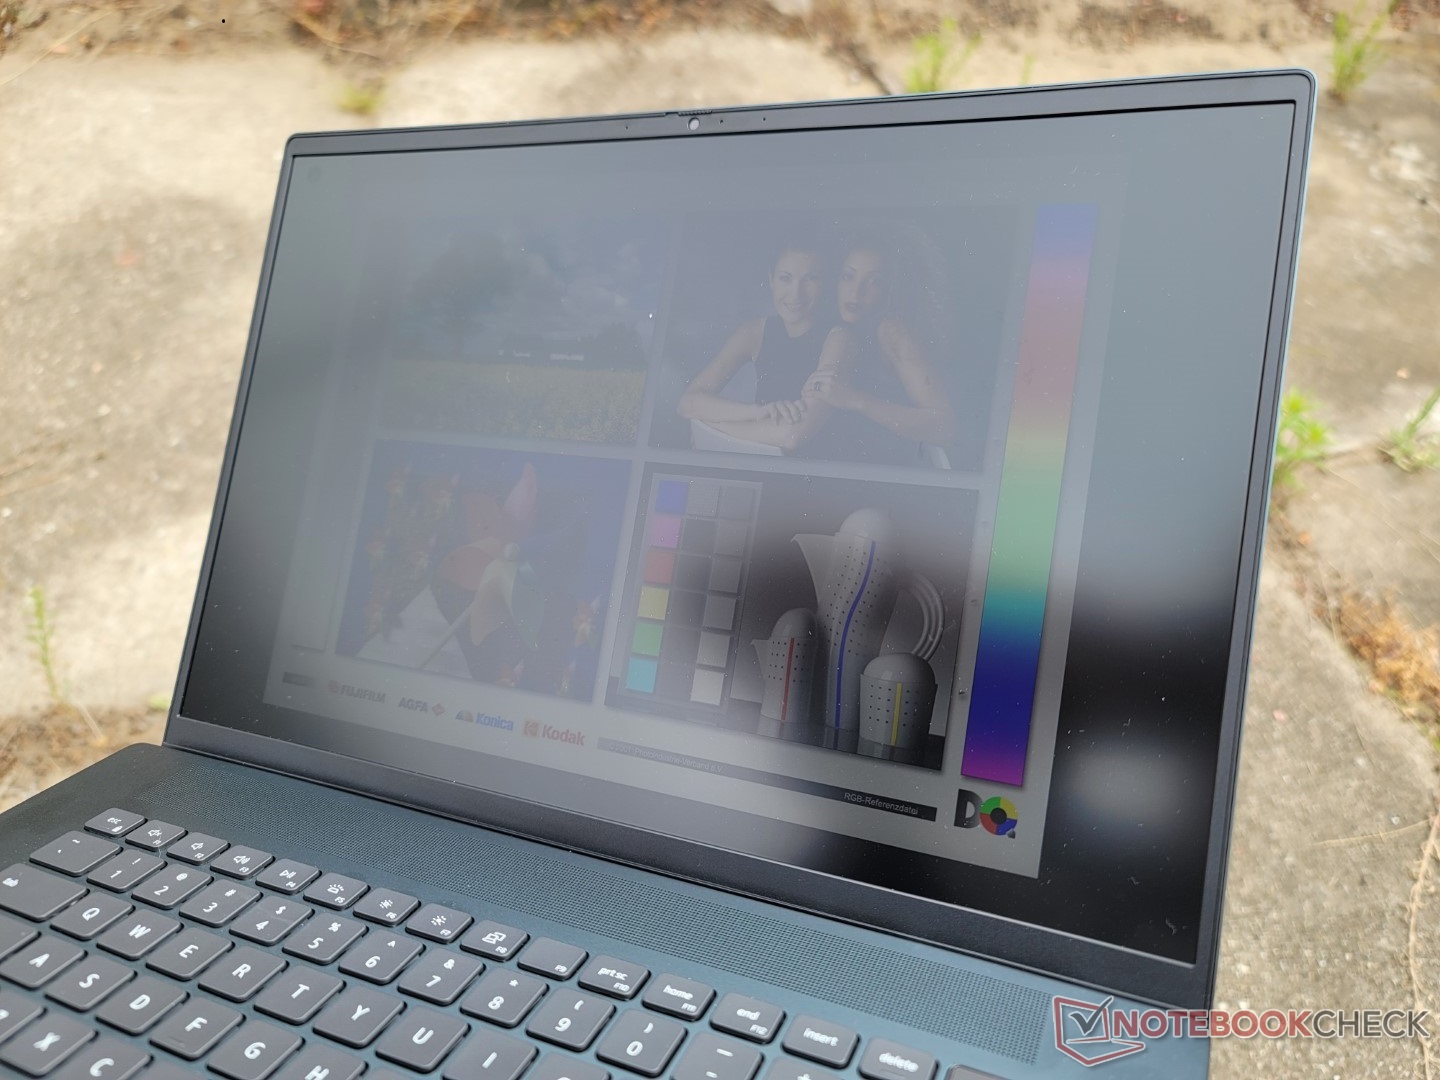
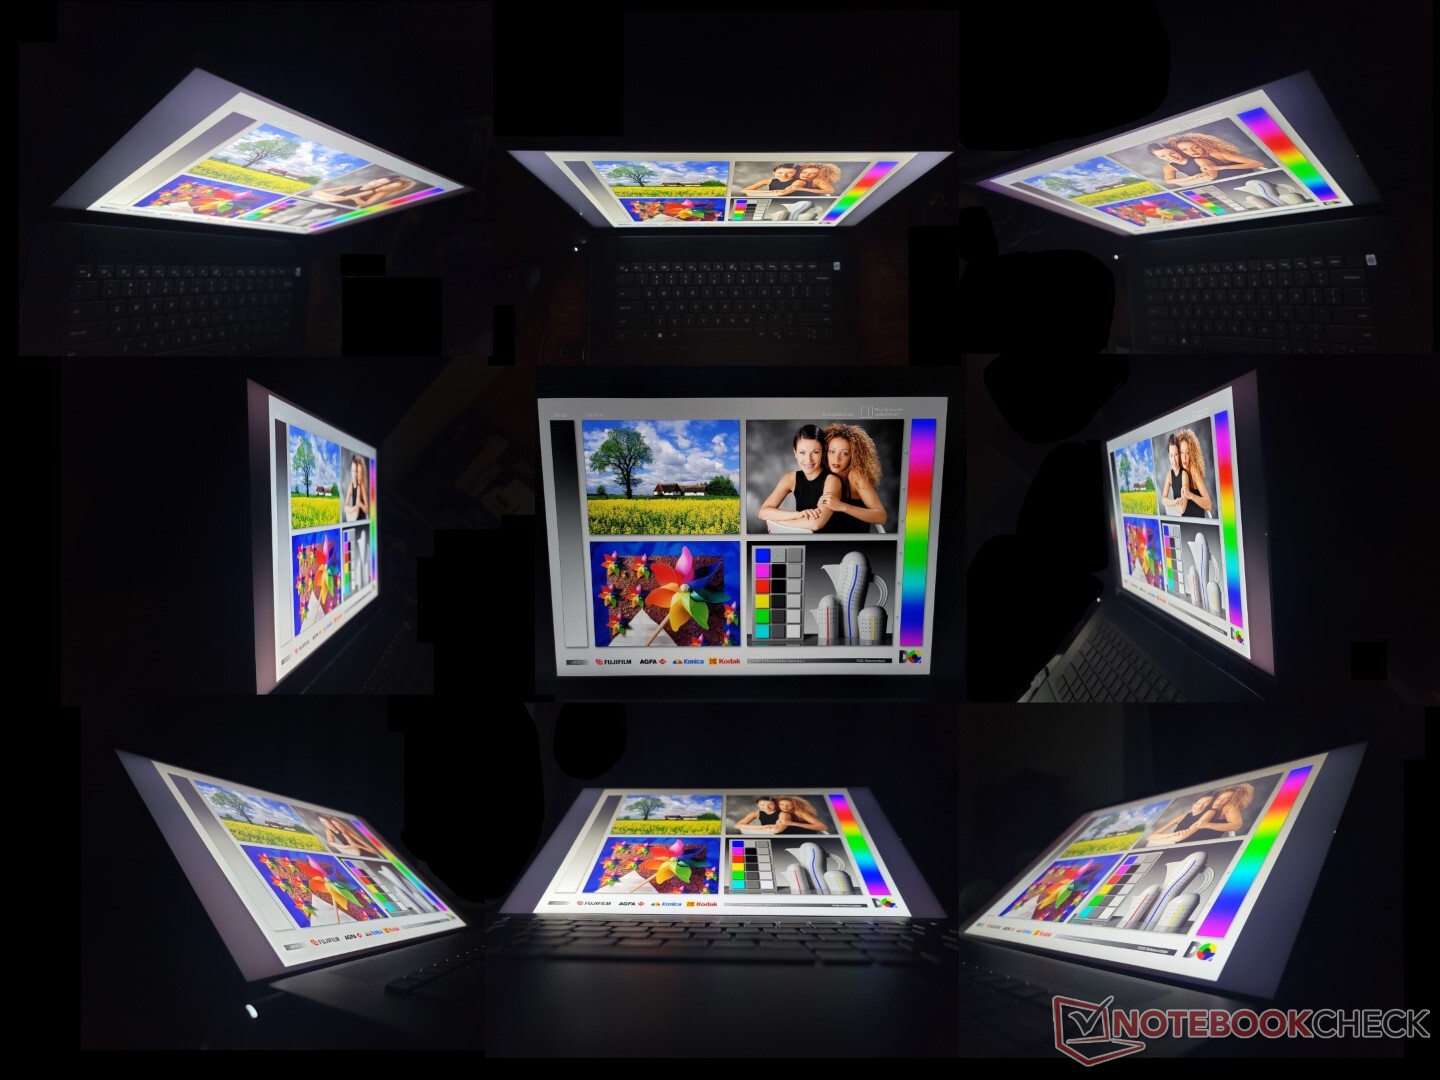
Display - Nessuna modifica di rilievo
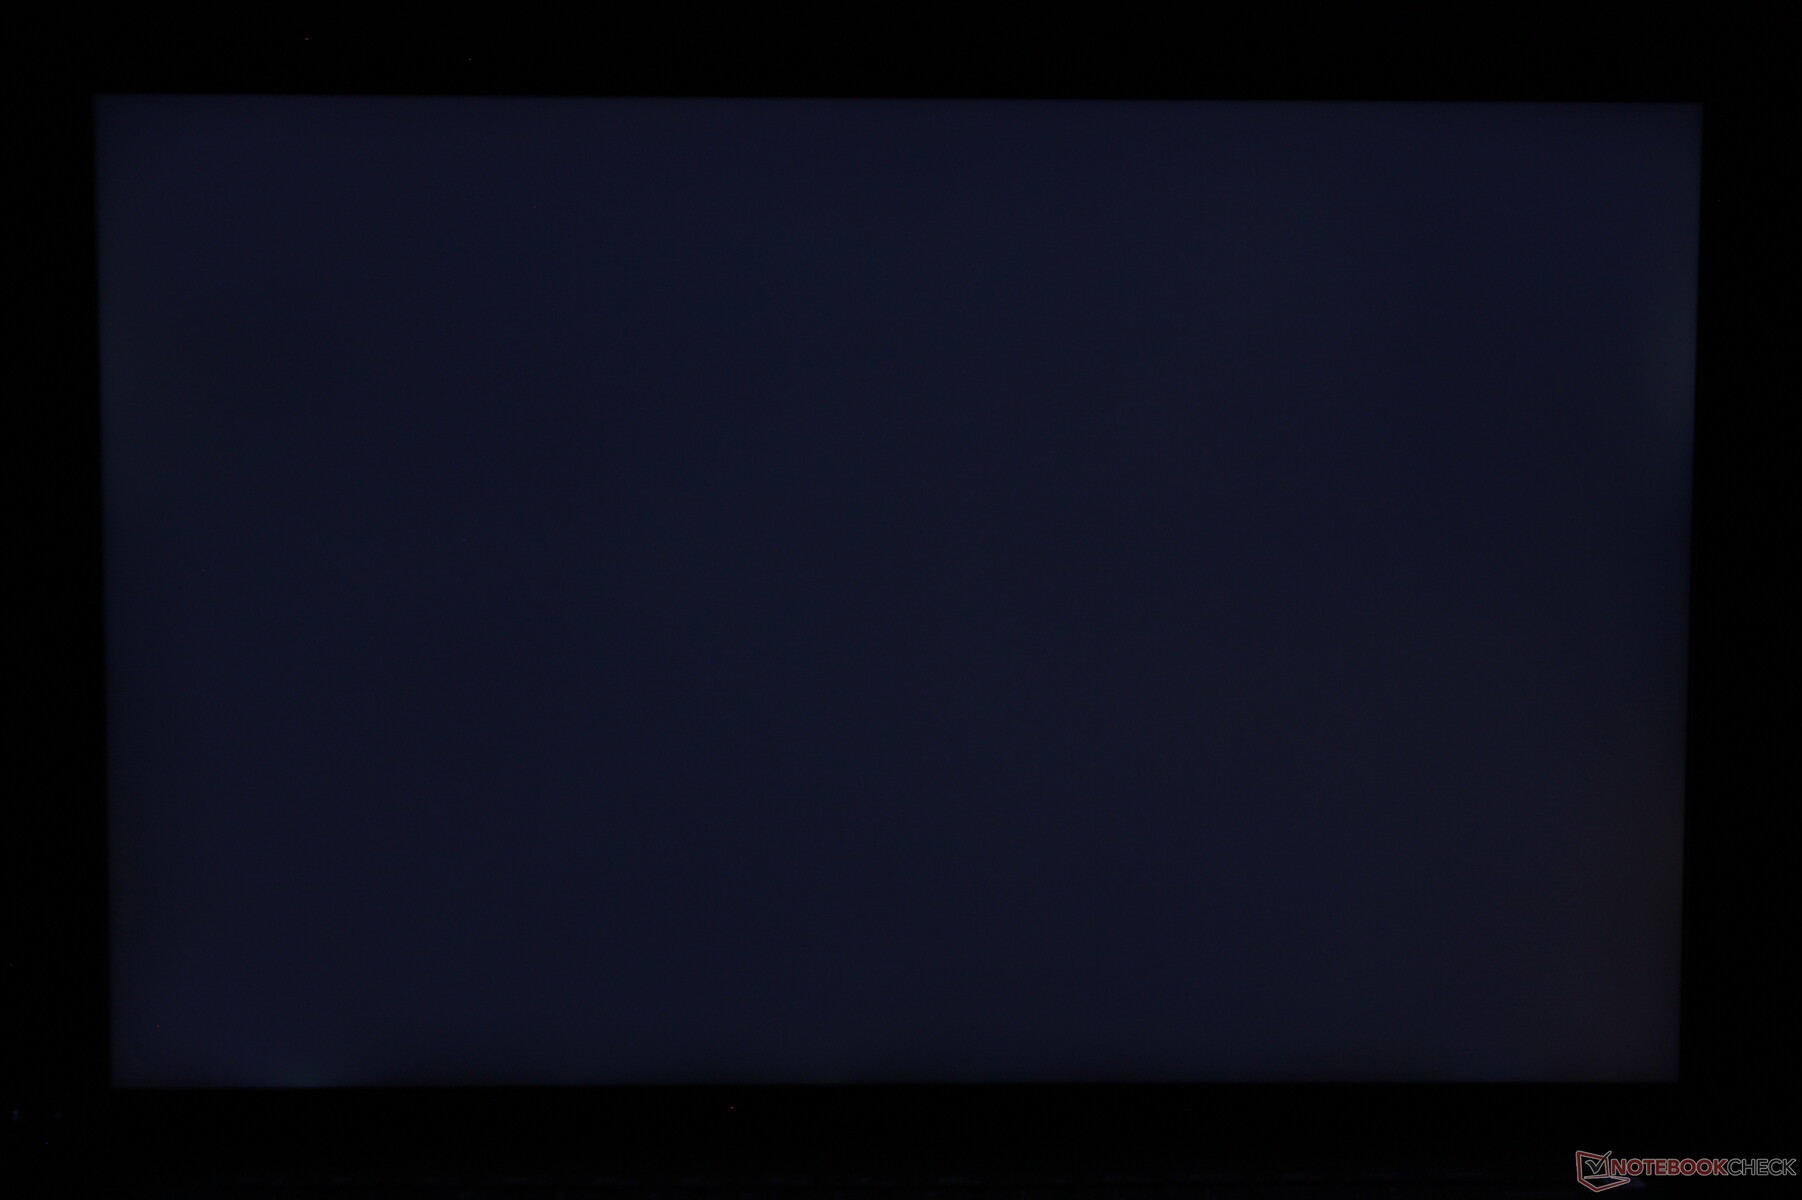
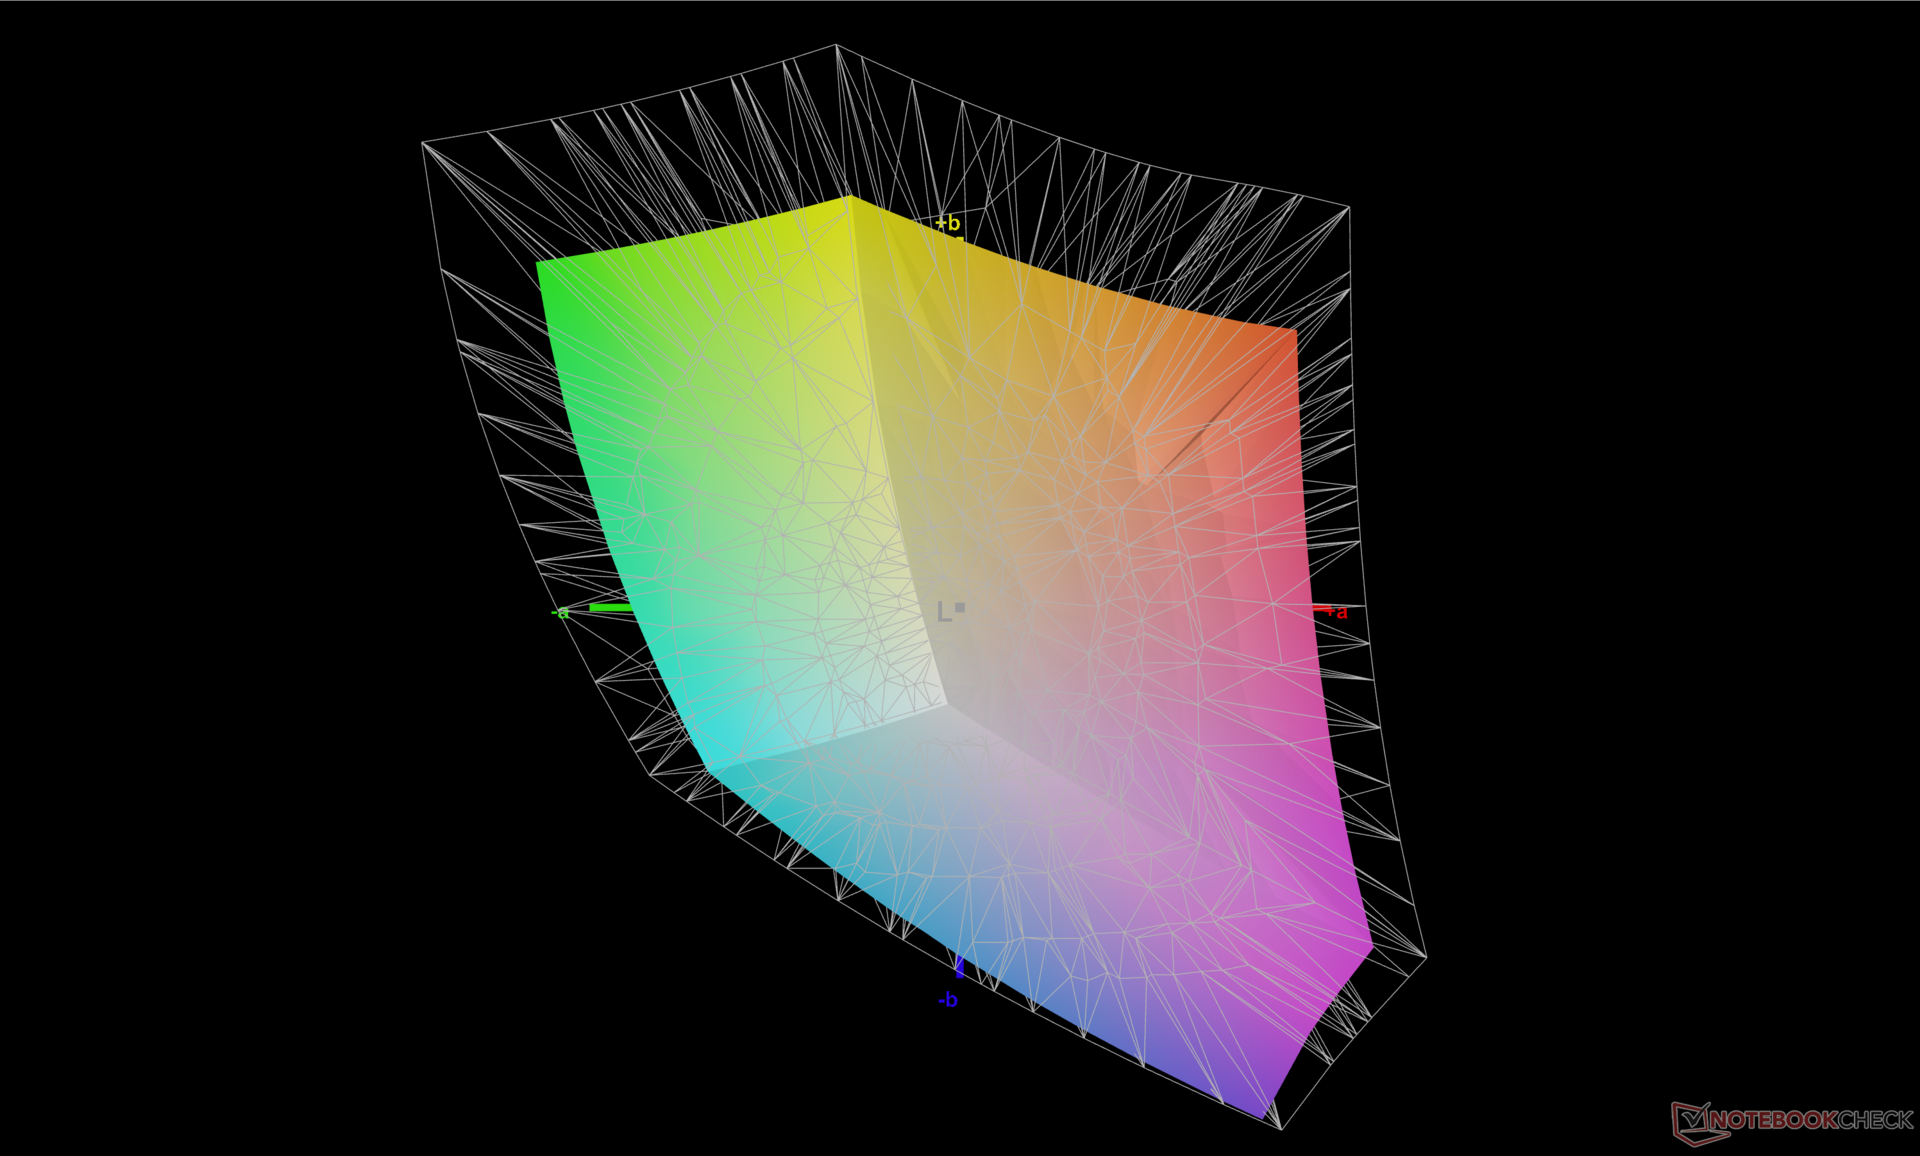
È interessante notare che Dell ha cambiato fornitore di pannelli, passando da AU Optronics per l'Inspiron 16 Plus 7610 dello scorso anno a BOE per quest'ultimo modello. I tempi di risposta sono leggermente più veloci e il ghosting meno grave, ma tutto il resto rimane per lo più invariato, compresa la copertura completa sRGB, il rapporto di contrasto di ~1000:1 e la luminosità massima di ~290 nit
L'esperienza visiva è buona, ma è ancora un passo indietro rispetto alla serie XPS o al pannello OLED dell'Asus VivoBook Pro 16X Asus VivoBook Pro 16X. La qualità dell'immagine è notevolmente più granulosa a causa dell'aggressivo overlay opaco, mentre i colori non sono così vivaci come quelli dell'OLED. Capiamo che la serie Inspiron non è destinata a essere il top di gamma, ma è deludente che Dell non abbia apportato modifiche significative al display quest'anno
È possibile scegliere tra tre pannelli da 300 nit: 3072 x 1920 opaco non touch, 1920 x 1200 opaco non touch e 1920 x 1200 lucido touch. Le nostre misurazioni qui sotto riflettono solo il pannello a risoluzione più alta.
| |||||||||||||||||||||||||
Distribuzione della luminosità: 92 %
Al centro con la batteria: 288.9 cd/m²
Contrasto: 1111:1 (Nero: 0.26 cd/m²)
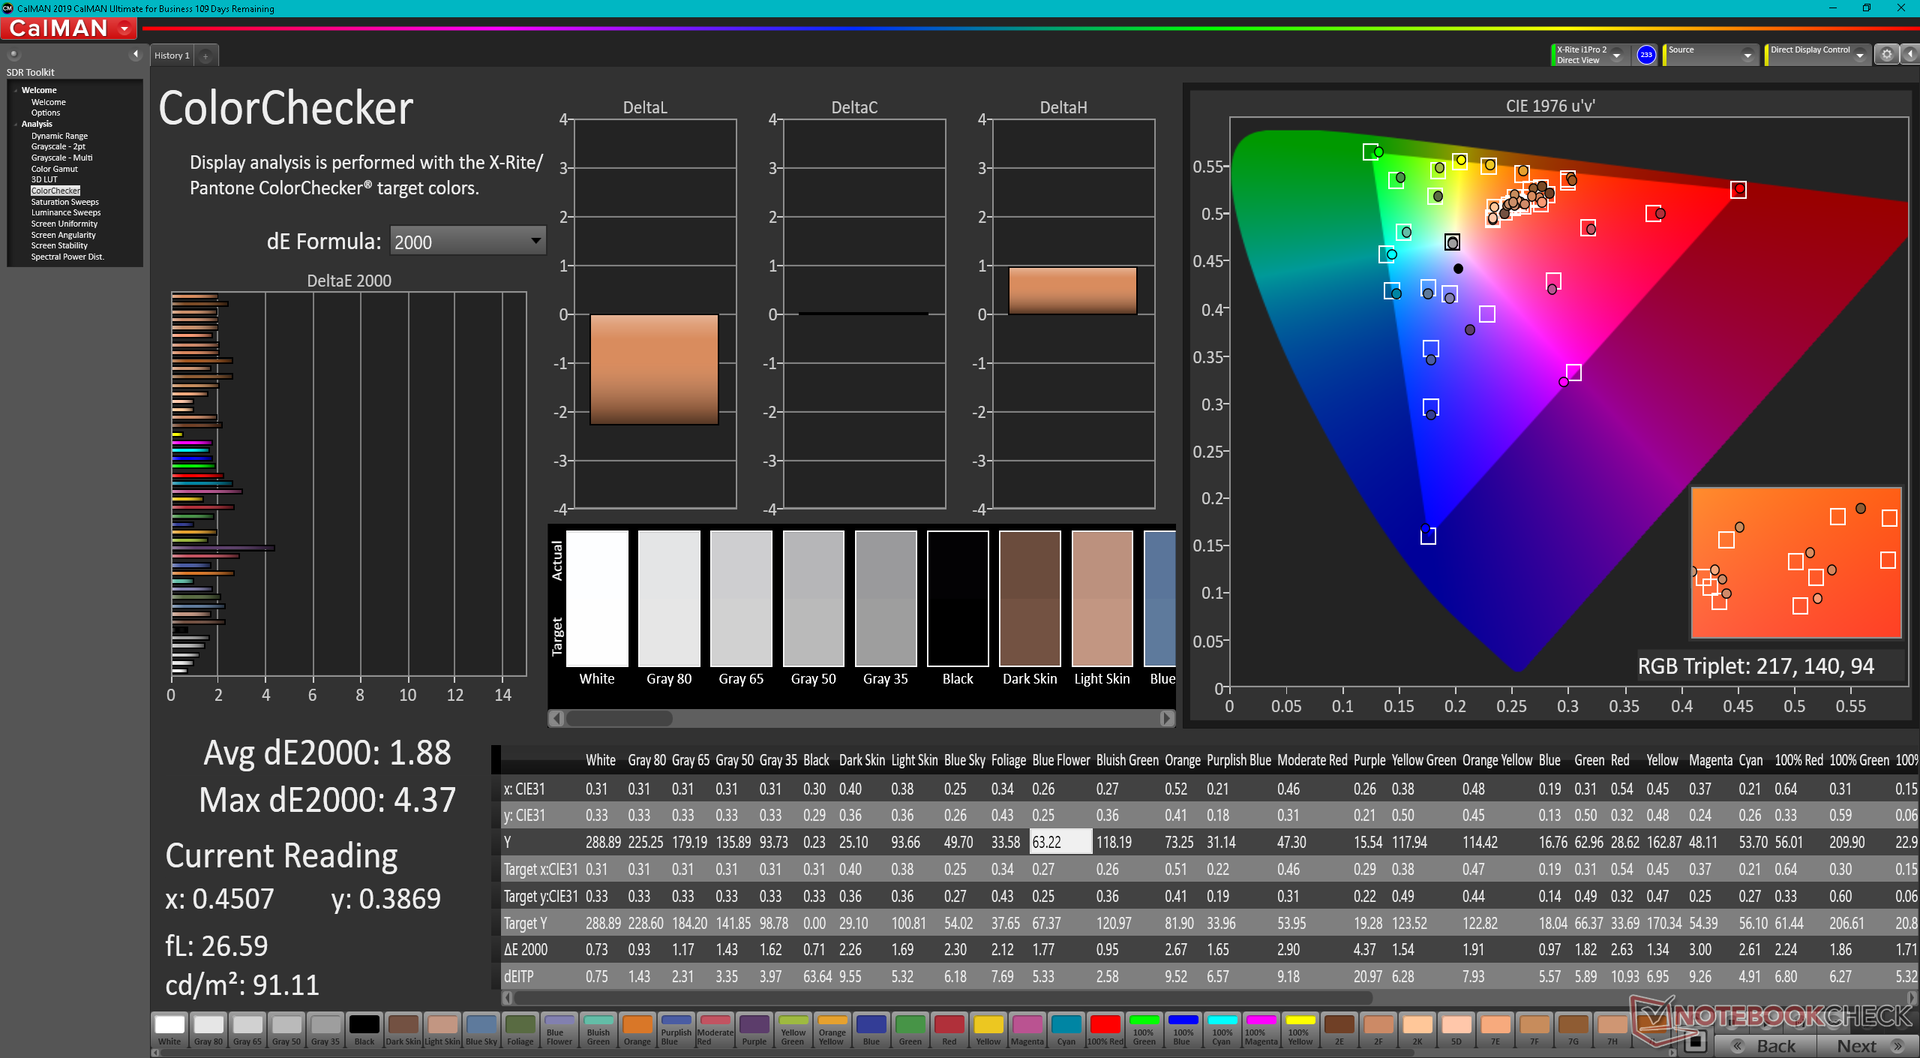
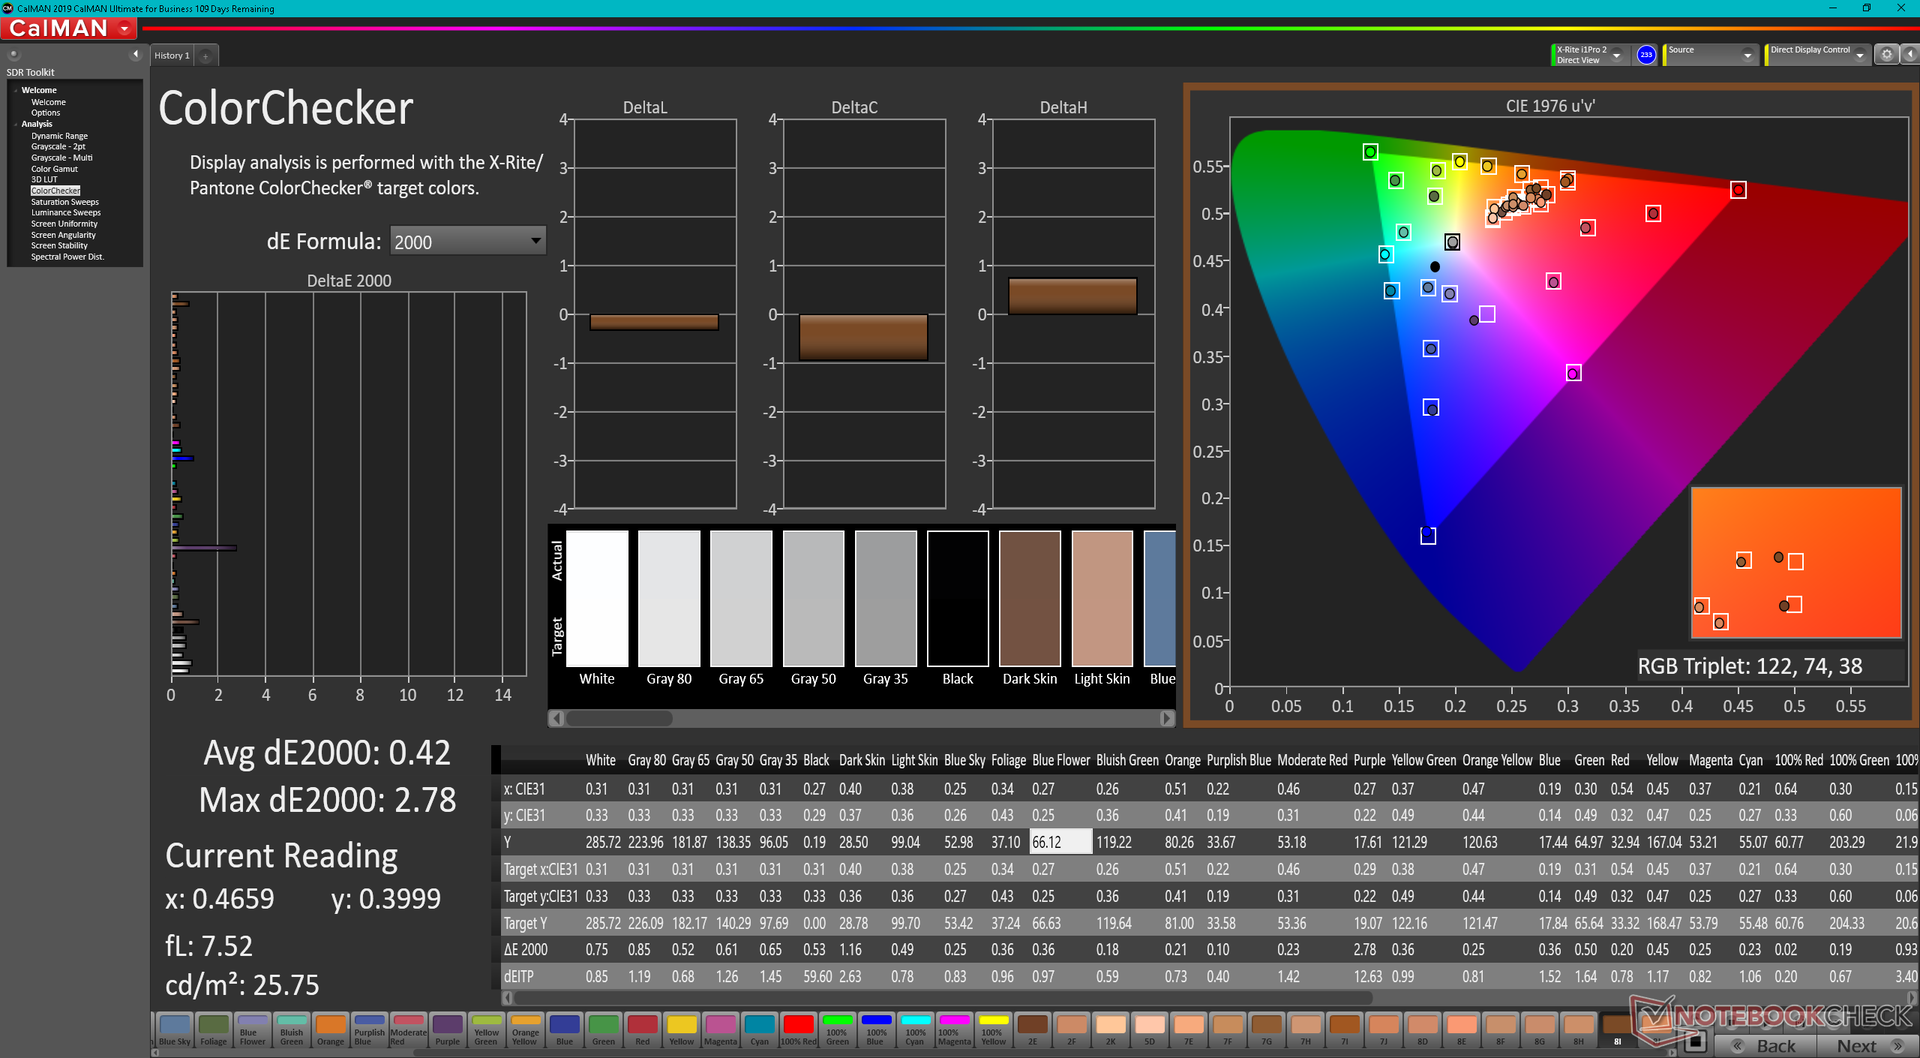
ΔE ColorChecker Calman: 1.88 | ∀{0.5-29.43 Ø4.72}
calibrated: 0.42
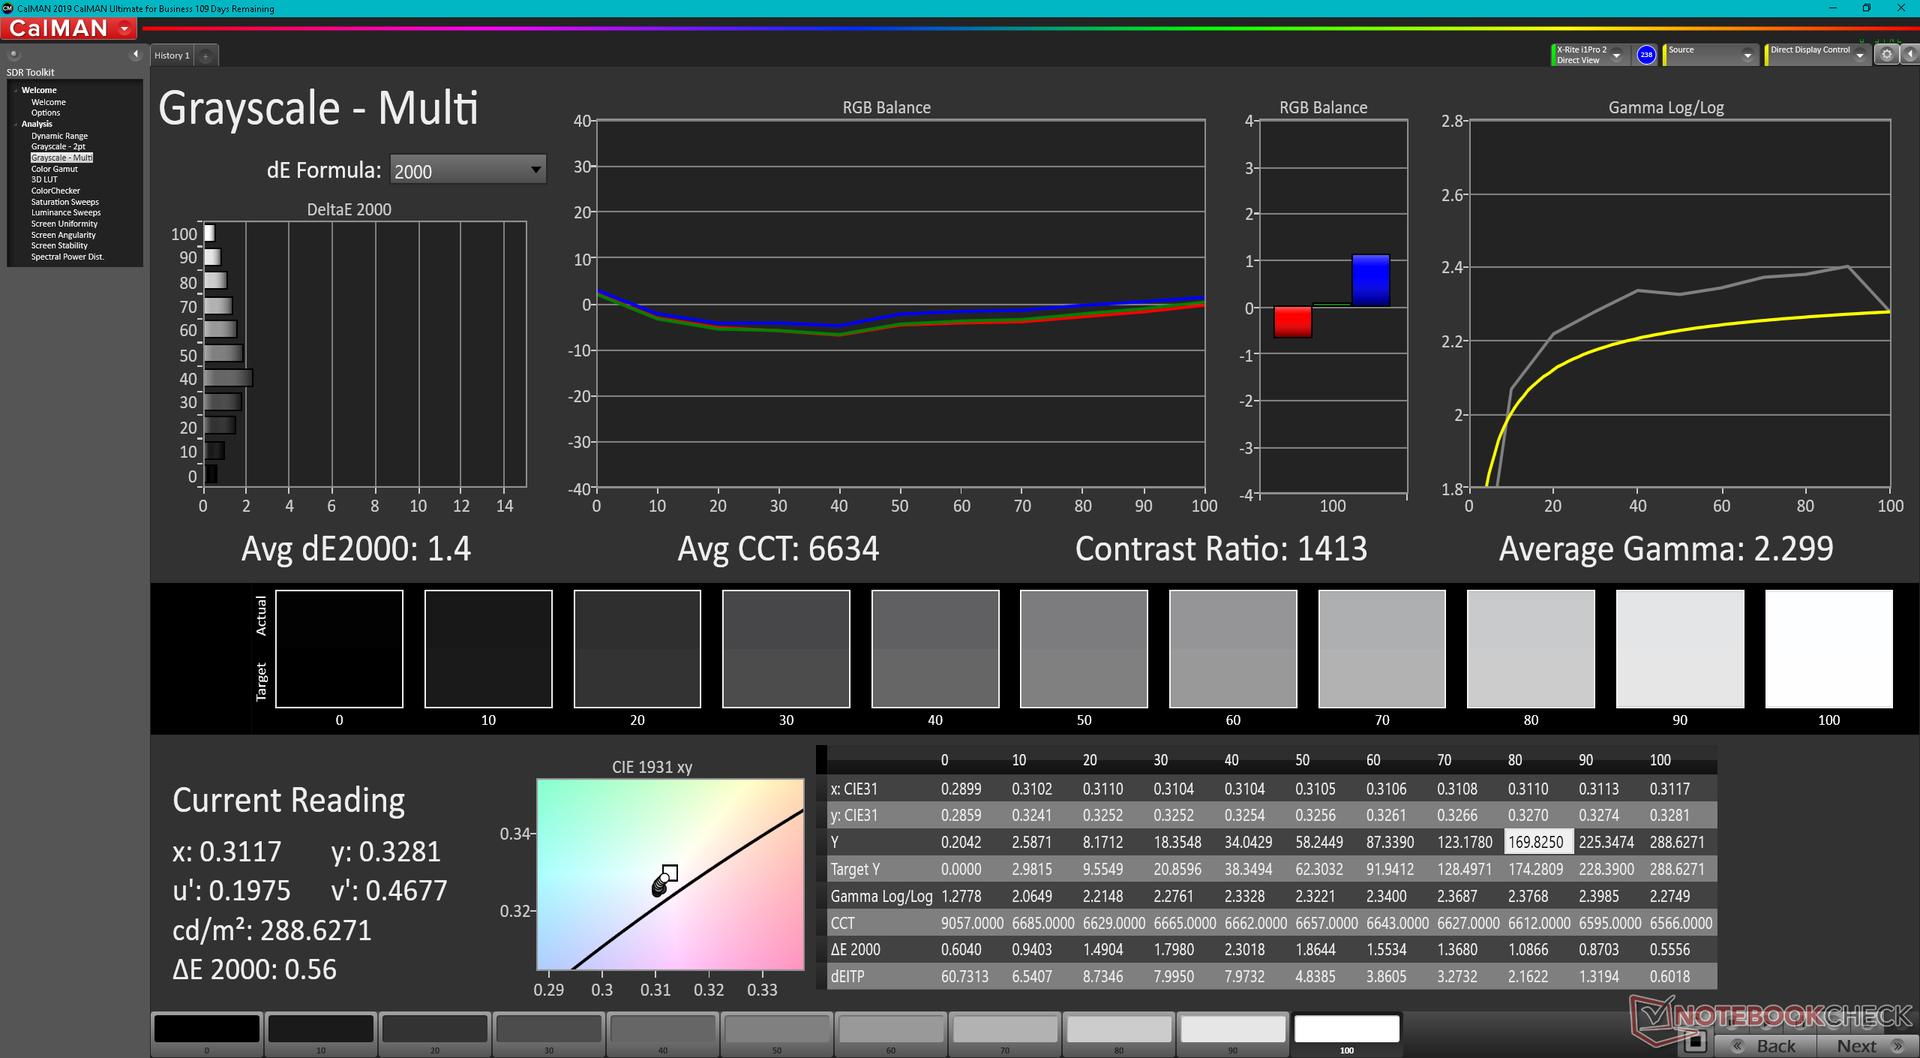
ΔE Greyscale Calman: 1.4 | ∀{0.09-98 Ø4.97}
73.2% AdobeRGB 1998 (Argyll 3D)
99.5% sRGB (Argyll 3D)
70.8% Display P3 (Argyll 3D)
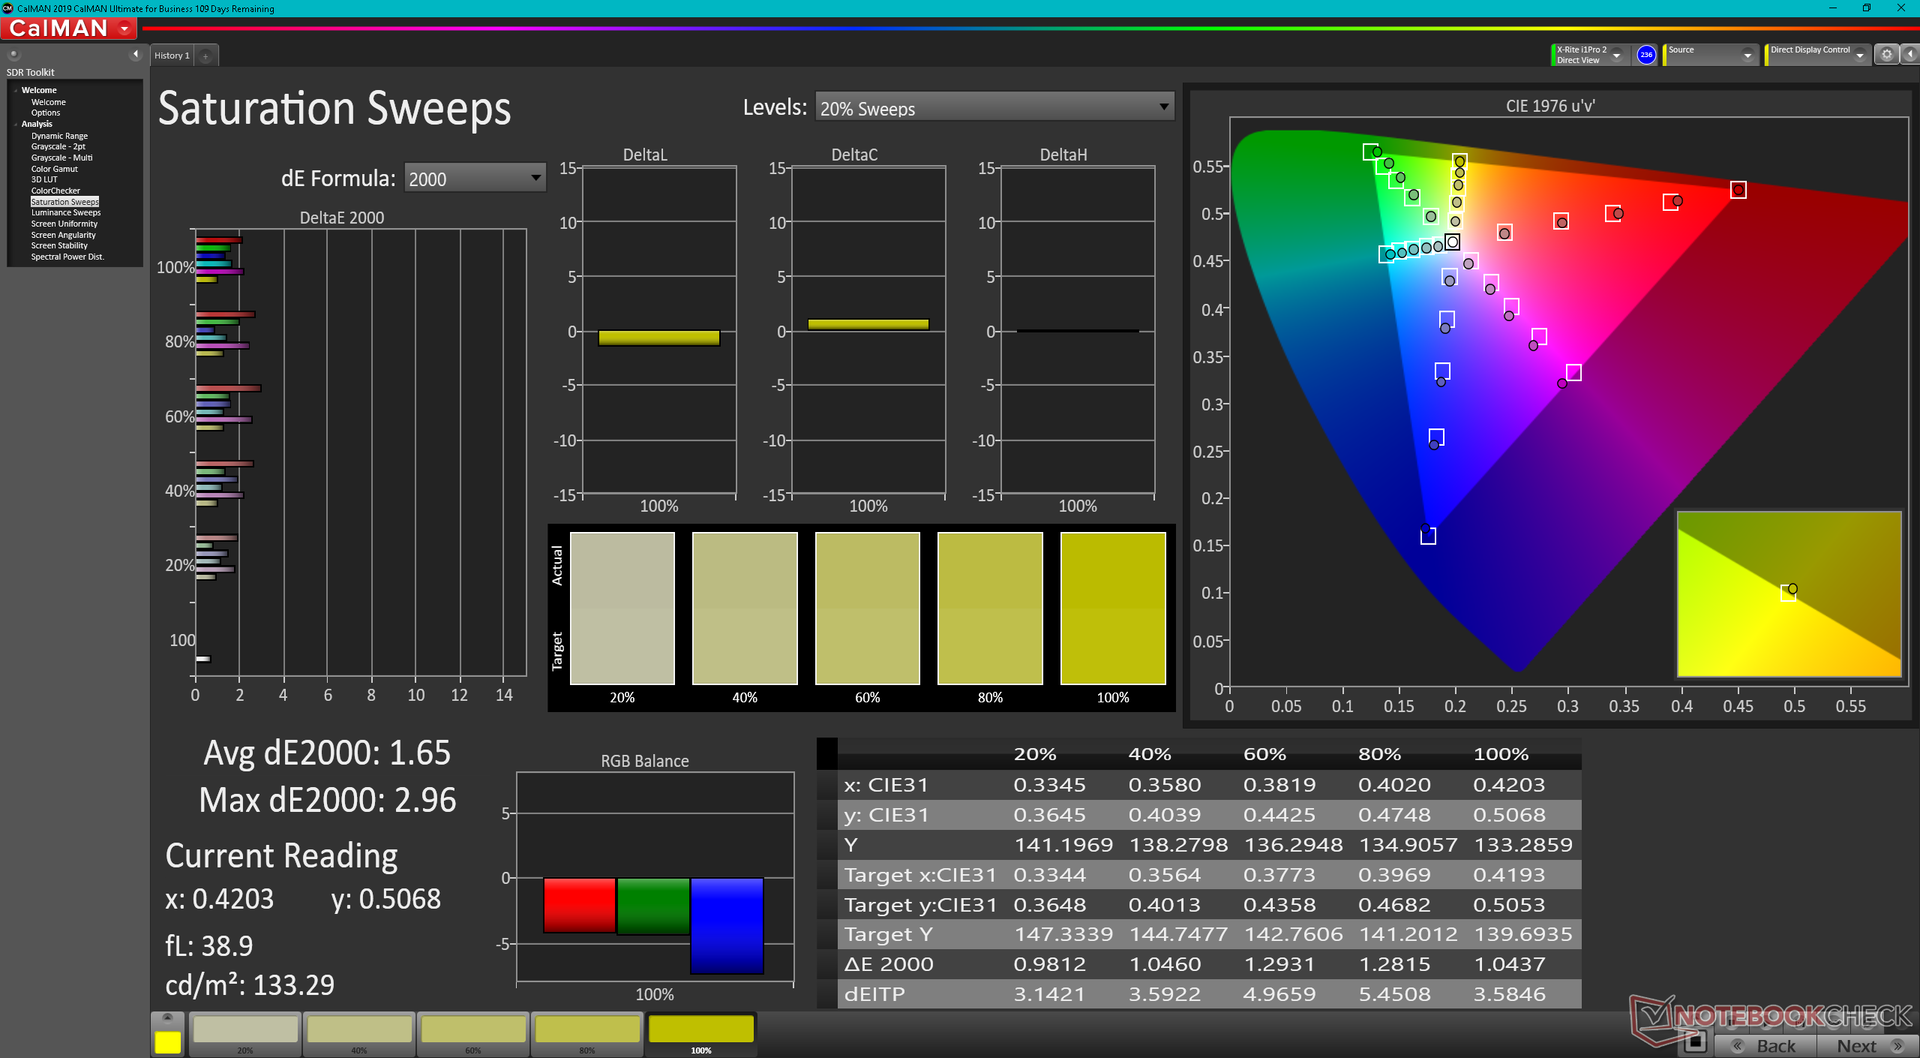
Gamma: 2.3
CCT: 6634 K
| Dell Inspiron 16 Plus 7620 BOE NE16N41, IPS, 3072x1920, 16" | Dell Inspiron 16 Plus 7610 AU Optronics B160QAN, IPS, 3072x1920, 16" | Lenovo Yoga 7 16IAP7 Lenovo LEN160WQXGA, IPS, 2560x1600, 16" | Huawei MateBook D 16 2022 BOE NV160WUM-NH0, IPS, 1920x1200, 16" | Acer Swift X SFX16-51G-5388 Chi Mei N161HCA-EA3, , 1920x1080, 16.1" | Asus Vivobook Pro 16X-M7600QE Samsung ATNA60YV02-0, OLED, 3840x2400, 16.1" | |
|---|---|---|---|---|---|---|
| Display | 3% | -5% | -5% | -7% | 25% | |
| Display P3 Coverage (%) | 70.8 | 74.1 5% | 67 -5% | 66.2 -6% | 65.1 -8% | 99.8 41% |
| sRGB Coverage (%) | 99.5 | 99.4 0% | 95.7 -4% | 96.4 -3% | 95.65 -4% | 100 1% |
| AdobeRGB 1998 Coverage (%) | 73.2 | 75.8 4% | 69.3 -5% | 68.3 -7% | 66.75 -9% | 96.9 32% |
| Response Times | -30% | 8% | 27% | 25% | 94% | |
| Response Time Grey 50% / Grey 80% * (ms) | 38 ? | 49.2 ? -29% | 36 ? 5% | 30.5 ? 20% | 30 ? 21% | 2 ? 95% |
| Response Time Black / White * (ms) | 28 ? | 36.8 ? -31% | 24.8 ? 11% | 18.7 ? 33% | 20 ? 29% | 2 ? 93% |
| PWM Frequency (Hz) | 60 ? | |||||
| Screen | -47% | -13% | -56% | -6% | -35% | |
| Brightness middle (cd/m²) | 288.9 | 296.8 3% | 393.7 36% | 319 10% | 276 -4% | 392 36% |
| Brightness (cd/m²) | 276 | 292 6% | 367 33% | 317 15% | 264 -4% | 396 43% |
| Brightness Distribution (%) | 92 | 87 -5% | 84 -9% | 90 -2% | 85 -8% | 98 7% |
| Black Level * (cd/m²) | 0.26 | 0.21 19% | 0.38 -46% | 0.23 12% | 0.16 38% | |
| Contrast (:1) | 1111 | 1413 27% | 1036 -7% | 1387 25% | 1725 55% | |
| Colorchecker dE 2000 * | 1.88 | 2.56 -36% | 1.97 -5% | 3.4 -81% | 1.8 4% | 1.74 7% |
| Colorchecker dE 2000 max. * | 4.37 | 4.76 -9% | 5.46 -25% | 8.1 -85% | 3.77 14% | 3.18 27% |
| Colorchecker dE 2000 calibrated * | 0.42 | 1.86 -343% | 0.62 -48% | 0.8 -90% | 0.63 -50% | 1.85 -340% |
| Greyscale dE 2000 * | 1.4 | 2.6 -86% | 2.1 -50% | 5.7 -307% | 2.76 -97% | 1.77 -26% |
| Gamma | 2.3 96% | 2.07 106% | 2.1 105% | 2.1 105% | 2.37 93% | 2.22 99% |
| CCT | 6634 98% | 6628 98% | 6461 101% | 7433 87% | 6564 99% | 6483 100% |
| Media totale (Programma / Settaggio) | -25% /
-34% | -3% /
-9% | -11% /
-33% | 4% /
-2% | 28% /
1% |
* ... Meglio usare valori piccoli
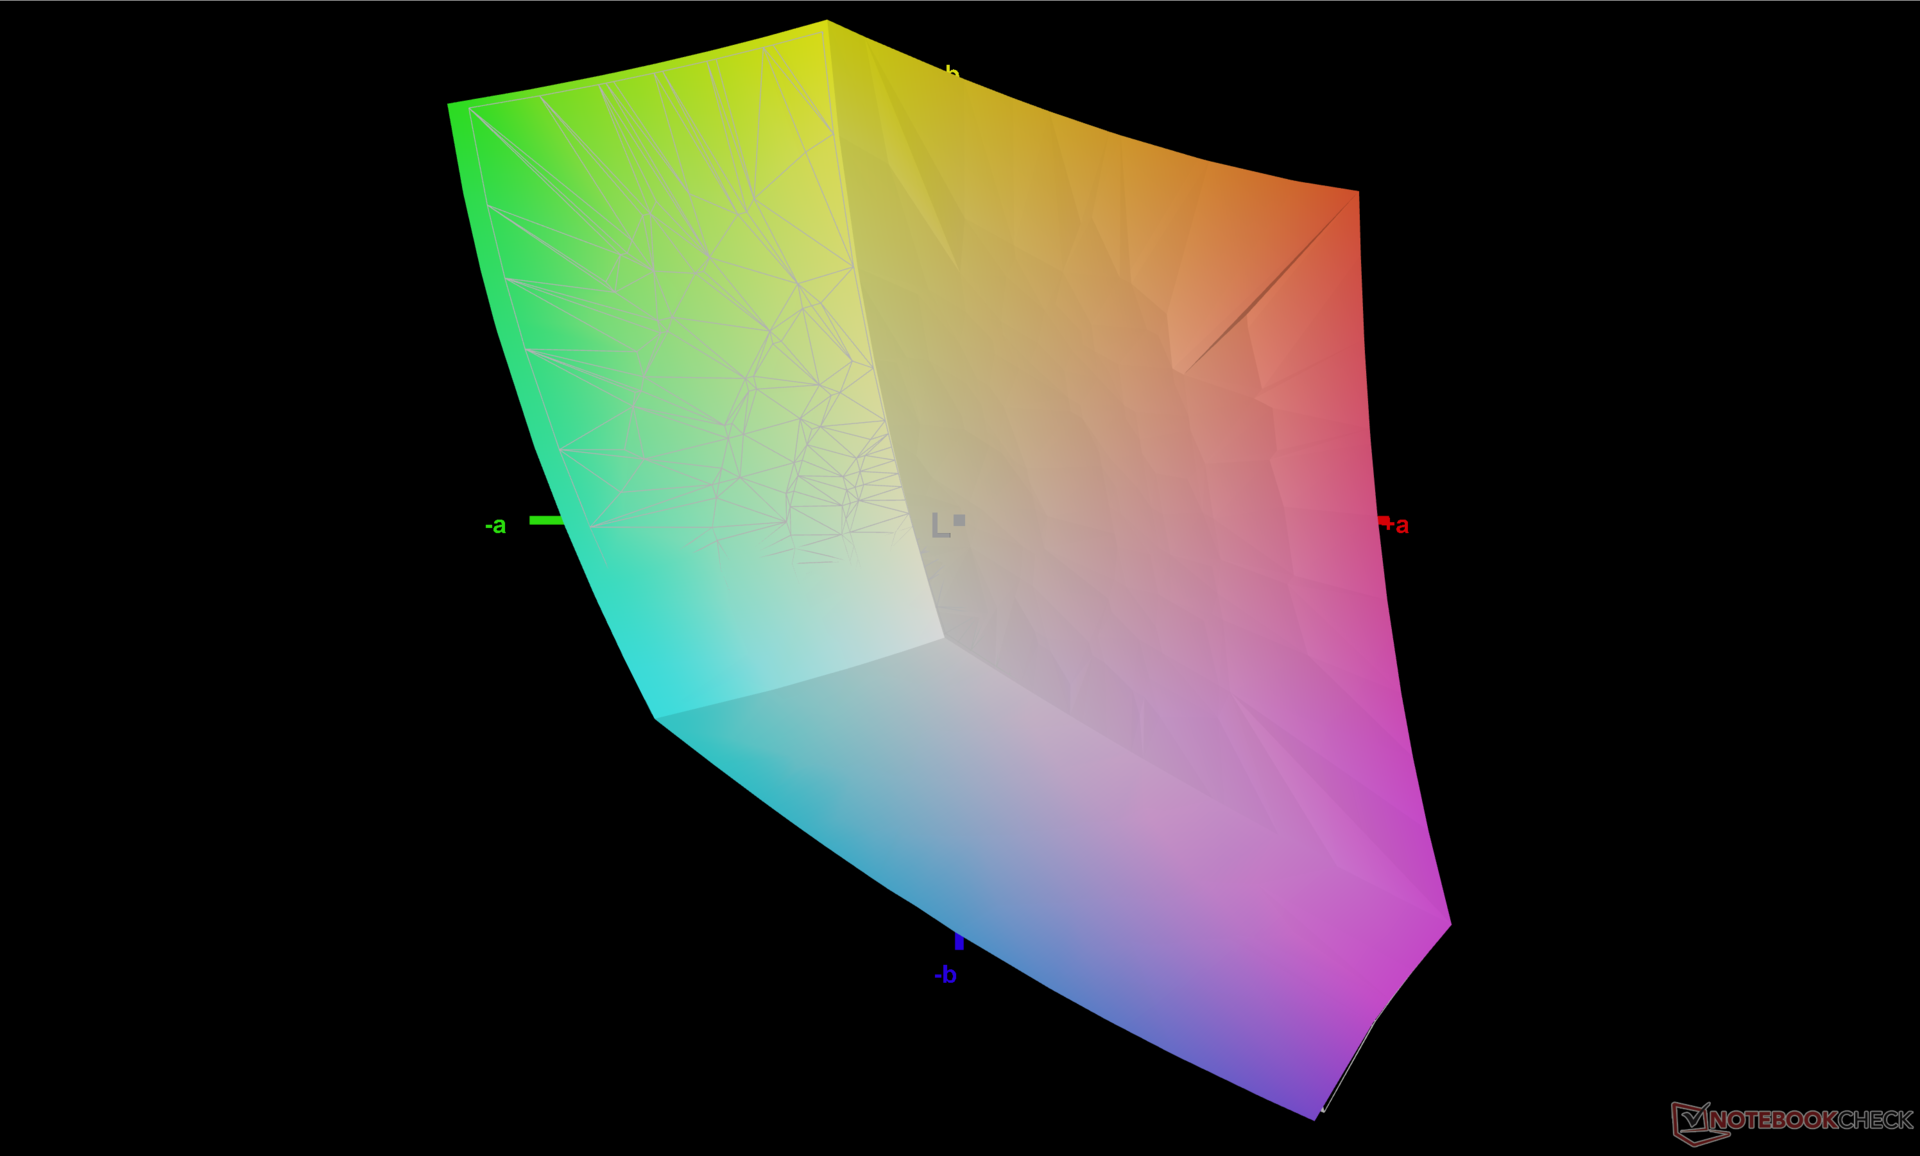
Il display è ben calibrato, proprio come abbiamo scoperto sul 7610. I valori medi del DeltaE della scala di grigi e del colore si attestano rispettivamente a 1,4 e 1,88, mentre i nostri tentativi di calibrazione hanno migliorato ulteriormente le medie a 0,5 e 0,42. Se apprezzate la precisione dei display sRGB, allora vi piacerà quello che vedrete qui.
Tempi di risposta del Display
| ↔ Tempi di risposta dal Nero al Bianco | ||
|---|---|---|
| 28 ms ... aumenta ↗ e diminuisce ↘ combinato | ↗ 13.2 ms Incremento | 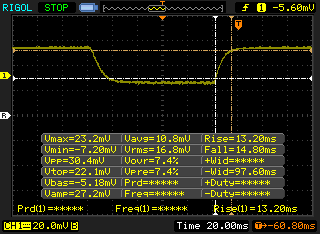 |
| ↘ 14.8 ms Calo | ||
| Lo schermo mostra tempi di risposta relativamente lenti nei nostri tests e potrebbe essere troppo lento per i gamers. In confronto, tutti i dispositivi di test variano da 0.1 (minimo) a 240 (massimo) ms. » 71 % di tutti i dispositivi è migliore. Questo significa che i tempi di risposta rilevati sono peggiori rispetto alla media di tutti i dispositivi testati (19.8 ms). | ||
| ↔ Tempo di risposta dal 50% Grigio all'80% Grigio | ||
| 38 ms ... aumenta ↗ e diminuisce ↘ combinato | ↗ 21.2 ms Incremento | 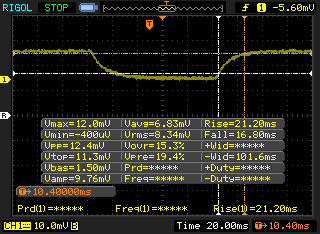 |
| ↘ 16.8 ms Calo | ||
| Lo schermo mostra tempi di risposta lenti nei nostri tests e sarà insoddisfacente per i gamers. In confronto, tutti i dispositivi di test variano da 0.165 (minimo) a 636 (massimo) ms. » 55 % di tutti i dispositivi è migliore. Questo significa che i tempi di risposta rilevati sono peggiori rispetto alla media di tutti i dispositivi testati (31 ms). | ||
Sfarfallio dello schermo / PWM (Pulse-Width Modulation)
| flickering dello schermo / PWM non rilevato | 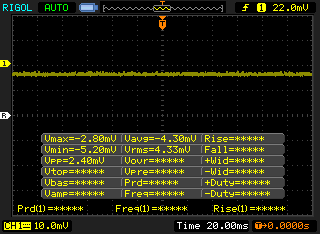 | ||
In confronto: 52 % di tutti i dispositivi testati non utilizza PWM per ridurre la luminosita' del display. Se è rilevato PWM, una media di 7769 (minimo: 5 - massimo: 343500) Hz è stata rilevata. | |||
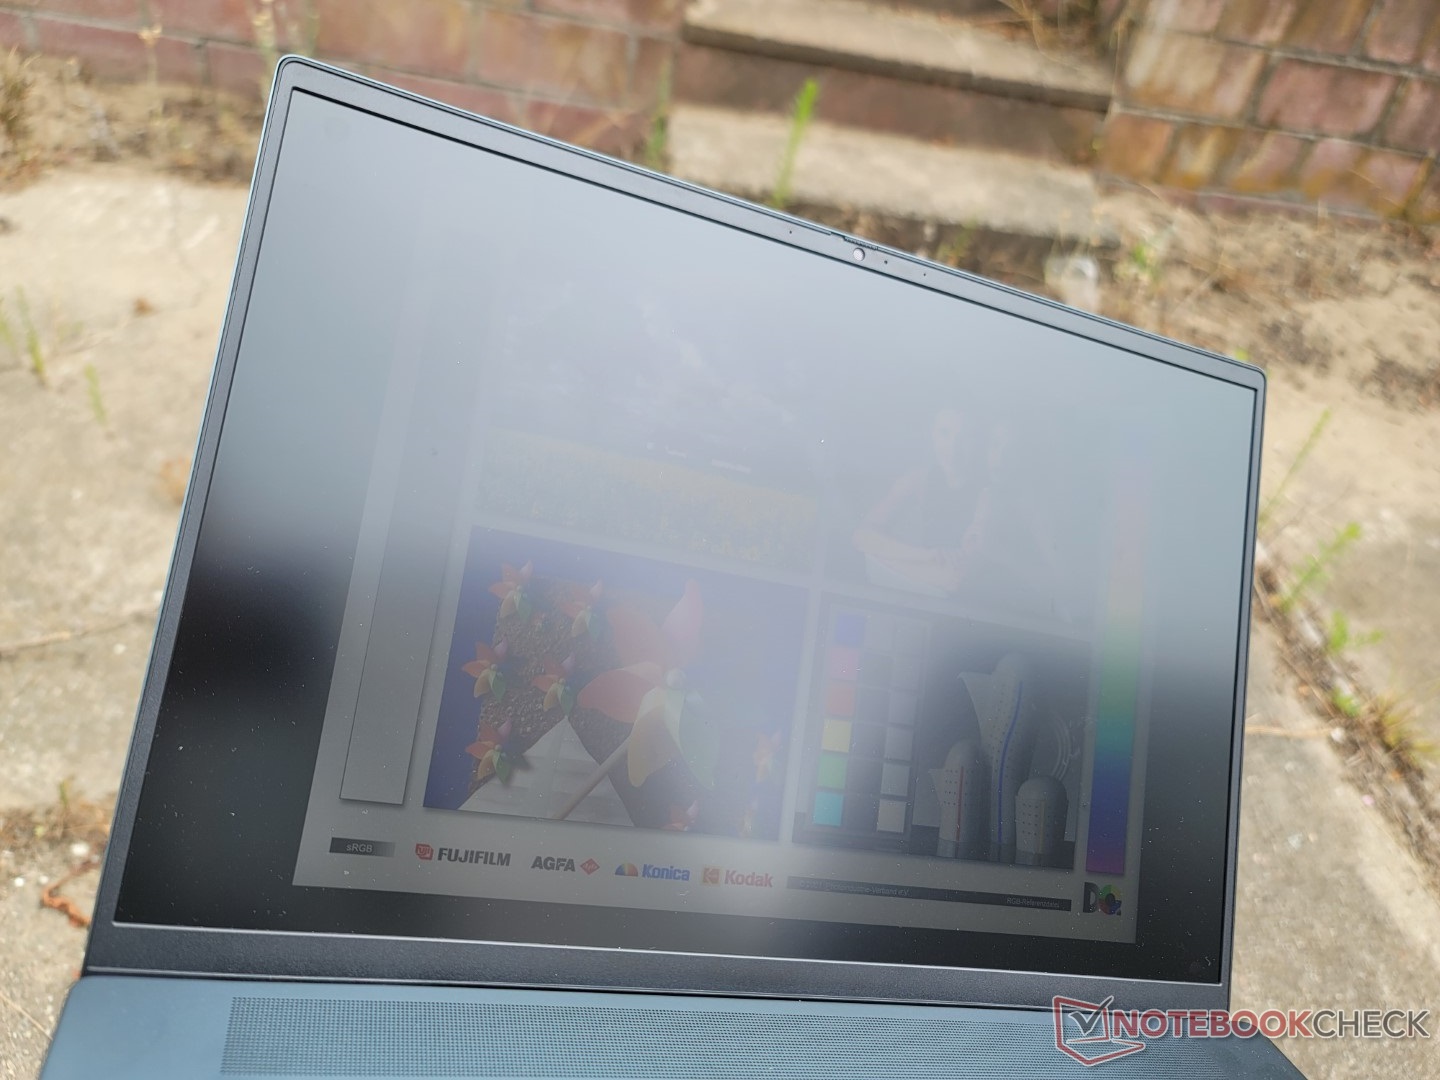
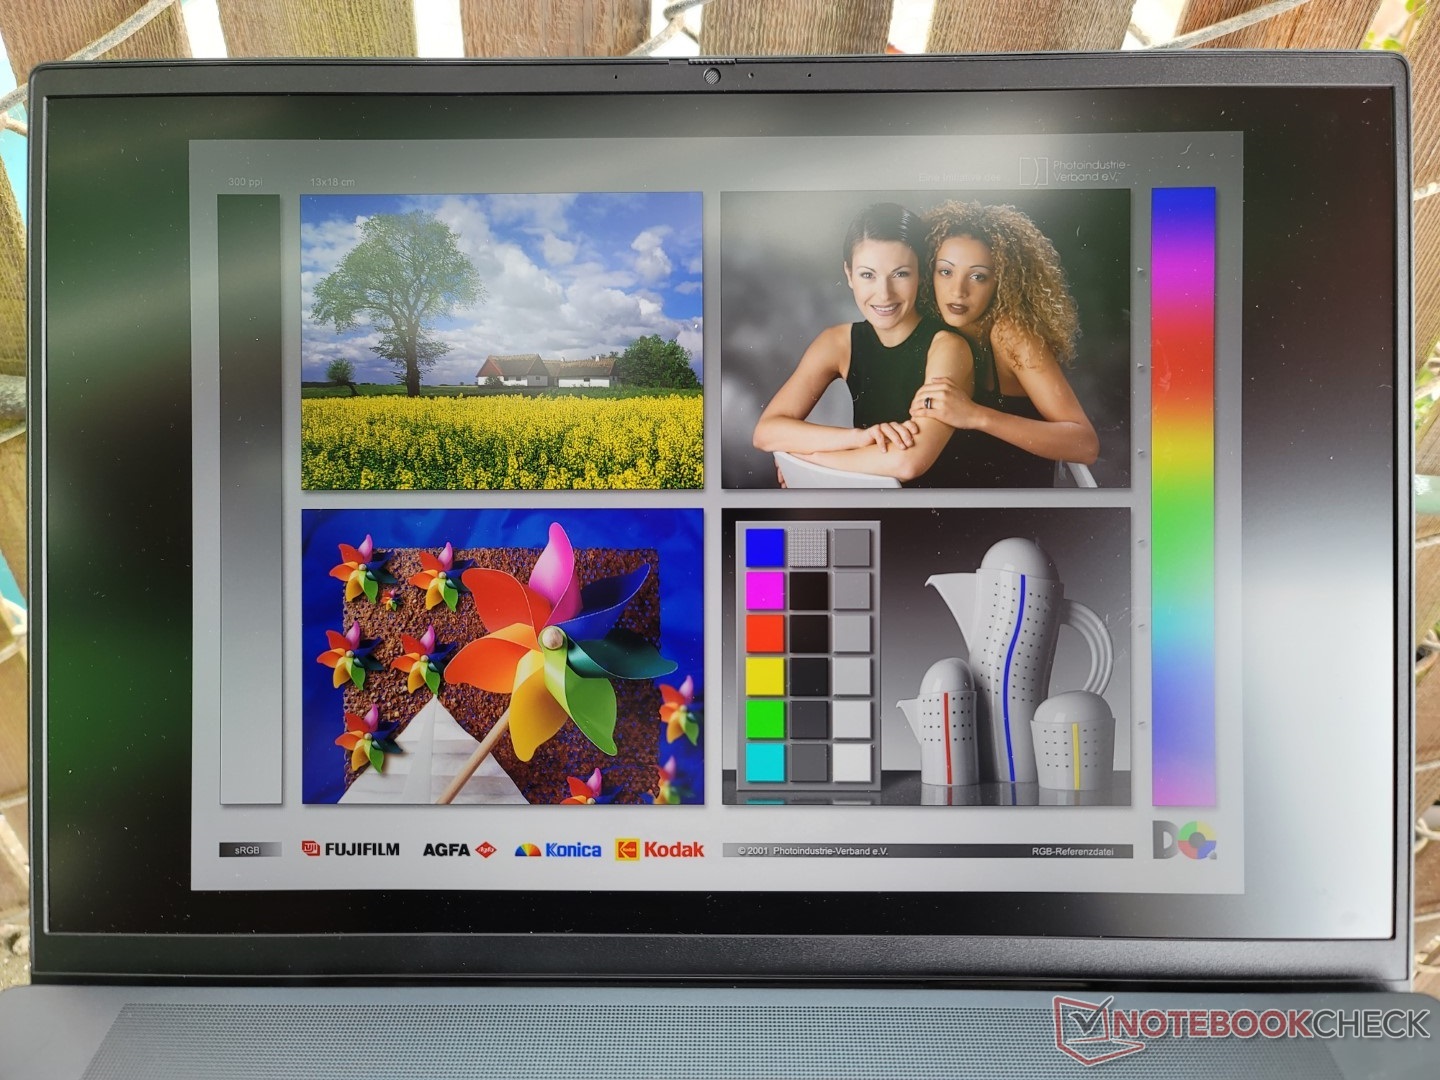
La visibilità all'aperto è paragonabile a quella del modello dello scorso anno, poiché la luminosità massima non è cambiata. Il Lenovo Yoga 7 o l'Asus VivoBook Pro 16X hanno display più luminosi, ma è più difficile evitare i riflessi dei loro overlay lucidi.
Prestazioni - La 12a generazione offre prestazioni e consumi più elevati
Condizioni di test
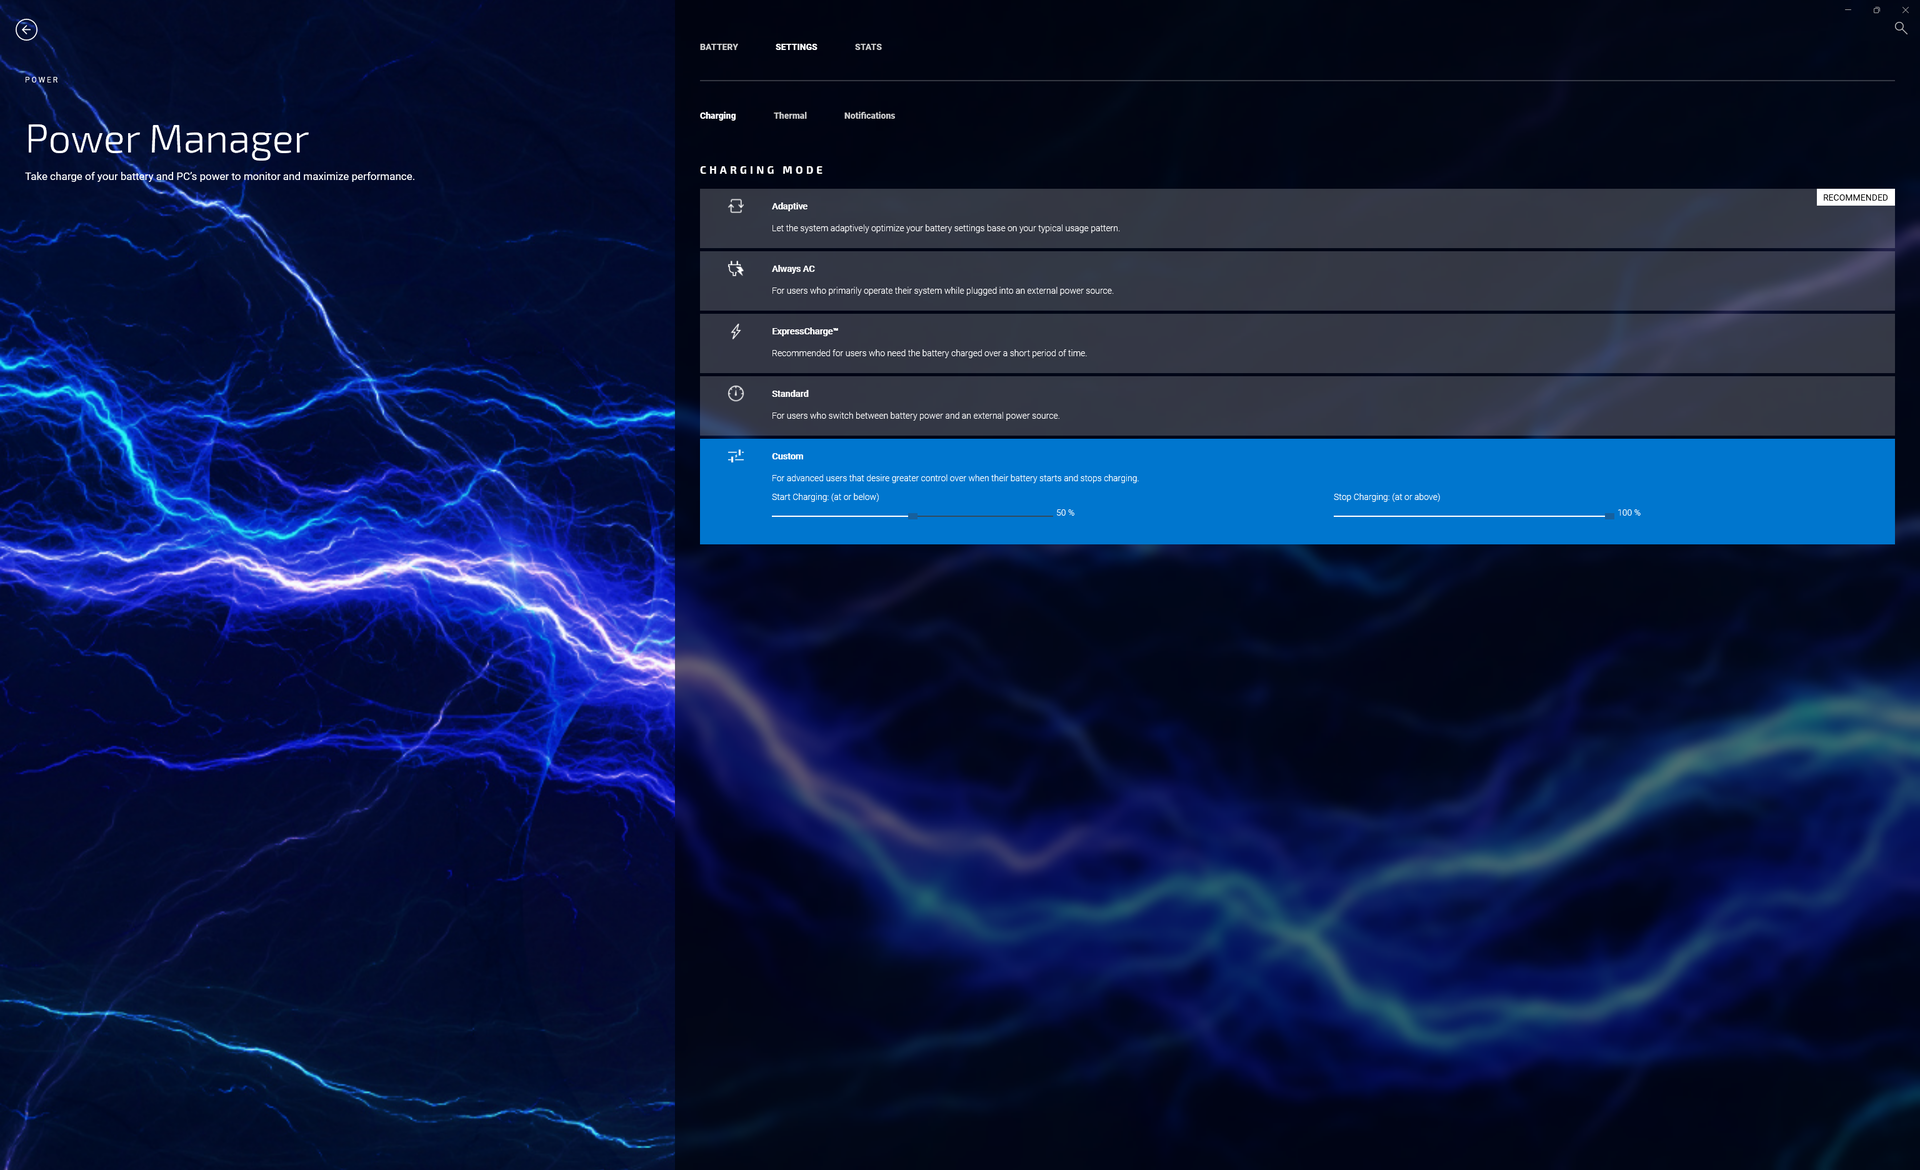
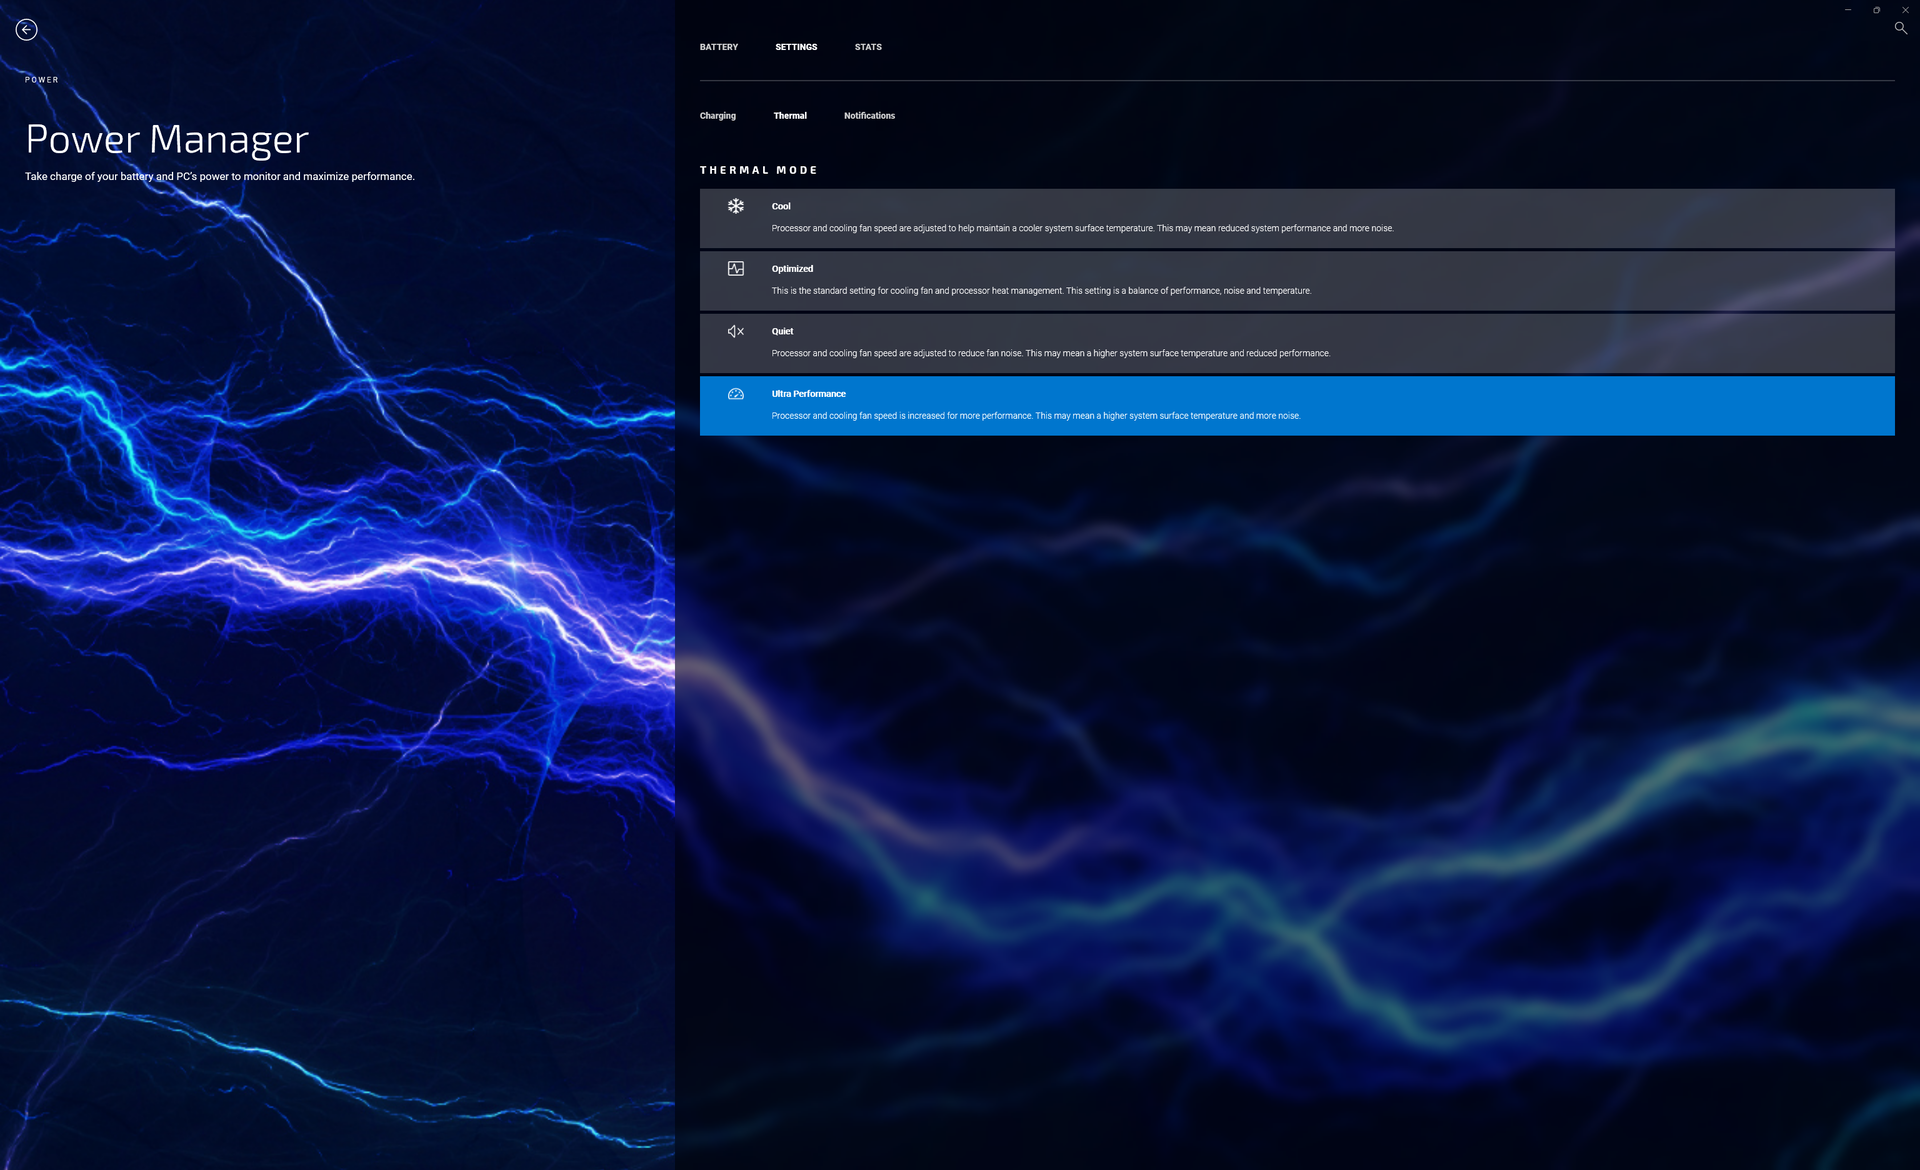
Abbiamo impostato la nostra unità in modalità Performance tramite Windows e Ultra Performance tramite il software MyDell preinstallato prima di eseguire i benchmark qui sotto. Gli utenti dovrebbero familiarizzare con MyDell, in quanto è l'hub per i problemi di garanzia, la registrazione del prodotto, le impostazioni di ricarica della batteria e le modalità di prestazioni
Nvidia Optimus viene fornito di serie senza opzione MUX.
Processore
Le prestazioni multi-thread grezze sono più veloci di circa il 30-50% rispetto alla generazione precedente Core i7-11800H per rappresentare un incremento abbastanza significativo rispetto all'anno precedente. La sostenibilità delle prestazioni potrebbe essere migliore, tuttavia, poiché i punteggi di CineBench R15 xT diminuiscono di circa il 18% quando si esegue il benchmark in loop. Non sappiamo quanto gli utenti debbano aspettarsi un calo delle prestazioni se passano al Core i5-12500H Core i5-12500H in quanto, al momento, non abbiamo ancora testato nessun portatile con questa CPU.
Cinebench R15 Multi Loop
Cinebench R23: Multi Core | Single Core
Cinebench R15: CPU Multi 64Bit | CPU Single 64Bit
Blender: v2.79 BMW27 CPU
7-Zip 18.03: 7z b 4 | 7z b 4 -mmt1
Geekbench 5.5: Multi-Core | Single-Core
HWBOT x265 Benchmark v2.2: 4k Preset
LibreOffice : 20 Documents To PDF
R Benchmark 2.5: Overall mean
| HWBOT x265 Benchmark v2.2 / 4k Preset | |
| MSI Creator Z16P B12UHST | |
| Gigabyte Aero 16 YE5 | |
| Razer Blade 15 2022 | |
| Media Intel Core i7-12700H (4.67 - 21.8, n=64) | |
| Dell Inspiron 16 Plus 7620 | |
| HP Victus 16-e0145ng | |
| Lenovo Yoga 7 16IAP7 | |
| Dell Inspiron 16 Plus 7610-MHJ8F | |
| Dell Inspiron 14 7420 2-in-1 | |
| Acer Swift X SFX16-51G-5388 | |
| HP Pavilion Gaming 16-a0242ng | |
* ... Meglio usare valori piccoli
AIDA64: FP32 Ray-Trace | FPU Julia | CPU SHA3 | CPU Queen | FPU SinJulia | FPU Mandel | CPU AES | CPU ZLib | FP64 Ray-Trace | CPU PhotoWorxx
| Performance rating | |
| Asus Vivobook Pro 16X-M7600QE | |
| Dell Inspiron 16 Plus 7620 | |
| Media Intel Core i7-12700H | |
| Huawei MateBook D 16 2022 | |
| Lenovo Yoga 7 16IAP7 | |
| Acer Swift X SFX16-51G-5388 | |
| Dell Inspiron 16 Plus 7610 -9! | |
| AIDA64 / FP32 Ray-Trace | |
| Asus Vivobook Pro 16X-M7600QE | |
| Asus Vivobook Pro 16X-M7600QE | |
| Dell Inspiron 16 Plus 7620 | |
| Huawei MateBook D 16 2022 | |
| Media Intel Core i7-12700H (2585 - 17957, n=64) | |
| Lenovo Yoga 7 16IAP7 | |
| Acer Swift X SFX16-51G-5388 | |
| AIDA64 / FPU Julia | |
| Asus Vivobook Pro 16X-M7600QE | |
| Asus Vivobook Pro 16X-M7600QE | |
| Dell Inspiron 16 Plus 7620 | |
| Huawei MateBook D 16 2022 | |
| Media Intel Core i7-12700H (12439 - 90760, n=64) | |
| Lenovo Yoga 7 16IAP7 | |
| Acer Swift X SFX16-51G-5388 | |
| AIDA64 / CPU SHA3 | |
| Asus Vivobook Pro 16X-M7600QE | |
| Asus Vivobook Pro 16X-M7600QE | |
| Media Intel Core i7-12700H (833 - 4242, n=64) | |
| Dell Inspiron 16 Plus 7620 | |
| Huawei MateBook D 16 2022 | |
| Lenovo Yoga 7 16IAP7 | |
| Acer Swift X SFX16-51G-5388 | |
| AIDA64 / CPU Queen | |
| Asus Vivobook Pro 16X-M7600QE | |
| Asus Vivobook Pro 16X-M7600QE | |
| Media Intel Core i7-12700H (57923 - 103202, n=63) | |
| Huawei MateBook D 16 2022 | |
| Dell Inspiron 16 Plus 7620 | |
| Lenovo Yoga 7 16IAP7 | |
| Acer Swift X SFX16-51G-5388 | |
| AIDA64 / FPU SinJulia | |
| Asus Vivobook Pro 16X-M7600QE | |
| Asus Vivobook Pro 16X-M7600QE | |
| Media Intel Core i7-12700H (3249 - 9939, n=64) | |
| Dell Inspiron 16 Plus 7620 | |
| Huawei MateBook D 16 2022 | |
| Lenovo Yoga 7 16IAP7 | |
| Acer Swift X SFX16-51G-5388 | |
| AIDA64 / FPU Mandel | |
| Asus Vivobook Pro 16X-M7600QE | |
| Asus Vivobook Pro 16X-M7600QE | |
| Dell Inspiron 16 Plus 7620 | |
| Media Intel Core i7-12700H (7135 - 44760, n=64) | |
| Huawei MateBook D 16 2022 | |
| Lenovo Yoga 7 16IAP7 | |
| Acer Swift X SFX16-51G-5388 | |
| AIDA64 / CPU AES | |
| Asus Vivobook Pro 16X-M7600QE | |
| Asus Vivobook Pro 16X-M7600QE | |
| Huawei MateBook D 16 2022 | |
| Media Intel Core i7-12700H (31839 - 144360, n=64) | |
| Dell Inspiron 16 Plus 7620 | |
| Acer Swift X SFX16-51G-5388 | |
| Lenovo Yoga 7 16IAP7 | |
| AIDA64 / FP64 Ray-Trace | |
| Asus Vivobook Pro 16X-M7600QE | |
| Asus Vivobook Pro 16X-M7600QE | |
| Dell Inspiron 16 Plus 7620 | |
| Media Intel Core i7-12700H (1437 - 9692, n=64) | |
| Huawei MateBook D 16 2022 | |
| Lenovo Yoga 7 16IAP7 | |
| Acer Swift X SFX16-51G-5388 | |
| AIDA64 / CPU PhotoWorxx | |
| Lenovo Yoga 7 16IAP7 | |
| Huawei MateBook D 16 2022 | |
| Acer Swift X SFX16-51G-5388 | |
| Dell Inspiron 16 Plus 7620 | |
| Media Intel Core i7-12700H (12863 - 52207, n=64) | |
| Asus Vivobook Pro 16X-M7600QE | |
| Asus Vivobook Pro 16X-M7600QE | |
Prestazioni del sistema
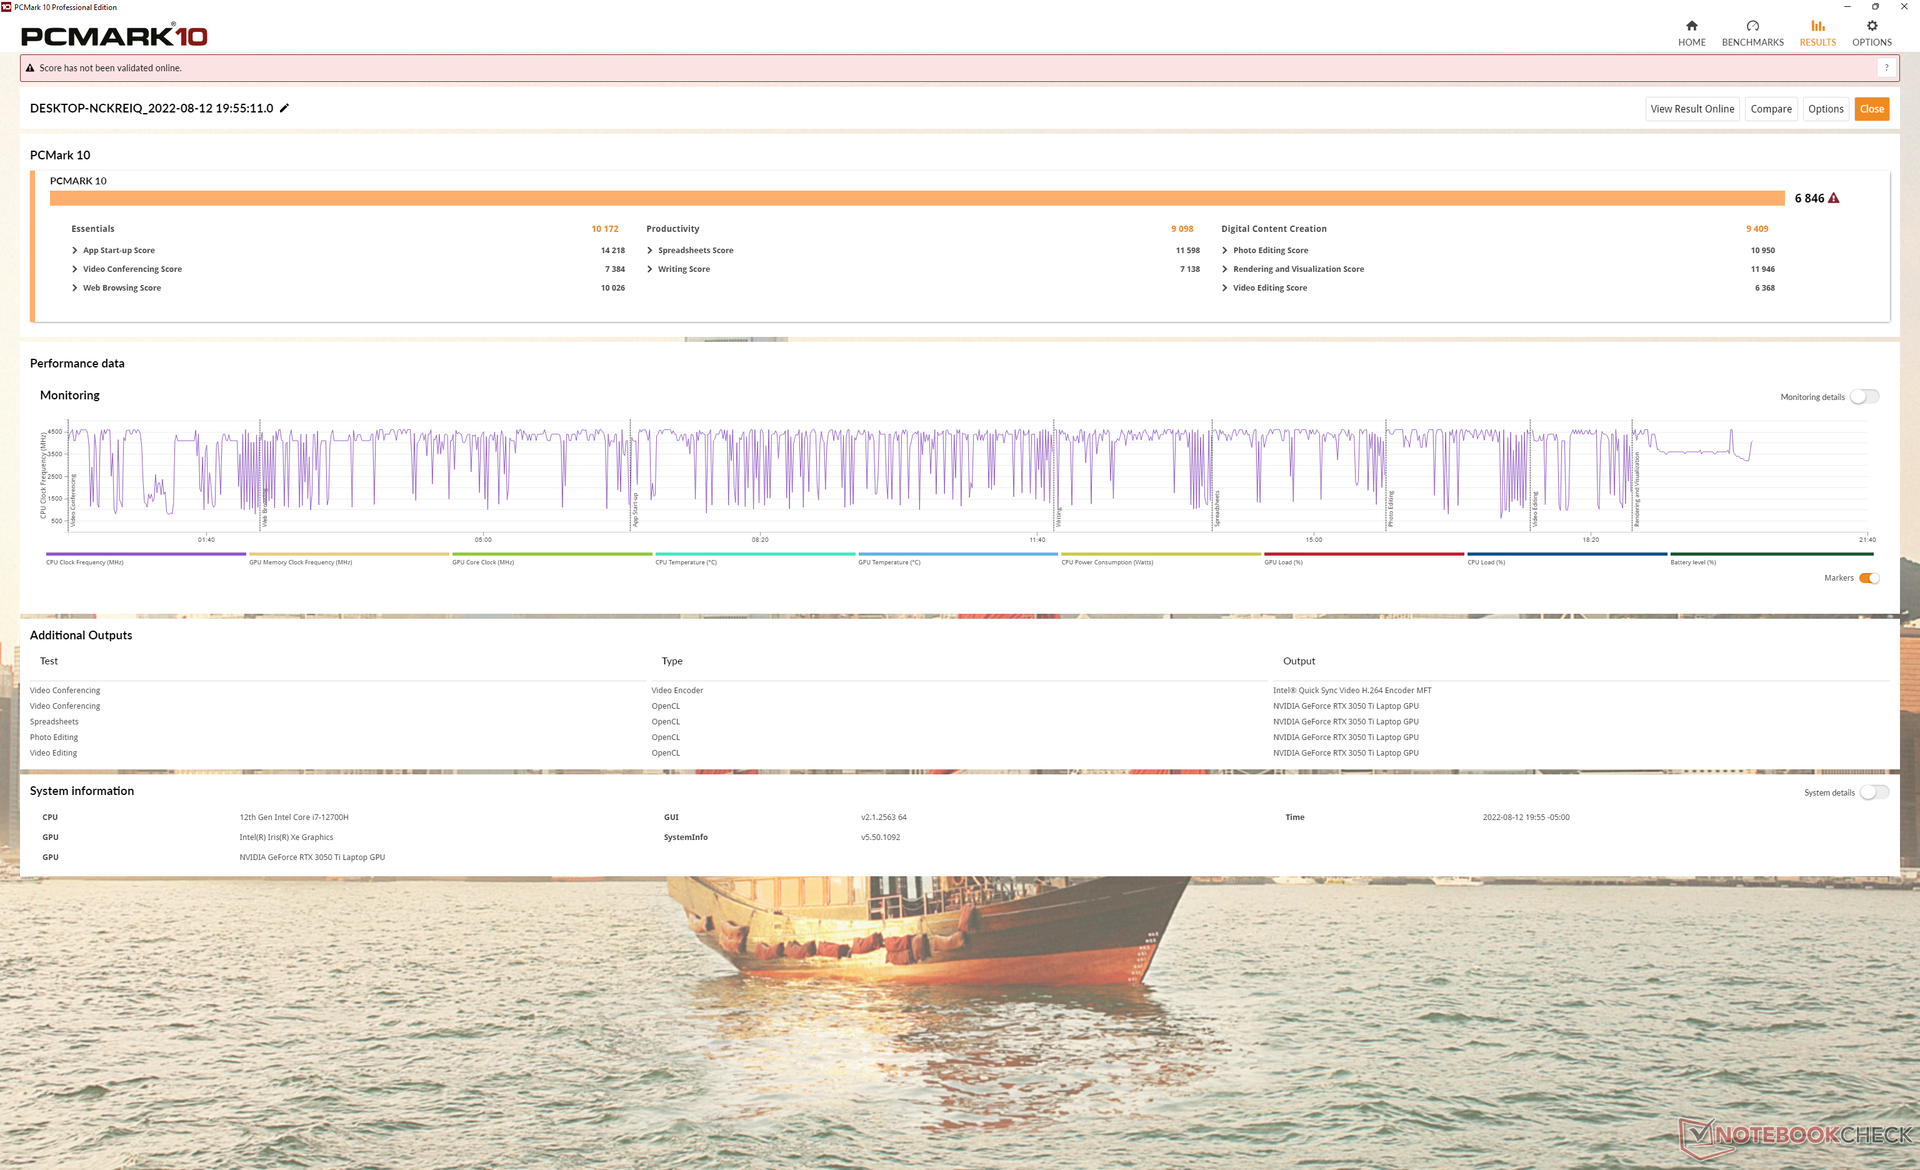
I risultati di PCMark 10 sono costantemente superiori a quelli della precedente generazione di Inspiron 16 Plus 7610 e della maggior parte degli altri portatili multimediali da 16 pollici.
CrossMark: Overall | Productivity | Creativity | Responsiveness
| PCMark 10 / Score | |
| Dell Inspiron 16 Plus 7620 | |
| Media Intel Core i7-12700H, NVIDIA GeForce RTX 3050 Ti Laptop GPU (6623 - 7075, n=5) | |
| Asus Vivobook Pro 16X-M7600QE | |
| Dell Inspiron 16 Plus 7610 | |
| Huawei MateBook D 16 2022 | |
| Lenovo Yoga 7 16IAP7 | |
| Acer Swift X SFX16-51G-5388 | |
| PCMark 10 / Essentials | |
| Huawei MateBook D 16 2022 | |
| Lenovo Yoga 7 16IAP7 | |
| Asus Vivobook Pro 16X-M7600QE | |
| Media Intel Core i7-12700H, NVIDIA GeForce RTX 3050 Ti Laptop GPU (9540 - 10970, n=5) | |
| Dell Inspiron 16 Plus 7620 | |
| Dell Inspiron 16 Plus 7610 | |
| Acer Swift X SFX16-51G-5388 | |
| PCMark 10 / Productivity | |
| Asus Vivobook Pro 16X-M7600QE | |
| Dell Inspiron 16 Plus 7620 | |
| Media Intel Core i7-12700H, NVIDIA GeForce RTX 3050 Ti Laptop GPU (8530 - 9555, n=5) | |
| Acer Swift X SFX16-51G-5388 | |
| Dell Inspiron 16 Plus 7610 | |
| Huawei MateBook D 16 2022 | |
| Lenovo Yoga 7 16IAP7 | |
| PCMark 10 / Digital Content Creation | |
| Dell Inspiron 16 Plus 7620 | |
| Media Intel Core i7-12700H, NVIDIA GeForce RTX 3050 Ti Laptop GPU (8855 - 9542, n=5) | |
| Dell Inspiron 16 Plus 7610 | |
| Asus Vivobook Pro 16X-M7600QE | |
| Lenovo Yoga 7 16IAP7 | |
| Huawei MateBook D 16 2022 | |
| Acer Swift X SFX16-51G-5388 | |
| CrossMark / Overall | |
| Huawei MateBook D 16 2022 | |
| Dell Inspiron 16 Plus 7620 | |
| Media Intel Core i7-12700H, NVIDIA GeForce RTX 3050 Ti Laptop GPU (1654 - 1872, n=5) | |
| Lenovo Yoga 7 16IAP7 | |
| Acer Swift X SFX16-51G-5388 | |
| CrossMark / Productivity | |
| Huawei MateBook D 16 2022 | |
| Media Intel Core i7-12700H, NVIDIA GeForce RTX 3050 Ti Laptop GPU (1595 - 1792, n=5) | |
| Dell Inspiron 16 Plus 7620 | |
| Lenovo Yoga 7 16IAP7 | |
| Acer Swift X SFX16-51G-5388 | |
| CrossMark / Creativity | |
| Huawei MateBook D 16 2022 | |
| Dell Inspiron 16 Plus 7620 | |
| Lenovo Yoga 7 16IAP7 | |
| Media Intel Core i7-12700H, NVIDIA GeForce RTX 3050 Ti Laptop GPU (1699 - 1993, n=5) | |
| Acer Swift X SFX16-51G-5388 | |
| CrossMark / Responsiveness | |
| Huawei MateBook D 16 2022 | |
| Media Intel Core i7-12700H, NVIDIA GeForce RTX 3050 Ti Laptop GPU (1383 - 1768, n=5) | |
| Dell Inspiron 16 Plus 7620 | |
| Lenovo Yoga 7 16IAP7 | |
| Acer Swift X SFX16-51G-5388 | |
| PCMark 10 Score | 6846 punti | |
Aiuto | ||
| AIDA64 / Memory Copy | |
| Lenovo Yoga 7 16IAP7 | |
| Huawei MateBook D 16 2022 | |
| Acer Swift X SFX16-51G-5388 | |
| Dell Inspiron 16 Plus 7620 | |
| Media Intel Core i7-12700H (25615 - 80511, n=64) | |
| Asus Vivobook Pro 16X-M7600QE | |
| Asus Vivobook Pro 16X-M7600QE | |
| AIDA64 / Memory Read | |
| Lenovo Yoga 7 16IAP7 | |
| Dell Inspiron 16 Plus 7620 | |
| Media Intel Core i7-12700H (25586 - 79442, n=64) | |
| Huawei MateBook D 16 2022 | |
| Acer Swift X SFX16-51G-5388 | |
| Asus Vivobook Pro 16X-M7600QE | |
| Asus Vivobook Pro 16X-M7600QE | |
| AIDA64 / Memory Write | |
| Acer Swift X SFX16-51G-5388 | |
| Lenovo Yoga 7 16IAP7 | |
| Huawei MateBook D 16 2022 | |
| Dell Inspiron 16 Plus 7620 | |
| Media Intel Core i7-12700H (23679 - 88660, n=64) | |
| Asus Vivobook Pro 16X-M7600QE | |
| Asus Vivobook Pro 16X-M7600QE | |
| AIDA64 / Memory Latency | |
| Acer Swift X SFX16-51G-5388 | |
| Huawei MateBook D 16 2022 | |
| Lenovo Yoga 7 16IAP7 | |
| Dell Inspiron 16 Plus 7620 | |
| Media Intel Core i7-12700H (76.2 - 133.9, n=62) | |
| Asus Vivobook Pro 16X-M7600QE | |
| Asus Vivobook Pro 16X-M7600QE | |
| Dell Inspiron 16 Plus 7610 | |
* ... Meglio usare valori piccoli
Latenza DPC
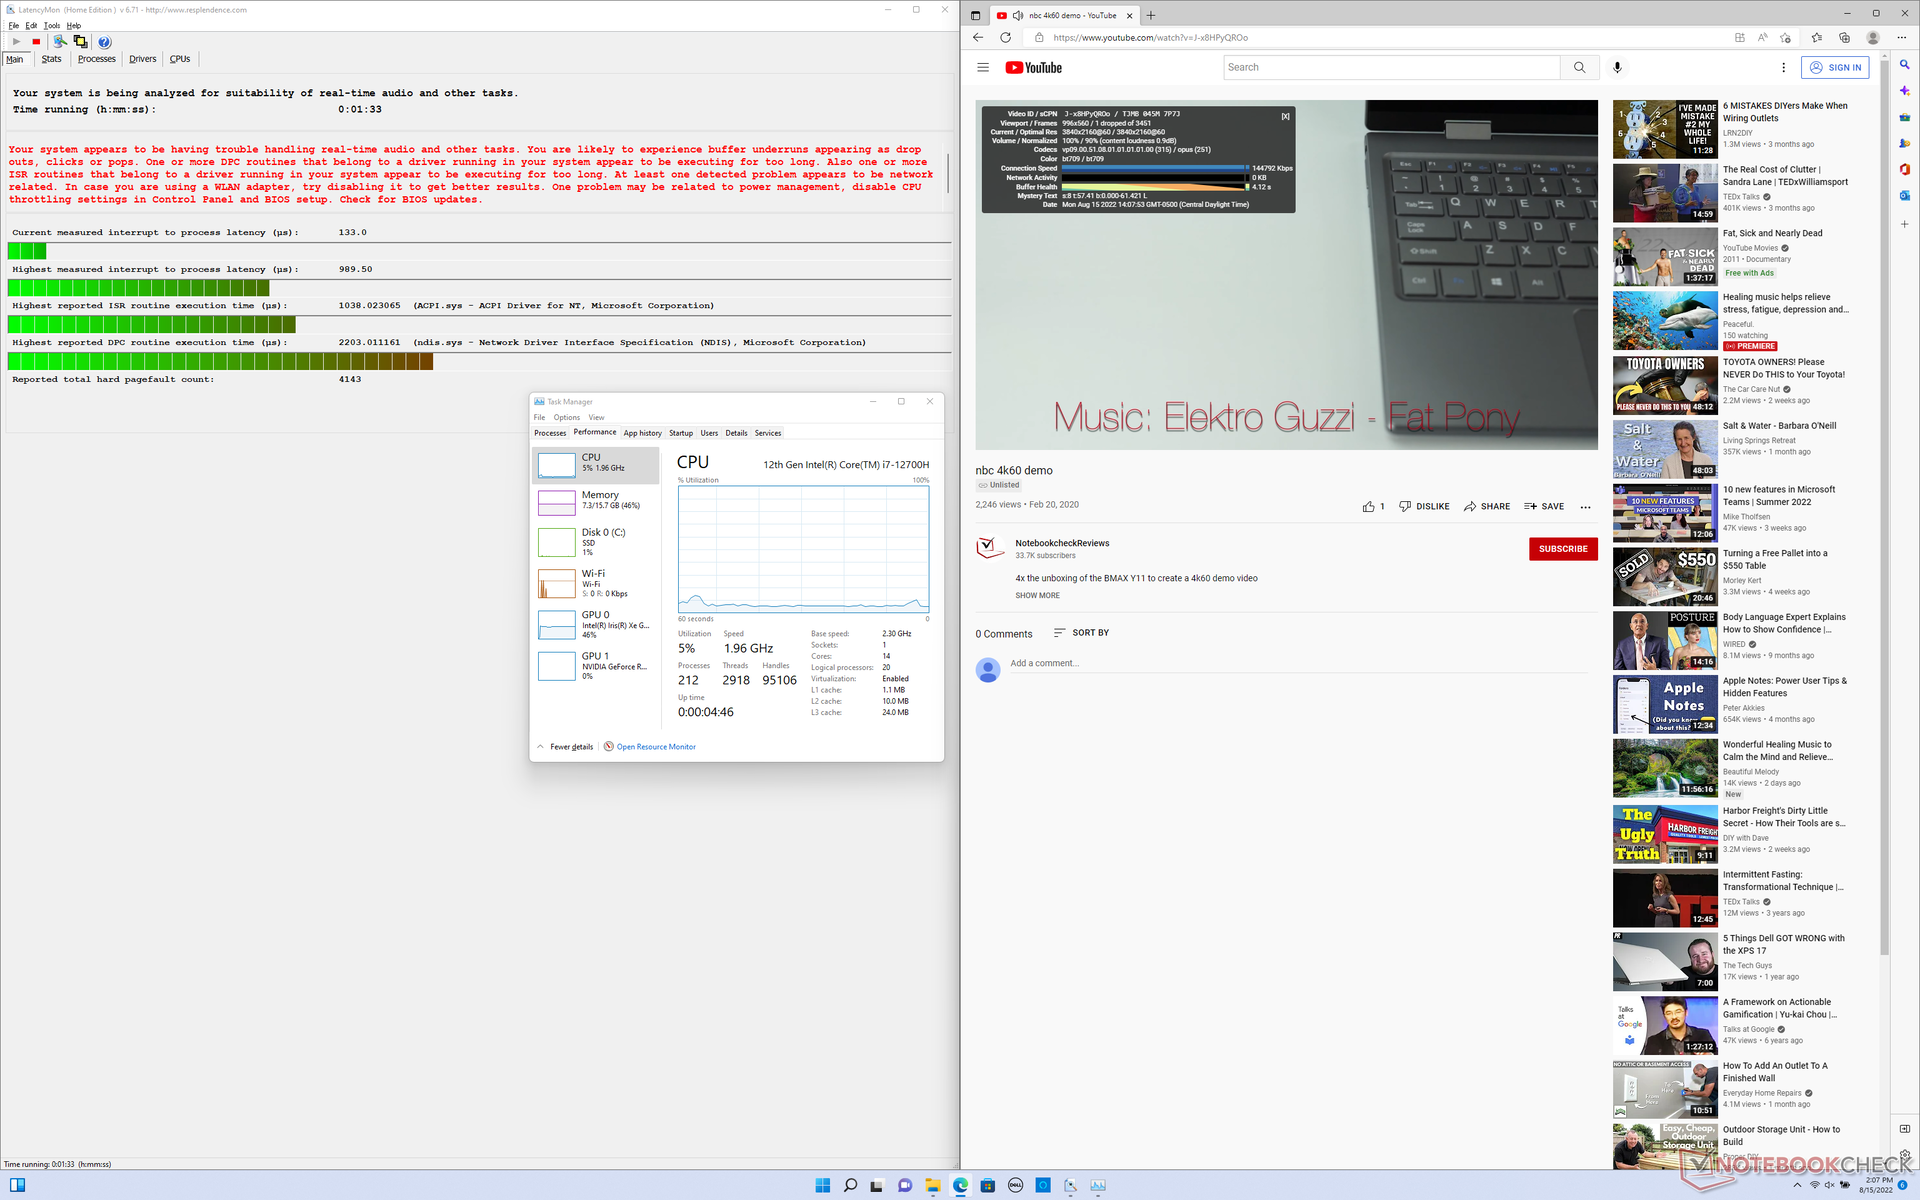
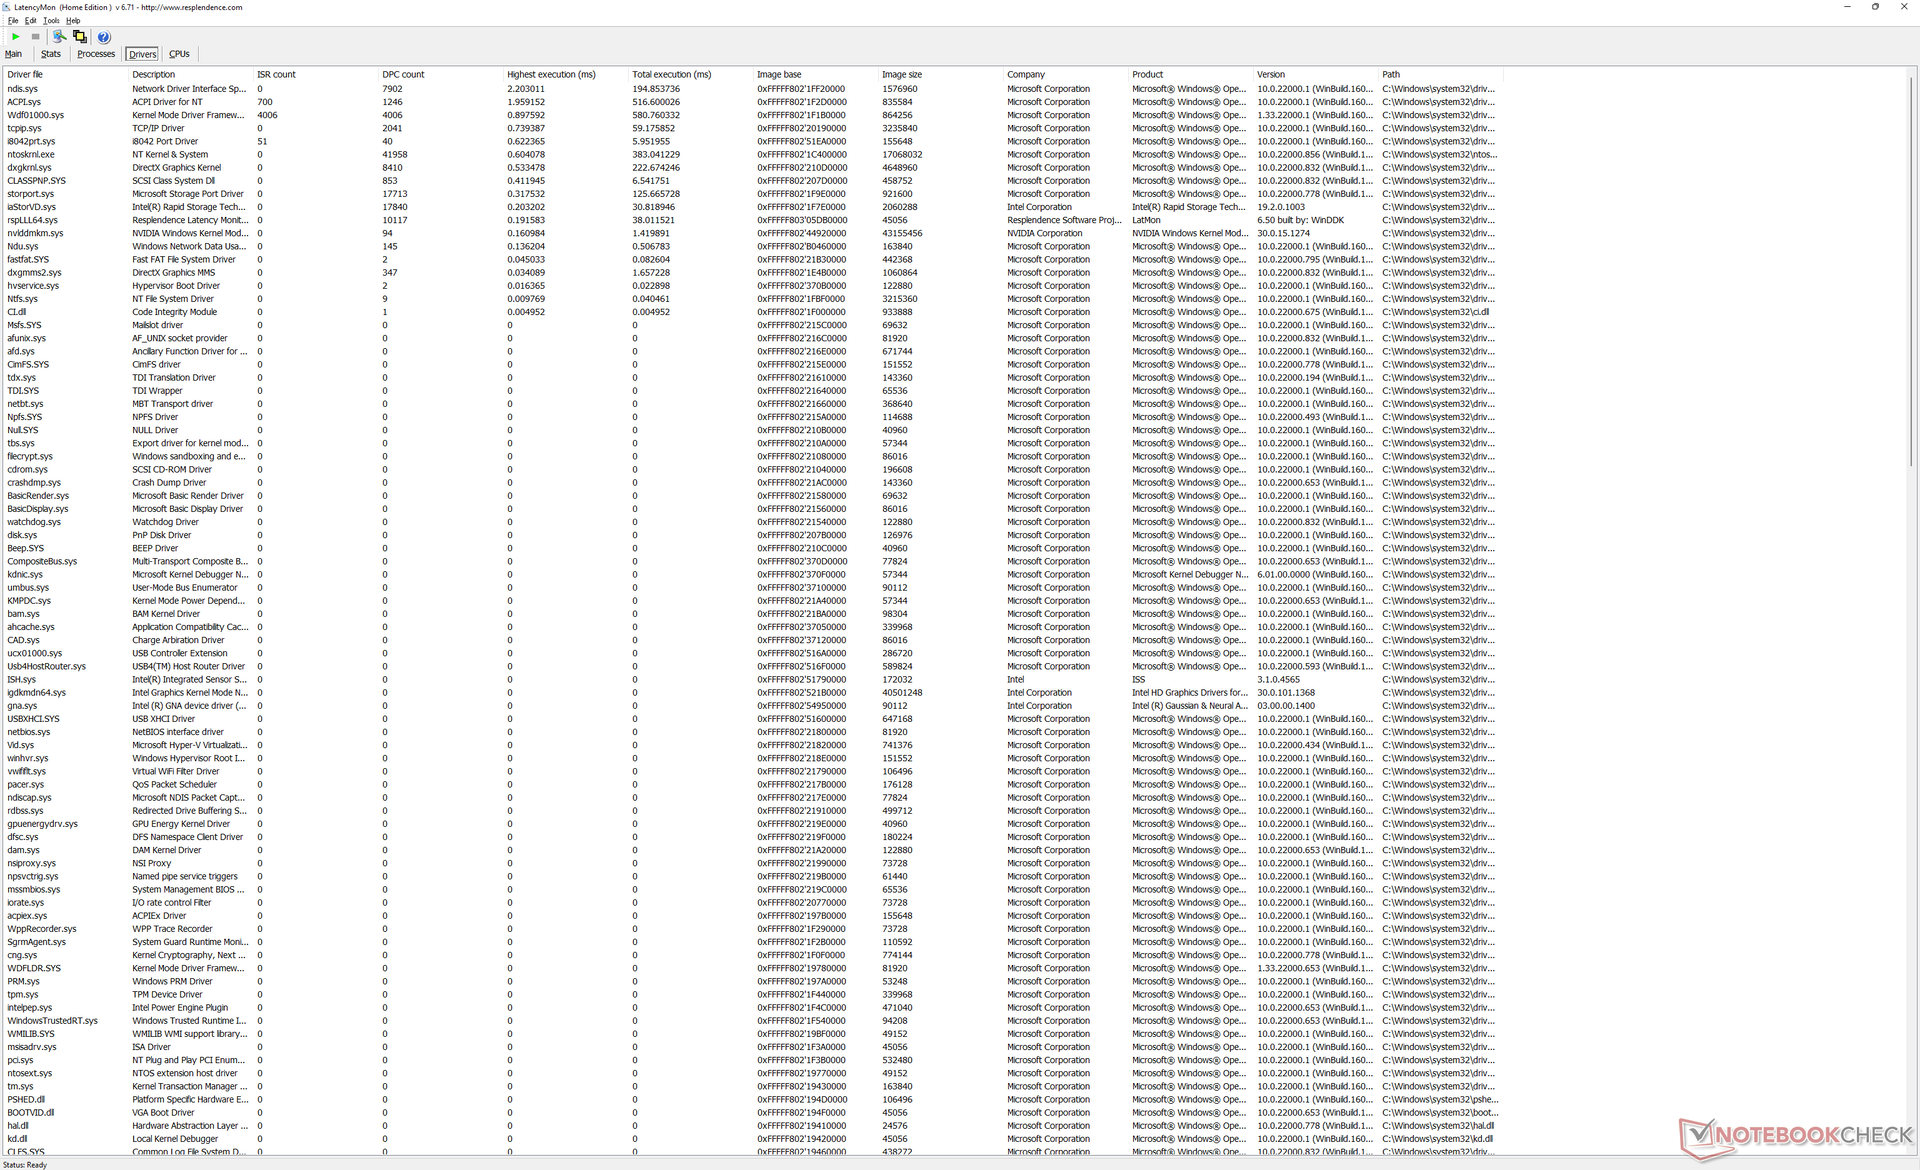
LatencyMon rivela lievi problemi di DPC quando si aprono più schede del browser sulla nostra homepage. la riproduzione di video 4K a 60 FPS è invece fluida, con una sola caduta di fotogrammi durante il nostro video di prova della durata di un minuto.
| DPC Latencies / LatencyMon - interrupt to process latency (max), Web, Youtube, Prime95 | |
| Acer Swift X SFX16-51G-5388 | |
| Asus Vivobook Pro 16X-M7600QE | |
| Dell Inspiron 16 Plus 7610 | |
| Dell Inspiron 16 Plus 7620 | |
| Huawei MateBook D 16 2022 | |
| Lenovo Yoga 7 16IAP7 | |
* ... Meglio usare valori piccoli
Dispositivi di archiviazione
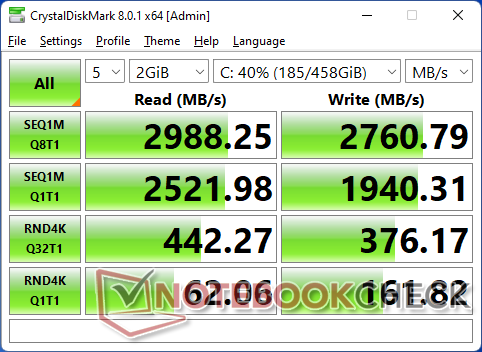
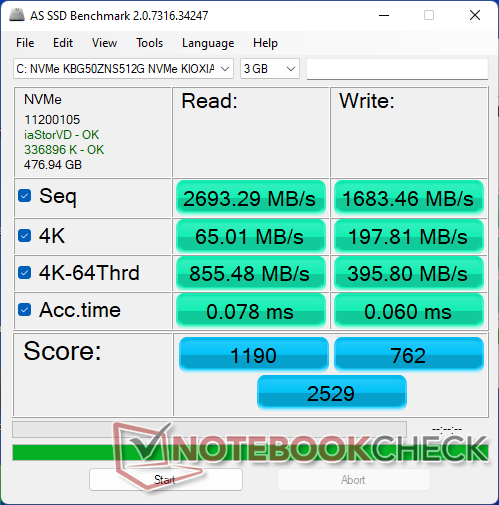
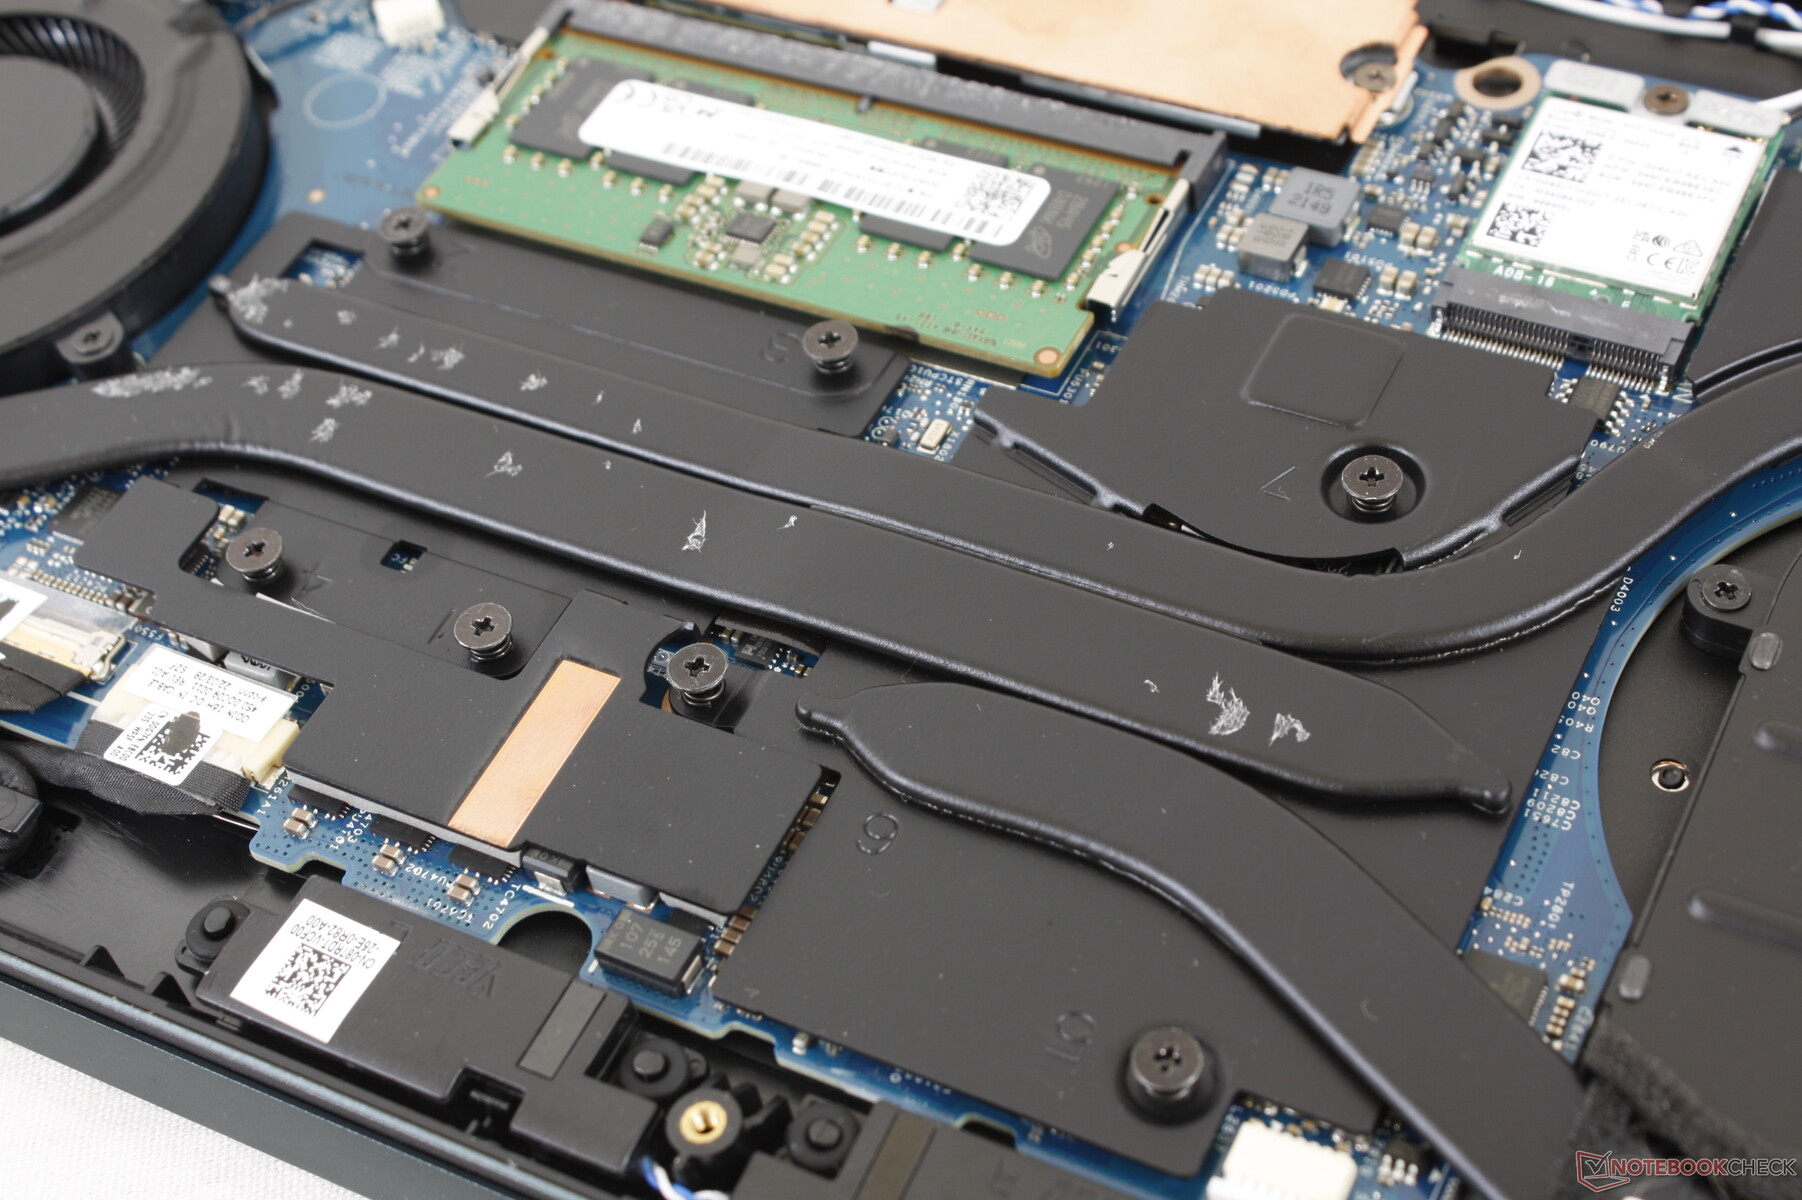
La nostra unità di prova è dotata di un'unità economica PCIe4 x4 M.2 da 512 GB.SSD Kioxia per velocità di lettura e scrittura sequenziale fino a ~2700 MB/s ciascuna. Un diffusore di calore in rame si trova sulla parte superiore per favorire il raffreddamento. L'unità nella nostra unità non ha mostrato problemi di throttling delle prestazioni quando si è eseguito DiskSpd in loop.

| Drive Performance rating - Percent | |
| Huawei MateBook D 16 2022 | |
| Asus Vivobook Pro 16X-M7600QE | |
| Lenovo Yoga 7 16IAP7 | |
| Dell Inspiron 16 Plus 7620 | |
| Acer Swift X SFX16-51G-5388 | |
| Dell Inspiron 16 Plus 7610 | |
* ... Meglio usare valori piccoli
Disk Throttling: DiskSpd Read Loop, Queue Depth 8
Prestazioni della GPU - leggermente più veloci di prima
Le prestazioni grafiche della nostra GeForce RTX 3050 Ti è solo del 10% circa più veloce della RTX 3050 del modello dello scorso anno. Anche se la serie RTX 3050 è generalmente deludente, dato che la più vecchia e più economica GTX 1660 Ti è superiore, ma almeno l'implementazione di Dell è più veloce della maggior parte degli altri portatili con la stessa GPU
L'aggiornamento alla configurazione RTX 3060 dovrebbe aumentare le prestazioni grafiche fino al 20%. Tuttavia, la GPU sarebbe limitata a un TGP da 60 W, che si colloca nella fascia bassa dello spettro delle opzioni RTX 3060 mobili.
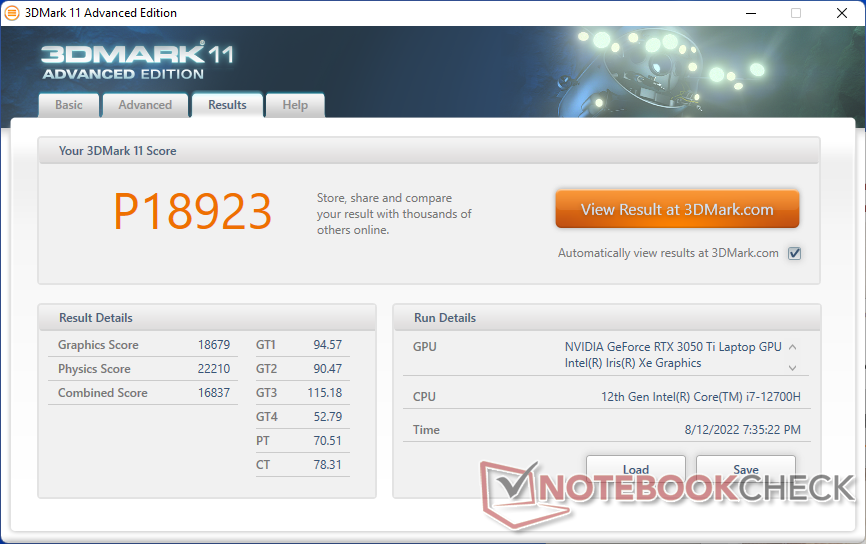
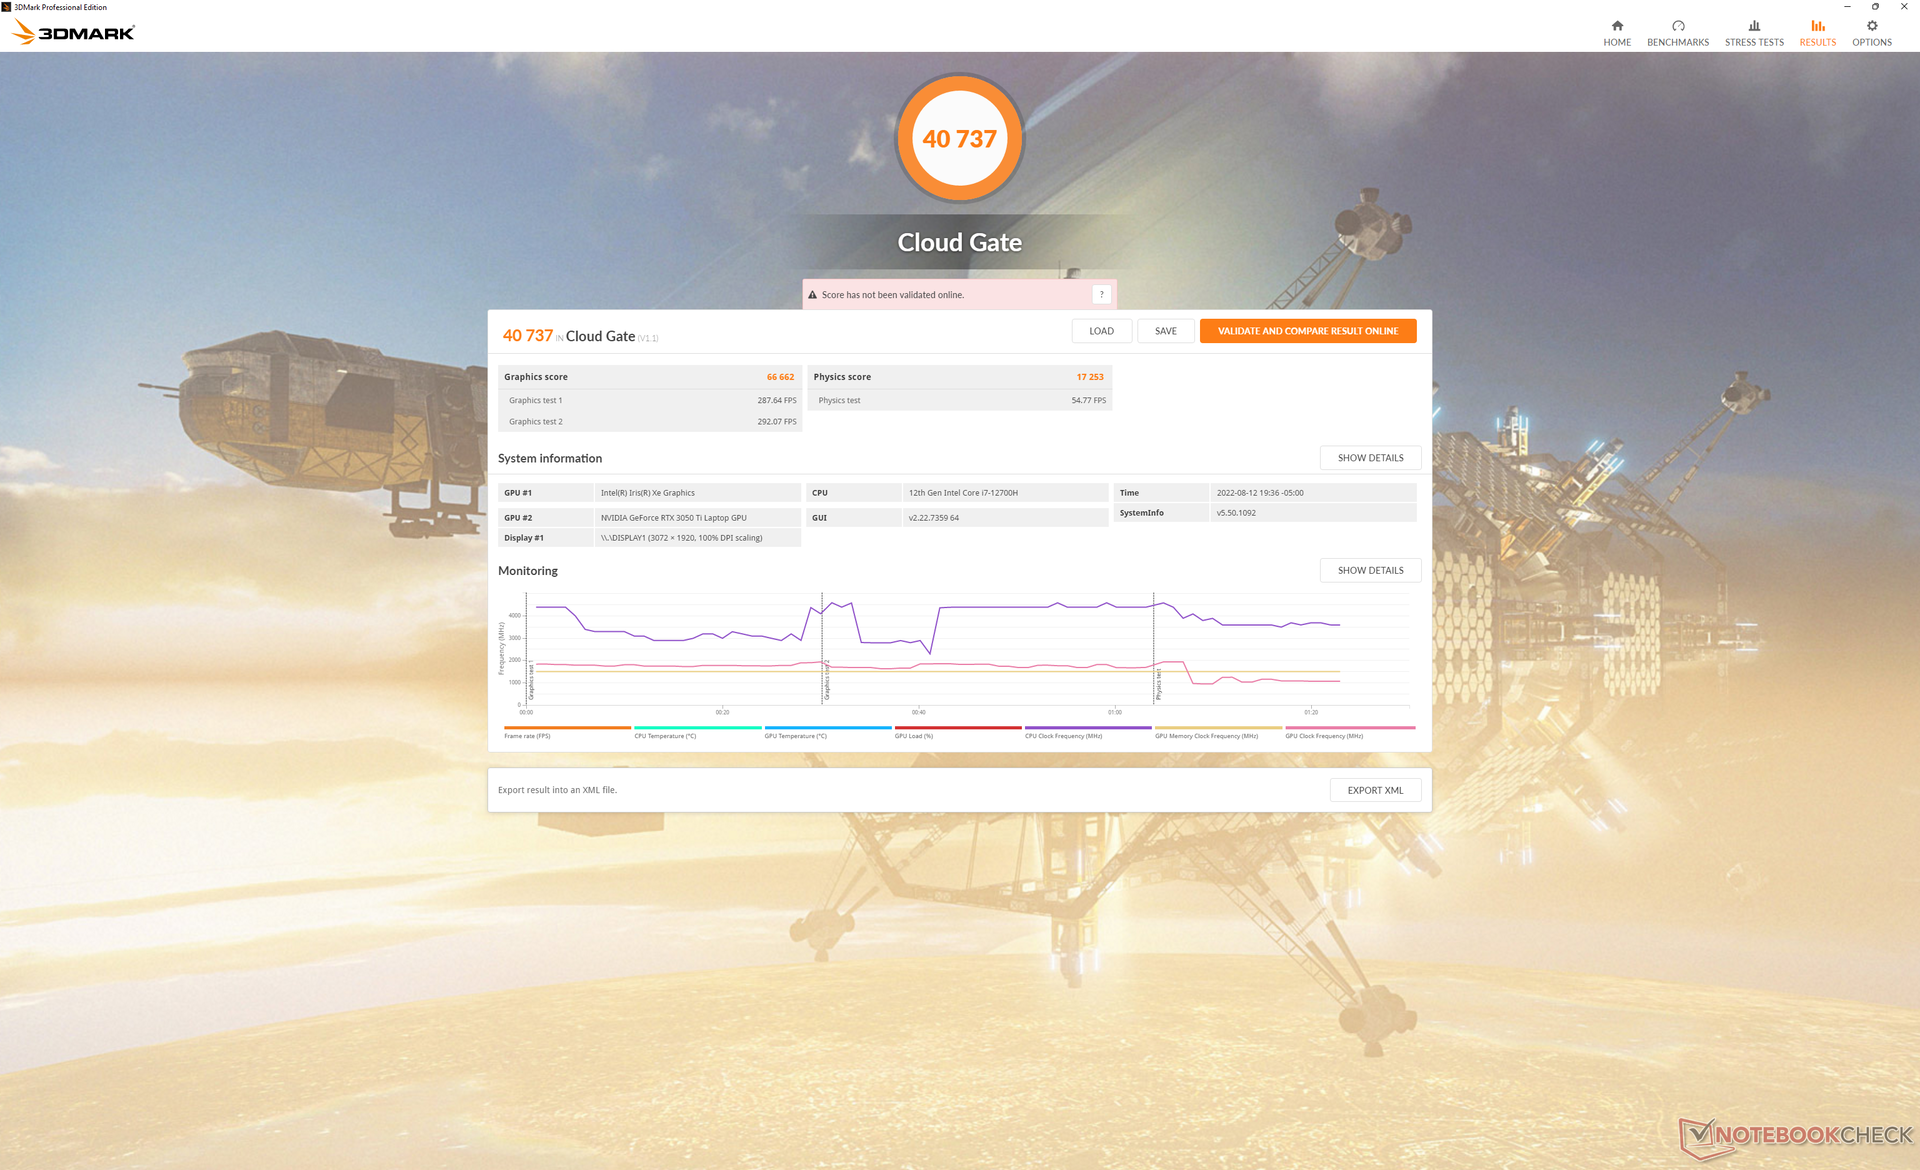
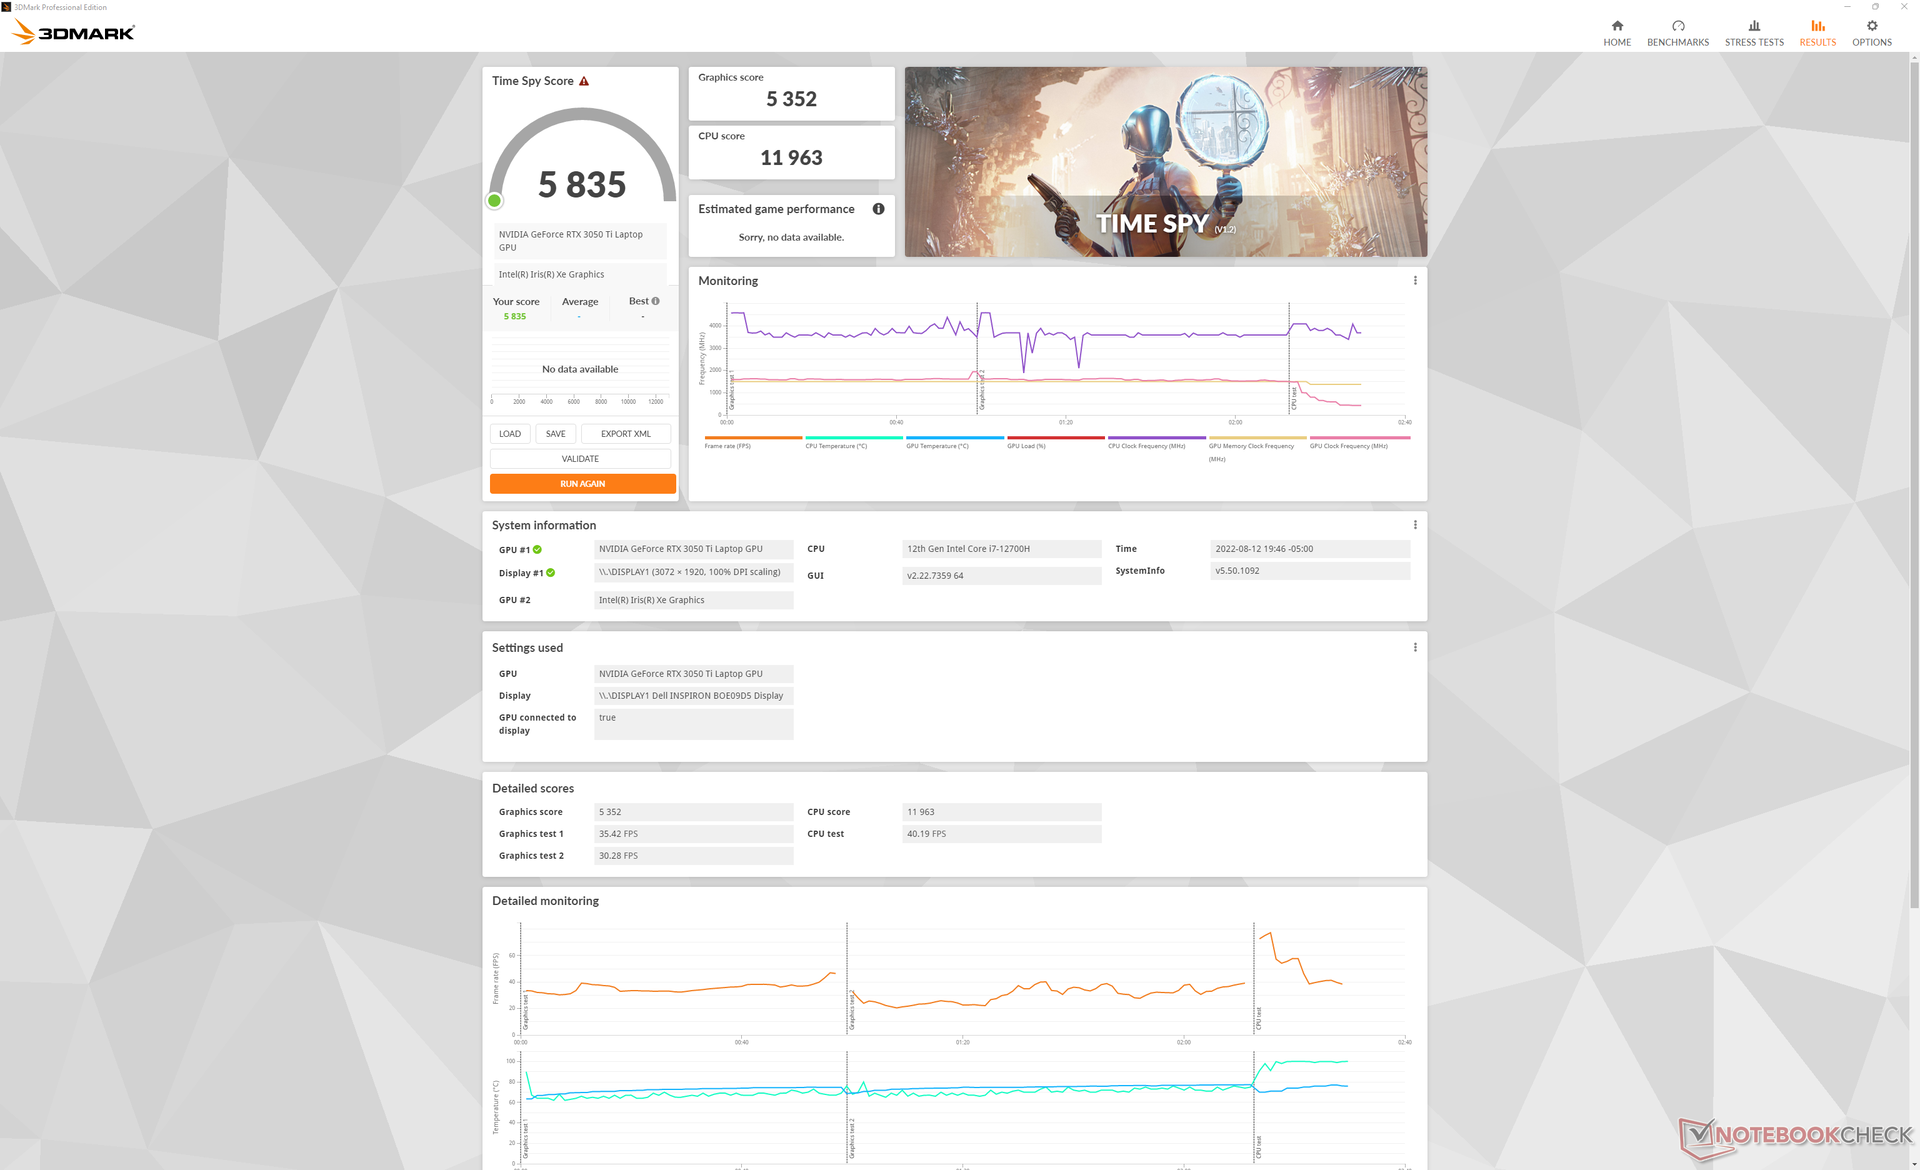
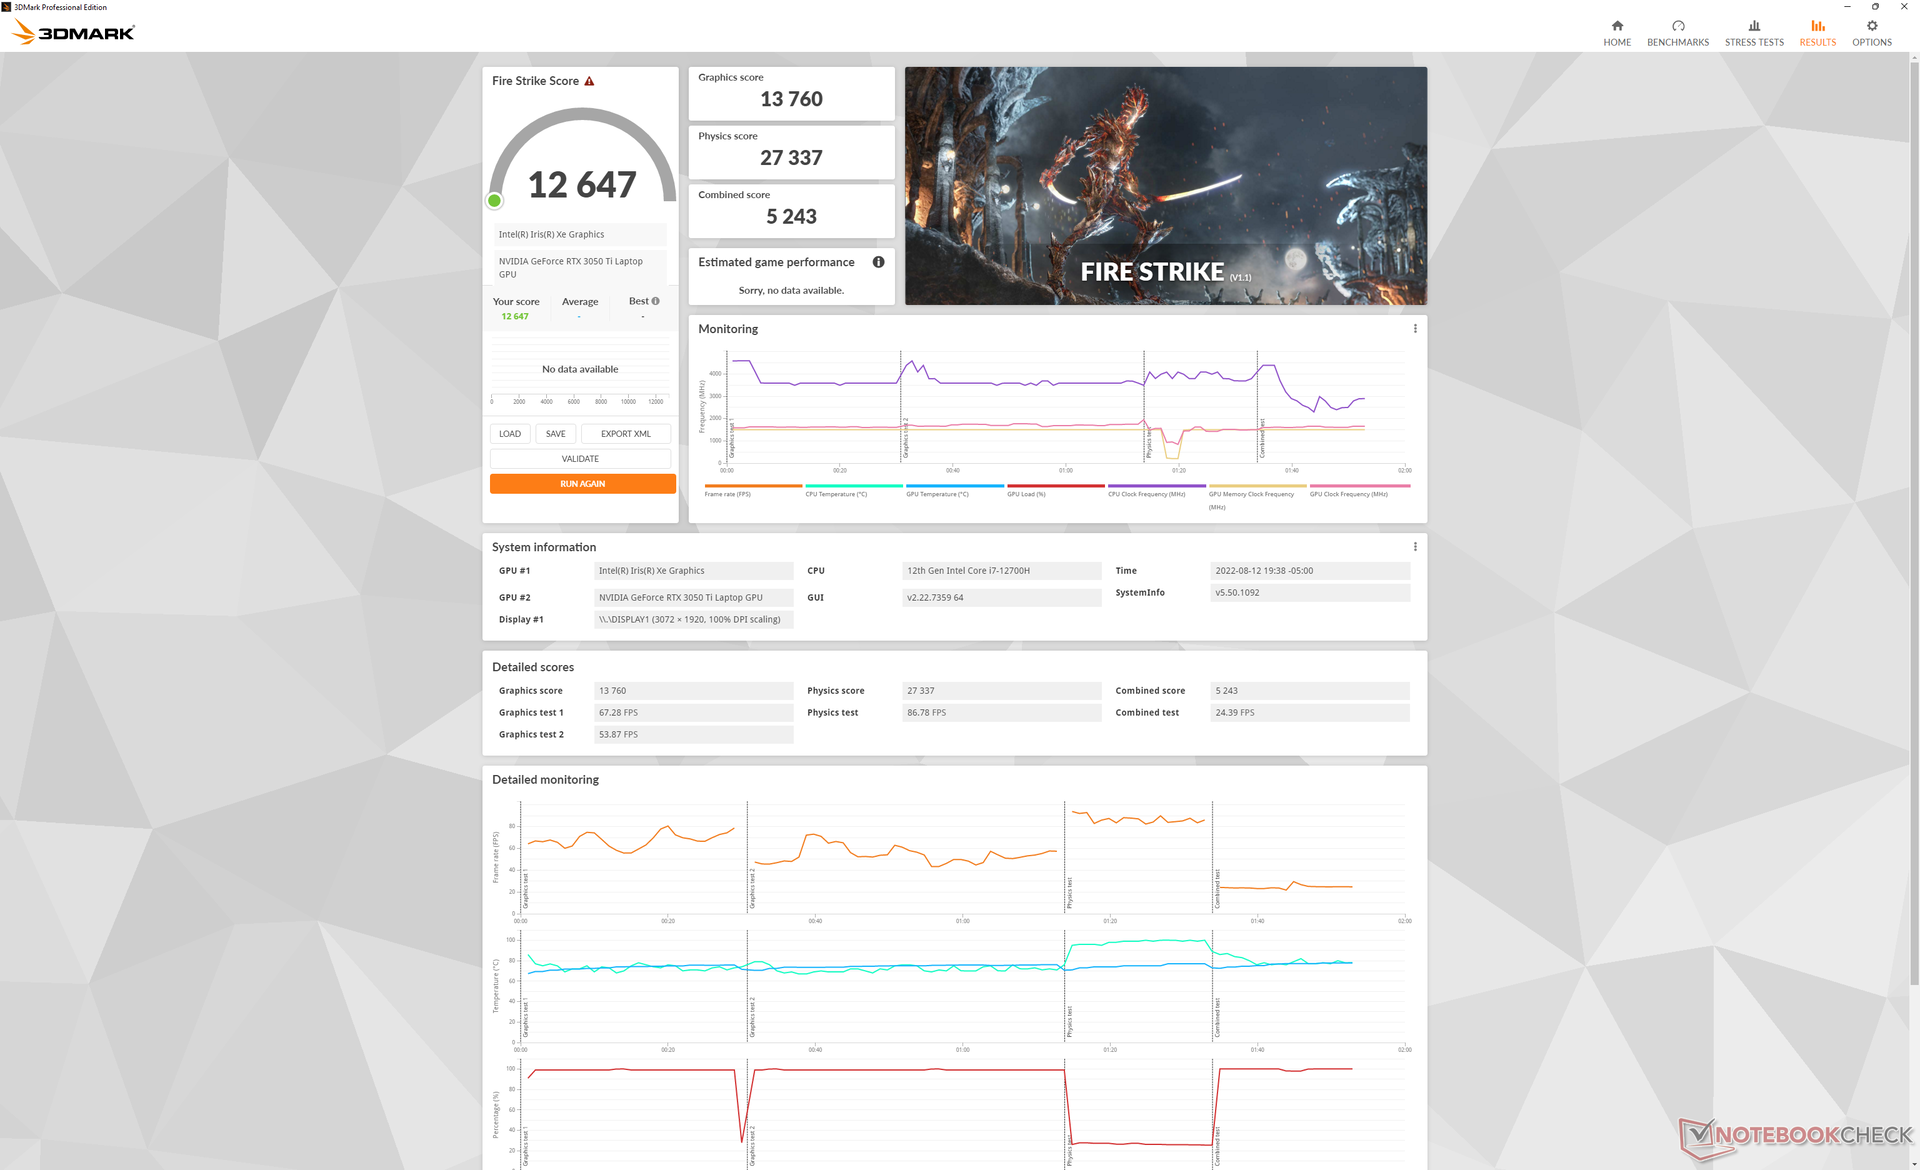
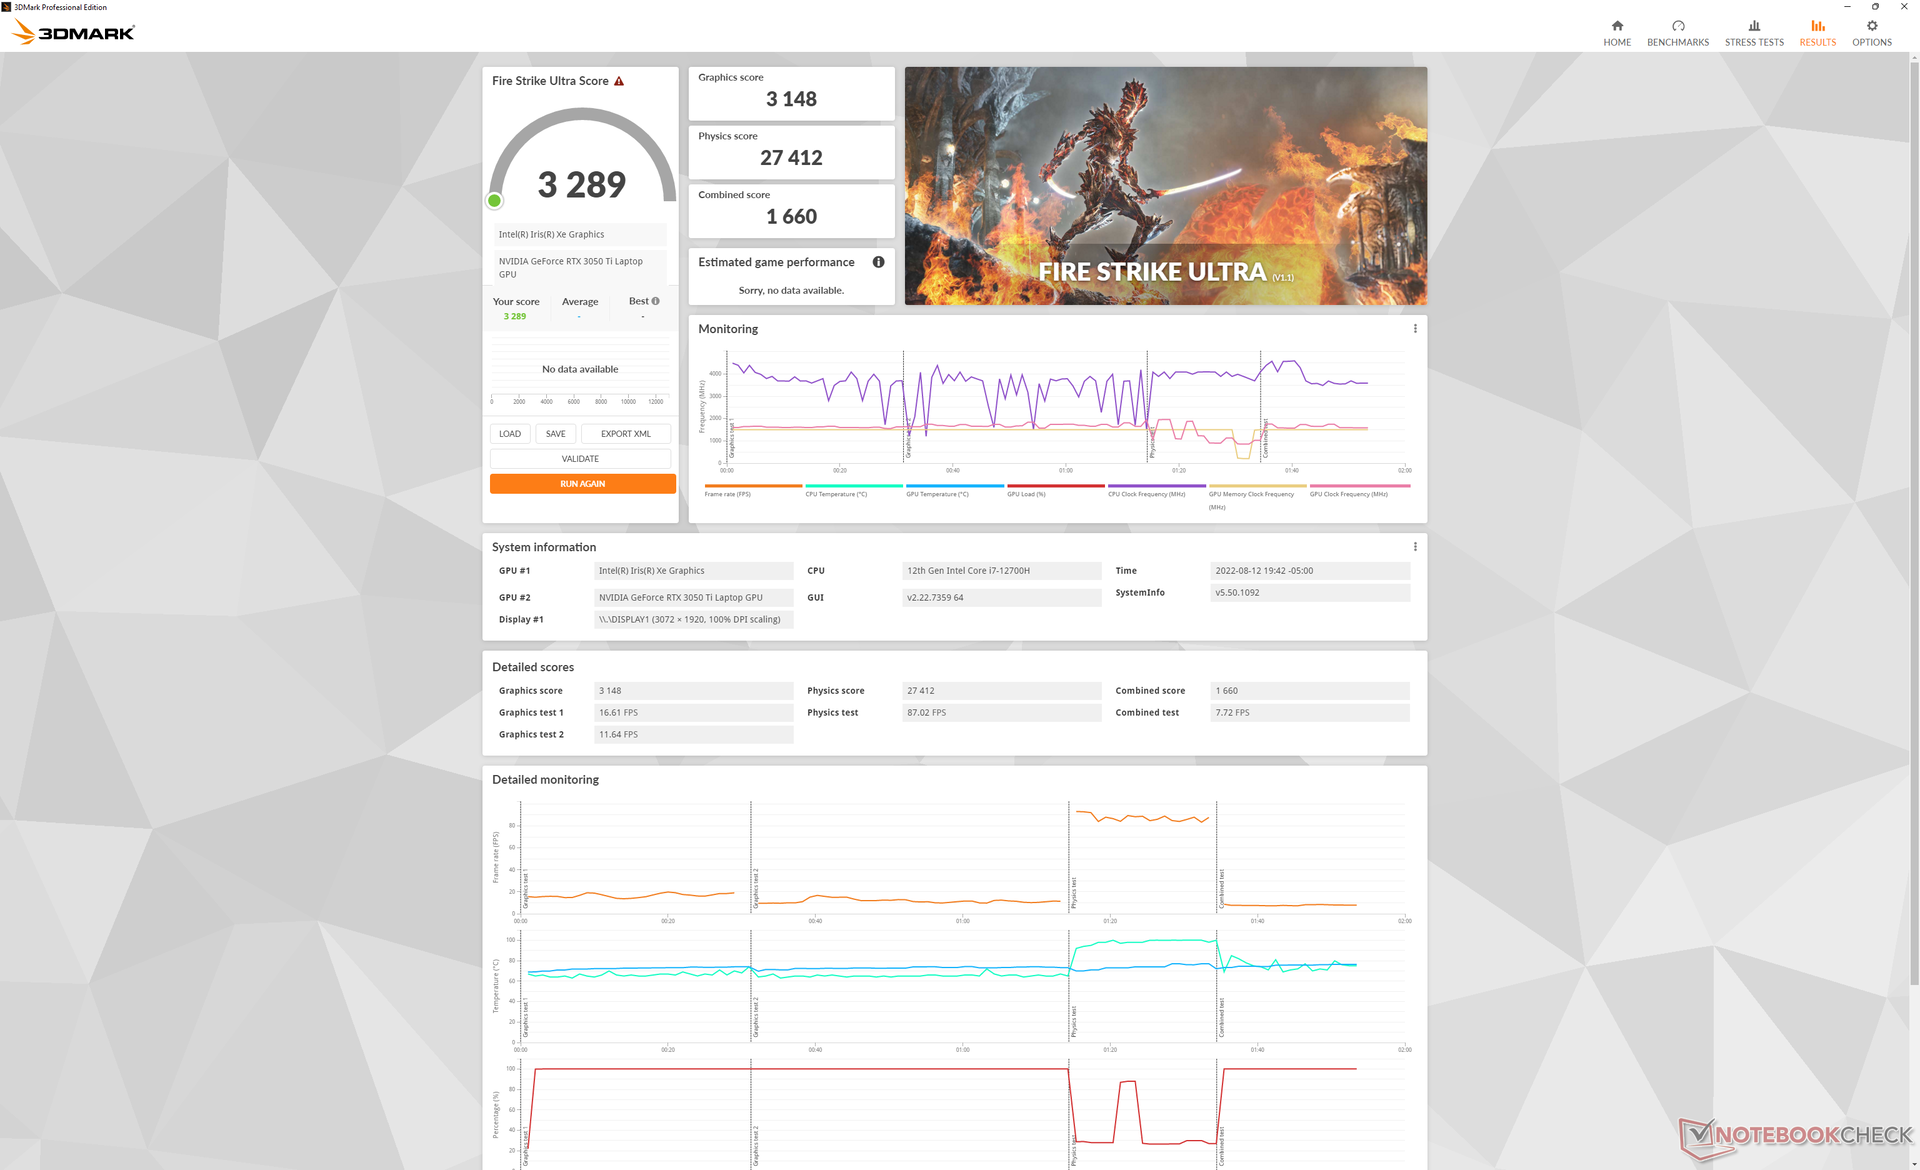
| 3DMark 11 Performance | 18923 punti | |
| 3DMark Cloud Gate Standard Score | 40737 punti | |
| 3DMark Fire Strike Score | 12647 punti | |
| 3DMark Time Spy Score | 5835 punti | |
Aiuto | ||
| Cyberpunk 2077 1.6 | |
| 1920x1080 Low Preset | |
| Dell Inspiron 16 Plus 7620 | |
| Media NVIDIA GeForce RTX 3050 Ti Laptop GPU (48.2 - 81.9, n=9) | |
| Lenovo Yoga 7 16IAP7 | |
| 1920x1080 Medium Preset | |
| Dell Inspiron 16 Plus 7620 | |
| Media NVIDIA GeForce RTX 3050 Ti Laptop GPU (47.4 - 67.4, n=9) | |
| Lenovo Yoga 7 16IAP7 | |
| 1920x1080 High Preset | |
| Dell Inspiron 16 Plus 7620 | |
| Media NVIDIA GeForce RTX 3050 Ti Laptop GPU (39 - 51.5, n=9) | |
| Lenovo Yoga 7 16IAP7 | |
| 1920x1080 Ultra Preset | |
| Media NVIDIA GeForce RTX 3050 Ti Laptop GPU (31 - 50.5, n=9) | |
| Dell Inspiron 16 Plus 7620 | |
| Lenovo Yoga 7 16IAP7 | |
| 2560x1440 Ultra Preset | |
| Dell Inspiron 16 Plus 7620 | |
| Media NVIDIA GeForce RTX 3050 Ti Laptop GPU (20 - 25, n=4) | |
Witcher 3 FPS Chart
| basso | medio | alto | ultra | QHD | |
|---|---|---|---|---|---|
| GTA V (2015) | 181.7 | 176.1 | 148.7 | 75.4 | 53.4 |
| The Witcher 3 (2015) | 297.3 | 183 | 108.4 | 57 | |
| Dota 2 Reborn (2015) | 171.8 | 157.5 | 148 | 140.7 | |
| Final Fantasy XV Benchmark (2018) | 138.9 | 77.7 | 54.1 | 38.1 | |
| X-Plane 11.11 (2018) | 132.5 | 115.6 | 92.8 | ||
| Strange Brigade (2018) | 307 | 138.3 | 110.2 | 95.2 | 69.1 |
| Cyberpunk 2077 1.6 (2022) | 79.5 | 66.2 | 47.9 | 39.5 | 23.4 |
Emissioni: potrebbe essere più silenzioso
Rumore del sistema
Il rumore della ventola è sempre presente, poiché entrambe le ventole non sono mai veramente inattive, anche quando si è seduti sulla scrivania senza applicazioni in esecuzione. Al massimo della silenziosità, abbiamo registrato un rumore di 25,7 dB(A) contro uno sfondo silenzioso di 23,3 dB(A), anche quando è impostato il profilo di alimentazione "Quiet". Inoltre, il rumore della ventola impiega un po' di tempo per calmarsi dopo l'esecuzione di carichi elevati come i giochi. Dopo la chiusura Witcher 3, ad esempio, le ventole rimangono rumorose per diversi minuti.
Il rumore della ventola si stabilizza a 49,2 dB(A) quando si utilizza la modalità Ultra Performance o a 46,1 dB(A) Witcher 3 in modalità Ultra Performance o 46,1 dB(A) in modalità Balanced, più rumorosa di quella del Vivobook Pro 16X dotato della stessa GPU RTX 3050 Ti. L'elevata gamma di 40 dB(A) ha più in comune con i portatili da gioco ad alta potenza che con altri portatili multimediali.
Rumorosità
| Idle |
| 25.7 / 26.1 / 30.6 dB(A) |
| Sotto carico |
| 46.2 / 49.4 dB(A) |
 | ||
30 dB silenzioso 40 dB(A) udibile 50 dB(A) rumoroso |
||
min: | ||
| Dell Inspiron 16 Plus 7620 GeForce RTX 3050 Ti Laptop GPU, i7-12700H, Kioxia BG5 KBG50ZNS512G | Dell Inspiron 16 Plus 7610 GeForce RTX 3050 4GB Laptop GPU, i7-11800H, Kingston OM3PDP3512B | Lenovo Yoga 7 16IAP7 Iris Xe G7 96EUs, i7-1260P, Micron 2450 512GB MTFDKCD512TFK | Huawei MateBook D 16 2022 Iris Xe G7 96EUs, i7-12700H, Silicon Motion PCIe-8 SSD | Acer Swift X SFX16-51G-5388 GeForce RTX 3050 4GB Laptop GPU, i5-11320H, Samsung PM991 MZVLQ512HBLU | Asus Vivobook Pro 16X-M7600QE GeForce RTX 3050 Ti Laptop GPU, R9 5900HX, SK Hynix HFM001TD3JX013N | |
|---|---|---|---|---|---|---|
| Noise | 3% | 14% | 8% | 3% | 1% | |
| off /ambiente * (dB) | 23.3 | 24.4 -5% | 23.6 -1% | 24.2 -4% | 25.4 -9% | 26 -12% |
| Idle Minimum * (dB) | 25.7 | 24.4 5% | 23.6 8% | 24.2 6% | 25.4 1% | 27 -5% |
| Idle Average * (dB) | 26.1 | 24.4 7% | 23.6 10% | 25.8 1% | 25.4 3% | 27 -3% |
| Idle Maximum * (dB) | 30.6 | 24.4 20% | 23.6 23% | 30.5 -0% | 27.8 9% | 27.5 10% |
| Load Average * (dB) | 46.2 | 48.3 -5% | 37.7 18% | 39.8 14% | 41 11% | 41.7 10% |
| Witcher 3 ultra * (dB) | 49.2 | 48.9 1% | 40 19% | 39.8 19% | ||
| Load Maximum * (dB) | 49.4 | 48.9 1% | 40.2 19% | 39.8 19% | 47 5% | 45.3 8% |
* ... Meglio usare valori piccoli
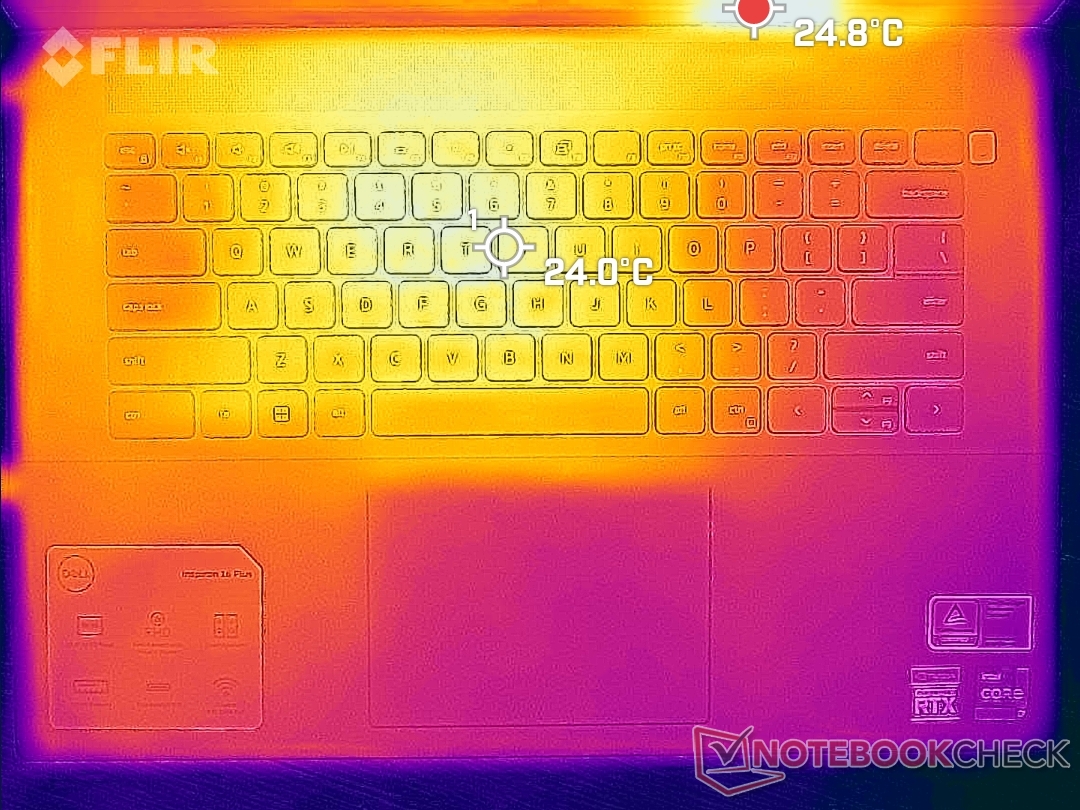
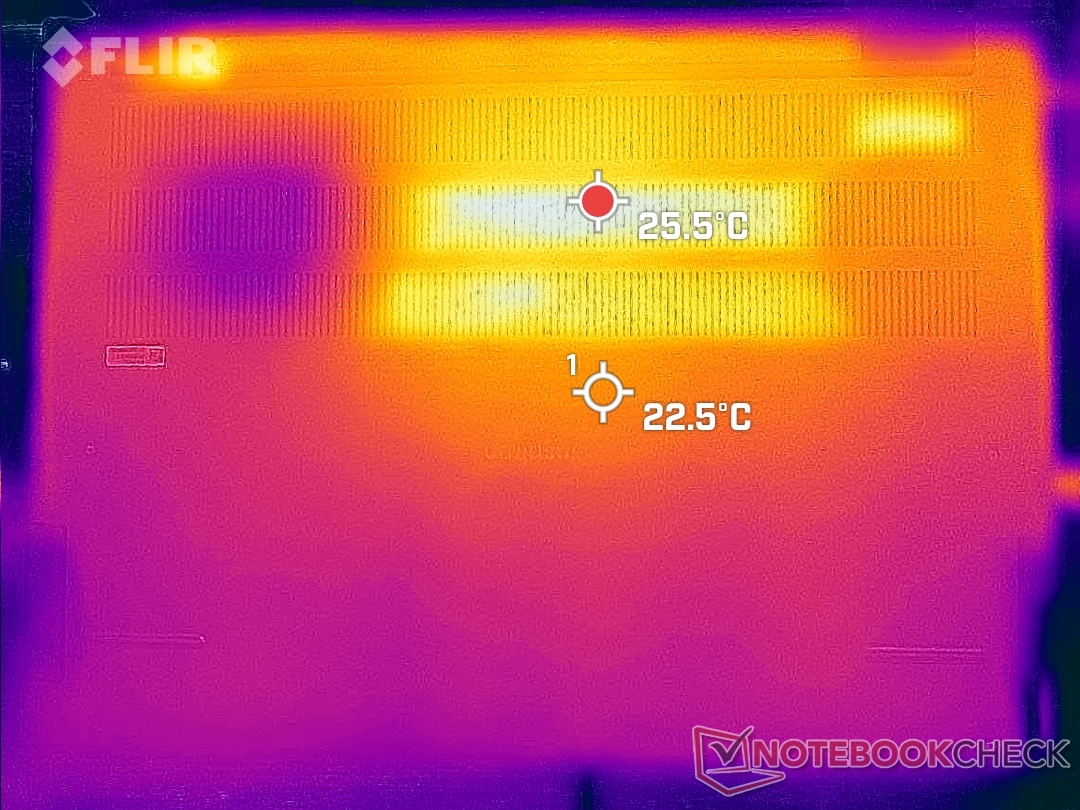
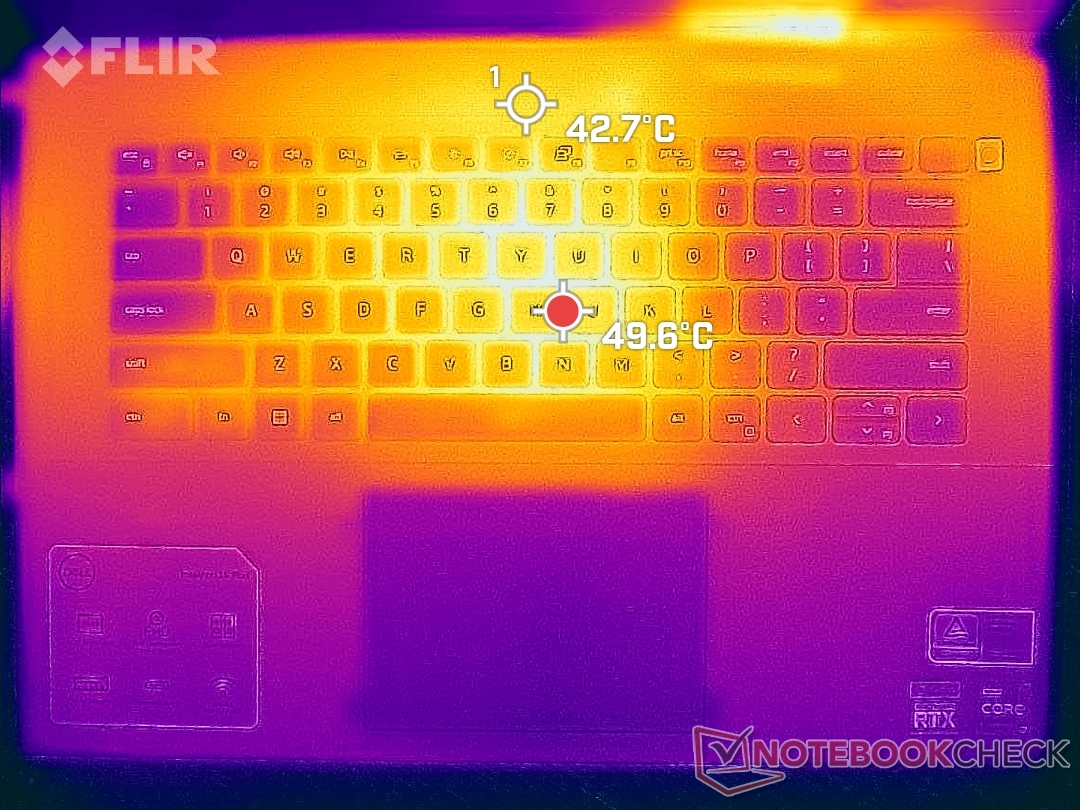
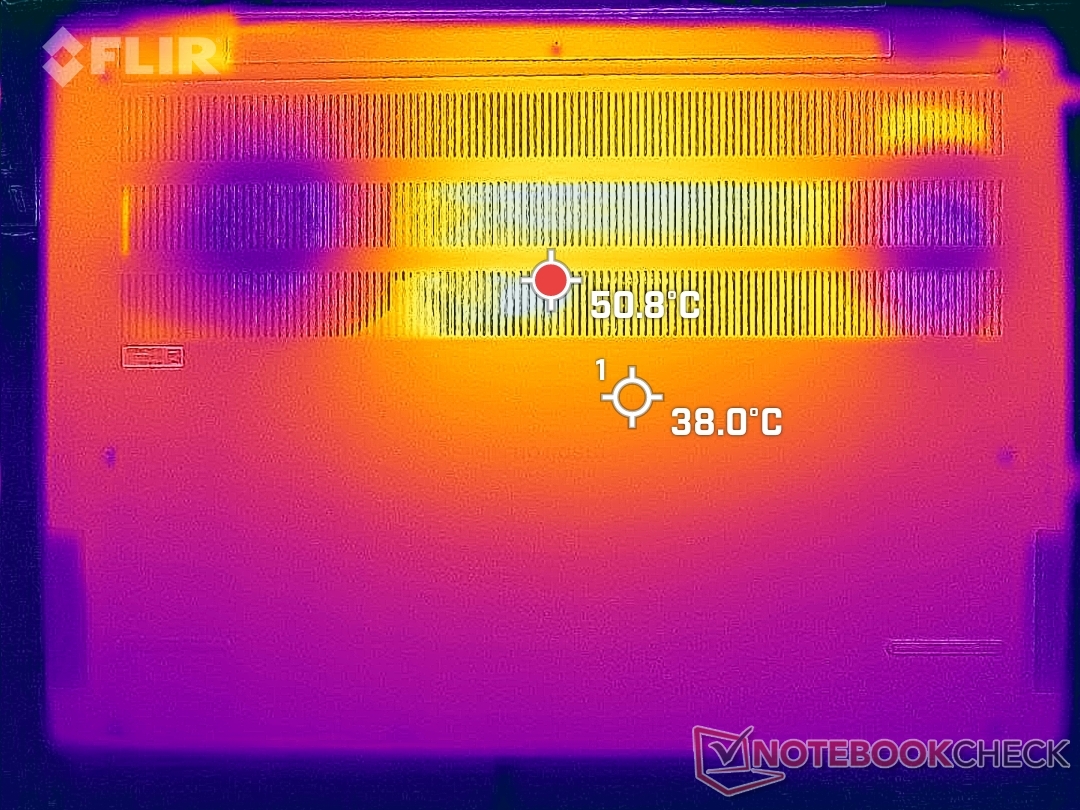
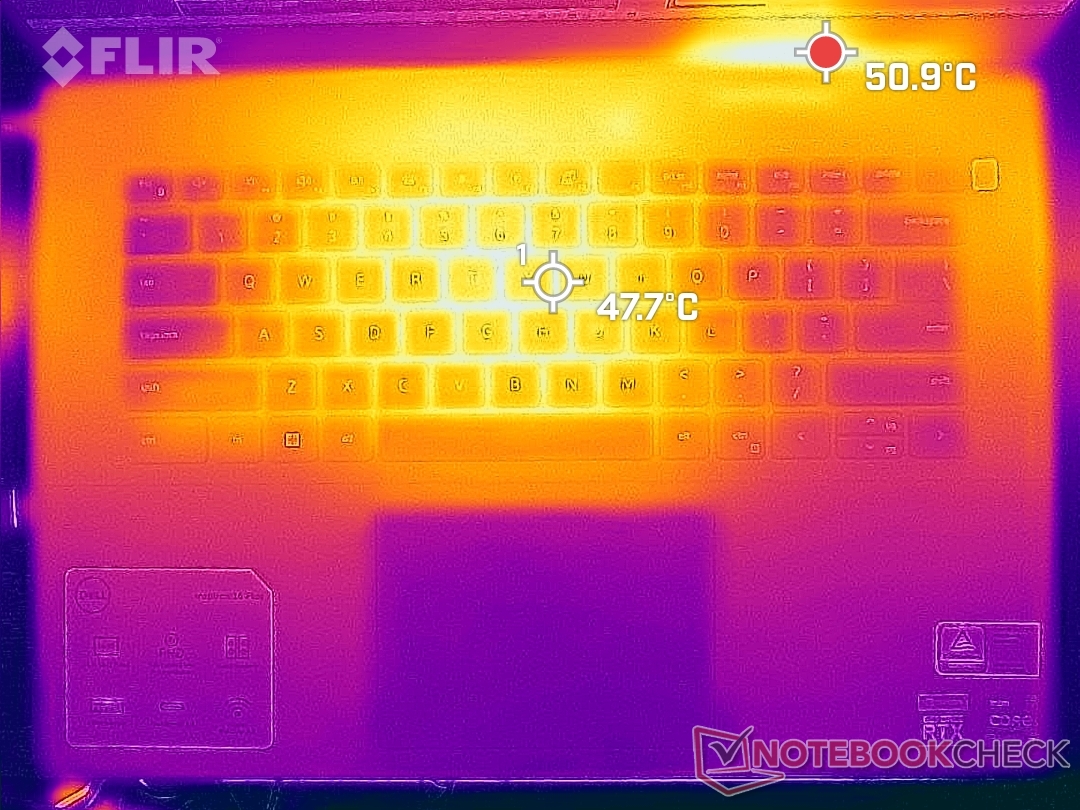
Temperatura
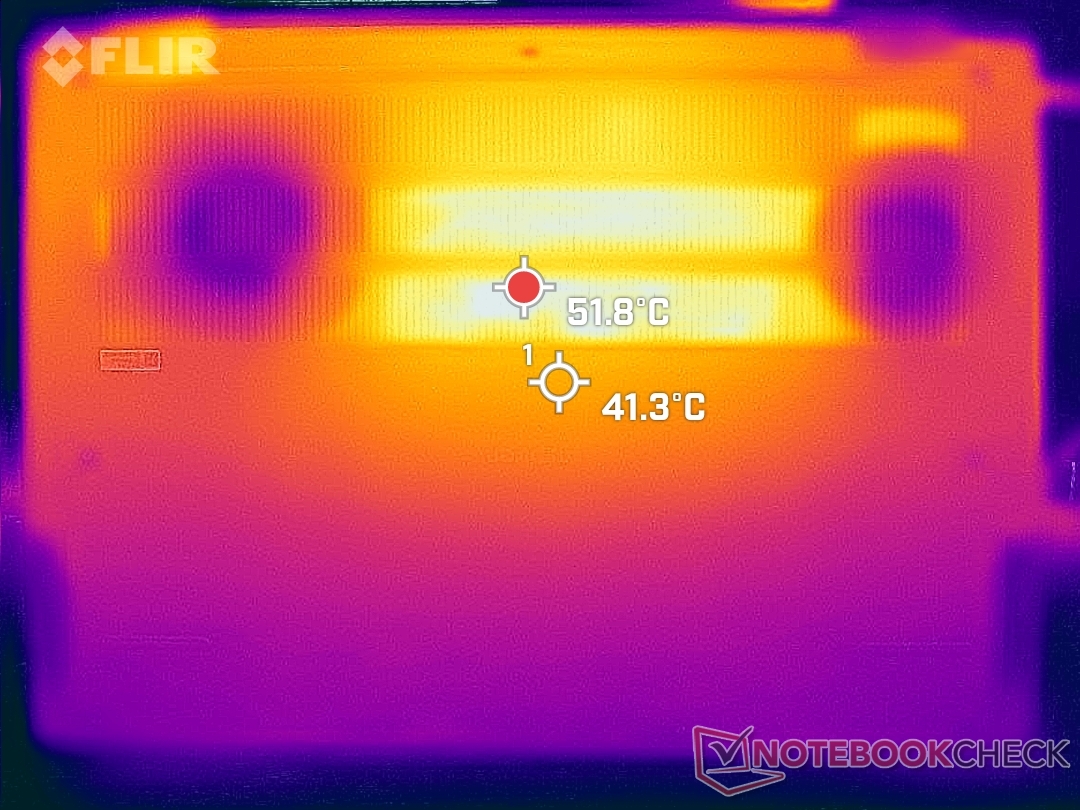
I punti caldi si trovano proprio al centro della tastiera, dove le temperature possono raggiungere i 50 C quando si eseguono carichi elevati come i giochi. Altri portatili da 16 pollici come l' Asus Vivobook Pro 16Xlenovo Yoga 7 e persino il vecchio Inspiron 16 7610 sono più freddi di qualche grado quando sono sottoposti a carichi simili. Anche i poggiapolsi possono essere più caldi del previsto, con una temperatura di 30 °C rispetto alla più comune media di 20 °C. L'Inspiron 16 Plus 7620 è certamente più un portatile da scrivania che un portatile da viaggio.
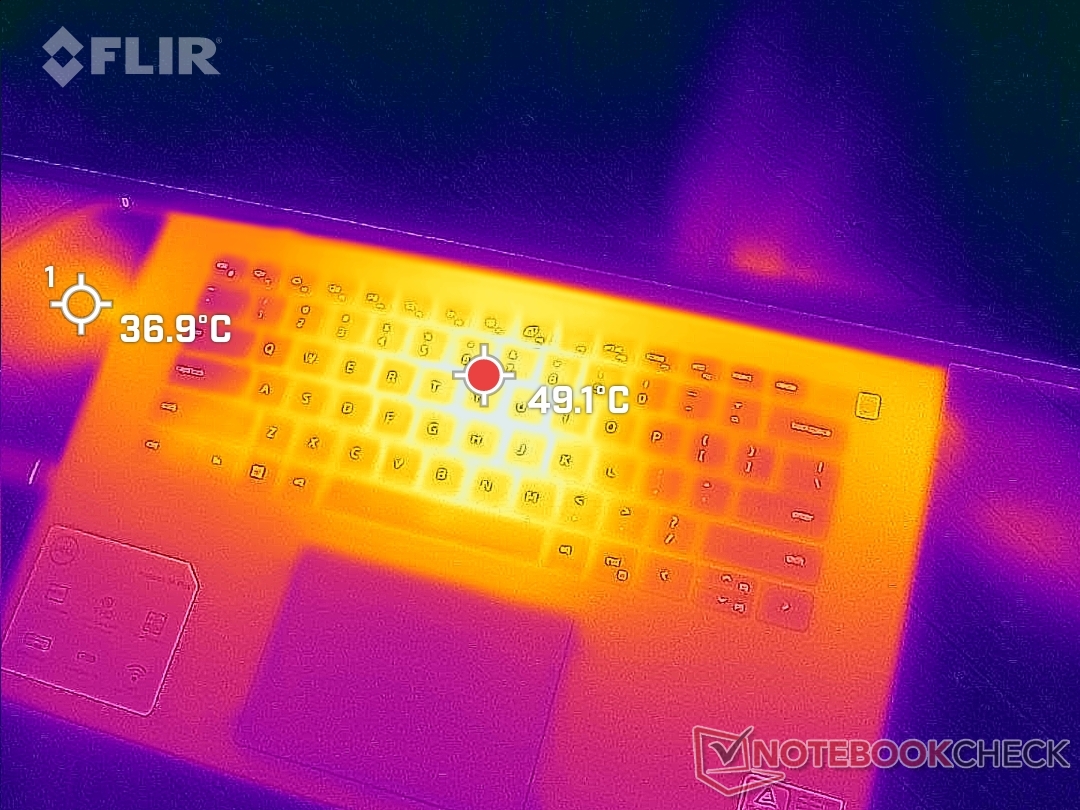
(-) La temperatura massima sul lato superiore è di 46 °C / 115 F, rispetto alla media di 36.8 °C / 98 F, che varia da 21 a 71 °C per questa classe Multimedia.
(-) Il lato inferiore si riscalda fino ad un massimo di 45.8 °C / 114 F, rispetto alla media di 39.1 °C / 102 F
(+) In idle, la temperatura media del lato superiore è di 26.8 °C / 80 F, rispetto alla media deld ispositivo di 31.3 °C / 88 F.
(±) Riproducendo The Witcher 3, la temperatura media per il lato superiore e' di 36.8 °C / 98 F, rispetto alla media del dispositivo di 31.3 °C / 88 F.
(+) I poggiapolsi e il touchpad sono piu' freddi della temperatura della pelle con un massimo di 30.6 °C / 87.1 F e sono quindi freddi al tatto.
(±) La temperatura media della zona del palmo della mano di dispositivi simili e'stata di 28.7 °C / 83.7 F (-1.9 °C / -3.4 F).
| Dell Inspiron 16 Plus 7620 Intel Core i7-12700H, NVIDIA GeForce RTX 3050 Ti Laptop GPU | Dell Inspiron 16 Plus 7610 Intel Core i7-11800H, NVIDIA GeForce RTX 3050 4GB Laptop GPU | Lenovo Yoga 7 16IAP7 Intel Core i7-1260P, Intel Iris Xe Graphics G7 96EUs | Huawei MateBook D 16 2022 Intel Core i7-12700H, Intel Iris Xe Graphics G7 96EUs | Acer Swift X SFX16-51G-5388 Intel Core i5-11320H, NVIDIA GeForce RTX 3050 4GB Laptop GPU | Asus Vivobook Pro 16X-M7600QE AMD Ryzen 9 5900HX, NVIDIA GeForce RTX 3050 Ti Laptop GPU | |
|---|---|---|---|---|---|---|
| Heat | -12% | 24% | 3% | -6% | 9% | |
| Maximum Upper Side * (°C) | 46 | 46.4 -1% | 39 15% | 41.8 9% | 52.4 -14% | 39.4 14% |
| Maximum Bottom * (°C) | 45.8 | 54.8 -20% | 34.2 25% | 47.3 -3% | 50 -9% | 43.6 5% |
| Idle Upper Side * (°C) | 29.2 | 31.4 -8% | 21.2 27% | 28.3 3% | 30.3 -4% | 27.6 5% |
| Idle Bottom * (°C) | 31 | 36.6 -18% | 21.6 30% | 30.2 3% | 30.4 2% | 27.5 11% |
* ... Meglio usare valori piccoli
Stress test
Quando si esegue lo stress Prime95, la CPU raggiunge i 3,5 GHz e 80 W per i primi 15 secondi circa, fino a quando la temperatura del core raggiunge i 90 C. Successivamente, la velocità di clock e l'assorbimento di potenza della scheda diminuiscono gradualmente prima di stabilizzarsi rispettivamente a 2,3 GHz e 50 W, per mantenere una temperatura del core di 86 C. Eseguendo lo stesso test sul modello 2021 si ottengono temperature del core leggermente inferiori e un assorbimento di potenza della scheda di 83 C e 45 W, rispettivamente.
La frequenza di clock della GPU, la temperatura e l'assorbimento di potenza della scheda si stabilizzerebbero rispettivamente a 1627 MHz, 85 C e 64 W Witcher 3 rispetto ai 1837 MHz, 69 C e 63 W dell'Inspiron 16 Plus 7610. Non c'è dubbio che i processori del modello 2022 siano più caldi per fornire prestazioni più elevate.
Il funzionamento a batteria limita le prestazioni anche se impostato in modalità Ultra Performance. Un test 3DMark 11 a batteria restituirebbe punteggi di Fisica e Grafica rispettivamente di 10252 e 8609 punti, rispetto a 22210 e 18923 punti con l'alimentazione di rete.
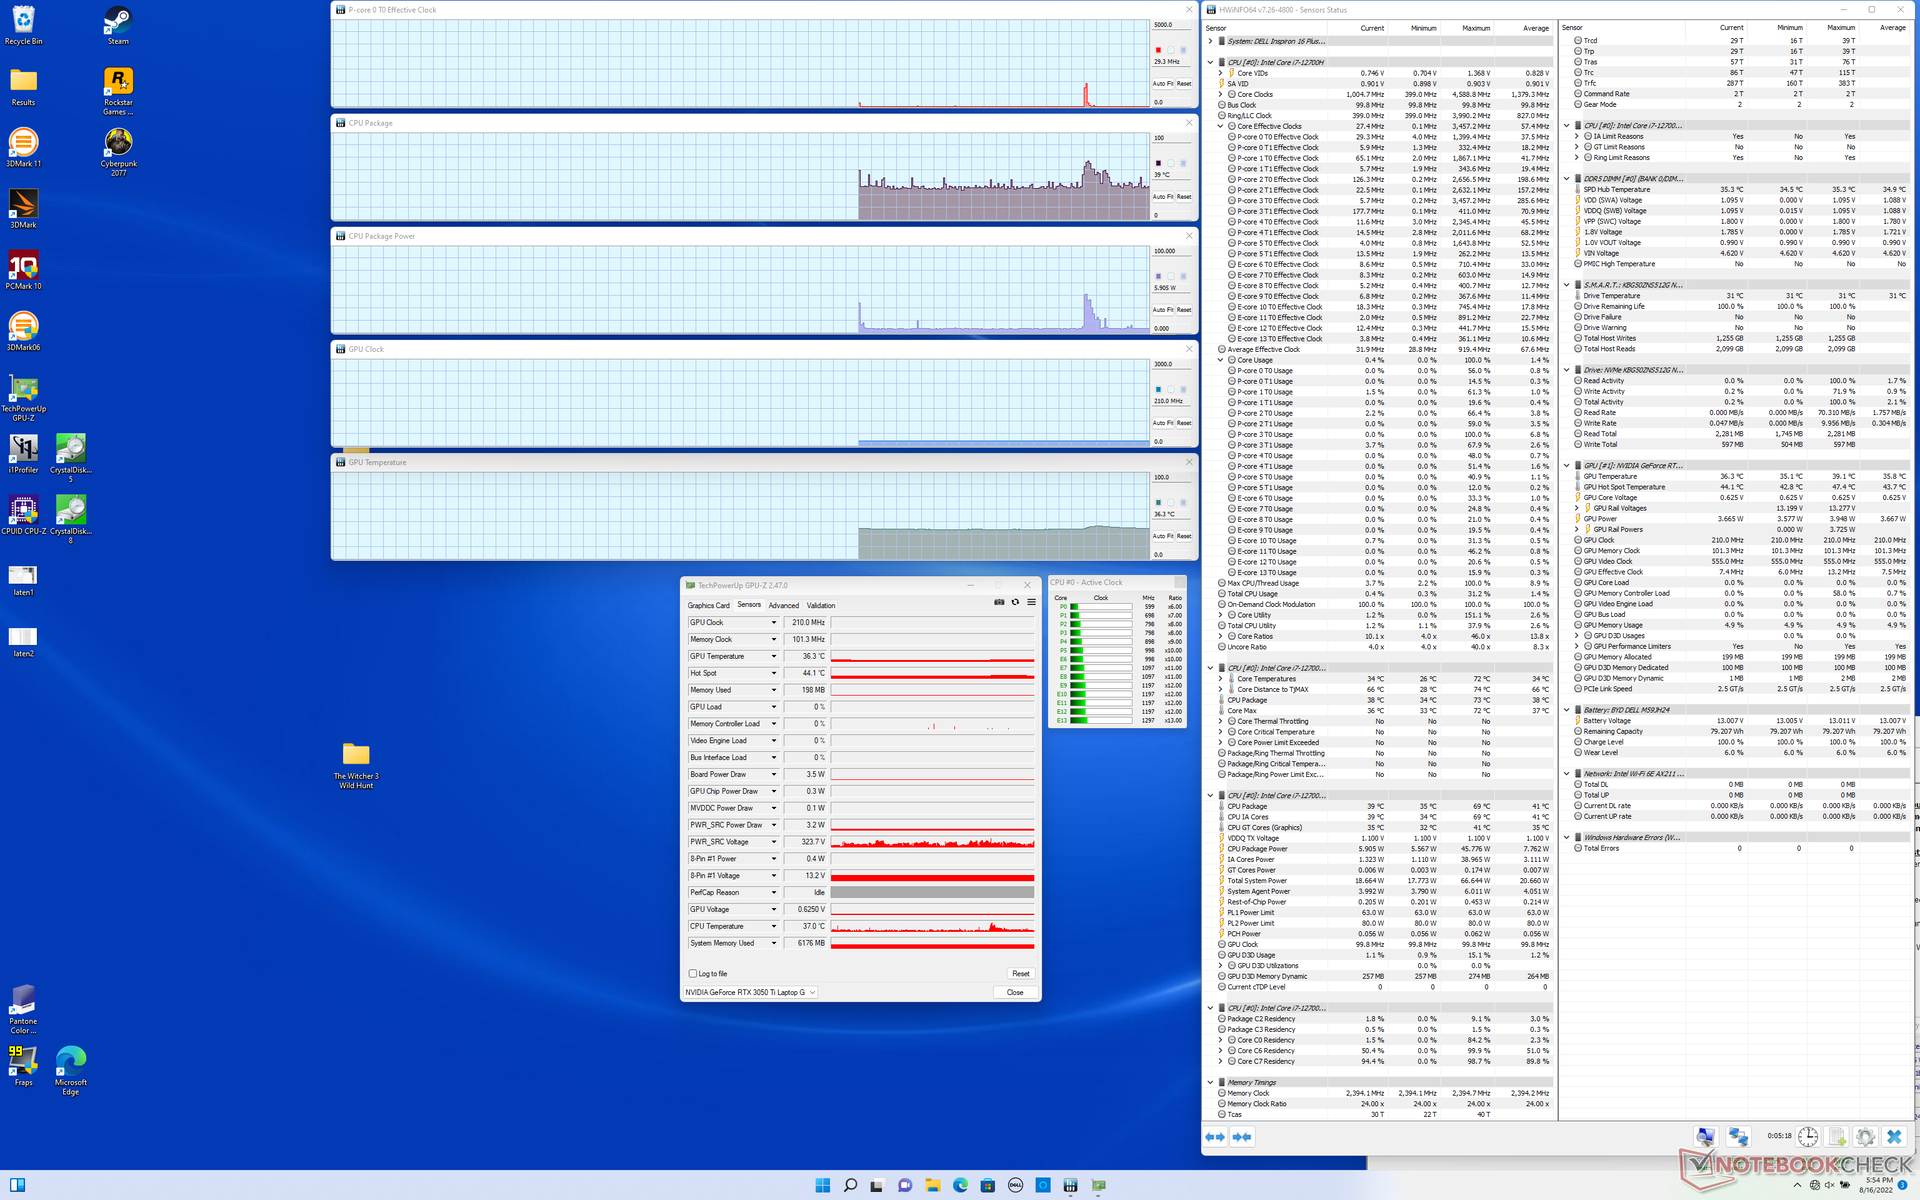
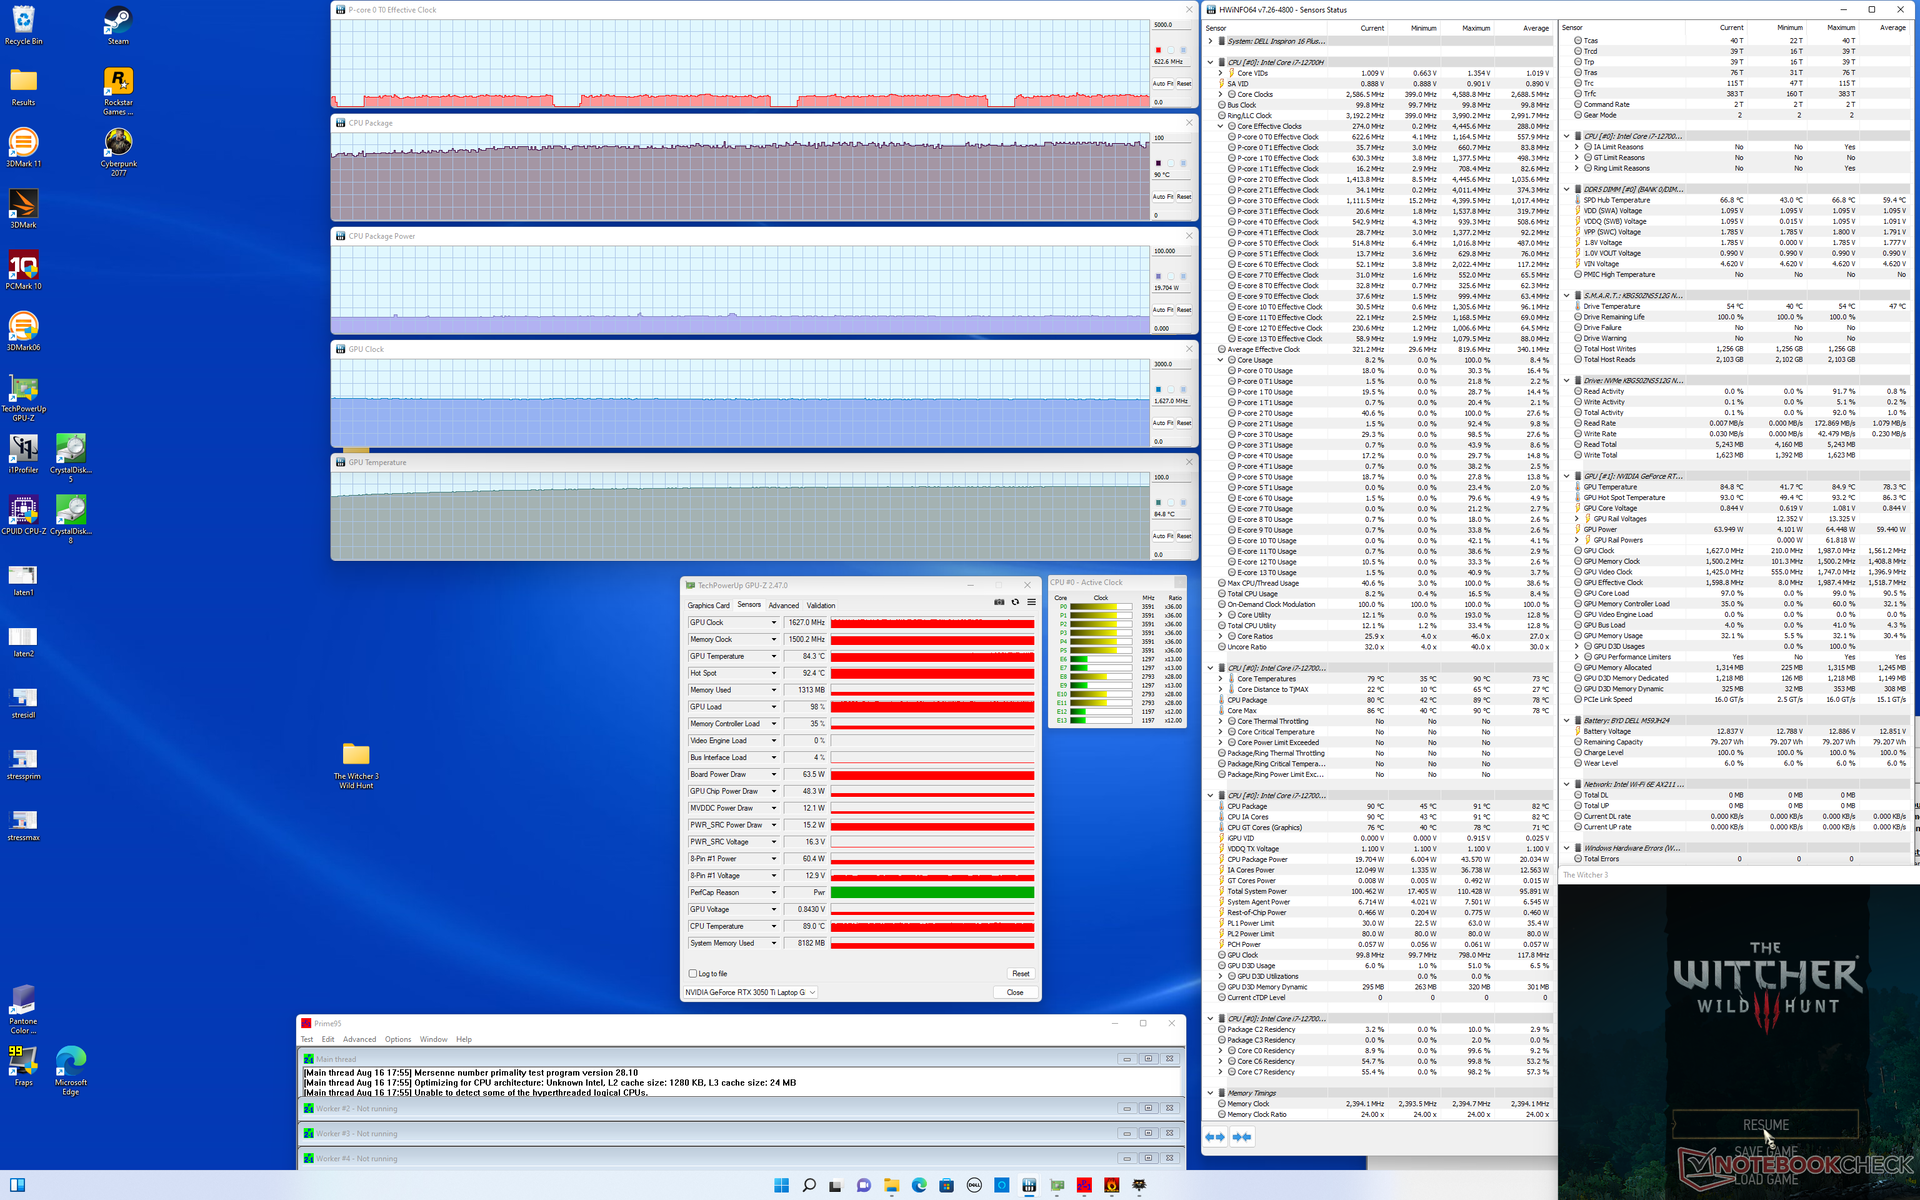
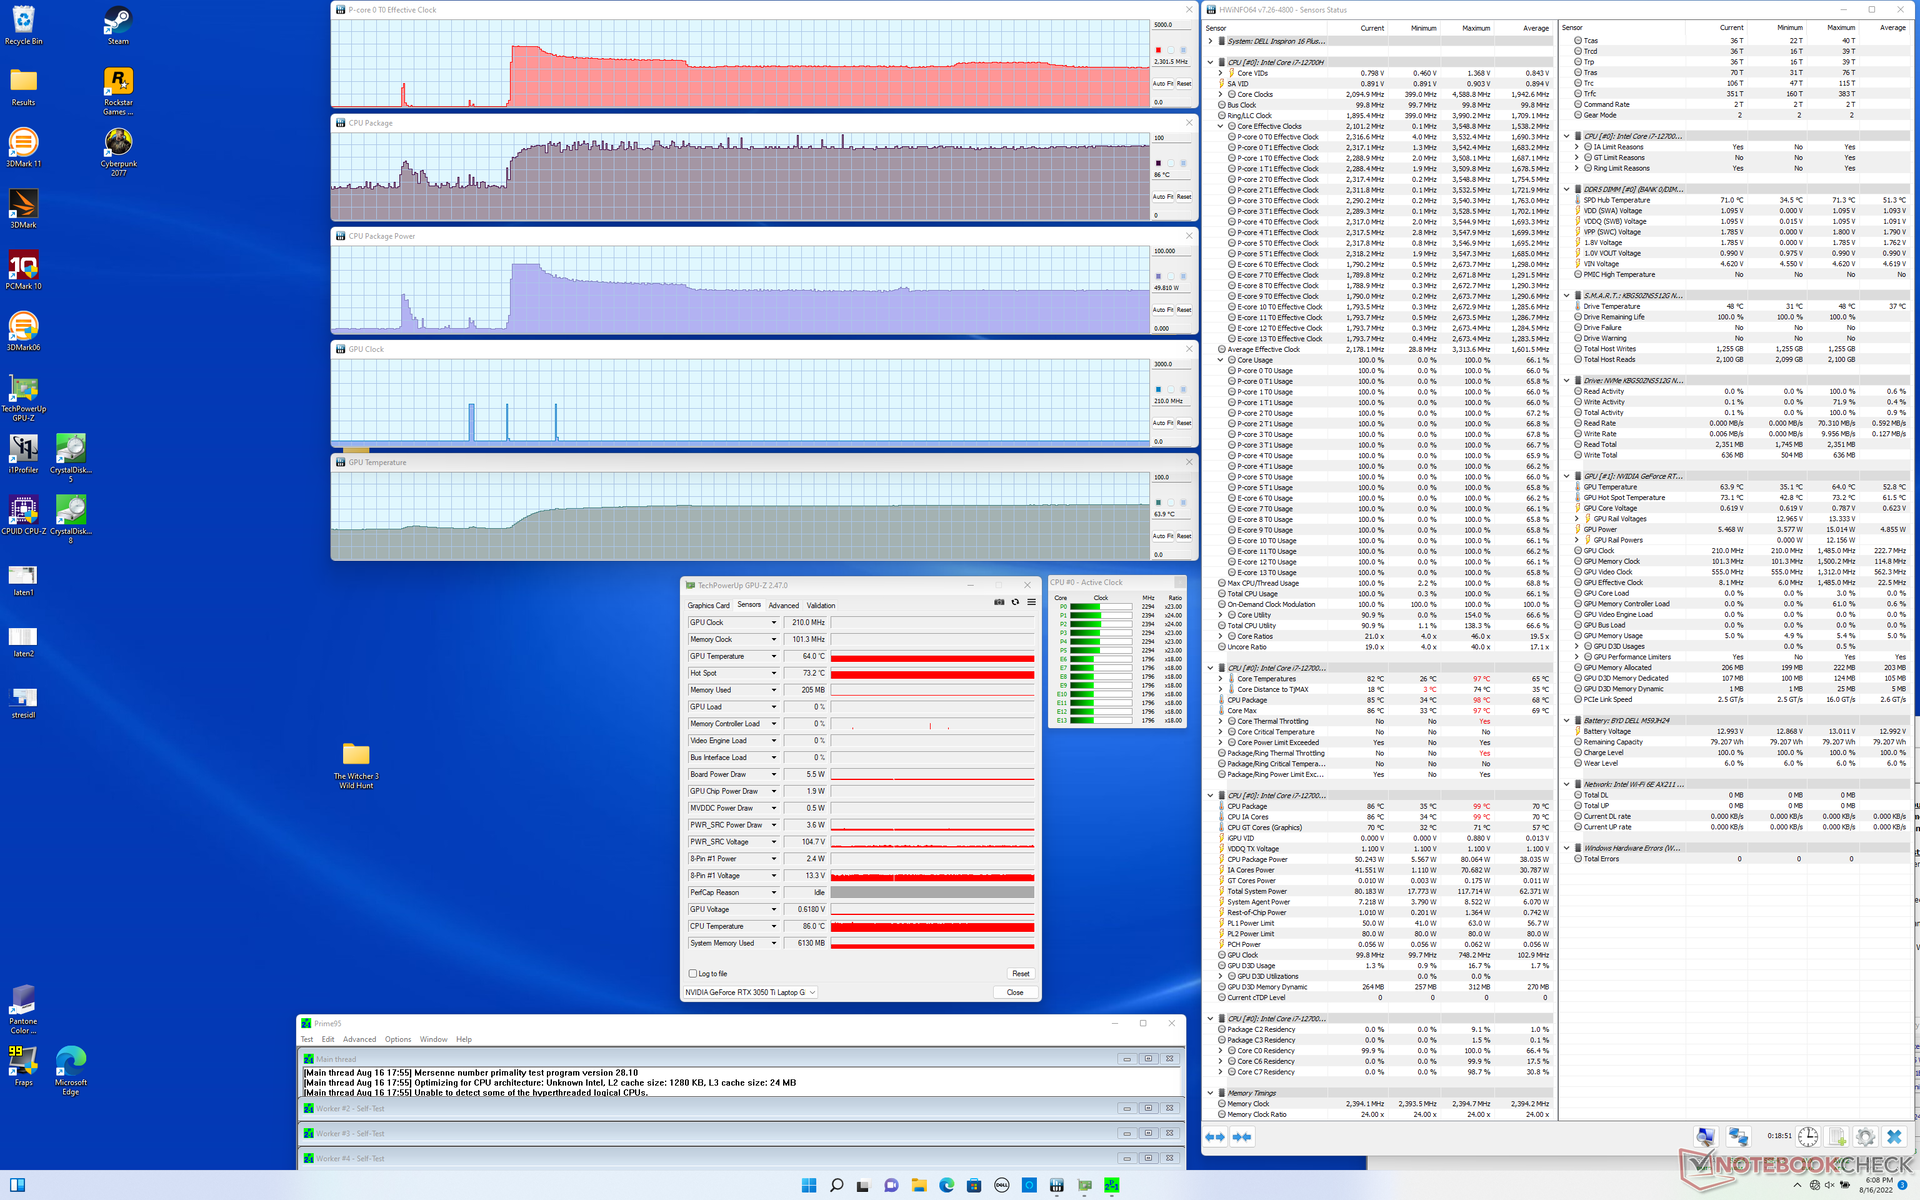
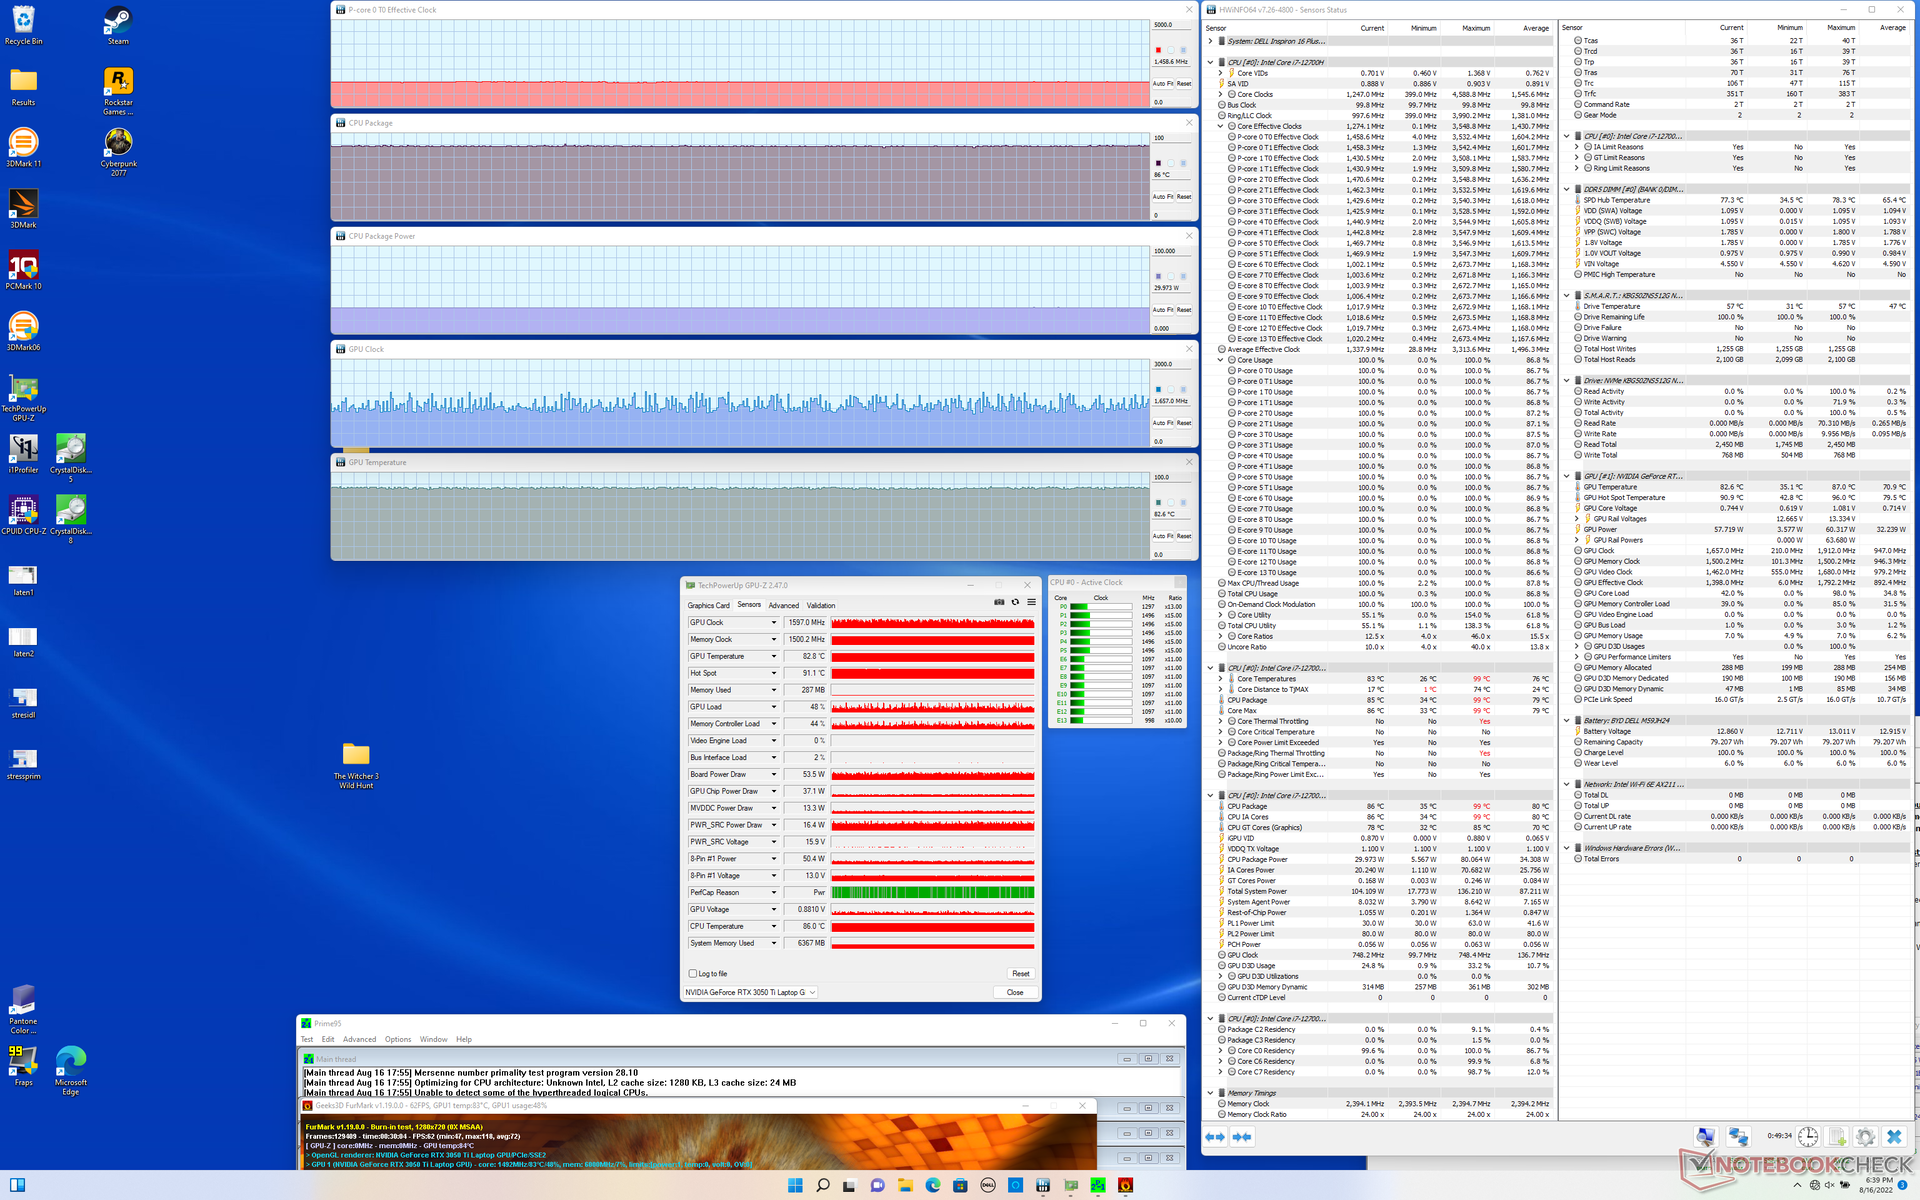
| Clock della CPU (GHz) | Clock della GPU (MHz) | Temperatura media della CPU (°C) | Temperatura media della GPU (°C) | |
| Sistema inattivo | -- | -- | 39 | 36 |
| Stress Prime95 | 2,3 | -- | 86 | 64 |
| Prime95 + FurMark Stress | 1,5 | ~1597 | 86 | 83 |
| Witcher 3 Stress | ~0,6 | 1627 | 90 | 85 |
Altoparlanti
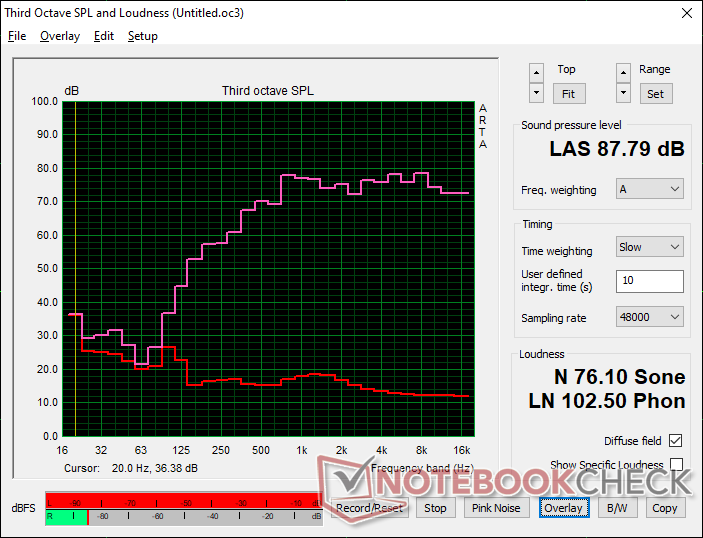
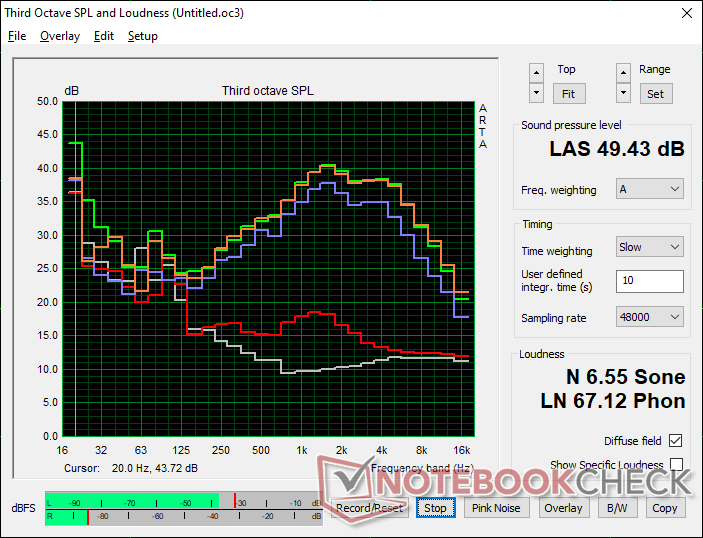
Dell Inspiron 16 Plus 7620 analisi audio
(+) | gli altoparlanti sono relativamente potenti (87.8 dB)
Bassi 100 - 315 Hz
(-) | quasi nessun basso - in media 22.2% inferiori alla media
(±) | la linearità dei bassi è media (9.7% delta rispetto alla precedente frequenza)
Medi 400 - 2000 Hz
(+) | medi bilanciati - solo only 3.3% rispetto alla media
(+) | medi lineari (5.3% delta rispetto alla precedente frequenza)
Alti 2 - 16 kHz
(+) | Alti bilanciati - appena 2.5% dalla media
(+) | alti lineari (4.7% delta rispetto alla precedente frequenza)
Nel complesso 100 - 16.000 Hz
(+) | suono nel complesso lineare (13.4% differenza dalla media)
Rispetto alla stessa classe
» 28% di tutti i dispositivi testati in questa classe è stato migliore, 5% simile, 68% peggiore
» Il migliore ha avuto un delta di 5%, medio di 17%, peggiore di 45%
Rispetto a tutti i dispositivi testati
» 14% di tutti i dispositivi testati in questa classe è stato migliore, 4% similare, 83% peggiore
» Il migliore ha avuto un delta di 4%, medio di 24%, peggiore di 134%
Apple MacBook Pro 16 2021 M1 Pro analisi audio
(+) | gli altoparlanti sono relativamente potenti (84.7 dB)
Bassi 100 - 315 Hz
(+) | bassi buoni - solo 3.8% dalla media
(+) | bassi in lineaa (5.2% delta rispetto alla precedente frequenza)
Medi 400 - 2000 Hz
(+) | medi bilanciati - solo only 1.3% rispetto alla media
(+) | medi lineari (2.1% delta rispetto alla precedente frequenza)
Alti 2 - 16 kHz
(+) | Alti bilanciati - appena 1.9% dalla media
(+) | alti lineari (2.7% delta rispetto alla precedente frequenza)
Nel complesso 100 - 16.000 Hz
(+) | suono nel complesso lineare (4.6% differenza dalla media)
Rispetto alla stessa classe
» 0% di tutti i dispositivi testati in questa classe è stato migliore, 0% simile, 100% peggiore
» Il migliore ha avuto un delta di 5%, medio di 17%, peggiore di 45%
Rispetto a tutti i dispositivi testati
» 0% di tutti i dispositivi testati in questa classe è stato migliore, 0% similare, 100% peggiore
» Il migliore ha avuto un delta di 4%, medio di 24%, peggiore di 134%
Gestione dell'energia - CPU affamate di energia
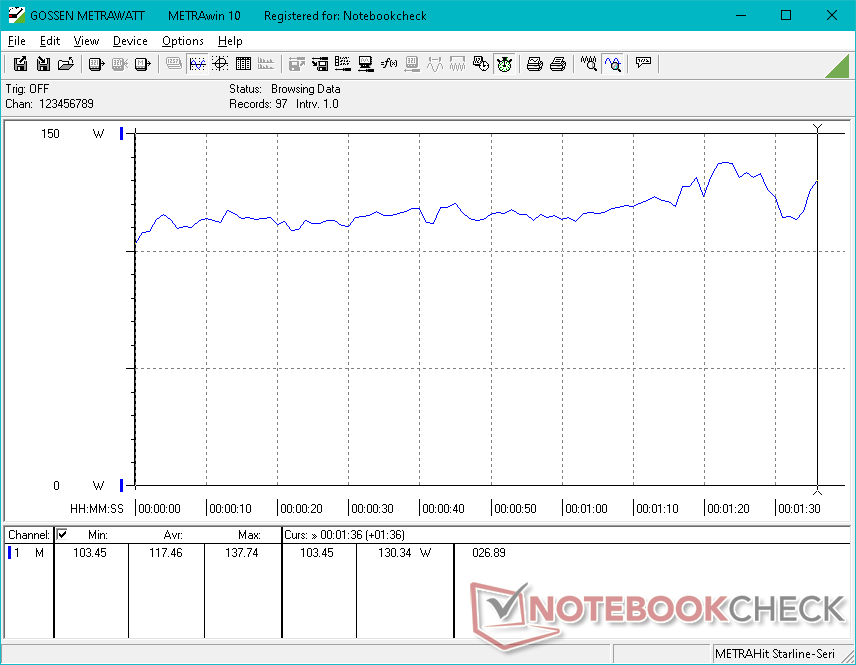
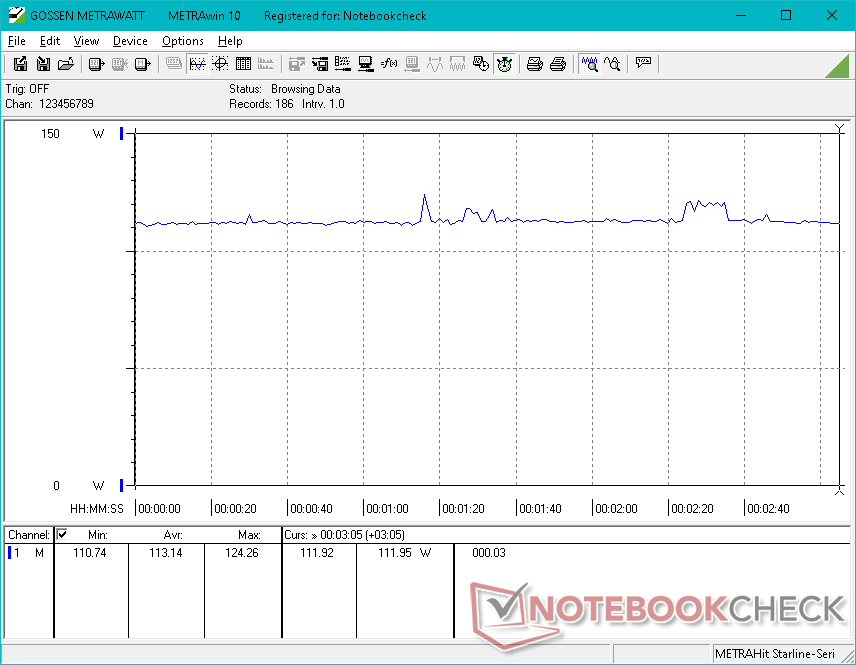
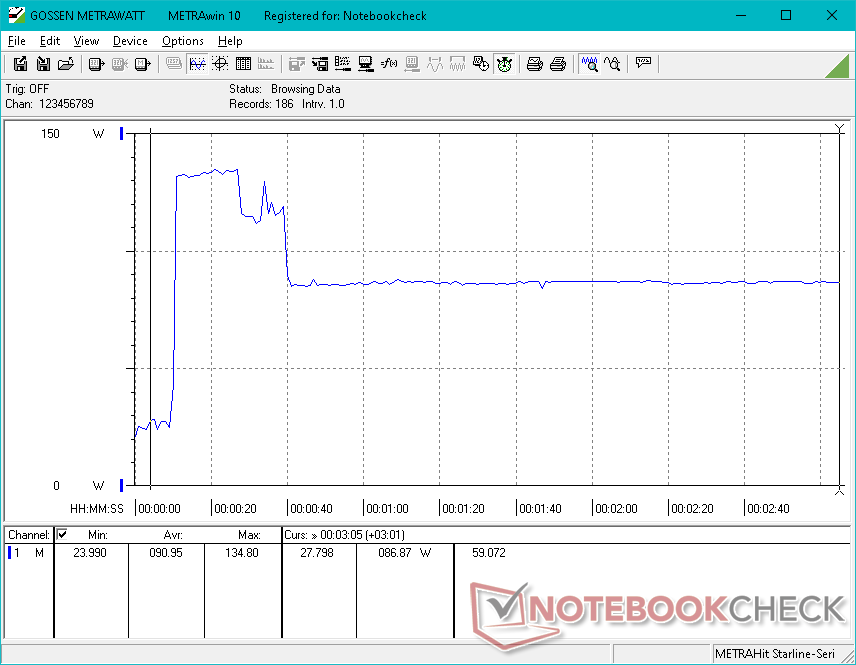
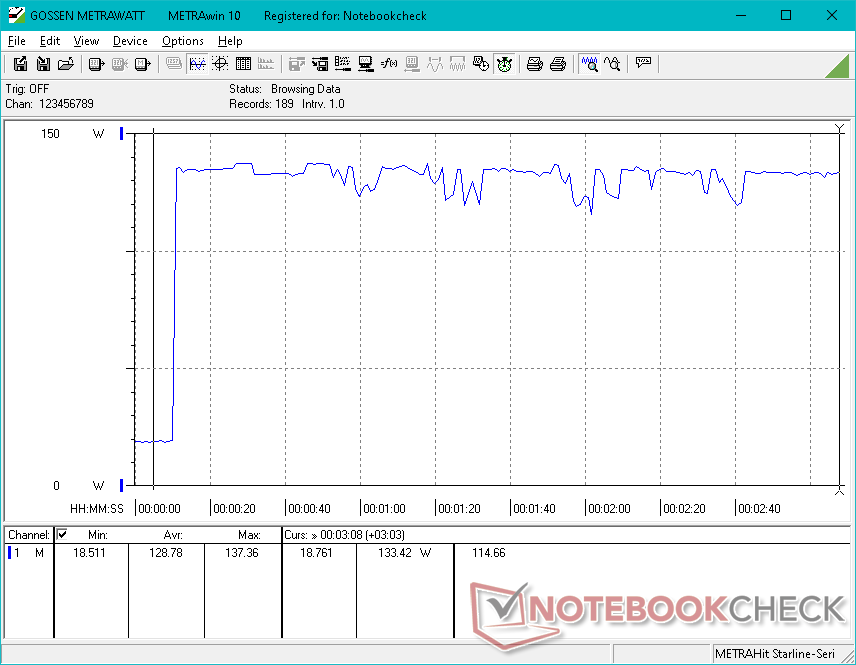
Consumo di energia
Il consumo di energia è simile a quello del modello 2021 quando è al minimo sul desktop o quando si eseguono carichi molto bassi. Quando si eseguono carichi più elevati, tuttavia, il modello 2022 diventa più esigente, soprattutto se tali carichi sono intensivi per la CPU. In esecuzione Witcher 3, ad esempio, assorbe solo il 5% di energia in più, mentre Prime95 ne consuma ben il 72% in più. Il consumo significativamente più elevato è in linea con la maggior parte degli altri portatili che abbiamo testato finora, dotati di CPU Alder Lake di 12a generazione
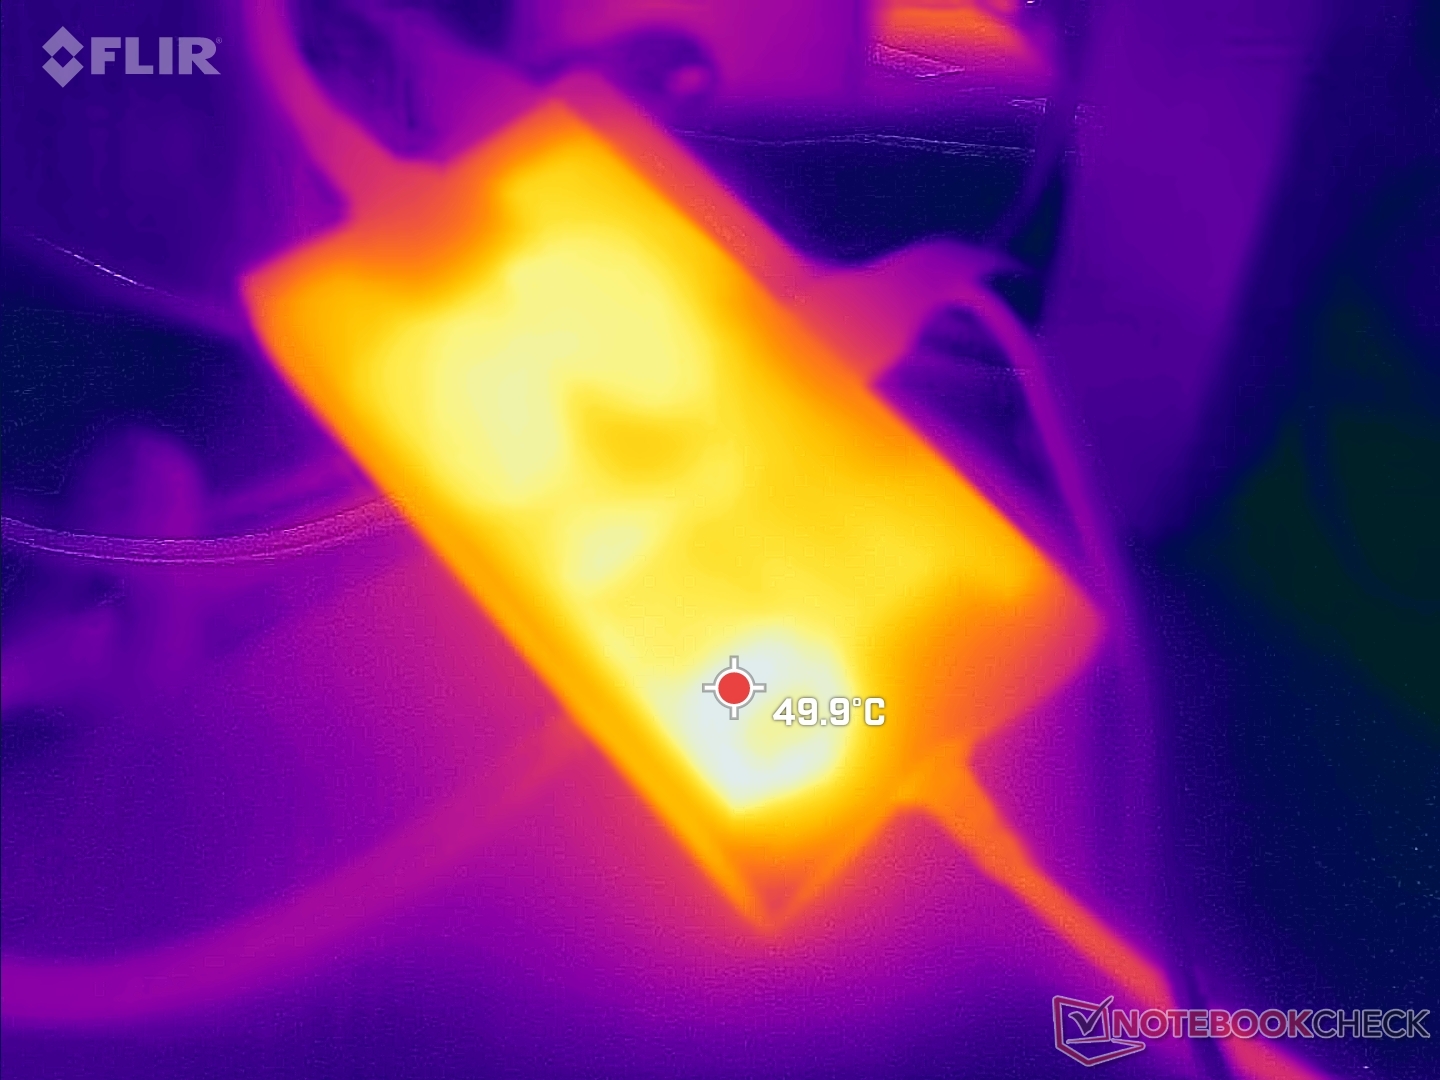
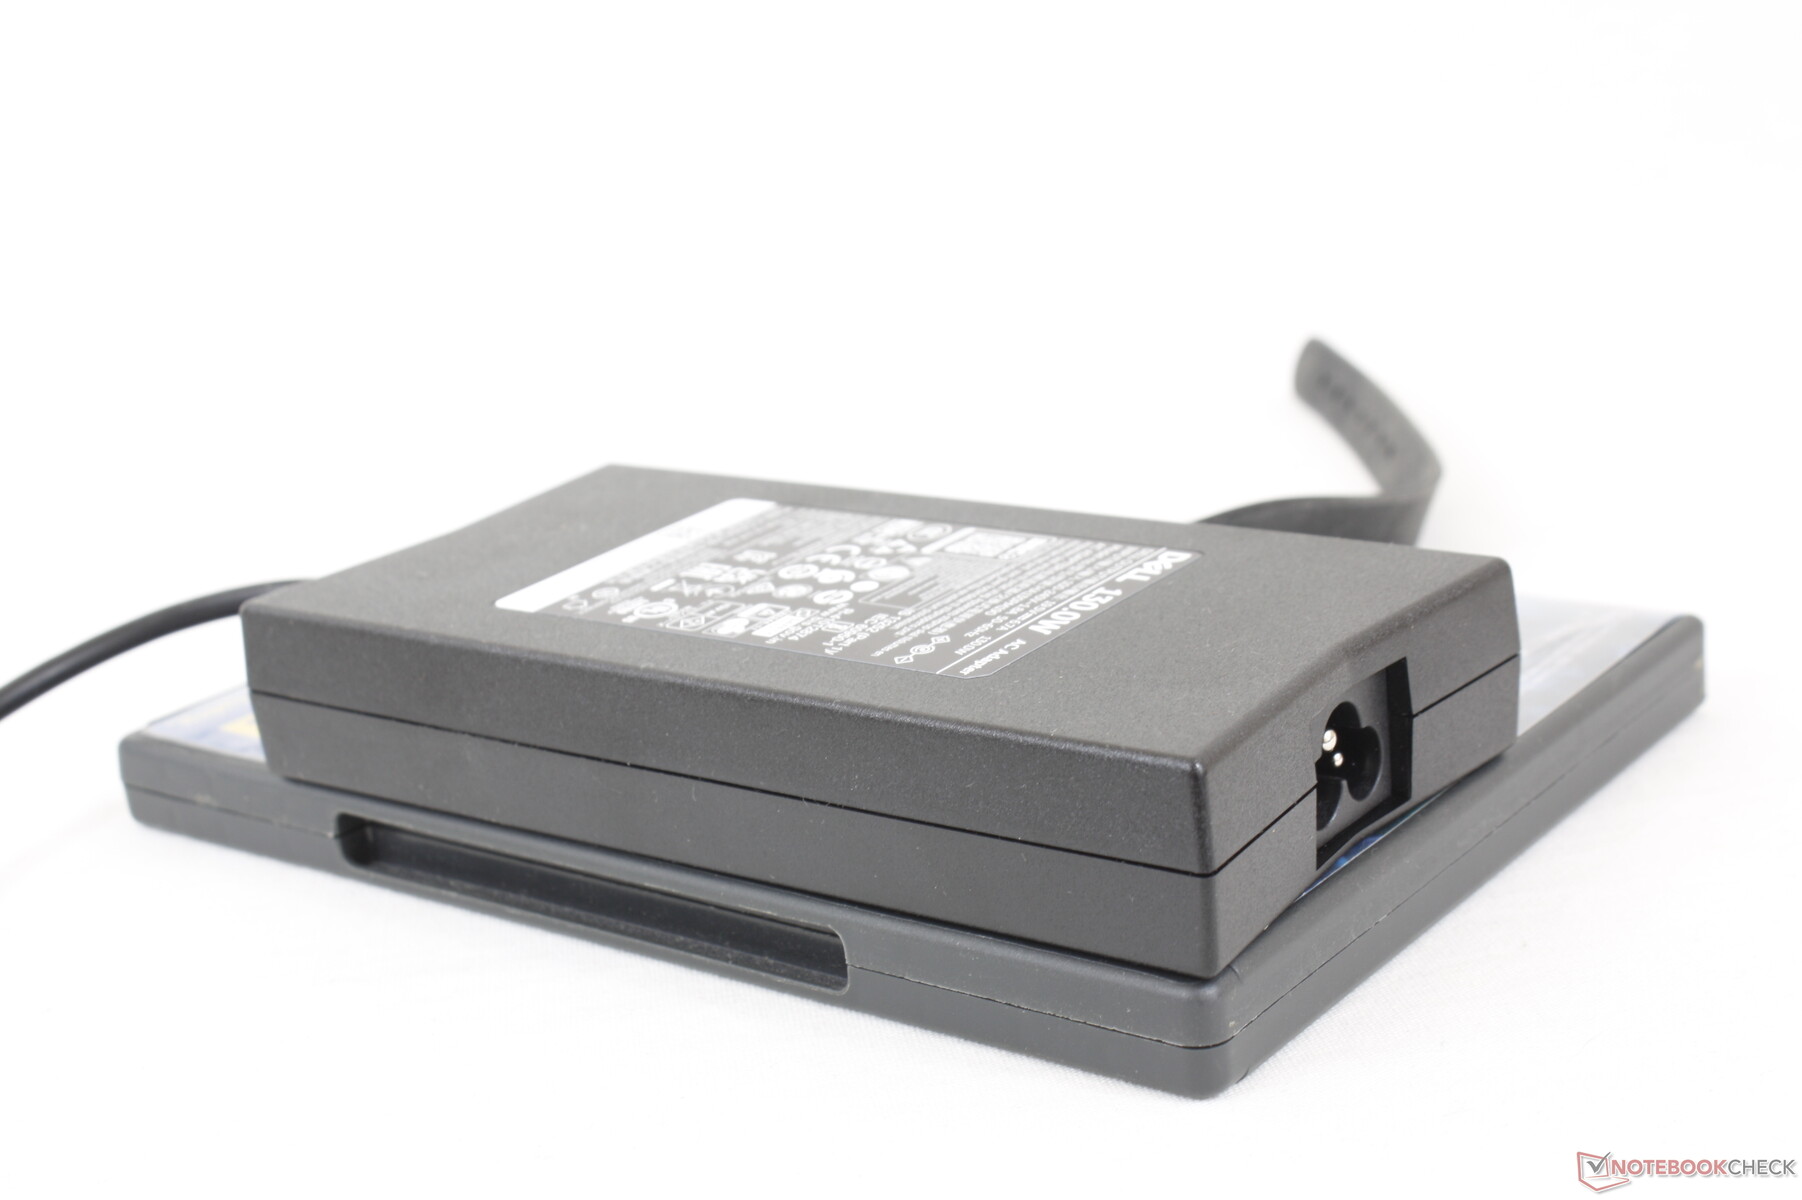
Abbiamo registrato un consumo massimo di 137 W dall'adattatore CA da 130 W di medie dimensioni (~15,3 x 7,5 x 2,6 cm). Dell non ha apportato alcuna modifica all'adattatore CA o alla sua capacità nominale, nonostante la CPU più assetata di energia.
| Off / Standby | |
| Idle | |
| Sotto carico |
|
Leggenda:
min: | |
| Dell Inspiron 16 Plus 7620 i7-12700H, GeForce RTX 3050 Ti Laptop GPU, Kioxia BG5 KBG50ZNS512G, IPS, 3072x1920, 16" | Dell Inspiron 16 Plus 7610 i7-11800H, GeForce RTX 3050 4GB Laptop GPU, Kingston OM3PDP3512B, IPS, 3072x1920, 16" | Lenovo Yoga 7 16IAP7 i7-1260P, Iris Xe G7 96EUs, Micron 2450 512GB MTFDKCD512TFK, IPS, 2560x1600, 16" | Huawei MateBook D 16 2022 i7-12700H, Iris Xe G7 96EUs, Silicon Motion PCIe-8 SSD, IPS, 1920x1200, 16" | Acer Swift X SFX16-51G-5388 i5-11320H, GeForce RTX 3050 4GB Laptop GPU, Samsung PM991 MZVLQ512HBLU, , 1920x1080, 16.1" | Asus Vivobook Pro 16X-M7600QE R9 5900HX, GeForce RTX 3050 Ti Laptop GPU, SK Hynix HFM001TD3JX013N, OLED, 3840x2400, 16.1" | |
|---|---|---|---|---|---|---|
| Power Consumption | 1% | 35% | 29% | 21% | 1% | |
| Idle Minimum * (Watt) | 6.8 | 7.7 -13% | 6.6 3% | 6.1 10% | 7 -3% | 8.2 -21% |
| Idle Average * (Watt) | 9.6 | 10.7 -11% | 8.3 14% | 10.6 -10% | 10.1 -5% | 16.2 -69% |
| Idle Maximum * (Watt) | 17 | 16.8 1% | 9.8 42% | 11.5 32% | 15 12% | 19.7 -16% |
| Load Average * (Watt) | 117.5 | 100.39 15% | 66 44% | 65.5 44% | 63.3 46% | 65.8 44% |
| Witcher 3 ultra * (Watt) | 113.1 | 108 5% | 52 54% | 61.2 46% | 63.3 44% | 65.6 42% |
| Load Maximum * (Watt) | 137.4 | 129 6% | 67.1 51% | 68.4 50% | 94 32% | 104 24% |
* ... Meglio usare valori piccoli
Power Consumption Witcher 3 / Stresstest
Power Consumption external Monitor
Durata della batteria
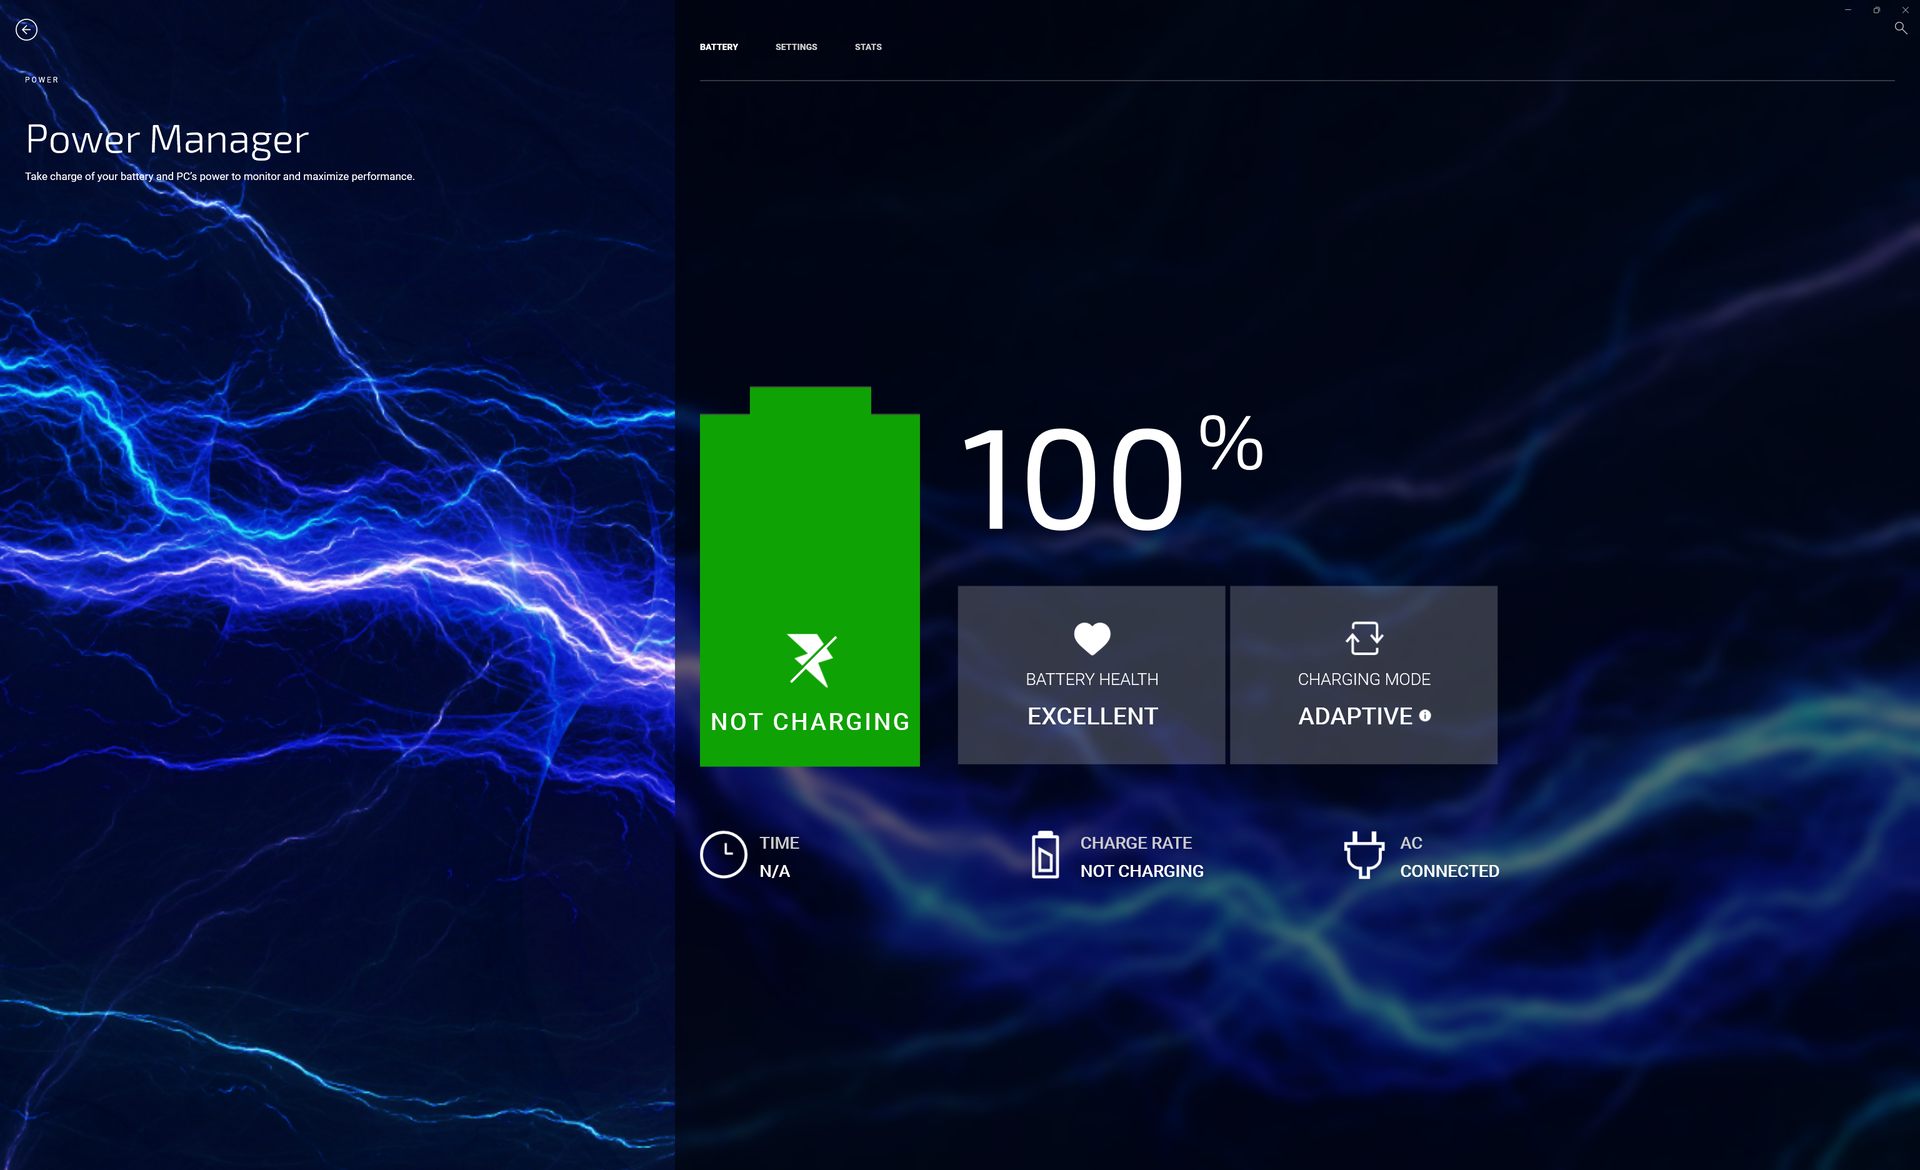
La capacità della batteria non è cambiata rispetto al modello dell'anno scorso e le durate sono simili. Gli utenti possono aspettarsi 9,5 ore di utilizzo reale della WLAN con il profilo energetico Bilanciato. Su alcune SKU è disponibile una batteria più piccola da 56 Wh per un peso complessivo inferiore.
La ricarica da vuoto a pieno richiede circa 2 ore con l'adattatore CA in dotazione. Il sistema può essere ricaricato anche tramite caricatori USB-C di terze parti.
| Dell Inspiron 16 Plus 7620 i7-12700H, GeForce RTX 3050 Ti Laptop GPU, 86 Wh | Dell Inspiron 16 Plus 7610 i7-11800H, GeForce RTX 3050 4GB Laptop GPU, 86 Wh | Lenovo Yoga 7 16IAP7 i7-1260P, Iris Xe G7 96EUs, 71 Wh | Huawei MateBook D 16 2022 i7-12700H, Iris Xe G7 96EUs, 60 Wh | Acer Swift X SFX16-51G-5388 i5-11320H, GeForce RTX 3050 4GB Laptop GPU, 58.7 Wh | Asus Vivobook Pro 16X-M7600QE R9 5900HX, GeForce RTX 3050 Ti Laptop GPU, 96 Wh | |
|---|---|---|---|---|---|---|
| Autonomia della batteria | 63% | 2% | -26% | 5% | 6% | |
| Reader / Idle (h) | 18.6 | 20.5 10% | 12.2 -34% | 20.3 9% | ||
| WiFi v1.3 (h) | 9.6 | 9.9 3% | 7.9 -18% | 7.1 -26% | 8.1 -16% | 11.3 18% |
| Load (h) | 1.2 | 3.3 175% | 1.9 58% | 1.5 25% | 1.1 -8% | |
| H.264 (h) | 8.4 | |||||
| Gaming (h) | 1.1 |
Pro
Contro
Verdetto - Parte multimediale, parte creatore, parte giocatore
Il vantaggio più rilevante dell'Inspiron 16 Plus 7620 rispetto al modello 7610 è la CPU Intel Core-H di 12a generazione, che offre prestazioni multi-thread fino al 50% più veloci. Se i carichi di lavoro possono sfruttare il processore più veloce, allora il 7620 può essere un valido investimento rispetto al suo predecessore.
La maggior parte delle altre modifiche sono un passo indietro per la serie o, al massimo, aggiornamenti relativamente minori. Ad esempio, la webcam da 2 MP a risoluzione più elevata è apprezzabile, ma non è neanche lontanamente paragonabile alle webcam da 5 MP dell'HP Spectre o dell'Envy 16. Anche il design rivisto dello chassis è piacevole, ma non rende il sistema più leggero, più piccolo o più resistente rispetto al vecchio 7610. Alternative come il più leggero Asus VivoBook Pro 16X sono dotati di RTX 3050 Ti e di un pannello OLED, che il nostro Dell ancora non offre. Un pannello di aggiornamento più veloce, come quello a 120 Hz dell'HP Envy 16, sarebbe un'ottima opzione.
L'Inspiron 16 Plus 7620 è molto più veloce del 7610 per quanto riguarda le prestazioni della CPU. Per il resto, quasi tutto il resto è rimasto invariato o addirittura peggiorato, come le temperature più calde e il minor numero di slot di espansione.
Nel frattempo, diversi altri cambiamenti possono essere considerati dei downgrade, come il tastierino numerico omesso, il clickpad più piccolo, il consumo energetico più elevato sotto carico, le temperature più calde e il minor numero di slot per SODIMM e M.2 SSD. Si tratta comunque di un sistema potente, con colori e prestazioni adatte al gioco occasionale e alla creazione di contenuti, ma non è esattamente un fuoriclasse quando mancano alcune caratteristiche.
Prezzo e disponibilità
Amazon attualmente è disponibile una configurazione con Core i7-12700H, 16 GB di RAM, 512 GB di SSD, display 3K e grafica RTX 3050 a 1450 dollari. Consigliamo di ordinare direttamente da Dell per avere più opzioni.
Dell Inspiron 16 Plus 7620
- 08/18/2022 v7 (old)
Allen Ngo
Price comparison

