Asus Zephyrus M15 GU502LU vs. GU502LW: dov'è la differenza?
Punteggio | Data | Modello | Peso | Altezza | Dimensione | Risoluzione | Prezzo |
|---|---|---|---|---|---|---|---|
| 82.1 % v7 (old) | 10/2020 | Asus ROG Zephyrus M15 GU502LU-BI7N4 i7-10750H, GeForce GTX 1660 Ti Mobile | 2 kg | 18.9 mm | 15.60" | 1920x1080 | |
| 82.5 % v7 (old) | 10/2020 | Asus ROG Zephyrus M15 GU502L i7-10750H, GeForce RTX 2070 Max-Q | 2 kg | 18.9 mm | 15.60" | 3840x2160 | |
| 82.1 % v7 (old) | 09/2020 | HP Omen 15-ek0456ng i5-10300H, GeForce GTX 1660 Ti Mobile | 2.1 kg | 32 mm | 15.60" | 1920x1080 | |
| 82.1 % v7 (old) | 10/2020 | Gateway Creator Series 15.6 GWTN156-3BK i5-10300H, GeForce RTX 2060 Mobile | 2 kg | 19.9 mm | 15.60" | 1920x1080 | |
| 83.3 % v7 (old) | 07/2020 | Lenovo Legion 5 15IMH05H i5-10300H, GeForce RTX 2060 Mobile | 2.5 kg | 26.1 mm | 15.60" | 1920x1080 | |
| 83.2 % v7 (old) | 05/2020 | MSI GP65 10SFK-047US i7-10750H, GeForce RTX 2070 Mobile | 2.3 kg | 27.5 mm | 15.60" | 1920x1080 |
| |||||||||||||||||||||||||
Distribuzione della luminosità: 86 %
Al centro con la batteria: 282.5 cd/m²
Contrasto: 831:1 (Nero: 0.34 cd/m²)
ΔE ColorChecker Calman: 4.89 | ∀{0.5-29.43 Ø4.72}
calibrated: 4.75
ΔE Greyscale Calman: 2.2 | ∀{0.09-98 Ø4.97}
58.5% sRGB (Argyll 1.6.3 3D)
37.2% AdobeRGB 1998 (Argyll 1.6.3 3D)
40.65% AdobeRGB 1998 (Argyll 3D)
59.1% sRGB (Argyll 3D)
39.32% Display P3 (Argyll 3D)
Gamma: 2.14
CCT: 6850 K
| Asus ROG Zephyrus M15 GU502LU-BI7N4 Panda LM156LF-2F01, IPS, 15.6", 1920x1080 | Asus ROG Zephyrus M15 GU502L AU Optronics B156ZAN03.1, IPS, 15.6", 3840x2160 | HP Omen 15-ek0456ng LGD05FE, IPS, 15.6", 1920x1080 | Gateway Creator Series 15.6 GWTN156-3BK BOE NV156FHM-NX1, IPS, 15.6", 1920x1080 | Lenovo Legion 5 15IMH05H BOE CQ NV156FHM-NX1, IPS, 15.6", 1920x1080 | MSI GP65 10SFK-047US LG Philips LP156WFG-SPB3, IPS, 15.6", 1920x1080 | |
|---|---|---|---|---|---|---|
| Display | 73% | 0% | -1% | 60% | ||
| Display P3 Coverage (%) | 39.32 | 69.4 77% | 39.86 1% | 38.8 -1% | 63.5 61% | |
| sRGB Coverage (%) | 59.1 | 99 68% | 58.4 -1% | 57.8 -2% | 94.4 60% | |
| AdobeRGB 1998 Coverage (%) | 40.65 | 70.5 73% | 41.18 1% | 40.09 -1% | 65.1 60% | |
| Response Times | -66% | 46% | -15% | 17% | 57% | |
| Response Time Grey 50% / Grey 80% * (ms) | 26 ? | 60 ? -131% | 17 ? 35% | 38.4 ? -48% | 26 ? -0% | 10.4 ? 60% |
| Response Time Black / White * (ms) | 25.6 ? | 25.6 ? -0% | 11 ? 57% | 20.8 ? 19% | 17 ? 34% | 12 ? 53% |
| PWM Frequency (Hz) | ||||||
| Screen | 59% | 30% | -16% | 4% | 21% | |
| Brightness middle (cd/m²) | 282.5 | 387 37% | 314 11% | 296.3 5% | 301 7% | 384.9 36% |
| Brightness (cd/m²) | 260 | 377 45% | 293 13% | 284 9% | 277 7% | 358 38% |
| Brightness Distribution (%) | 86 | 90 5% | 87 1% | 84 -2% | 77 -10% | 87 1% |
| Black Level * (cd/m²) | 0.34 | 0.23 32% | 0.22 35% | 0.38 -12% | 0.26 24% | 0.67 -97% |
| Contrast (:1) | 831 | 1683 103% | 1427 72% | 780 -6% | 1158 39% | 574 -31% |
| Colorchecker dE 2000 * | 4.89 | 1.8 63% | 2.51 49% | 6.56 -34% | 5.12 -5% | 2.43 50% |
| Colorchecker dE 2000 max. * | 17.46 | 3.94 77% | 4.42 75% | 21.81 -25% | 8.86 49% | 4.58 74% |
| Colorchecker dE 2000 calibrated * | 4.75 | 0.7 85% | 1.71 64% | 5.34 -12% | 4.88 -3% | 2.03 57% |
| Greyscale dE 2000 * | 2.2 | 2.9 -32% | 3.26 -48% | 4.4 -100% | 3.47 -58% | 2.6 -18% |
| Gamma | 2.14 103% | 2.178 101% | 2.42 91% | 2.22 99% | 2.37 93% | 2.2 100% |
| CCT | 6850 95% | 6992 93% | 6150 106% | 6716 97% | 7062 92% | 6981 93% |
| Color Space (Percent of AdobeRGB 1998) (%) | 37.2 | 99 166% | 37.3 0% | 37 -1% | 59.7 60% | |
| Color Space (Percent of sRGB) (%) | 58.5 | 99 69% | 57.6 -2% | 57 -3% | 93.9 61% | |
| Media totale (Programma / Settaggio) | 22% /
46% | 38% /
33% | -10% /
-13% | 7% /
5% | 46% /
33% |
* ... Meglio usare valori piccoli
Tempi di risposta del Display
| ↔ Tempi di risposta dal Nero al Bianco | ||
|---|---|---|
| 25.6 ms ... aumenta ↗ e diminuisce ↘ combinato | ↗ 14.8 ms Incremento | 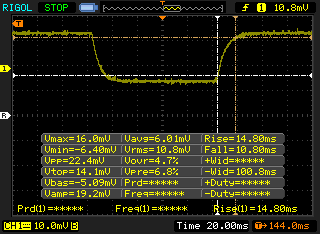 |
| ↘ 10.8 ms Calo | ||
| Lo schermo mostra tempi di risposta relativamente lenti nei nostri tests e potrebbe essere troppo lento per i gamers. In confronto, tutti i dispositivi di test variano da 0.1 (minimo) a 240 (massimo) ms. » 61 % di tutti i dispositivi è migliore. Questo significa che i tempi di risposta rilevati sono peggiori rispetto alla media di tutti i dispositivi testati (19.8 ms). | ||
| ↔ Tempo di risposta dal 50% Grigio all'80% Grigio | ||
| 26 ms ... aumenta ↗ e diminuisce ↘ combinato | ↗ 11.2 ms Incremento | 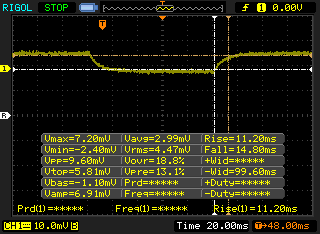 |
| ↘ 14.8 ms Calo | ||
| Lo schermo mostra tempi di risposta relativamente lenti nei nostri tests e potrebbe essere troppo lento per i gamers. In confronto, tutti i dispositivi di test variano da 0.165 (minimo) a 636 (massimo) ms. » 36 % di tutti i dispositivi è migliore. Questo significa che i tempi di risposta rilevati sono migliori rispettto alla media di tutti i dispositivi testati (31 ms). | ||
Sfarfallio dello schermo / PWM (Pulse-Width Modulation)
| flickering dello schermo / PWM non rilevato | 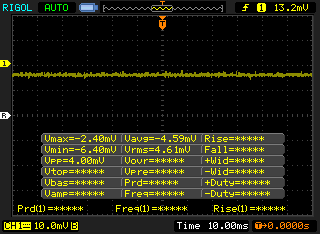 | ||
In confronto: 52 % di tutti i dispositivi testati non utilizza PWM per ridurre la luminosita' del display. Se è rilevato PWM, una media di 7781 (minimo: 5 - massimo: 343500) Hz è stata rilevata. | |||
Cinebench R15: CPU Multi 64Bit | CPU Single 64Bit
Blender: v2.79 BMW27 CPU
7-Zip 18.03: 7z b 4 -mmt1 | 7z b 4
Geekbench 5.5: Single-Core | Multi-Core
HWBOT x265 Benchmark v2.2: 4k Preset
LibreOffice : 20 Documents To PDF
R Benchmark 2.5: Overall mean
| HWBOT x265 Benchmark v2.2 / 4k Preset | |
| MSI GT76 Titan DT 10SGS | |
| Asus Zephyrus S15 GX502L | |
| Asus ROG Strix Scar 15 G532LWS | |
| Eurocom Nightsky RX15 | |
| Asus ROG Zephyrus G15 GA502IU-ES76 | |
| MSI Bravo 15 A4DCR | |
| Asus ROG Zephyrus M15 GU502LU-BI7N4 | |
| HP Pavilion Gaming 15-ec1206ng | |
| Media Intel Core i7-10750H (5.54 - 11.6, n=43) | |
| Schenker XMG Pro 15 | |
| LibreOffice / 20 Documents To PDF | |
| MSI Bravo 15 A4DCR | |
| HP Pavilion Gaming 15-ec1206ng | |
| Asus ROG Zephyrus G15 GA502IU-ES76 | |
| Media Intel Core i7-10750H (43.1 - 99.2, n=43) | |
| Asus ROG Strix Scar 15 G532LWS | |
| Asus ROG Zephyrus M15 GU502LU-BI7N4 | |
| Asus Zephyrus S15 GX502L | |
| MSI GT76 Titan DT 10SGS | |
| R Benchmark 2.5 / Overall mean | |
| Schenker XMG Pro 15 | |
| Asus ROG Zephyrus M15 GU502LU-BI7N4 | |
| Media Intel Core i7-10750H (0.578 - 0.708, n=42) | |
| HP Pavilion Gaming 15-ec1206ng | |
| MSI Bravo 15 A4DCR | |
| Asus Zephyrus S15 GX502L | |
| Asus ROG Zephyrus G15 GA502IU-ES76 | |
| MSI GT76 Titan DT 10SGS | |
| Asus ROG Strix Scar 15 G532LWS | |
* ... Meglio usare valori piccoli
| PCMark 8 Home Score Accelerated v2 | 4463 punti | |
| PCMark 8 Work Score Accelerated v2 | 5764 punti | |
| PCMark 10 Score | 5241 punti | |
Aiuto | ||
| DPC Latencies / LatencyMon - interrupt to process latency (max), Web, Youtube, Prime95 | |
| HP Omen 15-ek0456ng | |
| Asus ROG Zephyrus M15 GU502LU-BI7N4 | |
| Gateway Creator Series 15.6 GWTN156-3BK | |
| Asus ROG Zephyrus M15 GU502L | |
| MSI GP65 10SFK-047US | |
| Lenovo Legion 5 15IMH05H | |
* ... Meglio usare valori piccoli
| Asus ROG Zephyrus M15 GU502LU-BI7N4 Intel SSD 660p SSDPEKNW512G8 | Asus ROG Zephyrus M15 GU502L 2x Intel SSD 660p SSDPEKNW512G8 (RAID 0) | HP Omen 15-ek0456ng Toshiba XG6 KXG60ZNV512G | Gateway Creator Series 15.6 GWTN156-3BK Phison PS5013 PM8256GPTCB4B8TF | Lenovo Legion 5 15IMH05H Samsung PM991 MZALQ512HALU | MSI GP65 10SFK-047US Samsung SSD PM981 MZVLB1T0HALR | |
|---|---|---|---|---|---|---|
| AS SSD | 53% | 109% | 11% | 37% | 148% | |
| Seq Read (MB/s) | 1198 | 2523 111% | 2053 71% | 1592 33% | 2012 68% | 2066 72% |
| Seq Write (MB/s) | 676 | 1578 133% | 2562 279% | 1057 56% | 1261 87% | 2418 258% |
| 4K Read (MB/s) | 48.09 | 50.4 5% | 42.46 -12% | 34.12 -29% | 43.66 -9% | 54.2 13% |
| 4K Write (MB/s) | 112.7 | 115.6 3% | 97.2 -14% | 120.4 7% | 109.3 -3% | 129 14% |
| 4K-64 Read (MB/s) | 323.1 | 634 96% | 1414 338% | 410.1 27% | 851 163% | 1865 477% |
| 4K-64 Write (MB/s) | 790 | 1114 41% | 1471 86% | 634 -20% | 780 -1% | 1878 138% |
| Access Time Read * (ms) | 0.067 | 0.095 -42% | 0.079 -18% | 0.072 -7% | 0.117 -75% | 0.042 37% |
| Access Time Write * (ms) | 0.14 | 0.038 73% | 0.039 72% | 0.105 25% | 0.036 74% | 0.091 35% |
| Score Read (Points) | 491 | 936 91% | 1662 238% | 613 25% | 1096 123% | 2126 333% |
| Score Write (Points) | 970 | 1388 43% | 1825 88% | 860 -11% | 1016 5% | 2249 132% |
| Score Total (Points) | 1704 | 2770 63% | 4364 156% | 1771 4% | 2643 55% | 5482 222% |
| Copy ISO MB/s (MB/s) | 898 | 2106 135% | 1913 113% | 1255 40% | 1481 65% | 2927 226% |
| Copy Program MB/s (MB/s) | 523 | 549 5% | 833 59% | 508 -3% | 467.5 -11% | 728 39% |
| Copy Game MB/s (MB/s) | 948 | 854 -10% | 1667 76% | 986 4% | 734 -23% | 1614 70% |
| CrystalDiskMark 5.2 / 6 | 43% | 46% | 21% | 17% | 63% | |
| Write 4K (MB/s) | 126.2 | 123 -3% | 120 -5% | 170.2 35% | 145.4 15% | 145 15% |
| Read 4K (MB/s) | 52.9 | 52.5 -1% | 36.09 -32% | 52.5 -1% | 51.6 -2% | 46.84 -11% |
| Write Seq (MB/s) | 934 | 1698 82% | 1778 90% | 1105 18% | 1007 8% | 2377 154% |
| Read Seq (MB/s) | 1524 | 2440 60% | 1362 -11% | 1507 -1% | 1145 -25% | 2185 43% |
| Write 4K Q32T1 (MB/s) | 423.4 | 450.4 6% | 429.1 1% | 380.8 -10% | 468.4 11% | 463.5 9% |
| Read 4K Q32T1 (MB/s) | 338.3 | 550 63% | 493.2 46% | 531 57% | 528 56% | 527 56% |
| Write Seq Q32T1 (MB/s) | 960 | 1794 87% | 2936 206% | 1253 31% | 1381 44% | 2395 149% |
| Read Seq Q32T1 (MB/s) | 1832 | 2812 53% | 3227 76% | 2543 39% | 2291 25% | 3470 89% |
| Write 4K Q8T8 (MB/s) | 1536 | |||||
| Read 4K Q8T8 (MB/s) | 1490 | |||||
| Media totale (Programma / Settaggio) | 48% /
50% | 78% /
87% | 16% /
15% | 27% /
30% | 106% /
117% |
* ... Meglio usare valori piccoli

Throttling Disco: DiskSpd Read Loop, Queue Depth 8
| 3DMark 11 Performance | 19342 punti | |
| 3DMark Cloud Gate Standard Score | 38136 punti | |
| 3DMark Fire Strike Score | 14649 punti | |
| 3DMark Time Spy Score | 6261 punti | |
Aiuto | ||
| basso | medio | alto | ultra | |
|---|---|---|---|---|
| GTA V (2015) | 178 | 171 | 140 | 76 |
| The Witcher 3 (2015) | 288.3 | 193.2 | 117.6 | 65.1 |
| Dota 2 Reborn (2015) | 150 | 135 | 124 | 118 |
| Final Fantasy XV Benchmark (2018) | 137 | 87.6 | 63.9 | |
| X-Plane 11.11 (2018) | 101 | 89 | 75.2 | |
| Strange Brigade (2018) | 311 | 150 | 122 | 104 |
| Asus ROG Zephyrus M15 GU502LU-BI7N4 GeForce GTX 1660 Ti Mobile, i7-10750H, Intel SSD 660p SSDPEKNW512G8 | Asus ROG Zephyrus M15 GU502L GeForce RTX 2070 Max-Q, i7-10750H, 2x Intel SSD 660p SSDPEKNW512G8 (RAID 0) | HP Omen 15-ek0456ng GeForce GTX 1660 Ti Mobile, i5-10300H, Toshiba XG6 KXG60ZNV512G | Gateway Creator Series 15.6 GWTN156-3BK GeForce RTX 2060 Mobile, i5-10300H, Phison PS5013 PM8256GPTCB4B8TF | Lenovo Legion 5 15IMH05H GeForce RTX 2060 Mobile, i5-10300H, Samsung PM991 MZALQ512HALU | MSI GP65 10SFK-047US GeForce RTX 2070 Mobile, i7-10750H, Samsung SSD PM981 MZVLB1T0HALR | |
|---|---|---|---|---|---|---|
| Noise | -7% | 3% | -2% | 3% | -6% | |
| off /ambiente * (dB) | 25.8 | 25 3% | 27 -5% | 26.5 -3% | 30.7 -19% | 29.3 -14% |
| Idle Minimum * (dB) | 25.8 | 31 -20% | 32.4 -26% | 26.5 -3% | 30.7 -19% | 31.9 -24% |
| Idle Average * (dB) | 33.2 | 32 4% | 32.4 2% | 26.5 20% | 30.7 8% | 31.9 4% |
| Idle Maximum * (dB) | 33.2 | 36 -8% | 32.4 2% | 32.4 2% | 30.7 8% | 33.5 -1% |
| Load Average * (dB) | 37.3 | 55 -47% | 32.5 13% | 55.4 -49% | 36.6 2% | 47 -26% |
| Witcher 3 ultra * (dB) | 60.8 | 53 13% | 47.2 22% | 55.3 9% | 47 23% | 53.8 12% |
| Load Maximum * (dB) | 60.8 | 57 6% | 51.9 15% | 55.3 9% | 50.9 16% | 56.7 7% |
* ... Meglio usare valori piccoli
Rumorosità
| Idle |
| 25.8 / 33.2 / 33.2 dB(A) |
| Sotto carico |
| 37.3 / 60.8 dB(A) |
 | ||
30 dB silenzioso 40 dB(A) udibile 50 dB(A) rumoroso |
||
min: | ||
(-) La temperatura massima sul lato superiore è di 49.4 °C / 121 F, rispetto alla media di 40.4 °C / 105 F, che varia da 21.2 a 68.8 °C per questa classe Gaming.
(-) Il lato inferiore si riscalda fino ad un massimo di 60 °C / 140 F, rispetto alla media di 43.2 °C / 110 F
(+) In idle, la temperatura media del lato superiore è di 26.2 °C / 79 F, rispetto alla media deld ispositivo di 33.9 °C / 93 F.
(±) Riproducendo The Witcher 3, la temperatura media per il lato superiore e' di 36 °C / 97 F, rispetto alla media del dispositivo di 33.9 °C / 93 F.
(+) I poggiapolsi e il touchpad sono piu' freddi della temperatura della pelle con un massimo di 30 °C / 86 F e sono quindi freddi al tatto.
(±) La temperatura media della zona del palmo della mano di dispositivi simili e'stata di 28.8 °C / 83.8 F (-1.2 °C / -2.2 F).
Asus ROG Zephyrus M15 GU502LU-BI7N4 analisi audio
(+) | gli altoparlanti sono relativamente potenti (83.9 dB)
Bassi 100 - 315 Hz
(±) | bassi ridotti - in media 9.4% inferiori alla media
(±) | la linearità dei bassi è media (10.2% delta rispetto alla precedente frequenza)
Medi 400 - 2000 Hz
(+) | medi bilanciati - solo only 2.2% rispetto alla media
(+) | medi lineari (5.2% delta rispetto alla precedente frequenza)
Alti 2 - 16 kHz
(+) | Alti bilanciati - appena 3.7% dalla media
(+) | alti lineari (5.8% delta rispetto alla precedente frequenza)
Nel complesso 100 - 16.000 Hz
(+) | suono nel complesso lineare (9.9% differenza dalla media)
Rispetto alla stessa classe
» 5% di tutti i dispositivi testati in questa classe è stato migliore, 2% simile, 94% peggiore
» Il migliore ha avuto un delta di 6%, medio di 18%, peggiore di 132%
Rispetto a tutti i dispositivi testati
» 4% di tutti i dispositivi testati in questa classe è stato migliore, 1% similare, 95% peggiore
» Il migliore ha avuto un delta di 4%, medio di 24%, peggiore di 134%
Apple MacBook 12 (Early 2016) 1.1 GHz analisi audio
(+) | gli altoparlanti sono relativamente potenti (83.6 dB)
Bassi 100 - 315 Hz
(±) | bassi ridotti - in media 11.3% inferiori alla media
(±) | la linearità dei bassi è media (14.2% delta rispetto alla precedente frequenza)
Medi 400 - 2000 Hz
(+) | medi bilanciati - solo only 2.4% rispetto alla media
(+) | medi lineari (5.5% delta rispetto alla precedente frequenza)
Alti 2 - 16 kHz
(+) | Alti bilanciati - appena 2% dalla media
(+) | alti lineari (4.5% delta rispetto alla precedente frequenza)
Nel complesso 100 - 16.000 Hz
(+) | suono nel complesso lineare (10.2% differenza dalla media)
Rispetto alla stessa classe
» 7% di tutti i dispositivi testati in questa classe è stato migliore, 2% simile, 91% peggiore
» Il migliore ha avuto un delta di 5%, medio di 18%, peggiore di 53%
Rispetto a tutti i dispositivi testati
» 5% di tutti i dispositivi testati in questa classe è stato migliore, 1% similare, 94% peggiore
» Il migliore ha avuto un delta di 4%, medio di 24%, peggiore di 134%
| Off / Standby | |
| Idle | |
| Sotto carico |
|
Leggenda:
min: | |
| Asus ROG Zephyrus M15 GU502LU-BI7N4 i7-10750H, GeForce GTX 1660 Ti Mobile, Intel SSD 660p SSDPEKNW512G8, IPS, 1920x1080, 15.6" | Asus ROG Zephyrus M15 GU502L i7-10750H, GeForce RTX 2070 Max-Q, 2x Intel SSD 660p SSDPEKNW512G8 (RAID 0), IPS, 3840x2160, 15.6" | HP Omen 15-ek0456ng i5-10300H, GeForce GTX 1660 Ti Mobile, Toshiba XG6 KXG60ZNV512G, IPS, 1920x1080, 15.6" | Gateway Creator Series 15.6 GWTN156-3BK i5-10300H, GeForce RTX 2060 Mobile, Phison PS5013 PM8256GPTCB4B8TF, IPS, 1920x1080, 15.6" | Lenovo Legion 5 15IMH05H i5-10300H, GeForce RTX 2060 Mobile, Samsung PM991 MZALQ512HALU, IPS, 1920x1080, 15.6" | MSI GP65 10SFK-047US i7-10750H, GeForce RTX 2070 Mobile, Samsung SSD PM981 MZVLB1T0HALR, IPS, 1920x1080, 15.6" | |
|---|---|---|---|---|---|---|
| Power Consumption | 6% | 17% | 2% | 38% | -8% | |
| Idle Minimum * (Watt) | 10 | 10 -0% | 9.2 8% | 9.9 1% | 3.2 68% | 14.2 -42% |
| Idle Average * (Watt) | 16.9 | 13 23% | 14.6 14% | 17 -1% | 8.3 51% | 18.8 -11% |
| Idle Maximum * (Watt) | 28.3 | 23 19% | 18.1 36% | 31.9 -13% | 8.7 69% | 23.9 16% |
| Load Average * (Watt) | 122.7 | 137 -12% | 84 32% | 90.5 26% | 82 33% | 96.9 21% |
| Witcher 3 ultra * (Watt) | 143.2 | 140 2% | 142 1% | 162.3 -13% | 151 -5% | 185 -29% |
| Load Maximum * (Watt) | 224.1 | 222 1% | 194 13% | 202.1 10% | 195 13% | 233.4 -4% |
* ... Meglio usare valori piccoli
| Asus ROG Zephyrus M15 GU502LU-BI7N4 i7-10750H, GeForce GTX 1660 Ti Mobile, 76 Wh | Asus ROG Zephyrus M15 GU502L i7-10750H, GeForce RTX 2070 Max-Q, 76 Wh | HP Omen 15-ek0456ng i5-10300H, GeForce GTX 1660 Ti Mobile, 70.91 Wh | Gateway Creator Series 15.6 GWTN156-3BK i5-10300H, GeForce RTX 2060 Mobile, 46.74 Wh | Lenovo Legion 5 15IMH05H i5-10300H, GeForce RTX 2060 Mobile, 60 Wh | MSI GP65 10SFK-047US i7-10750H, GeForce RTX 2070 Mobile, 51 Wh | |
|---|---|---|---|---|---|---|
| Autonomia della batteria | -7% | 10% | 37% | 22% | -37% | |
| WiFi v1.3 (h) | 5.9 | 5.5 -7% | 6.5 10% | 8.1 37% | 7.2 22% | 3.7 -37% |
| Reader / Idle (h) | 8.6 | 11.7 | 14.1 | |||
| Load (h) | 1.5 | 1.7 | 1.4 |
Pro
Contro
La modalità Turbo sui portatili Asus Zephyrus ha un impatto maggiore sulle prestazioni rispetto alla modalità Turbo della maggior parte dei portatili MSI. Gli utenti non dovrebbero confondere la modalità Turbo con la modalità Performance, che funziona a velocità di clock più basse e a temperature leggermente più alte a causa limite basso del rumore della ventola.
A parte i profili di potenza confusi e le loro influenze sulle prestazioni, il GU502LU potrebbe essere migliore se si considera il prezzo di $1400 USD. La GPU GTX 1660 Ti, lo spazio colore ristretto e i tempi di risposta del display lento sono comuni nei computer portatili gaming economici che costano al dettaglio a centinaia di dollari in meno rispetto a questo Asus. Invece, il sovrapprezzo qui è riguarda il design del telaio relativamente sottile e leggero, poiché le alternative più economiche con le stesse specifiche interne sono tipicamente più spesse, più pesanti e probabilmente meno attraenti come la serie Acer Nitro, HP Pavilion Gaming, MSI GP65, o la serie Dell G3.
Prestazioni di gioco convenienti per un prezzo medio. Gli utenti pagheranno un extra per il telaio più sottile, più elegante e più portatile. Per il resto, è possibile trovare la stessa CPU, GPU e display su gaming laptop più economici e più pesanti.
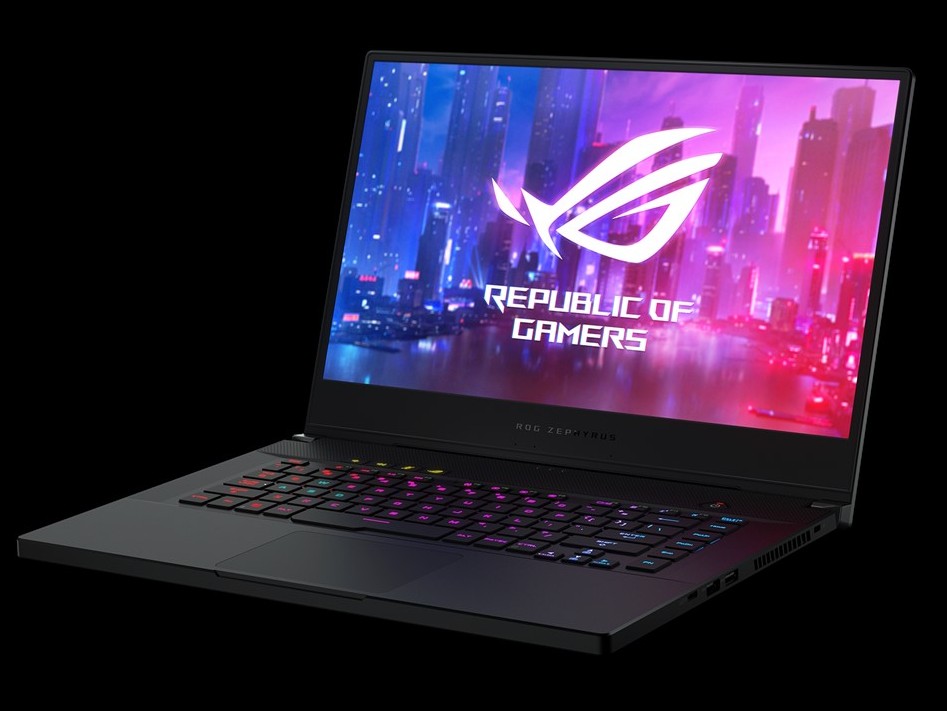
Asus ROG Zephyrus M15 GU502LU-BI7N4
- 10/12/2020 v7 (old)
Allen Ngo
Price comparison
