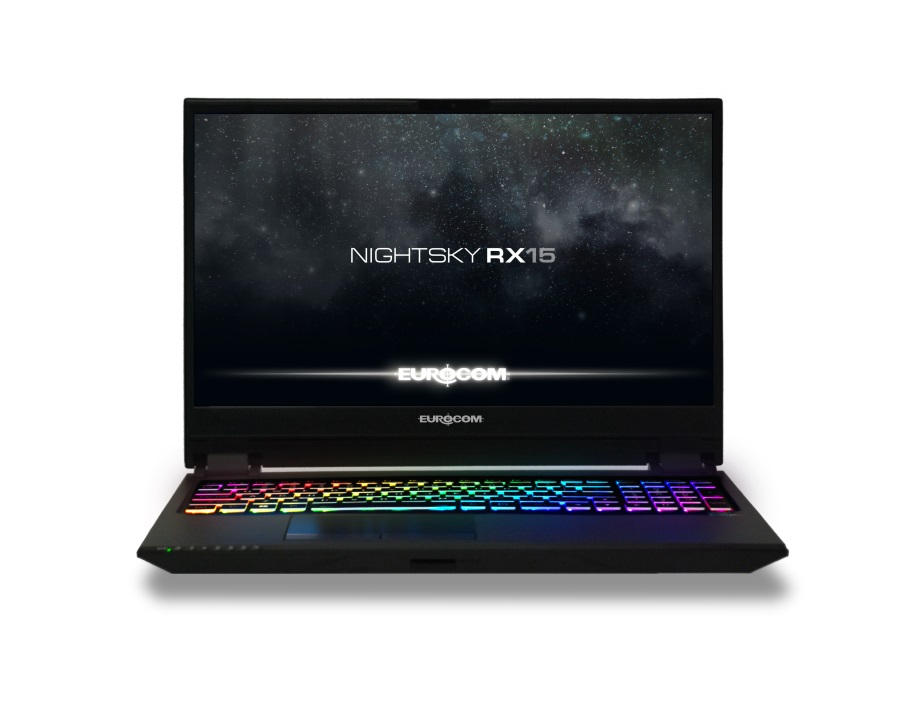
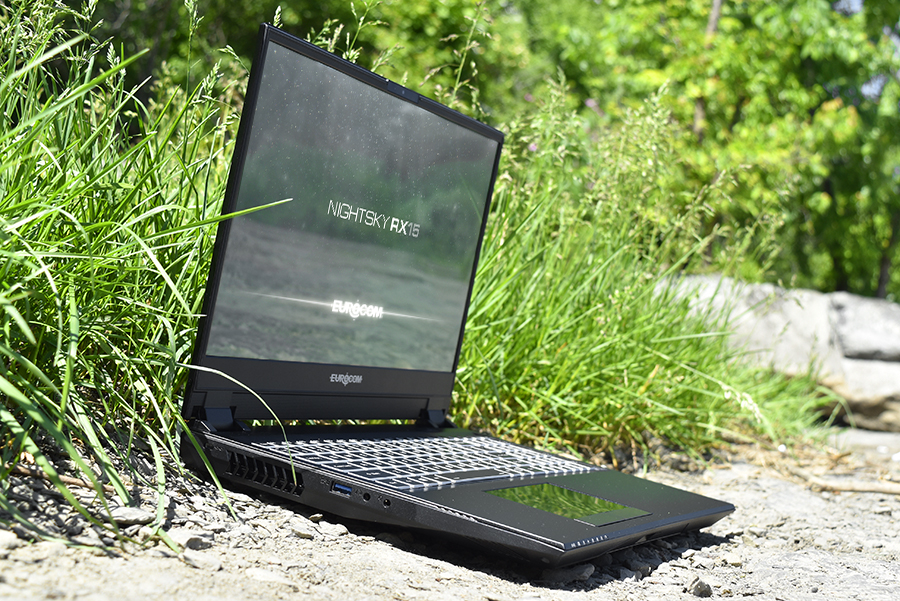
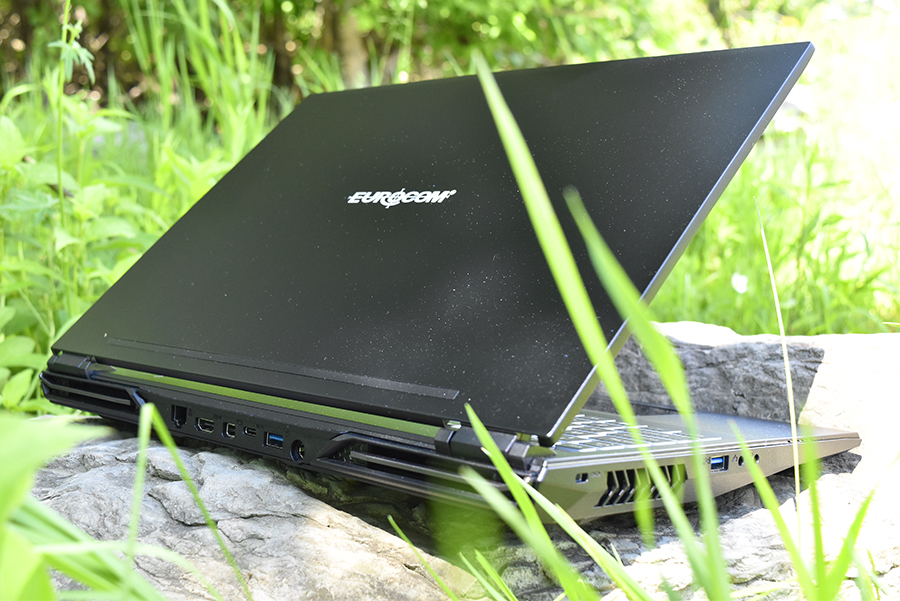
Recensione del Laptop Eurocom Nightsky RX15 (Clevo PB51RF, Core i9, 4K OLED)
| SD Card Reader | |
| average JPG Copy Test (av. of 3 runs) | |
| Eurocom Sky X4C (Toshiba Exceria Pro SDXC 64 GB UHS-II) | |
| Eurocom Nightsky RX15 (Toshiba Exceria Pro SDXC 64 GB UHS-II) | |
| HP Omen 15-dc1303ng (Toshiba Exceria Pro SDXC 64 GB UHS-II) | |
| HP Gaming Pavilion 15-dk0009ng (Toshiba Exceria Pro SDXC 64 GB UHS-II) | |
| MSI GE63 Raider RGB 8RF-008 (Toshiba Exceria Pro SDXC 64 GB UHS-II) | |
| maximum AS SSD Seq Read Test (1GB) | |
| Eurocom Nightsky RX15 (Toshiba Exceria Pro SDXC 64 GB UHS-II) | |
| Eurocom Sky X4C (Toshiba Exceria Pro SDXC 64 GB UHS-II) | |
| HP Omen 15-dc1303ng (Toshiba Exceria Pro SDXC 64 GB UHS-II) | |
| HP Gaming Pavilion 15-dk0009ng (Toshiba Exceria Pro SDXC 64 GB UHS-II) | |
| MSI GE63 Raider RGB 8RF-008 (Toshiba Exceria Pro SDXC 64 GB UHS-II) | |
| |||||||||||||||||||||||||
Distribuzione della luminosità: 88 %
Al centro con la batteria: 414.9 cd/m²
Contrasto: ∞:1 (Nero: 0 cd/m²)
ΔE ColorChecker Calman: 7.58 | ∀{0.5-29.43 Ø4.72}
ΔE Greyscale Calman: 2.9 | ∀{0.09-98 Ø4.97}
100% sRGB (Argyll 1.6.3 3D)
88.2% AdobeRGB 1998 (Argyll 1.6.3 3D)
99.1% AdobeRGB 1998 (Argyll 3D)
100% sRGB (Argyll 3D)
99.9% Display P3 (Argyll 3D)
Gamma: 2.05
CCT: 6538 K
| Eurocom Nightsky RX15 Samsung SDCA029, OLED, 15.6", 3840x2160 | Eurocom Nightsky Ti15 AU Optronics B156HAN, IPS, 15.6", 1920x1080 | Eurocom Sky X4C ID: SHP142A, Name: LQ156D1JX01B, IPS, 15.6", 3840x2160 | Dell XPS 15 7590 9980HK GTX 1650 Samsung 156WR04, SDCA029, OLED, 15.6", 3840x2160 | HP Omen 15-dc1303ng LG Philips LGD05C0, IPS, 15.6", 1920x1080 | MSI GE63 Raider RGB 8RF-008 CMN N156HHE-GA1 (CMN15F4), TN, 15.6", 1920x1080 | |
|---|---|---|---|---|---|---|
| Display | -26% | -23% | -6% | -26% | -8% | |
| Display P3 Coverage (%) | 99.9 | 65.2 -35% | 65.1 -35% | 88.1 -12% | 63.8 -36% | 90 -10% |
| sRGB Coverage (%) | 100 | 90.9 -9% | 96.5 -3% | 99.6 0% | 93.4 -7% | 100 0% |
| AdobeRGB 1998 Coverage (%) | 99.1 | 66.3 -33% | 67.2 -32% | 91.8 -7% | 65 -34% | 86 -13% |
| Response Times | -385% | -1239% | 6% | -403% | -713% | |
| Response Time Grey 50% / Grey 80% * (ms) | 2.4 ? | 14.4 ? -500% | 33.6 ? -1300% | 2.3 ? 4% | 14 ? -483% | 24.4 ? -917% |
| Response Time Black / White * (ms) | 2.6 ? | 9.6 ? -269% | 33.2 ? -1177% | 2.4 ? 8% | 11 ? -323% | 15.8 ? -508% |
| PWM Frequency (Hz) | 59.5 ? | 1000 ? | 59.5 ? | 25510 ? | ||
| Screen | -3% | -13% | 6% | 6% | -11% | |
| Brightness middle (cd/m²) | 414.9 | 331 -20% | 324.7 -22% | 421.2 2% | 316 -24% | 292 -30% |
| Brightness (cd/m²) | 404 | 327 -19% | 318 -21% | 417 3% | 295 -27% | 258 -36% |
| Brightness Distribution (%) | 88 | 83 -6% | 81 -8% | 94 7% | 84 -5% | 81 -8% |
| Black Level * (cd/m²) | 0.35 | 0.26 | 0.42 | 0.23 | ||
| Colorchecker dE 2000 * | 7.58 | 4.22 44% | 4.67 38% | 6.06 20% | 2.7 64% | 5.82 23% |
| Colorchecker dE 2000 max. * | 14.85 | 6.95 53% | 8.16 45% | 11.89 20% | 5.65 62% | 9.05 39% |
| Greyscale dE 2000 * | 2.9 | 3.9 -34% | 5.9 -103% | 2.8 3% | 2.35 19% | 4.61 -59% |
| Gamma | 2.05 107% | 2.26 97% | 2.14 103% | 2.15 102% | 2.41 91% | 2.65 83% |
| CCT | 6538 99% | 7392 88% | 7176 91% | 6235 104% | 6904 94% | 6950 94% |
| Color Space (Percent of AdobeRGB 1998) (%) | 88.2 | 59 -33% | 61.1 -31% | 81 -8% | 60 -32% | 76 -14% |
| Color Space (Percent of sRGB) (%) | 100 | 90.5 -9% | 96.1 -4% | 99.6 0% | 93 -7% | 100 0% |
| Contrast (:1) | 946 | 1249 | 752 | 1270 | ||
| Colorchecker dE 2000 calibrated * | 3.27 | 1.58 | 2.82 | |||
| Media totale (Programma / Settaggio) | -138% /
-67% | -425% /
-204% | 2% /
3% | -141% /
-64% | -244% /
-118% |
* ... Meglio usare valori piccoli
Tempi di risposta del Display
| ↔ Tempi di risposta dal Nero al Bianco | ||
|---|---|---|
| 2.6 ms ... aumenta ↗ e diminuisce ↘ combinato | ↗ 1.3 ms Incremento | 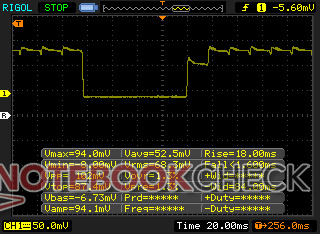 |
| ↘ 1.3 ms Calo | ||
| Lo schermo ha mostrato valori di risposta molto veloci nei nostri tests ed è molto adatto per i gaming veloce. In confronto, tutti i dispositivi di test variano da 0.1 (minimo) a 240 (massimo) ms. » 13 % di tutti i dispositivi è migliore. Questo significa che i tempi di risposta rilevati sono migliori rispettto alla media di tutti i dispositivi testati (19.9 ms). | ||
| ↔ Tempo di risposta dal 50% Grigio all'80% Grigio | ||
| 2.4 ms ... aumenta ↗ e diminuisce ↘ combinato | ↗ 1.2 ms Incremento | 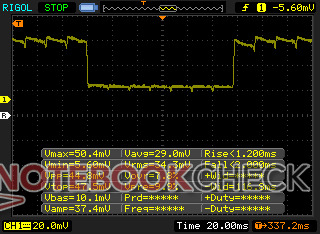 |
| ↘ 1.2 ms Calo | ||
| Lo schermo ha mostrato valori di risposta molto veloci nei nostri tests ed è molto adatto per i gaming veloce. In confronto, tutti i dispositivi di test variano da 0.165 (minimo) a 636 (massimo) ms. » 11 % di tutti i dispositivi è migliore. Questo significa che i tempi di risposta rilevati sono migliori rispettto alla media di tutti i dispositivi testati (31.1 ms). | ||
Sfarfallio dello schermo / PWM (Pulse-Width Modulation)
| flickering dello schermo / PWM rilevato | 59.5 Hz | ≤ 100 % settaggio luminosita' | 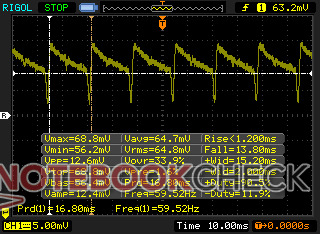 |
Il display sfarfalla a 59.5 Hz (Probabilmente a causa dell'uso di PWM) Flickering rilevato ad una luminosita' di 100 % o inferiore. Non dovrebbe verificarsi flickering o PWM sopra questo valore di luminosita'. La frequenza di 59.5 Hz è molto bassa, quindi il flickering potrebbe causare stanchezza agli occhi e mal di testa con un utilizzo prolungato. In confronto: 52 % di tutti i dispositivi testati non utilizza PWM per ridurre la luminosita' del display. Se è rilevato PWM, una media di 7784 (minimo: 5 - massimo: 343500) Hz è stata rilevata. | |||
| PCMark 8 Home Score Accelerated v2 | 3758 punti | |
| PCMark 8 Work Score Accelerated v2 | 4677 punti | |
| PCMark 10 Score | 6283 punti | |
Aiuto | ||
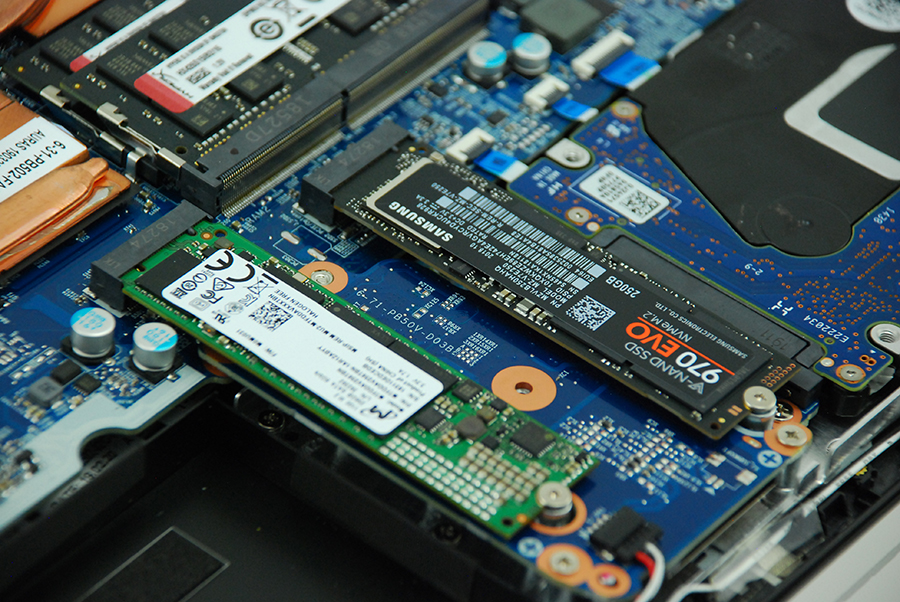
| Eurocom Nightsky RX15 Samsung SSD 970 Pro 512GB | Eurocom Sky X4C Samsung SSD 960 Pro 1TB m.2 NVMe | Razer Blade 15 RTX 2080 Max-Q Samsung SSD PM981 MZVLB512HAJQ | MSI GE63 Raider RGB 8RF-008 Samsung SSD PM871a MZNLN256HMHQ | Dell XPS 15 7590 9980HK GTX 1650 Toshiba XG6 KXG60ZNV1T02 | |
|---|---|---|---|---|---|
| AS SSD | 13% | 6% | -44% | 8% | |
| Seq Read (MB/s) | 2352 | 2541 8% | 1832 -22% | 512 -78% | 1723 -27% |
| Seq Write (MB/s) | 2184 | 1989 -9% | 1864 -15% | 462.8 -79% | 1386 -37% |
| 4K Read (MB/s) | 28.65 | 44.83 56% | 52.1 82% | 32.36 13% | 43.25 51% |
| 4K Write (MB/s) | 61.3 | 129.6 111% | 108.3 77% | 68.6 12% | 98.3 60% |
| 4K-64 Read (MB/s) | 1317 | 1646 25% | 1159 -12% | 348.6 -74% | 1078 -18% |
| 4K-64 Write (MB/s) | 2156 | 1375 -36% | 1807 -16% | 294.3 -86% | 1456 -32% |
| Access Time Read * (ms) | 0.101 | 0.032 68% | 0.05 50% | 0.101 -0% | 0.05 50% |
| Access Time Write * (ms) | 0.09 | 0.03 67% | 0.034 62% | 0.051 43% | 0.039 57% |
| Score Read (Points) | 1581 | 1945 23% | 1394 -12% | 432 -73% | 1294 -18% |
| Score Write (Points) | 2435 | 1703 -30% | 2102 -14% | 409 -83% | 1693 -30% |
| Score Total (Points) | 4813 | 4615 -4% | 4221 -12% | 1071 -78% | 3638 -24% |
| Copy ISO MB/s (MB/s) | 2705 | 1908 -29% | 2083 -23% | 3182 18% | |
| Copy Program MB/s (MB/s) | 666 | 467.2 -30% | 496.5 -25% | 984 48% | |
| Copy Game MB/s (MB/s) | 1583 | 1055 -33% | 977 -38% | 1824 15% |
* ... Meglio usare valori piccoli

| 3DMark 11 Performance | 23371 punti | |
| 3DMark Cloud Gate Standard Score | 40808 punti | |
| 3DMark Fire Strike Score | 18283 punti | |
| 3DMark Time Spy Score | 7968 punti | |
Aiuto | ||
| Shadow of the Tomb Raider - 1920x1080 Highest Preset AA:T | |
| MSI GE75 9SG | |
| Asus ROG Strix RTX 2070 OC | |
| Eurocom Nightsky RX15 | |
| Origin PC EVO16-S i7-9750H RTX 2080 Max-Q | |
| AMD Radeon RX Vega 64 | |
| Media NVIDIA GeForce RTX 2070 Mobile (74.2 - 97, n=11) | |
| Alienware m15 P79F | |
| Eurocom Nightsky Ti15 | |
| Dell XPS 15 7590 9980HK GTX 1650 | |
| basso | medio | alto | ultra | 4K | |
|---|---|---|---|---|---|
| BioShock Infinite (2013) | 391.4 | 345.6 | 320.2 | 181.3 | |
| The Witcher 3 (2015) | 329.3 | 244.8 | 155.8 | 80.6 | 57.4 |
| Shadow of the Tomb Raider (2018) | 160 | 114 | 107 | 97 | 34 |
| Eurocom Nightsky RX15 GeForce RTX 2070 Mobile, i9-9980HK, Samsung SSD 970 Pro 512GB | Eurocom Sky X4C GeForce GTX 1080 Mobile, i7-8700K, Samsung SSD 960 Pro 1TB m.2 NVMe | HP Omen 15-dc1303ng GeForce RTX 2070 Max-Q, i7-8750H, Samsung SSD PM981 MZVLB256HAHQ | Razer Blade 15 RTX 2080 Max-Q GeForce RTX 2080 Max-Q, i7-9750H, Samsung SSD PM981 MZVLB512HAJQ | MSI GE63 Raider RGB 8RF-008 GeForce GTX 1070 Mobile, i7-8750H, Samsung SSD PM871a MZNLN256HMHQ | Eurocom Nightsky Ti15 GeForce GTX 1660 Ti Mobile, i7-9750H, Samsung SSD 970 Pro 512GB | Dell XPS 15 7590 9980HK GTX 1650 GeForce GTX 1650 Mobile, i9-9980HK, Toshiba XG6 KXG60ZNV1T02 | |
|---|---|---|---|---|---|---|---|
| Noise | 4% | -2% | 11% | -5% | 3% | 7% | |
| off /ambiente * (dB) | 28.2 | 28.6 -1% | 30.5 -8% | 28.3 -0% | 30 -6% | 28.4 -1% | 28.2 -0% |
| Idle Minimum * (dB) | 28.2 | 28.6 -1% | 32.8 -16% | 28.8 -2% | 30 -6% | 28.6 -1% | 28.2 -0% |
| Idle Average * (dB) | 28.2 | 28.6 -1% | 32.8 -16% | 28.8 -2% | 35 -24% | 28.6 -1% | 28.2 -0% |
| Idle Maximum * (dB) | 31.7 | 31.1 2% | 32.8 -3% | 29 9% | 36 -14% | 28.6 10% | 30.4 4% |
| Load Average * (dB) | 53.7 | 42.2 21% | 42.5 21% | 33.5 38% | 42 22% | 47.8 11% | 43.8 18% |
| Witcher 3 ultra * (dB) | 53.7 | 53.8 -0% | 45 16% | 54 -1% | 53.7 -0% | 47.2 12% | |
| Load Maximum * (dB) | 53.7 | 50 7% | 47.5 12% | 45.2 16% | 56 -4% | 53.7 -0% | 47.2 12% |
* ... Meglio usare valori piccoli
Rumorosità
| Idle |
| 28.2 / 28.2 / 31.7 dB(A) |
| HDD |
| 0 dB(A) |
| Sotto carico |
| 53.7 / 53.7 dB(A) |
 | ||
30 dB silenzioso 40 dB(A) udibile 50 dB(A) rumoroso |
||
min: | ||
(±) La temperatura massima sul lato superiore è di 40.2 °C / 104 F, rispetto alla media di 40.4 °C / 105 F, che varia da 21.2 a 68.8 °C per questa classe Gaming.
(-) Il lato inferiore si riscalda fino ad un massimo di 53 °C / 127 F, rispetto alla media di 43.2 °C / 110 F
(+) In idle, la temperatura media del lato superiore è di 30.6 °C / 87 F, rispetto alla media deld ispositivo di 33.9 °C / 93 F.
(±) Riproducendo The Witcher 3, la temperatura media per il lato superiore e' di 34.9 °C / 95 F, rispetto alla media del dispositivo di 33.9 °C / 93 F.
(+) I poggiapolsi e il touchpad sono piu' freddi della temperatura della pelle con un massimo di 29.4 °C / 84.9 F e sono quindi freddi al tatto.
(±) La temperatura media della zona del palmo della mano di dispositivi simili e'stata di 28.8 °C / 83.8 F (-0.6 °C / -1.1 F).
Eurocom Nightsky RX15 analisi audio
(+) | gli altoparlanti sono relativamente potenti (85.6 dB)
Bassi 100 - 315 Hz
(-) | quasi nessun basso - in media 28.4% inferiori alla media
(±) | la linearità dei bassi è media (12.4% delta rispetto alla precedente frequenza)
Medi 400 - 2000 Hz
(+) | medi bilanciati - solo only 4.5% rispetto alla media
(±) | linearità dei medi adeguata (7% delta rispetto alla precedente frequenza)
Alti 2 - 16 kHz
(+) | Alti bilanciati - appena 1.6% dalla media
(+) | alti lineari (5.7% delta rispetto alla precedente frequenza)
Nel complesso 100 - 16.000 Hz
(±) | la linearità complessiva del suono è media (24.4% di differenza rispetto alla media
Rispetto alla stessa classe
» 88% di tutti i dispositivi testati in questa classe è stato migliore, 3% simile, 8% peggiore
» Il migliore ha avuto un delta di 6%, medio di 18%, peggiore di 132%
Rispetto a tutti i dispositivi testati
» 74% di tutti i dispositivi testati in questa classe è stato migliore, 6% similare, 20% peggiore
» Il migliore ha avuto un delta di 4%, medio di 24%, peggiore di 134%
Apple MacBook 12 (Early 2016) 1.1 GHz analisi audio
(+) | gli altoparlanti sono relativamente potenti (83.6 dB)
Bassi 100 - 315 Hz
(±) | bassi ridotti - in media 11.3% inferiori alla media
(±) | la linearità dei bassi è media (14.2% delta rispetto alla precedente frequenza)
Medi 400 - 2000 Hz
(+) | medi bilanciati - solo only 2.4% rispetto alla media
(+) | medi lineari (5.5% delta rispetto alla precedente frequenza)
Alti 2 - 16 kHz
(+) | Alti bilanciati - appena 2% dalla media
(+) | alti lineari (4.5% delta rispetto alla precedente frequenza)
Nel complesso 100 - 16.000 Hz
(+) | suono nel complesso lineare (10.2% differenza dalla media)
Rispetto alla stessa classe
» 7% di tutti i dispositivi testati in questa classe è stato migliore, 2% simile, 91% peggiore
» Il migliore ha avuto un delta di 5%, medio di 18%, peggiore di 53%
Rispetto a tutti i dispositivi testati
» 5% di tutti i dispositivi testati in questa classe è stato migliore, 1% similare, 94% peggiore
» Il migliore ha avuto un delta di 4%, medio di 24%, peggiore di 134%
| Off / Standby | |
| Idle | |
| Sotto carico |
|
Leggenda:
min: | |
| Eurocom Nightsky RX15 i9-9980HK, GeForce RTX 2070 Mobile, Samsung SSD 970 Pro 512GB, OLED, 3840x2160, 15.6" | Eurocom Sky X4C i7-8700K, GeForce GTX 1080 Mobile, Samsung SSD 960 Pro 1TB m.2 NVMe, IPS, 3840x2160, 15.6" | Razer Blade 15 RTX 2080 Max-Q i7-9750H, GeForce RTX 2080 Max-Q, Samsung SSD PM981 MZVLB512HAJQ, IPS, 1920x1080, 15.6" | MSI GE63 Raider RGB 8RF-008 i7-8750H, GeForce GTX 1070 Mobile, Samsung SSD PM871a MZNLN256HMHQ, TN, 1920x1080, 15.6" | Eurocom Nightsky Ti15 i7-9750H, GeForce GTX 1660 Ti Mobile, Samsung SSD 970 Pro 512GB, IPS, 1920x1080, 15.6" | Asus Strix Scar III G531GW i9-9880H, GeForce RTX 2070 Mobile, Intel SSD 660p 1TB SSDPEKNW010T8, IPS, 1920x1080, 15.6" | |
|---|---|---|---|---|---|---|
| Power Consumption | -33% | 21% | 24% | 3% | -32% | |
| Idle Minimum * (Watt) | 12.6 | 30.2 -140% | 12.5 1% | 9 29% | 16.8 -33% | 29 -130% |
| Idle Average * (Watt) | 21.4 | 34.7 -62% | 15.3 29% | 14 35% | 29 -36% | 32 -50% |
| Idle Maximum * (Watt) | 34.4 | 37.8 -10% | 20.7 40% | 19 45% | 30.8 10% | 37 -8% |
| Load Average * (Watt) | 123.2 | 130.3 -6% | 90.2 27% | 91 26% | 89.2 28% | 157 -27% |
| Witcher 3 ultra * (Watt) | 192.4 | 172.2 10% | 162 16% | 182 5% | 141.1 27% | 173 10% |
| Load Maximum * (Watt) | 246.6 | 217.7 12% | 209.3 15% | 238 3% | 192.3 22% | 217 12% |
* ... Meglio usare valori piccoli
| Eurocom Nightsky RX15 i9-9980HK, GeForce RTX 2070 Mobile, 62 Wh | Eurocom Sky X4C i7-8700K, GeForce GTX 1080 Mobile, 82 Wh | HP Omen 15-dc1303ng i7-8750H, GeForce RTX 2070 Max-Q, 70 Wh | Razer Blade 15 RTX 2080 Max-Q i7-9750H, GeForce RTX 2080 Max-Q, 80 Wh | MSI GE63 Raider RGB 8RF-008 i7-8750H, GeForce GTX 1070 Mobile, 51 Wh | Eurocom Nightsky Ti15 i7-9750H, GeForce GTX 1660 Ti Mobile, 62 Wh | Dell XPS 15 7590 9980HK GTX 1650 i9-9980HK, GeForce GTX 1650 Mobile, 97 Wh | |
|---|---|---|---|---|---|---|---|
| Autonomia della batteria | -24% | -3% | 94% | 18% | 6% | 129% | |
| WiFi v1.3 (h) | 3.4 | 2.6 -24% | 3.3 -3% | 6.6 94% | 4 18% | 3.6 6% | 7.8 129% |
| Reader / Idle (h) | 3 | 5 | 15.9 | 5.7 | 15.2 | ||
| Load (h) | 1.4 | 1.2 | 1.7 | 0.8 | 3.3 |
Pro
Contro
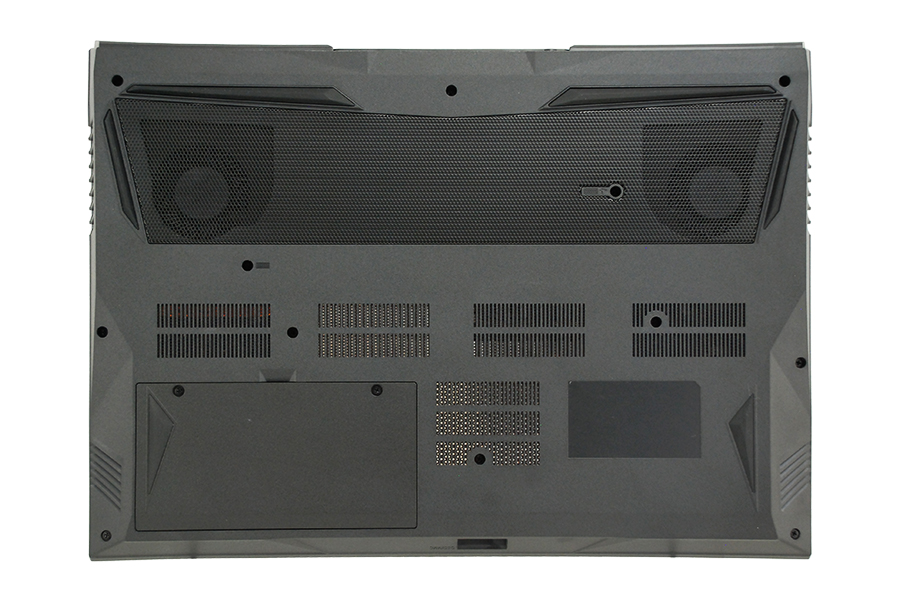
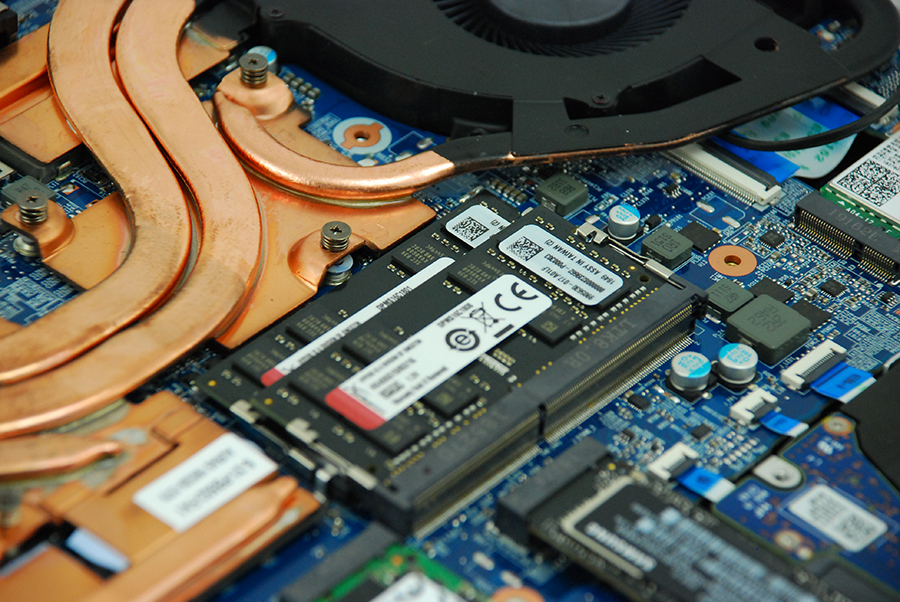
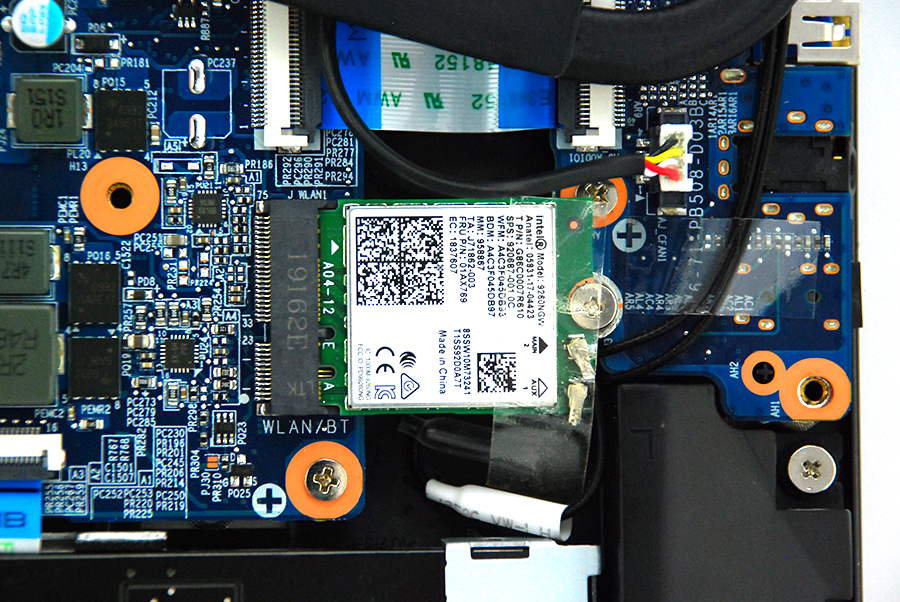
Molte delle nostre stesse conclusioni sul Nightsky Ti15 valgono anche per il Nightsky RX15, tra cui la difficile manutenzione, l'eccellente feedback della tastiera, la durata media della batteria, le grandi prestazioni e le ventole rumorose durante il gaming. Vogliamo invece rispondere a questa domanda: Core i9 e OLED valgono la pena di essere aggiornati rispetto Core i7 ed IPS?
La SKU più appropriata dipenderà dallo scenario di utilizzo. Se avete intenzione di utilizzare il Nightsky RX15 principalmente per giocare a 60 FPS, allora il Core i7 con IPS o OLED faranno al caso vostro. Se si punta a frame rate superiori a 60 FPS, tuttavia, la potenza di CPU aggiuntiva del Core i9 e la velocità di aggiornamento nativa più veloce del pannello IPS a 144 Hz o 240 Hz vi sarà meglio. Per uno scenario di utilizzo misto tra carichi di lavoro professionali esigenti, riproduzione multimediale e giochi, la SKU Core i9 e OLED come quella che abbiamo qui è ottimale. E' un peccato che l'assistenza sia più difficile di quanto dovrebbe essere.
L'OLED offre colori notevolmente più profondi, neri più profondi, meno ghosting, pixel più densi per pollice, un'immagine più brillante e una qualità dell'immagine più nitida rispetto a qualsiasi alternativa IPS a 144 Hz o 240 Hz. Per i giocatori più competitivi che apprezzano frame rate molto elevati, tuttavia, l'IPS è ancora l'opzione migliore.
Eurocom Nightsky RX15
- 08/27/2019 v6 (old)
Allen Ngo
Price comparison
