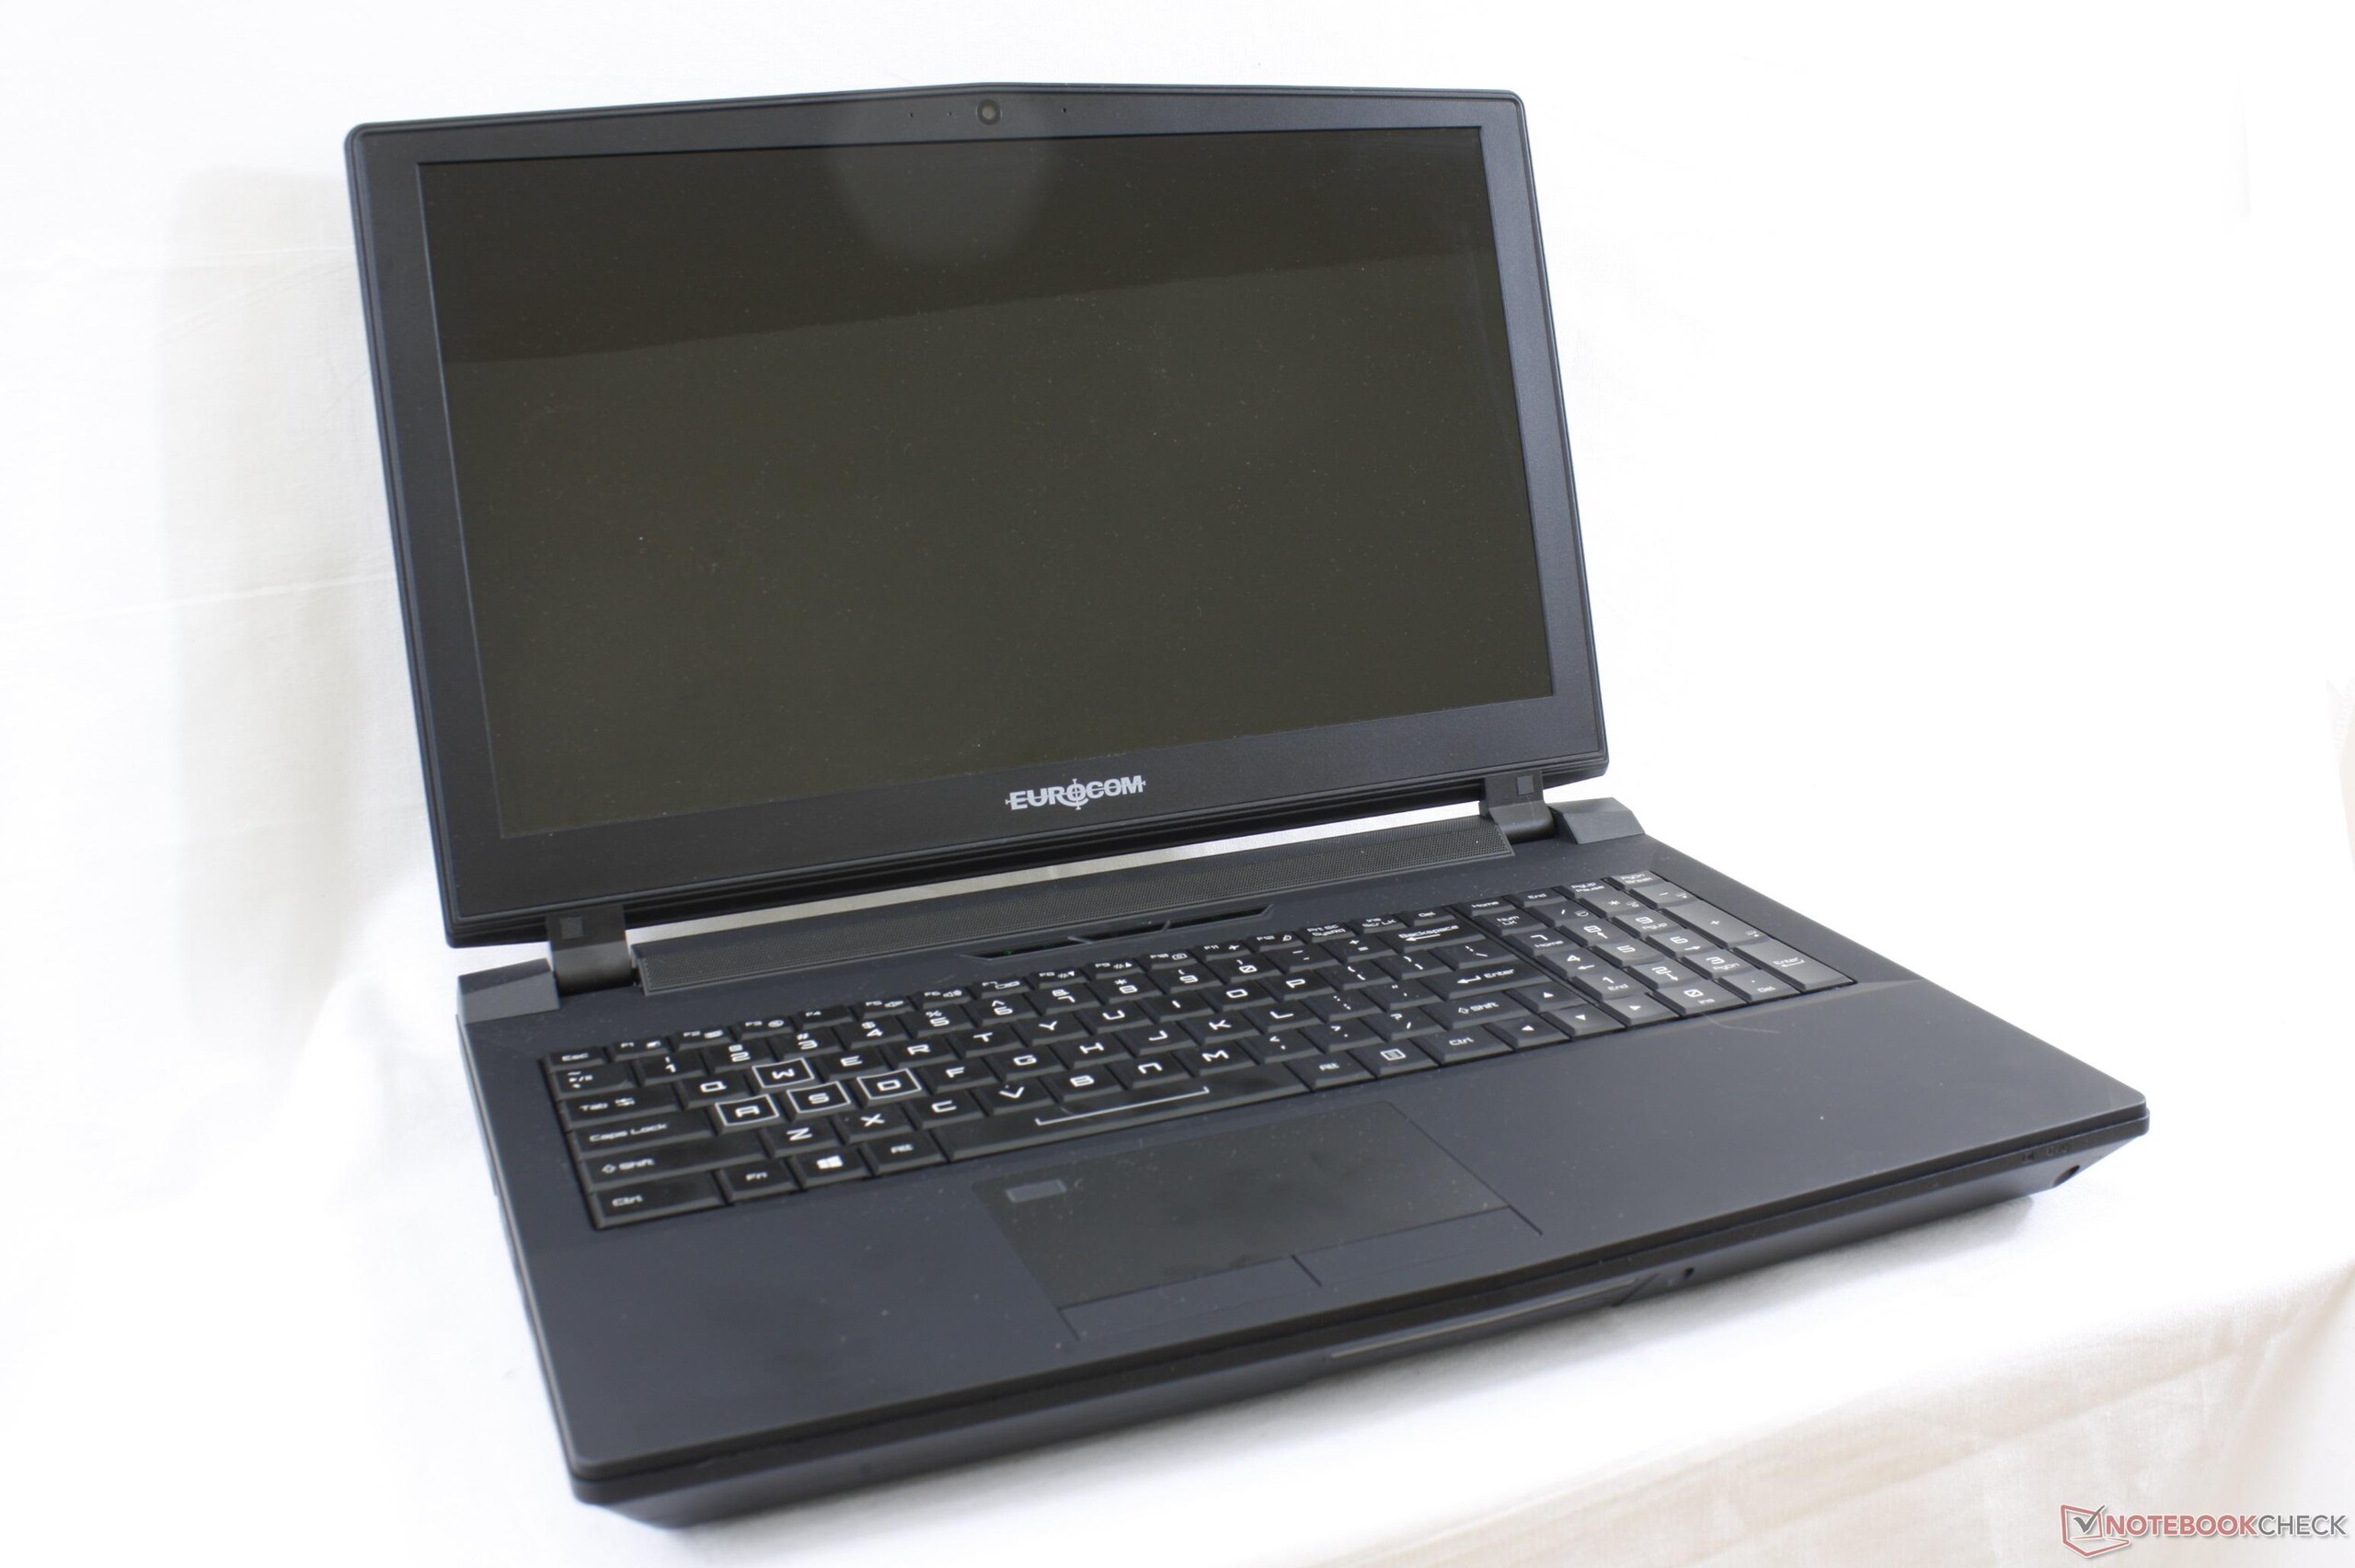
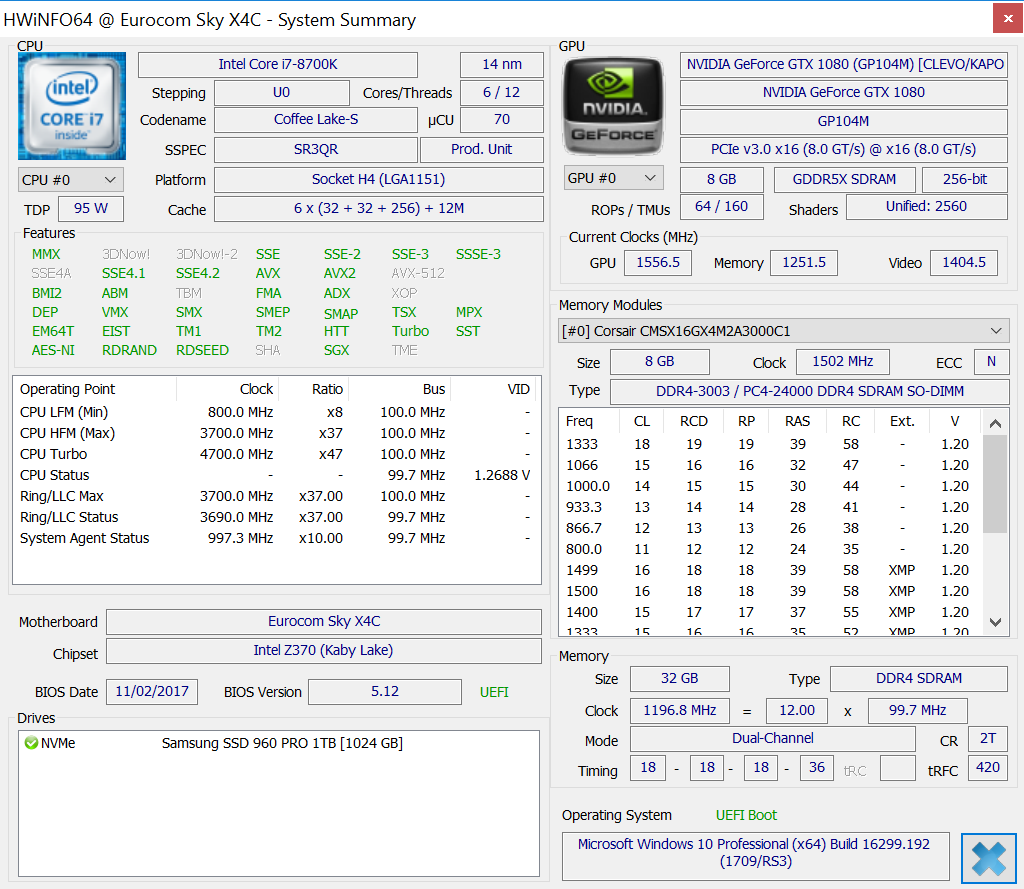
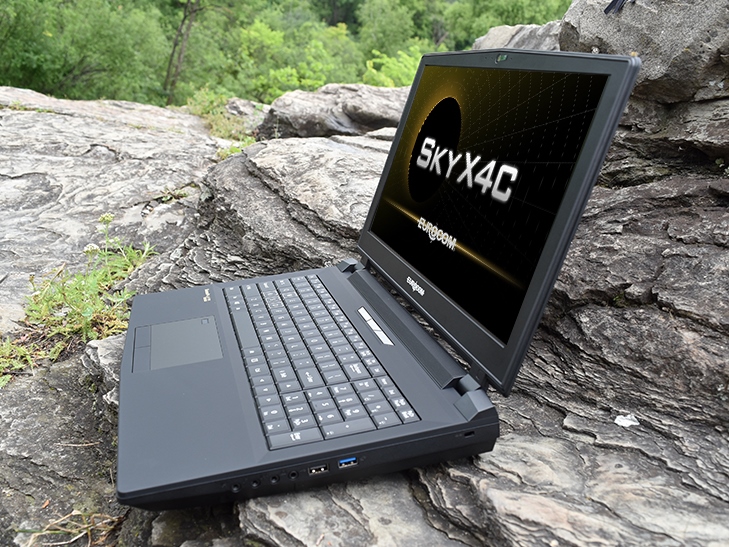
Recensione breve del Portatile Eurocom Sky X4C (i7-8700K, GTX 1080, Clevo P751TM1-G)
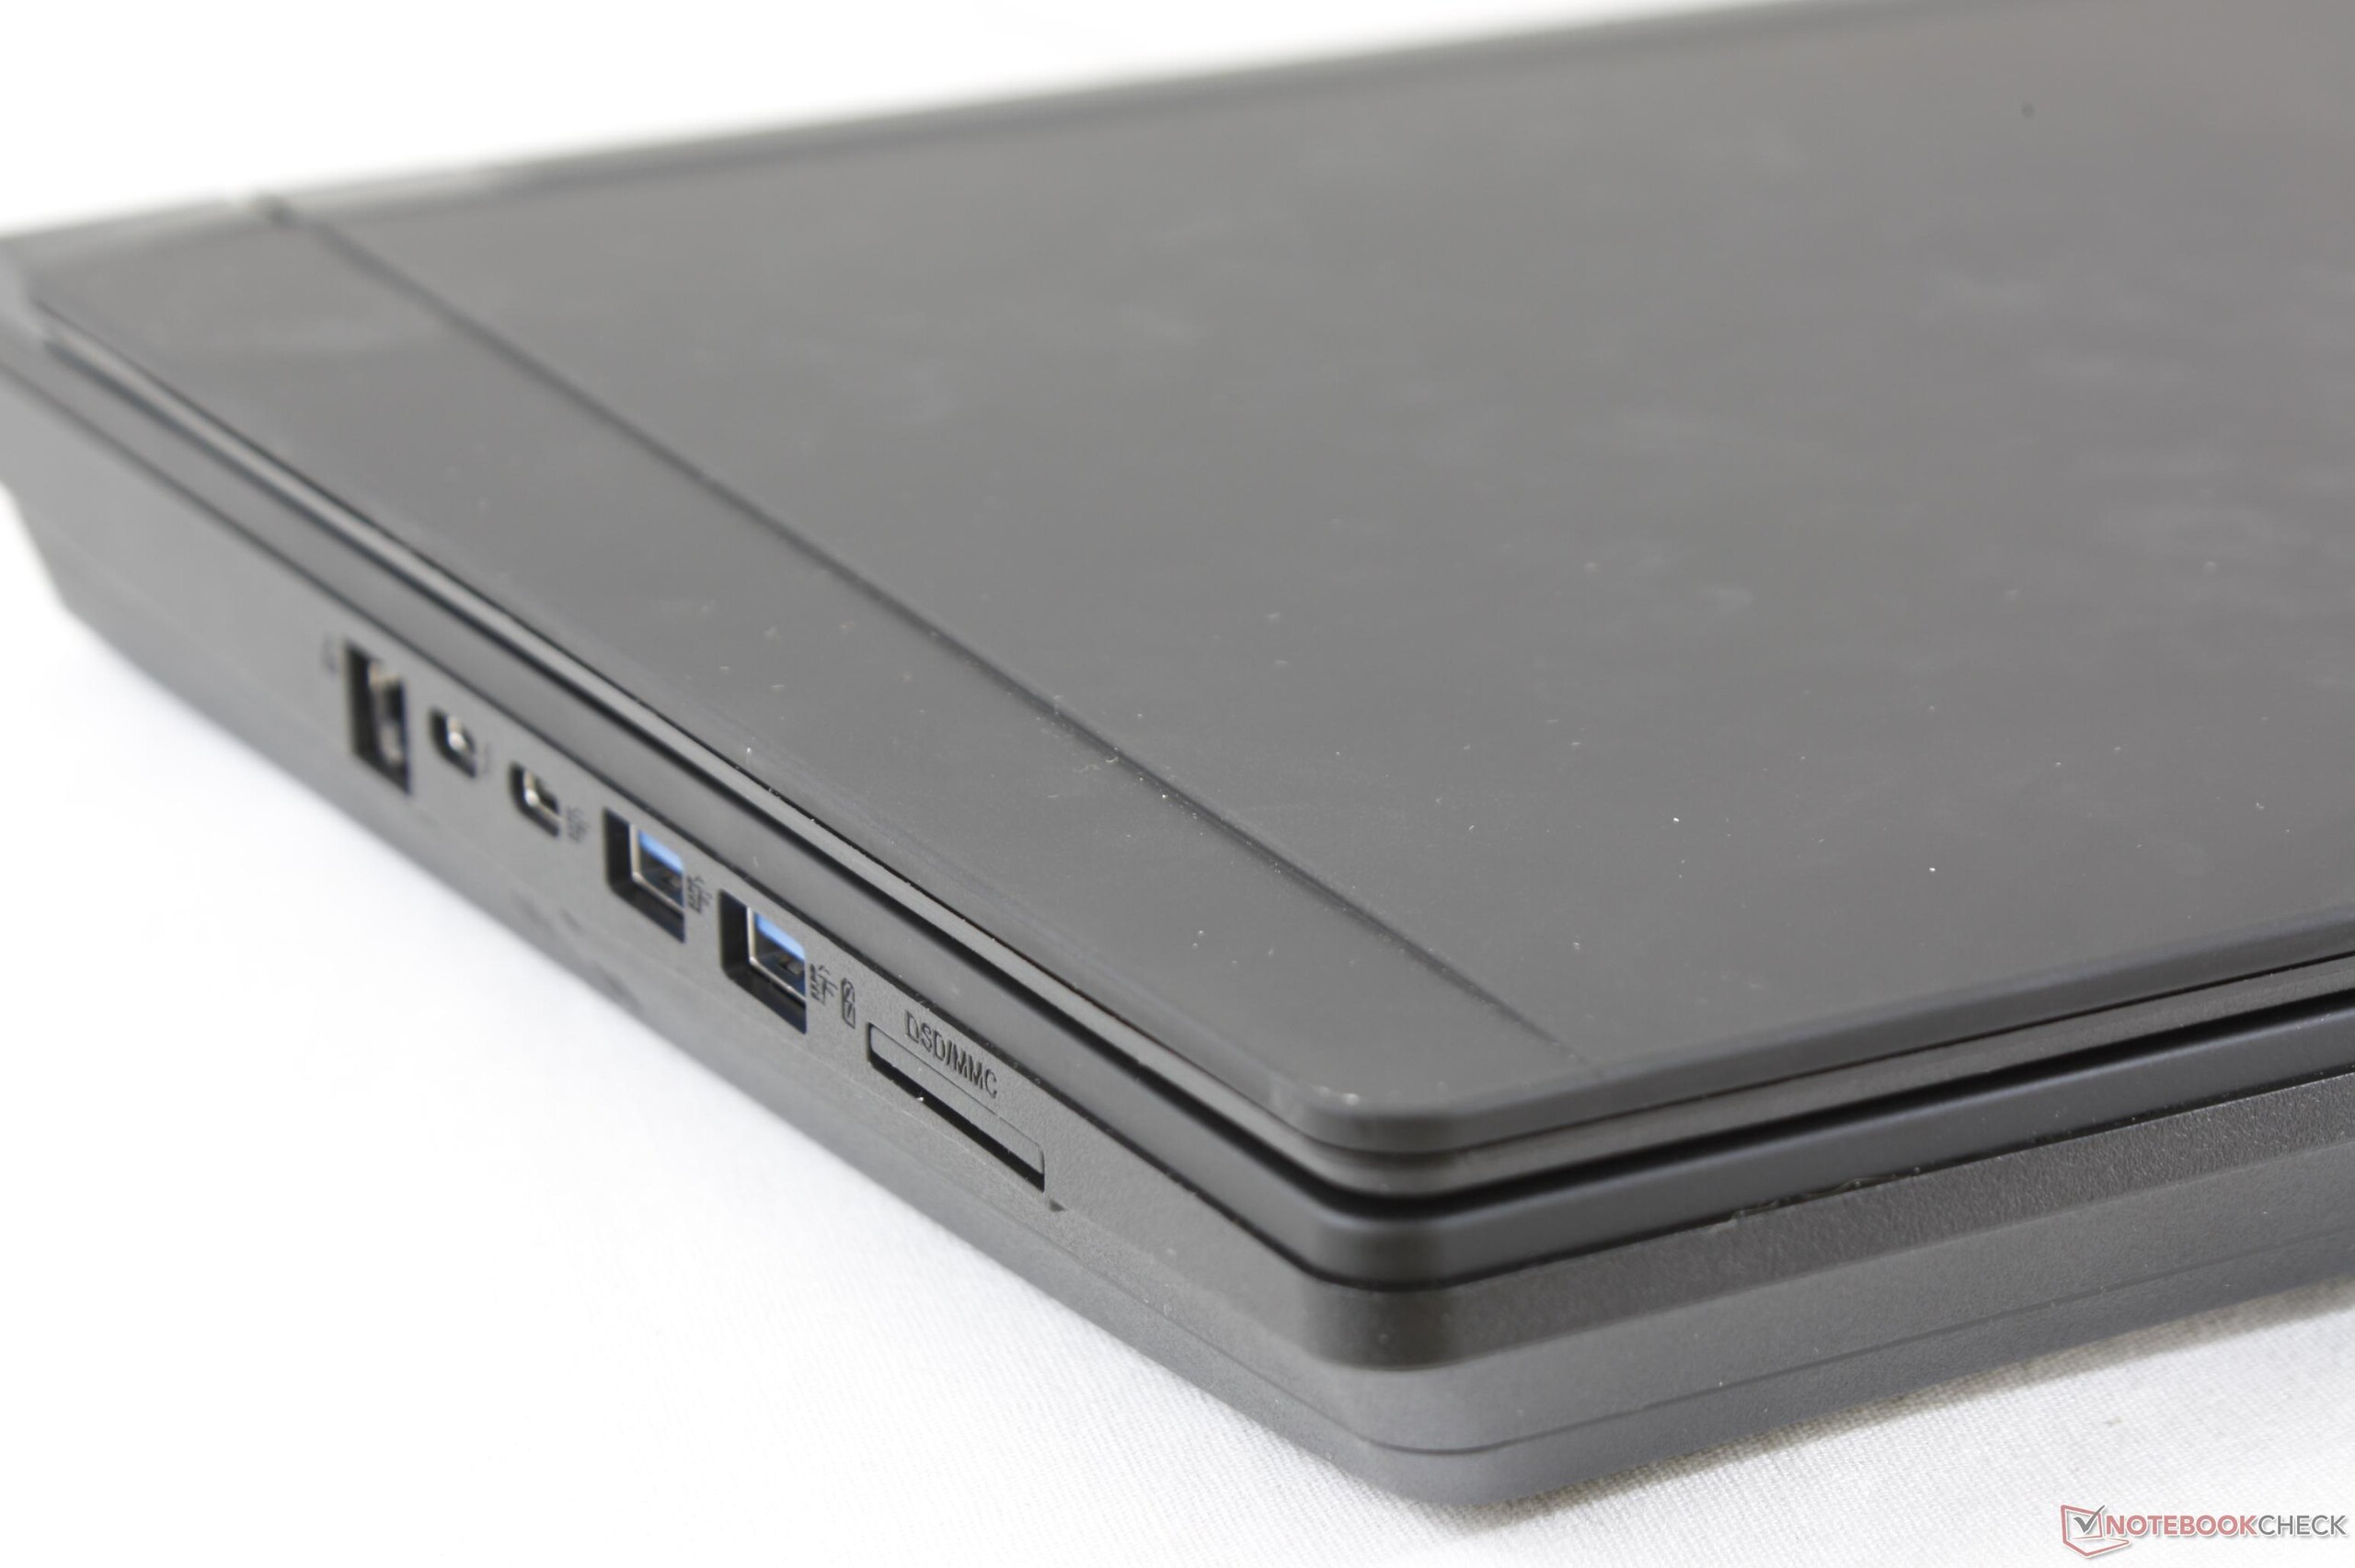
| SD Card Reader | |
| average JPG Copy Test (av. of 3 runs) | |
| Eurocom Sky X4C (Toshiba Exceria Pro SDXC 64 GB UHS-II) | |
| Dell XPS 15 9560 (i7-7700HQ, UHD) (Toshiba Exceria Pro SDXC 64 GB UHS-II) | |
| Acer Predator 15 G9-593-751X (Toshiba Exceria Pro SDXC 64 GB UHS-II) | |
| maximum AS SSD Seq Read Test (1GB) | |
| Dell XPS 15 9560 (i7-7700HQ, UHD) (Toshiba Exceria Pro SDXC 64 GB UHS-II) | |
| Eurocom Sky X4C (Toshiba Exceria Pro SDXC 64 GB UHS-II) | |
| Acer Predator 15 G9-593-751X (Toshiba Exceria Pro SDXC 64 GB UHS-II) | |
| Networking | |
| iperf3 transmit AX12 | |
| Acer Predator 15 G9-593-751X | |
| Eurocom Sky X4C | |
| MSI GT62VR 7RE-223 | |
| iperf3 receive AX12 | |
| Acer Predator 15 G9-593-751X | |
| MSI GT62VR 7RE-223 | |
| Eurocom Sky X4C | |
| |||||||||||||||||||||||||
Distribuzione della luminosità: 81 %
Al centro con la batteria: 324.7 cd/m²
Contrasto: 1249:1 (Nero: 0.26 cd/m²)
ΔE ColorChecker Calman: 4.67 | ∀{0.5-29.43 Ø4.71}
ΔE Greyscale Calman: 5.9 | ∀{0.09-98 Ø4.96}
96.1% sRGB (Argyll 1.6.3 3D)
61.1% AdobeRGB 1998 (Argyll 1.6.3 3D)
67.2% AdobeRGB 1998 (Argyll 3D)
96.5% sRGB (Argyll 3D)
65.1% Display P3 (Argyll 3D)
Gamma: 2.14
CCT: 7176 K
| Eurocom Sky X4C ID: SHP142A, Name: LQ156D1JX01B, IPS, 15.6", 3840x2160 | MSI GT62VR 7RE-223 LG Philips LP156WF6 (LGD046F), IPS, 15.6", 1920x1080 | Alienware 15 R3 HPJGK_B156HTN (AUO51ED), TN, 15.6", 1920x1080 | Asus Strix GL502VS-FY032T LG Philips LP156WF6-SPB6 (LGD046F), IPS, 15.6", 1920x1080 | EVGA SC15 ID: AUO42ED, Name: AU Optronics B156HAN04.2, , 15.6", 1920x1080 | Dell XPS 15 9560 (i7-7700HQ, UHD) IGZO IPS, 15.6", 3840x2160 | |
|---|---|---|---|---|---|---|
| Display | -9% | -2% | -8% | -5% | 30% | |
| Display P3 Coverage (%) | 65.1 | 63.9 -2% | 66 1% | 64.5 -1% | 62.3 -4% | 89.7 38% |
| sRGB Coverage (%) | 96.5 | 83.1 -14% | 90.5 -6% | 83.1 -14% | 89.6 -7% | 100 4% |
| AdobeRGB 1998 Coverage (%) | 67.2 | 60.8 -10% | 66.2 -1% | 60.8 -10% | 63.6 -5% | 100 49% |
| Response Times | 8% | 45% | 9% | -9% | -44% | |
| Response Time Grey 50% / Grey 80% * (ms) | 33.6 ? | 37 ? -10% | 25 ? 26% | 38 ? -13% | 41.6 ? -24% | 57.2 ? -70% |
| Response Time Black / White * (ms) | 33.2 ? | 25 ? 25% | 12 ? 64% | 23 ? 31% | 30.8 ? 7% | 39.2 ? -18% |
| PWM Frequency (Hz) | 1000 ? | 962 | ||||
| Screen | -5% | -33% | -6% | -1% | 1% | |
| Brightness middle (cd/m²) | 324.7 | 310 -5% | 386 19% | 315 -3% | 281.5 -13% | 370.1 14% |
| Brightness (cd/m²) | 318 | 311 -2% | 382 20% | 290 -9% | 253 -20% | 356 12% |
| Brightness Distribution (%) | 81 | 85 5% | 93 15% | 85 5% | 73 -10% | 87 7% |
| Black Level * (cd/m²) | 0.26 | 0.3 -15% | 0.39 -50% | 0.32 -23% | 0.27 -4% | 0.37 -42% |
| Contrast (:1) | 1249 | 1033 -17% | 990 -21% | 984 -21% | 1043 -16% | 1000 -20% |
| Colorchecker dE 2000 * | 4.67 | 4.82 -3% | 10.2 -118% | 4.88 -4% | 3.9 16% | 5.3 -13% |
| Colorchecker dE 2000 max. * | 8.16 | 10.14 -24% | 15.81 -94% | 8.88 -9% | 7.1 13% | 9.9 -21% |
| Greyscale dE 2000 * | 5.9 | 3.94 33% | 11.28 -91% | 4.17 29% | 3.8 36% | 4.6 22% |
| Gamma | 2.14 103% | 2.45 90% | 2.23 99% | 2.53 87% | 2.27 97% | 2.31 95% |
| CCT | 7176 91% | 6877 95% | 11383 57% | 6683 97% | 7322 89% | 6284 103% |
| Color Space (Percent of AdobeRGB 1998) (%) | 61.1 | 54 -12% | 59 -3% | 55 -10% | 57.8 -5% | 88.3 45% |
| Color Space (Percent of sRGB) (%) | 96.1 | 83 -14% | 90 -6% | 83 -14% | 89.3 -7% | 100 4% |
| Media totale (Programma / Settaggio) | -2% /
-4% | 3% /
-16% | -2% /
-4% | -5% /
-3% | -4% /
1% |
* ... Meglio usare valori piccoli
Tempi di risposta del Display
| ↔ Tempi di risposta dal Nero al Bianco | ||
|---|---|---|
| 33.2 ms ... aumenta ↗ e diminuisce ↘ combinato | ↗ 21.2 ms Incremento | 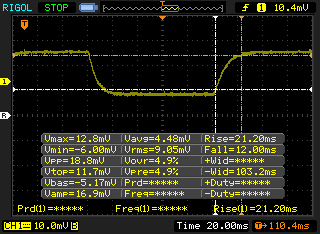 |
| ↘ 12 ms Calo | ||
| Lo schermo mostra tempi di risposta lenti nei nostri tests e sarà insoddisfacente per i gamers. In confronto, tutti i dispositivi di test variano da 0.1 (minimo) a 240 (massimo) ms. » 90 % di tutti i dispositivi è migliore. Questo significa che i tempi di risposta rilevati sono peggiori rispetto alla media di tutti i dispositivi testati (19.8 ms). | ||
| ↔ Tempo di risposta dal 50% Grigio all'80% Grigio | ||
| 33.6 ms ... aumenta ↗ e diminuisce ↘ combinato | ↗ 19.6 ms Incremento | 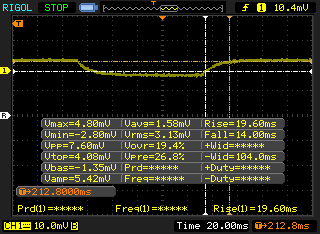 |
| ↘ 14 ms Calo | ||
| Lo schermo mostra tempi di risposta lenti nei nostri tests e sarà insoddisfacente per i gamers. In confronto, tutti i dispositivi di test variano da 0.165 (minimo) a 636 (massimo) ms. » 46 % di tutti i dispositivi è migliore. Questo significa che i tempi di risposta rilevati sono simili alla media di tutti i dispositivi testati (31 ms). | ||
Sfarfallio dello schermo / PWM (Pulse-Width Modulation)
| flickering dello schermo / PWM rilevato | 1000 Hz | ≤ 20 % settaggio luminosita' | 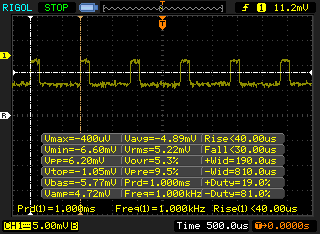 |
Il display sfarfalla a 1000 Hz (Probabilmente a causa dell'uso di PWM) Flickering rilevato ad una luminosita' di 20 % o inferiore. Non dovrebbe verificarsi flickering o PWM sopra questo valore di luminosita'. La frequenza di 1000 Hz è abbastanza alta, quindi la maggioranza degli utenti sensibili al PWM non dovrebbero notare alcun flickering. In confronto: 52 % di tutti i dispositivi testati non utilizza PWM per ridurre la luminosita' del display. Se è rilevato PWM, una media di 7754 (minimo: 5 - massimo: 343500) Hz è stata rilevata. | |||
| Cinebench R15 | |
| CPU Single 64Bit | |
| Eurocom Sky X4C | |
| Eurocom Tornado F5 | |
| Eurocom Sky X9C | |
| Smart7 Karme GX17E G2 | |
| Eurocom Tornado F5 Killer Edition | |
| Alienware 15 R3 Max-Q | |
| Eurocom Sky X7E2 | |
| AMD Ryzen 1800X - Asus Crosshair VI Hero | |
| Asus GL702ZC-GC104T | |
| Apple MacBook Pro 15 2016 (2.6 GHz, 450) | |
| Asus GL503VD-DB74 | |
| Dell Inspiron 15 7000 7577 | |
| CPU Multi 64Bit | |
| AMD Ryzen 1800X - Asus Crosshair VI Hero | |
| Asus GL702ZC-GC104T | |
| Eurocom Sky X9C | |
| Eurocom Sky X4C | |
| Smart7 Karme GX17E G2 | |
| Eurocom Tornado F5 | |
| Eurocom Sky X7E2 | |
| Alienware 15 R3 Max-Q | |
| Asus GL503VD-DB74 | |
| Apple MacBook Pro 15 2016 (2.6 GHz, 450) | |
| Eurocom Tornado F5 Killer Edition | |
| Dell Inspiron 15 7000 7577 | |
| Cinebench R11.5 | |
| CPU Single 64Bit | |
| Eurocom Sky X9C | |
| Eurocom Tornado F5 | |
| Eurocom Sky X4C | |
| Eurocom Tornado F5 Killer Edition | |
| Alienware 15 R3 Max-Q | |
| Asus GL503VD-DB74 | |
| AMD Ryzen 1800X - Asus Crosshair VI Hero | |
| Eurocom Sky X7E2 | |
| Asus GL702ZC-GC104T | |
| Apple MacBook Pro 15 2016 (2.6 GHz, 450) | |
| Dell Inspiron 15 7000 7577 | |
| CPU Multi 64Bit | |
| AMD Ryzen 1800X - Asus Crosshair VI Hero | |
| Asus GL702ZC-GC104T | |
| Eurocom Sky X9C | |
| Eurocom Sky X4C | |
| Eurocom Tornado F5 | |
| Eurocom Sky X7E2 | |
| Alienware 15 R3 Max-Q | |
| Asus GL503VD-DB74 | |
| Eurocom Tornado F5 Killer Edition | |
| Apple MacBook Pro 15 2016 (2.6 GHz, 450) | |
| Dell Inspiron 15 7000 7577 | |
| Cinebench R10 | |
| Rendering Multiple CPUs 32Bit | |
| Eurocom Sky X9C | |
| Eurocom Sky X4C | |
| AMD Ryzen 1800X - Asus Crosshair VI Hero | |
| Asus GL702ZC-GC104T | |
| Eurocom Tornado F5 | |
| Eurocom Sky X7E2 | |
| Eurocom Tornado F5 Killer Edition | |
| Alienware 15 R3 Max-Q | |
| Asus GL503VD-DB74 | |
| Dell Inspiron 15 7000 7577 | |
| Rendering Single 32Bit | |
| Eurocom Sky X9C | |
| Eurocom Sky X4C | |
| Eurocom Tornado F5 | |
| Eurocom Tornado F5 Killer Edition | |
| Eurocom Sky X7E2 | |
| Alienware 15 R3 Max-Q | |
| Asus GL503VD-DB74 | |
| Dell Inspiron 15 7000 7577 | |
| AMD Ryzen 1800X - Asus Crosshair VI Hero | |
| Asus GL702ZC-GC104T | |
| wPrime 2.10 - 1024m | |
| Dell Inspiron 15 7000 7577 | |
| Eurocom Tornado F5 Killer Edition | |
| Asus GL503VD-DB74 | |
| Eurocom Sky X7E2 | |
| Smart7 Karme GX17E G2 | |
| Eurocom Tornado F5 | |
| Eurocom Sky X4C | |
| Eurocom Sky X9C | |
| AMD Ryzen 1800X - Asus Crosshair VI Hero | |
* ... Meglio usare valori piccoli
| PCMark 8 | |
| Home Score Accelerated v2 | |
| Eurocom Sky X4C | |
| Acer Predator 15 G9-593-751X | |
| EVGA SC15 | |
| MSI GT62VR 7RE-223 | |
| Eurocom Sky X9C | |
| Alienware 15 R3 | |
| Asus Strix GL502VS-FY032T | |
| Work Score Accelerated v2 | |
| Acer Predator 15 G9-593-751X | |
| MSI GT62VR 7RE-223 | |
| EVGA SC15 | |
| Alienware 15 R3 | |
| Eurocom Sky X4C | |
| Eurocom Sky X9C | |
| Asus Strix GL502VS-FY032T | |
| Creative Score Accelerated v2 | |
| Eurocom Sky X9C | |
| Eurocom Sky X4C | |
| Acer Predator 15 G9-593-751X | |
| MSI GT62VR 7RE-223 | |
| Alienware 15 R3 | |
| EVGA SC15 | |
| PCMark 10 - Score | |
| Eurocom Sky X4C | |
| Eurocom Sky X9C | |
| PCMark 8 Home Score Accelerated v2 | 5225 punti | |
| PCMark 8 Creative Score Accelerated v2 | 9222 punti | |
| PCMark 8 Work Score Accelerated v2 | 5181 punti | |
| PCMark 10 Score | 6620 punti | |
Aiuto | ||
| Eurocom Sky X4C Samsung SSD 960 Pro 1TB m.2 NVMe | Acer Predator 15 G9-593-751X Samsung SM951 MZVPV256HDGL m.2 PCI-e | MSI GT62VR 7RE-223 Samsung SSD PM871a MZNLN256HMHQ | Asus Strix GL502VS-FY032T SanDisk SD8SNAT256G1002 | EVGA SC15 Toshiba NVMe THNSN5256GPU7 | |
|---|---|---|---|---|---|
| AS SSD | -30% | -74% | -123% | -35% | |
| Copy Game MB/s (MB/s) | 1055 | 1091 3% | 377.8 -64% | 977 -7% | |
| Copy Program MB/s (MB/s) | 467.2 | 488.6 5% | 199 -57% | 442.3 -5% | |
| Copy ISO MB/s (MB/s) | 1908 | 1575 -17% | 354.7 -81% | 1071 -44% | |
| Score Total (Points) | 4615 | 2574 -44% | 1019 -78% | 598 -87% | 2474 -46% |
| Score Write (Points) | 1703 | 570 -67% | 304 -82% | 288 -83% | 896 -47% |
| Score Read (Points) | 1945 | 1350 -31% | 472 -76% | 207 -89% | 1081 -44% |
| Access Time Write * (ms) | 0.03 | 0.032 -7% | 0.037 -23% | 0.161 -437% | 0.035 -17% |
| Access Time Read * (ms) | 0.032 | 0.059 -84% | 0.1 -213% | 0.097 -203% | 0.054 -69% |
| 4K-64 Write (MB/s) | 1375 | 346 -75% | 171.6 -88% | 191.8 -86% | 706 -49% |
| 4K-64 Read (MB/s) | 1646 | 1109 -33% | 383.4 -77% | 140.7 -91% | 822 -50% |
| 4K Write (MB/s) | 129.6 | 117.3 -9% | 104 -20% | 65.5 -49% | 95.5 -26% |
| 4K Read (MB/s) | 44.83 | 46.35 3% | 37.2 -17% | 16.31 -64% | 39.13 -13% |
| Seq Write (MB/s) | 1989 | 1067 -46% | 288.2 -86% | 309.9 -84% | 943 -53% |
| Seq Read (MB/s) | 2541 | 1941 -24% | 510 -80% | 504 -80% | 2203 -13% |
* ... Meglio usare valori piccoli

| 3DMark | |
| 1920x1080 Fire Strike Graphics | |
| Eurocom Sky X9C | |
| Aorus X9 | |
| Nvidia GeForce GTX 1080 Ti Founders Edition | |
| Eurocom Sky X4C | |
| Nvidia GeForce GTX 1080 Founders Edition | |
| Razer Blade Pro 2017 | |
| Alienware 15 R3 Max-Q | |
| Nvidia GeForce GTX 1070 Ti Founders Edition | |
| MSI GF72VR 7RF | |
| 3840x2160 Fire Strike Ultra Graphics | |
| Eurocom Sky X9C | |
| Nvidia GeForce GTX 1080 Ti Founders Edition | |
| Eurocom Sky X4C | |
| Nvidia GeForce GTX 1080 Founders Edition | |
| Nvidia GeForce GTX 1070 Ti Founders Edition | |
| Alienware 15 R3 Max-Q | |
| MSI GF72VR 7RF | |
| Fire Strike Extreme Graphics | |
| Eurocom Sky X9C | |
| Eurocom Sky X4C | |
| Nvidia GeForce GTX 1080 Founders Edition | |
| Nvidia GeForce GTX 1070 Ti Founders Edition | |
| Alienware 15 R3 Max-Q | |
| MSI GF72VR 7RF | |
| 3DMark 11 | |
| 1280x720 Performance GPU | |
| Eurocom Sky X9C | |
| Aorus X9 | |
| Nvidia GeForce GTX 1080 Ti Founders Edition | |
| Nvidia GeForce GTX 1080 Founders Edition | |
| Nvidia GeForce GTX 1070 Ti Founders Edition | |
| Eurocom Sky X4C | |
| Razer Blade Pro 2017 | |
| Alienware 15 R3 Max-Q | |
| MSI GF72VR 7RF | |
| 1280x720 Performance Combined | |
| Nvidia GeForce GTX 1070 Ti Founders Edition | |
| Eurocom Sky X9C | |
| Eurocom Sky X4C | |
| Nvidia GeForce GTX 1080 Founders Edition | |
| Nvidia GeForce GTX 1080 Ti Founders Edition | |
| Razer Blade Pro 2017 | |
| Aorus X9 | |
| Alienware 15 R3 Max-Q | |
| MSI GF72VR 7RF | |
| 3DMark 11 Performance | 22125 punti | |
| 3DMark Ice Storm Standard Score | 194644 punti | |
| 3DMark Cloud Gate Standard Score | 41694 punti | |
| 3DMark Fire Strike Score | 18551 punti | |
| 3DMark Fire Strike Extreme Score | 9551 punti | |
Aiuto | ||
| Rise of the Tomb Raider - 3840x2160 High Preset AA:FX AF:4x | |
| Eurocom Sky X9C | |
| Nvidia GeForce GTX 1080 Ti Founders Edition | |
| Nvidia GeForce GTX 1080 Ti Founders Edition | |
| Eurocom Sky X4C | |
| Nvidia GeForce GTX 1080 Founders Edition | |
| Nvidia GeForce GTX 1080 Founders Edition | |
| Nvidia GeForce GTX 1070 Ti Founders Edition | |
| Asus Zephyrus GX501 | |
| Eurocom Q5 | |
| Fallout 4 - 3840x2160 High Preset AA:T AF:16x | |
| Eurocom Sky X9C | |
| Nvidia GeForce GTX 1080 Ti Founders Edition | |
| Nvidia GeForce GTX 1080 Founders Edition | |
| Eurocom Sky X4C | |
| Eurocom Q5 | |
| basso | medio | alto | ultra | 4K | |
|---|---|---|---|---|---|
| BioShock Infinite (2013) | 181.2 | ||||
| Metro: Last Light (2013) | 141.1 | ||||
| Thief (2014) | 127.6 | ||||
| The Witcher 3 (2015) | 75.3 | 53.4 | |||
| Batman: Arkham Knight (2015) | 101 | 55 | |||
| Metal Gear Solid V (2015) | 60 | 60 | |||
| Fallout 4 (2015) | 123.4 | 53.4 | |||
| Rise of the Tomb Raider (2016) | 111.7 | 50.6 | |||
| Overwatch (2016) | 195.6 | 92.1 | |||
| Mafia 3 (2016) | 81.2 | 32.5 | |||
| Prey (2017) | 143 | 70.9 | |||
| Middle-earth: Shadow of War (2017) | 94 | 37 | |||
| Destiny 2 (2017) | 139.1 | 38.4 |
Rumorosità
| Idle |
| 28.6 / 28.6 / 31.1 dB(A) |
| HDD |
| 0 dB(A) |
| Sotto carico |
| 42.2 / 50 dB(A) |
 | ||
30 dB silenzioso 40 dB(A) udibile 50 dB(A) rumoroso |
||
min: | ||
| Eurocom Sky X4C GeForce GTX 1080 Mobile, i7-8700K, Samsung SSD 960 Pro 1TB m.2 NVMe | Alienware 15 R3 Max-Q GeForce GTX 1080 Max-Q, i7-7820HK, LiteOn CX2-8B256 | MSI GT62VR 7RE-223 GeForce GTX 1070 Mobile, i7-7700HQ, Samsung SSD PM871a MZNLN256HMHQ | Asus Strix GL502VS-FY032T GeForce GTX 1070 Mobile, 6700HQ, SanDisk SD8SNAT256G1002 | EVGA SC15 GeForce GTX 1060 Mobile, i7-7700HQ, Toshiba NVMe THNSN5256GPU7 | Alienware 15 R3 GeForce GTX 1070 Mobile, i7-7700HQ | |
|---|---|---|---|---|---|---|
| Noise | -6% | -8% | -6% | 1% | -13% | |
| off /ambiente * (dB) | 28.6 | 29 -1% | 30 -5% | 30 -5% | 28 2% | 30 -5% |
| Idle Minimum * (dB) | 28.6 | 32 -12% | 34 -19% | 32 -12% | 31.9 -12% | 31 -8% |
| Idle Average * (dB) | 28.6 | 33 -15% | 35 -22% | 33 -15% | 32 -12% | 32 -12% |
| Idle Maximum * (dB) | 31.1 | 35 -13% | 36 -16% | 34 -9% | 32 -3% | 42 -35% |
| Load Average * (dB) | 42.2 | 46 -9% | 40 5% | 39 8% | 36.5 14% | 49 -16% |
| Witcher 3 ultra * (dB) | 53.8 | 48 11% | 40.3 25% | |||
| Load Maximum * (dB) | 50 | 50 -0% | 46 8% | 51 -2% | 53.4 -7% | 50 -0% |
* ... Meglio usare valori piccoli
(±) La temperatura massima sul lato superiore è di 43.8 °C / 111 F, rispetto alla media di 40.4 °C / 105 F, che varia da 21.2 a 68.8 °C per questa classe Gaming.
(-) Il lato inferiore si riscalda fino ad un massimo di 49.6 °C / 121 F, rispetto alla media di 43.2 °C / 110 F
(+) In idle, la temperatura media del lato superiore è di 26.4 °C / 80 F, rispetto alla media deld ispositivo di 33.9 °C / 93 F.
(+) Riproducendo The Witcher 3, la temperatura media per il lato superiore e' di 30 °C / 86 F, rispetto alla media del dispositivo di 33.9 °C / 93 F.
(+) I poggiapolsi e il touchpad sono piu' freddi della temperatura della pelle con un massimo di 27.6 °C / 81.7 F e sono quindi freddi al tatto.
(±) La temperatura media della zona del palmo della mano di dispositivi simili e'stata di 28.8 °C / 83.8 F (+1.2 °C / 2.1 F).
| Off / Standby | |
| Idle | |
| Sotto carico |
|
Leggenda:
min: | |
| Eurocom Sky X4C i7-8700K, GeForce GTX 1080 Mobile, Samsung SSD 960 Pro 1TB m.2 NVMe, IPS, 3840x2160, 15.6" | Alienware 15 R3 Max-Q i7-7820HK, GeForce GTX 1080 Max-Q, LiteOn CX2-8B256, IPS, 1920x1080, 15.6" | MSI GT62VR 7RE-223 i7-7700HQ, GeForce GTX 1070 Mobile, Samsung SSD PM871a MZNLN256HMHQ, IPS, 1920x1080, 15.6" | EVGA SC15 i7-7700HQ, GeForce GTX 1060 Mobile, Toshiba NVMe THNSN5256GPU7, , 1920x1080, 15.6" | Alienware 15 R3 i7-7700HQ, GeForce GTX 1070 Mobile, , TN, 1920x1080, 15.6" | Eurocom Tornado F5 Killer Edition i5-7600K, GeForce GTX 1080 Mobile, Samsung SSD 960 Evo 250GB m.2 NVMe, IPS, 3840x2160, 15.6" | |
|---|---|---|---|---|---|---|
| Power Consumption | 18% | 27% | 27% | 28% | -8% | |
| Idle Minimum * (Watt) | 30.2 | 22 27% | 20 34% | 25.8 15% | 19 37% | 28.4 6% |
| Idle Average * (Watt) | 34.7 | 26 25% | 24 31% | 26.6 23% | 23 34% | 32 8% |
| Idle Maximum * (Watt) | 37.8 | 33 13% | 29 23% | 26.7 29% | 29 23% | 33.5 11% |
| Load Average * (Watt) | 130.3 | 86 34% | 82 37% | 80.3 38% | 85 35% | 190.9 -47% |
| Witcher 3 ultra * (Watt) | 172.2 | 159 8% | 121.2 30% | |||
| Load Maximum * (Watt) | 217.7 | 215 1% | 193 11% | 159.3 27% | 192 12% | 259.4 -19% |
* ... Meglio usare valori piccoli
| Eurocom Sky X4C i7-8700K, GeForce GTX 1080 Mobile, 82 Wh | Alienware 15 R3 Max-Q i7-7820HK, GeForce GTX 1080 Max-Q, 99 Wh | MSI GT62VR 7RE-223 i7-7700HQ, GeForce GTX 1070 Mobile, 75 Wh | Asus Strix GL502VS-FY032T 6700HQ, GeForce GTX 1070 Mobile, 62 Wh | EVGA SC15 i7-7700HQ, GeForce GTX 1060 Mobile, 62 Wh | Acer Predator 15 G9-593-751X i7-7700HQ, GeForce GTX 1070 Mobile, 90 Wh | |
|---|---|---|---|---|---|---|
| Autonomia della batteria | 94% | 61% | 12% | 10% | 112% | |
| Reader / Idle (h) | 3 | 7.1 137% | 6.3 110% | 4.1 37% | 3.7 23% | 8.4 180% |
| WiFi v1.3 (h) | 2.6 | 5.4 108% | 4.1 58% | 3.3 27% | 2.8 8% | 5.5 112% |
| Load (h) | 1.4 | 1.9 36% | 1.6 14% | 1 -29% | 1.4 0% | 2 43% |
Pro
Contro
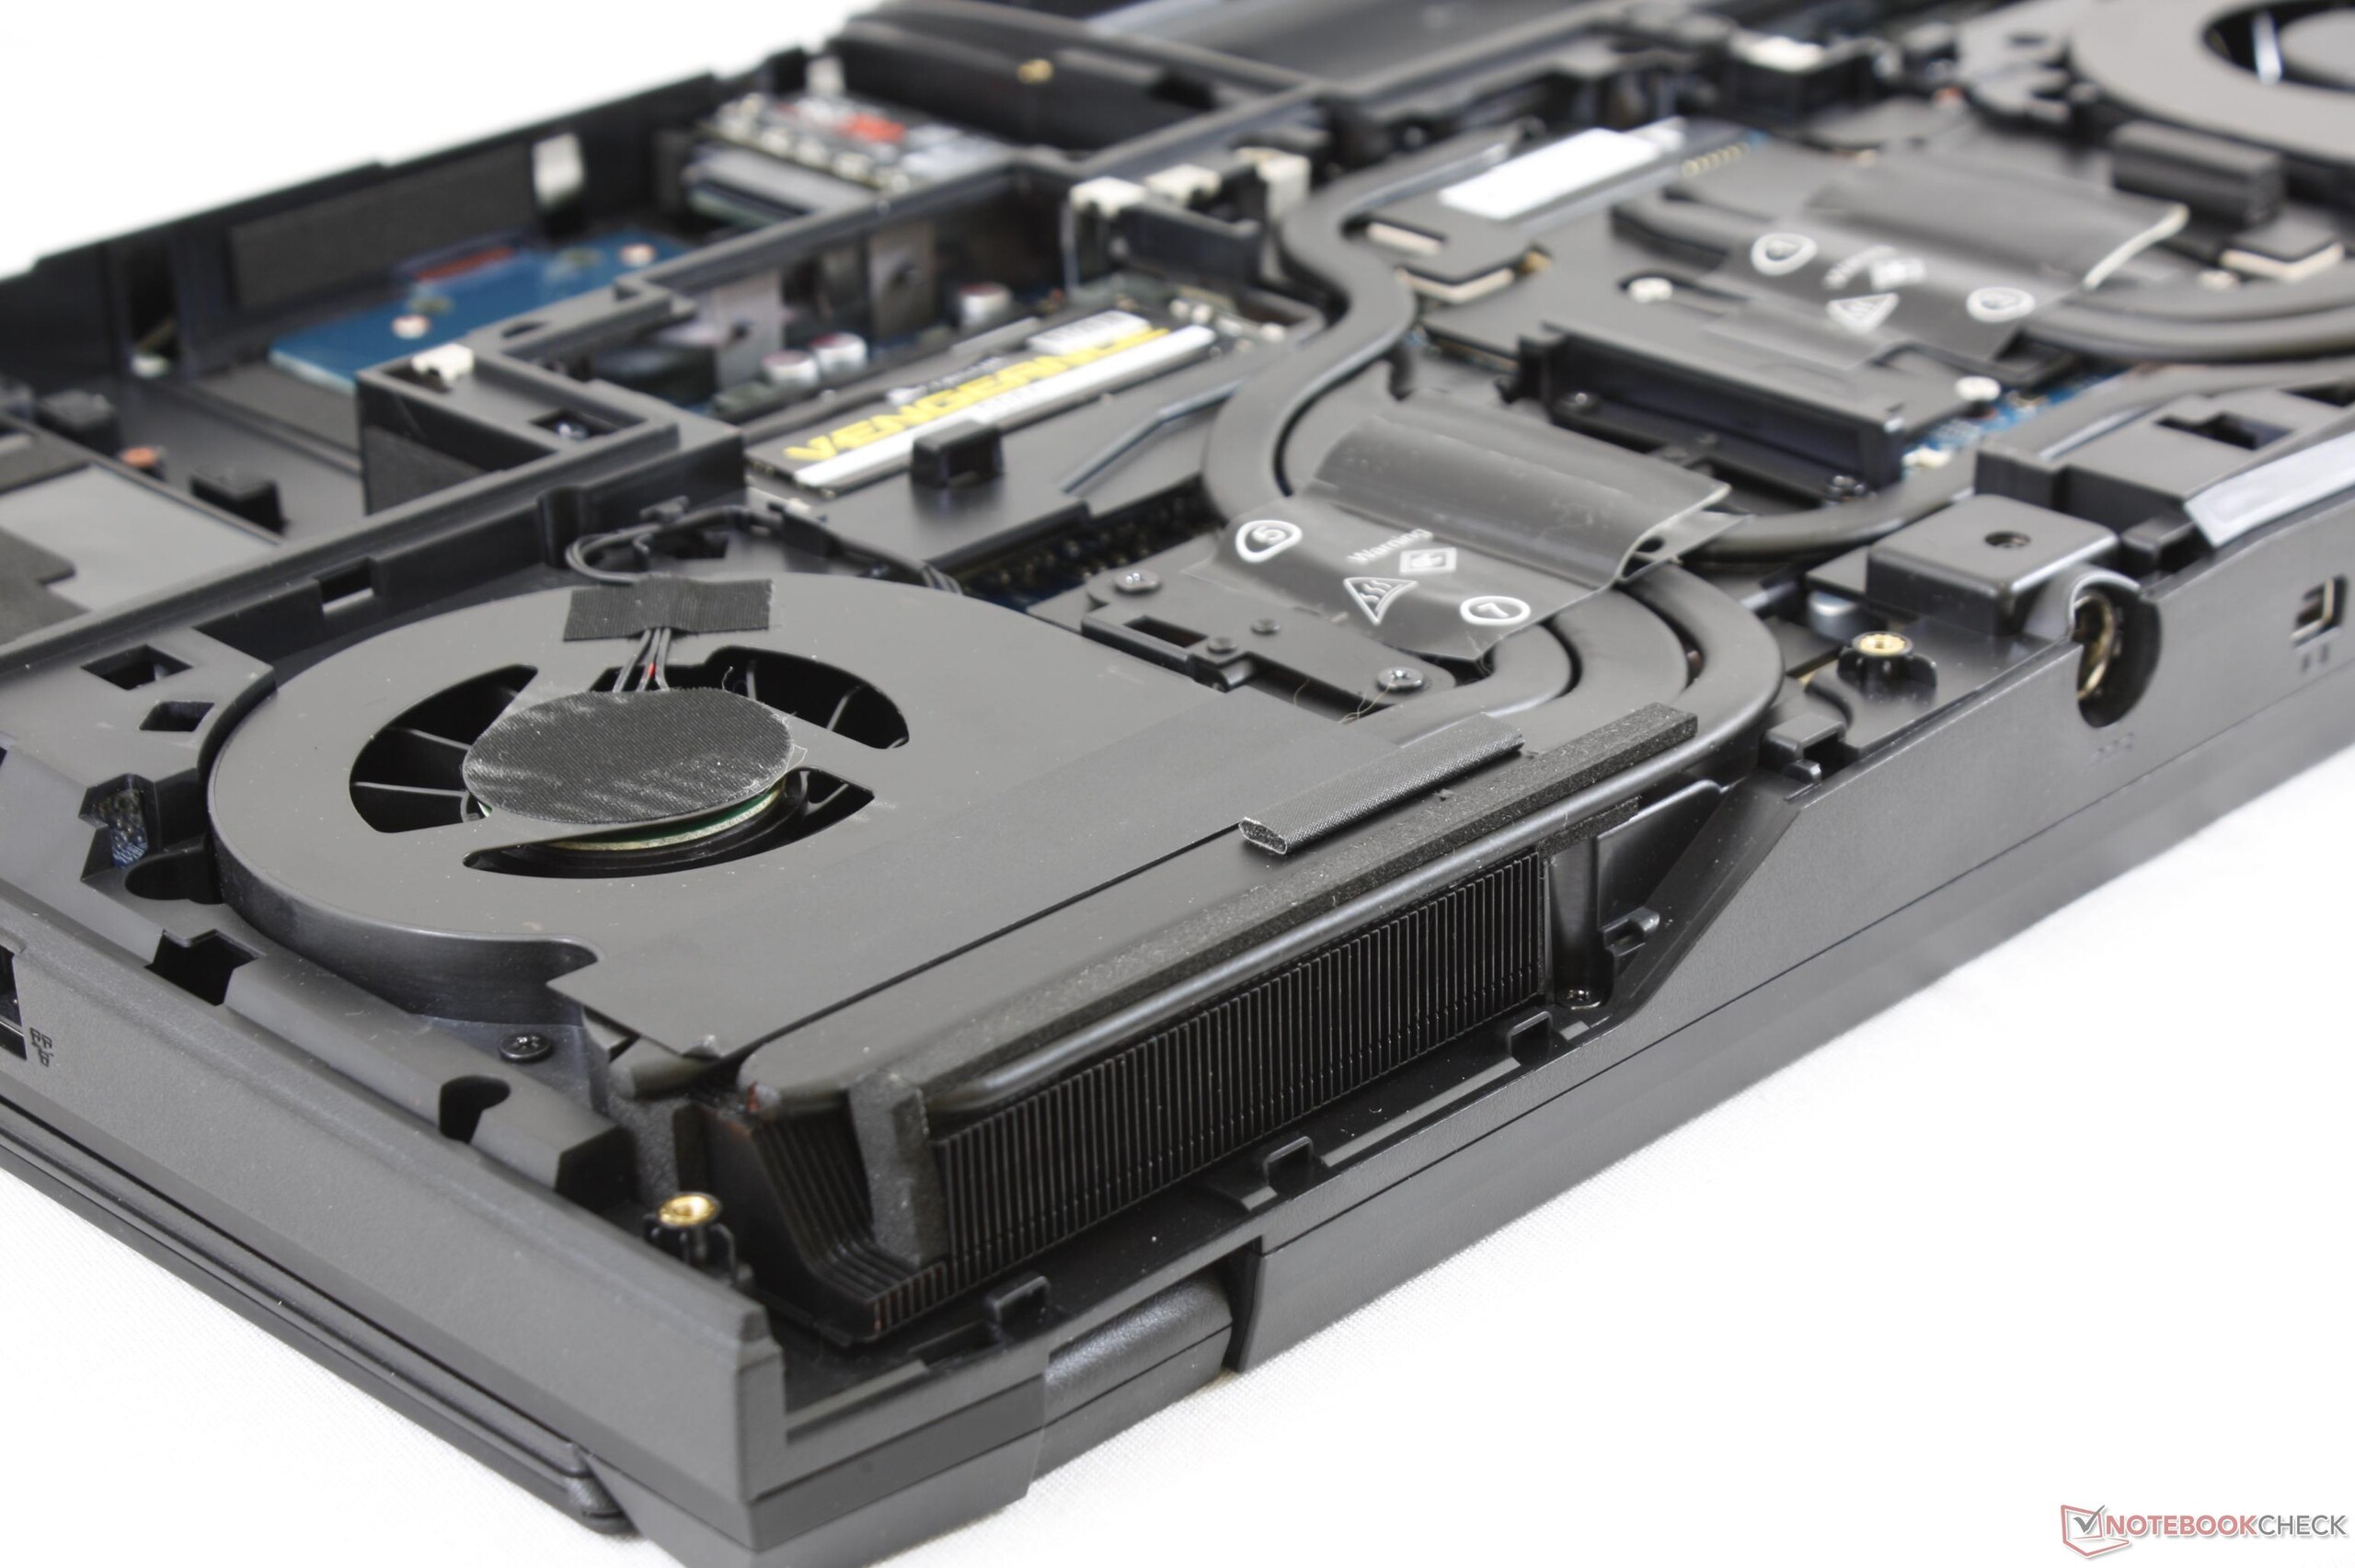
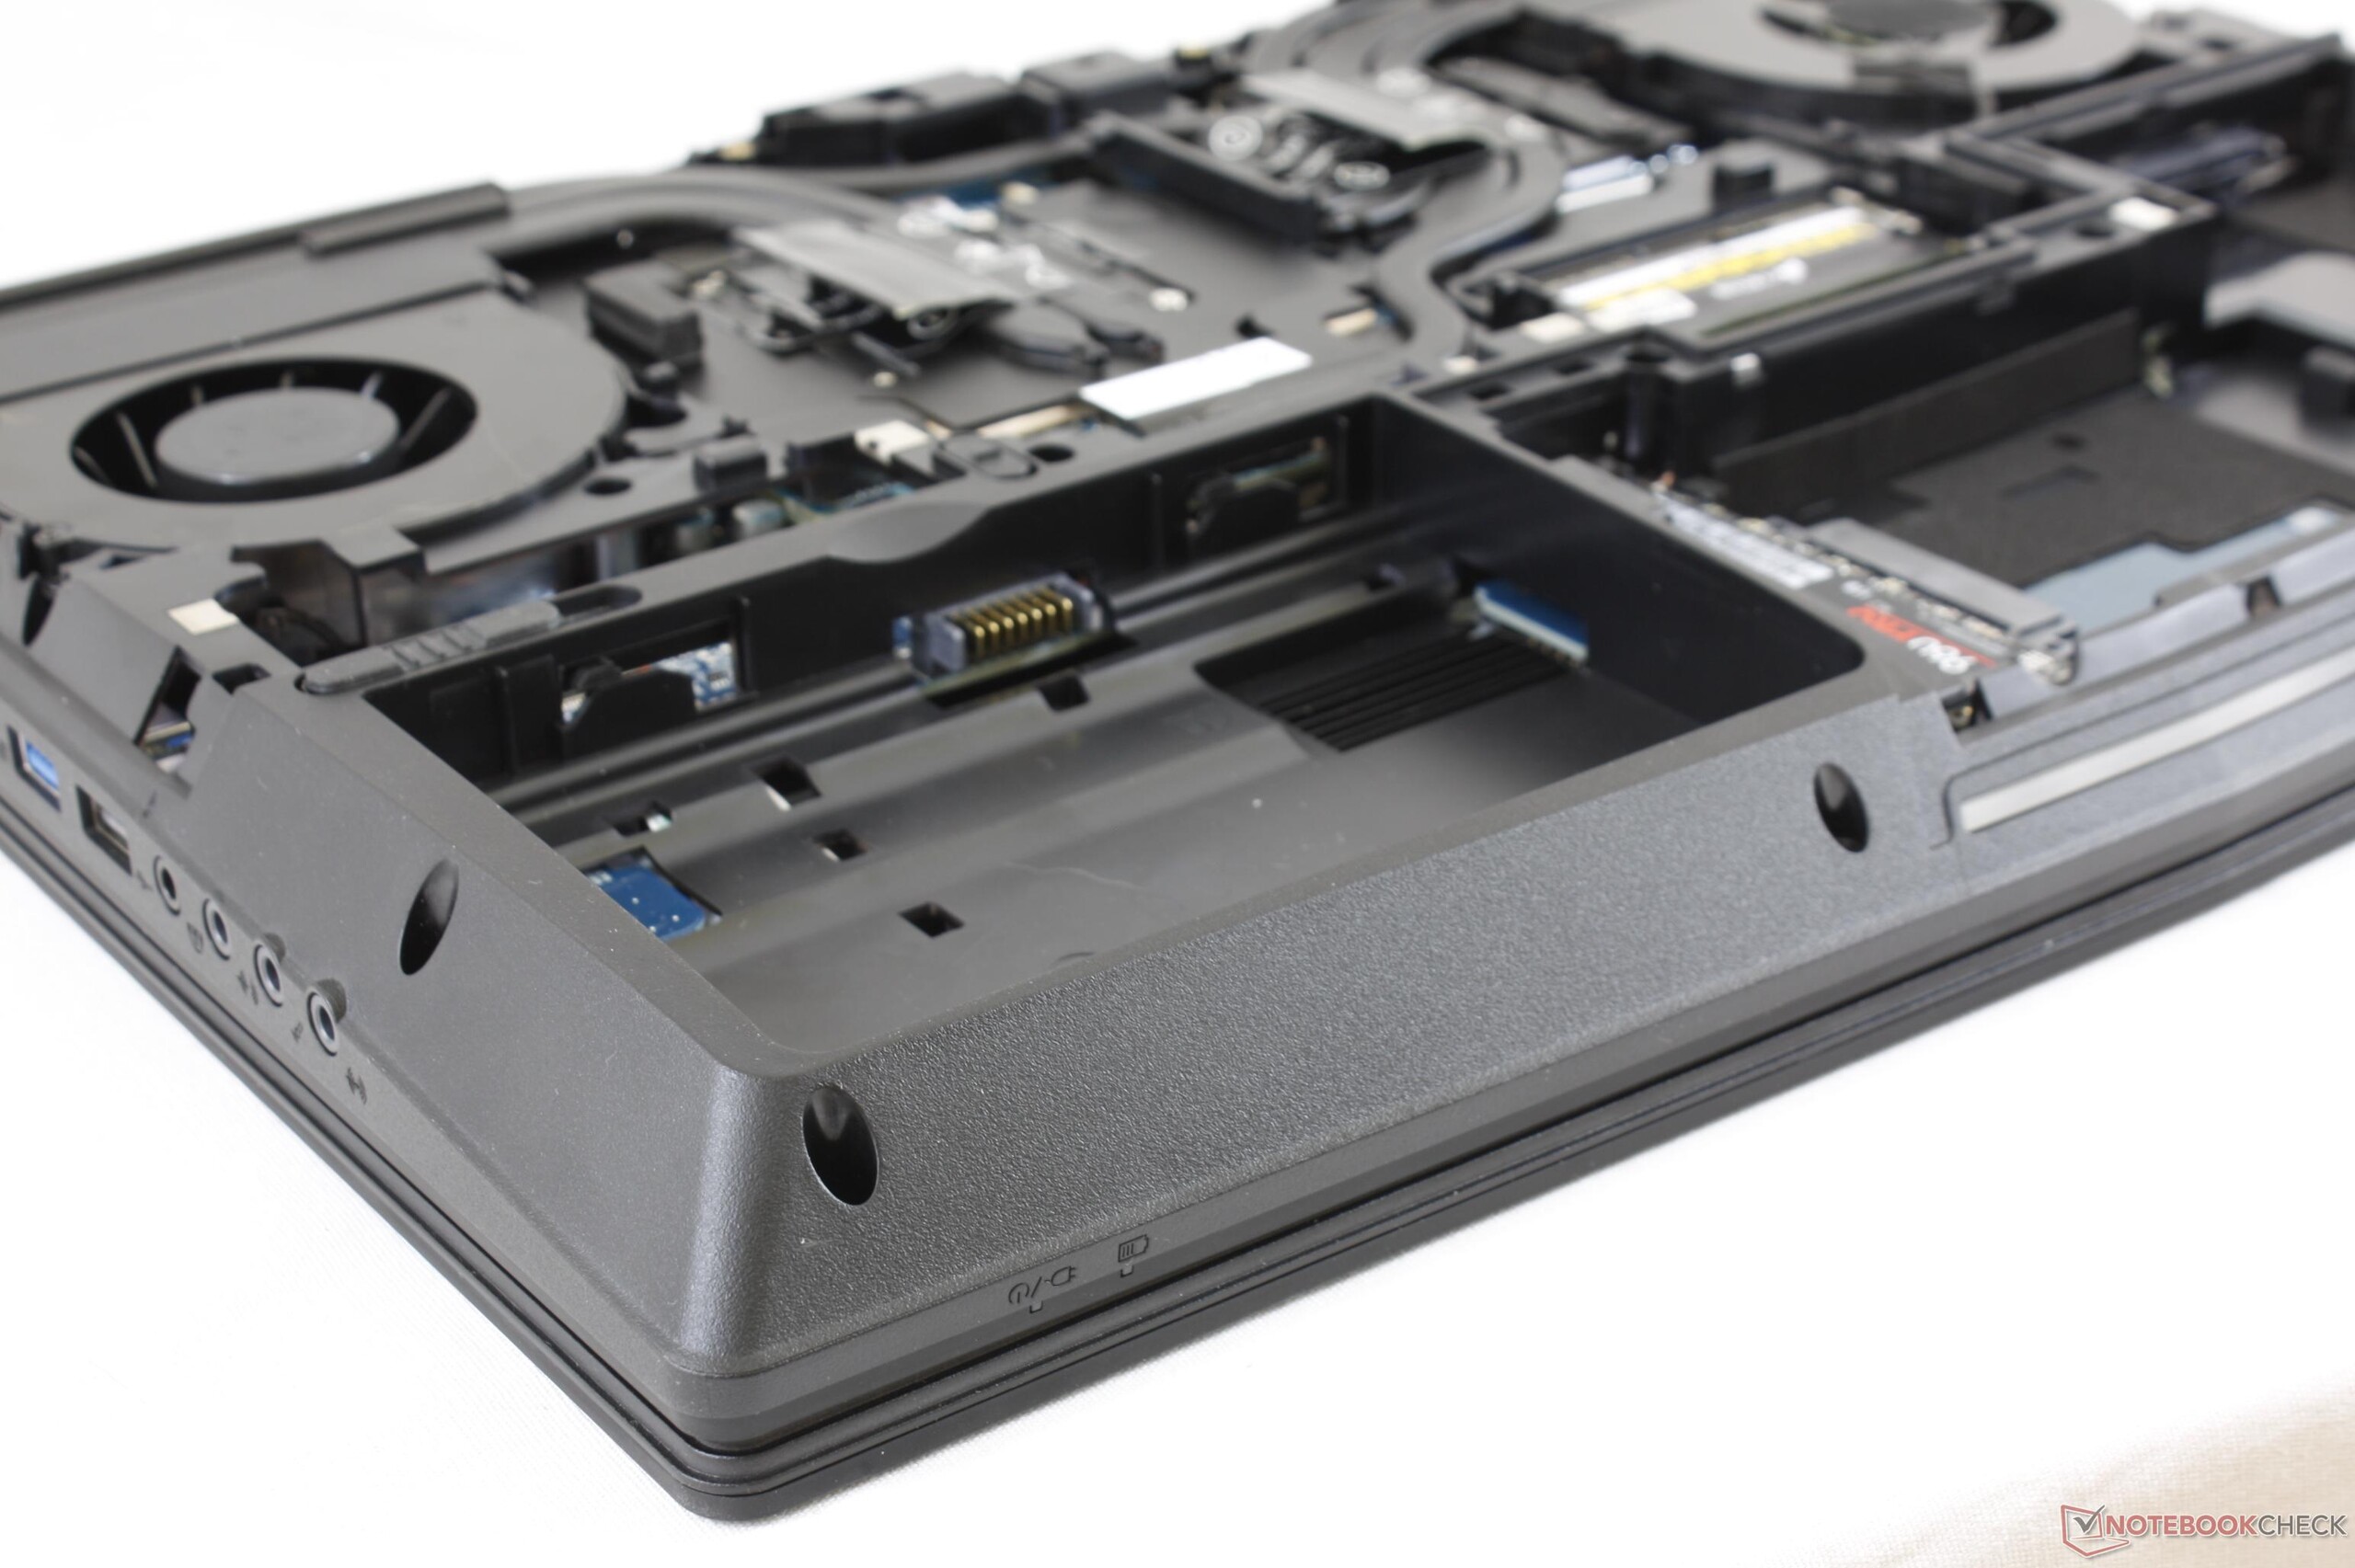
Lo Sky X4C è il più potente e versatile portatile da 15.6" disponibile grazie alla sua possibilità di upgrade simile ad un desktop. Le sue capacità dual-purpose come dispositivo gaming e workstation professionale e le opzioni SIM integrate lo rendono adatto a molti tipi di clienti. Non c'è modo per produttori come Lenovo, HP, o Dell di consentire agli utenti livelli di manutenzione e personalizzazione come quelli offerti dai portatili Eurocom e Clevo. Si tratta di un dispositivo dedicato ai fanatici dei portatili.
Considerando la potenza di questo Eurocom, lo chassis Clevo inizia a mostrare la sua età. Il G-Sync è limitato ad alcune GPUs e non ci sono opzioni per pannelli 3 ms/144 Hz, mancano funzioni touchscreen, oltre a 10 Gbps RJ-45, ed illuminazione RGB per singoli tasti o tasti ausiliari dedicati. Alcuni utenti potrebbero ritenere superflue queste carenze, ma ci saremmo aspettati di più per questo livello di prezzo.
L'hardware ha poche cose degne di nota. La cover gommata attira polvere e sporco e si nota un leggero effetto bleeding della retroilluminazione che fa storcere il naso agli appassionati. Il pannello lucido ma granuloso 4K UHD rende poco attraente questa configurazione e il consumo fluttua quando ci sono carichi di lavoro estremi ed abbiamo qualche preoccupazione riguardo l'utilizzo al 100% di CPU e GPU per lunghi periodi
Questo è il portatile da battere in termini di manutenzione e prestazioni. Tuttavia, c'è molto spazio per miglioramenti in merito a features e rumorosità della ventola.
Nota: si tratta di una recensione breve, con alcune sezioni non tradotte, per la versione integrale in inglese guardate qui.
Eurocom Sky X4C
- 02/11/2018 v6 (old)
Allen Ngo
Price comparison
