Recensione breve del Acer Predator 15 (7700HQ, GTX 1070, Full-HD)
| SD Card Reader | |
| average JPG Copy Test (av. of 3 runs) | |
| MSI GT62VR 7RE-223 | |
| Acer Predator 15 G9-593-751X | |
| Acer Predator 15 G9-593-765Q | |
| Asus Strix GL502VS-FY032T | |
| maximum AS SSD Seq Read Test (1GB) | |
| MSI GT62VR 7RE-223 | |
| Acer Predator 15 G9-593-765Q | |
| Acer Predator 15 G9-593-751X | |
| Asus Strix GL502VS-FY032T | |
| Networking | |
| iperf3 transmit AX12 | |
| Acer Predator 15 G9-593-751X | |
| Acer Predator 15 G9-593-765Q | |
| MSI GT62VR 7RE-223 | |
| Alienware 15 R3 | |
| iperf3 receive AX12 | |
| Acer Predator 15 G9-593-751X | |
| Alienware 15 R3 | |
| Acer Predator 15 G9-593-765Q | |
| MSI GT62VR 7RE-223 | |
| |||||||||||||||||||||||||
Distribuzione della luminosità: 88 %
Al centro con la batteria: 295 cd/m²
Contrasto: 922:1 (Nero: 0.32 cd/m²)
ΔE ColorChecker Calman: 4.59 | ∀{0.5-29.43 Ø4.72}
ΔE Greyscale Calman: 4.03 | ∀{0.09-98 Ø4.97}
85% sRGB (Argyll 1.6.3 3D)
56% AdobeRGB 1998 (Argyll 1.6.3 3D)
62.5% AdobeRGB 1998 (Argyll 3D)
85.5% sRGB (Argyll 3D)
65.4% Display P3 (Argyll 3D)
Gamma: 2.3
CCT: 7229 K
| Acer Predator 15 G9-593-751X LG Philips LP156WF6-SPP1 (LGD04D5), 1920x1080 | Acer Predator 15 G9-593-765Q LG Philips LP156WF6-SPP1 (LGD04D5), 1920x1080 | Alienware 15 R3 HPJGK_B156HTN (AUO51ED), 1920x1080 | MSI GT62VR 7RE-223 LG Philips LP156WF6 (LGD046F), 1920x1080 | Asus Strix GL502VS-FY032T LG Philips LP156WF6-SPB6 (LGD046F), 1920x1080 | |
|---|---|---|---|---|---|
| Display | -2% | 4% | -3% | -2% | |
| Display P3 Coverage (%) | 65.4 | 63.6 -3% | 66 1% | 63.9 -2% | 64.5 -1% |
| sRGB Coverage (%) | 85.5 | 83.9 -2% | 90.5 6% | 83.1 -3% | 83.1 -3% |
| AdobeRGB 1998 Coverage (%) | 62.5 | 61.3 -2% | 66.2 6% | 60.8 -3% | 60.8 -3% |
| Response Times | 4% | 43% | 1% | 4% | |
| Response Time Grey 50% / Grey 80% * (ms) | 36 ? | 35 ? 3% | 25 ? 31% | 37 ? -3% | 38 ? -6% |
| Response Time Black / White * (ms) | 26.4 ? | 25 ? 5% | 12 ? 55% | 25 ? 5% | 23 ? 13% |
| PWM Frequency (Hz) | 20830 ? | ||||
| Screen | 7% | -27% | 3% | 2% | |
| Brightness middle (cd/m²) | 295 | 273 -7% | 386 31% | 310 5% | 315 7% |
| Brightness (cd/m²) | 274 | 267 -3% | 382 39% | 311 14% | 290 6% |
| Brightness Distribution (%) | 88 | 83 -6% | 93 6% | 85 -3% | 85 -3% |
| Black Level * (cd/m²) | 0.32 | 0.27 16% | 0.39 -22% | 0.3 6% | 0.32 -0% |
| Contrast (:1) | 922 | 1011 10% | 990 7% | 1033 12% | 984 7% |
| Colorchecker dE 2000 * | 4.59 | 3.77 18% | 10.2 -122% | 4.82 -5% | 4.88 -6% |
| Colorchecker dE 2000 max. * | 11 | 10.64 3% | 15.81 -44% | 10.14 8% | 8.88 19% |
| Greyscale dE 2000 * | 4.03 | 2.48 38% | 11.28 -180% | 3.94 2% | 4.17 -3% |
| Gamma | 2.3 96% | 2.37 93% | 2.23 99% | 2.45 90% | 2.53 87% |
| CCT | 7229 90% | 6854 95% | 11383 57% | 6877 95% | 6683 97% |
| Color Space (Percent of AdobeRGB 1998) (%) | 56 | 55 -2% | 59 5% | 54 -4% | 55 -2% |
| Color Space (Percent of sRGB) (%) | 85 | 84 -1% | 90 6% | 83 -2% | 83 -2% |
| Media totale (Programma / Settaggio) | 3% /
4% | 7% /
-12% | 0% /
2% | 1% /
2% |
* ... Meglio usare valori piccoli
Sfarfallio dello schermo / PWM (Pulse-Width Modulation)
| flickering dello schermo / PWM rilevato | 20830 Hz | ≤ 90 % settaggio luminosita' | 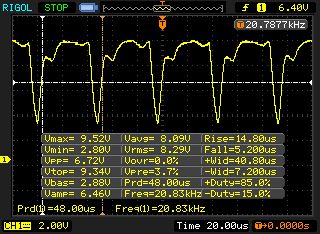 |
Il display sfarfalla a 20830 Hz (Probabilmente a causa dell'uso di PWM) Flickering rilevato ad una luminosita' di 90 % o inferiore. Non dovrebbe verificarsi flickering o PWM sopra questo valore di luminosita'. La frequenza di 20830 Hz è abbastanza alta, quindi la maggioranza degli utenti sensibili al PWM non dovrebbero notare alcun flickering. In confronto: 52 % di tutti i dispositivi testati non utilizza PWM per ridurre la luminosita' del display. Se è rilevato PWM, una media di 7769 (minimo: 5 - massimo: 343500) Hz è stata rilevata. | |||
Tempi di risposta del Display
| ↔ Tempi di risposta dal Nero al Bianco | ||
|---|---|---|
| 26.4 ms ... aumenta ↗ e diminuisce ↘ combinato | ↗ 15.2 ms Incremento | 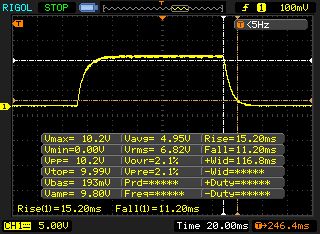 |
| ↘ 11.2 ms Calo | ||
| Lo schermo mostra tempi di risposta relativamente lenti nei nostri tests e potrebbe essere troppo lento per i gamers. In confronto, tutti i dispositivi di test variano da 0.1 (minimo) a 240 (massimo) ms. » 66 % di tutti i dispositivi è migliore. Questo significa che i tempi di risposta rilevati sono peggiori rispetto alla media di tutti i dispositivi testati (19.8 ms). | ||
| ↔ Tempo di risposta dal 50% Grigio all'80% Grigio | ||
| 36 ms ... aumenta ↗ e diminuisce ↘ combinato | ↗ 18 ms Incremento | 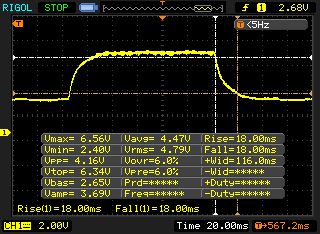 |
| ↘ 18 ms Calo | ||
| Lo schermo mostra tempi di risposta lenti nei nostri tests e sarà insoddisfacente per i gamers. In confronto, tutti i dispositivi di test variano da 0.165 (minimo) a 636 (massimo) ms. » 51 % di tutti i dispositivi è migliore. Questo significa che i tempi di risposta rilevati sono peggiori rispetto alla media di tutti i dispositivi testati (31 ms). | ||
| Cinebench R10 | |
| Rendering Multiple CPUs 32Bit | |
| MSI GT62VR 7RE-223 | |
| Acer Predator 15 G9-593-751X | |
| Rendering Single 32Bit | |
| Acer Predator 15 G9-593-751X | |
| MSI GT62VR 7RE-223 | |
| Geekbench 3 | |
| 32 Bit Multi-Core Score | |
| Acer Predator 15 G9-593-751X | |
| MSI GT62VR 7RE-223 | |
| 32 Bit Single-Core Score | |
| Acer Predator 15 G9-593-751X | |
| MSI GT62VR 7RE-223 | |
| Geekbench 4.0 | |
| 64 Bit Multi-Core Score | |
| Acer Predator 15 G9-593-751X | |
| MSI GT62VR 7RE-223 | |
| 64 Bit Single-Core Score | |
| MSI GT62VR 7RE-223 | |
| Acer Predator 15 G9-593-751X | |
| Geekbench 4.4 | |
| 64 Bit Multi-Core Score | |
| Acer Predator 15 G9-593-751X | |
| 64 Bit Single-Core Score | |
| Acer Predator 15 G9-593-751X | |
| JetStream 1.1 - 1.1 Total | |
| MSI GT62VR 7RE-223 | |
| Acer Predator 15 G9-593-751X | |
| Asus Strix GL502VS-FY032T | |
| PCMark 7 Score | 7004 punti | |
| PCMark 8 Home Score Accelerated v2 | 5169 punti | |
| PCMark 8 Creative Score Accelerated v2 | 8034 punti | |
| PCMark 8 Work Score Accelerated v2 | 5426 punti | |
Aiuto | ||
| PCMark 8 | |
| Home Score Accelerated v2 | |
| Acer Predator 15 G9-593-751X | |
| MSI GT62VR 7RE-223 | |
| Alienware 15 R3 | |
| Acer Predator 15 G9-593-765Q | |
| Asus Strix GL502VS-FY032T | |
| Work Score Accelerated v2 | |
| Acer Predator 15 G9-593-751X | |
| MSI GT62VR 7RE-223 | |
| Alienware 15 R3 | |
| Acer Predator 15 G9-593-765Q | |
| Asus Strix GL502VS-FY032T | |

| Acer Predator 15 G9-593-751X Samsung SM951 MZVPV256HDGL m.2 PCI-e | Acer Predator 15 G9-593-765Q LiteOn CV1-8B512 | Alienware 15 R3 | MSI GT62VR 7RE-223 Samsung SSD PM871a MZNLN256HMHQ | Asus Strix GL502VS-FY032T SanDisk SD8SNAT256G1002 | |
|---|---|---|---|---|---|
| CrystalDiskMark 3.0 | -55% | -28% | -47% | -64% | |
| Read Seq (MB/s) | 1939 | 517 -73% | 1123 -42% | 521 -73% | 485.4 -75% |
| Write Seq (MB/s) | 1262 | 449.7 -64% | 429.2 -66% | 422.8 -66% | 312.4 -75% |
| Read 512 (MB/s) | 1078 | 355.3 -67% | 833 -23% | 462 -57% | 294.8 -73% |
| Write 512 (MB/s) | 1192 | 433.7 -64% | 428.1 -64% | 286.9 -76% | 287.8 -76% |
| Read 4k (MB/s) | 50.8 | 27.69 -45% | 37.8 -26% | 38.55 -24% | 21.44 -58% |
| Write 4k (MB/s) | 141.9 | 72.9 -49% | 122.9 -13% | 122.8 -13% | 75.7 -47% |
| Read 4k QD32 (MB/s) | 573 | 290.9 -49% | 542 -5% | 388.4 -32% | 149.4 -74% |
| Write 4k QD32 (MB/s) | 375.3 | 273.8 -27% | 429.8 15% | 257.9 -31% | 256.3 -32% |
| 3DMark 06 Standard Score | 29731 punti | |
| 3DMark 11 Performance | 16110 punti | |
| 3DMark Ice Storm Standard Score | 139109 punti | |
| 3DMark Cloud Gate Standard Score | 28014 punti | |
| 3DMark Fire Strike Score | 13584 punti | |
| 3DMark Fire Strike Extreme Score | 7411 punti | |
| 3DMark Time Spy Score | 5133 punti | |
Aiuto | ||
| 3DMark - 1920x1080 Fire Strike Graphics | |
| Alienware 15 R3 | |
| MSI GT62VR 7RE-223 | |
| Acer Predator 15 G9-593-765Q | |
| Acer Predator 15 G9-593-751X | |
| Asus Strix GL502VS-FY032T | |
| Gigabyte Aero 15 | |
| Lenovo Legion Y720 80VR002XGE | |
| 3DMark 11 - 1280x720 Performance GPU | |
| Alienware 15 R3 | |
| MSI GT62VR 7RE-223 | |
| Acer Predator 15 G9-593-765Q | |
| Asus Strix GL502VS-FY032T | |
| Acer Predator 15 G9-593-751X | |
| Gigabyte Aero 15 | |
| Lenovo Legion Y720 80VR002XGE | |
| The Witcher 3 - 1920x1080 Ultra Graphics & Postprocessing (HBAO+) | |
| Acer Predator 15 G9-593-765Q | |
| Acer Predator 15 G9-593-751X | |
| Asus Strix GL502VS-FY032T | |
| Gigabyte Aero 15 | |
| Lenovo Legion Y720 80VR002XGE | |
| Battlefield 1 - 1920x1080 Ultra Preset AA:T | |
| Acer Predator 15 G9-593-751X | |
| Alienware 15 R3 | |
| MSI GT62VR 7RE-223 | |
| BioShock Infinite - 1920x1080 Ultra Preset, DX11 (DDOF) | |
| Acer Predator 15 G9-593-751X | |
| MSI GT62VR 7RE-223 | |
| Lenovo Legion Y720 80VR002XGE | |
| basso | medio | alto | ultra | |
|---|---|---|---|---|
| Tomb Raider (2013) | 456.5 | 446.2 | 408.4 | 207.3 |
| BioShock Infinite (2013) | 270 | 230.1 | 213.6 | 138.4 |
| The Witcher 3 (2015) | 236.2 | 178 | 110.1 | 59.6 |
| Battlefield 1 (2016) | 184.6 | 159.7 | 123.6 | 112.5 |
| For Honor (2017) | 245.3 | 150.6 | 143.3 | 105.6 |
| Ghost Recon Wildlands (2017) | 127.9 | 95.3 | 84.1 | 51.6 |
| Warhammer 40.000: Dawn of War III (2017) | 151.3 | 89.5 | 64.2 | 55.1 |
| Prey (2017) | 142.5 | 139.3 | 134.5 | 131.6 |
Rumorosità
| Idle |
| 34 / 36 / 38 dB(A) |
| HDD |
| 36 dB(A) |
| Sotto carico |
| 41 / 50 dB(A) |
 | ||
30 dB silenzioso 40 dB(A) udibile 50 dB(A) rumoroso |
||
min: | ||
| Acer Predator 15 G9-593-751X i7-7700HQ, GeForce GTX 1070 Mobile | Acer Predator 15 G9-593-765Q 6700HQ, GeForce GTX 1070 Mobile | Alienware 15 R3 i7-7700HQ, GeForce GTX 1070 Mobile | MSI GT62VR 7RE-223 i7-7700HQ, GeForce GTX 1070 Mobile | Asus Strix GL502VS-FY032T 6700HQ, GeForce GTX 1070 Mobile | |
|---|---|---|---|---|---|
| Noise | 3% | -1% | 4% | 6% | |
| off /ambiente * (dB) | 32 | 30 6% | 30 6% | 30 6% | 30 6% |
| Idle Minimum * (dB) | 34 | 31 9% | 31 9% | 34 -0% | 32 6% |
| Idle Average * (dB) | 36 | 35 3% | 32 11% | 35 3% | 33 8% |
| Idle Maximum * (dB) | 38 | 38 -0% | 42 -11% | 36 5% | 34 11% |
| Load Average * (dB) | 41 | 43 -5% | 49 -20% | 40 2% | 39 5% |
| Witcher 3 ultra * (dB) | 42 | ||||
| Load Maximum * (dB) | 50 | 49 2% | 50 -0% | 46 8% | 51 -2% |
* ... Meglio usare valori piccoli
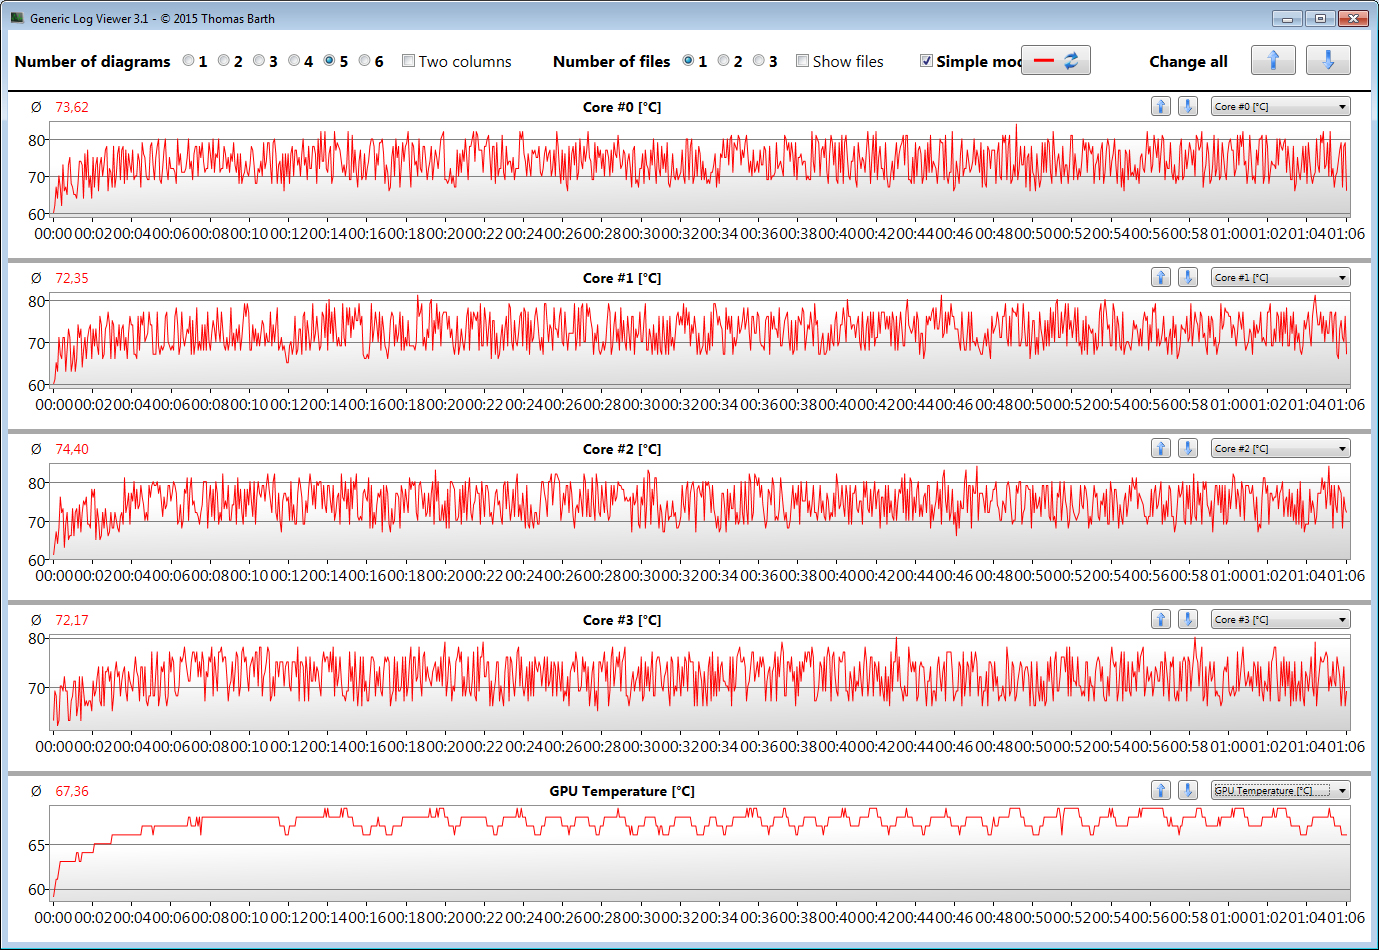
(±) La temperatura massima sul lato superiore è di 42.3 °C / 108 F, rispetto alla media di 40.4 °C / 105 F, che varia da 21.2 a 68.8 °C per questa classe Gaming.
(±) Il lato inferiore si riscalda fino ad un massimo di 40.9 °C / 106 F, rispetto alla media di 43.2 °C / 110 F
(+) In idle, la temperatura media del lato superiore è di 26.3 °C / 79 F, rispetto alla media deld ispositivo di 33.9 °C / 93 F.
(±) Riproducendo The Witcher 3, la temperatura media per il lato superiore e' di 34.8 °C / 95 F, rispetto alla media del dispositivo di 33.9 °C / 93 F.
(+) I poggiapolsi e il touchpad raggiungono la temperatura massima della pelle (32.1 °C / 89.8 F) e quindi non sono caldi.
(-) La temperatura media della zona del palmo della mano di dispositivi simili e'stata di 28.8 °C / 83.8 F (-3.3 °C / -6 F).
| Acer Predator 15 G9-593-751X i7-7700HQ, GeForce GTX 1070 Mobile | Acer Predator 15 G9-593-765Q 6700HQ, GeForce GTX 1070 Mobile | Alienware 15 R3 i7-7700HQ, GeForce GTX 1070 Mobile | MSI GT62VR 7RE-223 i7-7700HQ, GeForce GTX 1070 Mobile | Asus Strix GL502VS-FY032T 6700HQ, GeForce GTX 1070 Mobile | |
|---|---|---|---|---|---|
| Heat | 2% | -29% | -3% | -17% | |
| Maximum Upper Side * (°C) | 42.3 | 40.5 4% | 46 -9% | 40.6 4% | 48 -13% |
| Maximum Bottom * (°C) | 40.9 | 42 -3% | 51.8 -27% | 48.4 -18% | 46.8 -14% |
| Idle Upper Side * (°C) | 28.4 | 28.2 1% | 36.5 -29% | 26.8 6% | 33.7 -19% |
| Idle Bottom * (°C) | 25.2 | 24.3 4% | 38.2 -52% | 26.4 -5% | 30.5 -21% |
* ... Meglio usare valori piccoli
Acer Predator 15 G9-593-751X analisi audio
(+) | gli altoparlanti sono relativamente potenti (91 dB)
Bassi 100 - 315 Hz
(±) | bassi ridotti - in media 14.1% inferiori alla media
(±) | la linearità dei bassi è media (10.6% delta rispetto alla precedente frequenza)
Medi 400 - 2000 Hz
(+) | medi bilanciati - solo only 3.2% rispetto alla media
(+) | medi lineari (4.9% delta rispetto alla precedente frequenza)
Alti 2 - 16 kHz
(+) | Alti bilanciati - appena 3.7% dalla media
(+) | alti lineari (5.3% delta rispetto alla precedente frequenza)
Nel complesso 100 - 16.000 Hz
(+) | suono nel complesso lineare (14.1% differenza dalla media)
Rispetto alla stessa classe
» 24% di tutti i dispositivi testati in questa classe è stato migliore, 8% simile, 68% peggiore
» Il migliore ha avuto un delta di 6%, medio di 18%, peggiore di 132%
Rispetto a tutti i dispositivi testati
» 17% di tutti i dispositivi testati in questa classe è stato migliore, 4% similare, 79% peggiore
» Il migliore ha avuto un delta di 4%, medio di 24%, peggiore di 134%
Alienware 15 R3 analisi audio
(+) | gli altoparlanti sono relativamente potenti (82 dB)
Bassi 100 - 315 Hz
(-) | quasi nessun basso - in media 19.1% inferiori alla media
(±) | la linearità dei bassi è media (10.4% delta rispetto alla precedente frequenza)
Medi 400 - 2000 Hz
(±) | medi elevati - circa 6.7% superiore alla media
(±) | linearità dei medi adeguata (7.5% delta rispetto alla precedente frequenza)
Alti 2 - 16 kHz
(+) | Alti bilanciati - appena 3.6% dalla media
(+) | alti lineari (5.2% delta rispetto alla precedente frequenza)
Nel complesso 100 - 16.000 Hz
(±) | la linearità complessiva del suono è media (21.6% di differenza rispetto alla media
Rispetto alla stessa classe
» 77% di tutti i dispositivi testati in questa classe è stato migliore, 5% simile, 18% peggiore
» Il migliore ha avuto un delta di 6%, medio di 18%, peggiore di 132%
Rispetto a tutti i dispositivi testati
» 61% di tutti i dispositivi testati in questa classe è stato migliore, 7% similare, 32% peggiore
» Il migliore ha avuto un delta di 4%, medio di 24%, peggiore di 134%
| Off / Standby | |
| Idle | |
| Sotto carico |
|
Leggenda:
min: | |
| Acer Predator 15 G9-593-751X i7-7700HQ, GeForce GTX 1070 Mobile | Acer Predator 15 G9-593-765Q 6700HQ, GeForce GTX 1070 Mobile | Alienware 15 R3 i7-7700HQ, GeForce GTX 1070 Mobile | MSI GT62VR 7RE-223 i7-7700HQ, GeForce GTX 1070 Mobile | Asus Strix GL502VS-FY032T 6700HQ, GeForce GTX 1070 Mobile | |
|---|---|---|---|---|---|
| Power Consumption | 2% | 2% | 1% | 1% | |
| Idle Minimum * (Watt) | 18 | 18 -0% | 19 -6% | 20 -11% | 20 -11% |
| Idle Average * (Watt) | 23 | 24 -4% | 23 -0% | 24 -4% | 24 -4% |
| Idle Maximum * (Watt) | 30 | 29 3% | 29 3% | 29 3% | 29 3% |
| Load Average * (Watt) | 89 | 86 3% | 85 4% | 82 8% | 86 3% |
| Witcher 3 ultra * (Watt) | 168 | ||||
| Load Maximum * (Watt) | 213 | 201 6% | 192 10% | 193 9% | 183 14% |
* ... Meglio usare valori piccoli
| Acer Predator 15 G9-593-751X i7-7700HQ, GeForce GTX 1070 Mobile, 90 Wh | Acer Predator 15 G9-593-765Q 6700HQ, GeForce GTX 1070 Mobile, Wh | Alienware 15 R3 i7-7700HQ, GeForce GTX 1070 Mobile, 99 Wh | MSI GT62VR 7RE-223 i7-7700HQ, GeForce GTX 1070 Mobile, 75 Wh | Asus Strix GL502VS-FY032T 6700HQ, GeForce GTX 1070 Mobile, 62 Wh | |
|---|---|---|---|---|---|
| Autonomia della batteria | -5% | -17% | -21% | -47% | |
| Reader / Idle (h) | 8.4 | 6.4 -24% | 6.3 -25% | 4.1 -51% | |
| H.264 (h) | 4.9 | 5 2% | 4.4 -10% | 4.2 -14% | |
| WiFi v1.3 (h) | 5.5 | 4.8 -13% | 4.4 -20% | 4.1 -25% | 3.3 -40% |
| Load (h) | 2 | 1.9 -5% | 1.7 -15% | 1.6 -20% | 1 -50% |
Pro
Contro
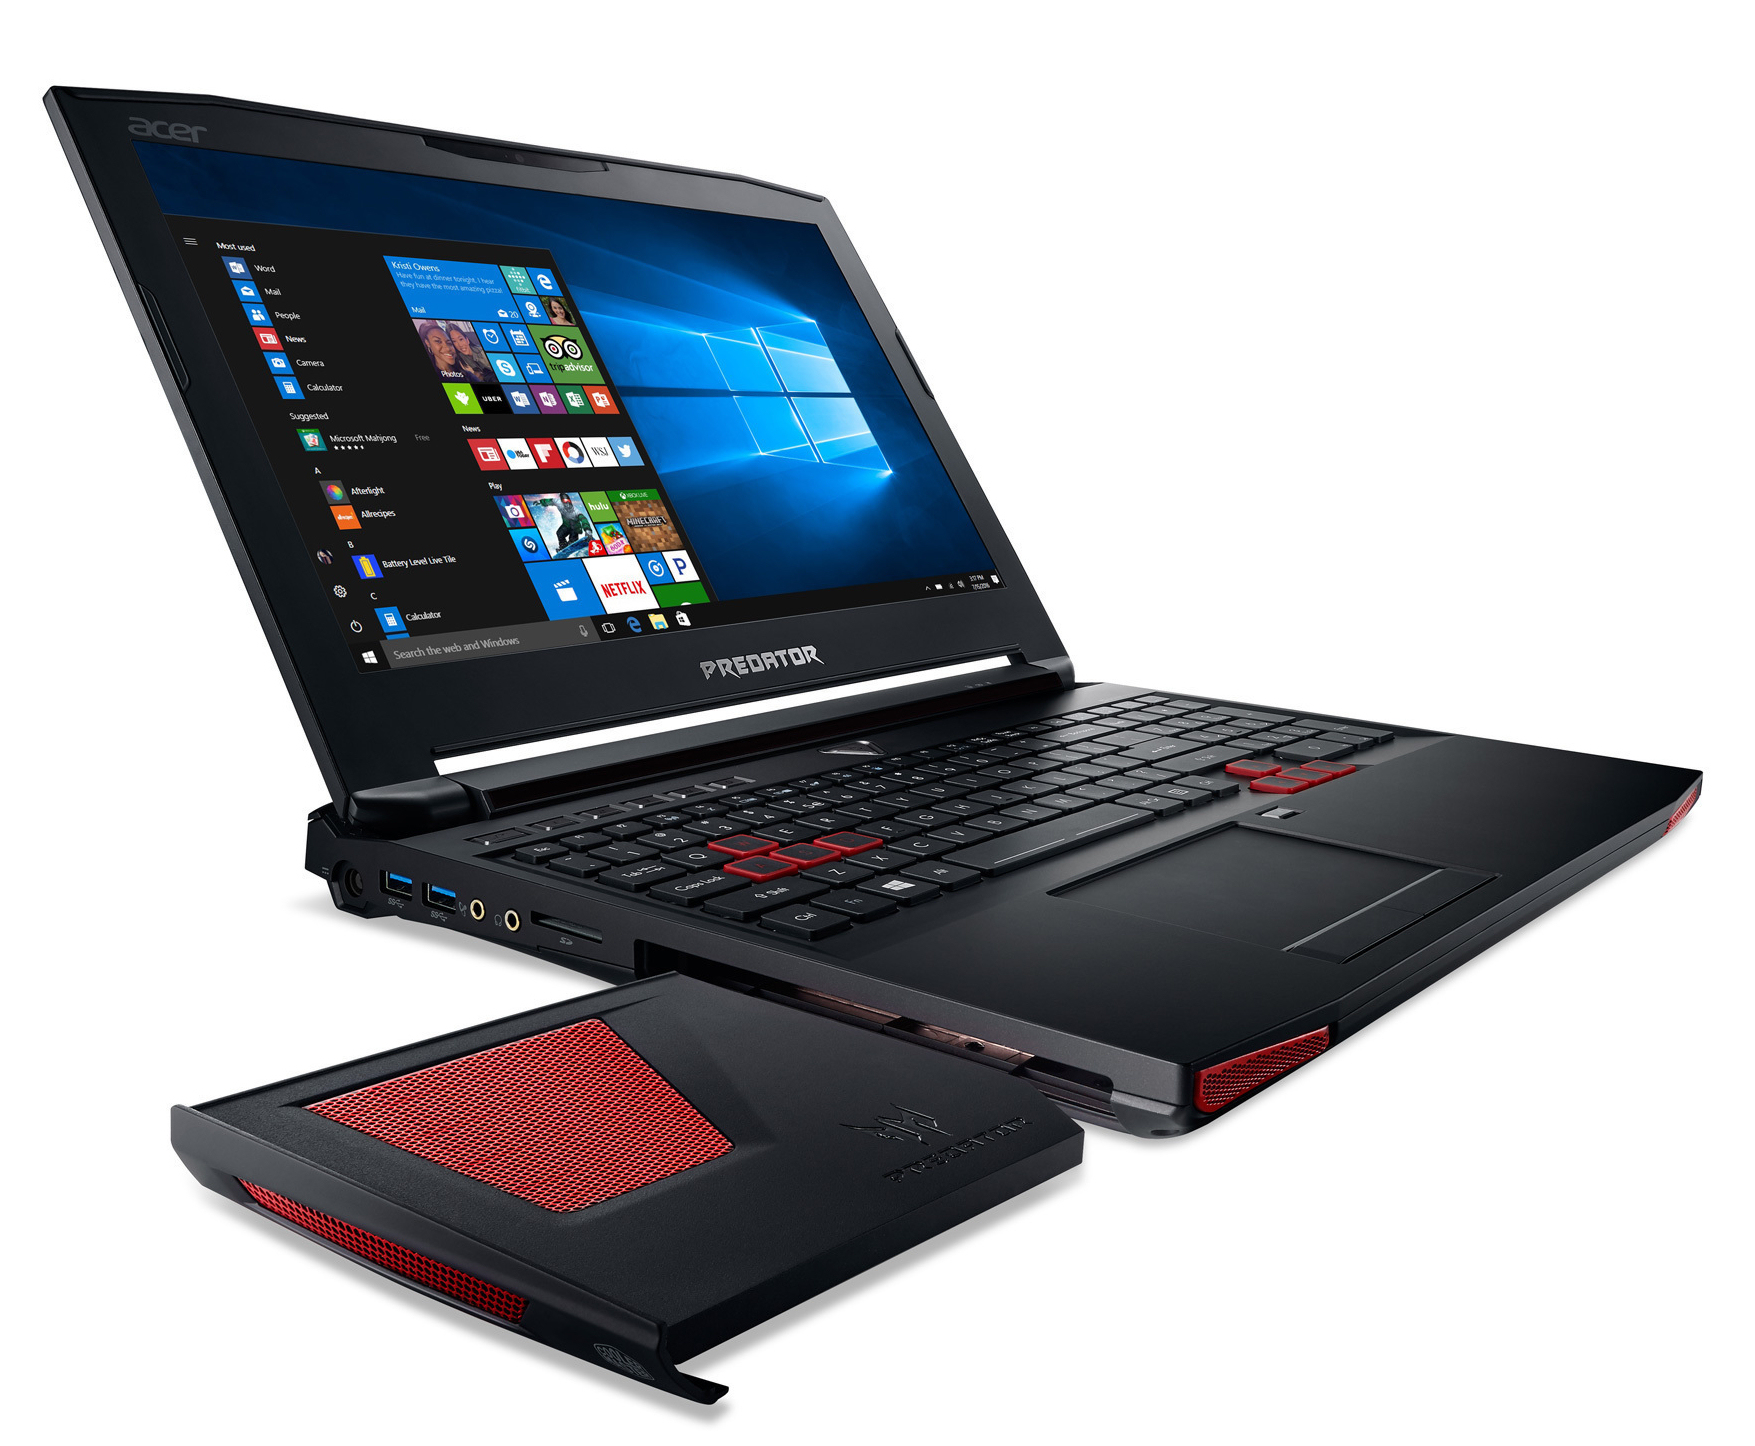
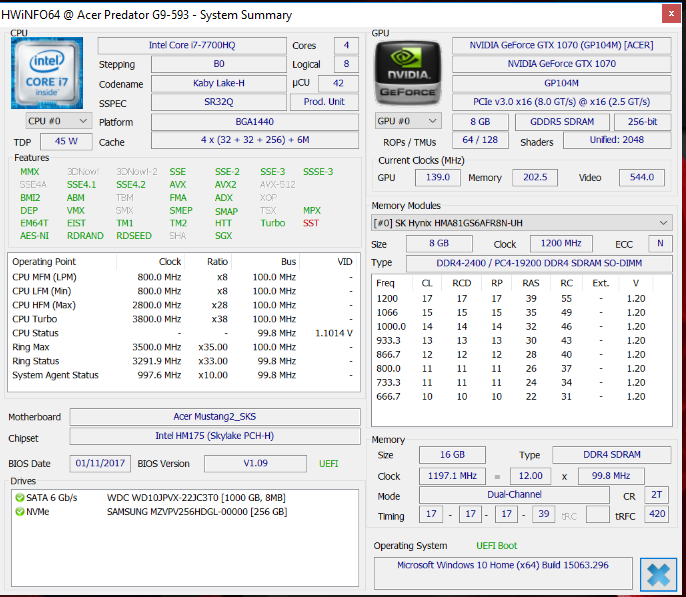
L'Acer Predator 15 G9-593-751X è di base un upgrade Kaby-Lake. Il processore Core-i7-7700HQ four-core offre solo un piccolo vantaggio di prestazioni rispetto al predecessore Skylake. L'hardware gestisce tutti i titoli attuali in modo fluido in risoluzione Full HD con settaggi massimi. La tecnologia Nvidia G-Sync consente una rappresentazione fluida delle immagini sul display 60-Hz. Lo schermo matto IPS Full HD attrae per contrato ed angoli di visuale. La luminosità è ok, ma potrebbe essere migliore.
Con il Predator 15, Acer realizza un portatile gaming completo.
La rumorosità del computer è a un livello normale per un portatile high-end. Le temperature sono relativamente basse. Un veloce SSD NVMe contribuisce ad un sistema scattante. Un hard drive da 2,5" fornisce lo spazio necessario con una capacità di 1 TB. Cambiare entrami i drives non è un problema, in quanto il portatile ha una cover per la manutenzione.
Nota: si tratta di una recensione breve, con alcune sezioni non tradotte, per la versione integrale in inglese guardate qui.
Acer Predator 15 G9-593-751X
- 05/28/2017 v6 (old)
Sascha Mölck