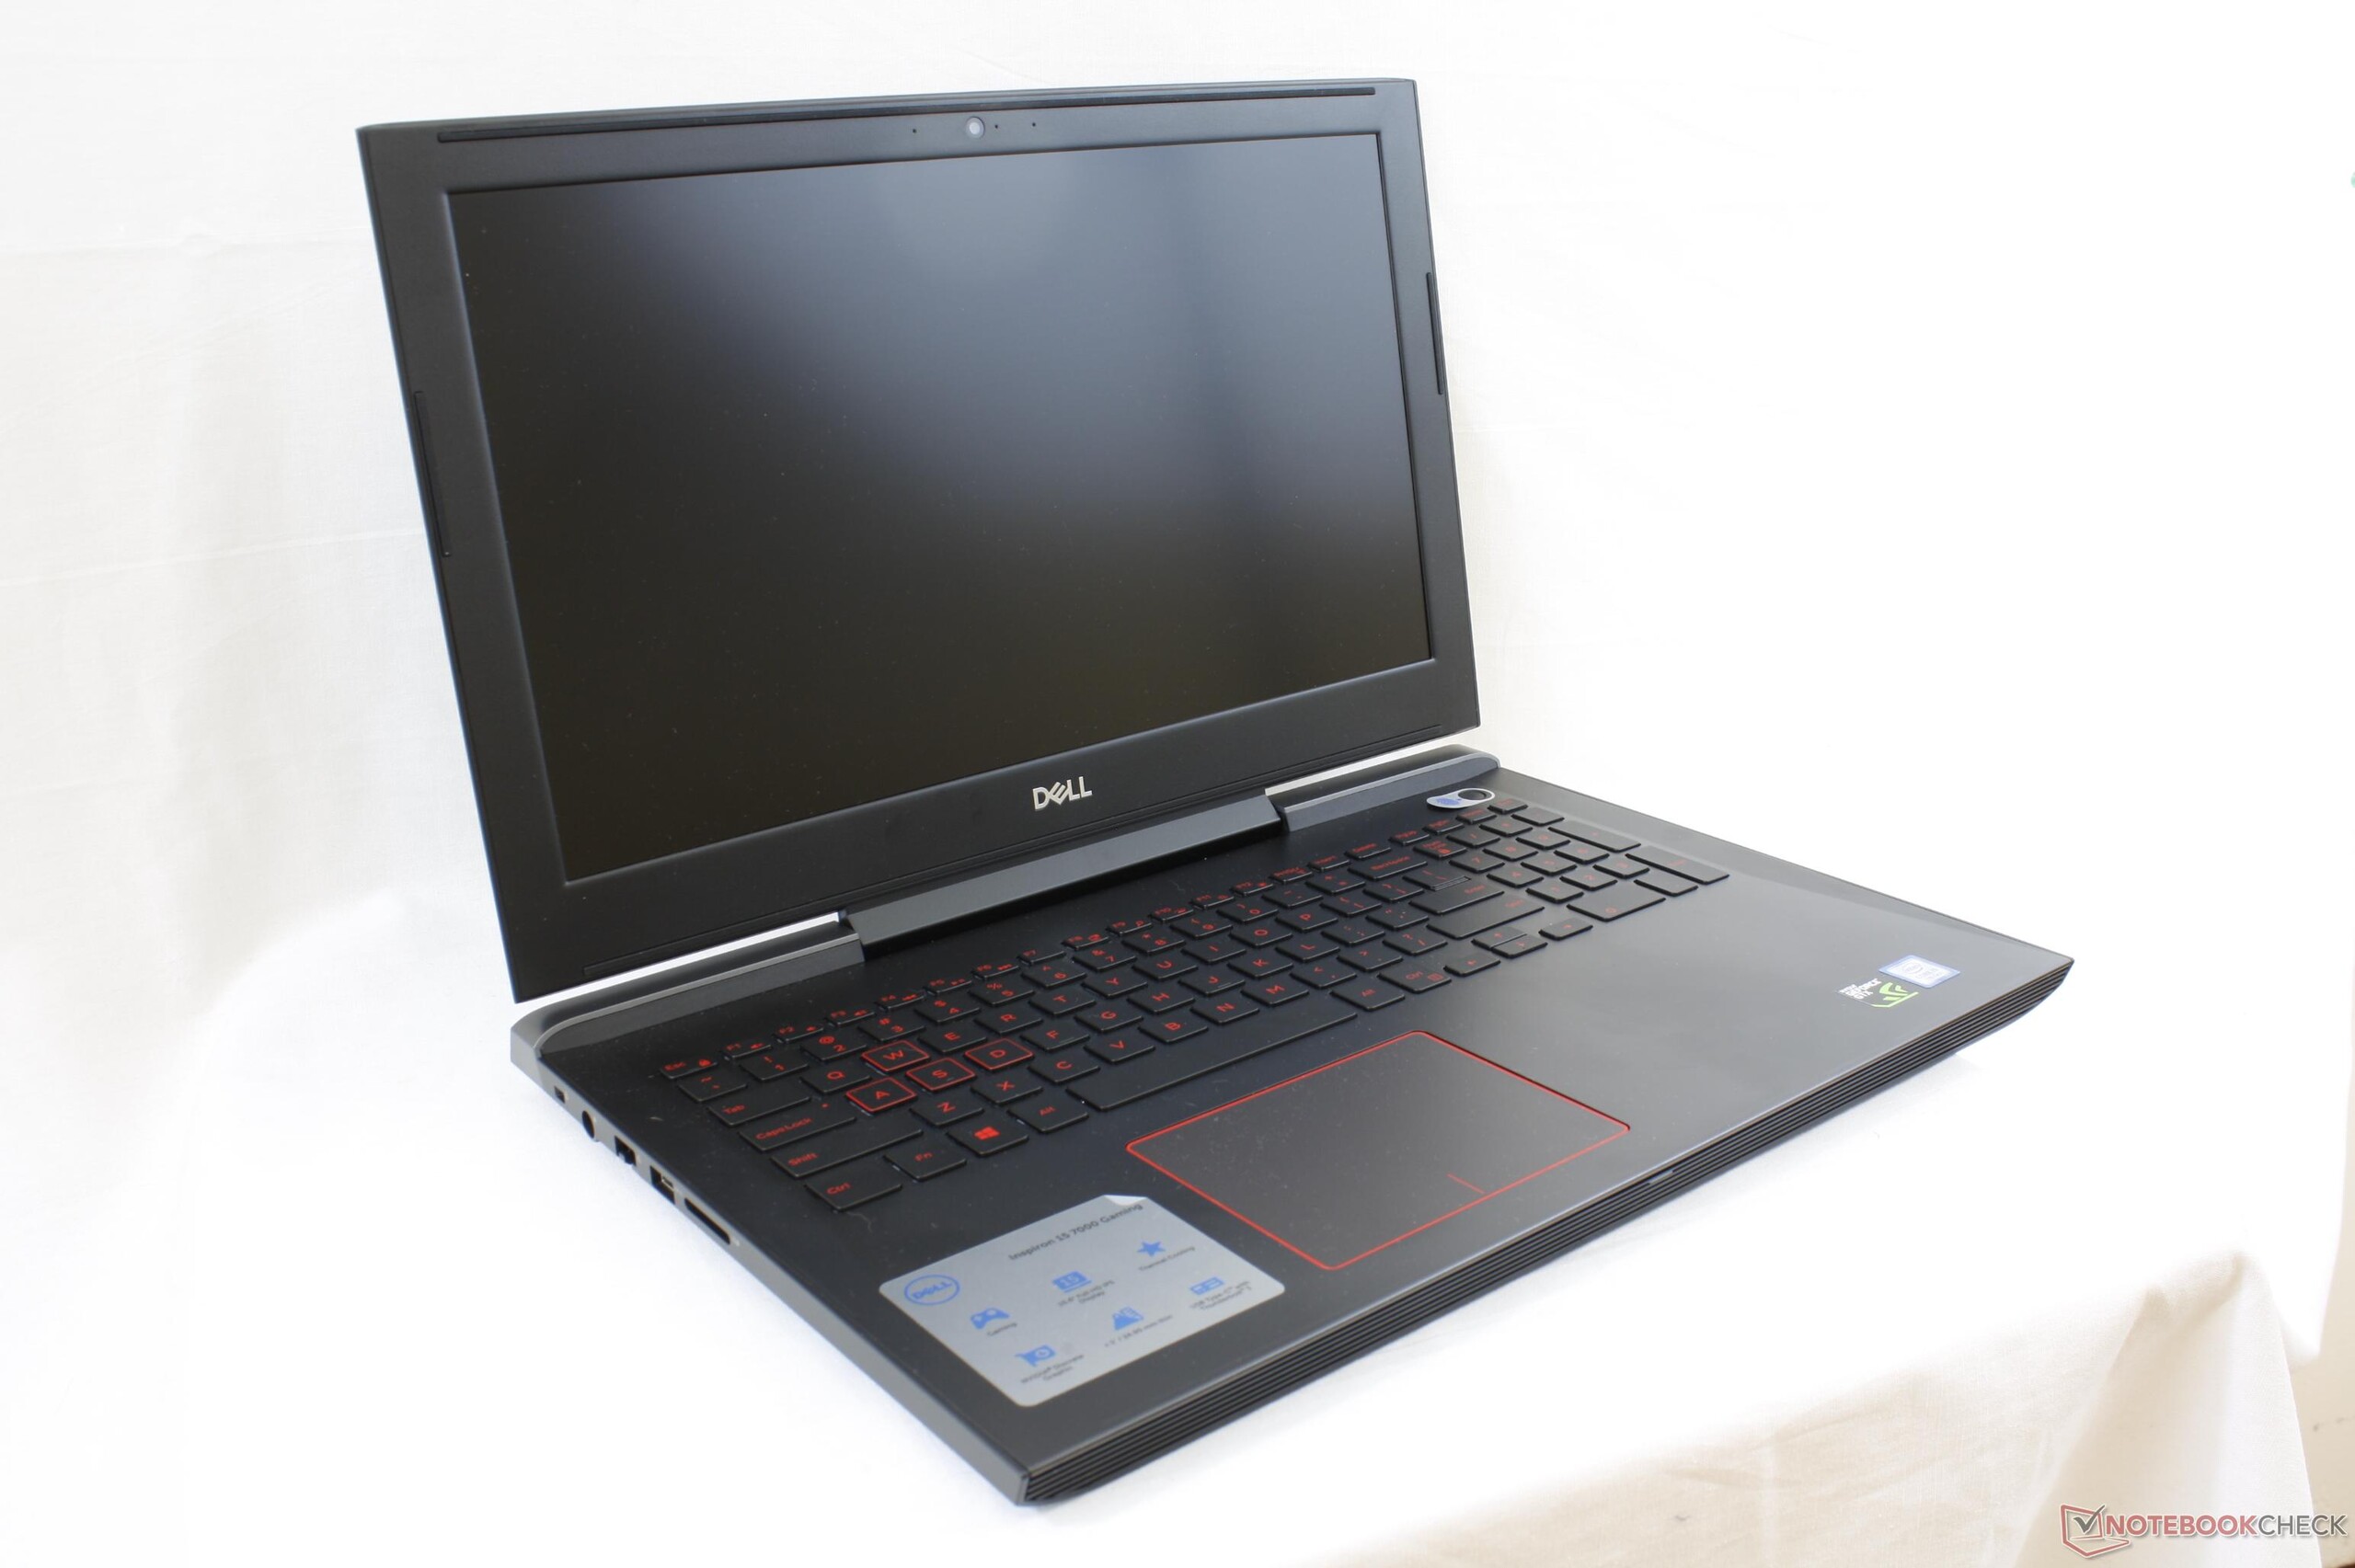
Recensione breve del Portatile Dell Inspiron 15 7000 7577 (i5-7300HQ, GTX 1060 Max-Q)
| SD Card Reader | |
| average JPG Copy Test (av. of 3 runs) | |
| Dell XPS 15 9560 (i7-7700HQ, UHD) | |
| Dell Inspiron 15 7000 7577 | |
| Dell Inspiron 15 7000 7567 | |
| maximum AS SSD Seq Read Test (1GB) | |
| Dell XPS 15 9560 (i7-7700HQ, UHD) | |
| Dell Inspiron 15 7000 7577 | |
| Dell Inspiron 15 7000 7567 | |
| Networking | |
| iperf3 transmit AX12 | |
| Dell XPS 15 9560 (i7-7700HQ, UHD) | |
| Dell Inspiron 15 7000 7577 | |
| Dell Inspiron 15 7000 7567 (jseb) | |
| iperf3 receive AX12 | |
| Dell Inspiron 15 7000 7577 | |
| Dell XPS 15 9560 (i7-7700HQ, UHD) | |
| Dell Inspiron 15 7000 7567 (jseb) | |
| |||||||||||||||||||||||||
Distribuzione della luminosità: 91 %
Al centro con la batteria: 235.4 cd/m²
Contrasto: 841:1 (Nero: 0.28 cd/m²)
ΔE ColorChecker Calman: 5.6 | ∀{0.5-29.43 Ø4.73}
ΔE Greyscale Calman: 3.6 | ∀{0.09-98 Ø4.97}
55.4% sRGB (Argyll 1.6.3 3D)
35.2% AdobeRGB 1998 (Argyll 1.6.3 3D)
38.32% AdobeRGB 1998 (Argyll 3D)
55.6% sRGB (Argyll 3D)
37.07% Display P3 (Argyll 3D)
Gamma: 2.23
CCT: 7214 K
| Dell Inspiron 15 7000 7577 ID: LG Philips LGD053F, Name: 156WF6, Dell P/N: 4XK13, IPS, 15.6", 1920x1080 | Dell Inspiron 15 7000 7567 AU Optronics AUO38ED B156HTN 28H80, TN, 15.6", 1920x1080 | Acer Nitro 5 AN515-51-788E LG Philips LP156WF6-SPK6, IPS, 15.6", 1920x1080 | HP Omen 15-ce002ng AUO42ED, IPS, 15.6", 1920x1080 | Lenovo Legion Y520-15IKBN-80WK001KUS LP156WF6-SPK3, IPS, 15.6", 1920x1080 | |
|---|---|---|---|---|---|
| Display | -2% | 12% | 72% | ||
| Display P3 Coverage (%) | 37.07 | 36.42 -2% | 41.7 12% | 65.8 78% | |
| sRGB Coverage (%) | 55.6 | 54.9 -1% | 62.2 12% | 90.9 63% | |
| AdobeRGB 1998 Coverage (%) | 38.32 | 37.62 -2% | 43.17 13% | 66.5 74% | |
| Response Times | -16% | 11% | -17% | -48% | |
| Response Time Grey 50% / Grey 80% * (ms) | 35.6 ? | 36 ? -1% | 35 ? 2% | 43.2 ? -21% | 58.8 ? -65% |
| Response Time Black / White * (ms) | 27.6 ? | 36 ? -30% | 22 ? 20% | 31.2 ? -13% | 36 ? -30% |
| PWM Frequency (Hz) | 21550 ? | ||||
| Screen | -61% | 9% | 36% | -13% | |
| Brightness middle (cd/m²) | 235.4 | 246 5% | 276 17% | 304 29% | 239 2% |
| Brightness (cd/m²) | 223 | 235 5% | 265 19% | 289 30% | 244 9% |
| Brightness Distribution (%) | 91 | 75 -18% | 91 0% | 86 -5% | 88 -3% |
| Black Level * (cd/m²) | 0.28 | 0.55 -96% | 0.25 11% | 0.26 7% | 0.35 -25% |
| Contrast (:1) | 841 | 447 -47% | 1104 31% | 1169 39% | 683 -19% |
| Colorchecker dE 2000 * | 5.6 | 10.97 -96% | 5.06 10% | 3.46 38% | 7.3 -30% |
| Colorchecker dE 2000 max. * | 20.3 | 10.13 50% | 7.72 62% | 24.7 -22% | |
| Greyscale dE 2000 * | 3.6 | 14.25 -296% | 6.25 -74% | 2.46 32% | 4.9 -36% |
| Gamma | 2.23 99% | 1.83 120% | 1.76 125% | 2.38 92% | 2.19 100% |
| CCT | 7214 90% | 11200 58% | 6873 95% | 6915 94% | 7332 89% |
| Color Space (Percent of AdobeRGB 1998) (%) | 35.2 | 35 -1% | 40 14% | 59 68% | 35 -1% |
| Color Space (Percent of sRGB) (%) | 55.4 | 55 -1% | 62 12% | 91 64% | 55 -1% |
| Media totale (Programma / Settaggio) | -26% /
-42% | 11% /
10% | 30% /
36% | -31% /
-18% |
* ... Meglio usare valori piccoli
Tempi di risposta del Display
| ↔ Tempi di risposta dal Nero al Bianco | ||
|---|---|---|
| 27.6 ms ... aumenta ↗ e diminuisce ↘ combinato | ↗ 15.6 ms Incremento | 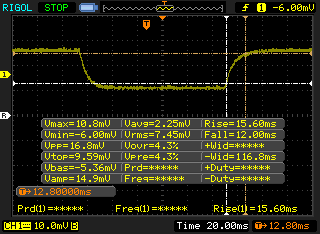 |
| ↘ 12 ms Calo | ||
| Lo schermo mostra tempi di risposta relativamente lenti nei nostri tests e potrebbe essere troppo lento per i gamers. In confronto, tutti i dispositivi di test variano da 0.1 (minimo) a 240 (massimo) ms. » 70 % di tutti i dispositivi è migliore. Questo significa che i tempi di risposta rilevati sono peggiori rispetto alla media di tutti i dispositivi testati (19.9 ms). | ||
| ↔ Tempo di risposta dal 50% Grigio all'80% Grigio | ||
| 35.6 ms ... aumenta ↗ e diminuisce ↘ combinato | ↗ 20 ms Incremento | 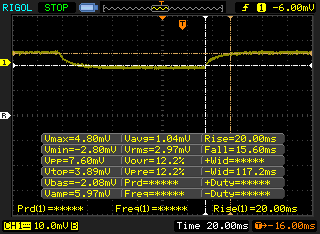 |
| ↘ 15.6 ms Calo | ||
| Lo schermo mostra tempi di risposta lenti nei nostri tests e sarà insoddisfacente per i gamers. In confronto, tutti i dispositivi di test variano da 0.165 (minimo) a 636 (massimo) ms. » 50 % di tutti i dispositivi è migliore. Questo significa che i tempi di risposta rilevati sono peggiori rispetto alla media di tutti i dispositivi testati (31.1 ms). | ||
Sfarfallio dello schermo / PWM (Pulse-Width Modulation)
| flickering dello schermo / PWM non rilevato | 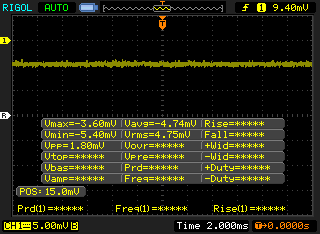 | ||
In confronto: 52 % di tutti i dispositivi testati non utilizza PWM per ridurre la luminosita' del display. Se è rilevato PWM, una media di 7798 (minimo: 5 - massimo: 343500) Hz è stata rilevata. | |||
| wPrime 2.10 - 1024m | |
| Lenovo Yoga 920-13IKB-80Y7 | |
| Dell Inspiron 15 7000 7567 Gaming (Core i5-7300HQ, GTX 1050) | |
| Dell Inspiron 15 7000 7577 | |
| Lenovo IdeaPad Y50 | |
| Razer Blade Pro RZ09-0220 | |
* ... Meglio usare valori piccoli
| PCMark 10 - Score | |
| Acer Nitro 5 AN515-51-788E | |
| Dell Inspiron 15 7000 7577 | |
| Dell Inspiron 15 7000 7567 Gaming (Core i5-7300HQ, GTX 1050) | |
| PCMark 8 Home Score Accelerated v2 | 3759 punti | |
| PCMark 8 Creative Score Accelerated v2 | 4723 punti | |
| PCMark 8 Work Score Accelerated v2 | 4856 punti | |
| PCMark 10 Score | 4406 punti | |
Aiuto | ||
| Dell Inspiron 15 7000 7577 Samsung PM961 MZVLW256HEHP | Dell Inspiron 15 7000 7567 Intel SSDSCKKF256H6 | Gigabyte Sabre 15G Liteonit CV3-8D128 | Lenovo Legion Y520-15IKBN-80WK001KUS Samsung PM961 MZVLW256HEHP | HP Omen 17-w100ng SanDisk Z400s SD8SNAT-128G | |
|---|---|---|---|---|---|
| AS SSD | -56% | -64% | 41% | -94% | |
| Copy Game MB/s (MB/s) | 382.5 | 286.2 -25% | 323.5 -15% | 1115 192% | 159.8 -58% |
| Copy Program MB/s (MB/s) | 274.8 | 224 -18% | 195.3 -29% | 502 83% | 80.6 -71% |
| Copy ISO MB/s (MB/s) | 814 | 425.4 -48% | 446.8 -45% | 1912 135% | 233.4 -71% |
| Score Total (Points) | 2405 | 734 -69% | 752 -69% | 2617 9% | 537 -78% |
| Score Write (Points) | 594 | 227 -62% | 234 -61% | 807 36% | 236 -60% |
| Score Read (Points) | 1241 | 332 -73% | 337 -73% | 1232 -1% | 206 -83% |
| Access Time Write * (ms) | 0.037 | 0.057 -54% | 0.073 -97% | 0.027 27% | 0.162 -338% |
| Access Time Read * (ms) | 0.058 | 0.094 -62% | 0.141 -143% | 0.065 -12% | 0.14 -141% |
| 4K-64 Write (MB/s) | 375.8 | 118.3 -69% | 132.2 -65% | 529 41% | 155 -59% |
| 4K-64 Read (MB/s) | 929 | 258.6 -72% | 257 -72% | 919 -1% | 137.4 -85% |
| 4K Write (MB/s) | 100.2 | 66.6 -34% | 53.8 -46% | 139.4 39% | 64.2 -36% |
| 4K Read (MB/s) | 46.95 | 25.16 -46% | 28.3 -40% | 48.57 3% | 17.76 -62% |
| Seq Write (MB/s) | 1181 | 416.1 -65% | 479.8 -59% | 1392 18% | 166.7 -86% |
| Seq Read (MB/s) | 2652 | 481.6 -82% | 516 -81% | 2649 0% | 507 -81% |
* ... Meglio usare valori piccoli

| 3DMark | |
| 1920x1080 Fire Strike Graphics | |
| Asus G701VIK-BA049T | |
| Alienware 15 R3 Max-Q | |
| Aorus X5 v7 | |
| Gigabyte Aero 15X | |
| AMD Radeon RX 480 8 GB Reference | |
| Razer Blade Pro RZ09-0220 | |
| HP Omen 15-ce002ng | |
| Dell Inspiron 15 7000 7577 | |
| EVGA SC17 | |
| Lenovo Legion Y520-15IKBN-80WK001KUS | |
| Asus GL503VD-DB74 | |
| Acer Swift 3 SF315-51G-57E5 | |
| Fire Strike Extreme Graphics | |
| Alienware 15 R3 Max-Q | |
| Gigabyte Aero 15X | |
| AMD Radeon RX 480 8 GB Reference | |
| Razer Blade Pro RZ09-0220 | |
| Dell Inspiron 15 7000 7577 | |
| EVGA SC17 | |
| Lenovo Legion Y520-15IKBN-80WK001KUS | |
| Asus GL503VD-DB74 | |
| 3DMark 11 | |
| 1280x720 Performance GPU | |
| Asus G701VIK-BA049T | |
| Alienware 15 R3 Max-Q | |
| Aorus X5 v7 | |
| Gigabyte Aero 15X | |
| AMD Radeon RX 480 8 GB Reference | |
| Razer Blade Pro RZ09-0220 | |
| HP Omen 15-ce002ng | |
| Dell Inspiron 15 7000 7577 | |
| EVGA SC17 | |
| Asus GL503VD-DB74 | |
| Acer Swift 3 SF315-51G-57E5 | |
| 1280x720 Performance Combined | |
| Asus G701VIK-BA049T | |
| AMD Radeon RX 480 8 GB Reference | |
| Aorus X5 v7 | |
| Alienware 15 R3 Max-Q | |
| EVGA SC17 | |
| Gigabyte Aero 15X | |
| Razer Blade Pro RZ09-0220 | |
| HP Omen 15-ce002ng | |
| Asus GL503VD-DB74 | |
| Dell Inspiron 15 7000 7577 | |
| Acer Swift 3 SF315-51G-57E5 | |
| 3DMark 11 Performance | 10176 punti | |
| 3DMark Ice Storm Standard Score | 96790 punti | |
| 3DMark Cloud Gate Standard Score | 17325 punti | |
| 3DMark Fire Strike Score | 8292 punti | |
| 3DMark Fire Strike Extreme Score | 4467 punti | |
Aiuto | ||
| Rise of the Tomb Raider - 1920x1080 Very High Preset AA:FX AF:16x | |
| MSI GE73VR 7RF Raider | |
| Nvidia GeForce GTX 1060 Founders Edition 6 GB | |
| Nvidia GeForce GTX 1060 Founders Edition 6 GB | |
| Razer Blade Pro RZ09-0220 | |
| Dell Inspiron 15 7000 7577 | |
| HP Omen 15-ce002ng | |
| Asus Strix GL502VT-DS74 | |
| Lenovo Legion Y520-15IKBN-80WK001KUS | |
| Gigabyte Sabre 15G | |
| MSI GL72 6QF | |
| The Witcher 3 - 1920x1080 Ultra Graphics & Postprocessing (HBAO+) | |
| MSI GE73VR 7RF Raider | |
| Nvidia GeForce GTX 1060 Founders Edition 6 GB | |
| Razer Blade Pro RZ09-0220 | |
| Lenovo Legion Y520-15IKBN-80WK001KUS | |
| Dell Inspiron 15 7000 7577 | |
| HP Omen 15-ce002ng | |
| Gigabyte Sabre 15G | |
| BioShock Infinite - 1920x1080 Ultra Preset, DX11 (DDOF) | |
| MSI GE73VR 7RF Raider | |
| Razer Blade Pro RZ09-0220 | |
| Dell Inspiron 15 7000 7577 | |
| Lenovo Legion Y520-15IKBN-80WK001KUS | |
| Asus Strix GL502VT-DS74 | |
| Gigabyte Sabre 15G | |
| MSI GL72 6QF | |
| basso | medio | alto | ultra | |
|---|---|---|---|---|
| Guild Wars 2 (2012) | 45.7 | |||
| BioShock Infinite (2013) | 95.3 | |||
| Metro: Last Light (2013) | 64.3 | |||
| Thief (2014) | 64.6 | |||
| The Witcher 3 (2015) | 73.4 | 35.2 | ||
| Batman: Arkham Knight (2015) | 74 | 49 | ||
| Metal Gear Solid V (2015) | 60 | |||
| Fallout 4 (2015) | 73.9 | 61.3 | ||
| Rise of the Tomb Raider (2016) | 67.5 | 55.4 | ||
| Overwatch (2016) | 98.4 | |||
| Mafia 3 (2016) | 36.2 | |||
| Prey (2017) | 97.1 | |||
| Dirt 4 (2017) | 118 | 87.1 | 46.5 | |
| F1 2017 (2017) | 94 | 77 | 56 | |
| Middle-earth: Shadow of War (2017) | 84 | 65 | 48 |
Rumorosità
| Idle |
| 28 / 28 / 28 dB(A) |
| Sotto carico |
| 30.3 / 46.5 dB(A) |
 | ||
30 dB silenzioso 40 dB(A) udibile 50 dB(A) rumoroso |
||
min: | ||
| Dell Inspiron 15 7000 7577 GeForce GTX 1060 Max-Q, i5-7300HQ, Samsung PM961 MZVLW256HEHP | Dell Inspiron 15 7000 7567 Gaming (Core i5-7300HQ, GTX 1050) GeForce GTX 1050 Mobile, i5-7300HQ, Toshiba MQ02ABD100H | Gigabyte Sabre 15G GeForce GTX 1050 Mobile, i7-7700HQ, Liteonit CV3-8D128 | Lenovo Legion Y520-15IKBN-80WK001KUS GeForce GTX 1050 Ti Mobile, i7-7700HQ, Samsung PM961 MZVLW256HEHP | Asus Strix GL502VT-DS74 GeForce GTX 970M, 6700HQ, Lite-On CV1-8B128 | HP Omen 15-ce002ng GeForce GTX 1060 Max-Q, i7-7700HQ, Samsung PM961 MZVLW256HEHP | |
|---|---|---|---|---|---|---|
| Noise | -12% | -21% | -7% | -12% | -16% | |
| off /ambiente * (dB) | 28 | 28 -0% | 28.2 -1% | 27.7 1% | 28.7 -2% | 30 -7% |
| Idle Minimum * (dB) | 28 | 31.6 -13% | 33 -18% | 30.5 -9% | 31 -11% | 30 -7% |
| Idle Average * (dB) | 28 | 31.8 -14% | 33.3 -19% | 30.5 -9% | 31 -11% | 33 -18% |
| Idle Maximum * (dB) | 28 | 31.8 -14% | 34.7 -24% | 30.6 -9% | 32 -14% | 37 -32% |
| Load Average * (dB) | 30.3 | 36.3 -20% | 44.5 -47% | 40 -32% | 40.7 -34% | 41 -35% |
| Witcher 3 ultra * (dB) | 39.5 | 46.3 -17% | 49.2 -25% | 40 -1% | 42 -6% | |
| Load Maximum * (dB) | 46.5 | 49 -5% | 52.8 -14% | 42.6 8% | 47.6 -2% | 50 -8% |
* ... Meglio usare valori piccoli
(±) La temperatura massima sul lato superiore è di 44 °C / 111 F, rispetto alla media di 40.4 °C / 105 F, che varia da 21.2 a 68.8 °C per questa classe Gaming.
(±) Il lato inferiore si riscalda fino ad un massimo di 43.8 °C / 111 F, rispetto alla media di 43.2 °C / 110 F
(+) In idle, la temperatura media del lato superiore è di 24.7 °C / 76 F, rispetto alla media deld ispositivo di 33.9 °C / 93 F.
(+) Riproducendo The Witcher 3, la temperatura media per il lato superiore e' di 27.9 °C / 82 F, rispetto alla media del dispositivo di 33.9 °C / 93 F.
(+) I poggiapolsi e il touchpad sono piu' freddi della temperatura della pelle con un massimo di 29.8 °C / 85.6 F e sono quindi freddi al tatto.
(±) La temperatura media della zona del palmo della mano di dispositivi simili e'stata di 28.8 °C / 83.8 F (-1 °C / -1.8 F).
Dell Inspiron 15 7000 7577 analisi audio
(±) | potenza degli altiparlanti media ma buona (80.9 dB)
Bassi 100 - 315 Hz
(±) | bassi ridotti - in media 13% inferiori alla media
(+) | bassi in lineaa (6.8% delta rispetto alla precedente frequenza)
Medi 400 - 2000 Hz
(+) | medi bilanciati - solo only 2.7% rispetto alla media
(+) | medi lineari (5.3% delta rispetto alla precedente frequenza)
Alti 2 - 16 kHz
(±) | alti elevati - circa 8% superiori alla media
(±) | la linearità degli alti è media (10.6% delta rispetto alla precedente frequenza)
Nel complesso 100 - 16.000 Hz
(±) | la linearità complessiva del suono è media (18.9% di differenza rispetto alla media
Rispetto alla stessa classe
» 63% di tutti i dispositivi testati in questa classe è stato migliore, 8% simile, 29% peggiore
» Il migliore ha avuto un delta di 6%, medio di 18%, peggiore di 132%
Rispetto a tutti i dispositivi testati
» 44% di tutti i dispositivi testati in questa classe è stato migliore, 8% similare, 48% peggiore
» Il migliore ha avuto un delta di 4%, medio di 24%, peggiore di 134%
Apple MacBook 12 (Early 2016) 1.1 GHz analisi audio
(+) | gli altoparlanti sono relativamente potenti (83.6 dB)
Bassi 100 - 315 Hz
(±) | bassi ridotti - in media 11.3% inferiori alla media
(±) | la linearità dei bassi è media (14.2% delta rispetto alla precedente frequenza)
Medi 400 - 2000 Hz
(+) | medi bilanciati - solo only 2.4% rispetto alla media
(+) | medi lineari (5.5% delta rispetto alla precedente frequenza)
Alti 2 - 16 kHz
(+) | Alti bilanciati - appena 2% dalla media
(+) | alti lineari (4.5% delta rispetto alla precedente frequenza)
Nel complesso 100 - 16.000 Hz
(+) | suono nel complesso lineare (10.2% differenza dalla media)
Rispetto alla stessa classe
» 7% di tutti i dispositivi testati in questa classe è stato migliore, 2% simile, 91% peggiore
» Il migliore ha avuto un delta di 5%, medio di 18%, peggiore di 53%
Rispetto a tutti i dispositivi testati
» 5% di tutti i dispositivi testati in questa classe è stato migliore, 1% similare, 94% peggiore
» Il migliore ha avuto un delta di 4%, medio di 24%, peggiore di 134%
| Off / Standby | |
| Idle | |
| Sotto carico |
|
Leggenda:
min: | |
| Dell Inspiron 15 7000 7577 i5-7300HQ, GeForce GTX 1060 Max-Q, Samsung PM961 MZVLW256HEHP, IPS, 1920x1080, 15.6" | Dell Inspiron 15 7000 7567 i7-7700HQ, GeForce GTX 1050 Ti Mobile, Intel SSDSCKKF256H6, TN, 1920x1080, 15.6" | Gigabyte Sabre 15G i7-7700HQ, GeForce GTX 1050 Mobile, Liteonit CV3-8D128, IPS, 1920x1080, 15.6" | MSI GF62VR 7RF-877 i7-7700HQ, GeForce GTX 1060 Mobile, Intel SSD 600p SSDPEKKW256G7, TN LED, 1920x1080, 15.6" | Asus Strix GL502VY-DS71 6700HQ, GeForce GTX 980M, SanDisk SD8SN8U1T001122, IPS, 1920x1080, 15.6" | |
|---|---|---|---|---|---|
| Power Consumption | 1% | -19% | -85% | -144% | |
| Idle Minimum * (Watt) | 7.1 | 4.4 38% | 8 -13% | 16.2 -128% | 20.6 -190% |
| Idle Average * (Watt) | 7.6 | 6.8 11% | 10.9 -43% | 18.2 -139% | 22.1 -191% |
| Idle Maximum * (Watt) | 8.6 | 8.3 3% | 11 -28% | 18.9 -120% | 22.5 -162% |
| Load Average * (Watt) | 59.5 | 81 -36% | 76.7 -29% | 82.7 -39% | 130.6 -119% |
| Witcher 3 ultra * (Watt) | 89 | 94.9 -7% | 125.7 -41% | ||
| Load Maximum * (Watt) | 112.8 | 127 -13% | 106.4 6% | 162.3 -44% | 177.2 -57% |
* ... Meglio usare valori piccoli
| Dell Inspiron 15 7000 7577 i5-7300HQ, GeForce GTX 1060 Max-Q, 56 Wh | Dell Inspiron 15 7000 7567 i7-7700HQ, GeForce GTX 1050 Ti Mobile, 74 Wh | Gigabyte Sabre 15G i7-7700HQ, GeForce GTX 1050 Mobile, 47 Wh | Lenovo Legion Y520-15IKBN-80WK001KUS i7-7700HQ, GeForce GTX 1050 Ti Mobile, 45 Wh | Asus Strix GL502VT-DS74 6700HQ, GeForce GTX 970M, 64 Wh | MSI GF62VR 7RF-877 i7-7700HQ, GeForce GTX 1060 Mobile, 41 Wh | |
|---|---|---|---|---|---|---|
| Autonomia della batteria | 39% | -27% | -38% | -23% | -68% | |
| Reader / Idle (h) | 11 | 19.6 78% | 8.2 -25% | 8.5 -23% | 9.7 -12% | 2.8 -75% |
| WiFi v1.3 (h) | 6.9 | 10.4 51% | 4.4 -36% | 4 -42% | 5.9 -14% | 1.9 -72% |
| Load (h) | 1.6 | 1.4 -13% | 1.3 -19% | 0.8 -50% | 0.9 -44% | 0.7 -56% |
Pro
Contro
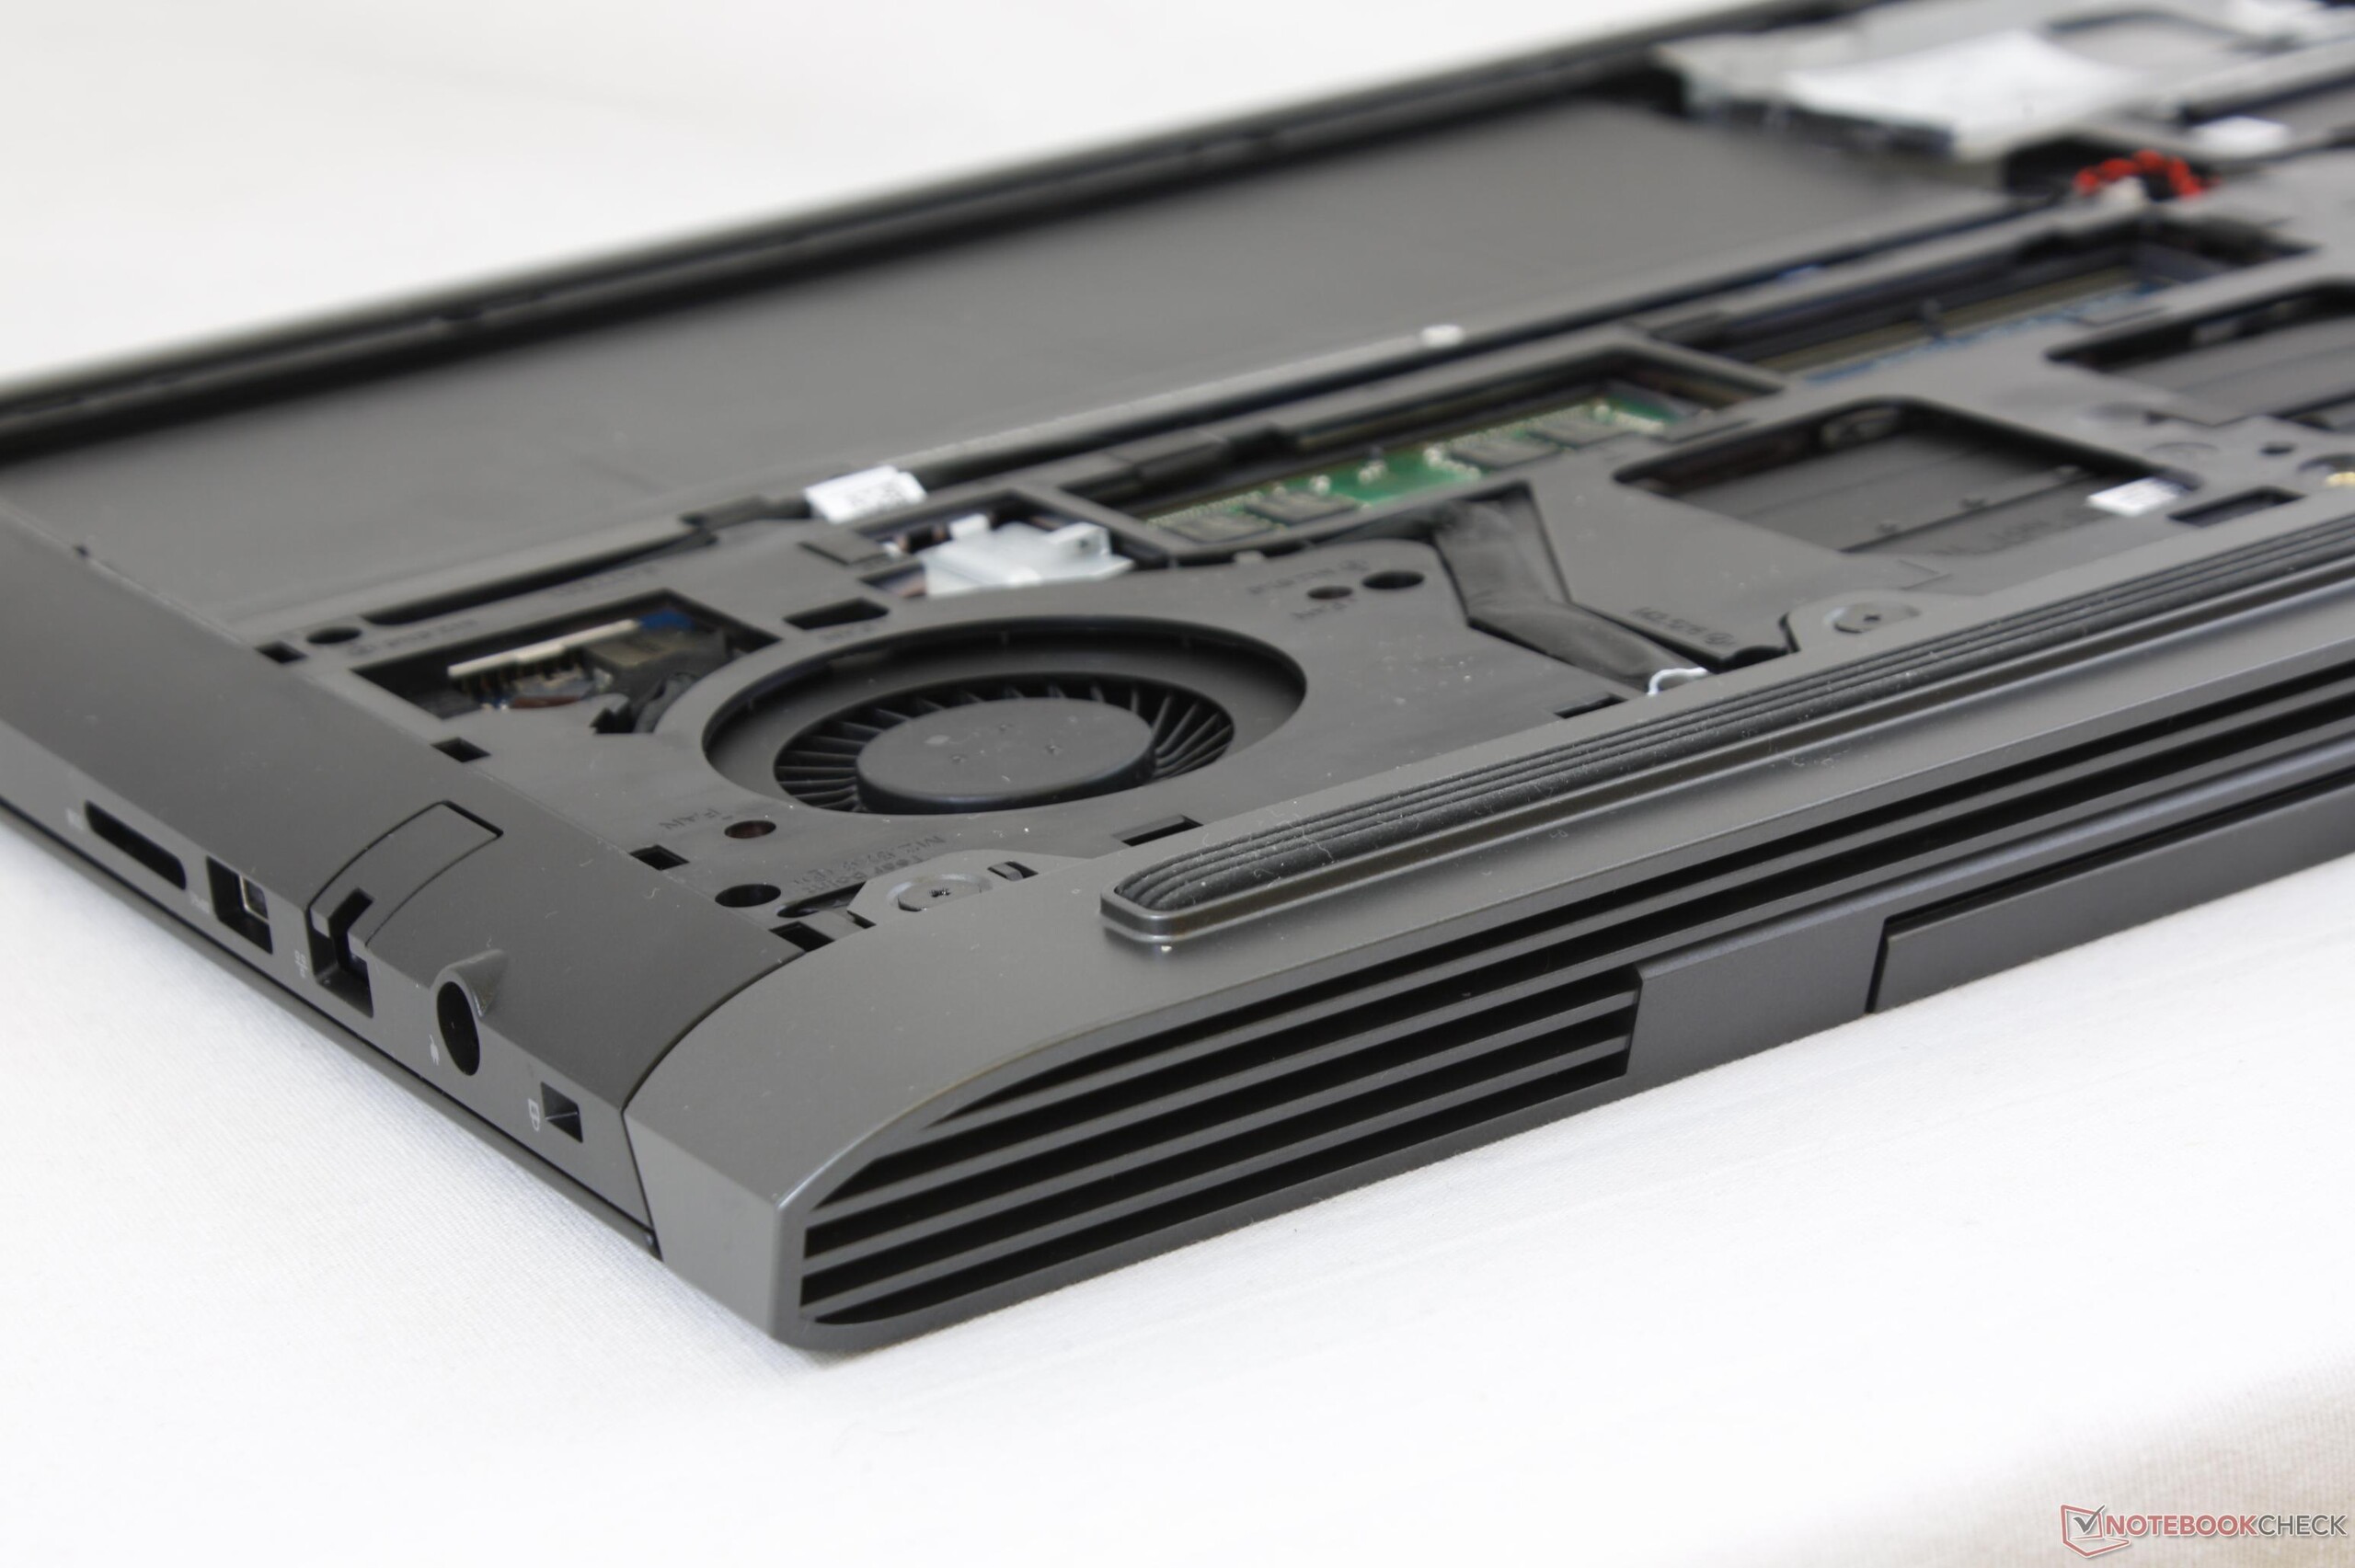
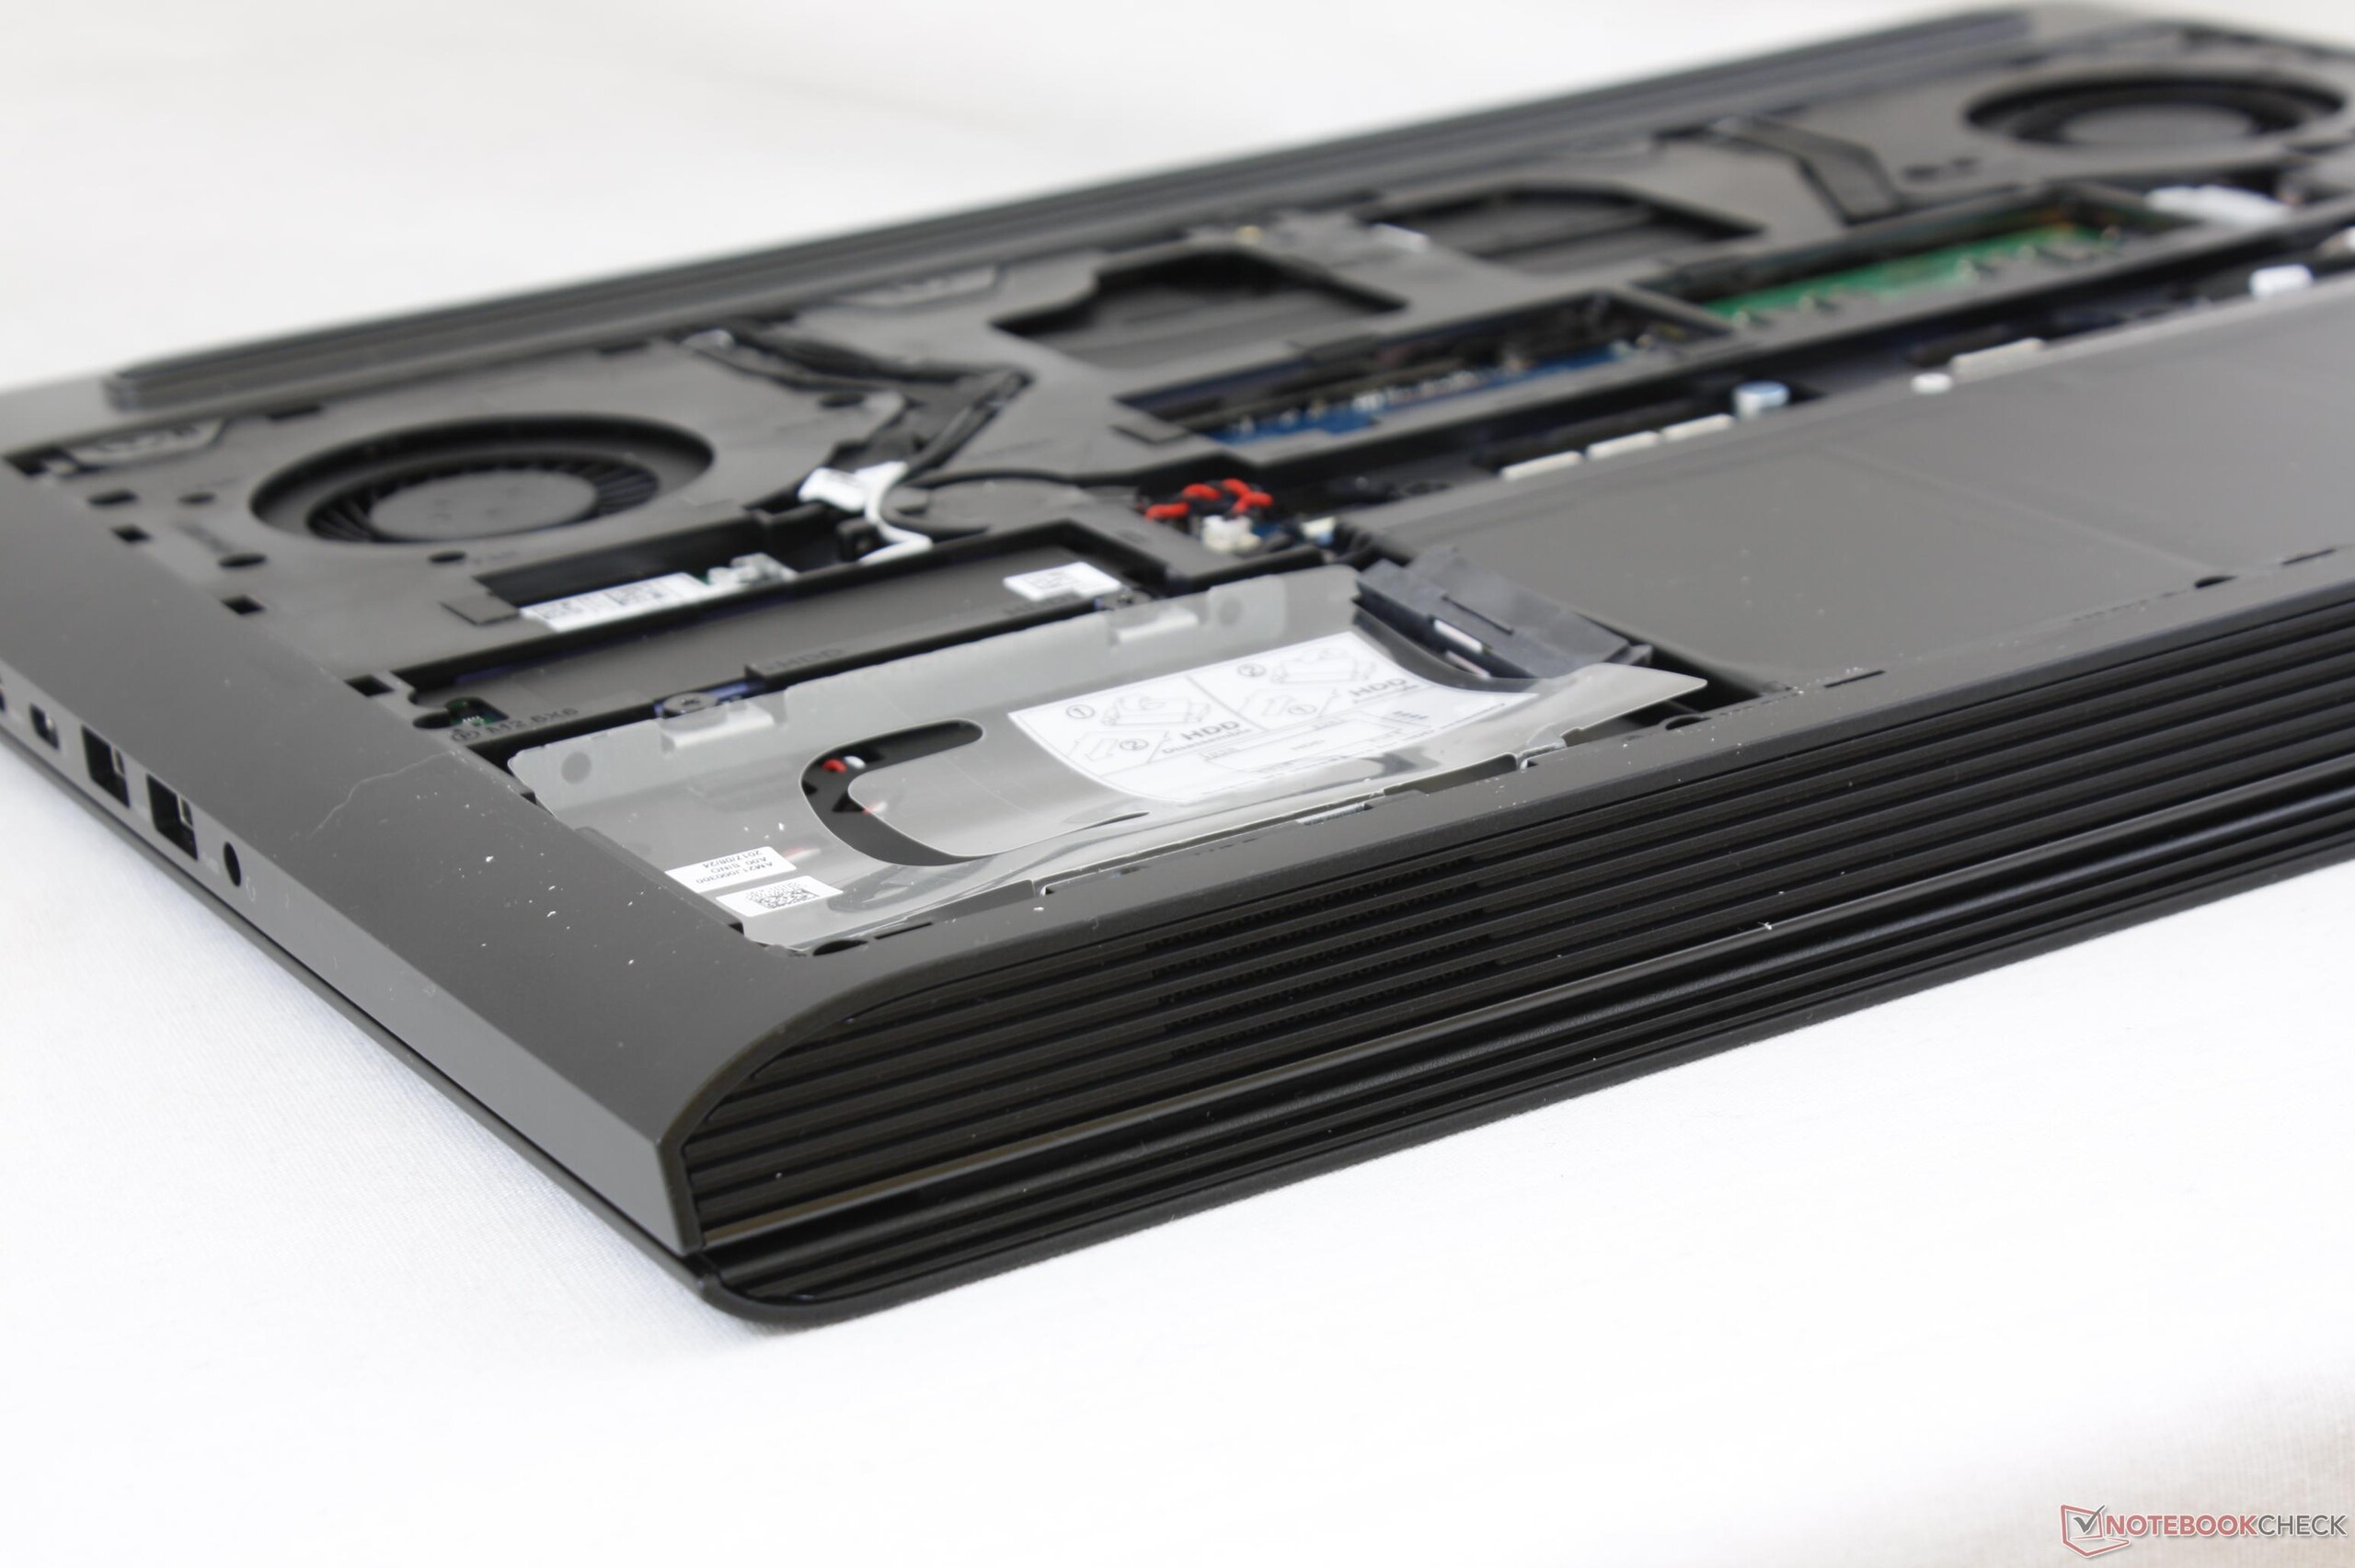
L'Inspiron 7577 è un sistema gaming eccezionale per il suo prezzo grazie alla robusta base, agli interni accessibili, e alla GPU GTX 1060 Max-Q. La GPU ha reso la macchina più silenziosa , veloce ed efficiente rispetto a tutte le SKUs dell'Inspiron 7567. Non sempre un successore offre un incremento di prestazioni grafiche tra il 35 ed il 70 % con un minimo incremento dei consumi tra il 5 ed il 10 % continuando ad avere ventole silenziose durante il gaming.
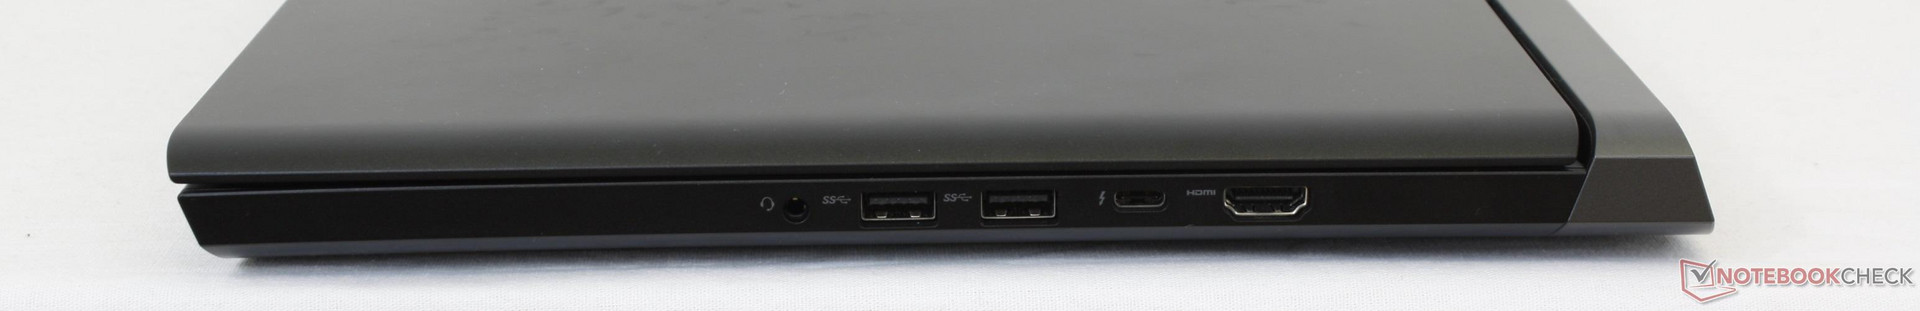
Se confrontato con concorrenti come l'Omen 15 (7700HQ, GTX 1060 Max-Q) o l'MSI GF62VR (7700HQ, GTX 1060), il Dell li supera facilmente entrambi. I consumi energetici sono inferiori rispetto all'MSI di circa il 40% con una minima riduzione delle prestazioni grafiche del 5 - 10 %. In cambio, la rumorosità della ventola è nettamente inferiore e l'autonomia è superiore. Il sistema riesce ad essere anche più silenzioso rispetto all'Omen 15 nonostante abbia la stessa GPU Max-Q e lo stesso punteggio nelle prestazioni 3D. Con una Thunderbolt 3 e un prezzo di partenza basso di appena $900 USD l'Inspiron 7577 è diventato subito il nostro portatile gaming preferito sotto alcuni punti di vista.
Alcune pecche separano l'Inspiron 7577 da altri modelli come l'Alienware 15 o l'Aorus X5. Innanzitutto, il display 1080p non ha alcune features. I colori non rispecchiano i valori degli schermi dei concorrenti dove ri va oltre il 90% della copertura della gamma sRGB. I colori non sono profondi come dovrebbero essere. Avremmo fatto a meno del pannello 4K UHD sull'Inspiron 7577 se ci fosse stato il G-Sync, un display con tempi di risposta migliori, ed una maggiore retroilluminazione. In secondo luogo i tasti sono troppo morbidi rispetto a quanto ci si aspetta da un portatile da 15" gaming. Sappiamo che Dell può fare di meglio come ha dimostrato con tastiere nettamente superiori nelle serie XPS, quindi non ci sono motivi per i quali il Inspiron non dovrebbe avere uno stesso trattamento. Altre piccole critiche riguardano l'illuminazione RGB dei tasti, il lettore SD molto lento, le casse scarse, ed il peso relativamente elevato per una esperienza gaming rispetto alla comodità della tastiera, al display, alla rumorosità ed alle performance.
L'Inspiron 7577 è il miglior portatile gaming per utenti che hanno limiti di budget. E' sorprendentemente silenzioso e duraturo con potenti prestazioni grafiche che superano il livello del prezzo. Il display e la tastiera sono due aspetti che fanno notare il livello budget, per il resto è eccezionale.
Nota: si tratta di una recensione breve, con alcune sezioni non tradotte, per la versione integrale in inglese guardate qui.
Dell Inspiron 15 7000 7577
- 01/03/2018 v6 (old)
Allen Ngo
Price comparison
