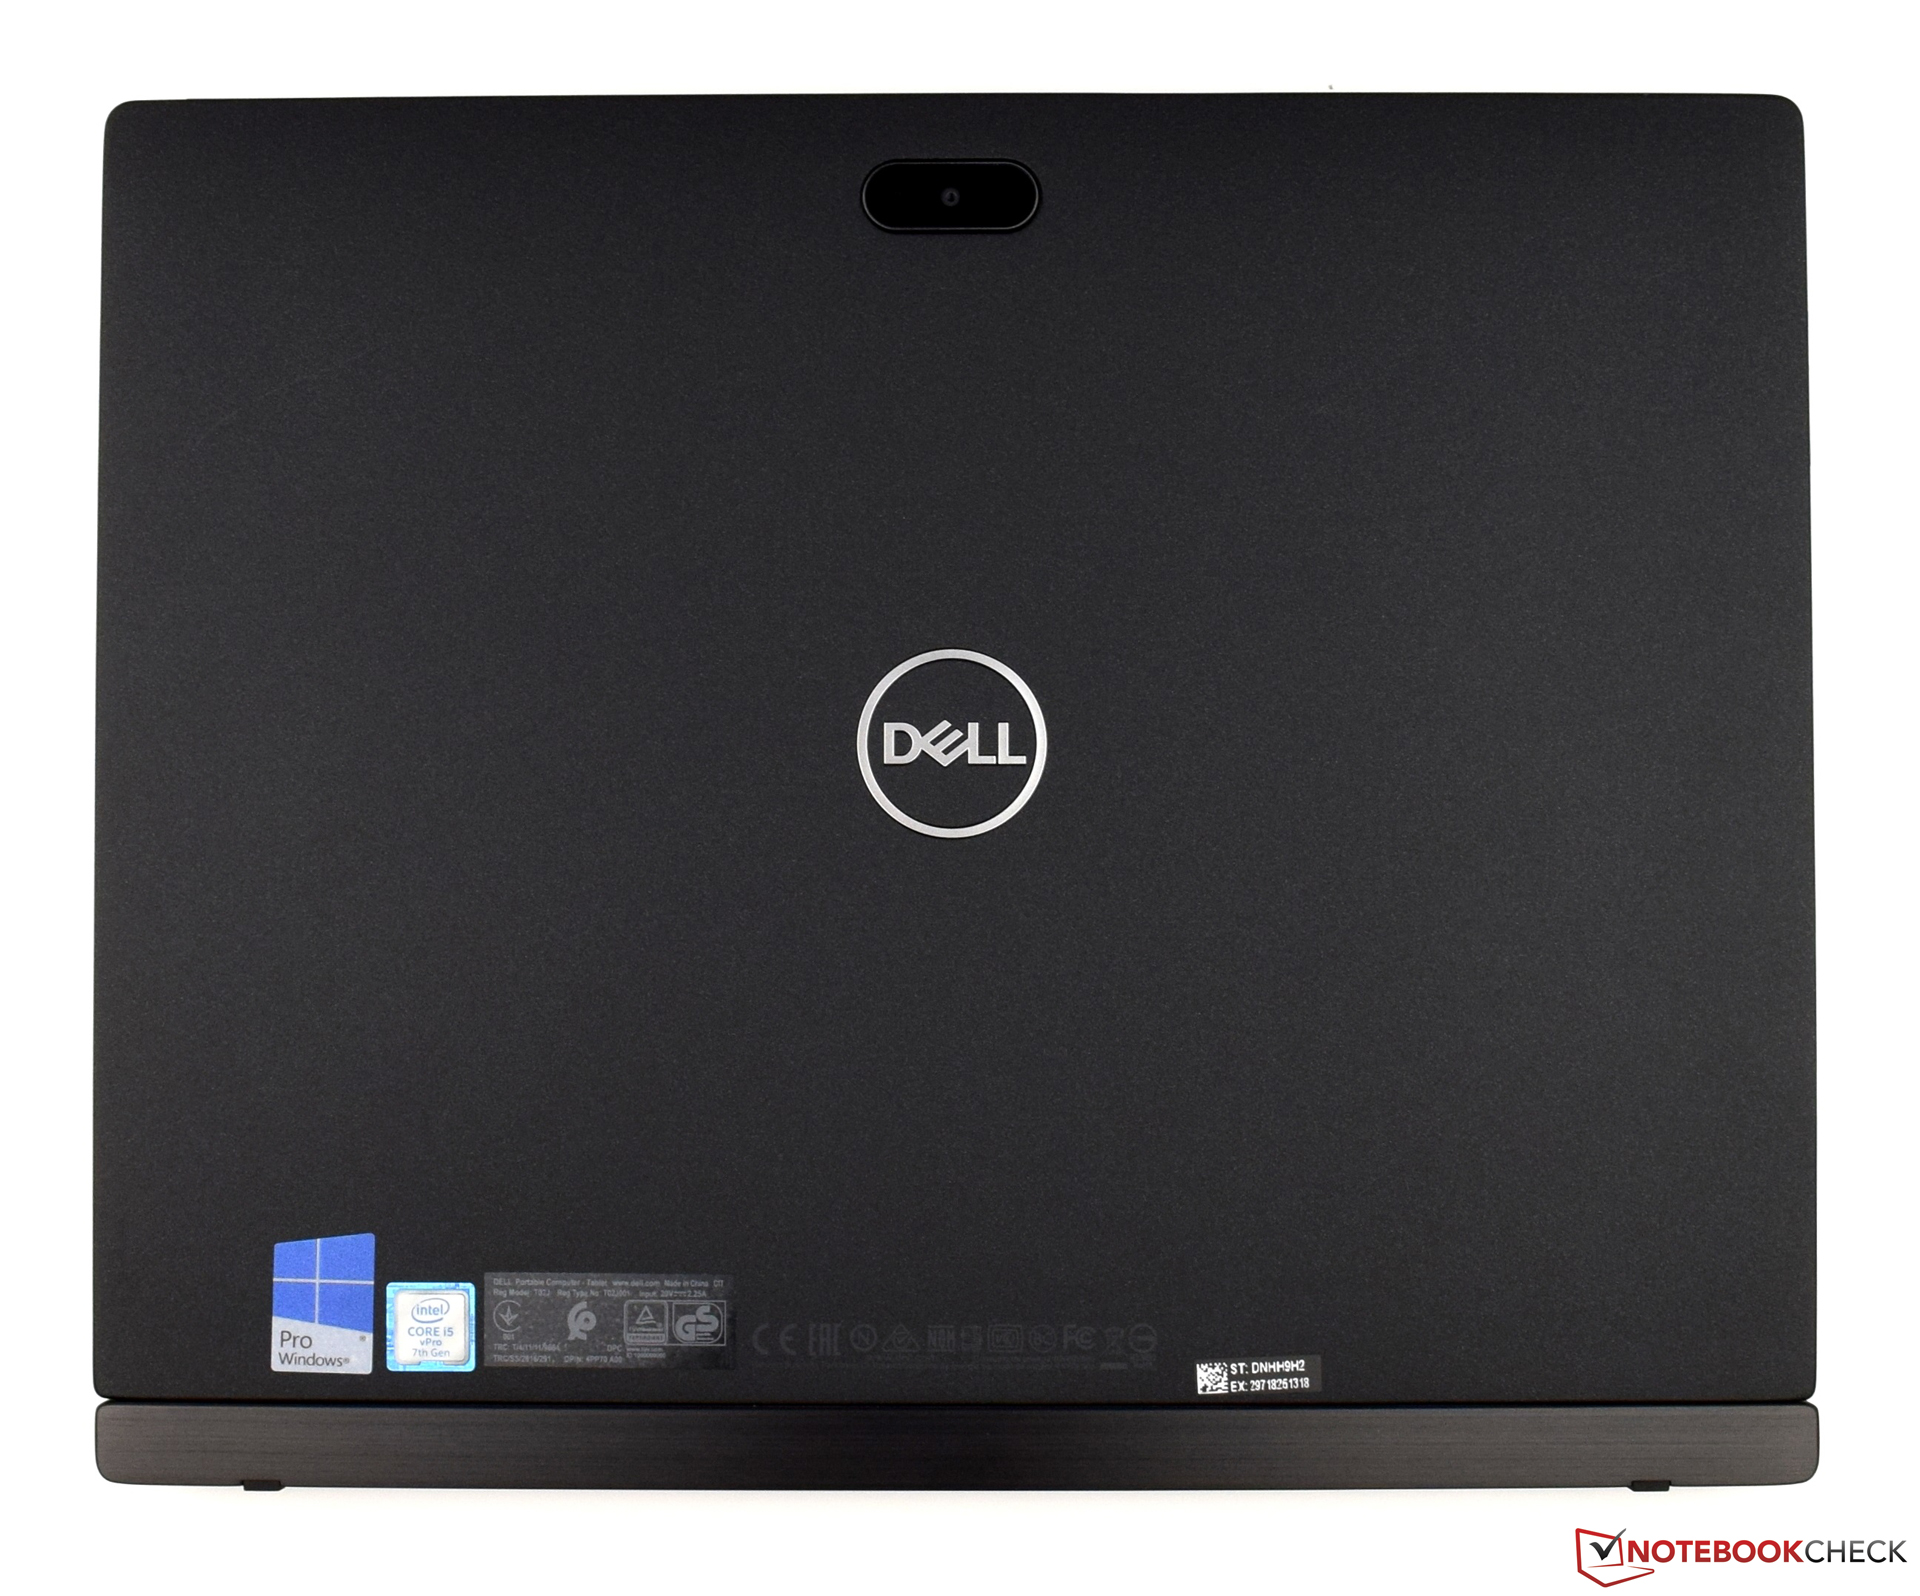
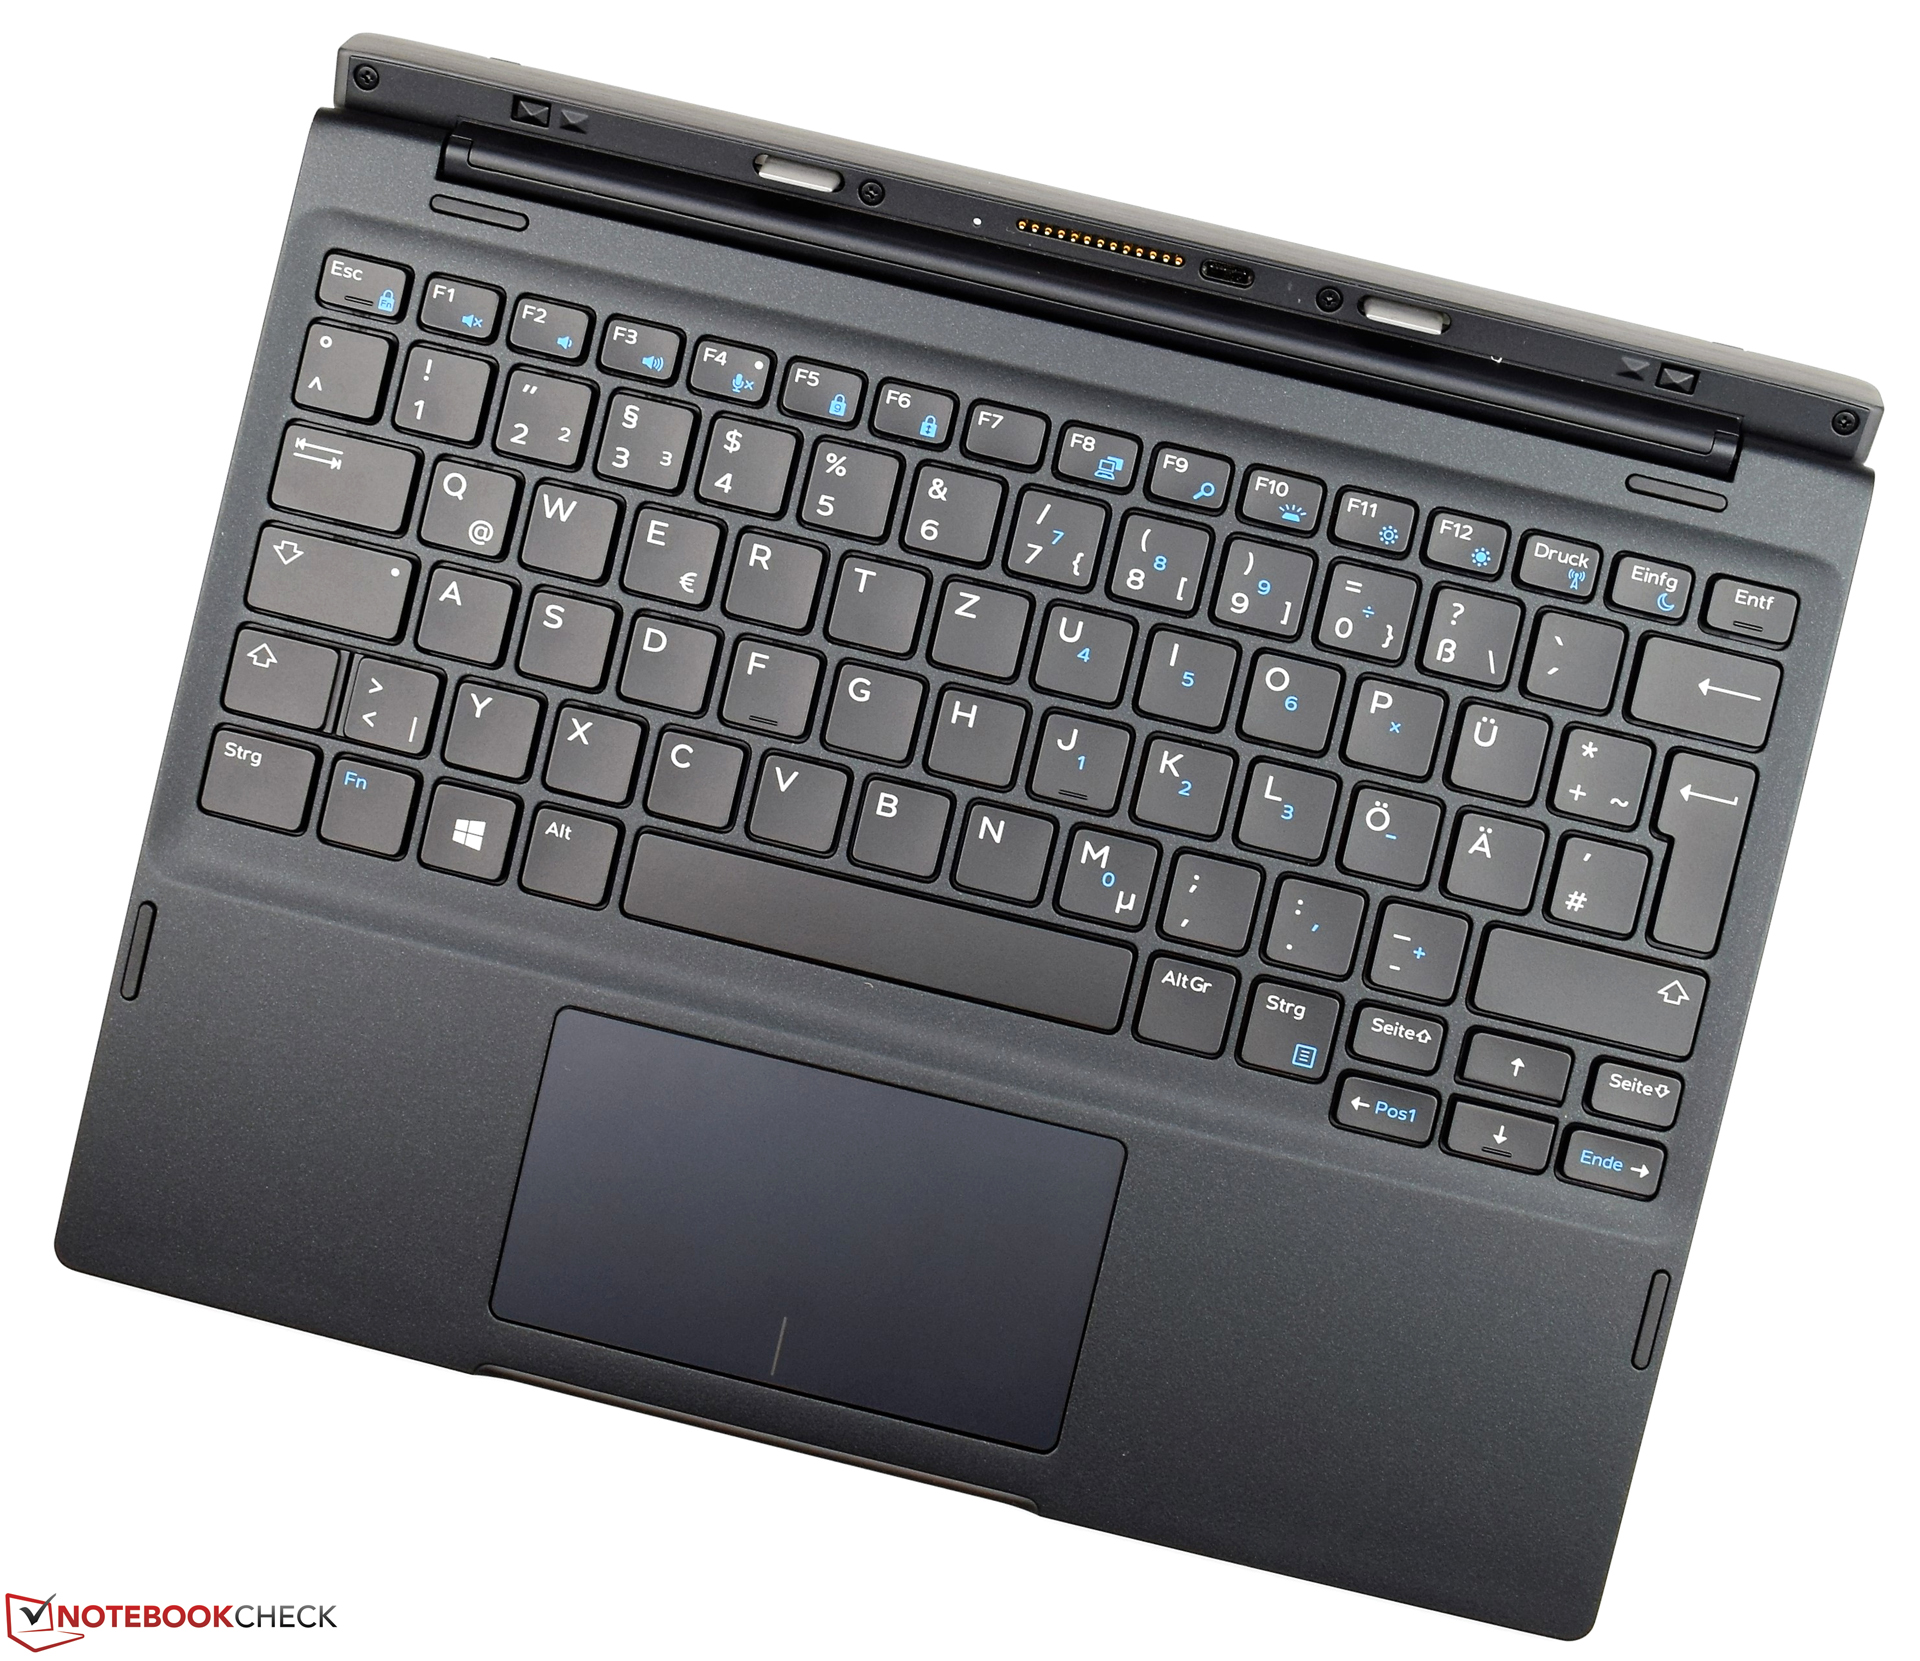
Recensione breve del Convertibile Dell Latitude 7285 (i5-7Y57, 256 GB, 3K)


| SD Card Reader | |
| average JPG Copy Test (av. of 3 runs) | |
| Lenovo ThinkPad X1 Yoga 2017 20JES03T00 (Toshiba Exceria Pro M401) | |
| Dell Latitude 12 5285 2-in-1 (Toshiba THN-M401S0640E2) | |
| Dell Latitude 7285 (Toshiba Exceria Pro M501) | |
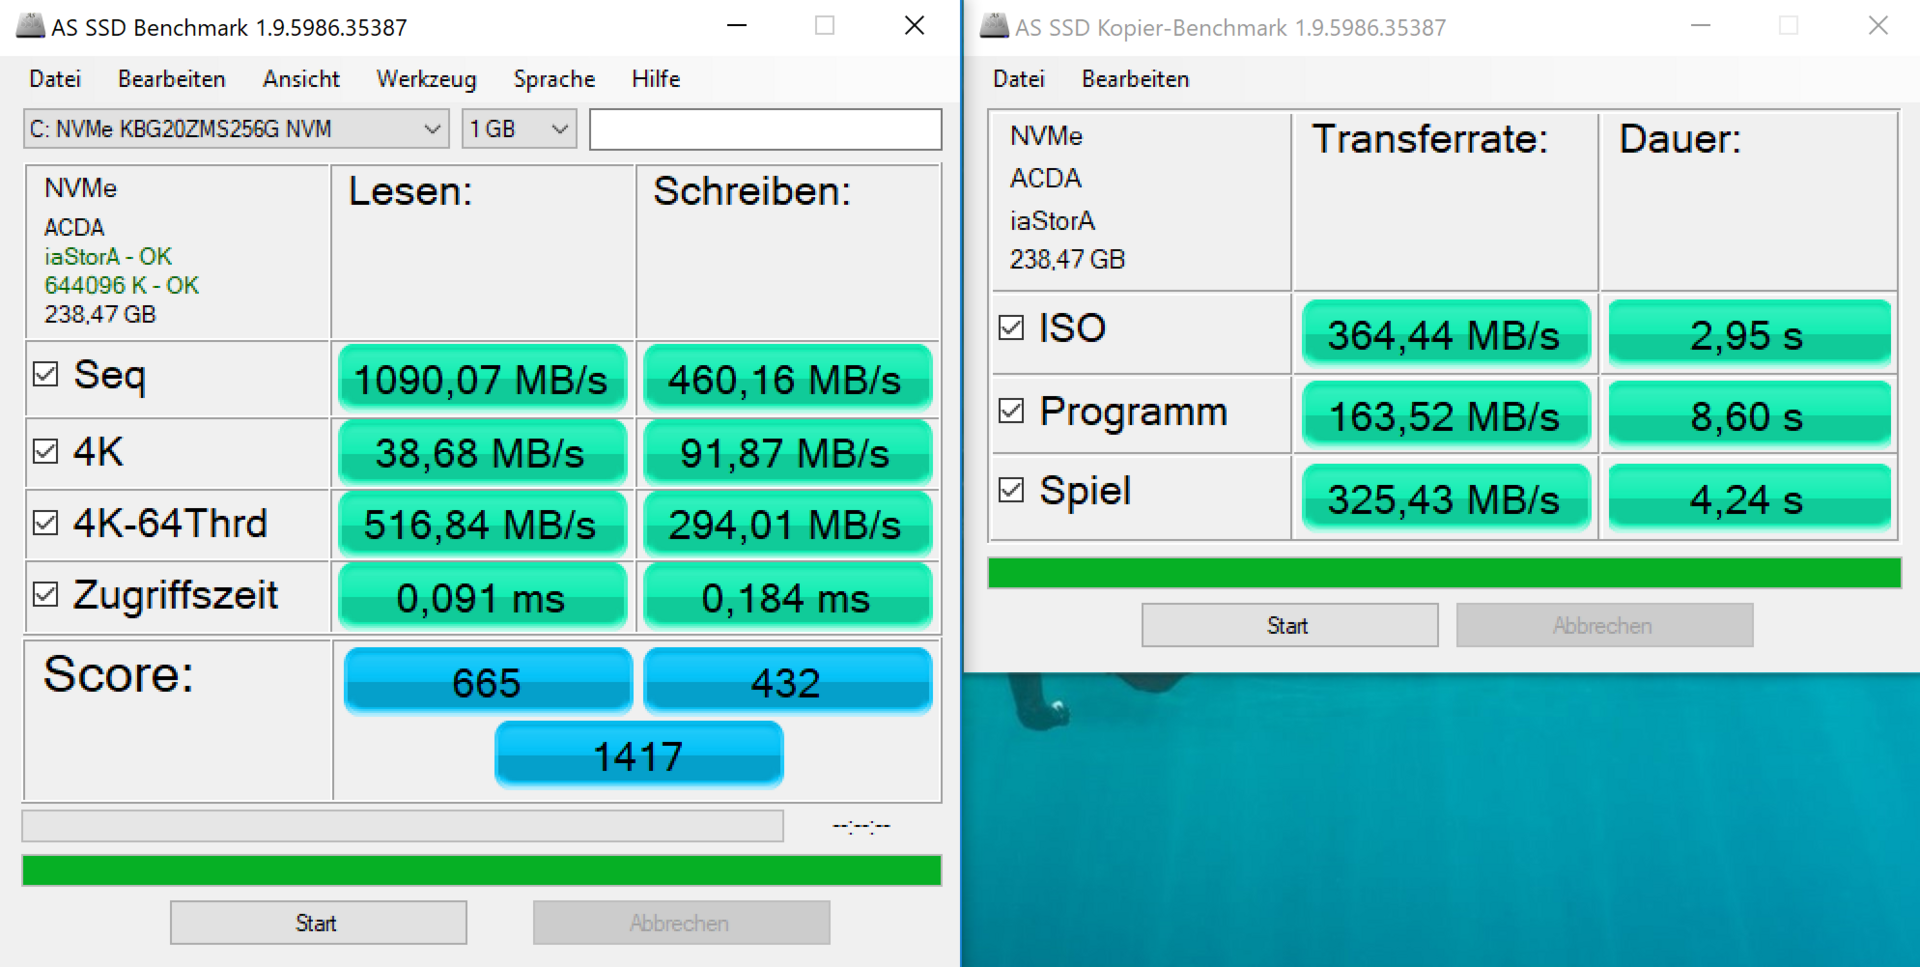
| maximum AS SSD Seq Read Test (1GB) | |
| Lenovo ThinkPad X1 Yoga 2017 20JES03T00 (Toshiba Exceria Pro M401) | |
| Dell Latitude 12 5285 2-in-1 (Toshiba THN-M401S0640E2) | |
| Dell Latitude 7285 (Toshiba Exceria Pro M501) | |
| |||||||||||||||||||||||||
Distribuzione della luminosità: 86 %
Al centro con la batteria: 525 cd/m²
Contrasto: 1435:1 (Nero: 0.37 cd/m²)
ΔE ColorChecker Calman: 3.5 | ∀{0.5-29.43 Ø4.71}
ΔE Greyscale Calman: 4.7 | ∀{0.09-98 Ø4.96}
99.8% sRGB (Argyll 1.6.3 3D)
67.6% AdobeRGB 1998 (Argyll 1.6.3 3D)
74.1% AdobeRGB 1998 (Argyll 3D)
99.8% sRGB (Argyll 3D)
73.3% Display P3 (Argyll 3D)
Gamma: 2.04
CCT: 6581 K
| Dell Latitude 7285 SHP1482 (LQ123Z1), , 2880x1920, 12.3" | Microsoft Surface Pro (2017) i5 LG Display LP123WQ112604, , 2736x1824, 12.3" | Lenovo ThinkPad X1 Yoga 2017 20JES03T00 LEN4140, , 2560x1440, 14" | Dell Latitude 12 5285 2-in-1 BOE06DC, , 1920x1280, 12.3" | Acer Switch 5 SW512-52-5819 WST KL.1200w.004, , 2160x1440, 12" | Toshiba Portege X20W-D-10R Toshiba TOS508F, , 1920x1080, 12.5" | HP Elite x2 1012 G1 LG Philips, , 1920x1280, 12.1" | |
|---|---|---|---|---|---|---|---|
| Display | -5% | -11% | -17% | -5% | -27% | ||
| Display P3 Coverage (%) | 73.3 | 67.6 -8% | 62.8 -14% | 58.8 -20% | 68.7 -6% | 53.8 -27% | |
| sRGB Coverage (%) | 99.8 | 99 -1% | 94 -6% | 87.5 -12% | 96.8 -3% | 73.7 -26% | |
| AdobeRGB 1998 Coverage (%) | 74.1 | 69.1 -7% | 64.7 -13% | 60.6 -18% | 70.4 -5% | 53.8 -27% | |
| Response Times | 5% | 91% | 2% | 15% | -40% | 25% | |
| Response Time Grey 50% / Grey 80% * (ms) | 44 ? | 42 ? 5% | 3.6 ? 92% | 42.4 ? 4% | 37 ? 16% | 67 ? -52% | 33.2 ? 25% |
| Response Time Black / White * (ms) | 30.4 ? | 29 ? 5% | 3.2 ? 89% | 30.8 ? -1% | 26 ? 14% | 39 ? -28% | 22.8 ? 25% |
| PWM Frequency (Hz) | 922 ? | 21000 | 240.4 ? | 210.1 ? | |||
| Screen | 2% | -18% | -10% | -33% | -17% | -35% | |
| Brightness middle (cd/m²) | 531 | 417 -21% | 243 -54% | 523.2 -1% | 369 -31% | 442 -17% | 322 -39% |
| Brightness (cd/m²) | 490 | 401 -18% | 240 -51% | 522 7% | 331 -32% | 410 -16% | 319 -35% |
| Brightness Distribution (%) | 86 | 88 2% | 95 10% | 88 2% | 75 -13% | 86 0% | 97 13% |
| Black Level * (cd/m²) | 0.37 | 0.29 22% | 0.42 -14% | 0.46 -24% | 0.22 41% | 0.42 -14% | |
| Contrast (:1) | 1435 | 1438 0% | 1246 -13% | 802 -44% | 2009 40% | 767 -47% | |
| Colorchecker dE 2000 * | 3.5 | 3.63 -4% | 5.3 -51% | 4 -14% | 5.52 -58% | 5.22 -49% | 6.02 -72% |
| Colorchecker dE 2000 max. * | 6.2 | 6.74 -9% | 8.9 -44% | 8.6 -39% | 9.29 -50% | 11.84 -91% | 10.06 -62% |
| Greyscale dE 2000 * | 4.7 | 2.18 54% | 3.7 21% | 5.5 -17% | 6.95 -48% | 7.88 -68% | 6.29 -34% |
| Gamma | 2.04 108% | 3.09 71% | 1.78 124% | 2.16 102% | 2.58 85% | 2.51 88% | 2.4 92% |
| CCT | 6581 99% | 6767 96% | 6202 105% | 7546 86% | 7009 93% | 6756 96% | 7712 84% |
| Color Space (Percent of AdobeRGB 1998) (%) | 67.6 | 63 -7% | 84.8 25% | 64.86 -4% | 56 -17% | 64 -5% | 47.8 -29% |
| Color Space (Percent of sRGB) (%) | 99.8 | 99 -1% | 100 0% | 93.97 -6% | 88 -12% | 97 -3% | 73.2 -27% |
| Media totale (Programma / Settaggio) | 1% /
1% | 37% /
4% | -6% /
-9% | -12% /
-23% | -21% /
-17% | -12% /
-25% |
* ... Meglio usare valori piccoli
Tempi di risposta del Display
| ↔ Tempi di risposta dal Nero al Bianco | ||
|---|---|---|
| 30.4 ms ... aumenta ↗ e diminuisce ↘ combinato | ↗ 15.6 ms Incremento | 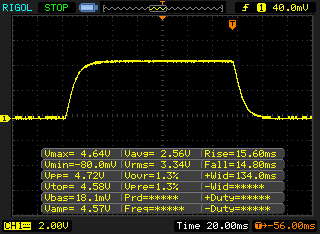 |
| ↘ 14.8 ms Calo | ||
| Lo schermo mostra tempi di risposta lenti nei nostri tests e sarà insoddisfacente per i gamers. In confronto, tutti i dispositivi di test variano da 0.1 (minimo) a 240 (massimo) ms. » 82 % di tutti i dispositivi è migliore. Questo significa che i tempi di risposta rilevati sono peggiori rispetto alla media di tutti i dispositivi testati (19.8 ms). | ||
| ↔ Tempo di risposta dal 50% Grigio all'80% Grigio | ||
| 44 ms ... aumenta ↗ e diminuisce ↘ combinato | ↗ 19.6 ms Incremento | 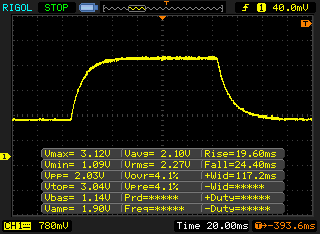 |
| ↘ 24.4 ms Calo | ||
| Lo schermo mostra tempi di risposta lenti nei nostri tests e sarà insoddisfacente per i gamers. In confronto, tutti i dispositivi di test variano da 0.165 (minimo) a 636 (massimo) ms. » 73 % di tutti i dispositivi è migliore. Questo significa che i tempi di risposta rilevati sono peggiori rispetto alla media di tutti i dispositivi testati (31 ms). | ||
Sfarfallio dello schermo / PWM (Pulse-Width Modulation)
| flickering dello schermo / PWM rilevato | 922 Hz | ≤ 20 % settaggio luminosita' | 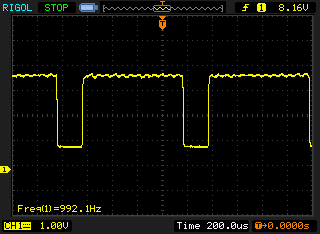 |
Il display sfarfalla a 922 Hz (Probabilmente a causa dell'uso di PWM) Flickering rilevato ad una luminosita' di 20 % o inferiore. Non dovrebbe verificarsi flickering o PWM sopra questo valore di luminosita'. La frequenza di 922 Hz è abbastanza alta, quindi la maggioranza degli utenti sensibili al PWM non dovrebbero notare alcun flickering. In confronto: 52 % di tutti i dispositivi testati non utilizza PWM per ridurre la luminosita' del display. Se è rilevato PWM, una media di 7757 (minimo: 5 - massimo: 343500) Hz è stata rilevata. | |||
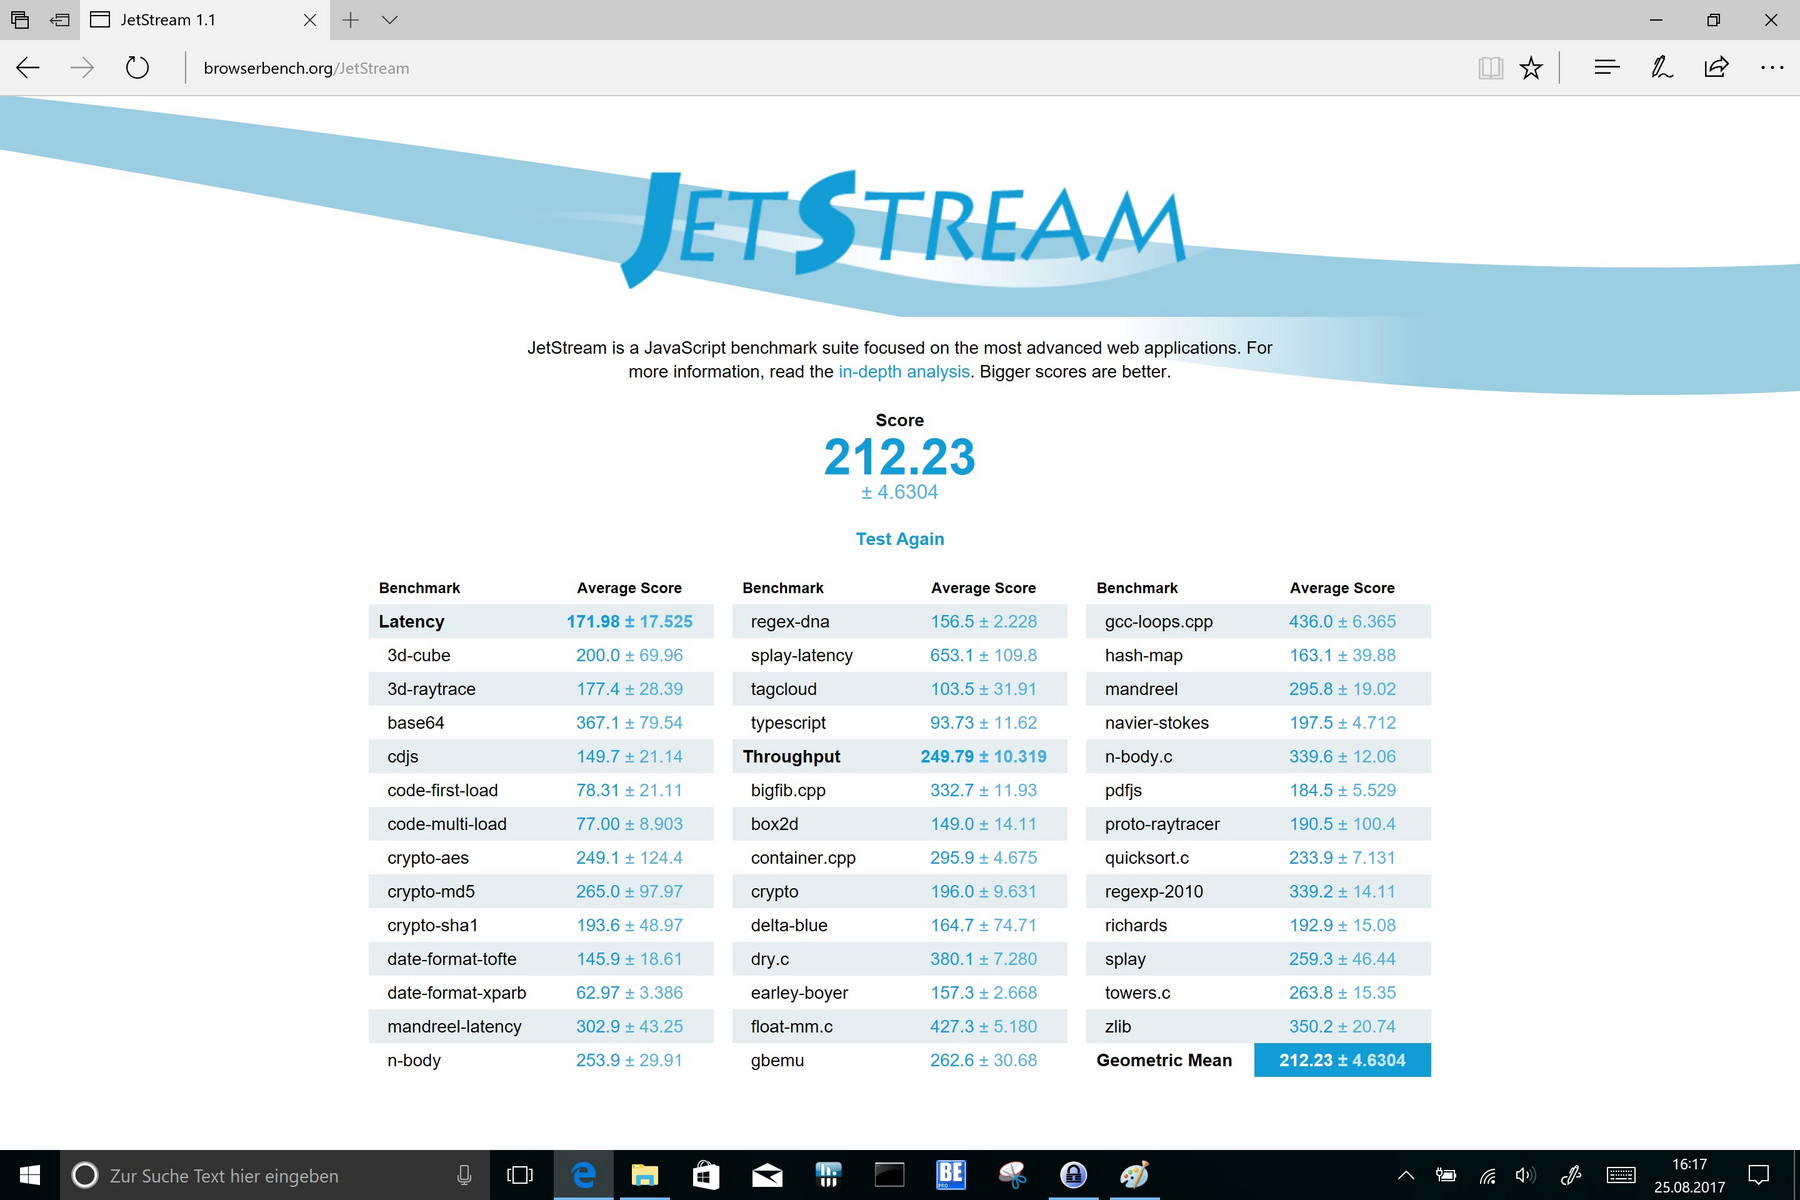
| JetStream 1.1 - 1.1 Total | |
| Lenovo ThinkPad X1 Yoga 2017 20JES03T00 | |
| Toshiba Portege X20W-D-10R | |
| Acer Switch 5 SW512-52-5819 | |
| Microsoft Surface Pro (2017) i5 | |
| Dell Latitude 7285 | |
| HP Elite x2 1012 G1 | |
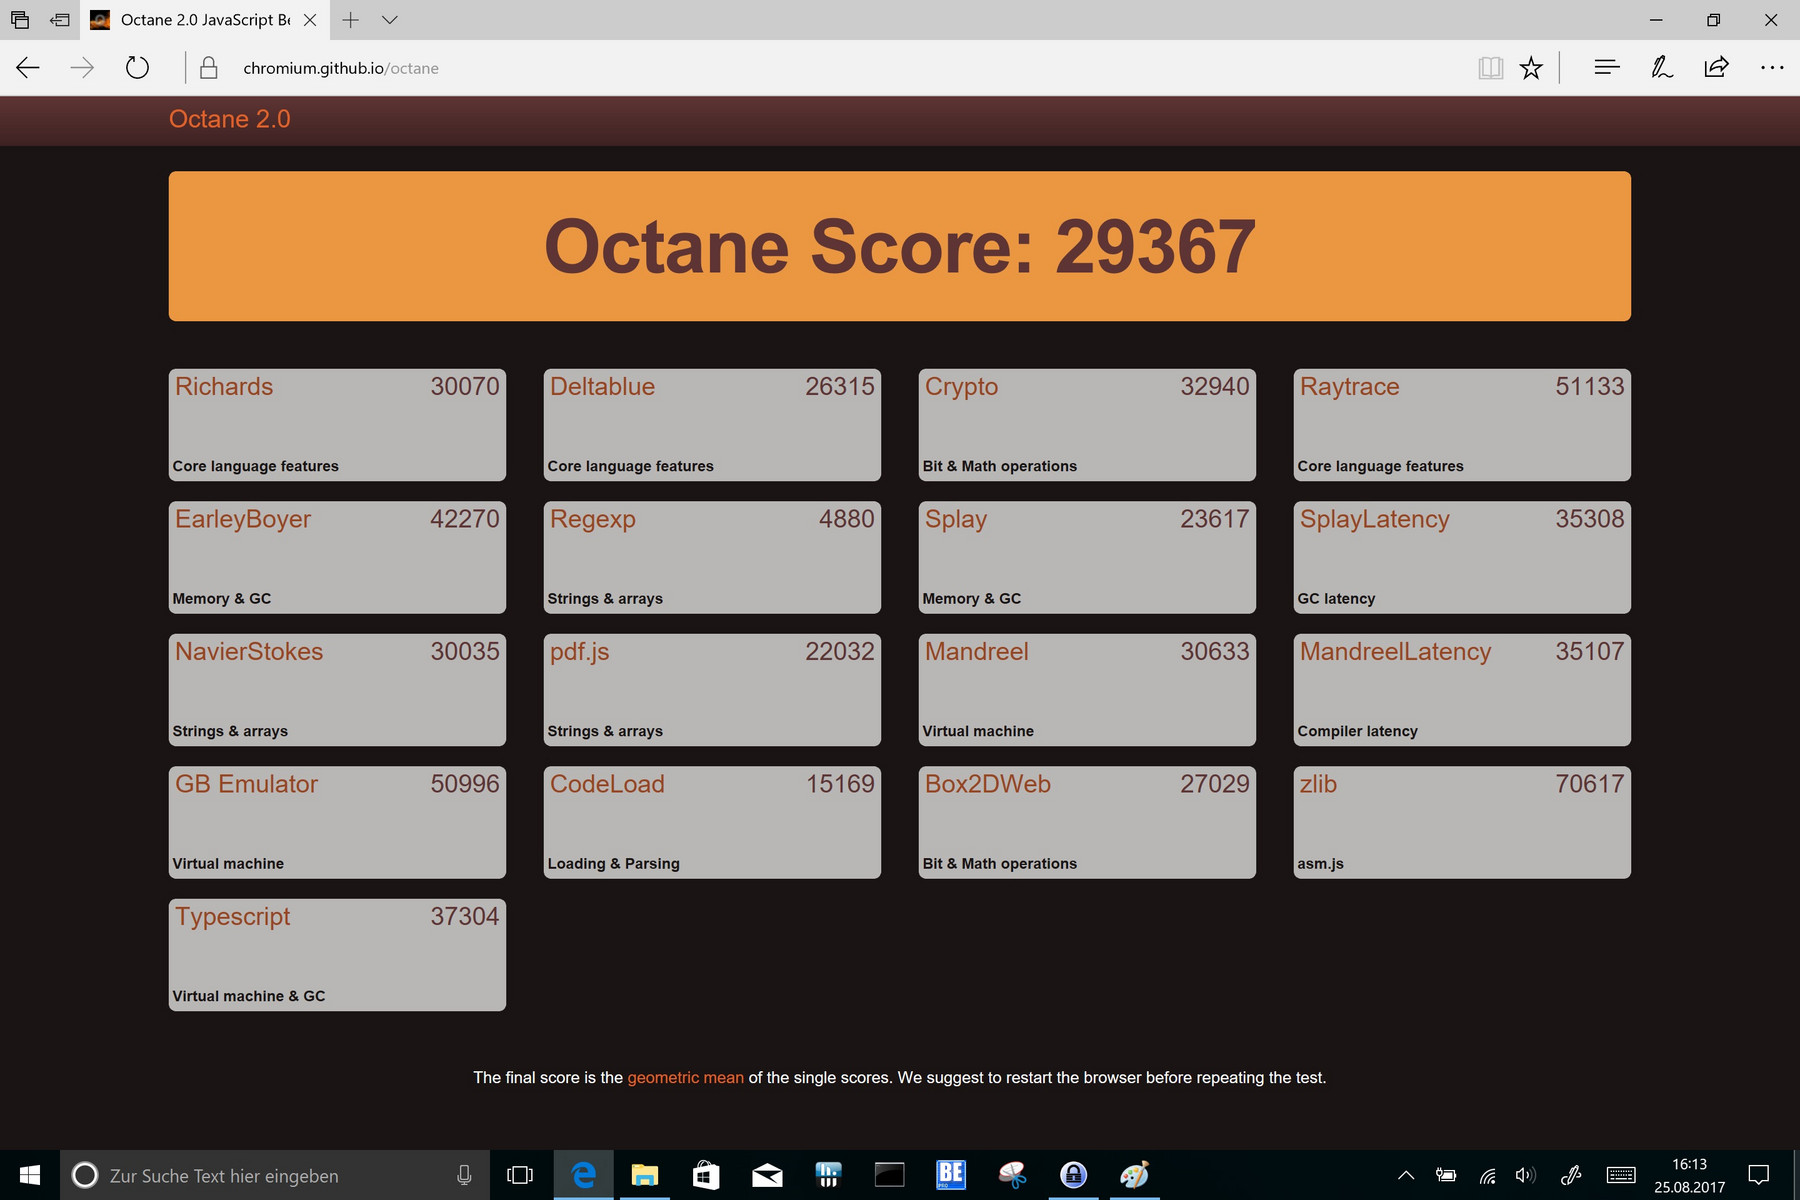
| Octane V2 - Total Score | |
| Toshiba Portege X20W-D-10R | |
| Microsoft Surface Pro (2017) i5 | |
| Acer Switch 5 SW512-52-5819 | |
| Lenovo ThinkPad X1 Yoga 2017 20JES03T00 | |
| Dell Latitude 7285 | |
| HP Elite x2 1012 G1 | |
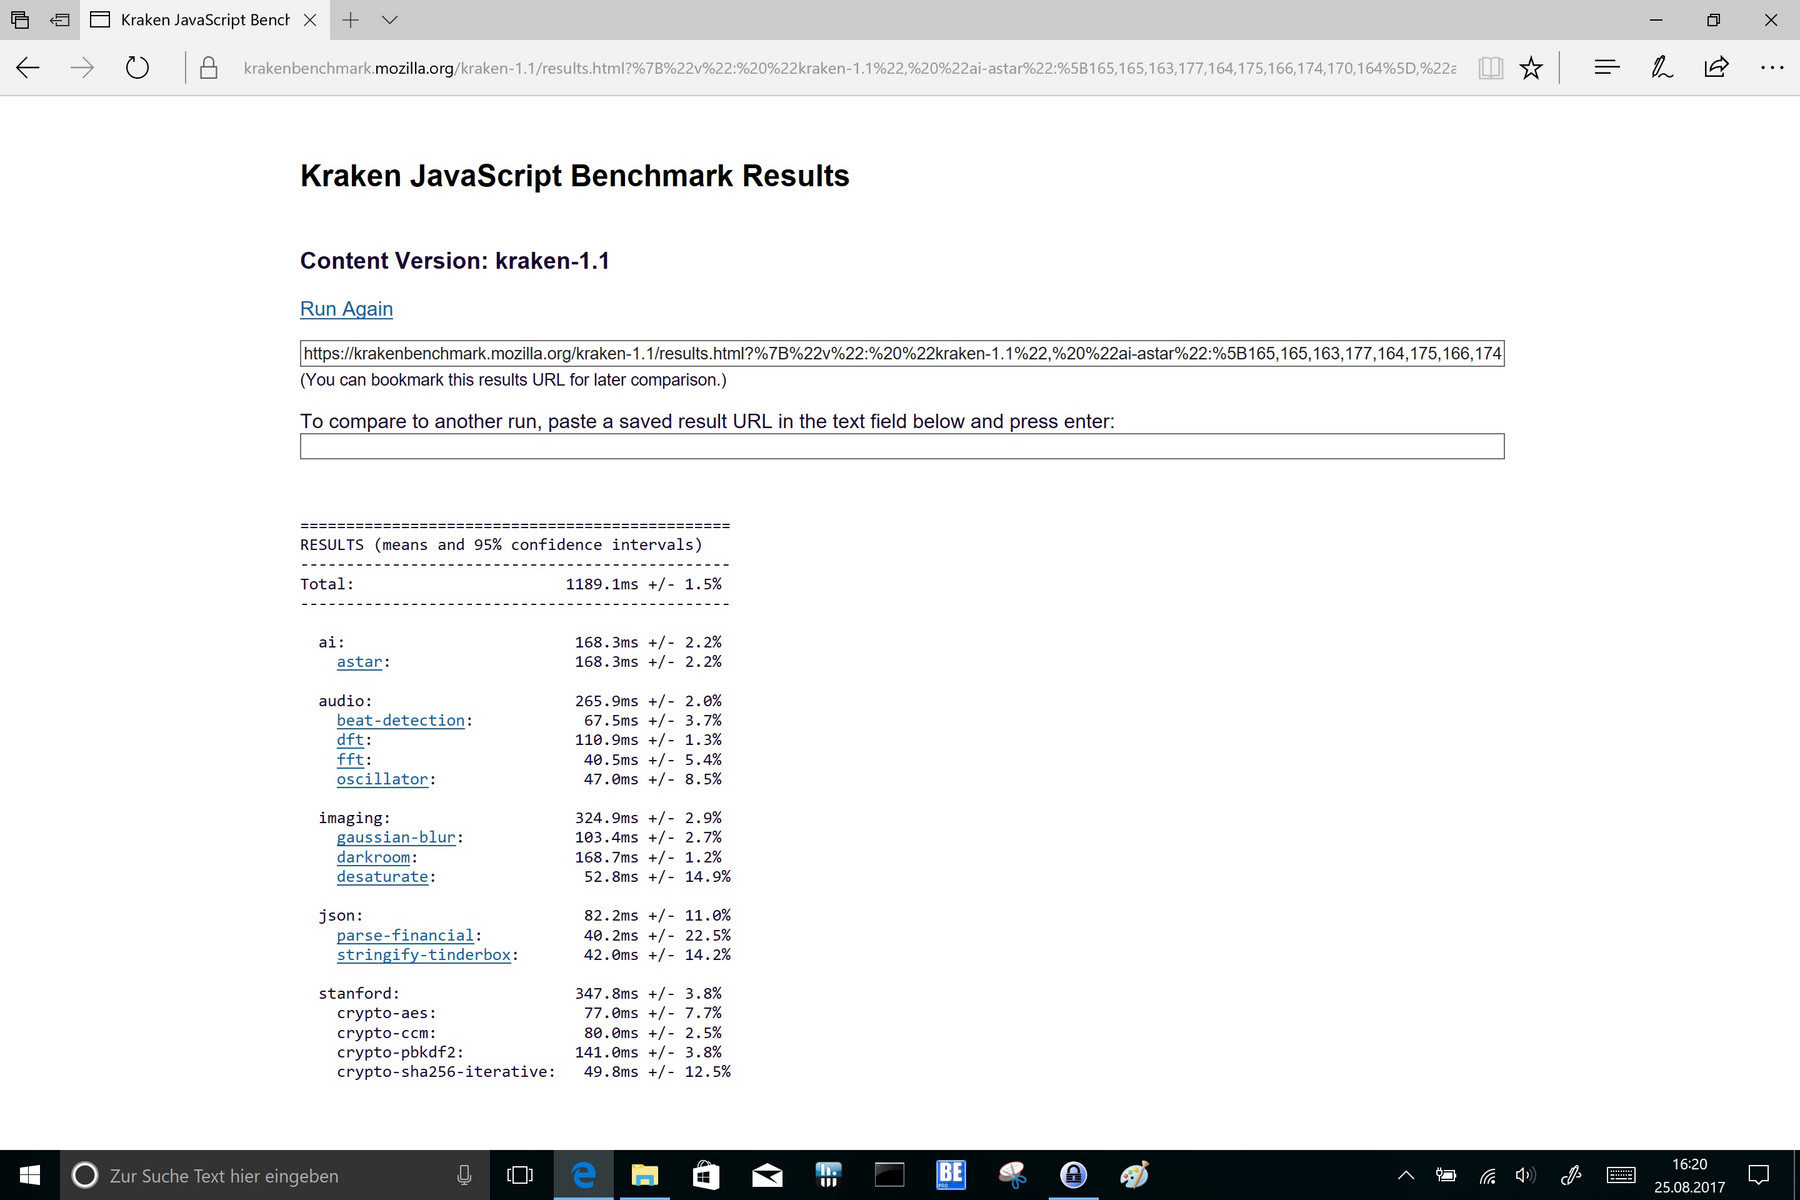
| Mozilla Kraken 1.1 - Total | |
| HP Elite x2 1012 G1 | |
| Dell Latitude 7285 | |
| Acer Switch 5 SW512-52-5819 | |
| Toshiba Portege X20W-D-10R | |
| Lenovo ThinkPad X1 Yoga 2017 20JES03T00 | |
* ... Meglio usare valori piccoli
| PCMark 10 | |
| Score | |
| Acer Switch 5 SW512-52-5819 | |
| Microsoft Surface Pro (2017) i5 | |
| Dell Latitude 7285 | |
| Productivity | |
| Acer Switch 5 SW512-52-5819 | |
| Microsoft Surface Pro (2017) i5 | |
| Dell Latitude 7285 | |
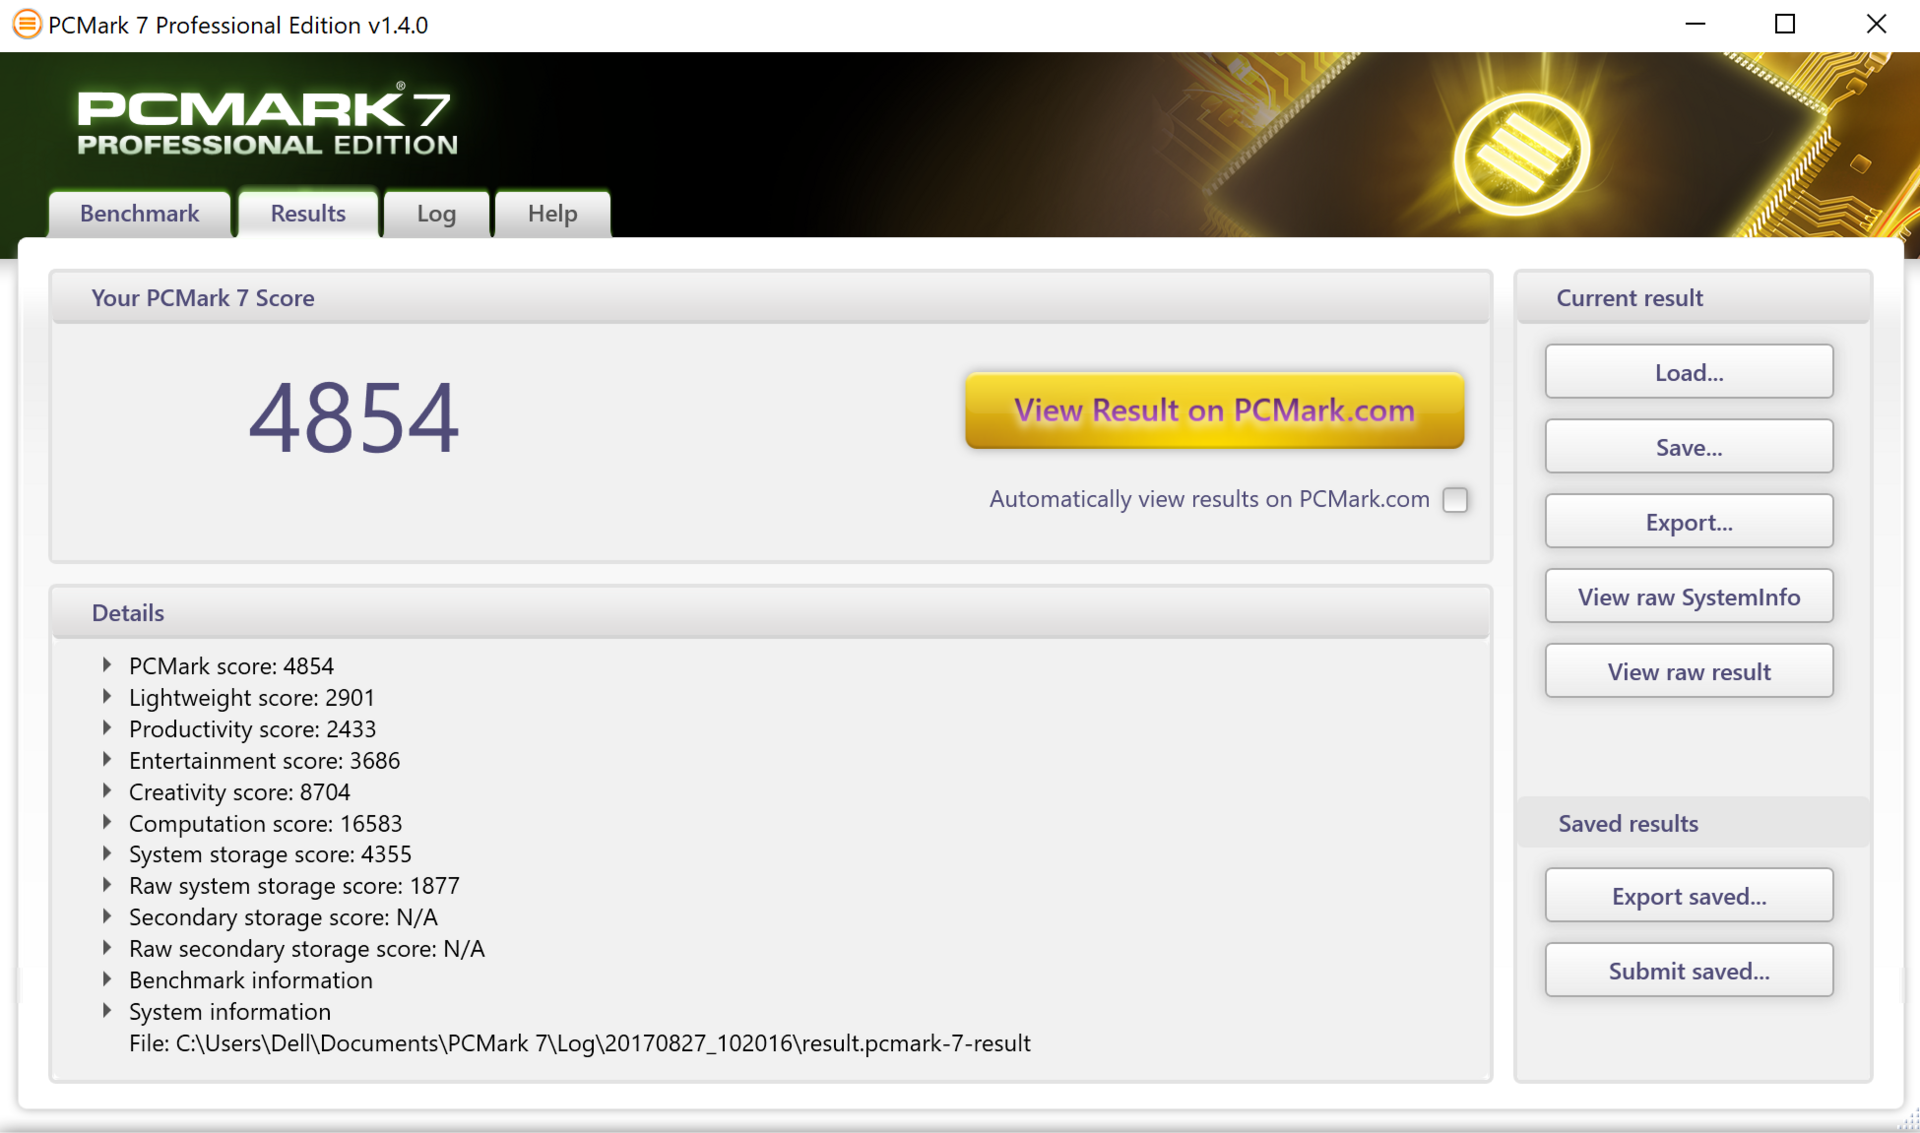
| PCMark 7 Score | 4854 punti | |
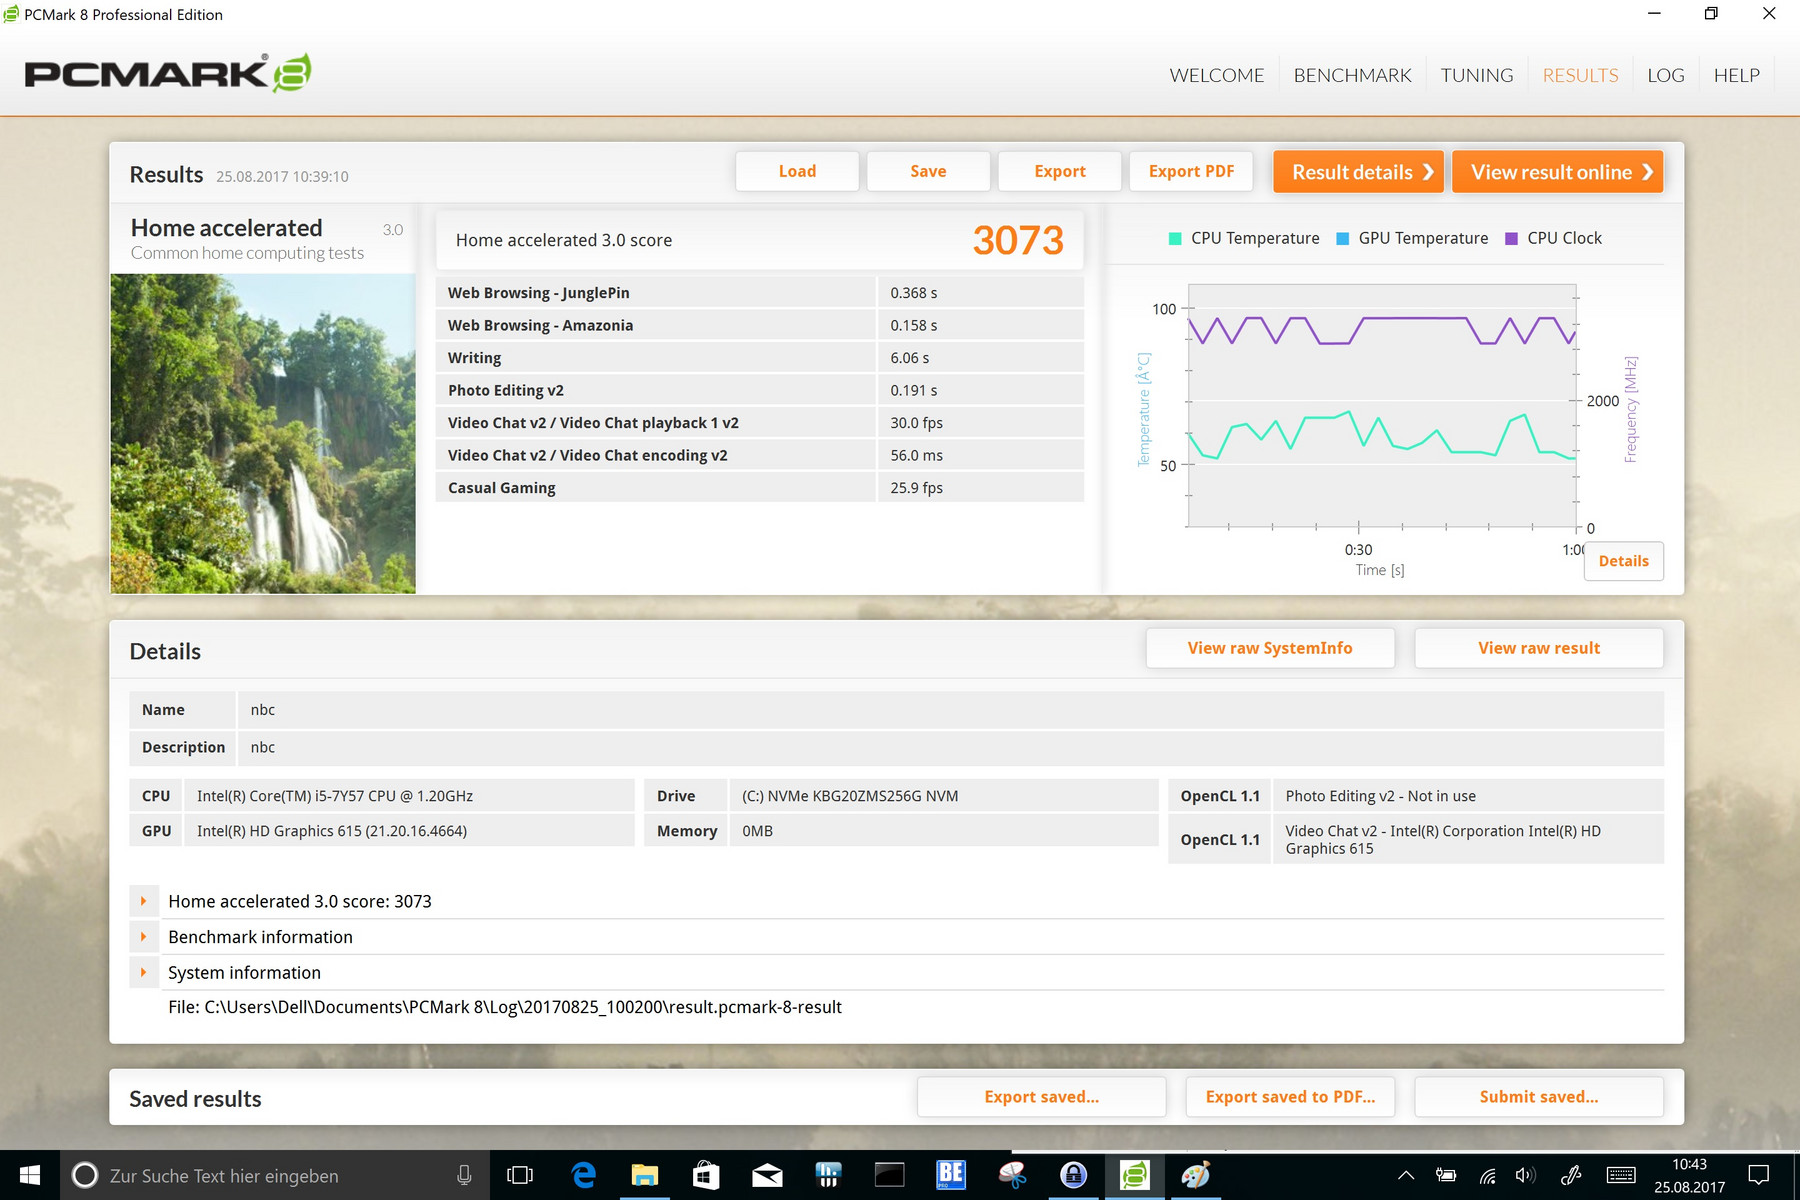
| PCMark 8 Home Score Accelerated v2 | 3073 punti | |
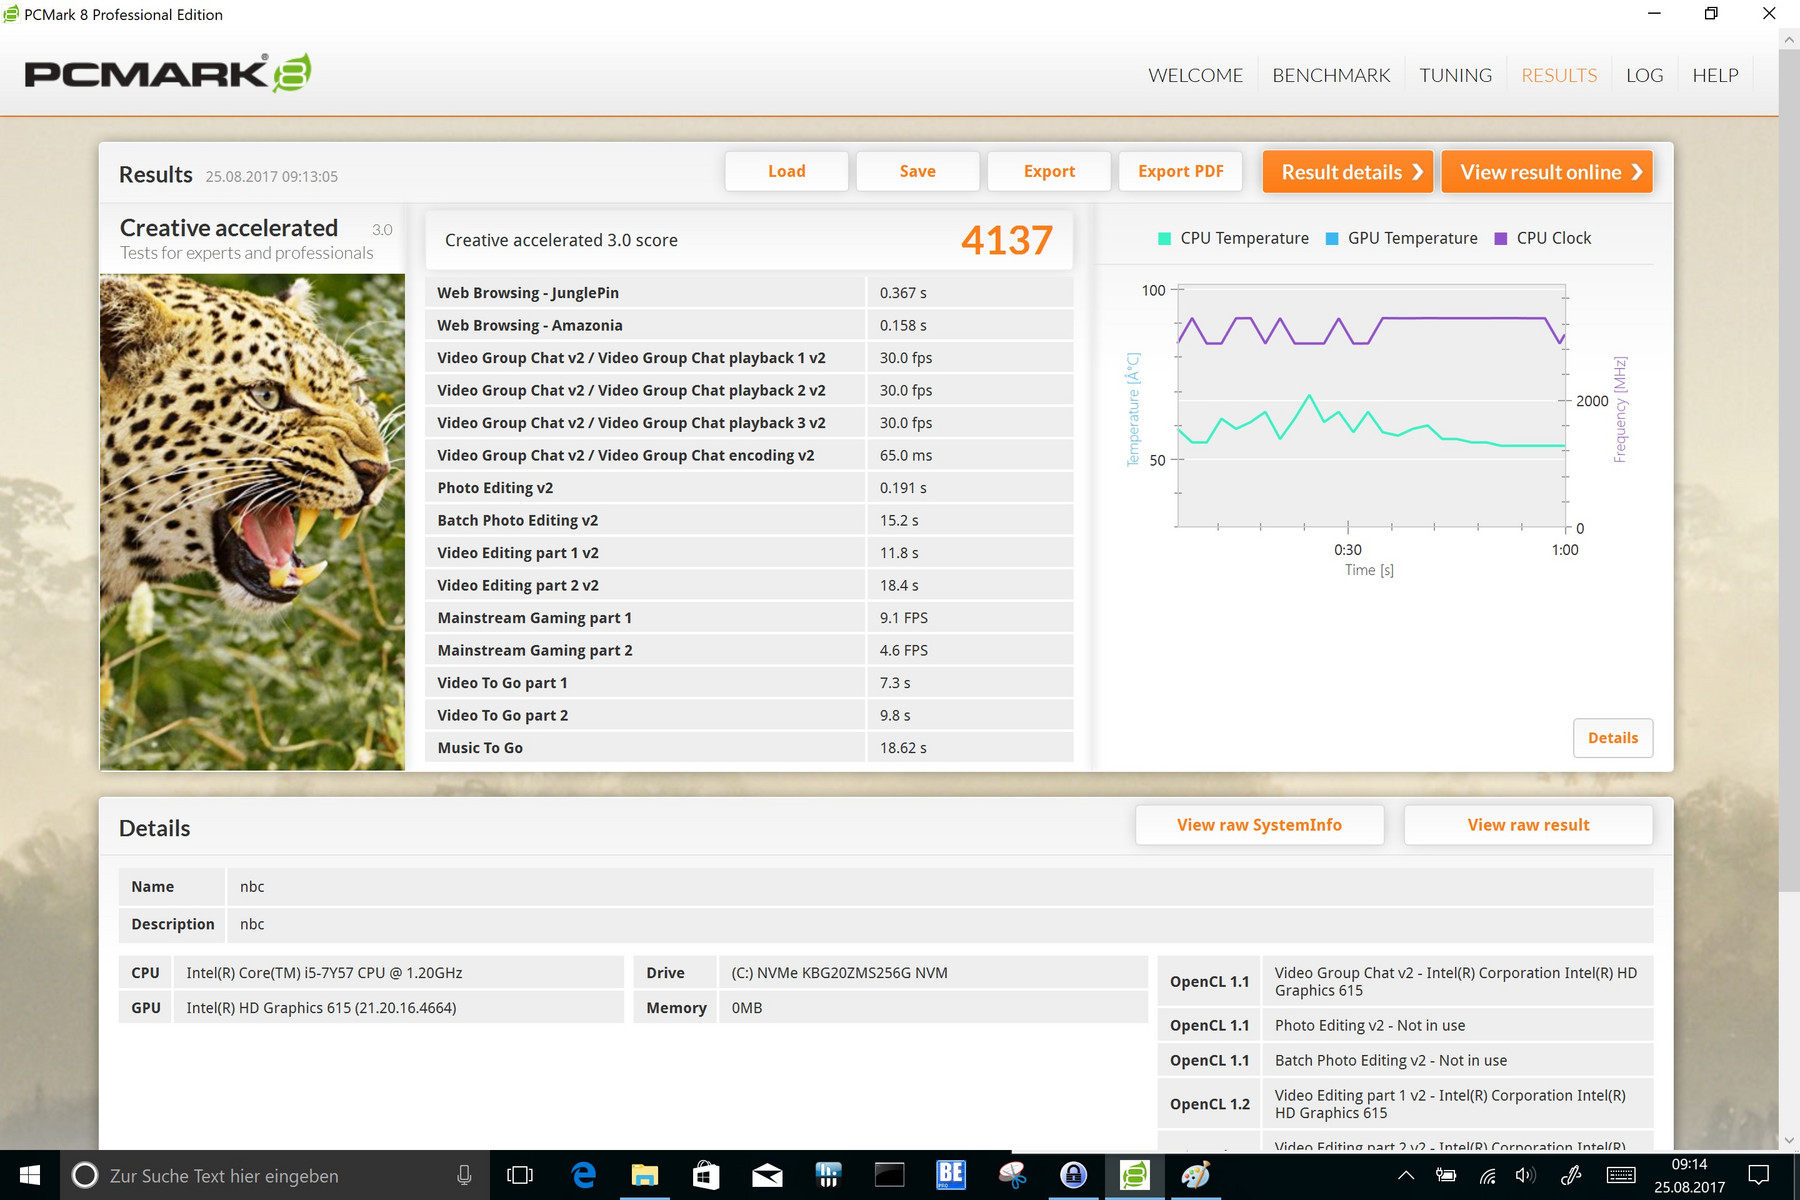
| PCMark 8 Creative Score Accelerated v2 | 4137 punti | |
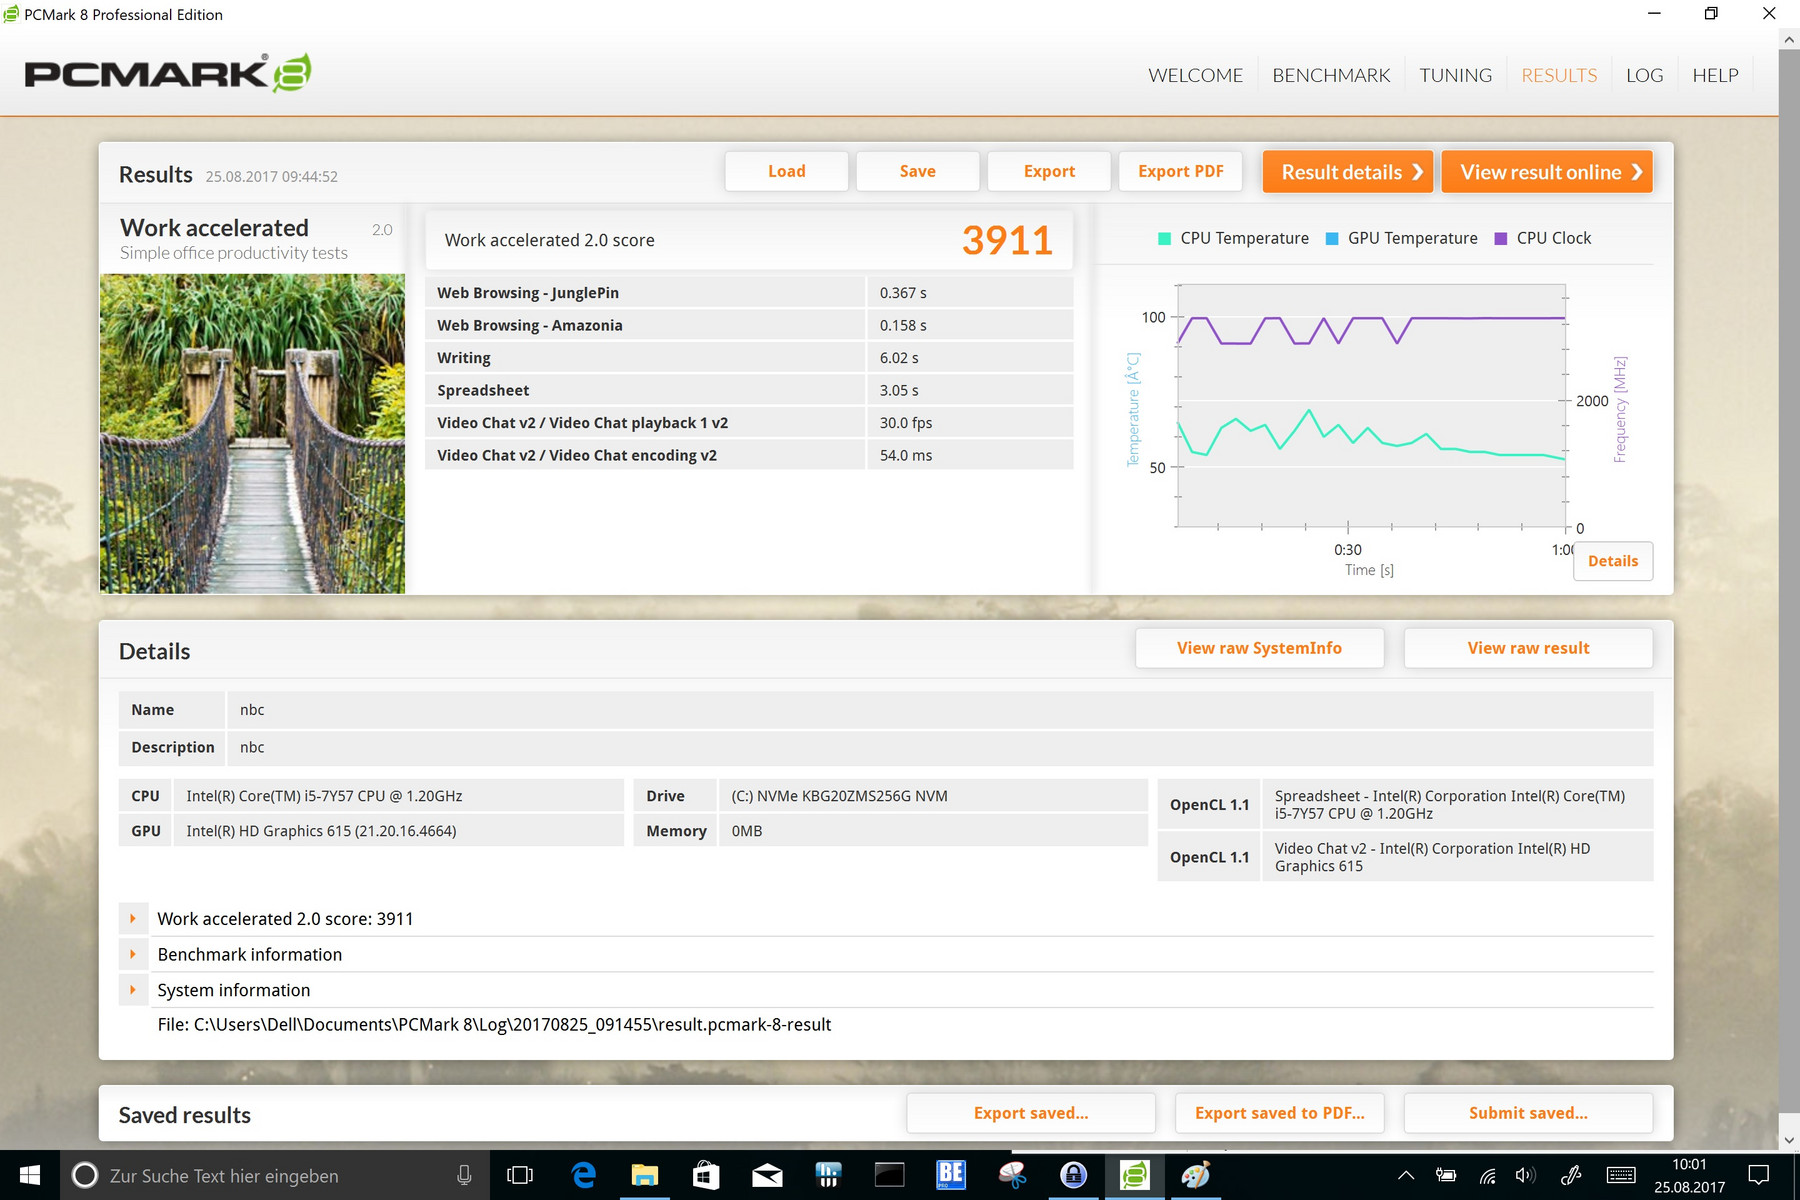
| PCMark 8 Work Score Accelerated v2 | 3911 punti | |
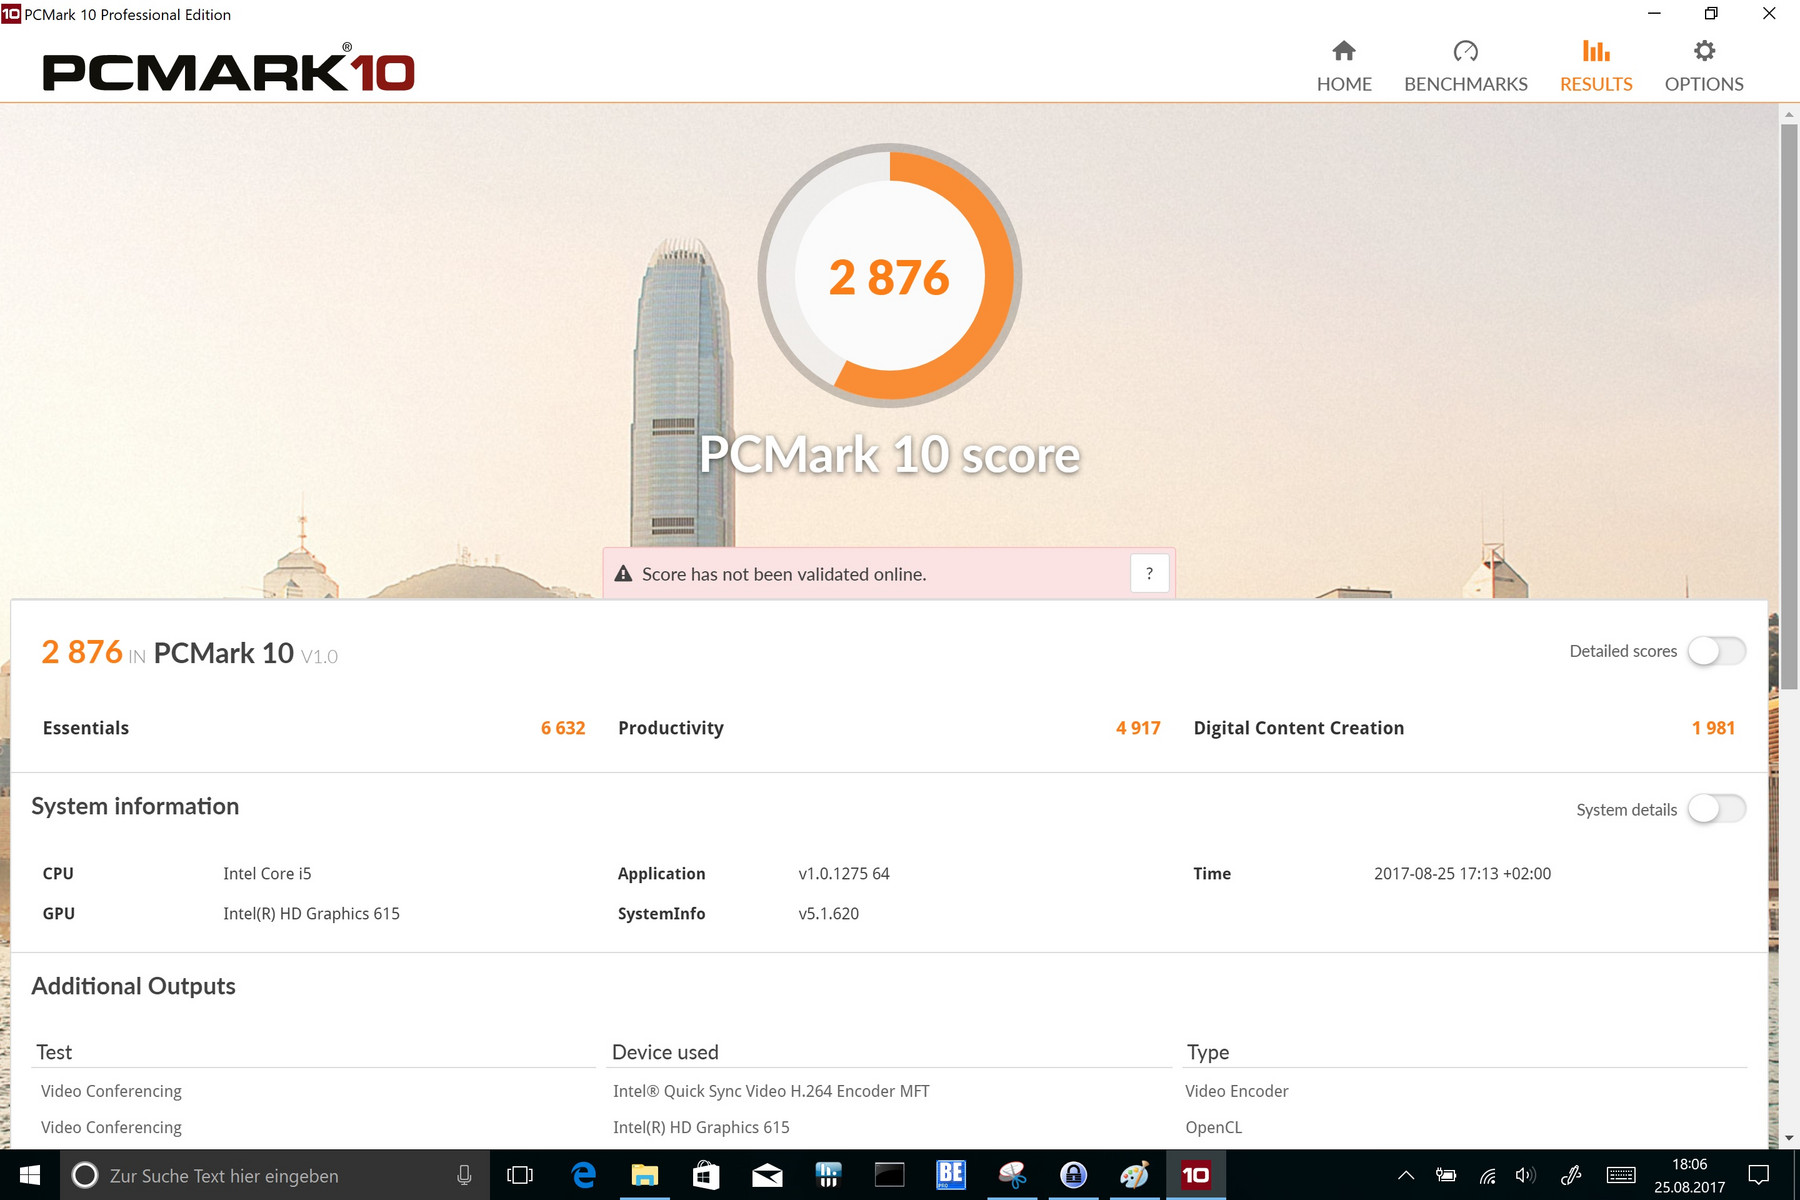
| PCMark 10 Score | 2876 punti | |
Aiuto | ||
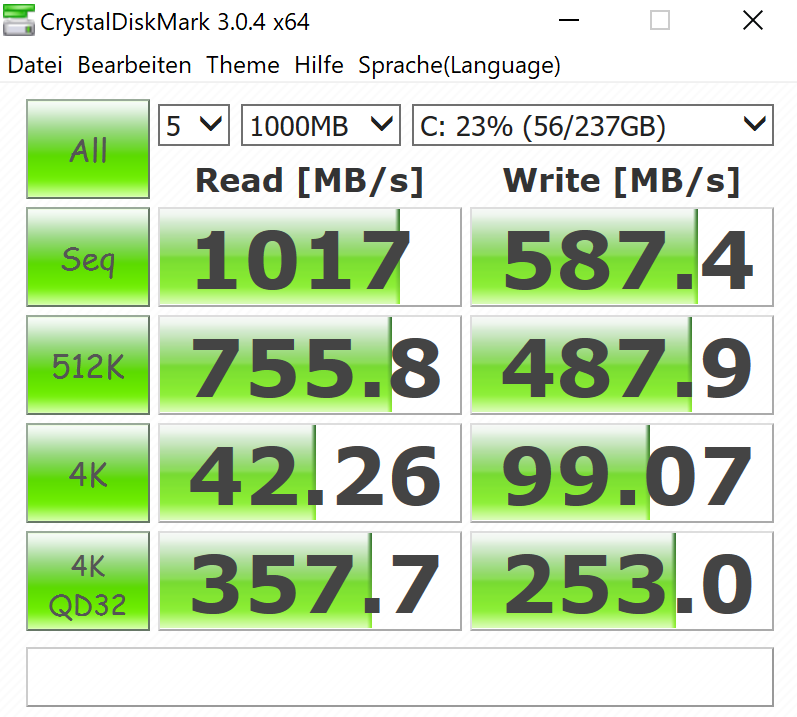
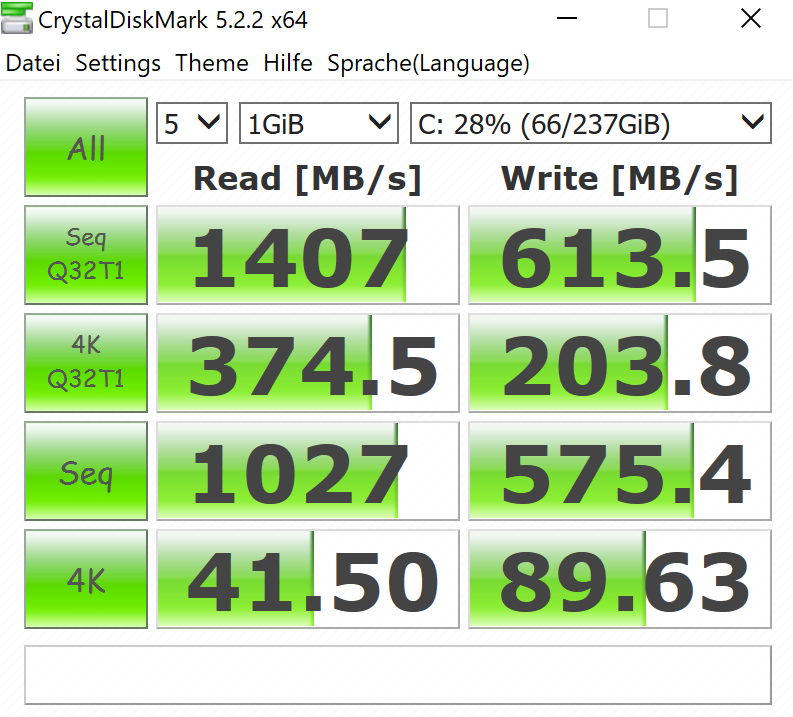
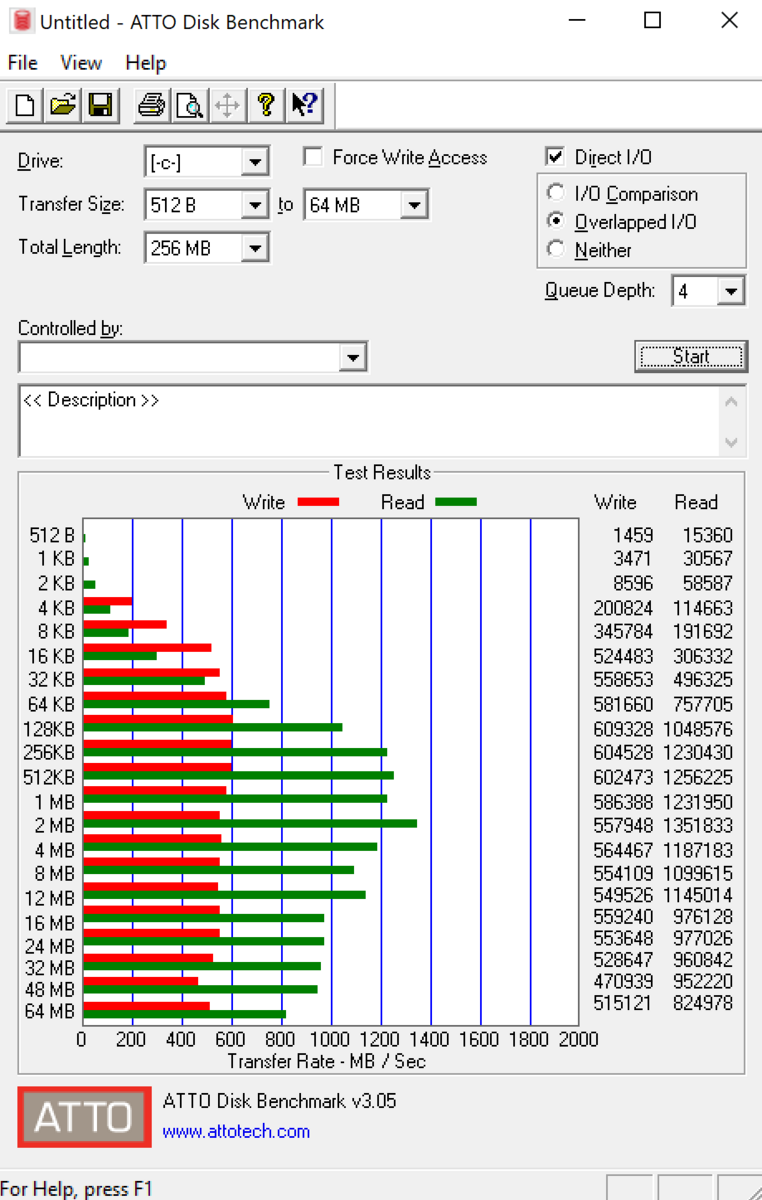
| Dell Latitude 7285 Toshiba KBG20ZMS256G | Microsoft Surface Pro (2017) i5 Samsung PM971 KUS030202M | Lenovo ThinkPad X1 Yoga 2017 20JES03T00 Samsung SSD PM961 1TB M.2 PCIe 3.0 x4 NVMe (MZVLW1T0) | Dell Latitude 12 5285 2-in-1 Samsung PM961 MZVLW256HEHP | Acer Switch 5 SW512-52-5819 Intel SSD 600p SSDPEKKW512G7 | Toshiba Portege X20W-D-10R Toshiba SG5 THNSNK512GVN8 | HP Elite x2 1012 G1 Liteon L8H-256V2G | |
|---|---|---|---|---|---|---|---|
| CrystalDiskMark 3.0 | 4% | 97% | 13% | 13% | -35% | -32% | |
| Read Seq (MB/s) | 1017 | 723 -29% | 2004 97% | 1294 27% | 1066 5% | 469 -54% | 501 -51% |
| Write Seq (MB/s) | 587 | 853 45% | 1693 188% | 865 47% | 593 1% | 277.3 -53% | 297.2 -49% |
| Read 512 (MB/s) | 756 | 225 -70% | 1040 38% | 406 -46% | 653 -14% | 404.4 -47% | 351.7 -53% |
| Write 512 (MB/s) | 487.9 | 445 -9% | 1292 165% | 589 21% | 535 10% | 266.6 -45% | 295.7 -39% |
| Read 4k (MB/s) | 45.26 | 46 2% | 58.2 29% | 31.75 -30% | 35.92 -21% | 25.24 -44% | 28.31 -37% |
| Write 4k (MB/s) | 99.1 | 125 26% | 182.2 84% | 72.2 -27% | 128.3 29% | 89.4 -10% | 90.3 -9% |
| Read 4k QD32 (MB/s) | 357.7 | 423 18% | 632 77% | 493.3 38% | 460.6 29% | 322.5 -10% | 285 -20% |
| Write 4k QD32 (MB/s) | 253 | 373 47% | 507 100% | 434.5 72% | 425.4 68% | 208.1 -18% | 268.4 6% |

| 3DMark 11 - 1280x720 Performance GPU | |
| Lenovo ThinkPad X1 Yoga 2017 20JES03T00 | |
| Acer Switch 5 SW512-52-5819 | |
| Dell Latitude 12 5285 2-in-1 | |
| Toshiba Portege X20W-D-10R | |
| Dell Latitude 7285 | |
| HP Elite x2 1012 G1 | |
| 3DMark 06 Standard Score | 7909 punti | |
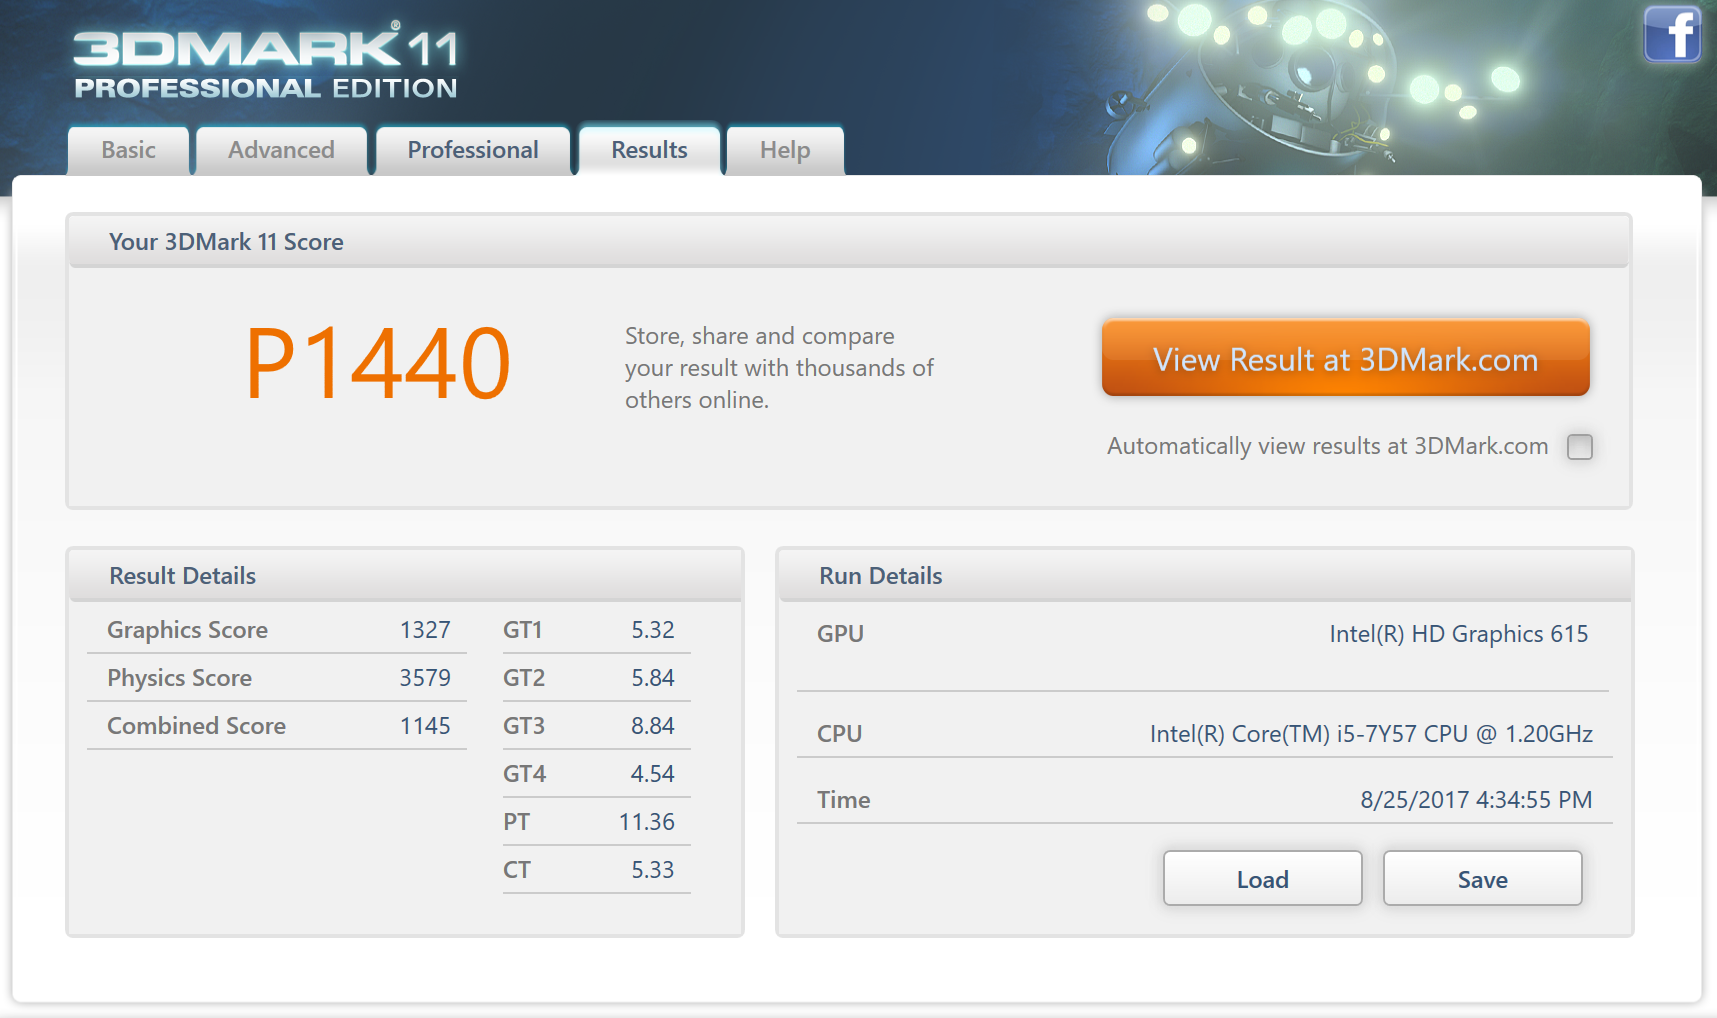
| 3DMark 11 Performance | 1440 punti | |
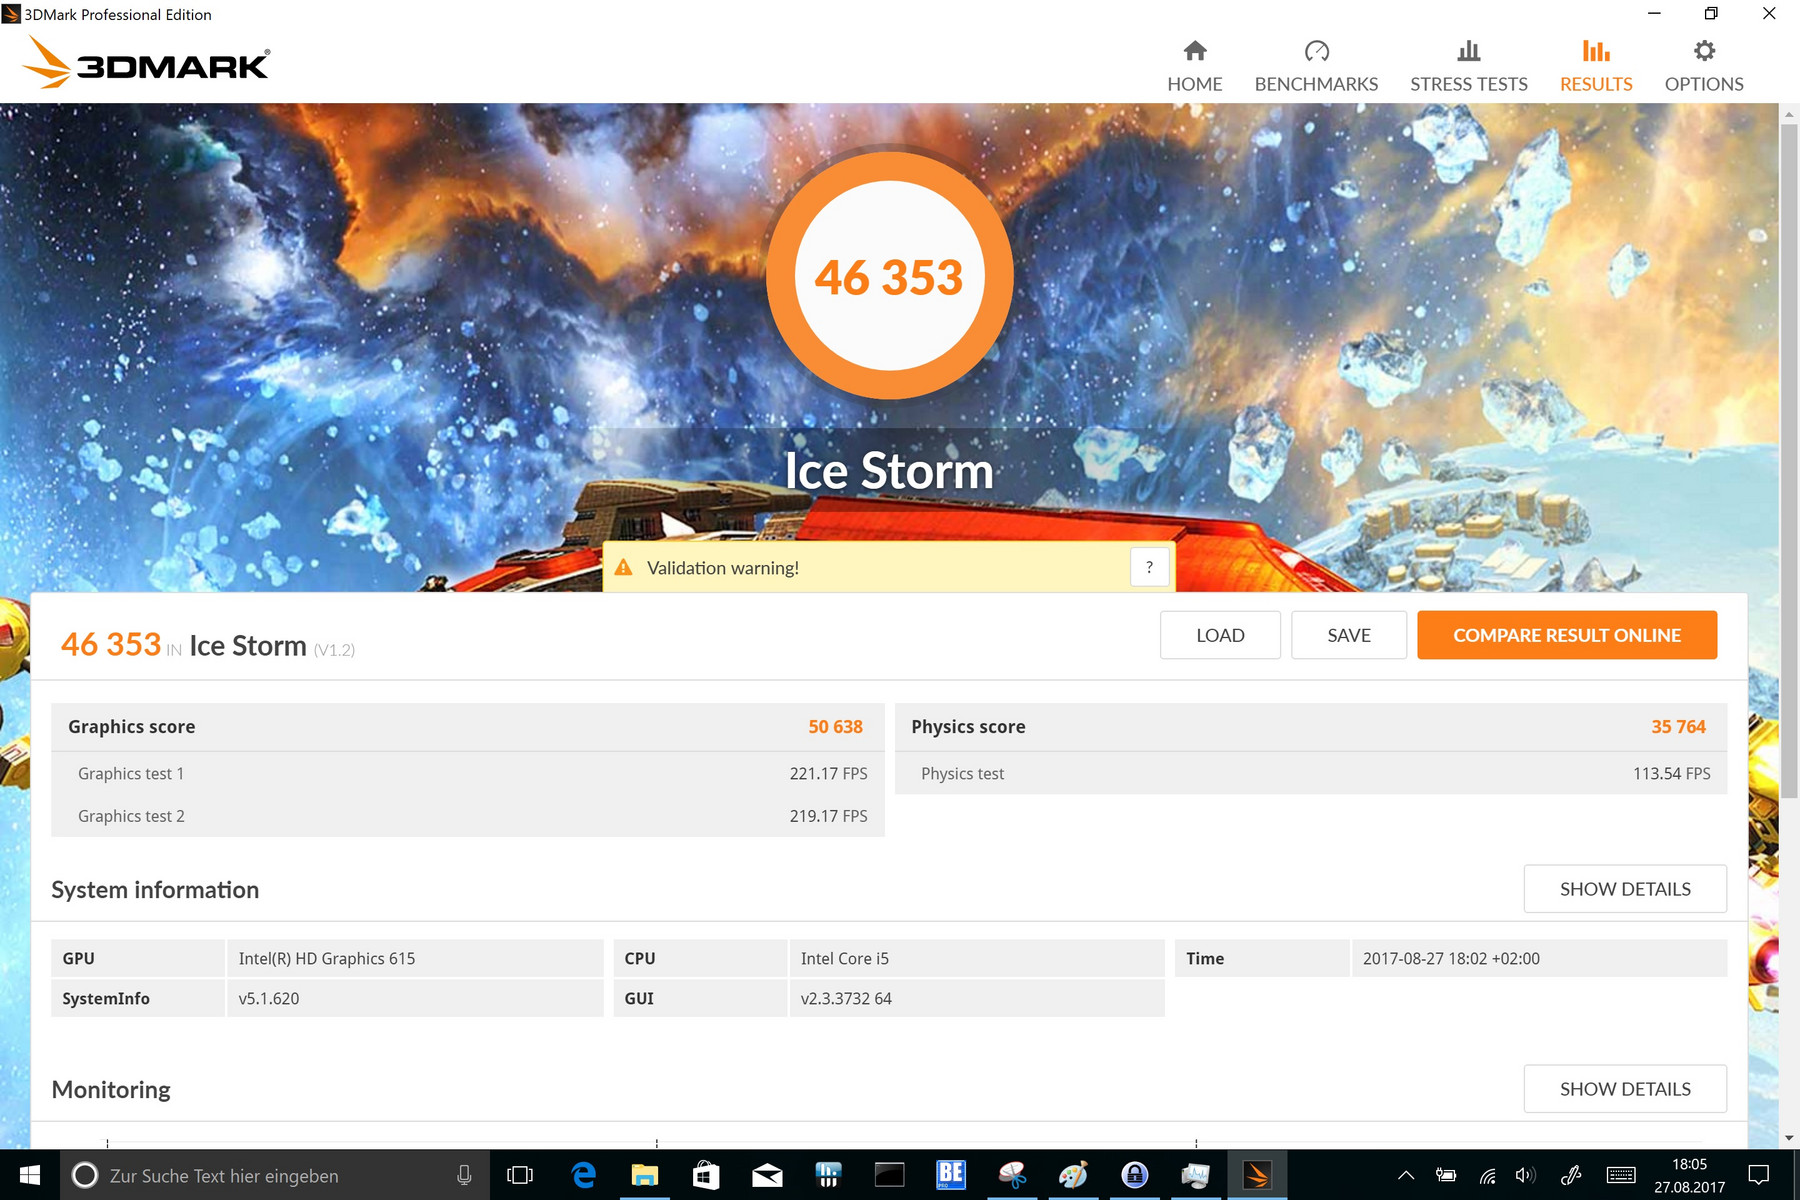
| 3DMark Ice Storm Standard Score | 46353 punti | |
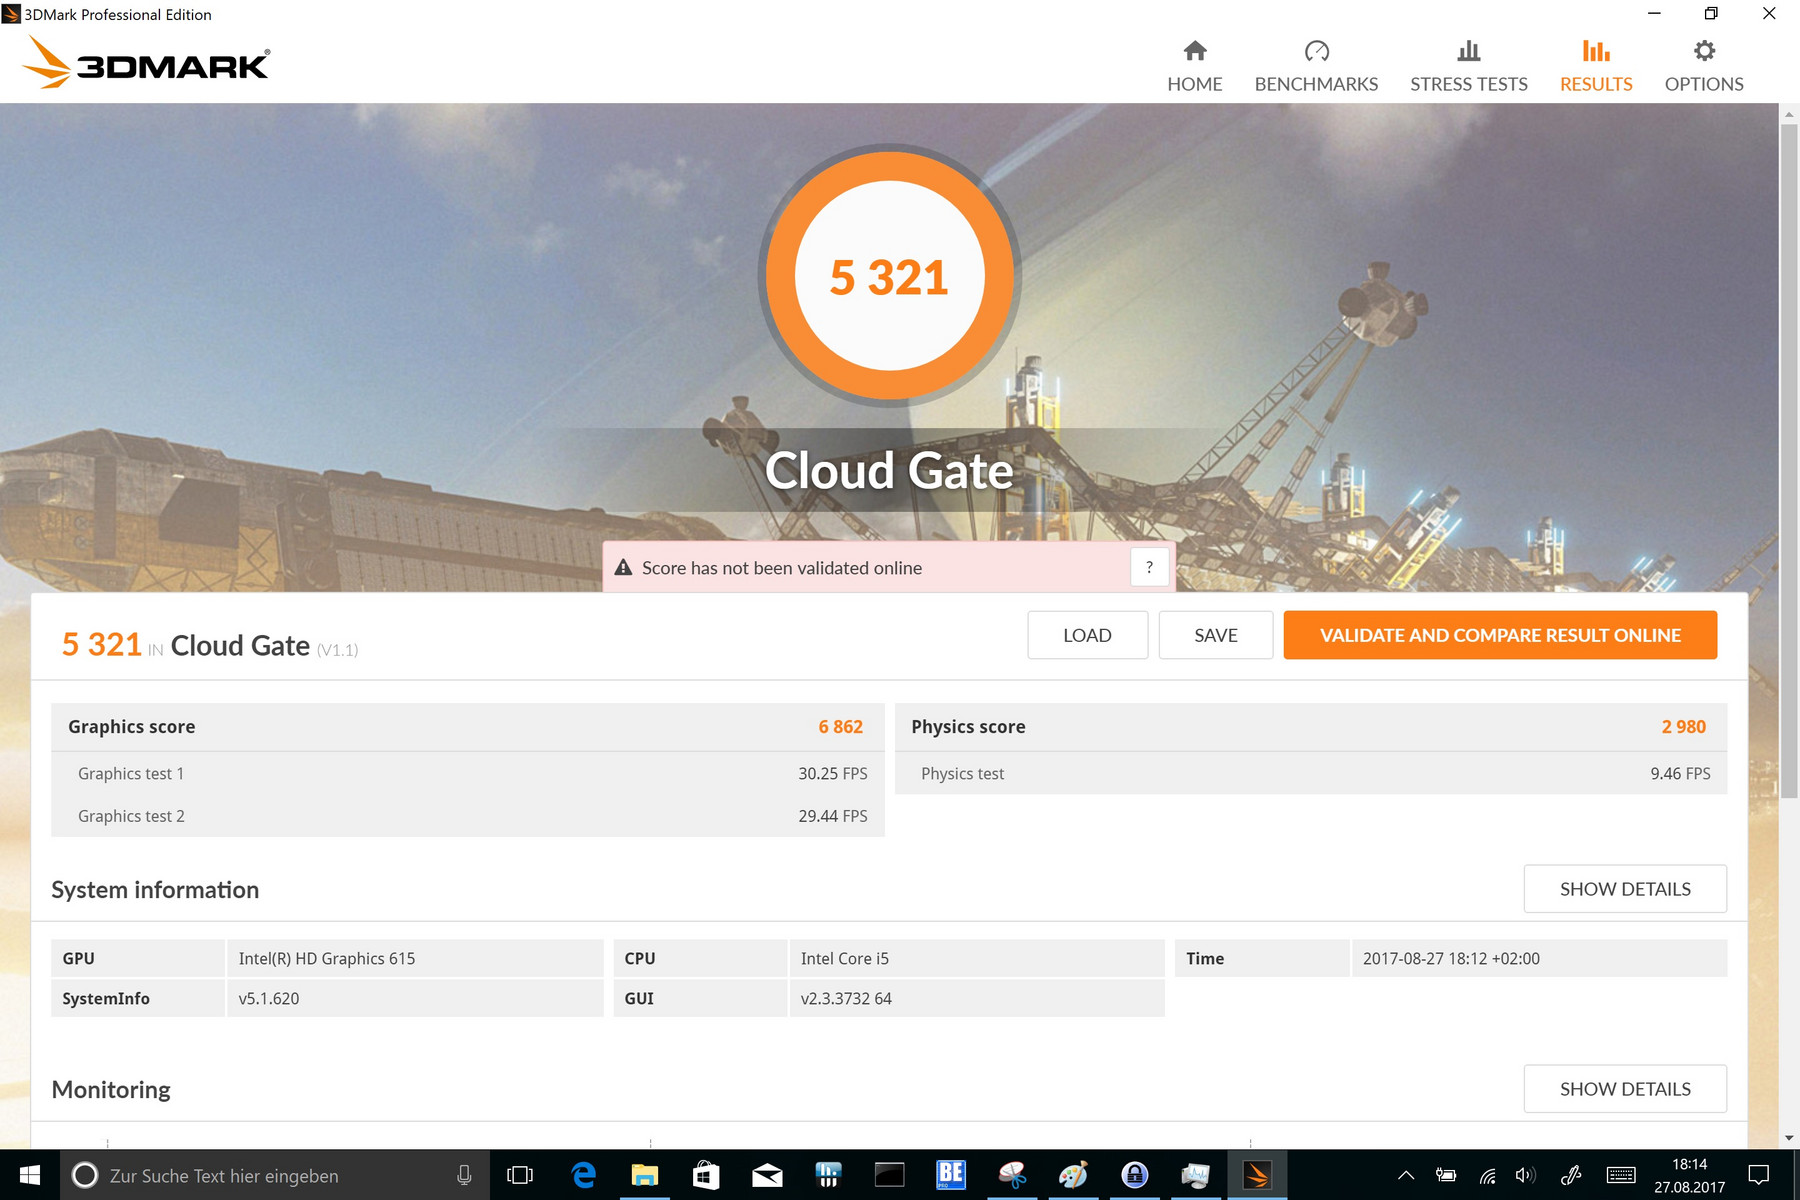
| 3DMark Cloud Gate Standard Score | 5321 punti | |
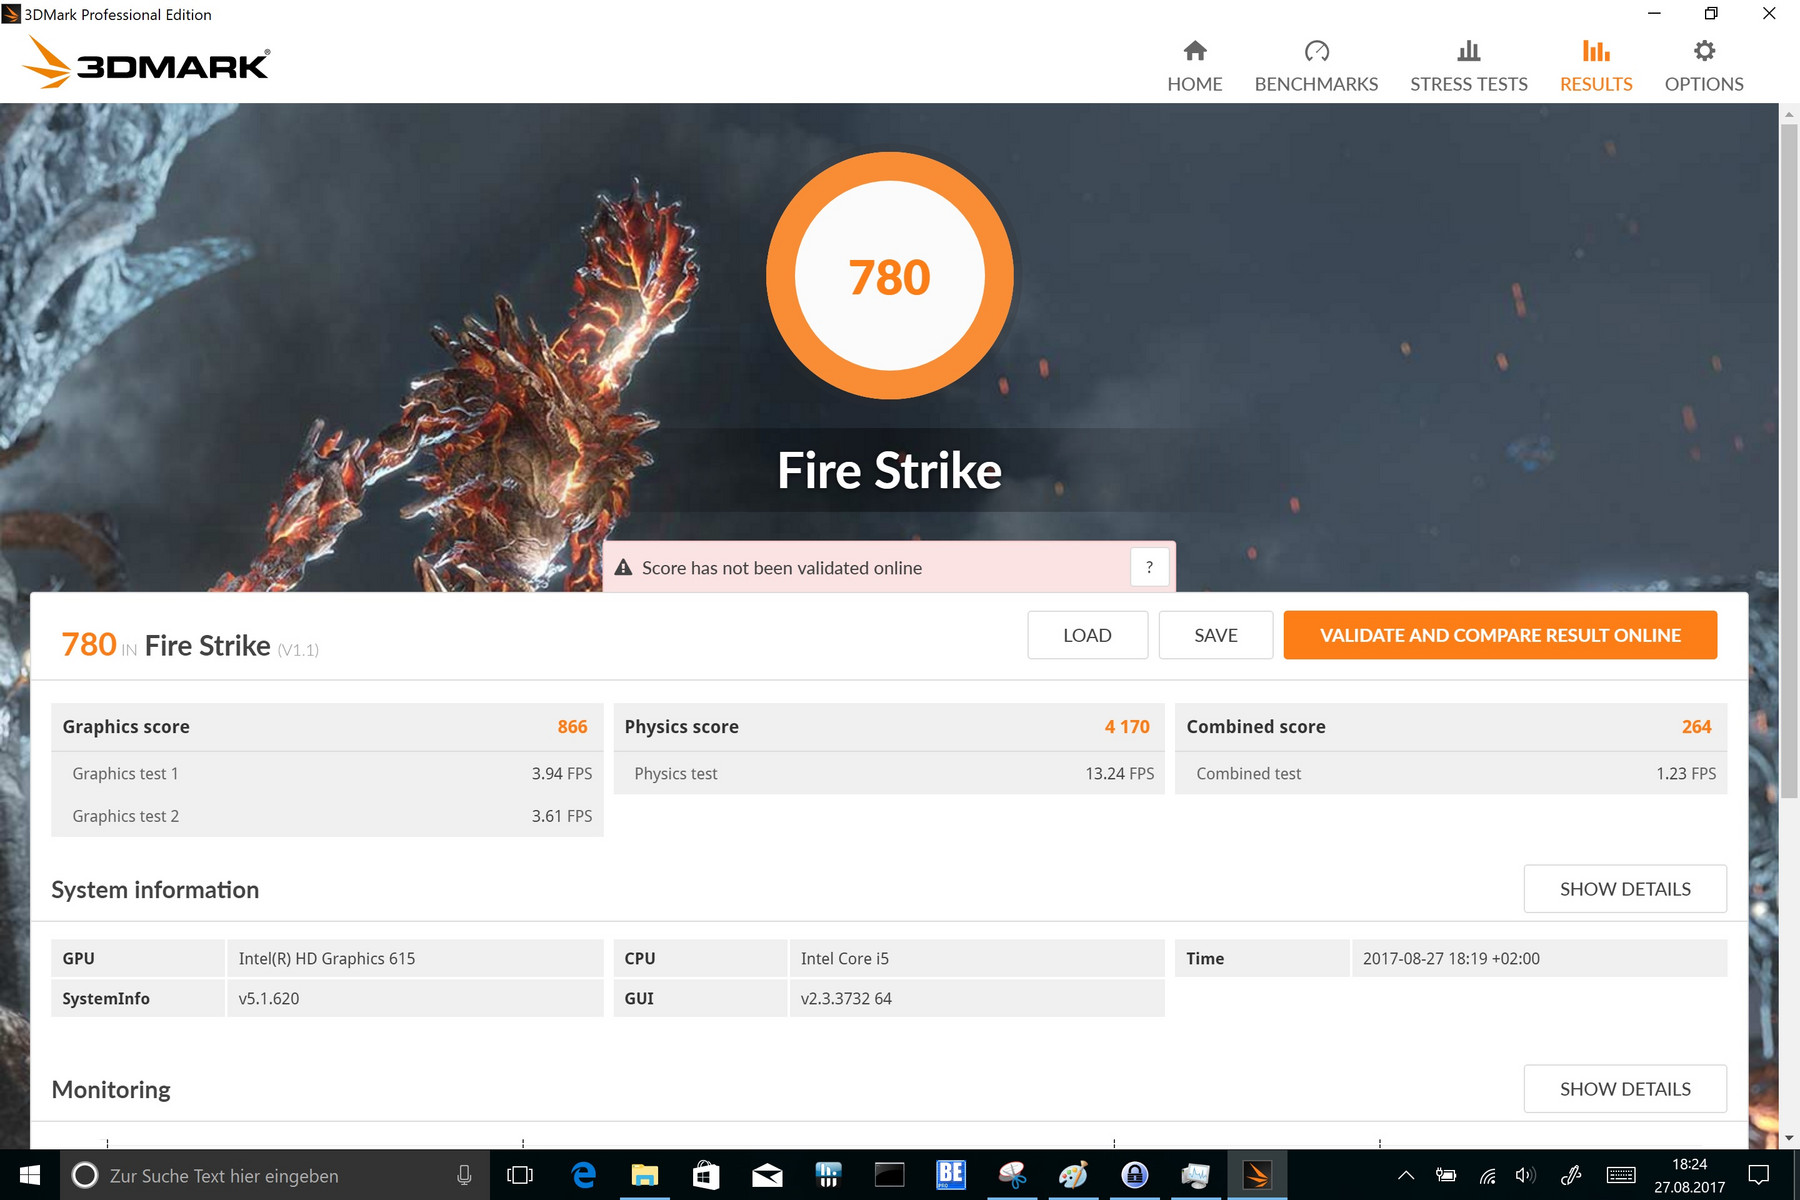
| 3DMark Fire Strike Score | 780 punti | |
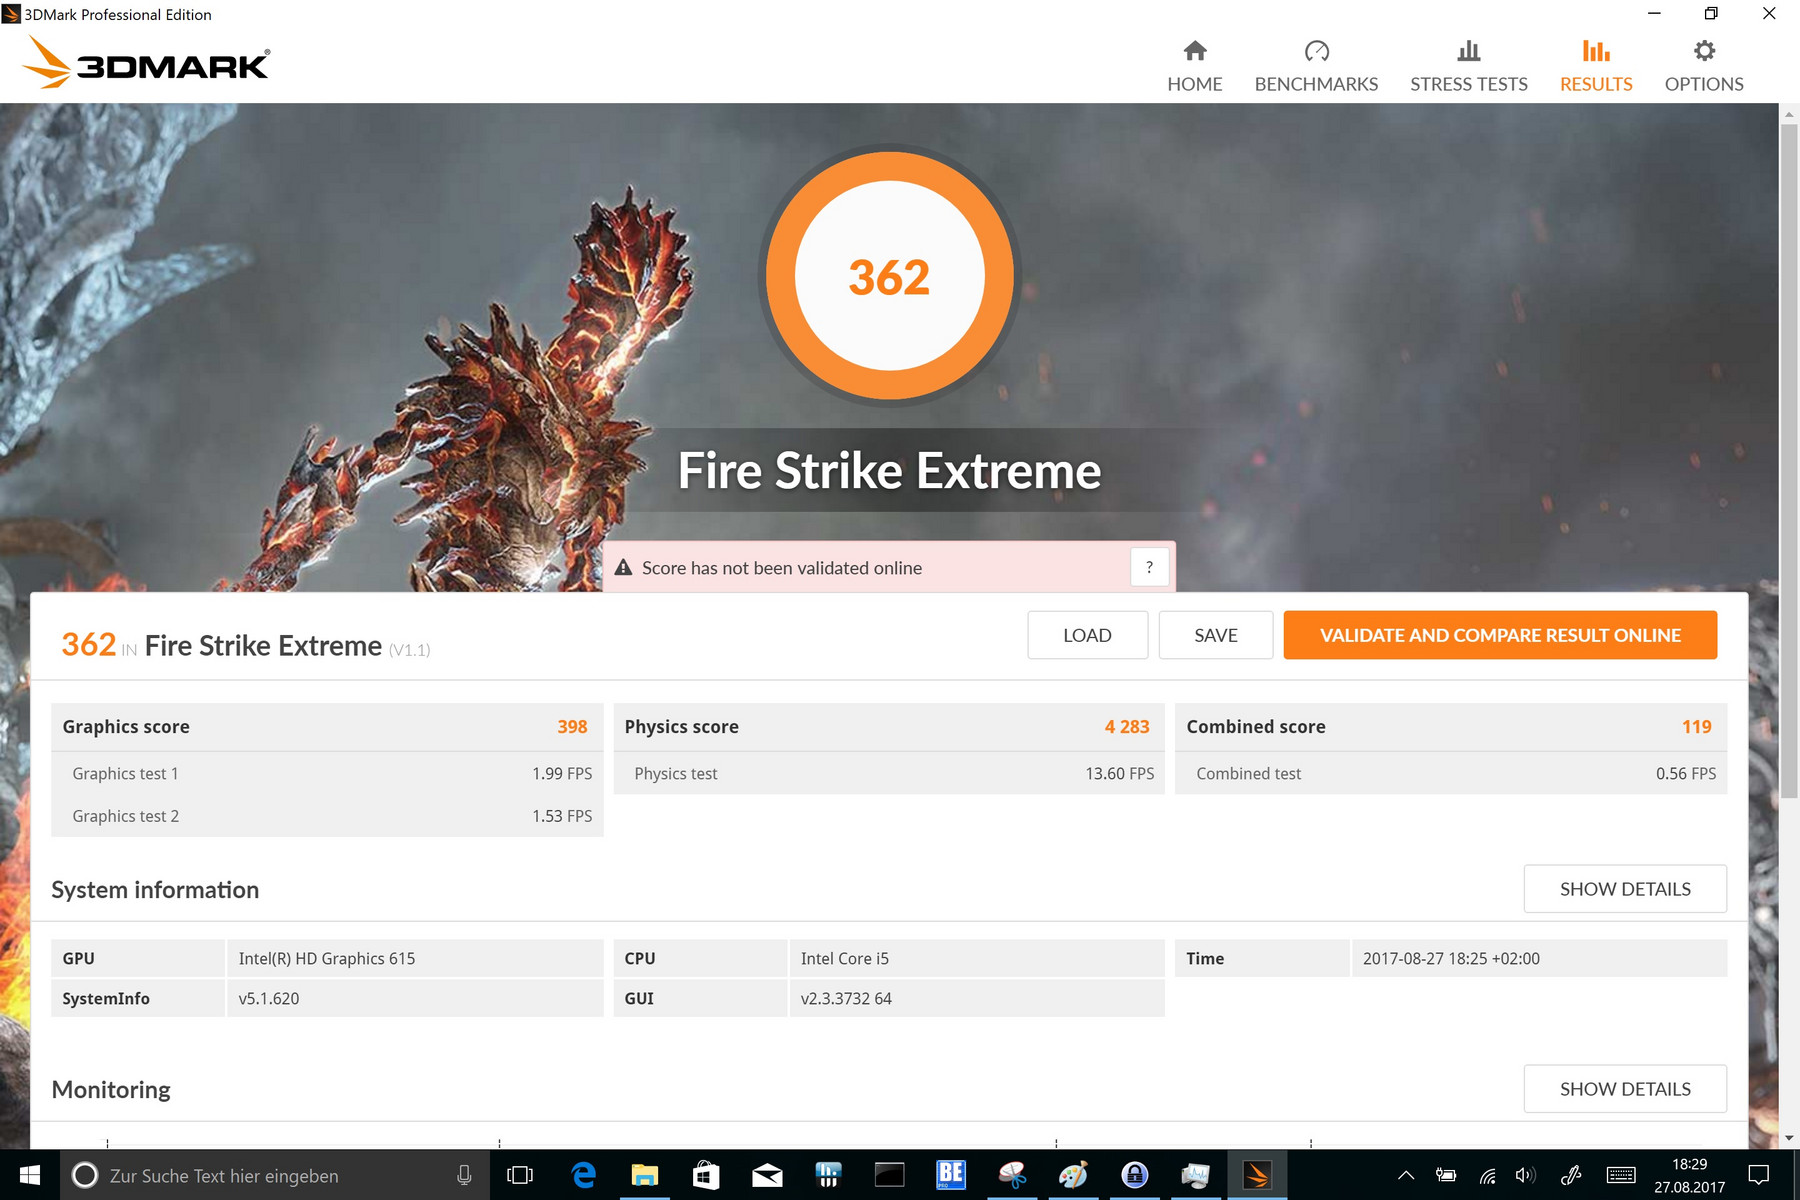
| 3DMark Fire Strike Extreme Score | 362 punti | |
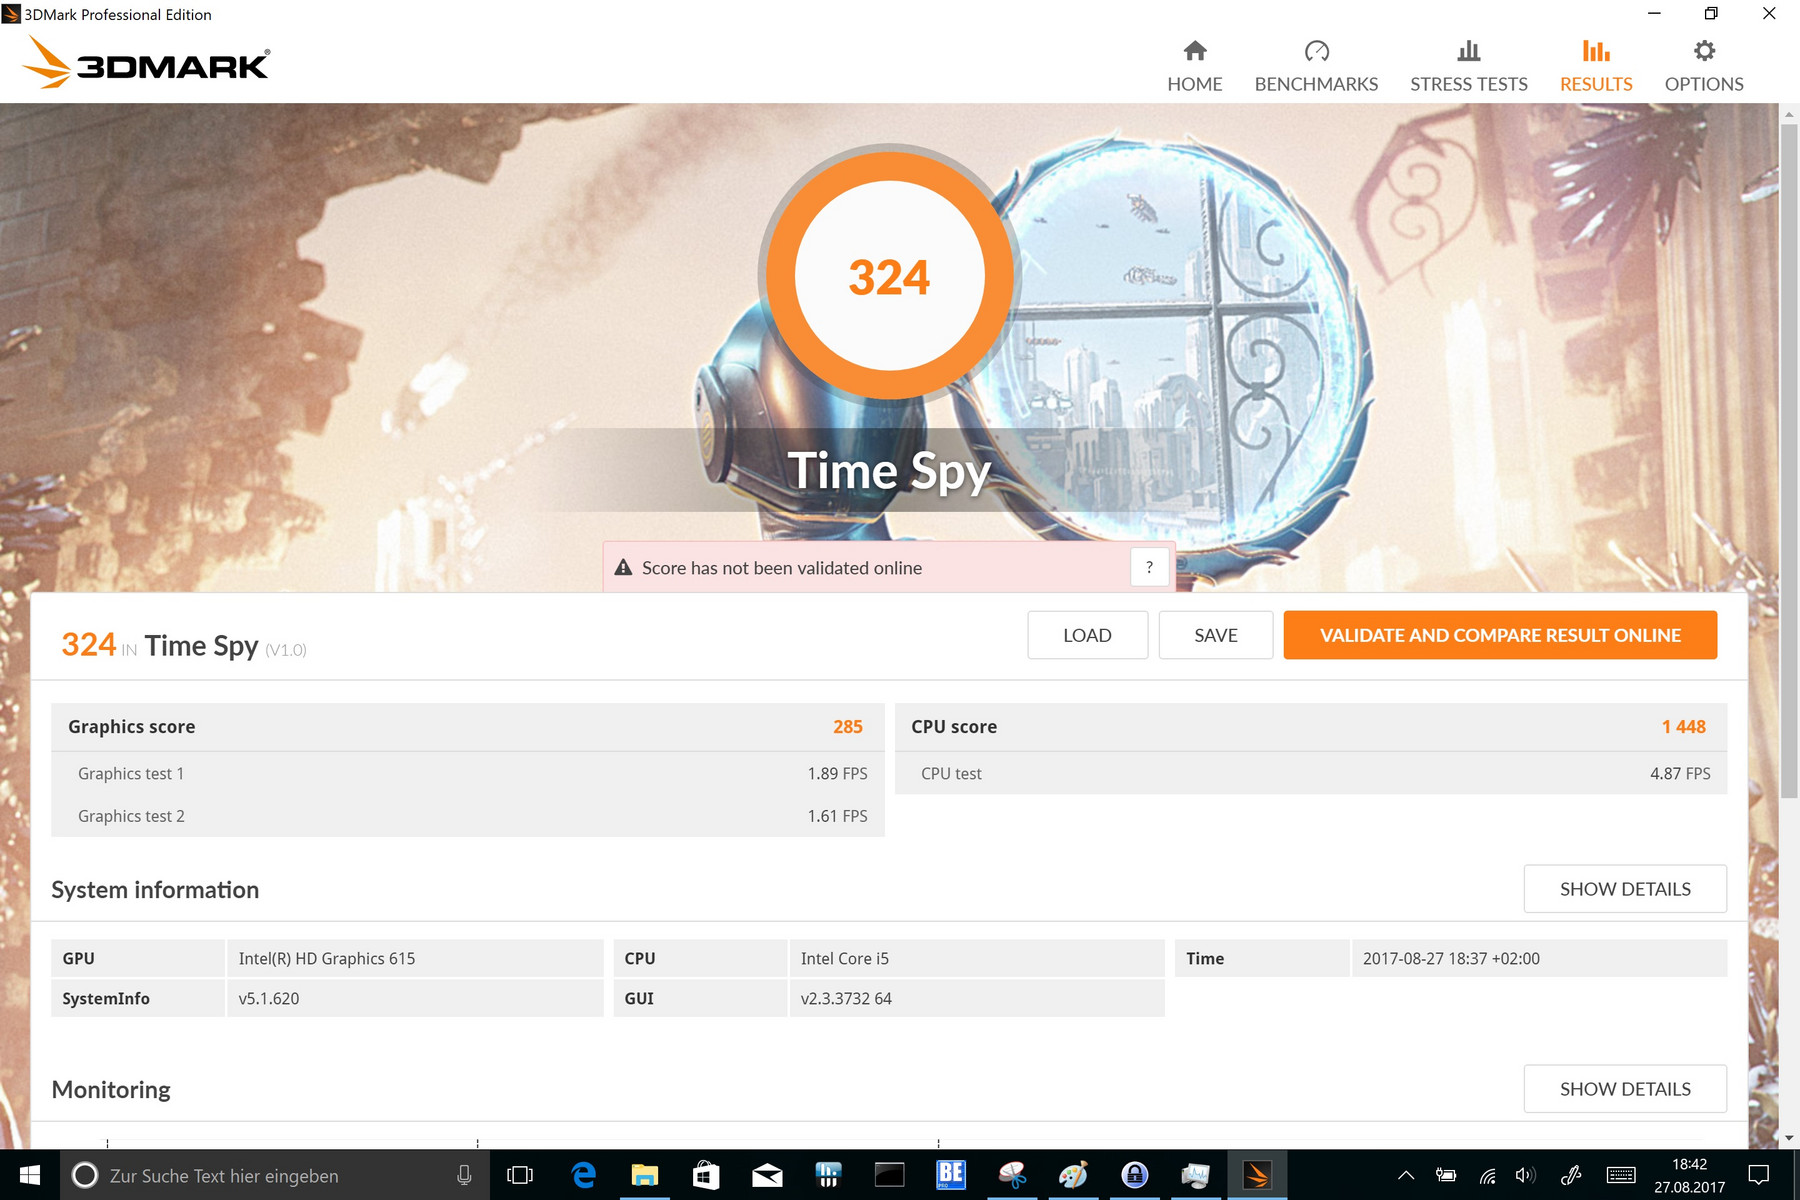
| 3DMark Time Spy Score | 324 punti | |
Aiuto | ||
| basso | medio | alto | ultra | |
|---|---|---|---|---|
| BioShock Infinite (2013) | 40.4 | 25.8 | 21.7 | 6.4 |
| Battlefield 4 (2013) | 32.7 | 19.8 | 18.3 | |
| Rise of the Tomb Raider (2016) | 13.8 | 9.1 |
(-) La temperatura massima sul lato superiore è di 46.8 °C / 116 F, rispetto alla media di 35.4 °C / 96 F, che varia da 19.6 a 60 °C per questa classe Convertible.
(-) Il lato inferiore si riscalda fino ad un massimo di 49.6 °C / 121 F, rispetto alla media di 36.9 °C / 98 F
(+) In idle, la temperatura media del lato superiore è di 28 °C / 82 F, rispetto alla media deld ispositivo di 30.3 °C / 87 F.
(-) I poggiapolsi e il touchpad possono diventare molto caldi al tatto con un massimo di 42.1 °C / 107.8 F.
(-) La temperatura media della zona del palmo della mano di dispositivi simili e'stata di 28 °C / 82.4 F (-14.1 °C / -25.4 F).
| Dell Latitude 7285 i5-7Y57, HD Graphics 615 | Microsoft Surface Pro (2017) i5 i5-7300U, HD Graphics 620 | Lenovo ThinkPad X1 Yoga 2017 20JES03T00 i7-7600U, HD Graphics 620 | Dell Latitude 12 5285 2-in-1 i7-7600U, HD Graphics 620 | Acer Switch 5 SW512-52-5819 i7-7500U, HD Graphics 620 | Toshiba Portege X20W-D-10R i7-7600U, HD Graphics 620 | HP Elite x2 1012 G1 6Y54, HD Graphics 515 | |
|---|---|---|---|---|---|---|---|
| Heat | -0% | 11% | 5% | 0% | 28% | 8% | |
| Maximum Upper Side * (°C) | 46.8 | 39.2 16% | 47.5 -1% | 38.2 18% | 44.7 4% | 35.7 24% | 39 17% |
| Maximum Bottom * (°C) | 49.6 | 40.3 19% | 44.8 10% | 48.6 2% | 47.5 4% | 24.2 51% | 41.2 17% |
| Idle Upper Side * (°C) | 30.1 | 37 -23% | 23.7 21% | 29.6 2% | 29.7 1% | 23.4 22% | 29.5 2% |
| Idle Bottom * (°C) | 28.5 | 32.3 -13% | 24.6 14% | 28.8 -1% | 30.7 -8% | 24.2 15% | 29.8 -5% |
* ... Meglio usare valori piccoli
Dell Latitude 7285 analisi audio
(-) | altoparlanti non molto potenti (69.1 dB)
Bassi 100 - 315 Hz
(±) | bassi ridotti - in media 13.6% inferiori alla media
(±) | la linearità dei bassi è media (8.1% delta rispetto alla precedente frequenza)
Medi 400 - 2000 Hz
(+) | medi bilanciati - solo only 3.4% rispetto alla media
(+) | medi lineari (5.9% delta rispetto alla precedente frequenza)
Alti 2 - 16 kHz
(+) | Alti bilanciati - appena 0.9% dalla media
(+) | alti lineari (4% delta rispetto alla precedente frequenza)
Nel complesso 100 - 16.000 Hz
(±) | la linearità complessiva del suono è media (17.4% di differenza rispetto alla media
Rispetto alla stessa classe
» 33% di tutti i dispositivi testati in questa classe è stato migliore, 8% simile, 59% peggiore
» Il migliore ha avuto un delta di 6%, medio di 20%, peggiore di 57%
Rispetto a tutti i dispositivi testati
» 33% di tutti i dispositivi testati in questa classe è stato migliore, 8% similare, 58% peggiore
» Il migliore ha avuto un delta di 4%, medio di 23%, peggiore di 134%
Lenovo ThinkPad X1 Yoga 2017 20JES03T00 analisi audio
(±) | potenza degli altiparlanti media ma buona (73.3 dB)
Bassi 100 - 315 Hz
(-) | quasi nessun basso - in media 19.1% inferiori alla media
(±) | la linearità dei bassi è media (8.6% delta rispetto alla precedente frequenza)
Medi 400 - 2000 Hz
(+) | medi bilanciati - solo only 2.6% rispetto alla media
(±) | linearità dei medi adeguata (8% delta rispetto alla precedente frequenza)
Alti 2 - 16 kHz
(+) | Alti bilanciati - appena 2.6% dalla media
(+) | alti lineari (6.6% delta rispetto alla precedente frequenza)
Nel complesso 100 - 16.000 Hz
(±) | la linearità complessiva del suono è media (21.7% di differenza rispetto alla media
Rispetto alla stessa classe
» 60% di tutti i dispositivi testati in questa classe è stato migliore, 9% simile, 31% peggiore
» Il migliore ha avuto un delta di 6%, medio di 20%, peggiore di 57%
Rispetto a tutti i dispositivi testati
» 62% di tutti i dispositivi testati in questa classe è stato migliore, 7% similare, 31% peggiore
» Il migliore ha avuto un delta di 4%, medio di 23%, peggiore di 134%
| Off / Standby | |
| Idle | |
| Sotto carico |
|
Leggenda:
min: | |
| Dell Latitude 7285 i5-7Y57, HD Graphics 615, Toshiba KBG20ZMS256G, IPS LED, 2880x1920, 12.3" | Microsoft Surface Pro (2017) i5 i5-7300U, HD Graphics 620, Samsung PM971 KUS030202M, IPS, 2736x1824, 12.3" | Lenovo ThinkPad X1 Yoga 2017 20JES03T00 i7-7600U, HD Graphics 620, Samsung SSD PM961 1TB M.2 PCIe 3.0 x4 NVMe (MZVLW1T0), OLED, 2560x1440, 14" | Dell Latitude 12 5285 2-in-1 i7-7600U, HD Graphics 620, Samsung PM961 MZVLW256HEHP, IPS, 1920x1280, 12.3" | Acer Switch 5 SW512-52-5819 i7-7500U, HD Graphics 620, Intel SSD 600p SSDPEKKW512G7, IPS, 2160x1440, 12" | Toshiba Portege X20W-D-10R i7-7600U, HD Graphics 620, Toshiba SG5 THNSNK512GVN8, IPS, 1920x1080, 12.5" | HP Elite x2 1012 G1 6Y54, HD Graphics 515, Liteon L8H-256V2G, IPS, 1920x1280, 12.1" | |
|---|---|---|---|---|---|---|---|
| Power Consumption | 21% | -11% | 16% | 18% | 35% | 22% | |
| Idle Minimum * (Watt) | 6.6 | 3.6 45% | 4.9 26% | 2.85 57% | 3.86 42% | 3.4 48% | 3.7 44% |
| Idle Average * (Watt) | 9.3 | 8.1 13% | 7.6 18% | 6.76 27% | 6.4 31% | 5.8 38% | 6.8 27% |
| Idle Maximum * (Watt) | 10.2 | 8.7 15% | 13.8 -35% | 6.91 32% | 7.17 30% | 6.7 34% | 7.6 25% |
| Load Average * (Watt) | 25.1 | 25.5 -2% | 33.4 -33% | 32.88 -31% | 30.5 -22% | 21.4 15% | 22.5 10% |
| Load Maximum * (Watt) | 36.1 | 23.5 35% | 46.5 -29% | 37.41 -4% | 32.4 10% | 21.6 40% | 34.5 4% |
* ... Meglio usare valori piccoli
| Dell Latitude 7285 i5-7Y57, HD Graphics 615, 54 Wh | Microsoft Surface Pro (2017) i5 i5-7300U, HD Graphics 620, 45 Wh | Lenovo ThinkPad X1 Yoga 2017 20JES03T00 i7-7600U, HD Graphics 620, 56 Wh | Dell Latitude 12 5285 2-in-1 i7-7600U, HD Graphics 620, 42 Wh | Acer Switch 5 SW512-52-5819 i7-7500U, HD Graphics 620, Wh | Toshiba Portege X20W-D-10R i7-7600U, HD Graphics 620, 44 Wh | HP Elite x2 1012 G1 6Y54, HD Graphics 515, 37 Wh | |
|---|---|---|---|---|---|---|---|
| Autonomia della batteria | 32% | -12% | -1% | -27% | 25% | -5% | |
| Reader / Idle (h) | 17.2 | 17.6 2% | 13.1 -24% | 17.9 4% | 11.9 -31% | 16.7 -3% | 12.2 -29% |
| H.264 (h) | 6.2 | 6.8 10% | 7.2 16% | ||||
| WiFi v1.3 (h) | 6.5 | 12.4 91% | 6.1 -6% | 8.1 25% | 5.9 -9% | 12 85% | 7.4 14% |
| Load (h) | 2.7 | 2.8 4% | 2 -26% | 1.8 -33% | 1.6 -41% | 2.5 -7% | 2.2 -19% |
Pro
Contro
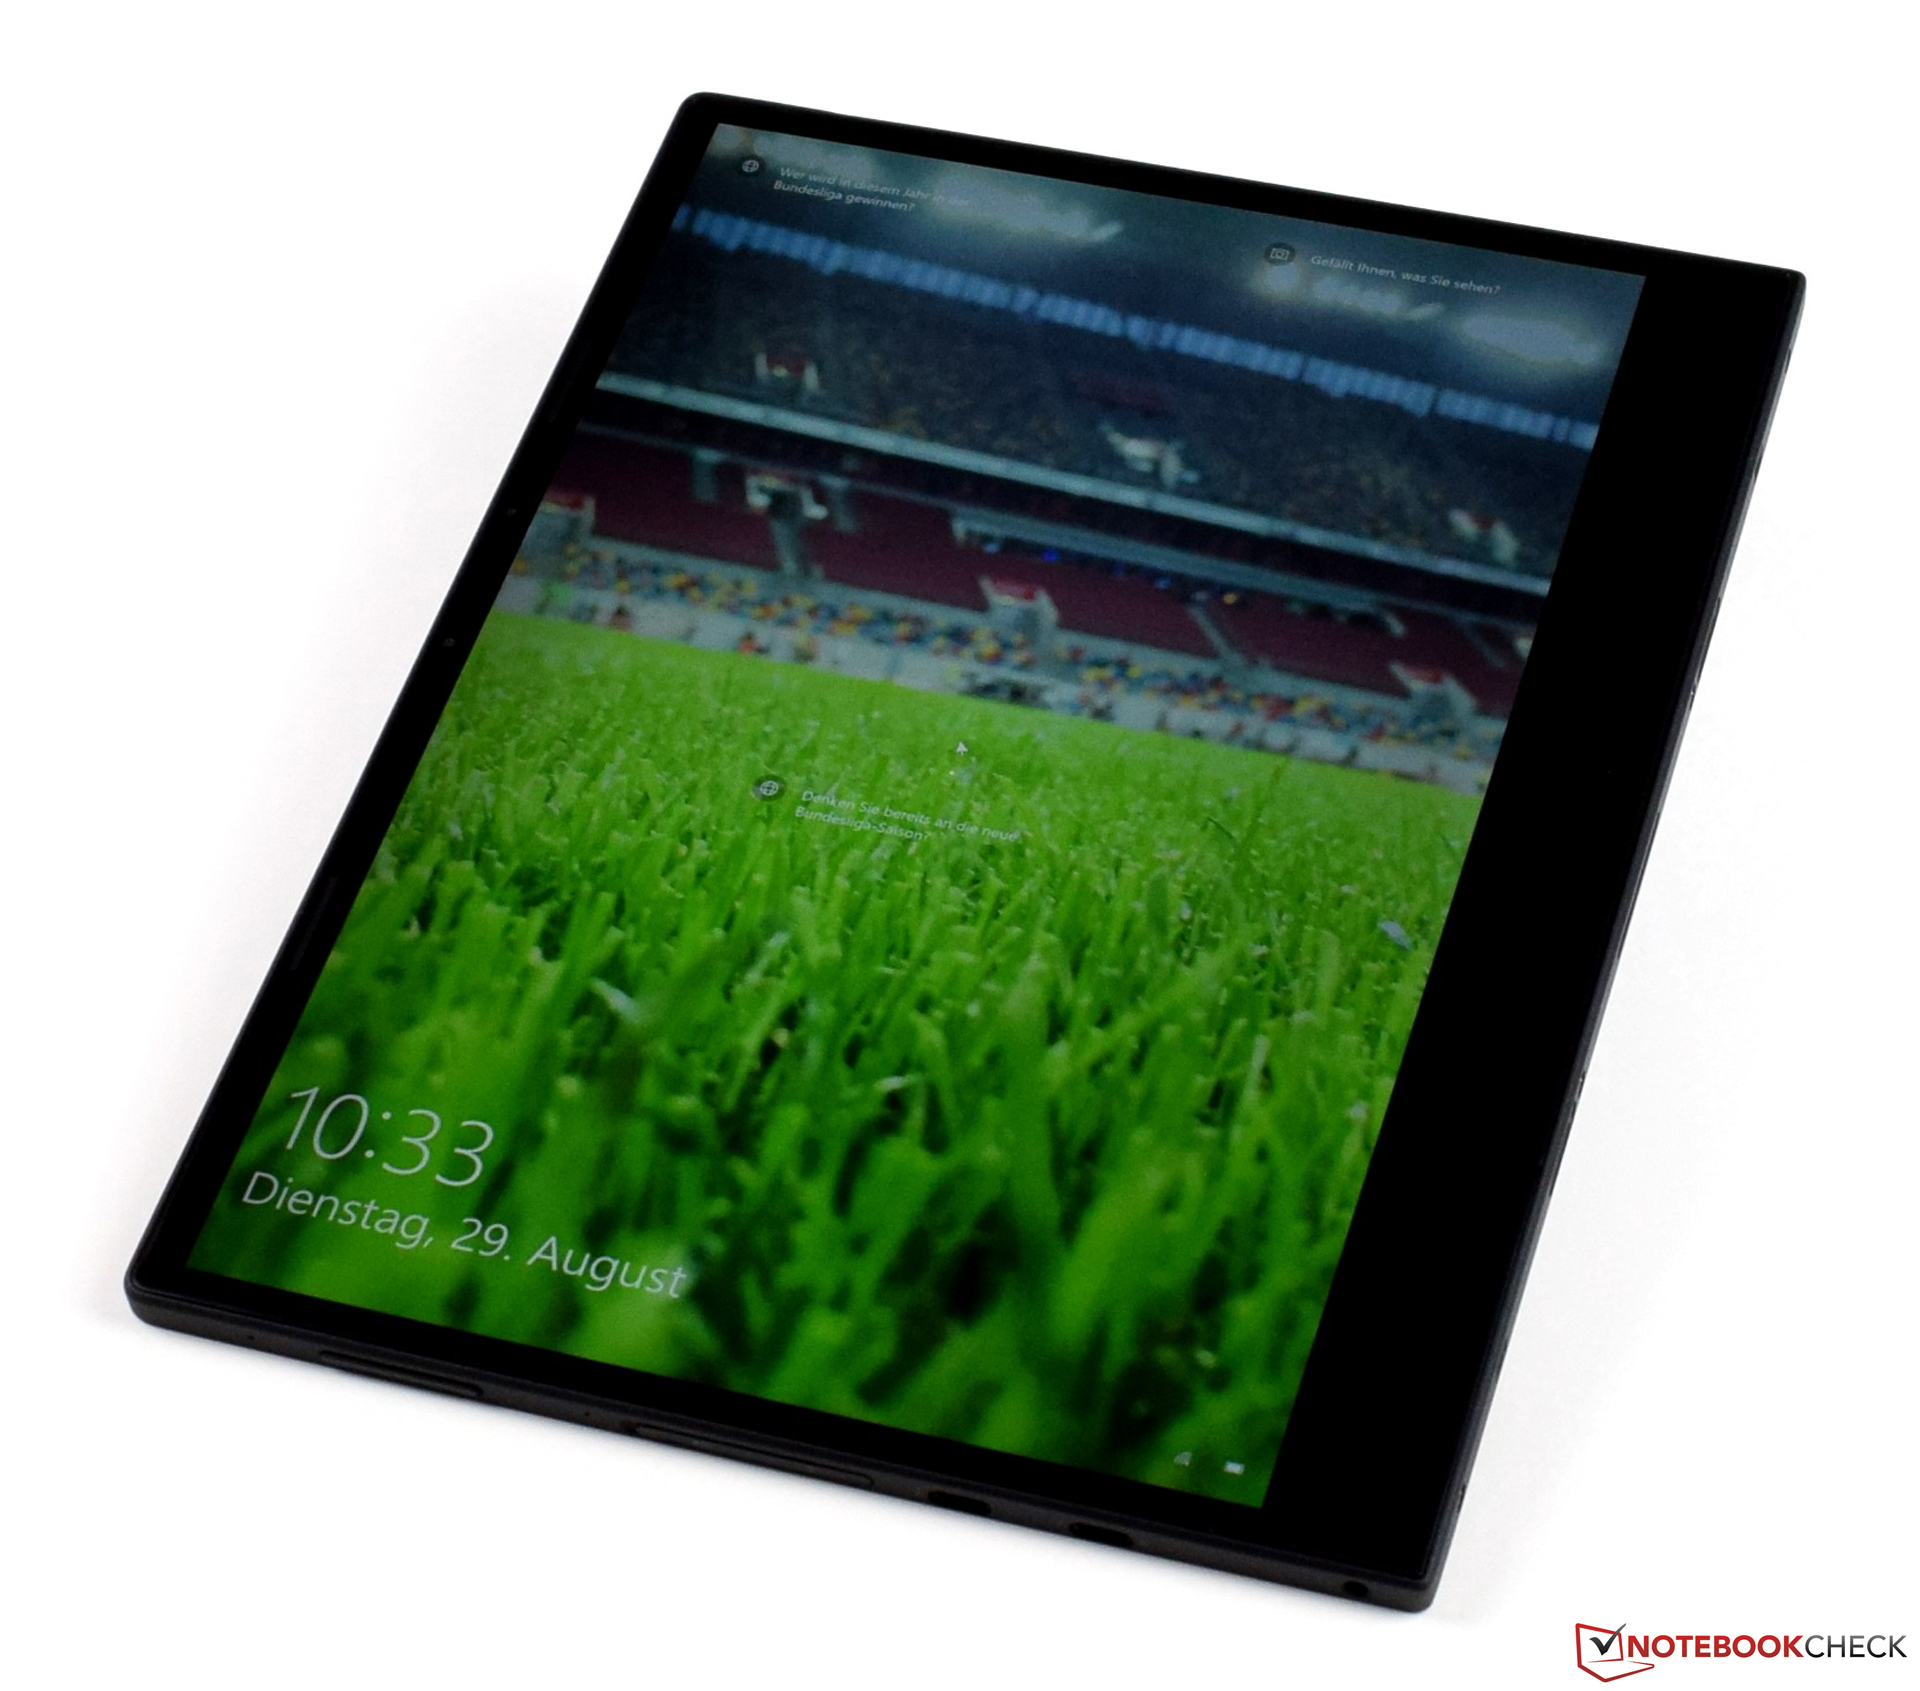
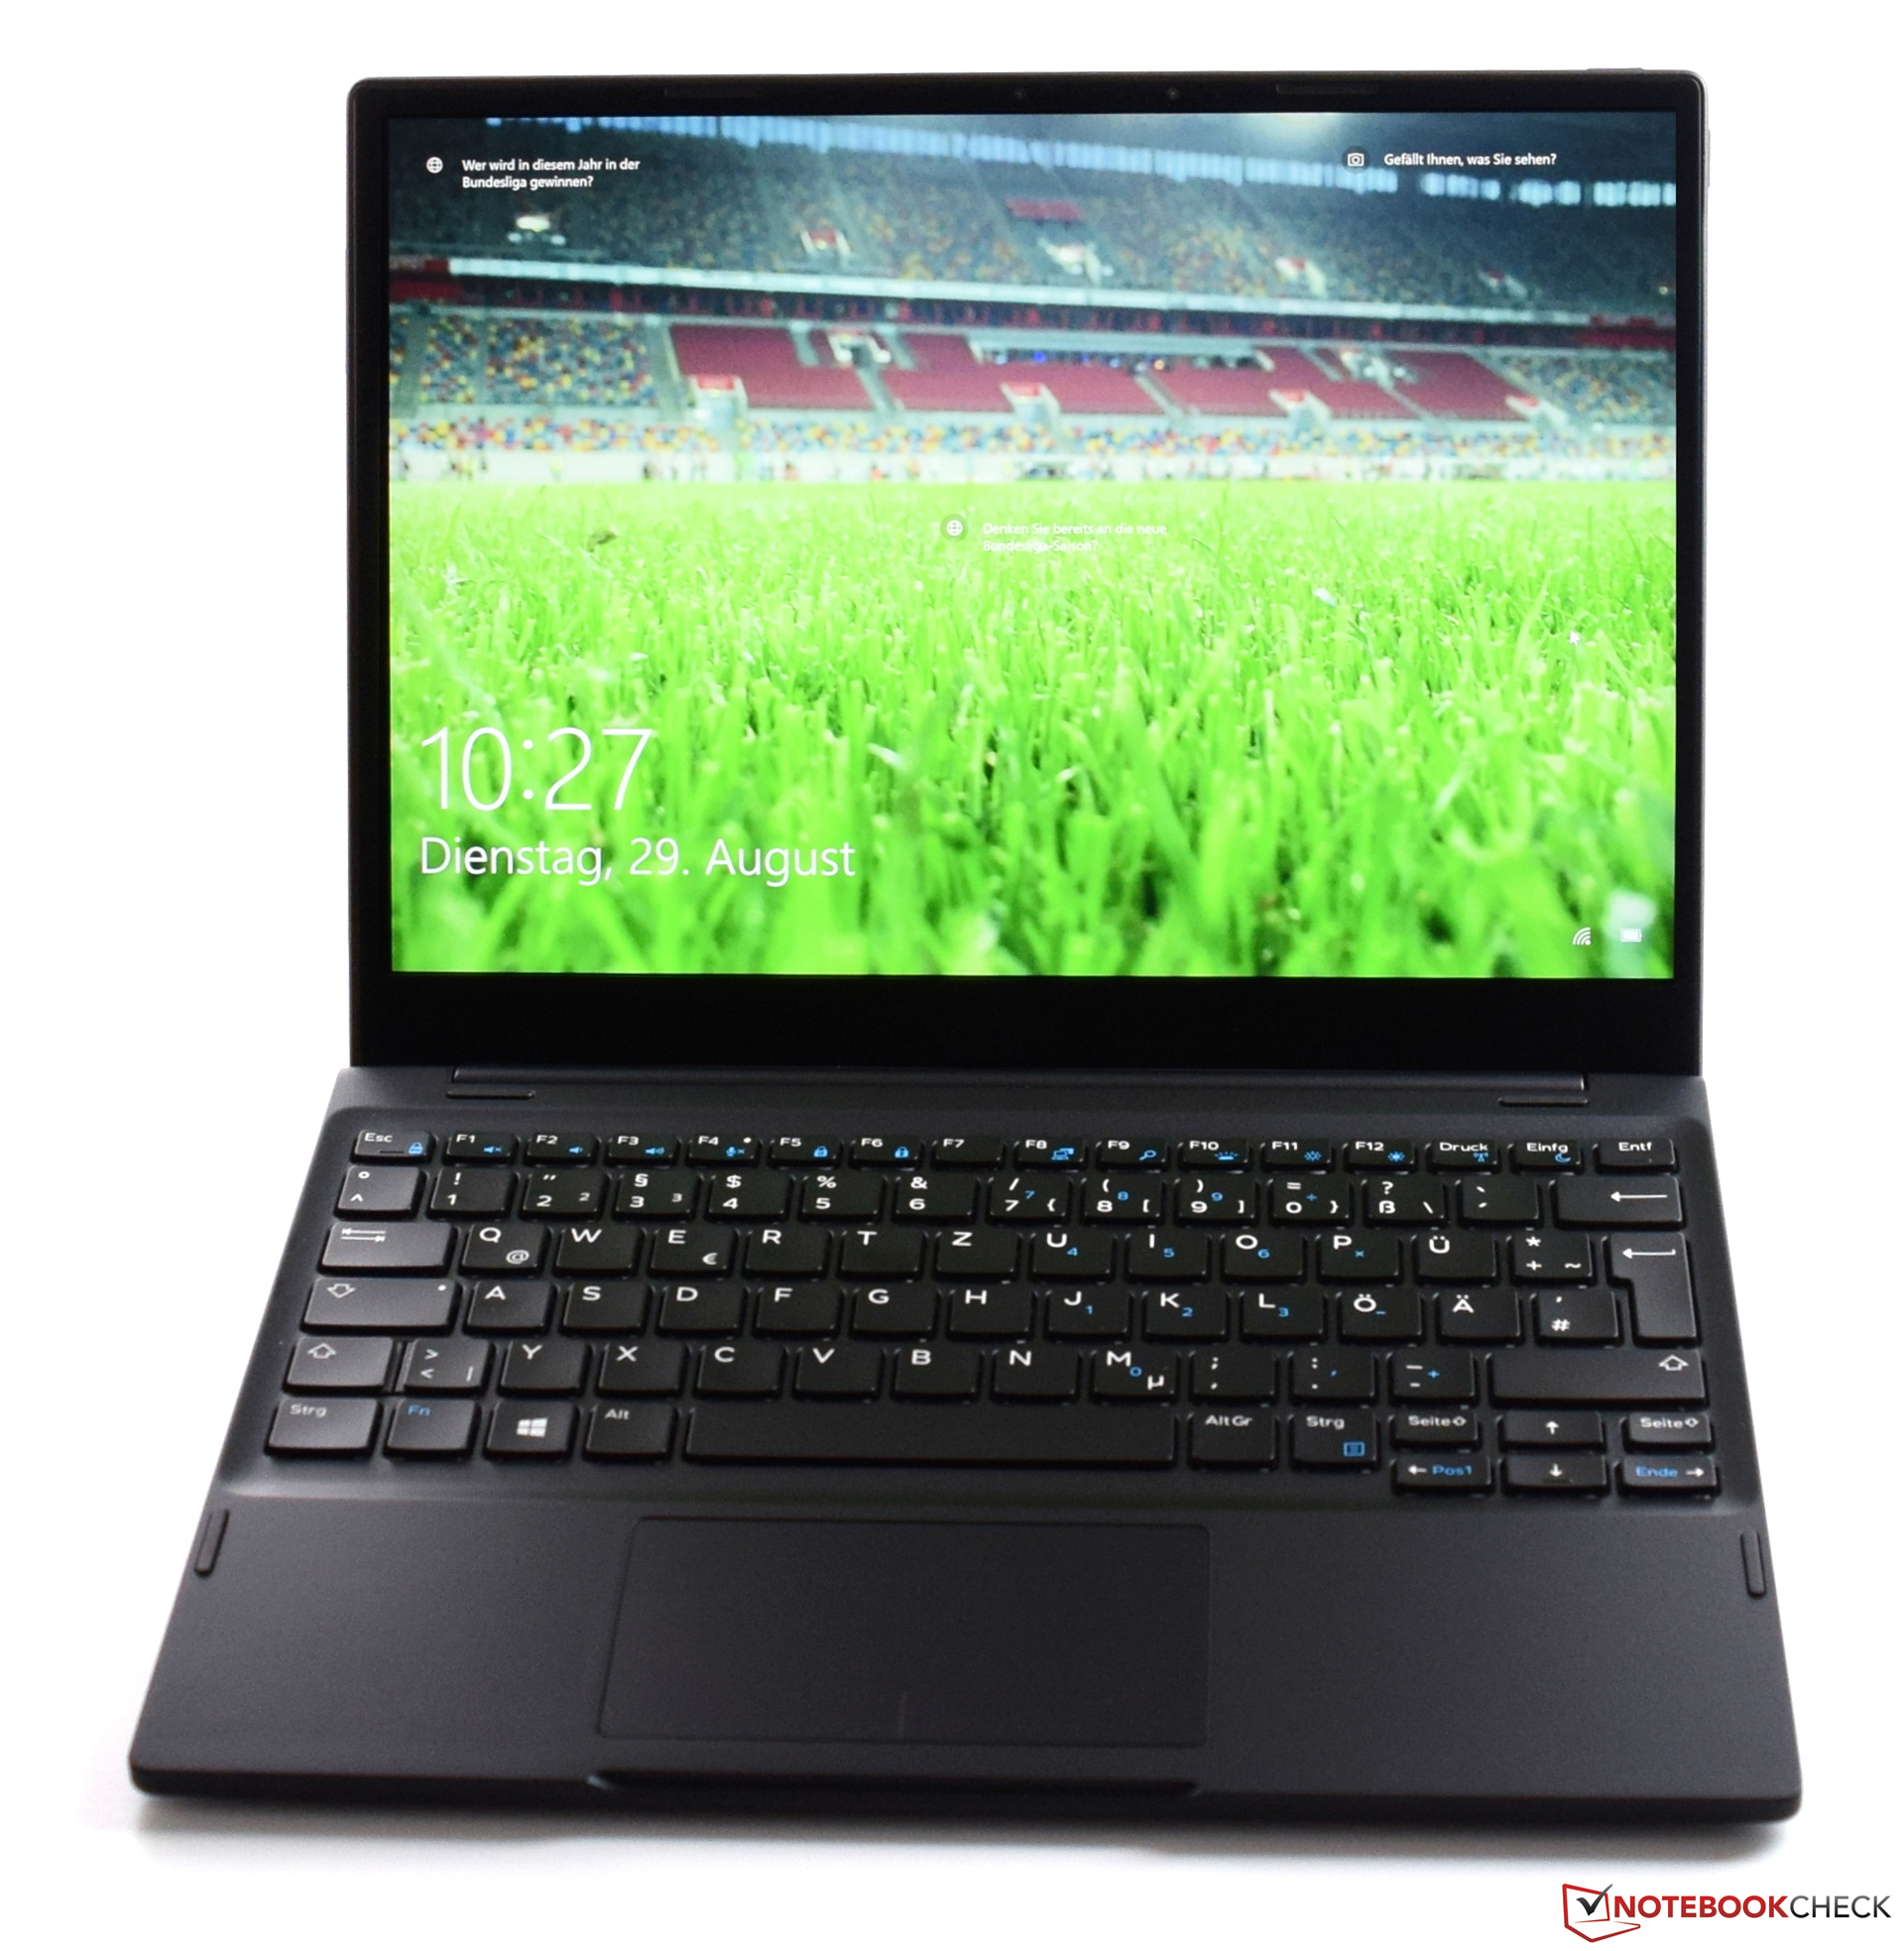
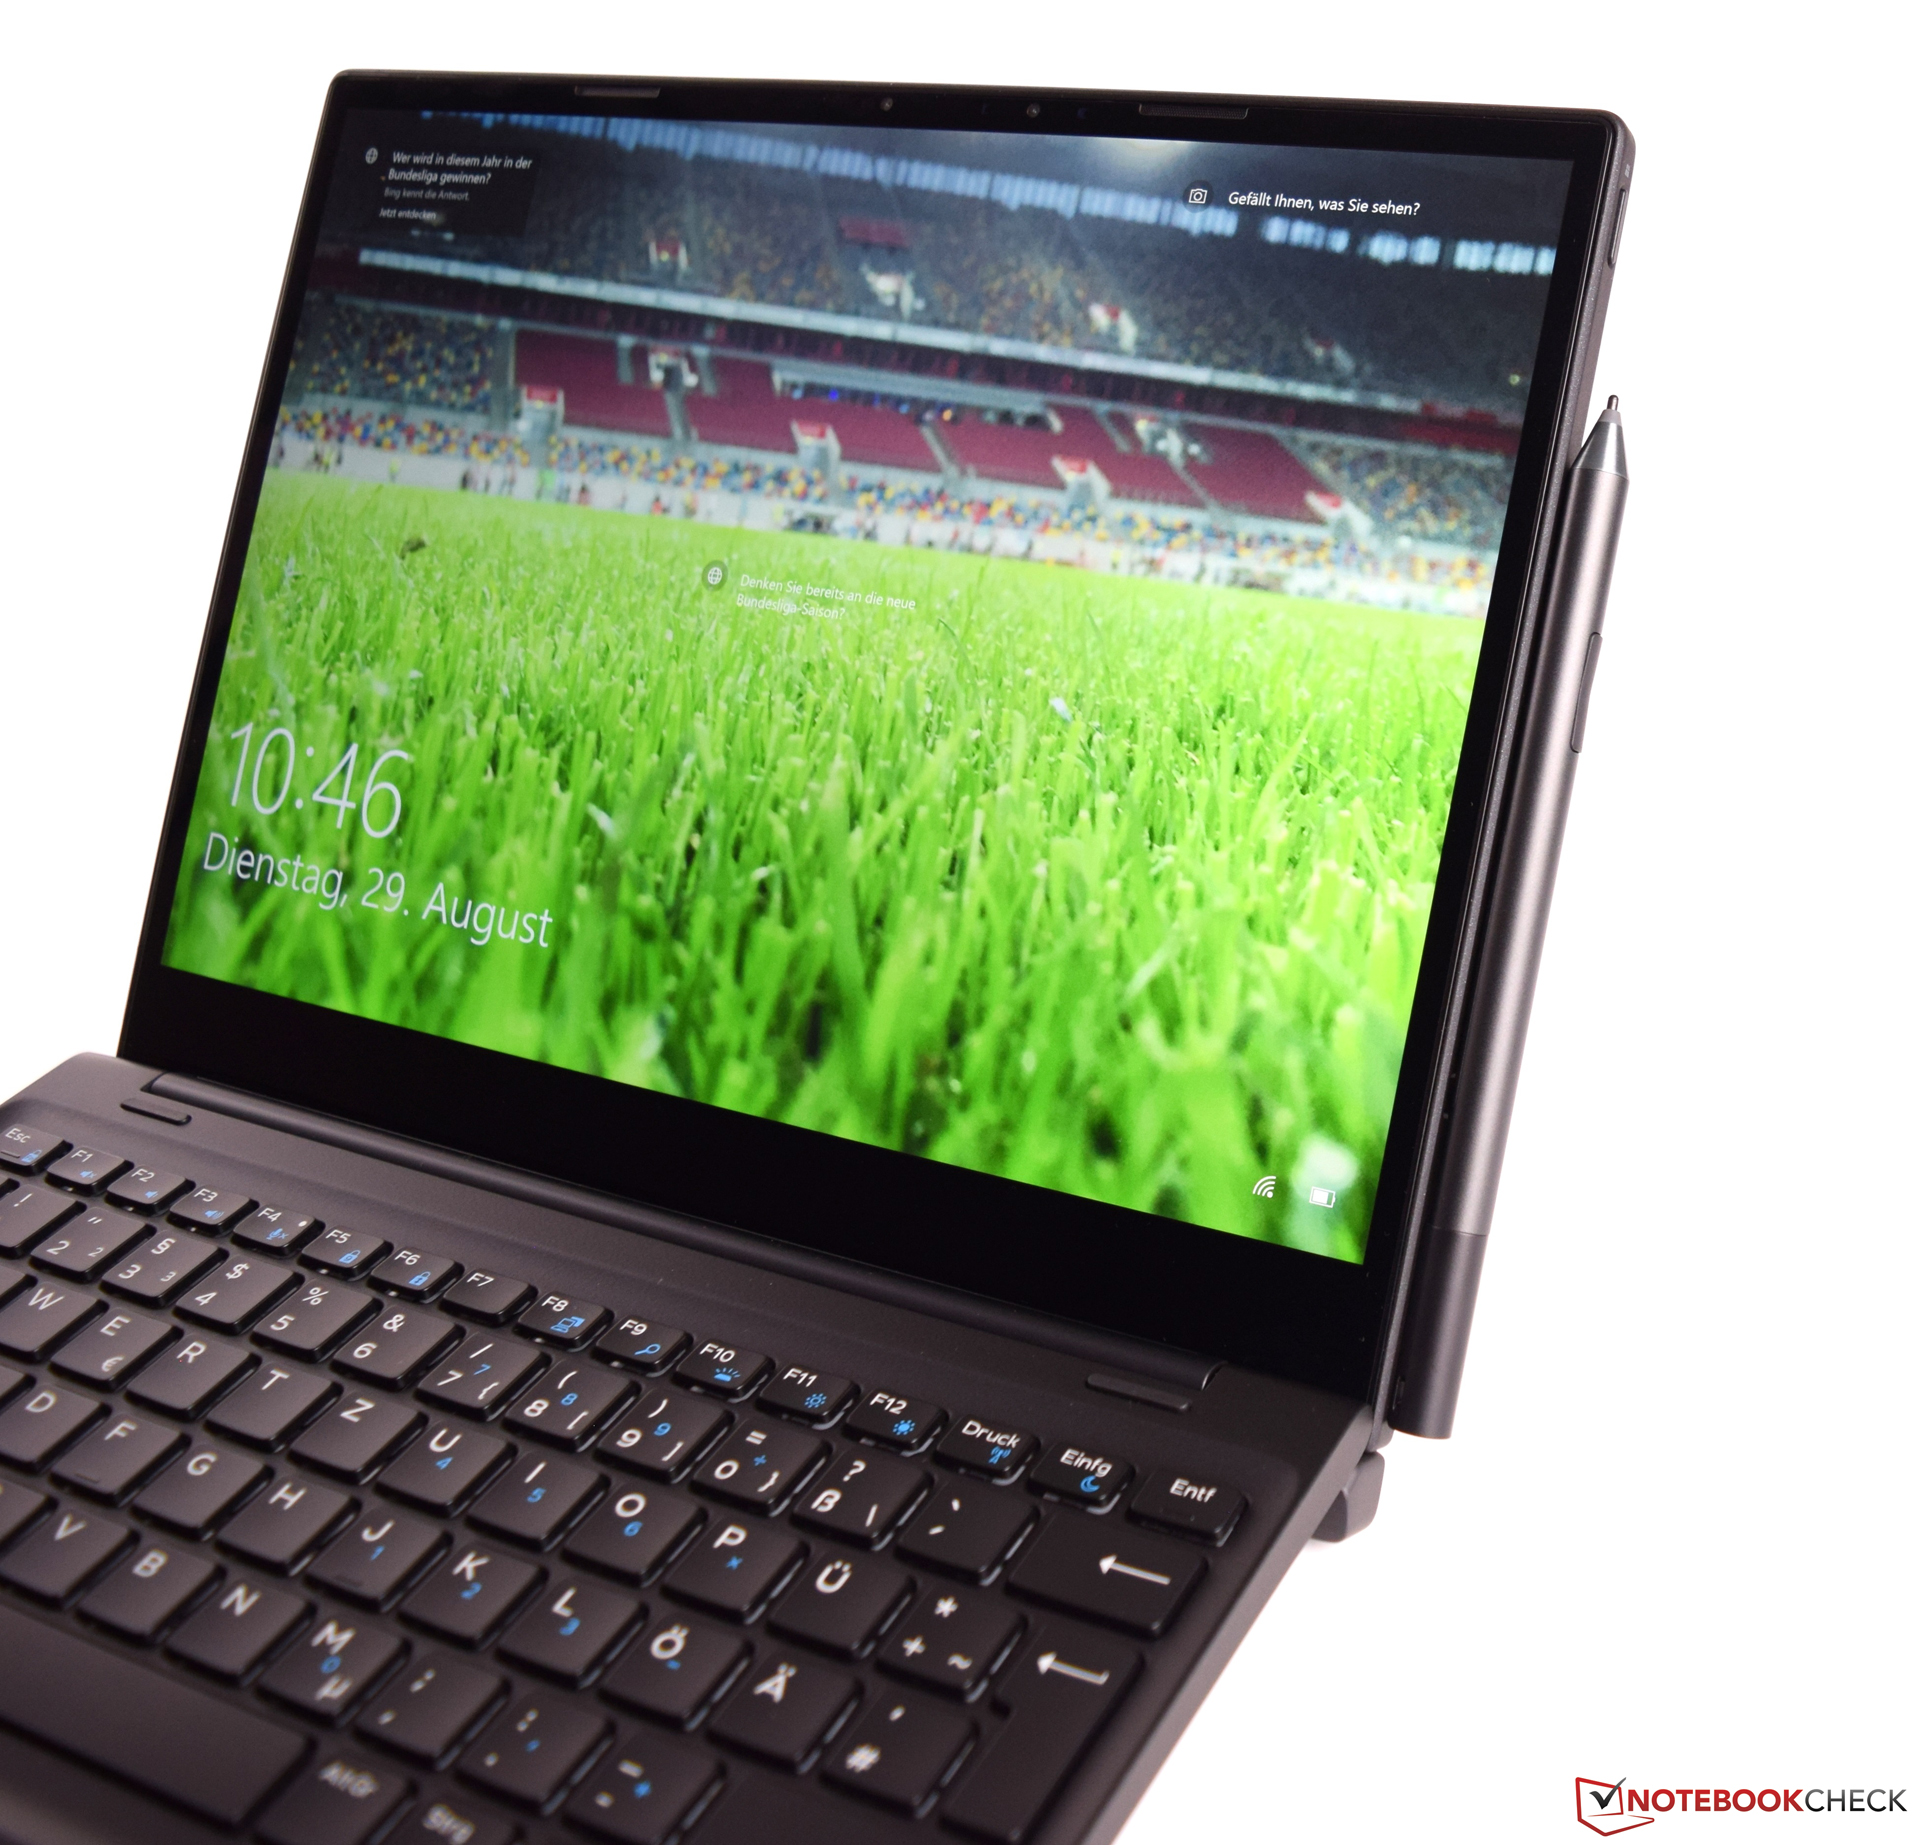
Con il Dell Latitude 7285, il produttore presenta un convertibile davvero high-quality con componenti moderni. L'Intel Core i5-7Y57 offre solide performance e va bene per le applicazioni quotidiane da ufficio. La CPU gestisce anche le applicazioni multimedia. Spesso il frugale SoC regge bene il confronto con i processori ULV più veloci. Per 2.300 Euro (~$2740) questo dispositivo per quello che vi dà non e molto economico. Tuttavia, riceverete un dispositivo ben costruito, con una ottima impressione sulla sua qualità da ogni punto di vista.
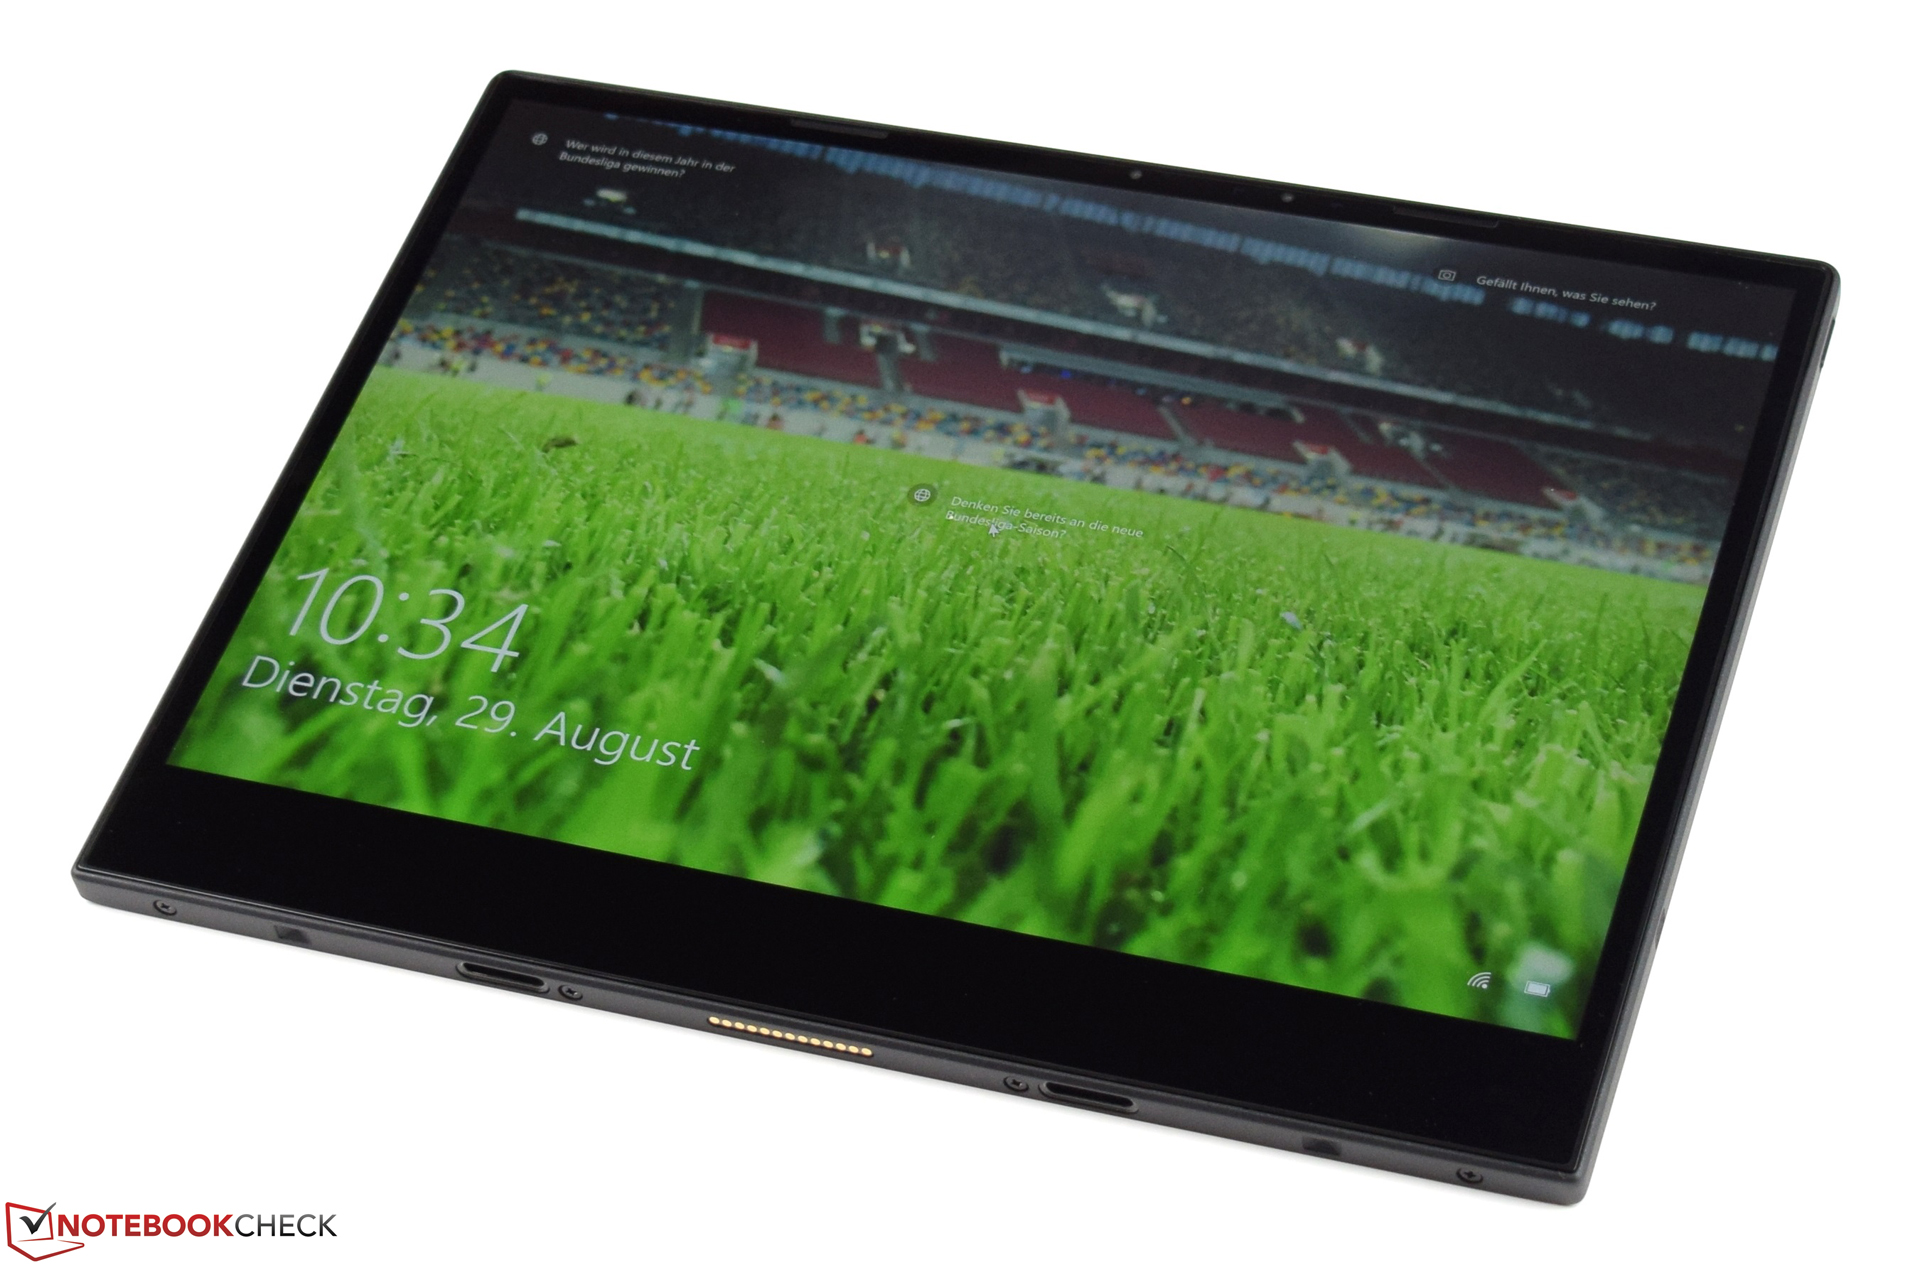
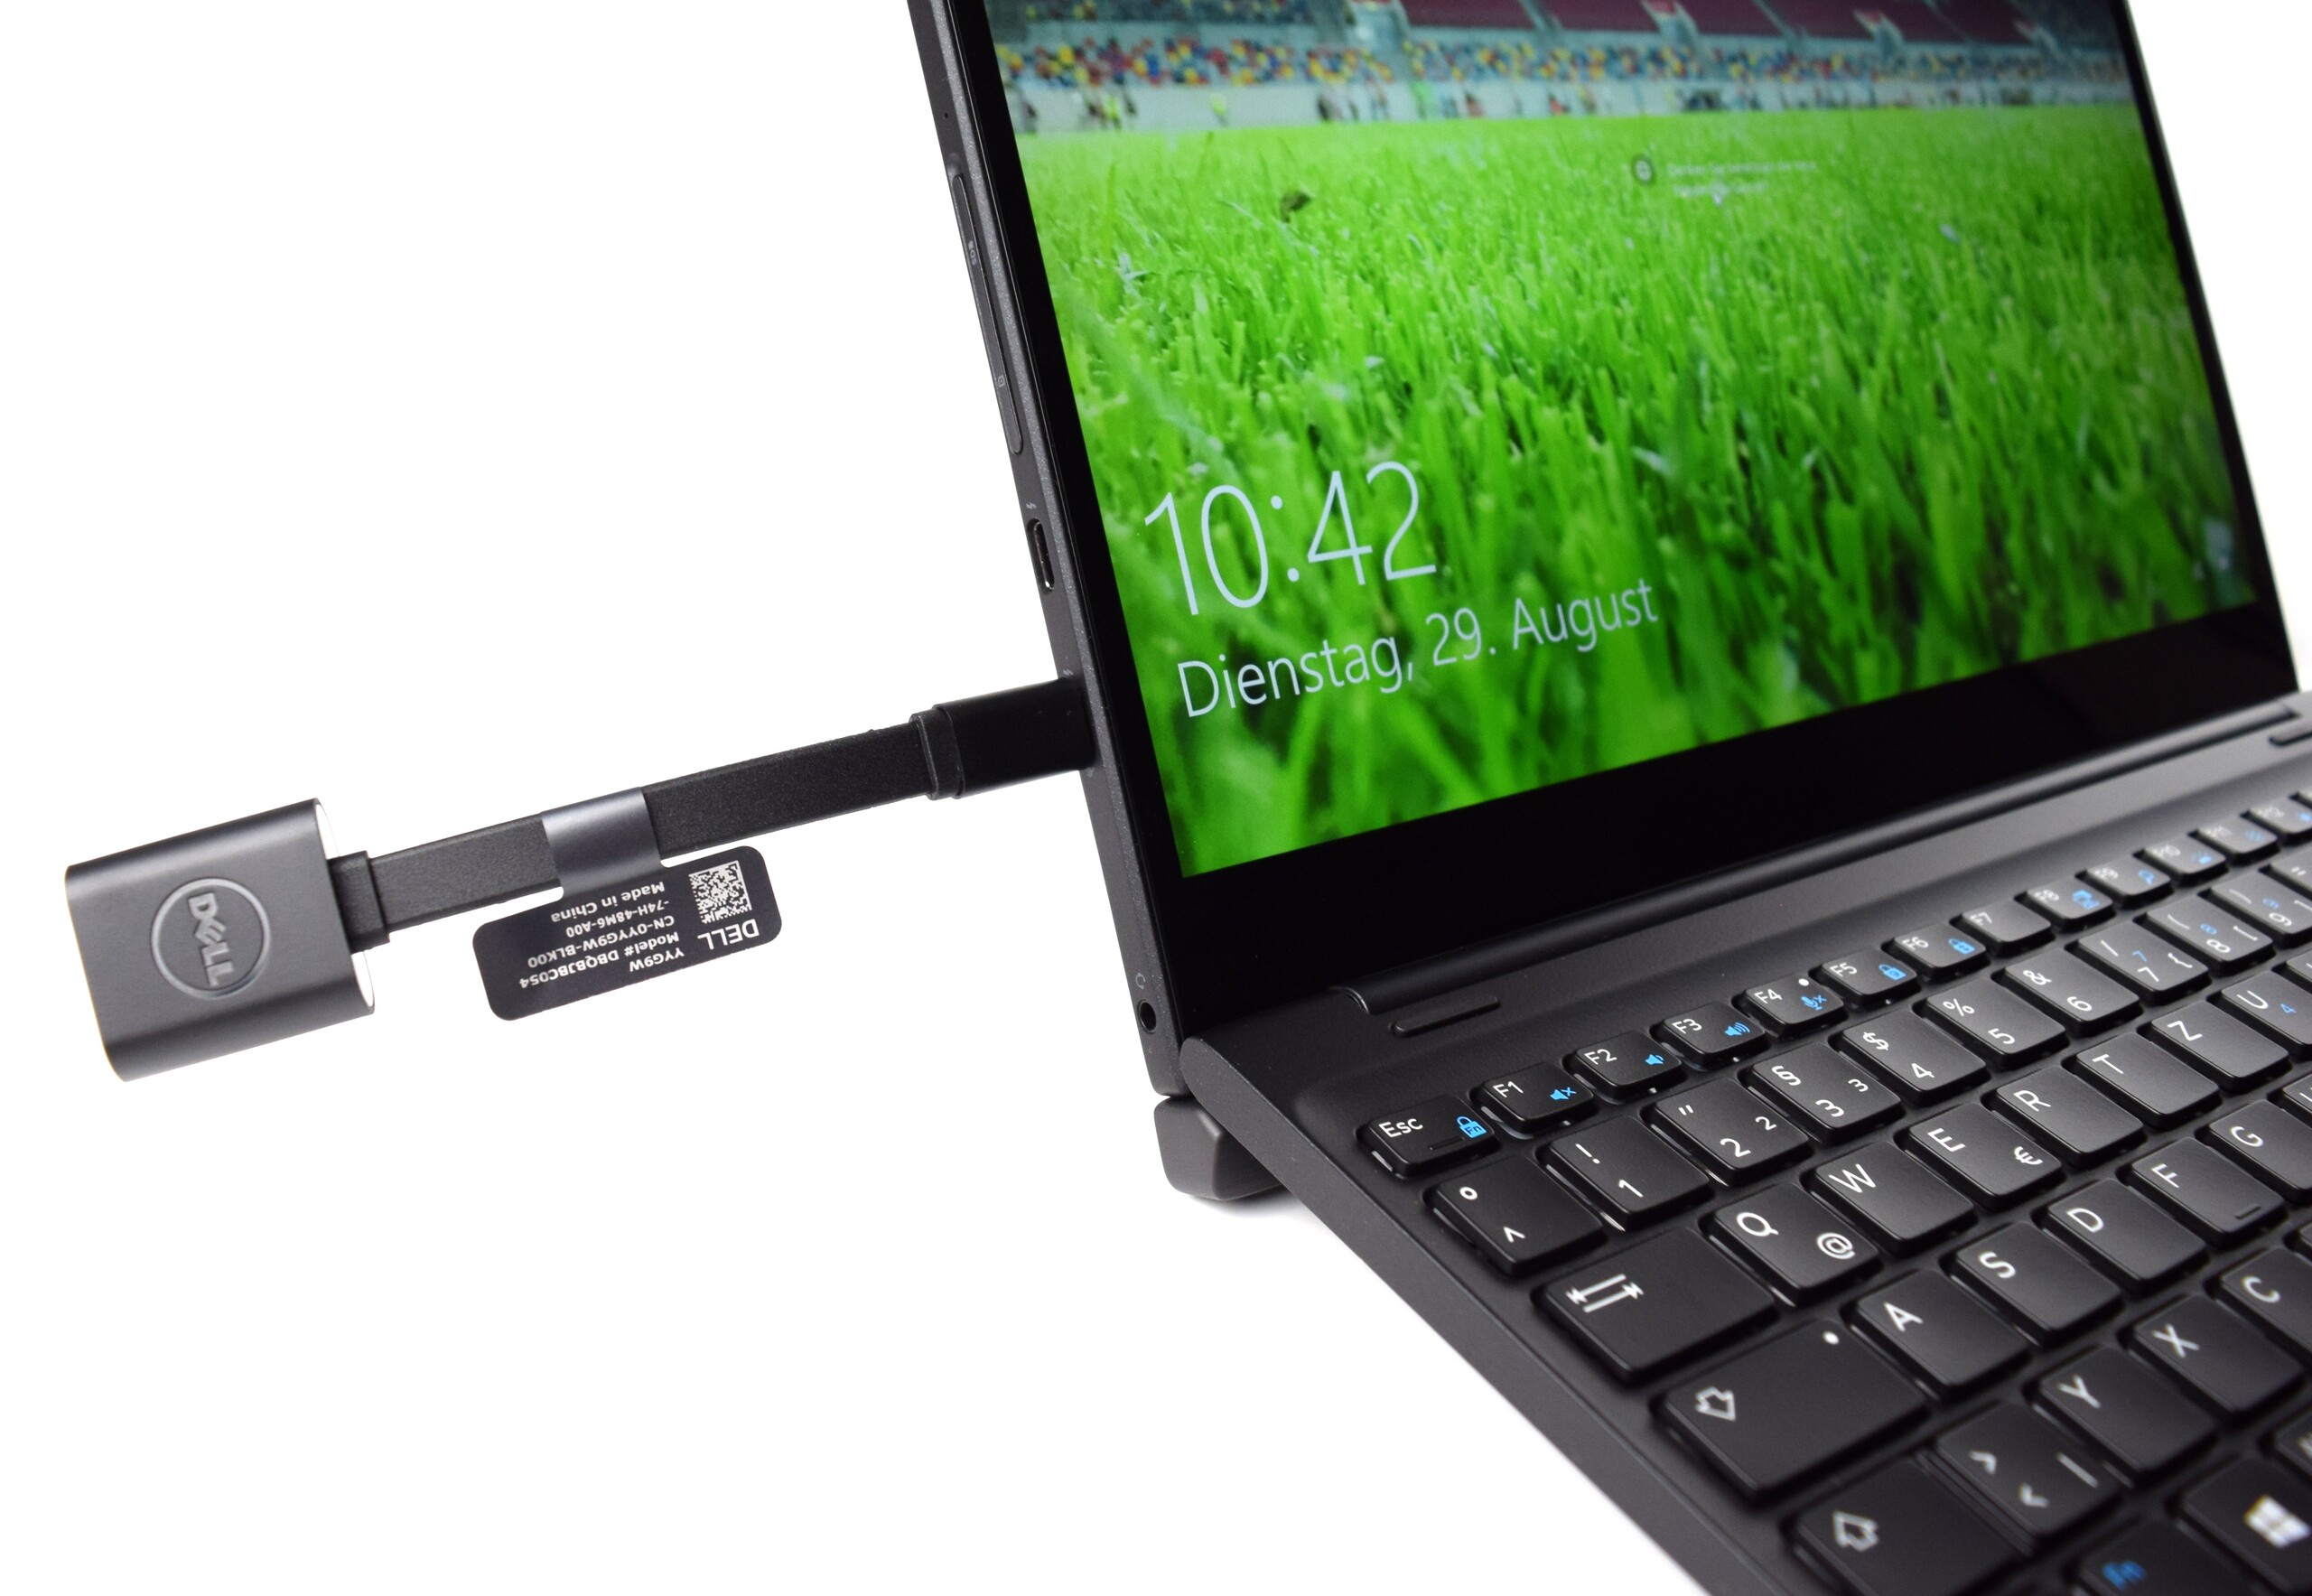
Il prezzo potrebbe impaurire qualcuno a primo impatto, ma Dell offre un dispositivo ben costruito con uno schermo 3K di prima classe e una selezione di connessioni moderne. Oltre al tablet ed alla keyboard dock, la confezione include la Dell Active Pen e 36 mesi di garanzia.
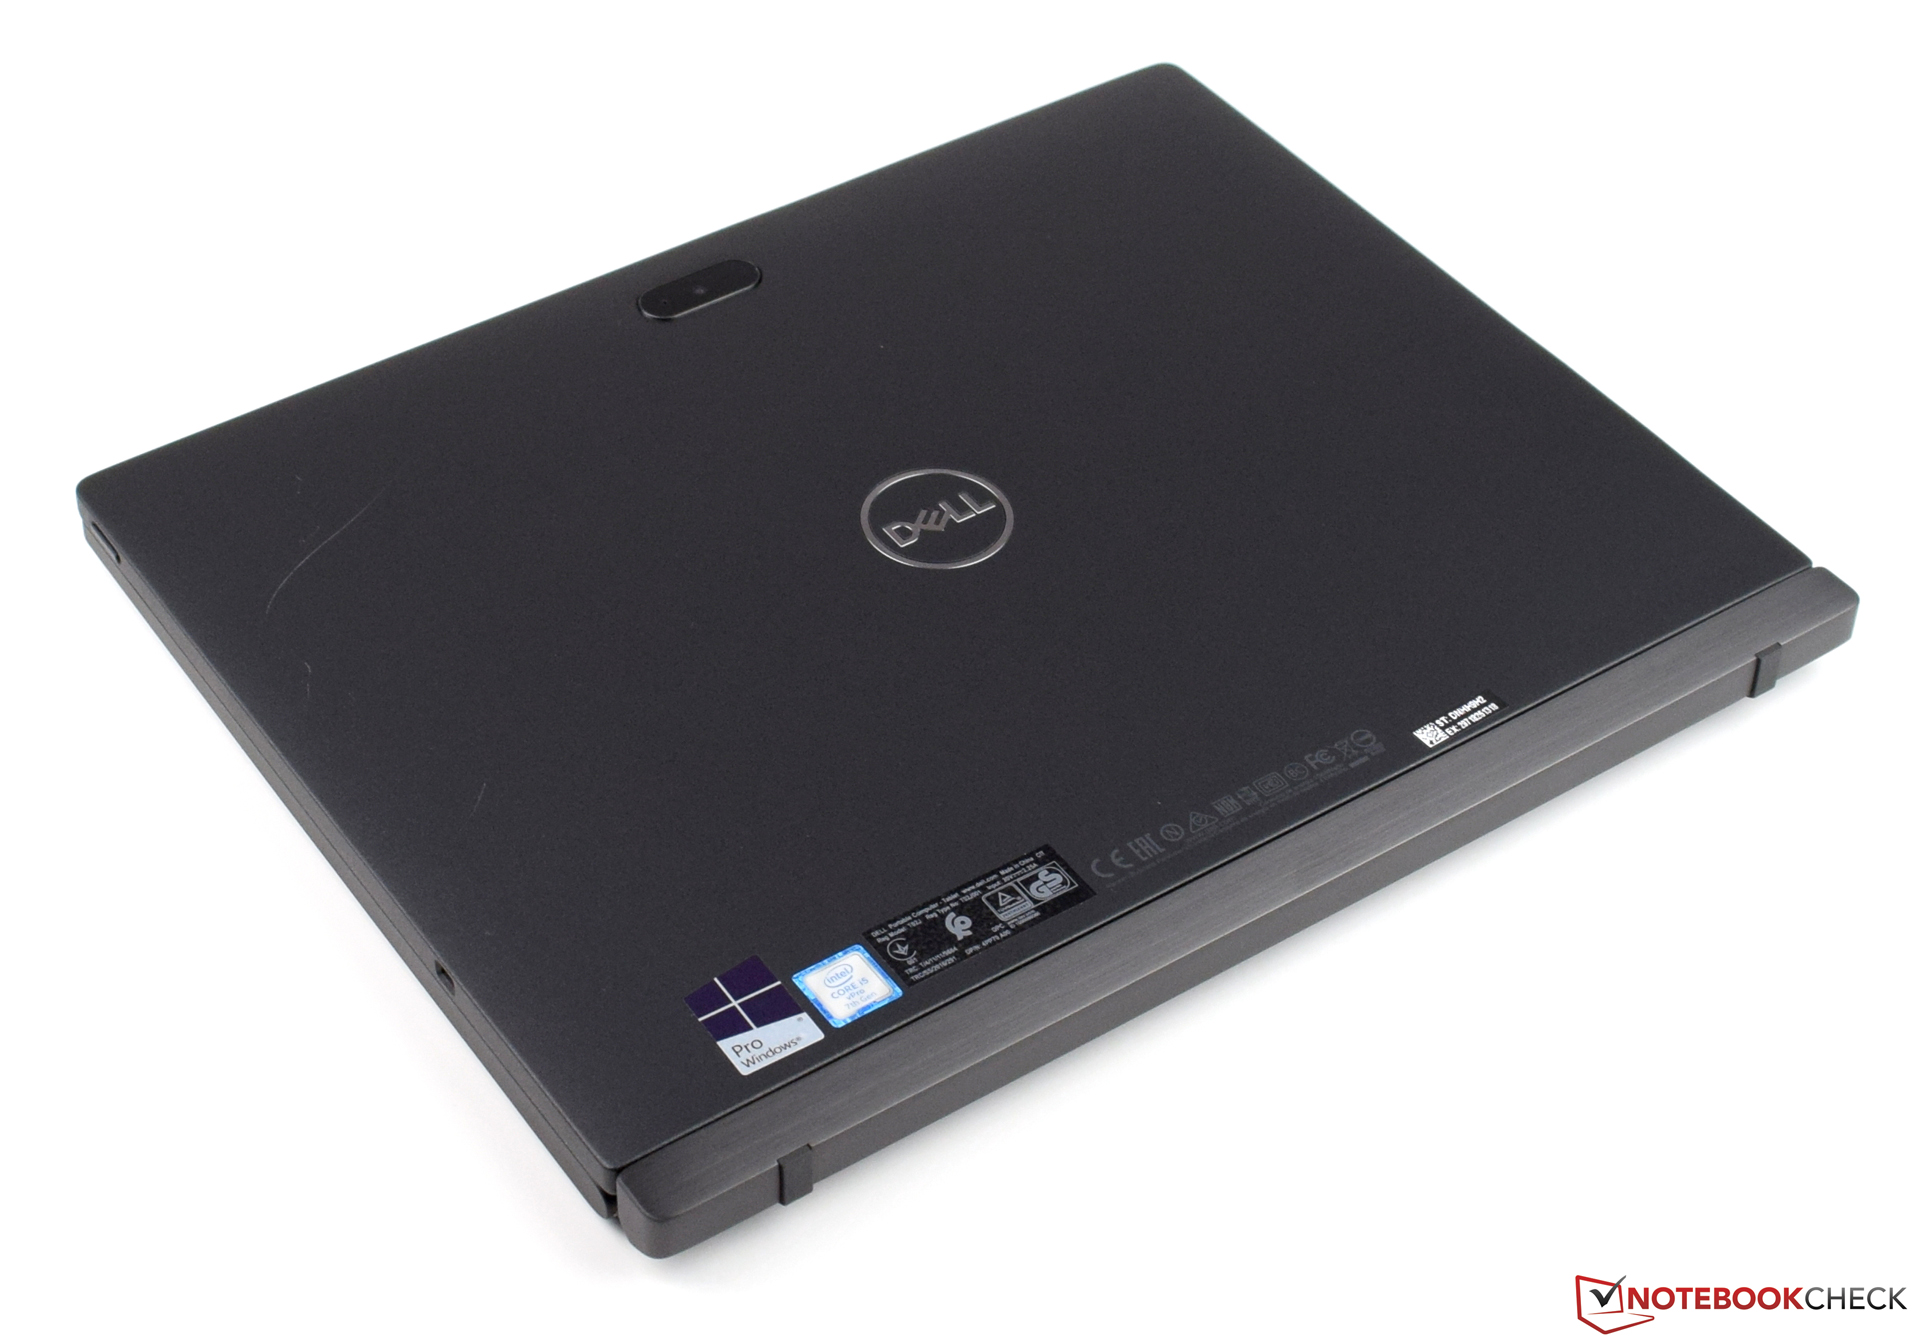
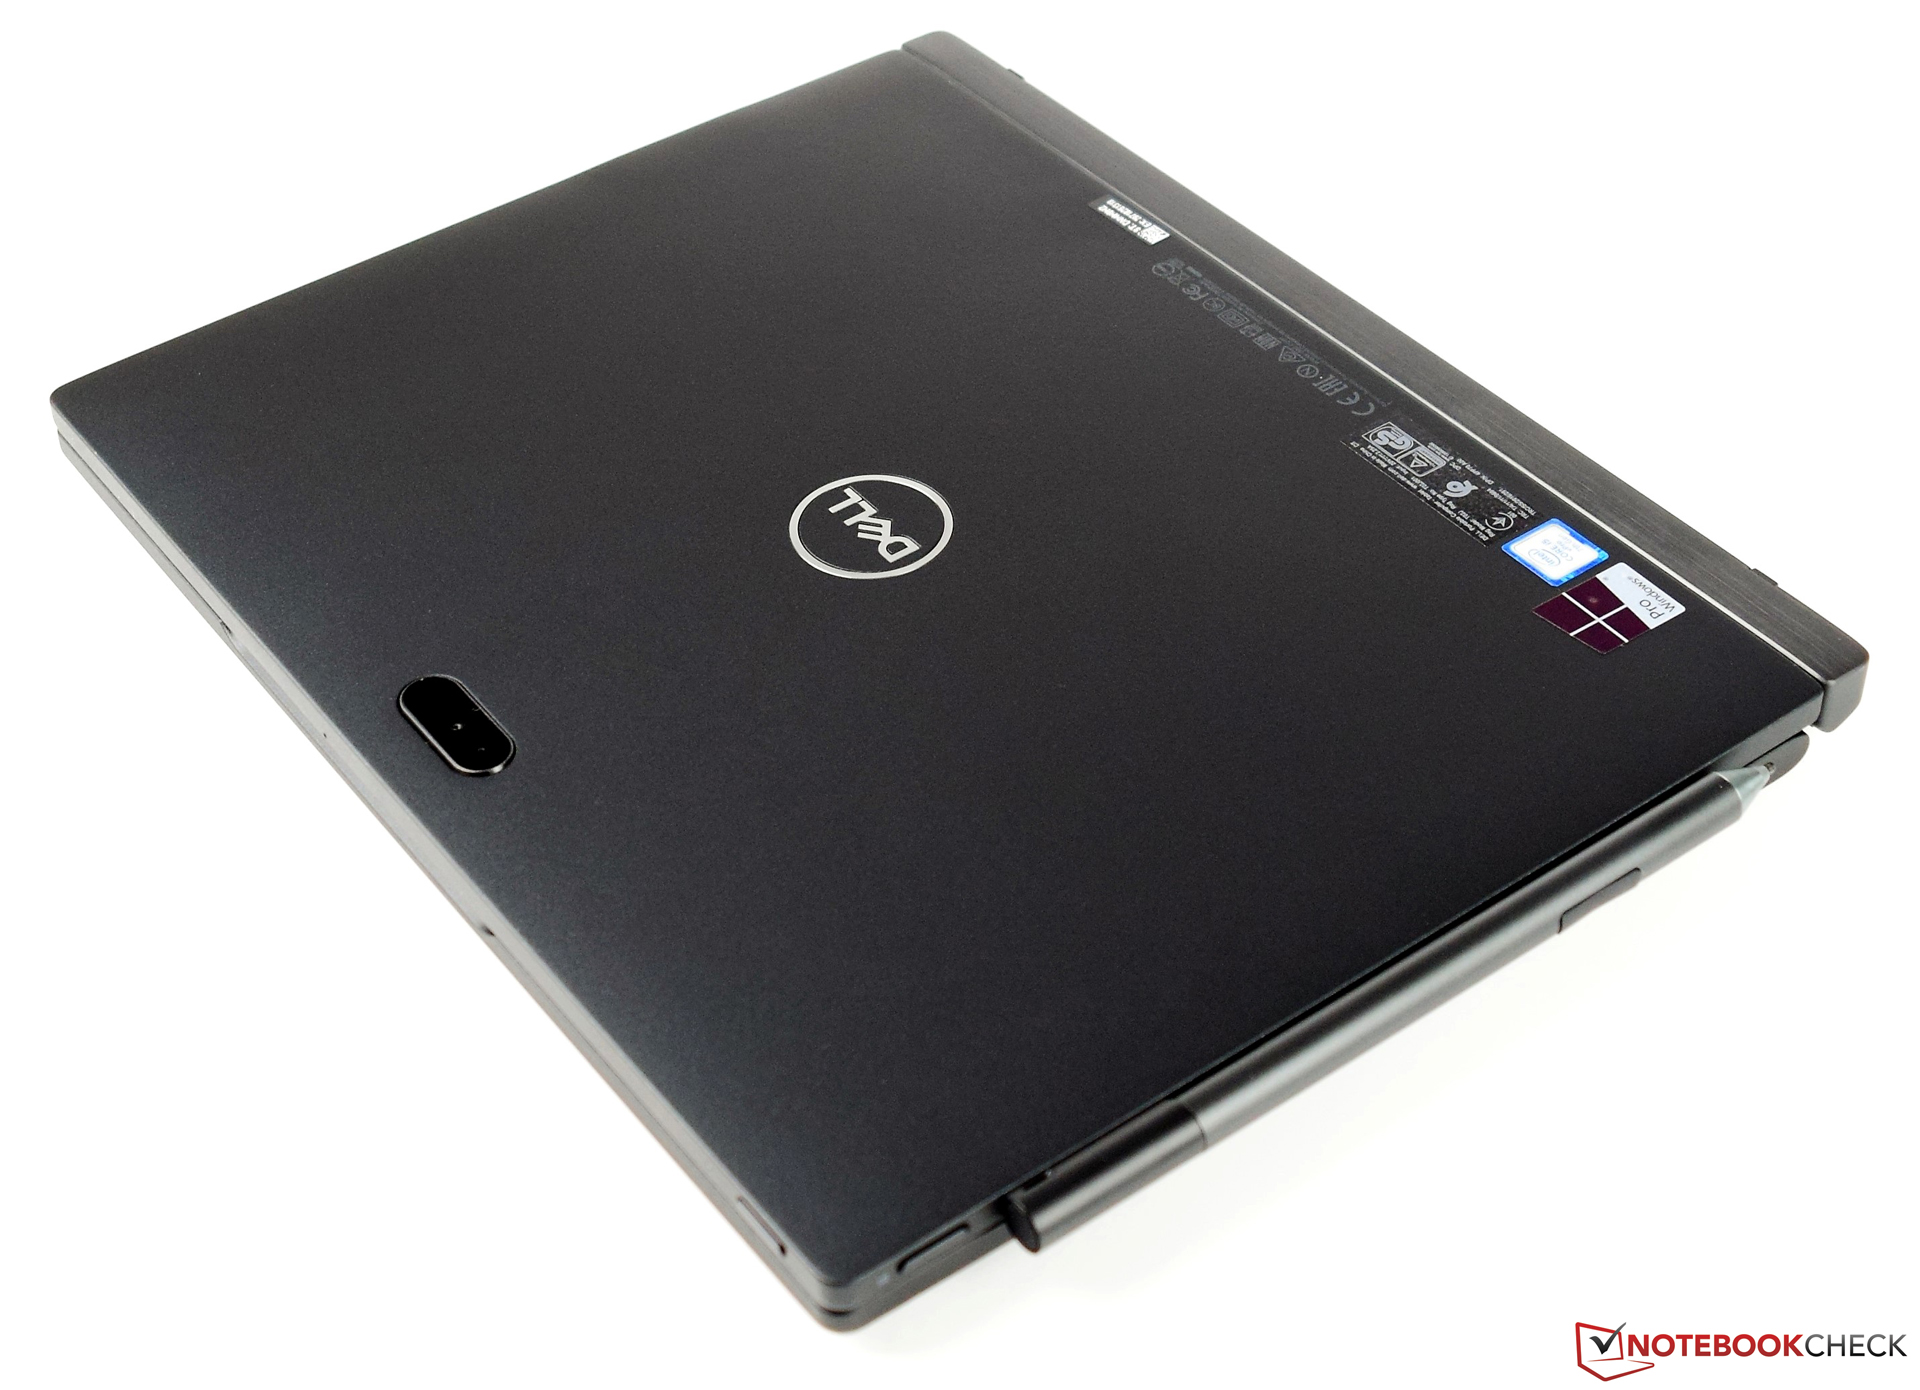
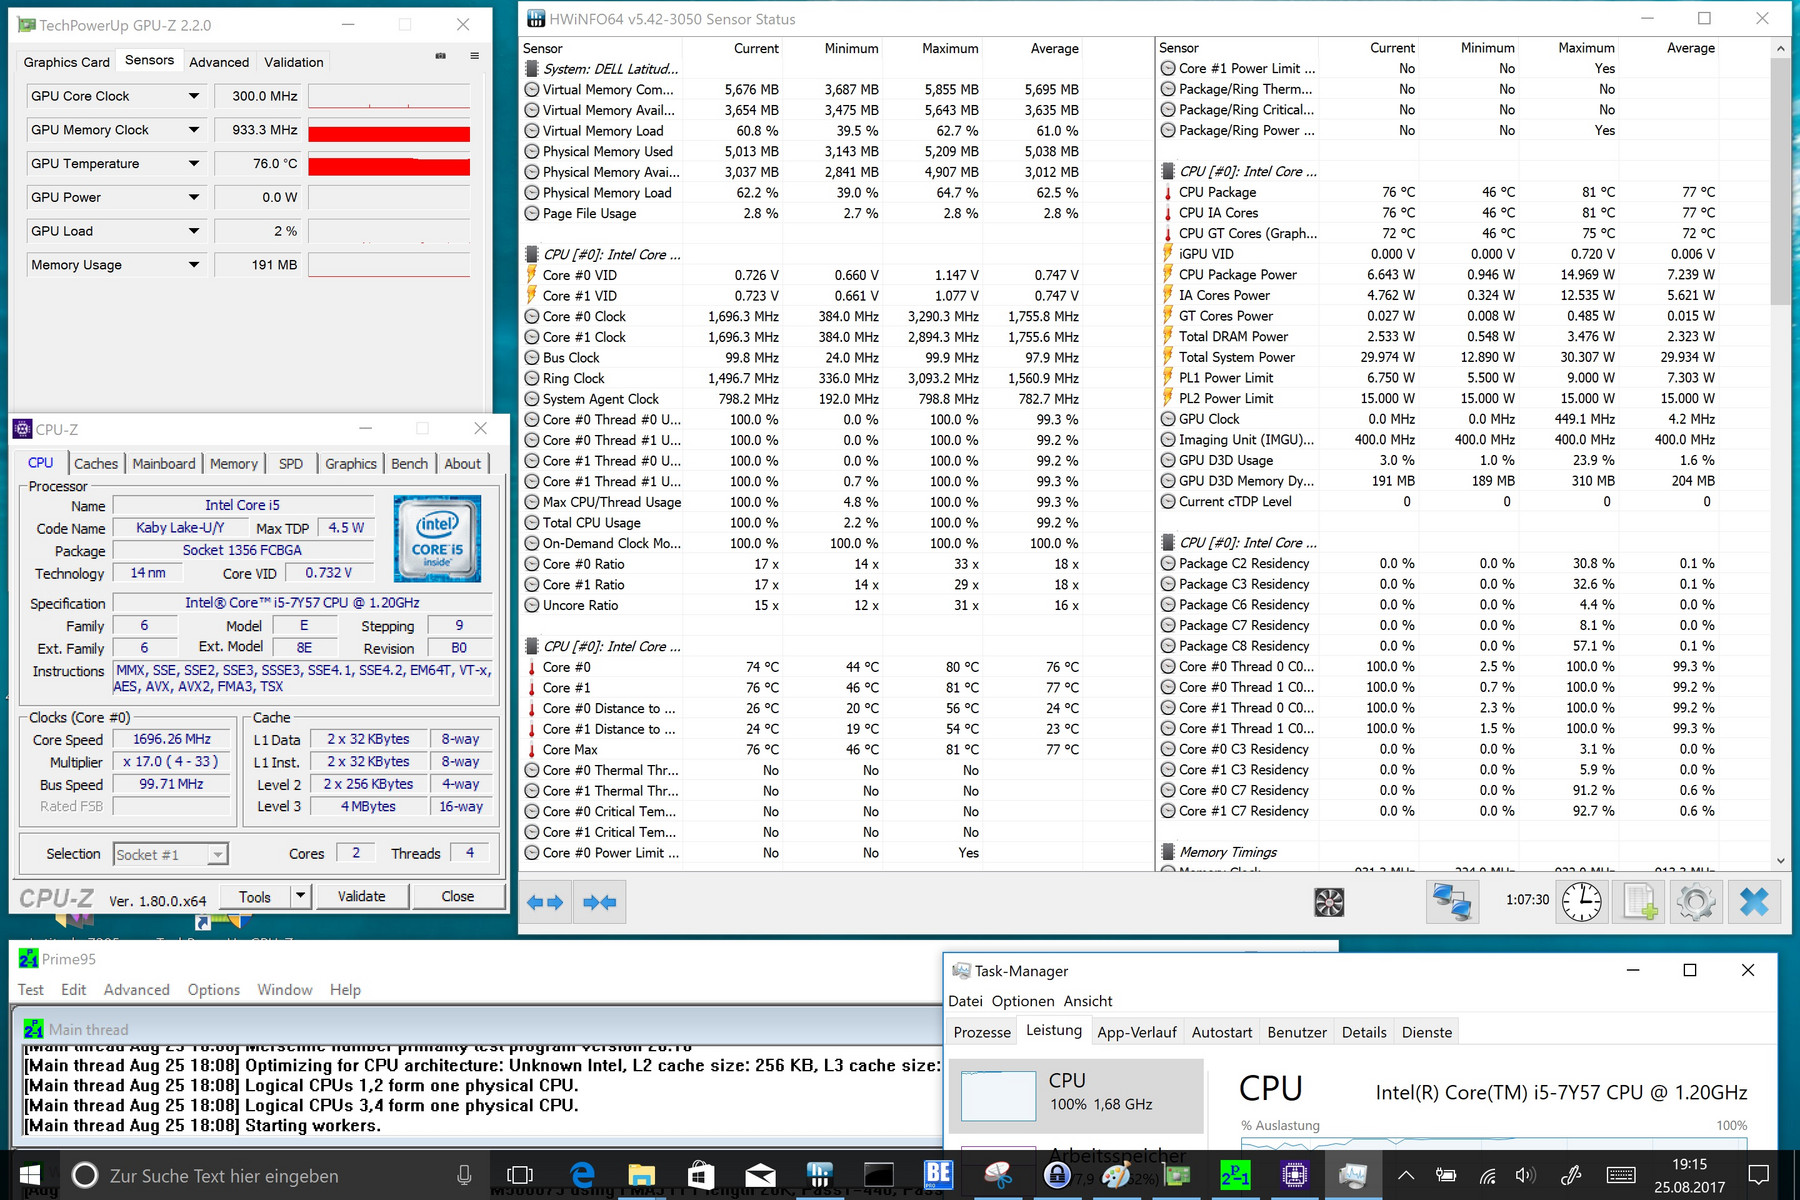
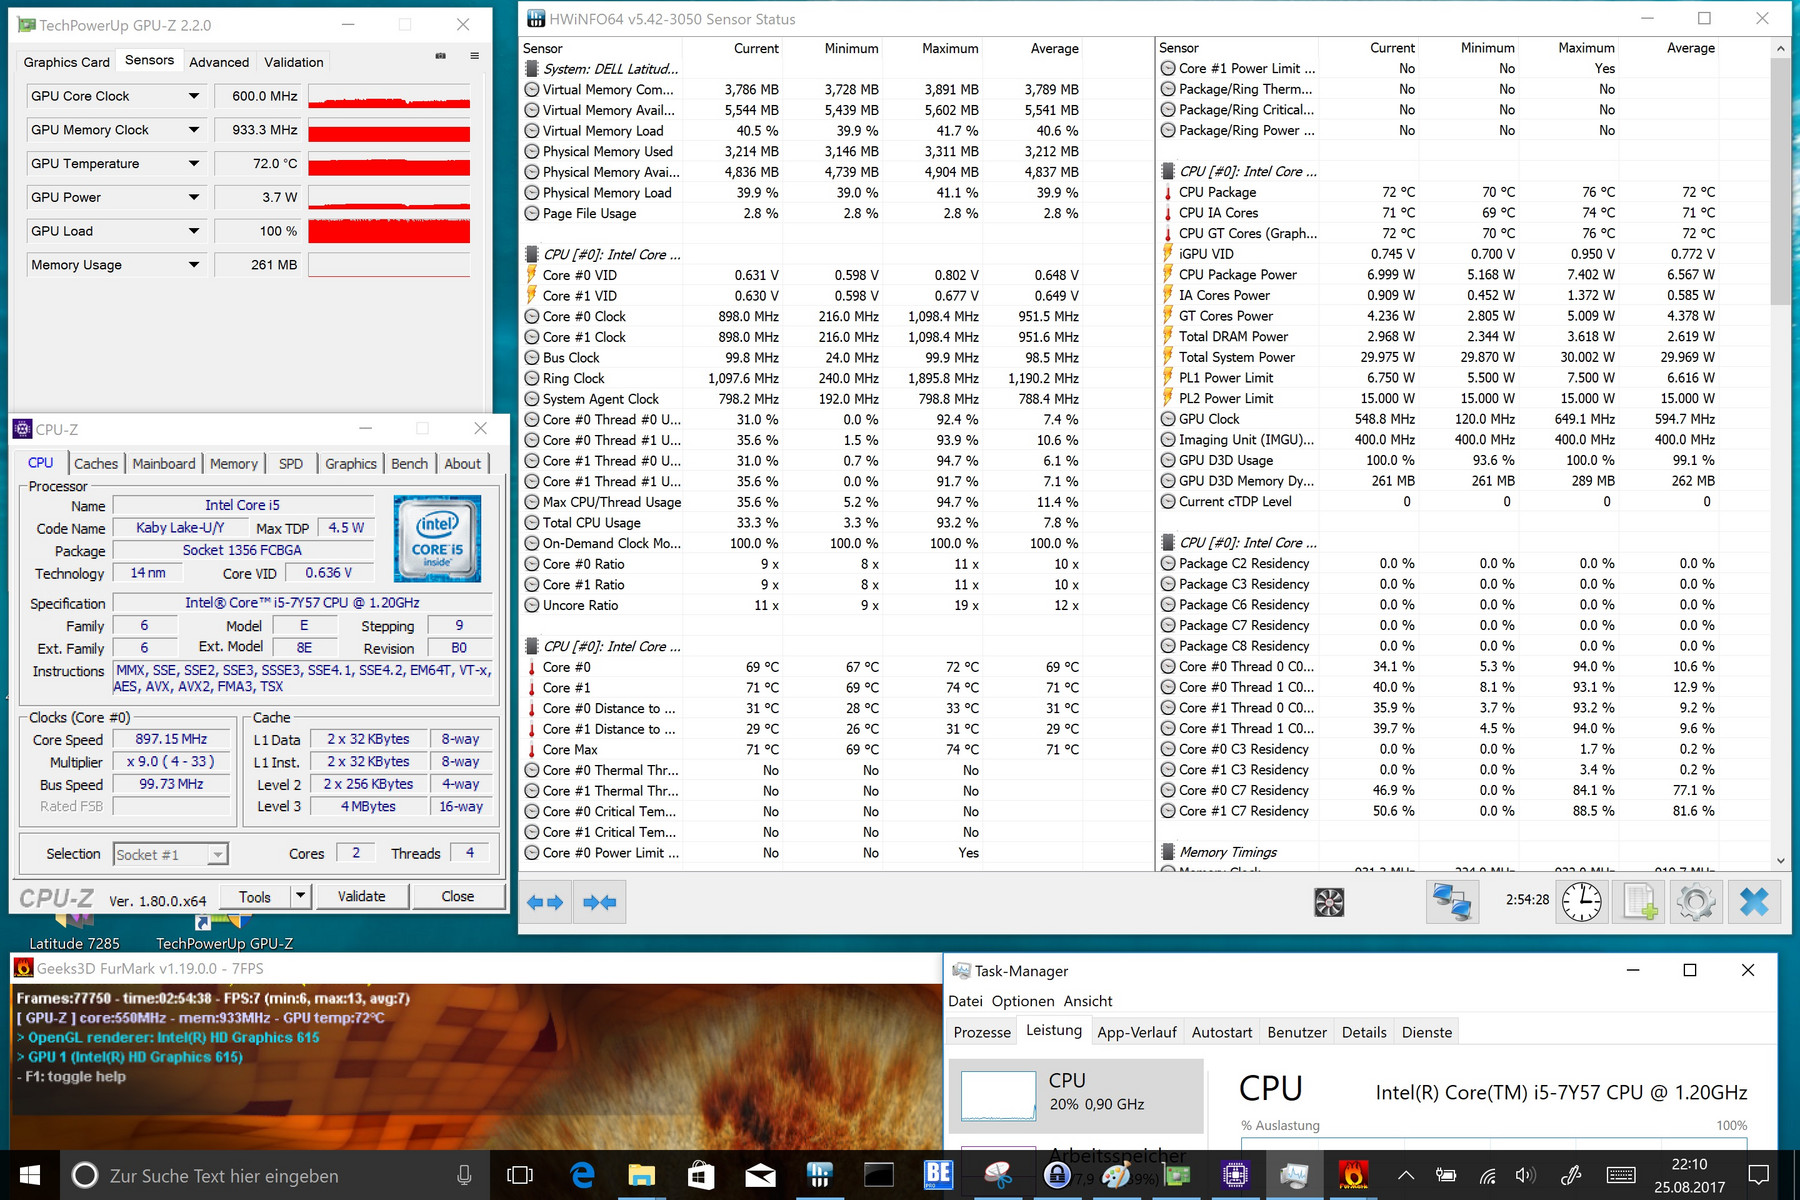
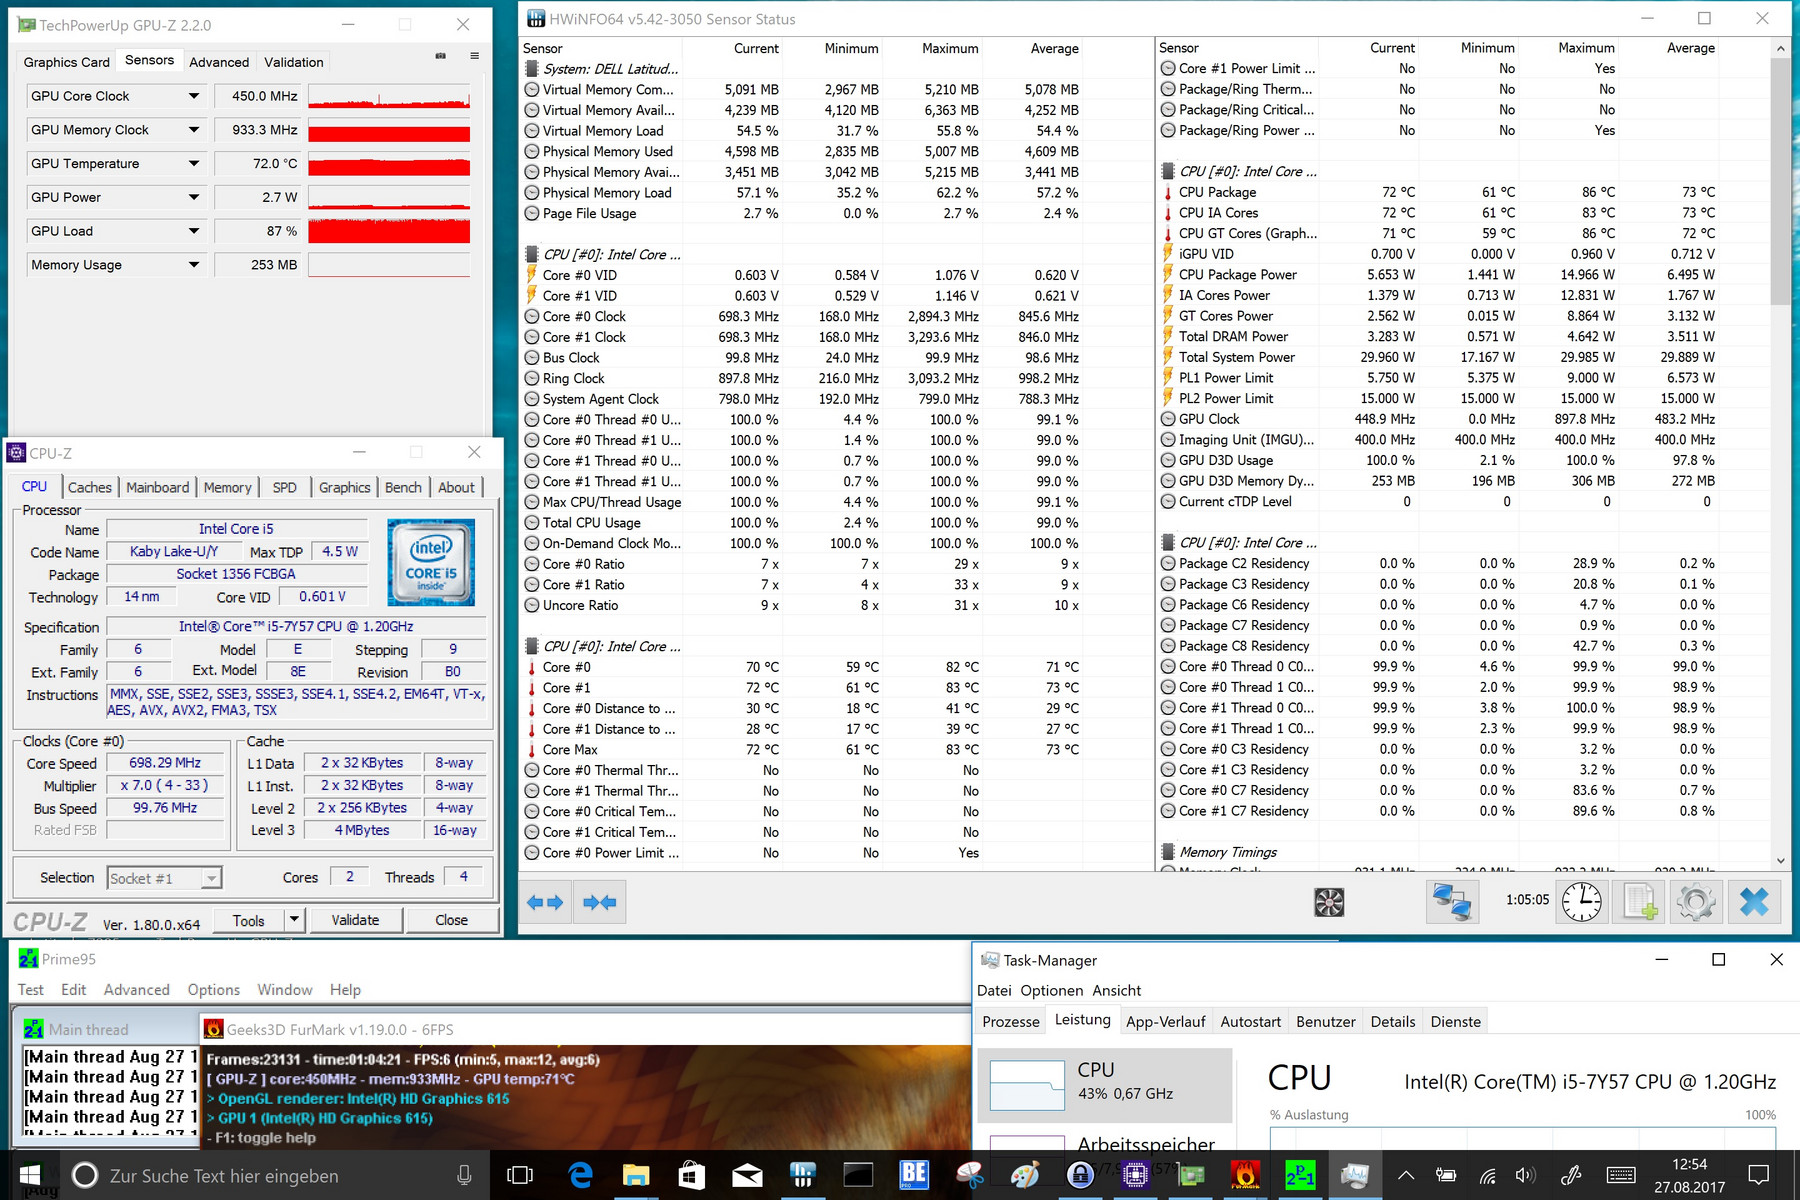
Abbiamo apprezzato la selezione di buoni materiali e il design sobrio. Il Dell Latitude 7285 riceve un'ottima valutazione per il display, che ha una luminosità molto elevata e una buona copertura della gamma di colore. Francamente, ci saremmo aspettati meno prestazioni dal processore, ma poiché Dell un lo limita con il TPD da 4,5 watts, le performance sono leggermente sopra le nostre attese. Tutti i risultati dei test senza eccezione mostrano che il Dell Latitude 7285 basato sull'Intel Core i5-7Y57 regge bene il confronto con la concorrenza.
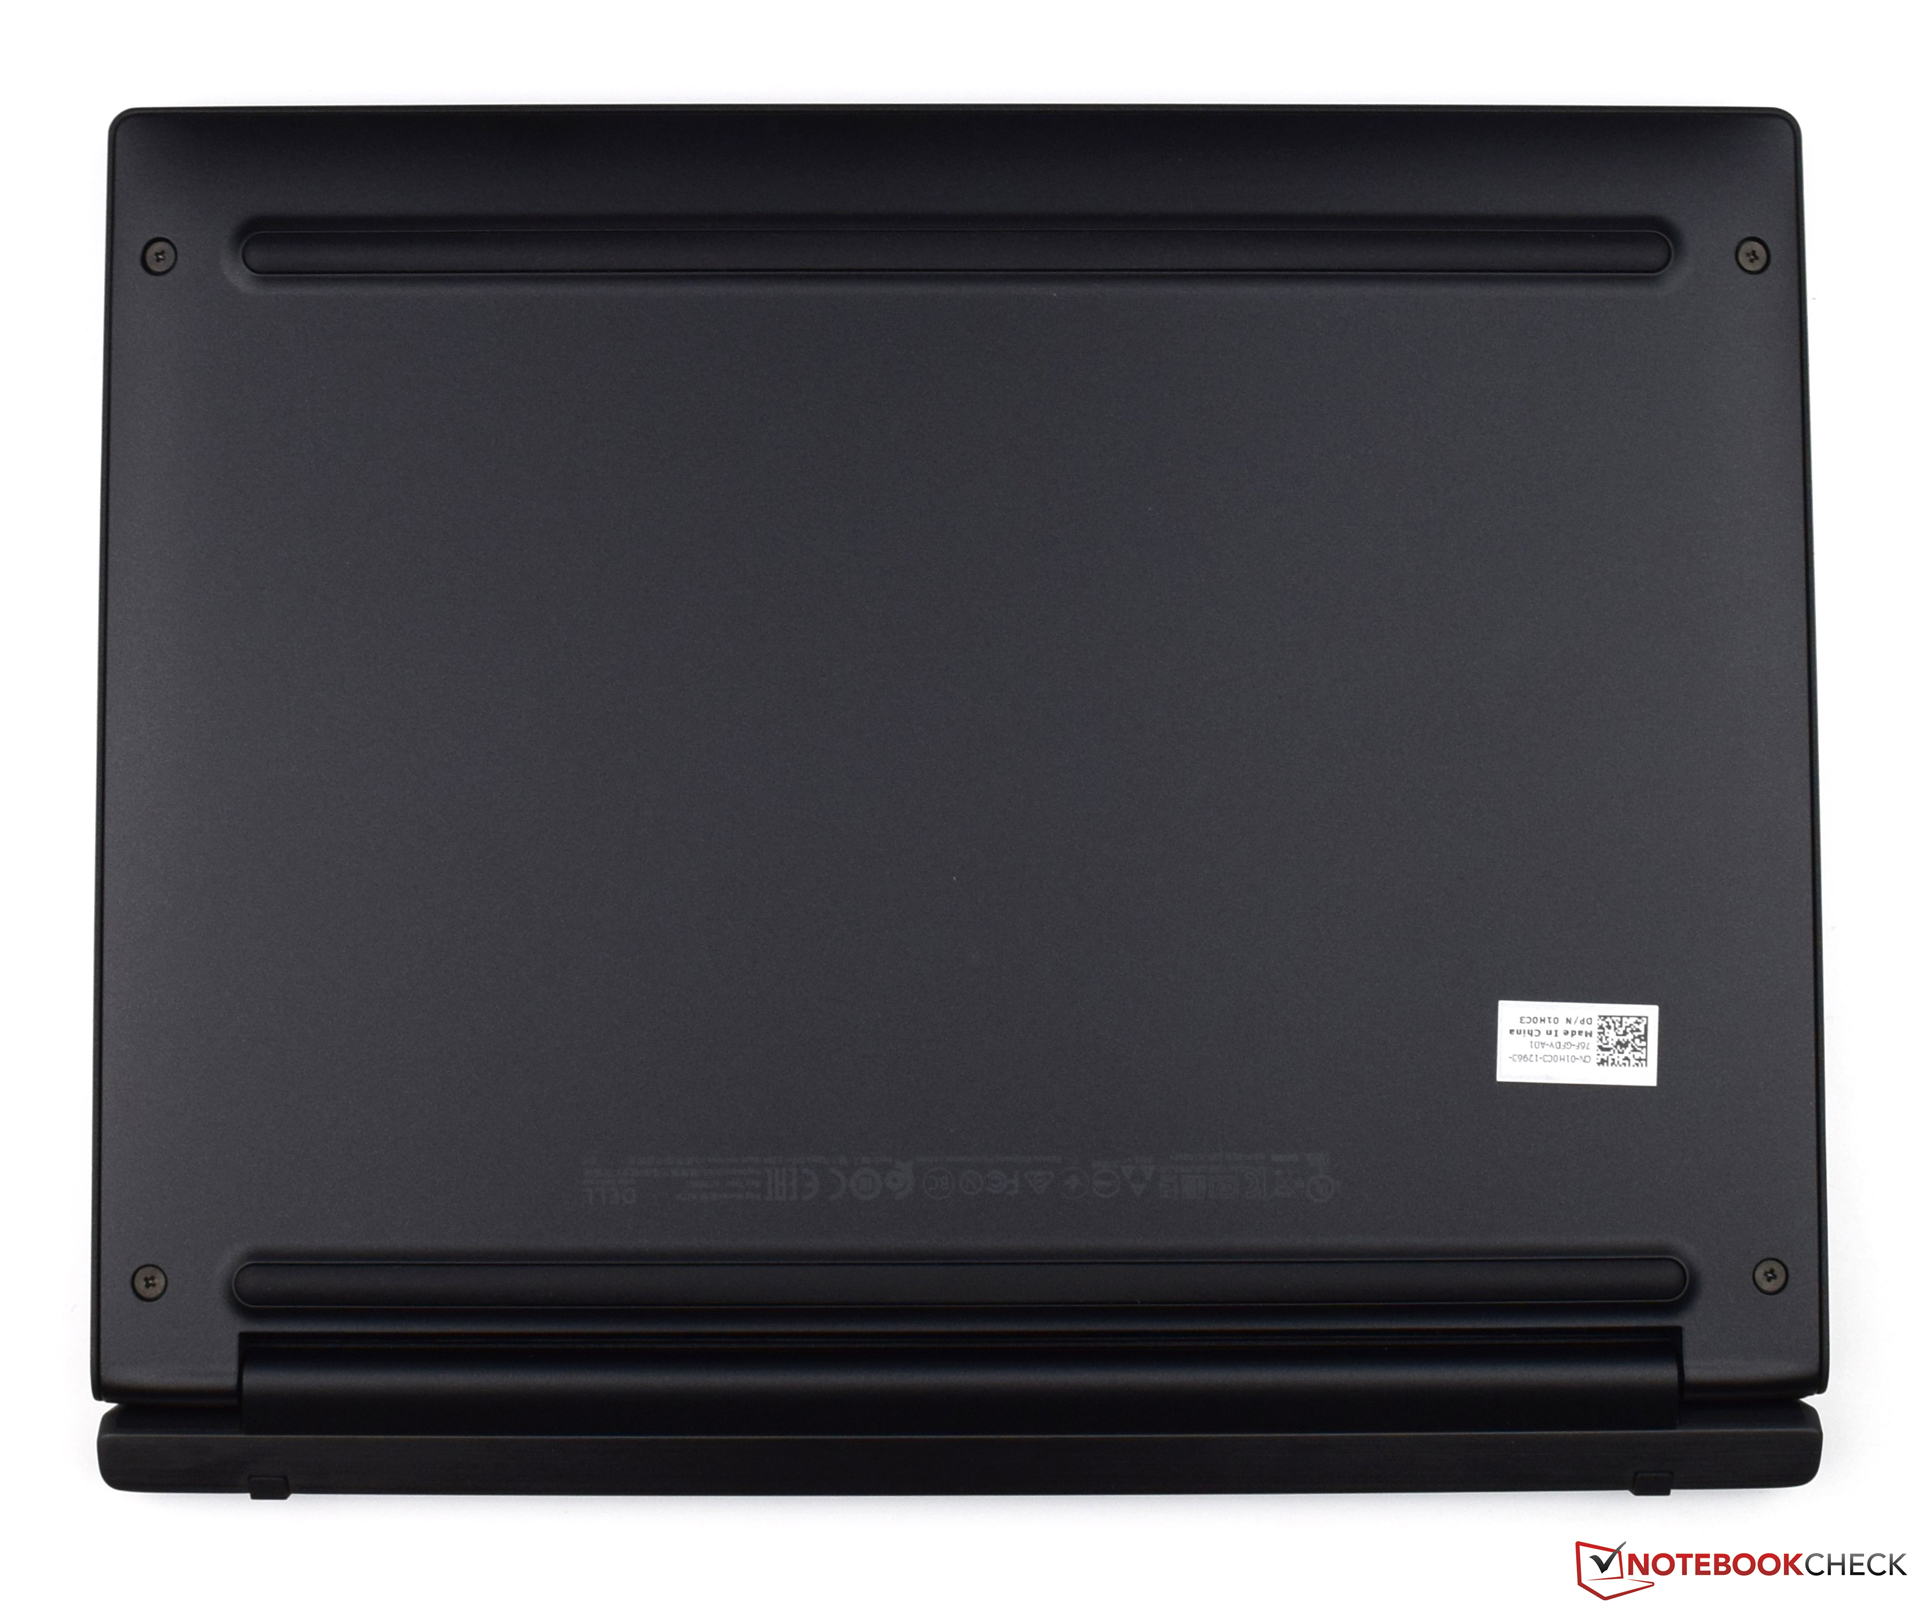
Per quanto riguarda i consumi, il dispositivo ci ha deluso un po', in quanto ci saremmo aspettati valori migliori da componenti frugali. Questo si nota anche nei risultati misti dell'autonomia della batteria. L'idea di mettere una batteria aggiuntiva nella keyboard dock è buona e previene un piazzamento peggiore nel nostro test di confronto.
Nota: si tratta di una recensione breve, con alcune sezioni non tradotte, per la versione integrale in inglese guardate qui.
Dell Latitude 7285
- 09/06/2017 v6 (old)
Sebastian Bade