Recensioni Notebook con Intel HD Graphics 615 la scheda grafica
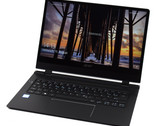
Recensione del portatile Acer Swift 7 SF714-51T (Core i7-7Y75, 256 GB, FHD, Touch)
L'ultimo aggiornamento del nuovo Acer Swift 7 non solo è più sottile del suo predecessore, ma include un processore Intel Core i7 della serie Y che dovrebbe fornire prestazioni migliori, e uno schermo multi-touch. Scoprite in questa recensione dettagliata i punti di forza e di debolezza dell'ultimo Acer Swift 7 e come se la cava con la concorrenza.
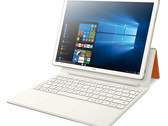
Intel Core i7-7Y75, HD Graphics 615, 14", 1.2 kgRecensione del Convertibile Huawei MateBook E (i5-7Y754, HD615)
Convertibile con design retro. L'Huawei MateBook E ha abbastanza stile per adattarsi a qualsiasi ufficio. Scopri nella nostra recensione se il convertibile con Intel Core i5-7Y54 e HD Graphics 615 si distingue dalla concorrenza con le sue funzionalità interne.
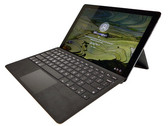
Intel Core i5-7Y54, HD Graphics 615, 12", 1.1 kgRecensione breve del Convertibile Eve V (m3, i5, i7)
Un progetto comune. E' passato circa un anno da quando il progetto Eve V è stato lanciato sulla piattaforma di crowdfunding Indiegogo. Il risultato finanziario è stato ottenuto a tempo record andando oltre il 1800%. Ora è il momento di passare alla distribuzione dei dispositivi ai supporters e testare i potenziali clienti. Oggi abbiamo tra le mani il dispositivo e confronteremo i tre modelli di CPU disponibili per l'Eve V.
Intel Core i5-7Y54, HD Graphics 615, 12.3", 1.4 kgRecensione breve del Google Pixelbook Chromebook
Il Chromebook ideale. Il più costoso Chromebook a disposizione è ovviamente veloce e molto versatile. Vi dovete solo preparare a portarvi dietro gli adattatori USB Type-C.
Intel Core i5-7Y57, HD Graphics 615, 12.3", 1.3 kgRecensione breve del Convertibile Dell Latitude 7285 (i5-7Y57, 256 GB, 3K)
Affidabile compagno di viaggio! Dell ci presenta un versatile convertibile da 12" con un modesto design senza tempo ma elegante. Dentro troviamo una CPU molto frugale Intel. Se questo consentirà un'ampia autonomia senza intaccare le prestazioni del Dell Latitude 7285, lo vedremo nella recensione.
Intel Core i5-7Y57, HD Graphics 615, 12.3", 1.4 kgMicrosoft Surface Pro (2017) m3: Intel Core m3-7Y30, 12.30", 1.1 kg
recensione » Recensione Breve del Convertibile Microsoft Surface Pro (2017) (Core m3, 128GB, 4GB)
Cube Thinker m3: Intel Core m3-7Y30, 13.50", 1.7 kg
recensione » Recensione breve del Portatile Cube Thinker (Core m3-7Y30, 8 GB, 256 GB)
Apple MacBook 12 2017: Intel Core m3-7Y32, 12.00", 0.9 kg
recensione » Recensione breve del Portatile Apple MacBook 12 (2017)
Lenovo ThinkPad X1 Tablet Gen 2: Intel Core i5-7Y54, 12.00", 1.1 kg
recensione » Recensione breve del Tablet Lenovo ThinkPad X1 Tablet Gen 2 (i5-7Y54)
Dell XPS 13 9365-4537 2-in-1: Intel Core i5-7Y54, 13.30", 1.2 kg
recensione » Recensione Breve del Convertibile Dell XPS 13 9365 (7Y54, QHD+)
Dell XPS 13-9365 2-in-1: Intel Core i7-7Y75, 13.30", 1.2 kg
recensione » Recensione Completa del Convertibile Dell XPS 13 9365 2-in-1
Acer Swift 7 SF713-51: Intel Core i5-7Y54, 13.30", 1.1 kg
recensione » Recensione breve del Portatile Acer Swift 7 SF713-51
Acer Spin 7 SP714-51-M09D: Intel Core i5-7Y54, 14.00", 1.3 kg
recensione » Recensione breve del Convertibile Acer Spin 7 SP714-51-M09D
Chuwi UBook XPro: Intel Core i7-7Y75, 13.00", 0.9 kg
Recensioni esterne » Chuwi UBook XPro
Asus Chromebook C425TA-H50039: Intel Pentium Gold 4415Y, 14.00", 1.3 kg
Recensioni esterne » Asus Chromebook C425TA-H50039
Acer Swift 7 SF714-51T-M4JV: Intel Core i7-7Y75, 14.00", 1.2 kg
Recensioni esterne » Acer Swift 7 SF714-51T-M4JV
Acer Swift 7 SF714-51T-M3EW: Intel Core i7-7Y75, 14.00", 1.2 kg
Recensioni esterne » Acer Swift 7 SF714-51T-M3EW
Microsoft Surface Pro (2017) m3: Intel Core m3-7Y30, 12.30", 1.1 kg
Recensioni esterne » Microsoft Surface Pro (2017) m3
Acer Swift 7 SF714-51T-M16F: Intel Core i7-7Y75, 14.00", 1.2 kg
Recensioni esterne » Acer Swift 7 SF714-51T-M16F
Asus VivoBook Flip 14 TP401CA-EC067T: Intel Core m3-7Y30, 14.00", 1.5 kg
Recensioni esterne » Asus VivoBook Flip 14 TP401CA-EC067T
Asus VivoBook Flip 14 TP401CA-DHM4T: Intel Core m3-7Y30, 14.00", 1.5 kg
Recensioni esterne » Asus VivoBook Flip 14 TP401CA-DHM4T
Acer Swift 7 Sf714-51t-m64v: Intel Core i7-7Y75, 14.00", 1.2 kg
Recensioni esterne » Acer Swift 7 Sf714-51t-m64v
Lenovo Yoga Book C930 YB-J912F: Intel Core i5-7Y54, 10.80", 0.8 kg
Recensioni esterne » Lenovo Yoga Book C930 YB-J912F
Samsung Chromebook Plus XE521QAB-K01US: Intel Celeron 3965Y, 12.20", 1.3 kg
Recensioni esterne » Samsung Chromebook Plus XE521QAB-K01US
Microsoft Surface Go MCZ-00002: Intel Pentium Gold 4415Y, 10.00", 0.5 kg
Recensioni esterne » Microsoft Surface Go MCZ-00002
HP Chromebook x2 12-f015nr: Intel Core m3-7Y30, 12.30", 1.4 kg
Recensioni esterne » HP Chromebook x2 12-f015nr
Asus VivoBook Flip 14 TP401CA-EC011T: Intel Core m3-7Y30, 14.00", 1.6 kg
Recensioni esterne » Asus VivoBook Flip 14 TP401CA-EC011T
Wortmann Terra Pad 1270: Intel Core i5-7Y54, 12.10", 0.8 kg
Recensioni esterne » Wortmann Terra Pad 1270
Asus VivoBook Flip 14 TP401CA-DHM6T: Intel Core m3-7Y30, 14.00", 1.5 kg
Recensioni esterne » Asus VivoBook Flip 14 TP401CA-DHM6T
Chuwi CoreBook 13: Intel Core m3-7Y30, 13.30", 1.1 kg
Recensioni esterne » Chuwi CoreBook 13
Teclast F6 Pro: Intel Core m3-7Y30, 13.30", 1.4 kg
Recensioni esterne » Teclast F6 Pro
Acer Swift 7 SF714-51T: Intel Core i7-7Y75, 14.00", 1.2 kg
Recensioni esterne » Acer Swift 7 SF714-51T
Dell Latitude 7285-8718: Intel Core i5-7Y57, 12.30", 1.4 kg
Recensioni esterne » Dell Latitude 7285-8718
Asus Zenbook UX330CA-FC106T: Intel Core m3-7Y30, 13.30", 1.2 kg
Recensioni esterne » Asus Zenbook UX330CA-FC106T
Google Pixelbook: Intel Core i5-7Y57, 12.30", 1.3 kg
Recensioni esterne » Google Pixelbook
Dell Latitude 7285: Intel Core i5-7Y57, 12.30", 1.4 kg
Recensioni esterne » Dell Latitude 7285
Lenovo ThinkPad X1 Tablet 2017, Core i5-7Y57: unknown, 12.00", 1.1 kg
Recensioni esterne » Lenovo ThinkPad X1 Tablet 2017, Core i5-7Y57
Acer Swift 7 SF713-51-M8MF: Intel Core i5-7Y54, 13.30", 1.1 kg
Recensioni esterne » Acer Swift 7 SF713-51-M8MF
Cube i35 Thinker: Intel Core m3-7Y30, 13.50", 1.7 kg
Recensioni esterne » Cube i35 Thinker
Samsung Galaxy Book 10.6 W627N LTE: Intel Core m3-7Y30, 10.60", 0.6 kg
Recensioni esterne » Samsung Galaxy Book 10.6 W627N LTE
Lenovo ThinkPad X1 Tablet 2017, Core i7-7Y75: Intel Core i7-7Y75, 12.00", 1.1 kg
Recensioni esterne » Lenovo ThinkPad X1 Tablet 2017, Core i7-7Y75
Apple MacBook 12 2017: Intel Core m3-7Y32, 12.00", 0.9 kg
Recensioni esterne » Apple MacBook 12 2017
Huawei Matebook E: Intel Core i5-7Y54, 12.10", 1.1 kg
Recensioni esterne » Huawei Matebook E
Microsoft Surface Pro (2017) m3: Intel Core m3-7Y32, 12.30", 0.8 kg
Recensioni esterne » Microsoft Surface Pro (2017)
Dell XPS 13 9365-4537 2-in-1: Intel Core i5-7Y54, 13.30", 1.2 kg
Recensioni esterne » Dell XPS 13 9365-4537
Acer Swift 7 SF713-51-M90J: Intel Core i5-7Y54, 13.30", 1.1 kg
Recensioni esterne » Acer Swift 7 SF713-51-M90J
Lenovo Yoga 710-11IKB-80V6001RGE: Intel Core m3-7Y30, 11.60", 1 kg
Recensioni esterne » Lenovo Yoga 710-11IKB-80V6001RGE
Dell Inspiron 11 3179: Intel Core m3-7Y30, 11.60", 1.4 kg
Recensioni esterne » Dell Inspiron 11 3179
Acer Swift 7 SF713-51-M2SB: Intel Core i5-7Y54, 13.30", 1.1 kg
Recensioni esterne » Acer Swift 7 SF713-51-M2SB
Asus Zenbook Flip UX360CA-C4171T: Intel Core m3-7Y30, 13.30", 1.3 kg
Recensioni esterne » Asus Zenbook Flip UX360CA-C4171T
Cube Mix Plus: Intel Core m3-7Y30, 10.60", 0.7 kg
Recensioni esterne » Cube Mix Plus
Dell XPS 13 9365-4544 2-in-1: Intel Core i7-7Y75, 13.30", 1.2 kg
Recensioni esterne » Dell XPS 13 9365-4544 2-in-1
HP Pro x2 612 G2: Intel Core m3-7Y30, 12.10", 1.2 kg
Recensioni esterne » HP Pro x2 612 G2
Lenovo ThinkPad X1 Tablet 2017: Intel Core m3-7Y30, 12.20", 1.1 kg
Recensioni esterne » Lenovo ThinkPad X1 Tablet 2017
Dell XPS 13-9365 2-in-1: Intel Core i7-7Y75, 13.30", 1.2 kg
Recensioni esterne » Dell XPS 13-9365
Acer Swift 7 SF713-51-M2LH: Intel Core i5-7Y54, 13.30", 1.1 kg
Recensioni esterne » Acer Swift 7 SF713-51-M2LH
Acer Spin 7 SP714-51-M37P: Intel Core i7-7Y75, 14.00", 1.6 kg
Recensioni esterne » Acer Spin 7 SP714-51-M37P
Asus Transformer 3 T305CA-GW019T: Intel Core m3-7Y30, 12.60", 0.7 kg
Recensioni esterne » Asus Transformer 3 T305CA-GW019T
Acer Spin 7 SP714-51-M339: Intel Core i5-7Y54, 14.00", 1.3 kg
Recensioni esterne » Acer Spin 7 SP714-51-M339
Dell XPS 13 2-in-1: Intel Core i5-7Y54, 13.30", 1.2 kg
Recensioni esterne » Dell XPS 13 2-in-1
Acer Spin 7 SP714-51-M4YD: Intel Core i7-7Y75, 14.00", 1.3 kg
Recensioni esterne » Acer Spin 7 SP714-51-M4YD
Asus Zenbook UX360CA-C4172T: Intel Core i5-7Y54, 13.30", 1.3 kg
Recensioni esterne » Asus Zenbook UX360CA-C4172T
Acer Spin 7 SP714-51-M09D: Intel Core i5-7Y54, 14.00", 1.3 kg
Recensioni esterne » Acer Spin 7 SP714-51-M09D
Acer Aspire R14 R7-471T-M613: Intel Core i7-7Y75, 14.00", 1.2 kg
Recensioni esterne » Acer Aspire R14 R7-471T-M613
Asus Transformer 3 T305CA-GW015T: Intel Core m3-7Y30, 12.60", 0.7 kg
Recensioni esterne » Asus Transformer 3 T305CA-GW015T
Acer Spin 7 SP714-51-M6LT: Intel Core i7-7Y75, 14.00", 1.6 kg
Recensioni esterne » Acer Spin 7 SP714-51-M6LT
Acer Swift 7 SF713-51: Intel Core i5-7Y54, 13.30", 1.1 kg
Recensioni esterne » Acer Swift 7 SF713-51