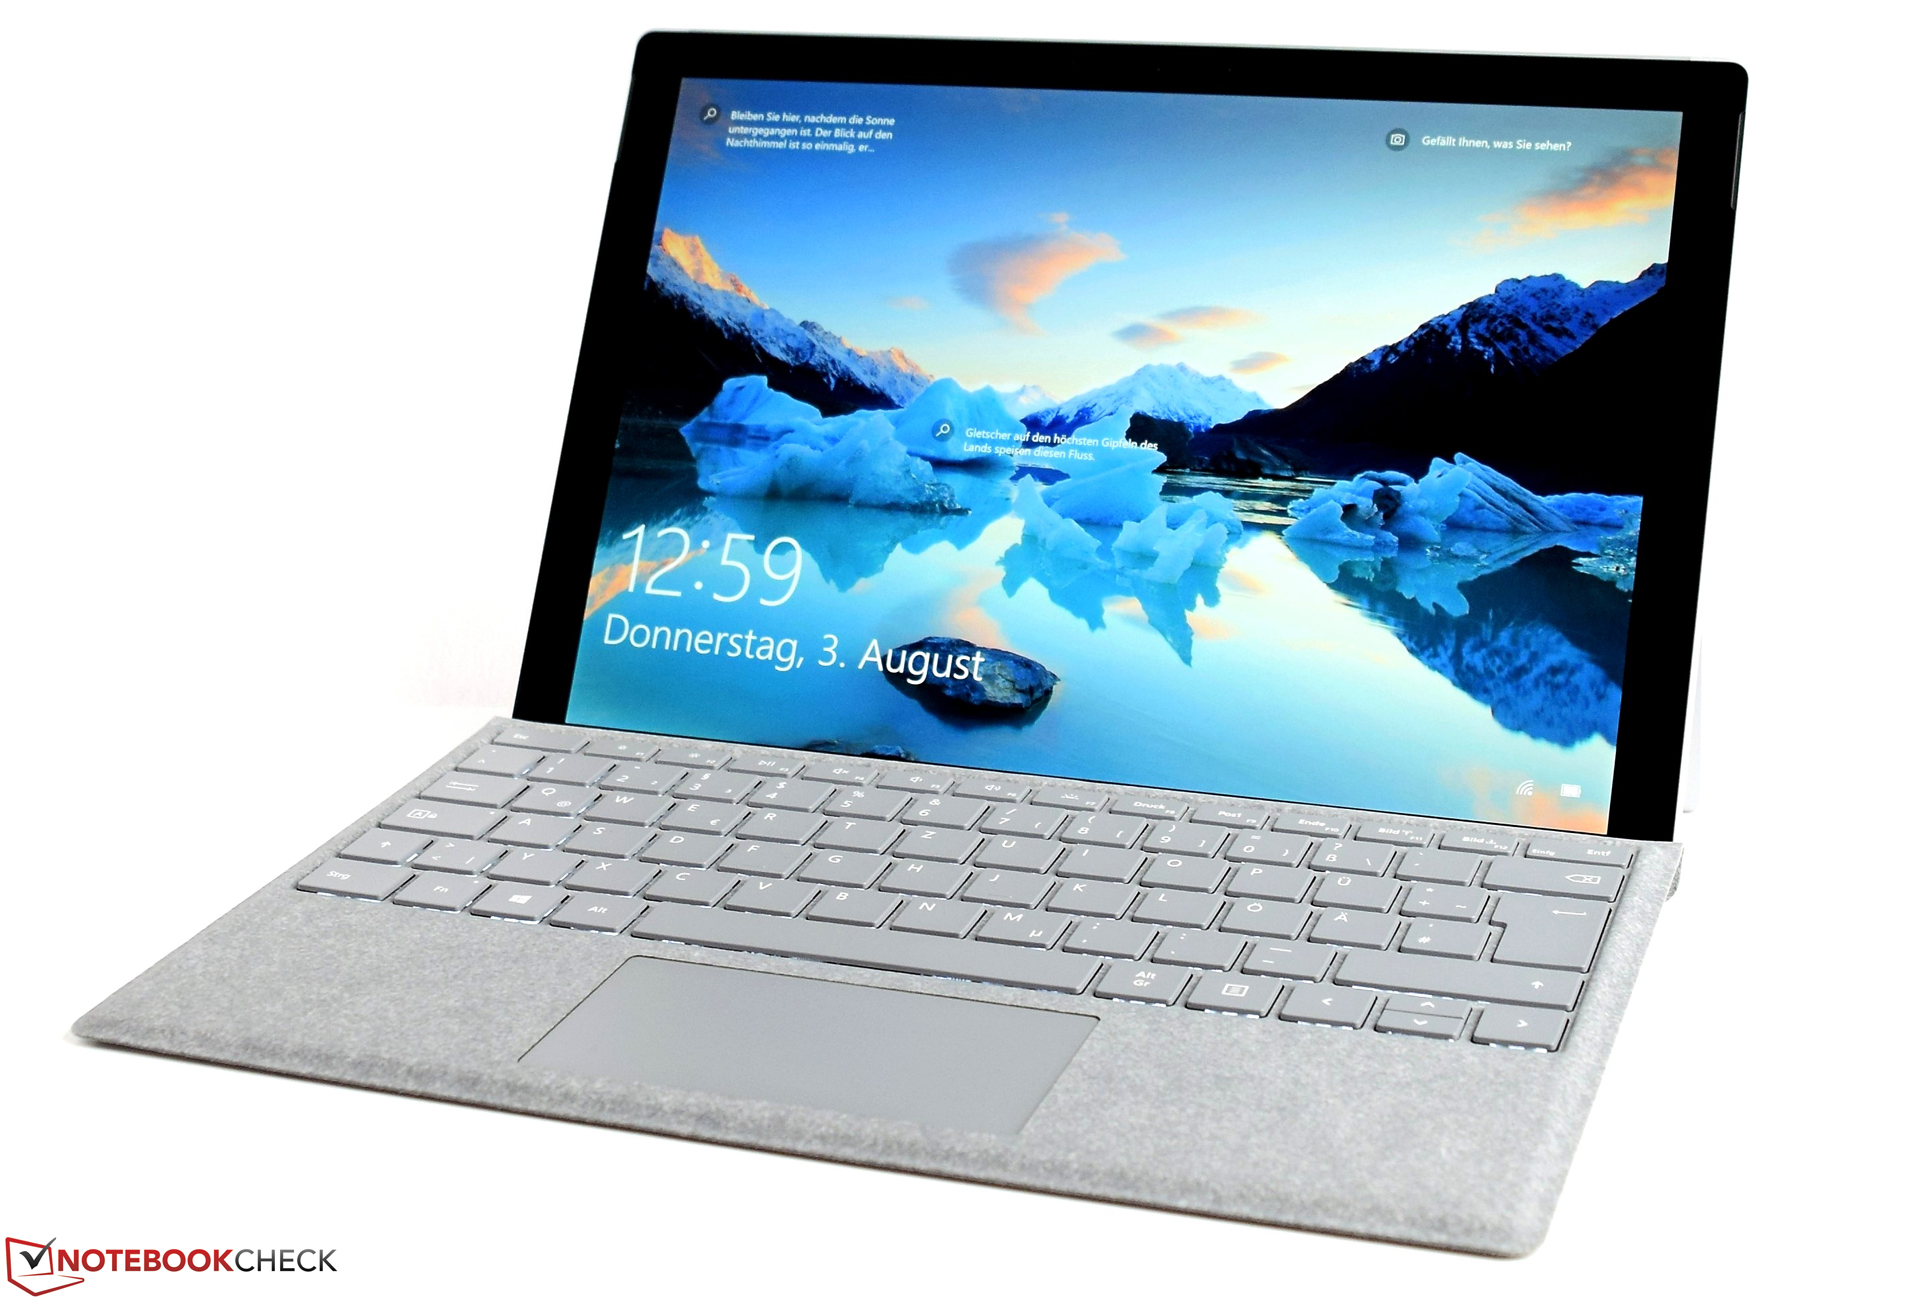
Recensione Breve del Convertibile Microsoft Surface Pro (2017) (Core m3, 128GB, 4GB)
| SD Card Reader | |
| average JPG Copy Test (av. of 3 runs) | |
| Lenovo ThinkPad X1 Tablet Gen 2 (Toshiba Exceria Pro SDXC 64 GB UHS-II) | |
| Microsoft Surface Pro (2017) m3 (Toshiba Exceria Pro M401 64 GB) | |
| Microsoft Surface Pro (2017) i7 (Toshiba Exceria Pro M401 64 GB) | |
| maximum AS SSD Seq Read Test (1GB) | |
| Lenovo ThinkPad X1 Tablet Gen 2 (Toshiba Exceria Pro SDXC 64 GB UHS-II) | |
| Microsoft Surface Pro (2017) i7 (Toshiba Exceria Pro M401 64 GB) | |
| Microsoft Surface Pro (2017) m3 (Toshiba Exceria Pro M401 64 GB) | |
| |||||||||||||||||||||||||
Distribuzione della luminosità: 93 %
Al centro con la batteria: 461 cd/m²
Contrasto: 1356:1 (Nero: 0.34 cd/m²)
ΔE ColorChecker Calman: 3.43 | ∀{0.5-29.43 Ø4.71}
ΔE Greyscale Calman: 3.08 | ∀{0.09-98 Ø4.96}
99% sRGB (Argyll 1.6.3 3D)
64% AdobeRGB 1998 (Argyll 1.6.3 3D)
70.1% AdobeRGB 1998 (Argyll 3D)
99.2% sRGB (Argyll 3D)
68.5% Display P3 (Argyll 3D)
Gamma: 3.03
CCT: 7014 K
| Microsoft Surface Pro (2017) m3 LG Display LP123WQ112604, , 2736x1826, 12.3" | Microsoft Surface Pro (2017) i7 LG Display LP123WQ112604, , 2736x1824, 12.3" | Microsoft Surface Pro (2017) i5 LG Display LP123WQ112604, , 2736x1824, 12.3" | Lenovo Ideapad Miix 720-12IKB AUO B120YAN01 / AUO106F, , 2880x1920, 12" | HP Elite x2 1012 G1 LG Philips, , 1920x1280, 12.1" | Lenovo ThinkPad X1 Tablet Gen 2 LSN120QL01L01, , 2160x1440, 12" | Samsung Galaxy Tab Pro S W700N Digital Flat Panel (NoName), , 2160x1440, 12.1" | Acer Aspire Switch Alpha 12 SA5-271-56HM Panasonic VVX12T041N00, , 2160x1440, 12" | |
|---|---|---|---|---|---|---|---|---|
| Screen | -16% | -0% | -28% | -43% | -31% | 81% | -44% | |
| Brightness middle (cd/m²) | 461 | 482 5% | 417 -10% | 406 -12% | 322 -30% | 388.1 -16% | 363 -21% | 345 -25% |
| Brightness (cd/m²) | 444 | 466 5% | 401 -10% | 396 -11% | 319 -28% | 344 -23% | 378 -15% | 328 -26% |
| Brightness Distribution (%) | 93 | 92 -1% | 88 -5% | 88 -5% | 97 4% | 78 -16% | 90 -3% | 91 -2% |
| Black Level * (cd/m²) | 0.34 | 0.395 -16% | 0.29 15% | 0.3 12% | 0.42 -24% | 0.39 -15% | 0.03 91% | 0.38 -12% |
| Contrast (:1) | 1356 | 1220 -10% | 1438 6% | 1353 0% | 767 -43% | 995 -27% | 12100 792% | 908 -33% |
| Colorchecker dE 2000 * | 3.43 | 4 -17% | 3.63 -6% | 5.28 -54% | 6.02 -76% | 4.6 -34% | 4.8 -40% | 8.4 -145% |
| Colorchecker dE 2000 max. * | 5.55 | 7.2 -30% | 6.74 -21% | 9.83 -77% | 10.06 -81% | 9.1 -64% | 6.91 -25% | 11.9 -114% |
| Greyscale dE 2000 * | 3.08 | 5.7 -85% | 2.18 29% | 6.71 -118% | 6.29 -104% | 6.1 -98% | 5.04 -64% | 4.3 -40% |
| Gamma | 3.03 73% | 2.28 96% | 3.09 71% | 2.29 96% | 2.4 92% | 2.07 106% | 2.57 86% | 2.63 84% |
| CCT | 7014 93% | 7950 82% | 6767 96% | 6532 100% | 7712 84% | 7104 91% | 7255 90% | 7368 88% |
| Color Space (Percent of AdobeRGB 1998) (%) | 64 | 62 -3% | 63 -2% | 59 -8% | 47.8 -25% | 59 -8% | 73 14% | 62 -3% |
| Color Space (Percent of sRGB) (%) | 99 | 96 -3% | 99 0% | 91 -8% | 73.2 -26% | 91 -8% |
* ... Meglio usare valori piccoli
Tempi di risposta del Display
| ↔ Tempi di risposta dal Nero al Bianco | ||
|---|---|---|
| 28 ms ... aumenta ↗ e diminuisce ↘ combinato | ↗ 18 ms Incremento | 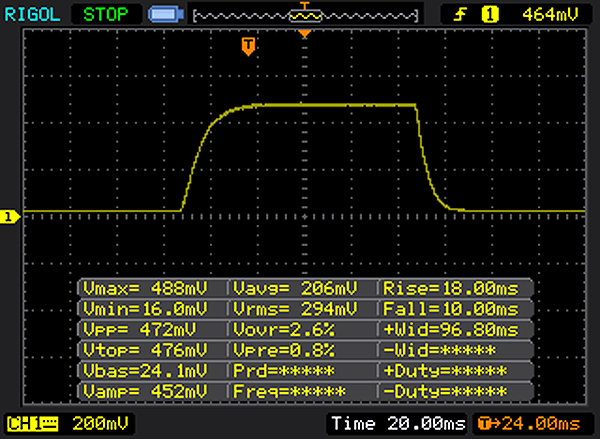 |
| ↘ 10 ms Calo | ||
| Lo schermo mostra tempi di risposta relativamente lenti nei nostri tests e potrebbe essere troppo lento per i gamers. In confronto, tutti i dispositivi di test variano da 0.1 (minimo) a 240 (massimo) ms. » 71 % di tutti i dispositivi è migliore. Questo significa che i tempi di risposta rilevati sono peggiori rispetto alla media di tutti i dispositivi testati (19.8 ms). | ||
| ↔ Tempo di risposta dal 50% Grigio all'80% Grigio | ||
| 42 ms ... aumenta ↗ e diminuisce ↘ combinato | ↗ 20 ms Incremento | 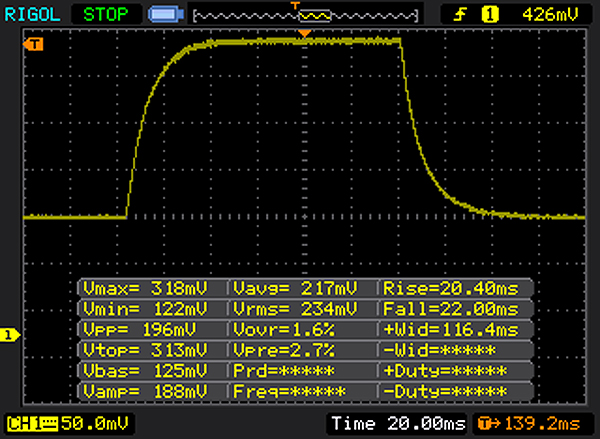 |
| ↘ 22 ms Calo | ||
| Lo schermo mostra tempi di risposta lenti nei nostri tests e sarà insoddisfacente per i gamers. In confronto, tutti i dispositivi di test variano da 0.165 (minimo) a 636 (massimo) ms. » 67 % di tutti i dispositivi è migliore. Questo significa che i tempi di risposta rilevati sono peggiori rispetto alla media di tutti i dispositivi testati (30.9 ms). | ||
Sfarfallio dello schermo / PWM (Pulse-Width Modulation)
| flickering dello schermo / PWM non rilevato | ||
In confronto: 52 % di tutti i dispositivi testati non utilizza PWM per ridurre la luminosita' del display. Se è rilevato PWM, una media di 7741 (minimo: 5 - massimo: 343500) Hz è stata rilevata. | ||
* ... Meglio usare valori piccoli
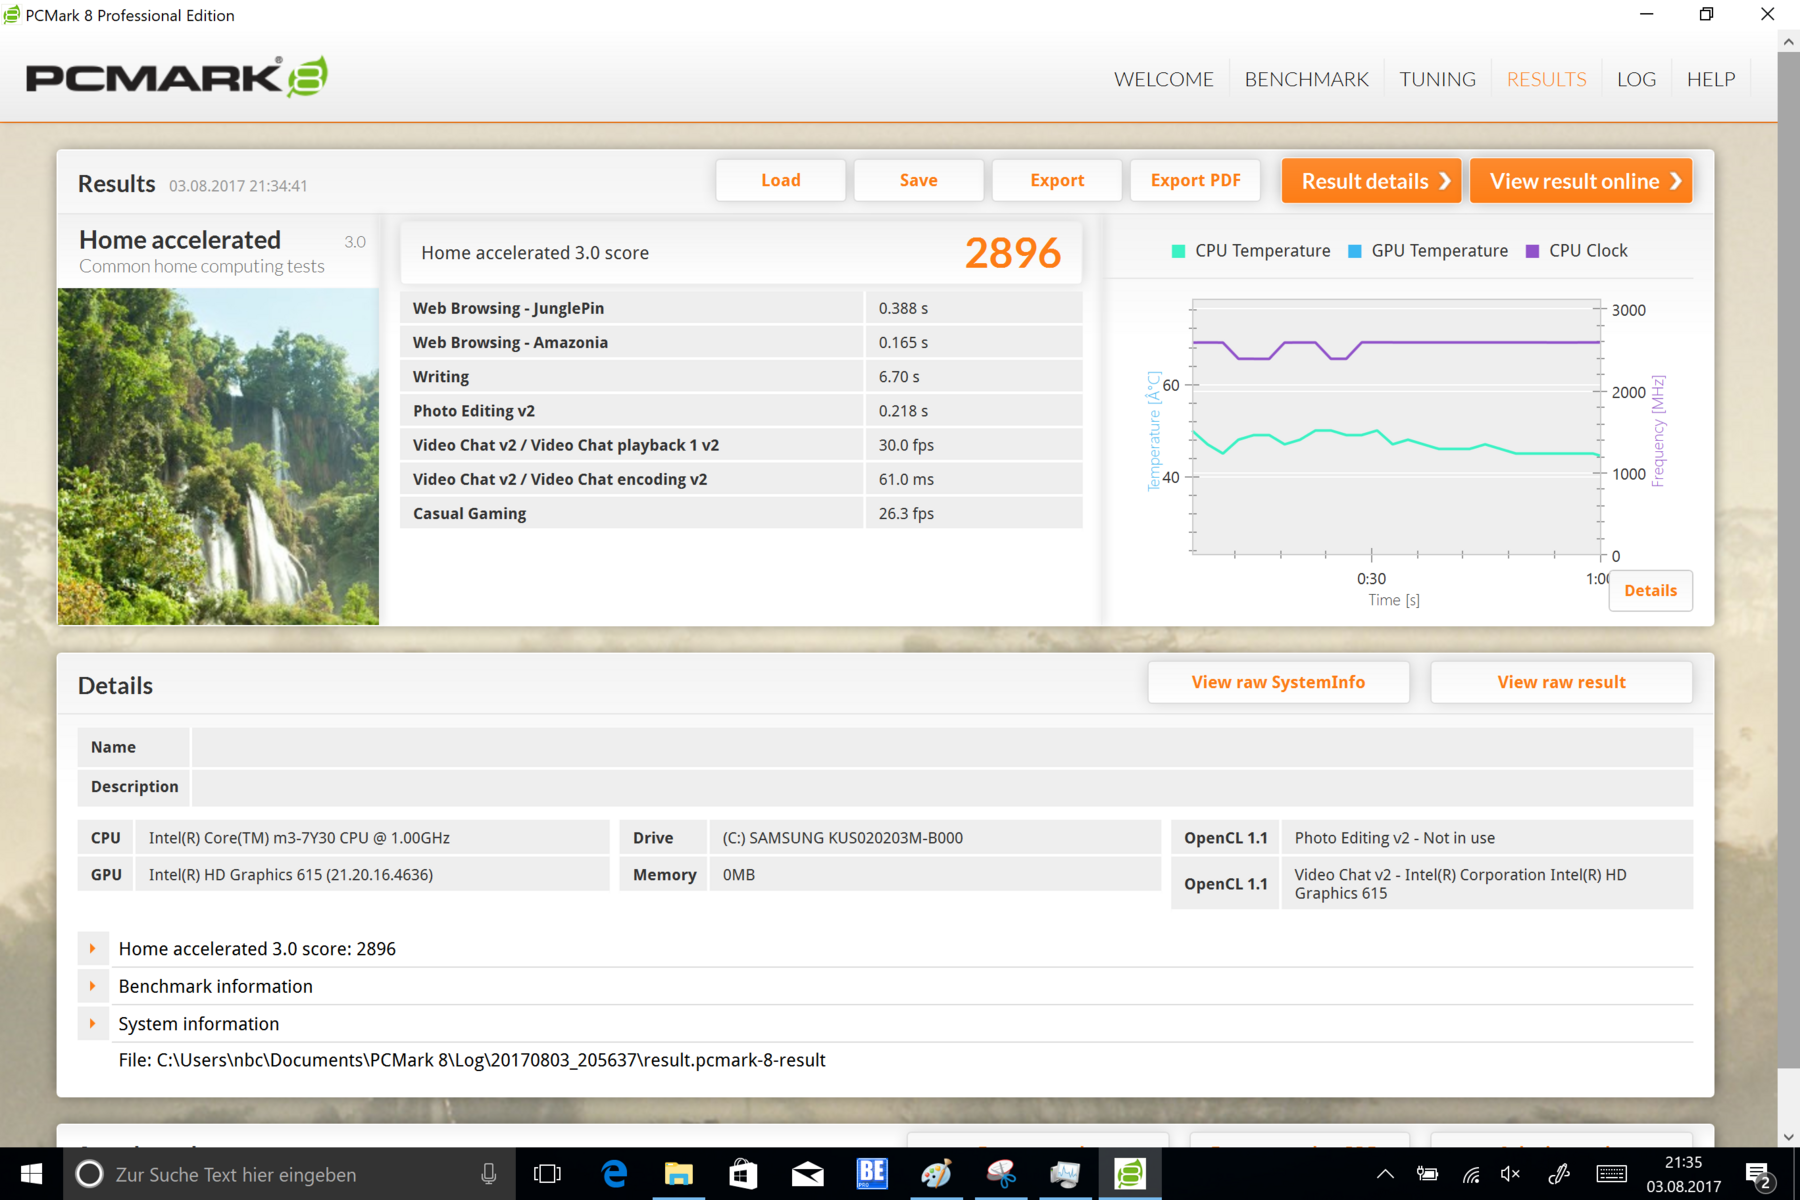
| PCMark 8 Home Score Accelerated v2 | 2896 punti | |
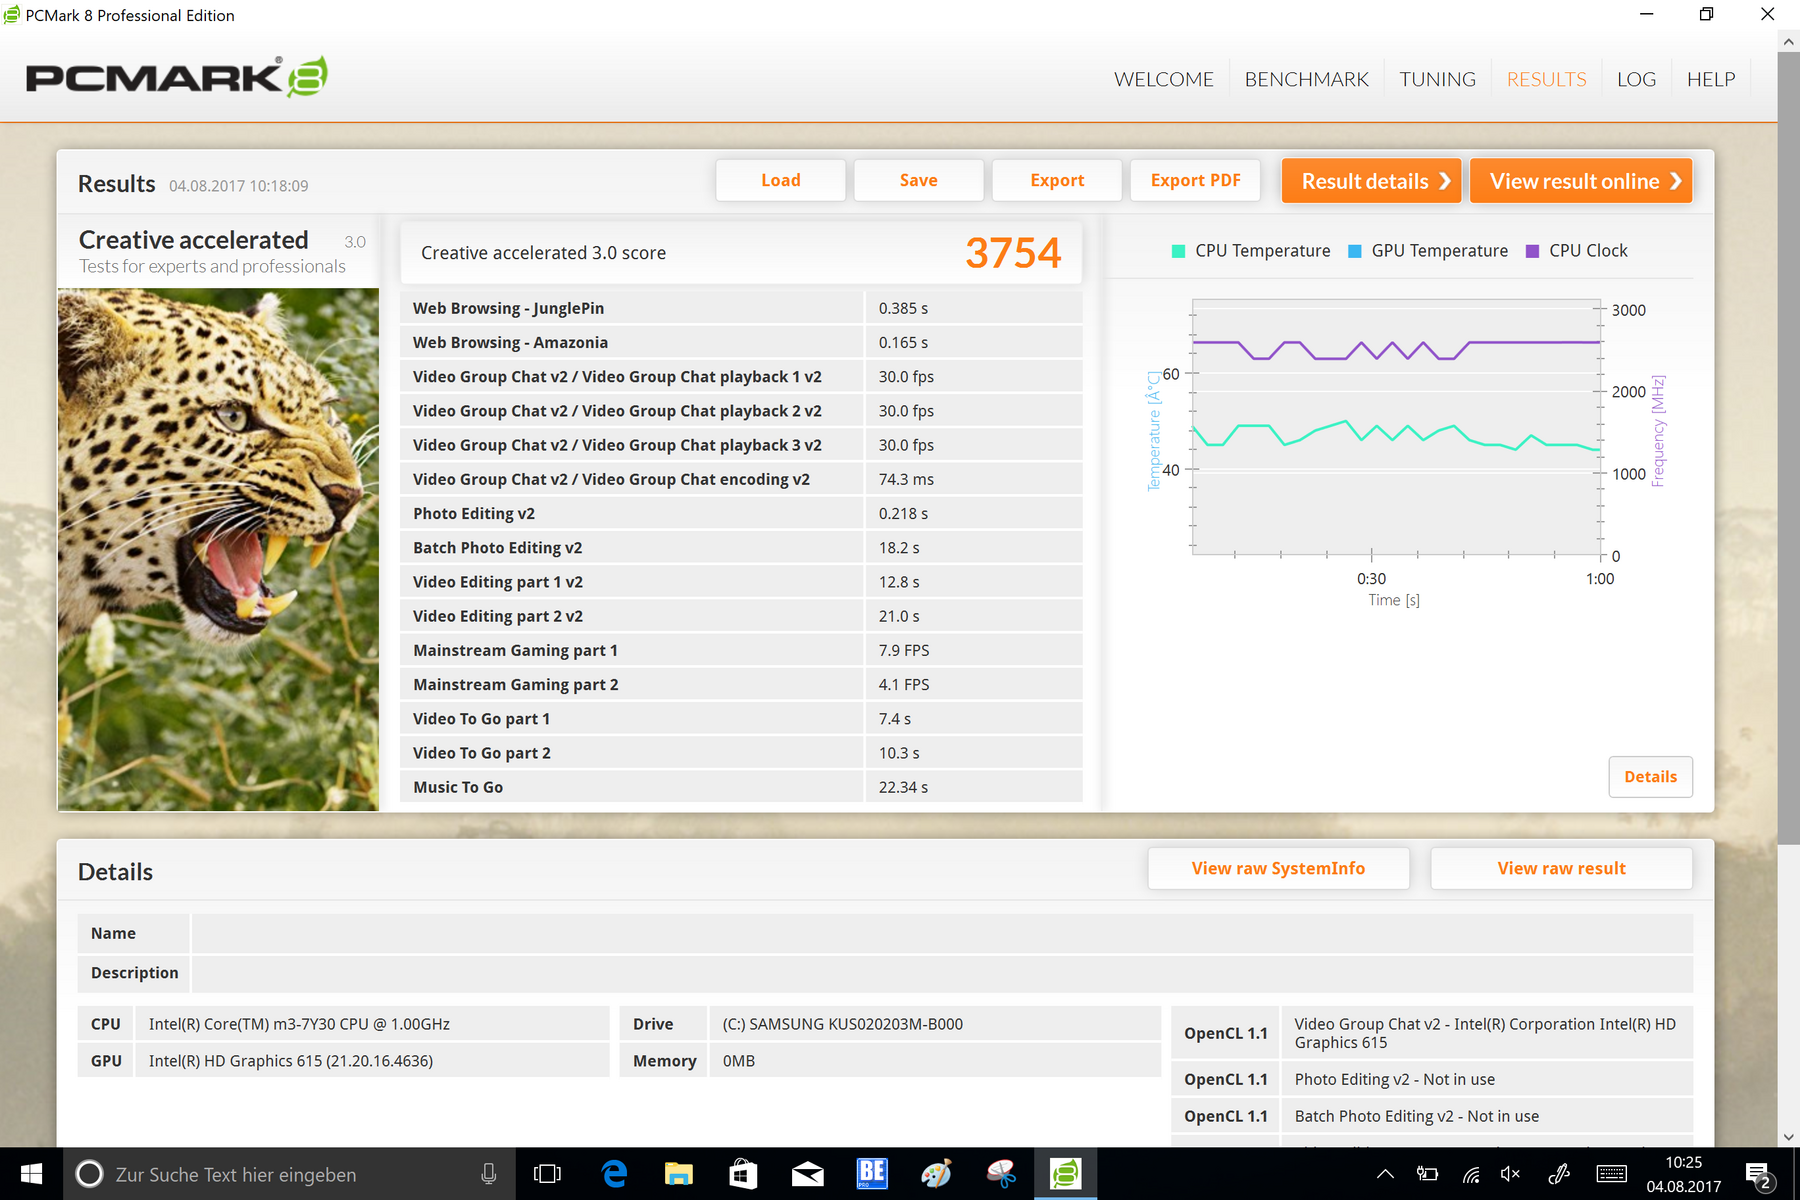
| PCMark 8 Creative Score Accelerated v2 | 3754 punti | |
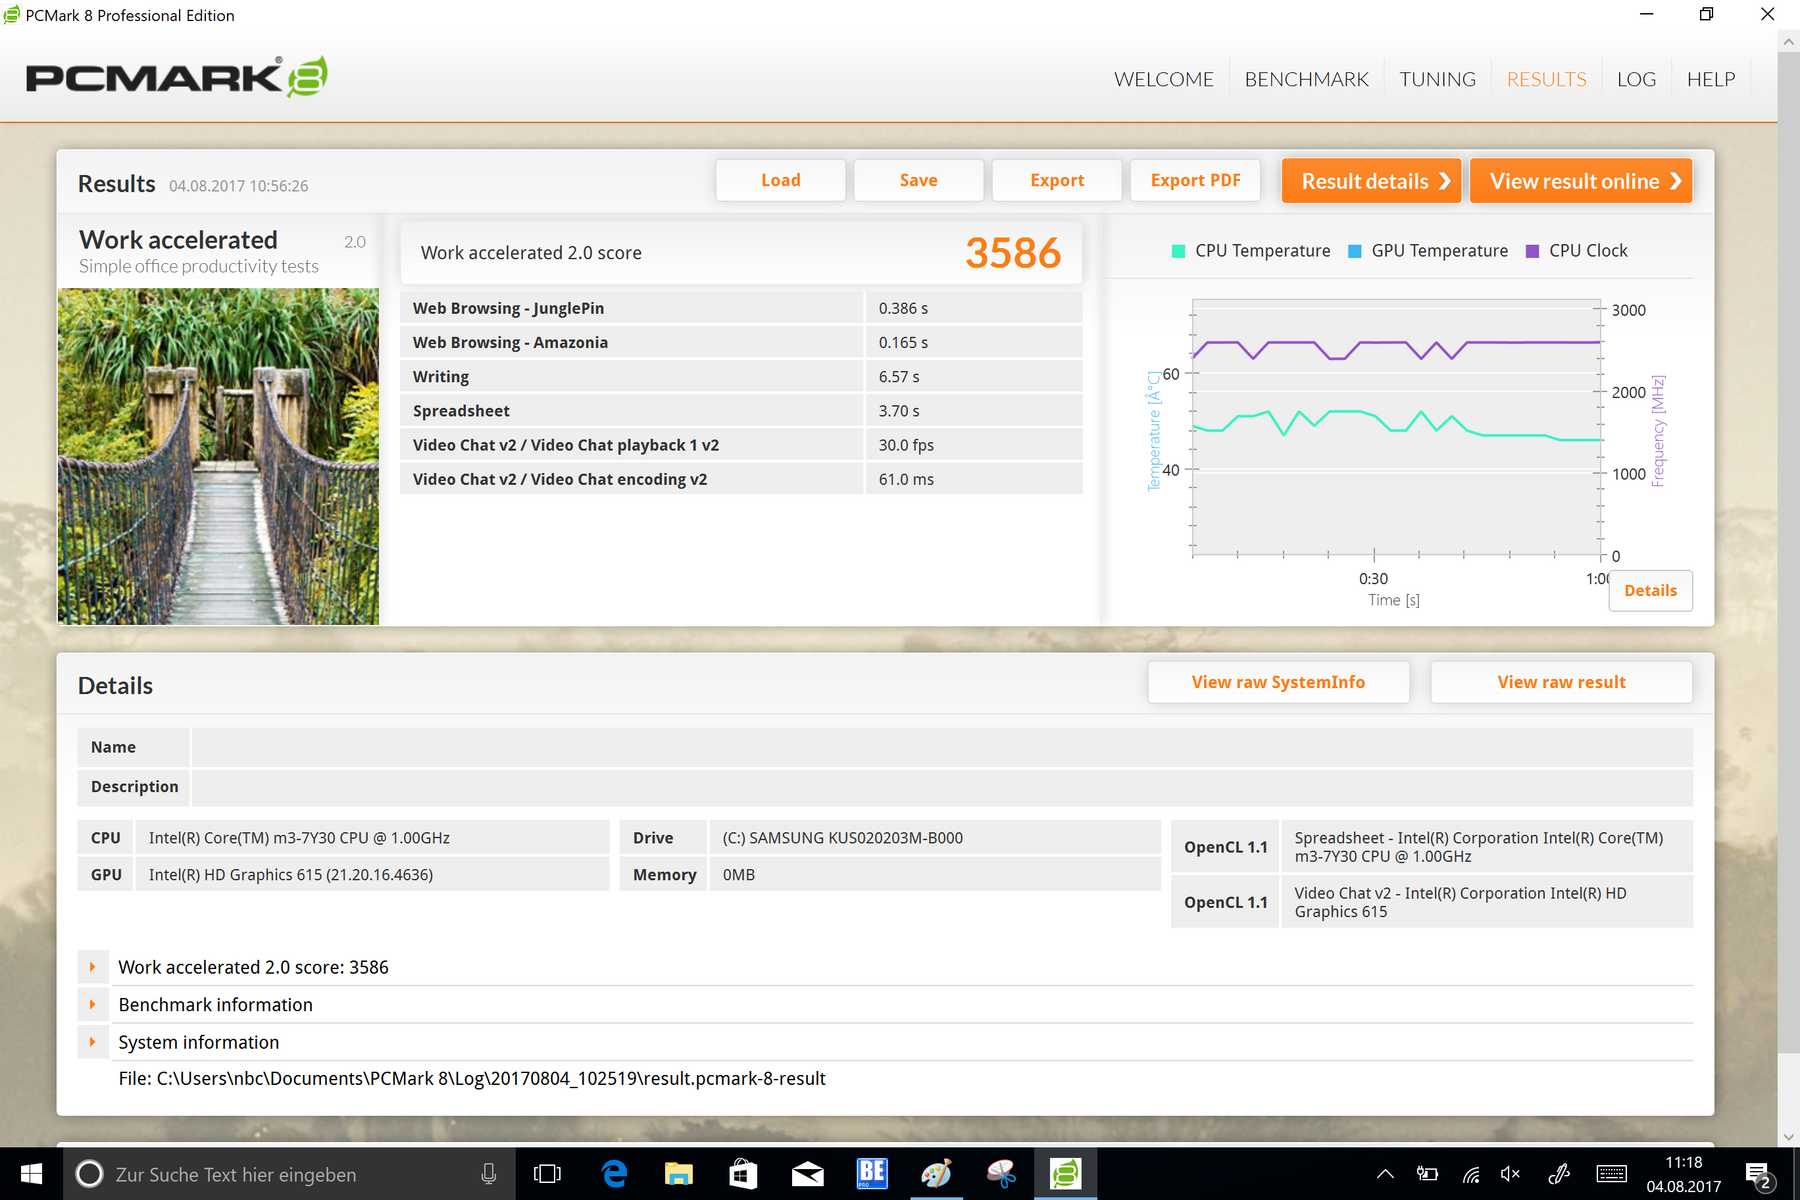
| PCMark 8 Work Score Accelerated v2 | 3586 punti | |
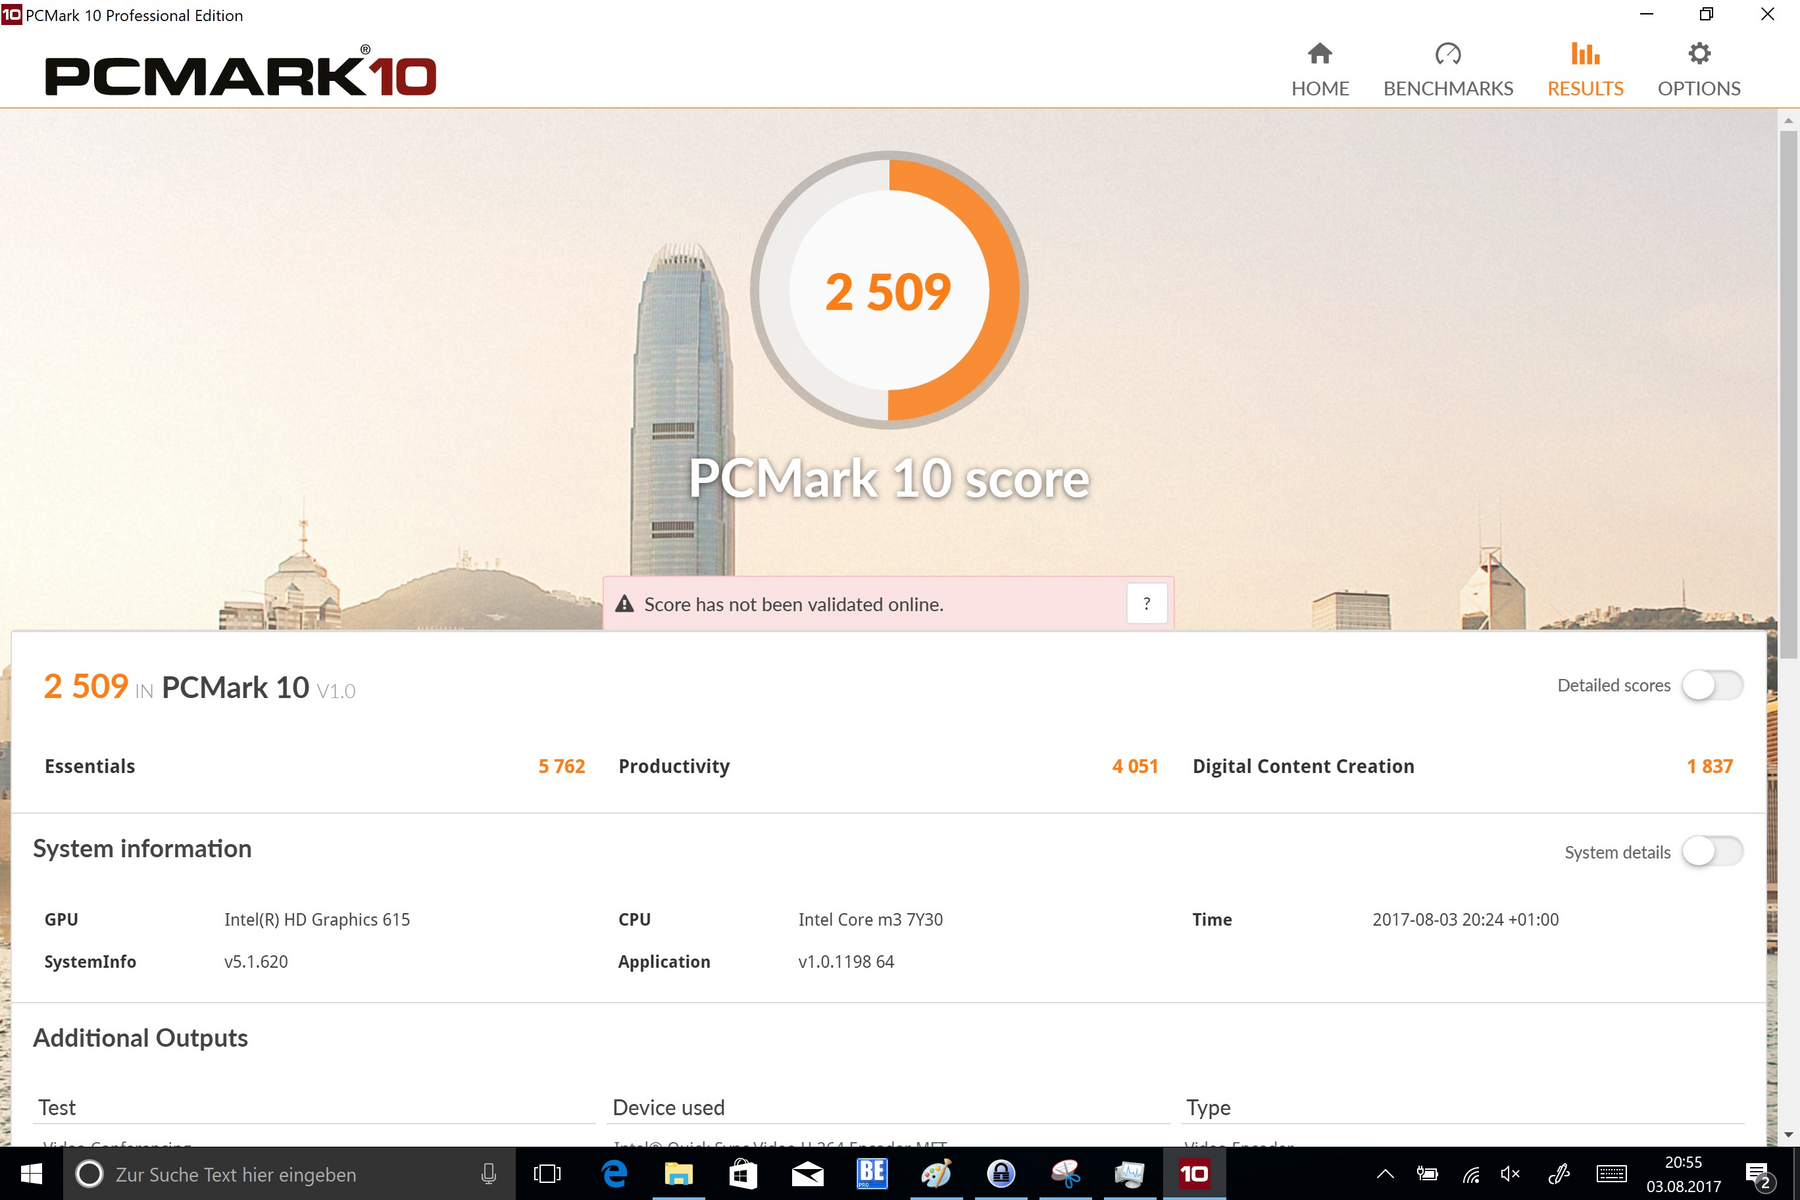
| PCMark 10 Score | 2509 punti | |
Aiuto | ||
| Microsoft Surface Pro (2017) m3 HD Graphics 615, m3-7Y30, Samsung PM971 KUS020203M | Microsoft Surface Pro (2017) i7 Iris Plus Graphics 640, i7-7660U, Samsung PM971 KUS040202M | Microsoft Surface Pro (2017) i5 HD Graphics 620, i5-7300U, Samsung PM971 KUS030202M | Lenovo Ideapad Miix 720-12IKB HD Graphics 620, i7-7500U, Samsung SSD PM961 1TB M.2 PCIe 3.0 x4 NVMe (MZVLW1T0) | HP Elite x2 1012 G1 HD Graphics 515, 6Y54, Liteon L8H-256V2G | Lenovo ThinkPad X1 Tablet Gen 2 HD Graphics 615, i5-7Y54, Samsung PM961 MZVLW256HEHP | Samsung Galaxy Tab Pro S W700N HD Graphics 515, 6Y30, Lite-On CV1-8B128 | Acer Aspire Switch Alpha 12 SA5-271-56HM HD Graphics 520, 6200U, Kingston RBU-SNS8152S3256GG2 | |
|---|---|---|---|---|---|---|---|---|
| CrystalDiskMark 3.0 | 78% | 38% | 193% | -2% | 94% | -33% | -14% | |
| Read Seq (MB/s) | 691 | 1308 89% | 723 5% | 2408 248% | 501 -27% | 1739 152% | 419.8 -39% | 518 -25% |
| Write Seq (MB/s) | 670 | 961 43% | 853 27% | 1702 154% | 297.2 -56% | 1259 88% | 162.9 -76% | 199.9 -70% |
| Read 512 (MB/s) | 261.1 | 227.5 -13% | 225 -14% | 1301 398% | 351.7 35% | 698 167% | 298.7 14% | 374.9 44% |
| Write 512 (MB/s) | 241 | 792 229% | 445 85% | 1288 434% | 295.7 23% | 869 261% | 160.9 -33% | 201 -17% |
| Read 4k (MB/s) | 40.11 | 53.6 34% | 46 15% | 53.6 34% | 28.31 -29% | 52.3 30% | 27.49 -31% | 29.3 -27% |
| Write 4k (MB/s) | 98.8 | 136.3 38% | 125 27% | 162.2 64% | 90.3 -9% | 120 21% | 48.44 -51% | 76.8 -22% |
| Read 4k QD32 (MB/s) | 301.8 | 485.6 61% | 423 40% | 504 67% | 285 -6% | 247.9 -18% | 236.2 -22% | 272 -10% |
| Write 4k QD32 (MB/s) | 172 | 421.5 145% | 373 117% | 420.8 145% | 268.4 56% | 259 51% | 135 -22% | 197.1 15% |

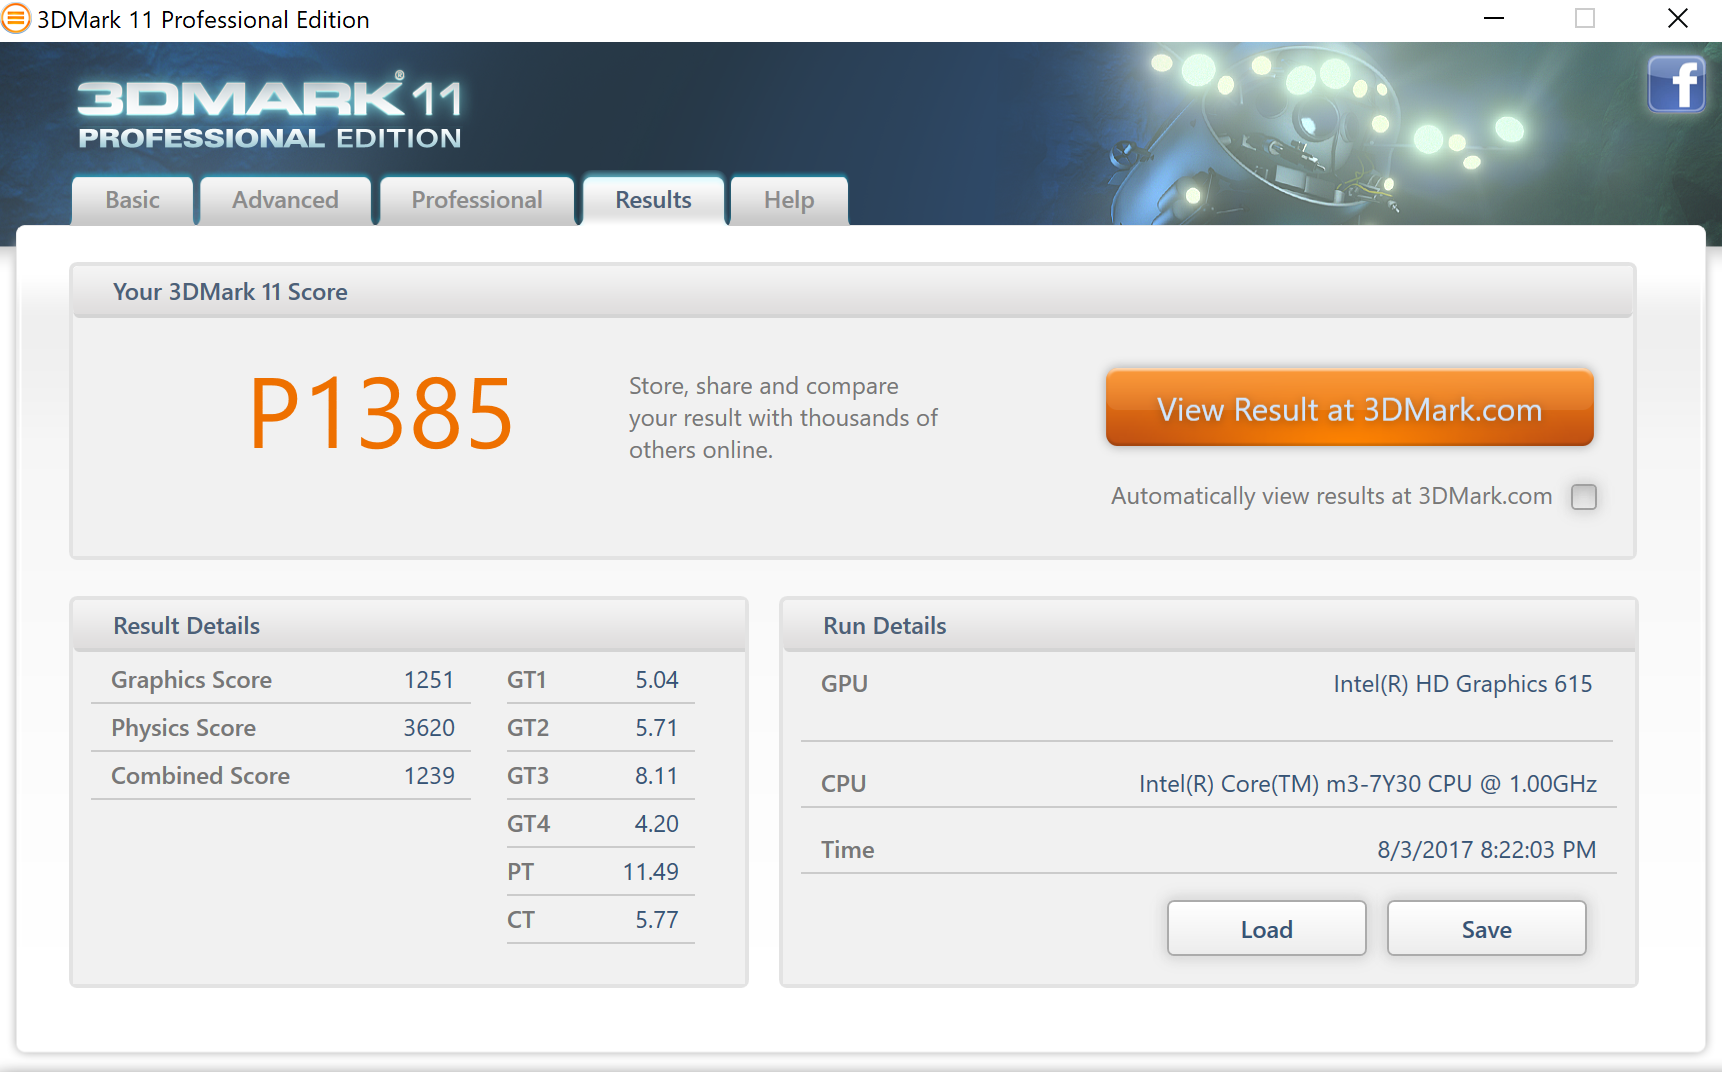
| 3DMark 11 Performance | 1385 punti | |
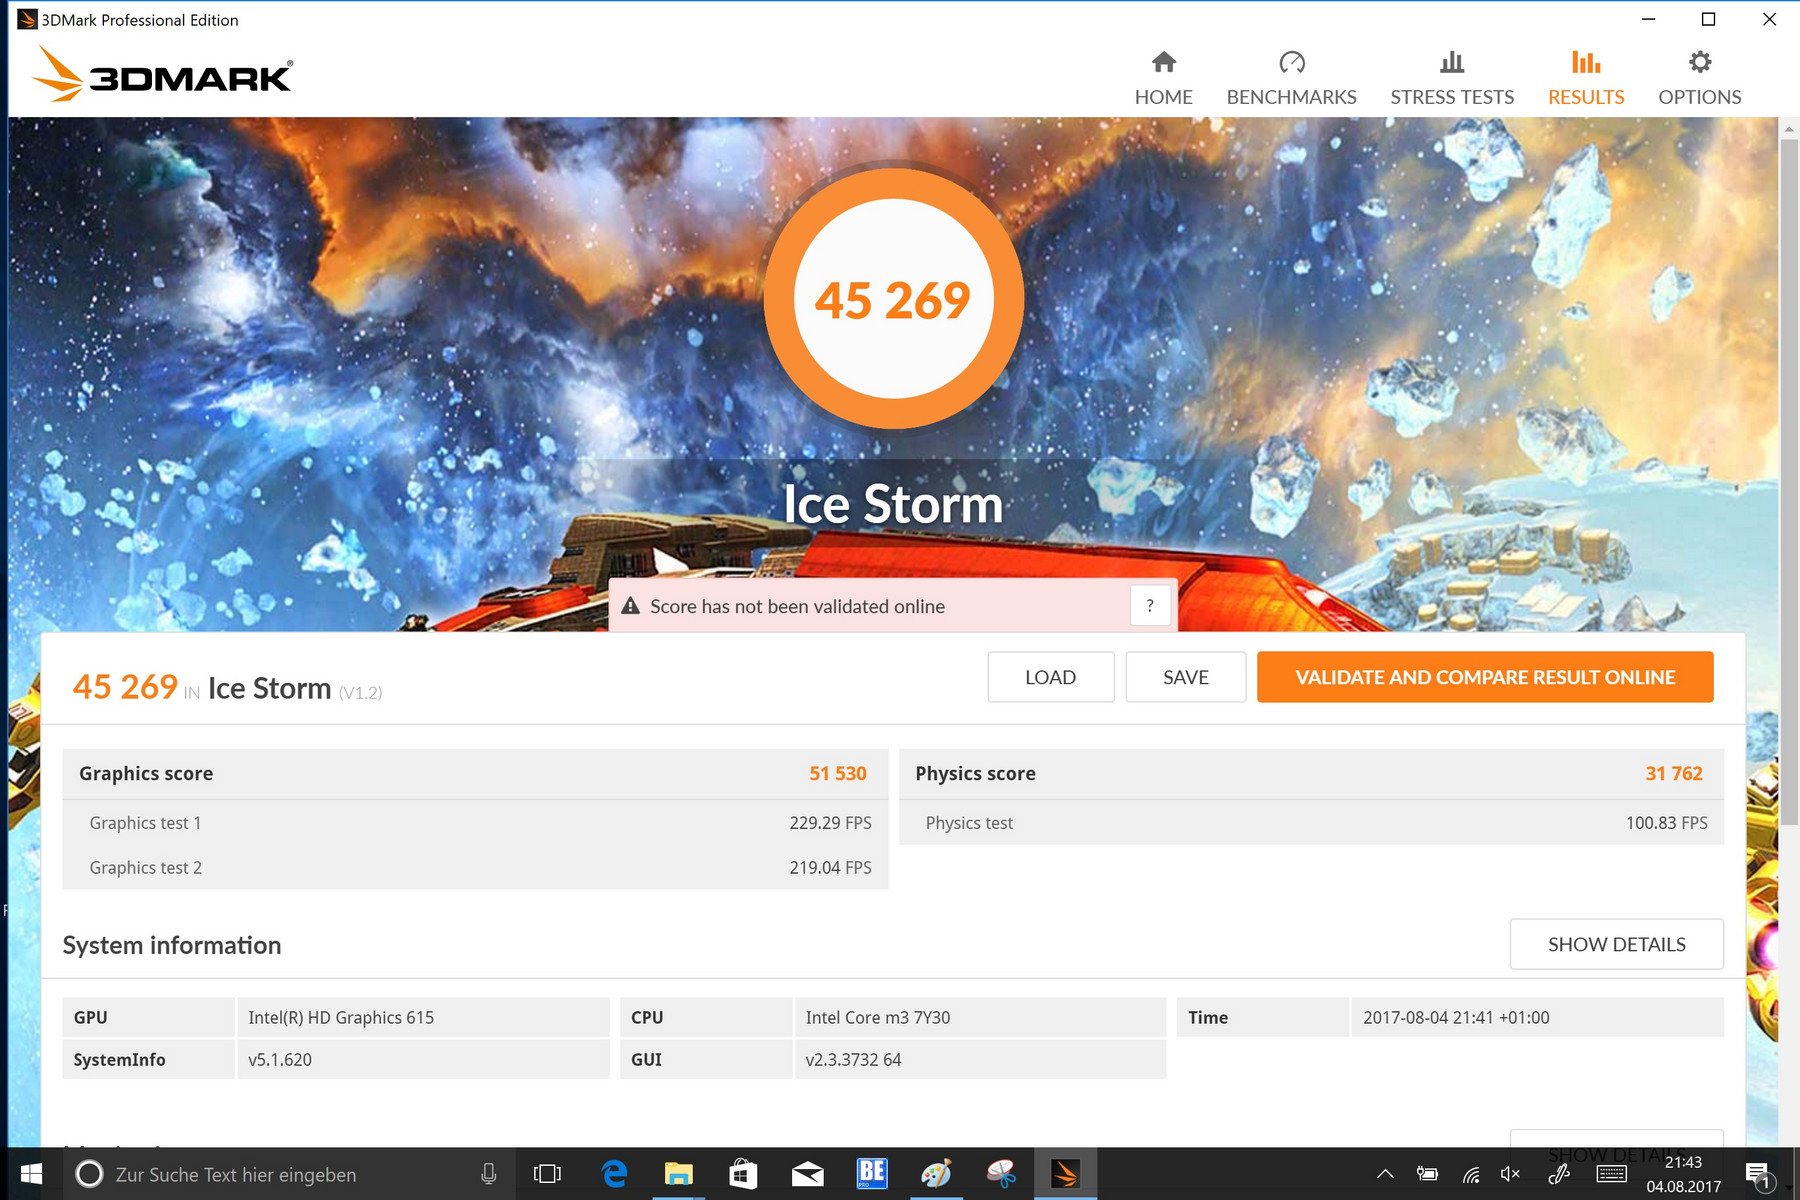
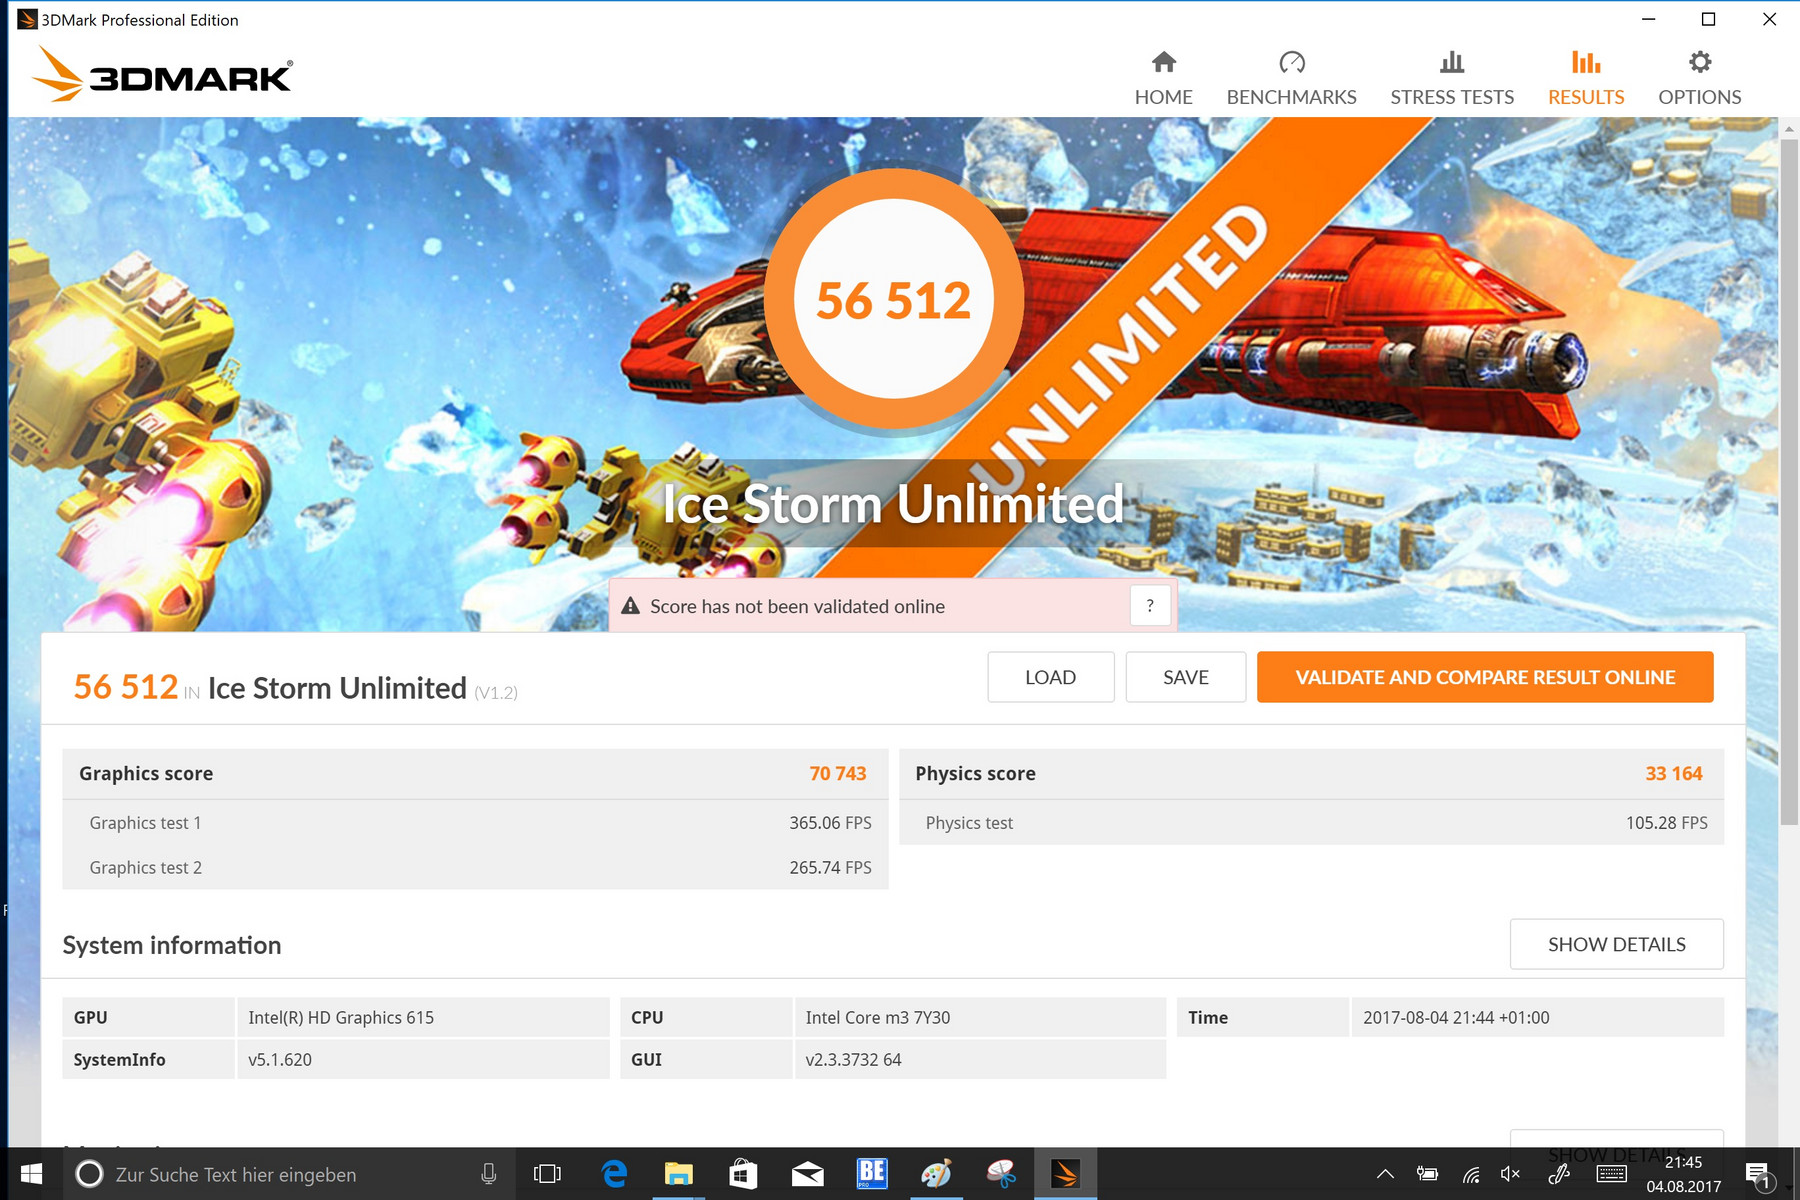
| 3DMark Ice Storm Standard Score | 45269 punti | |
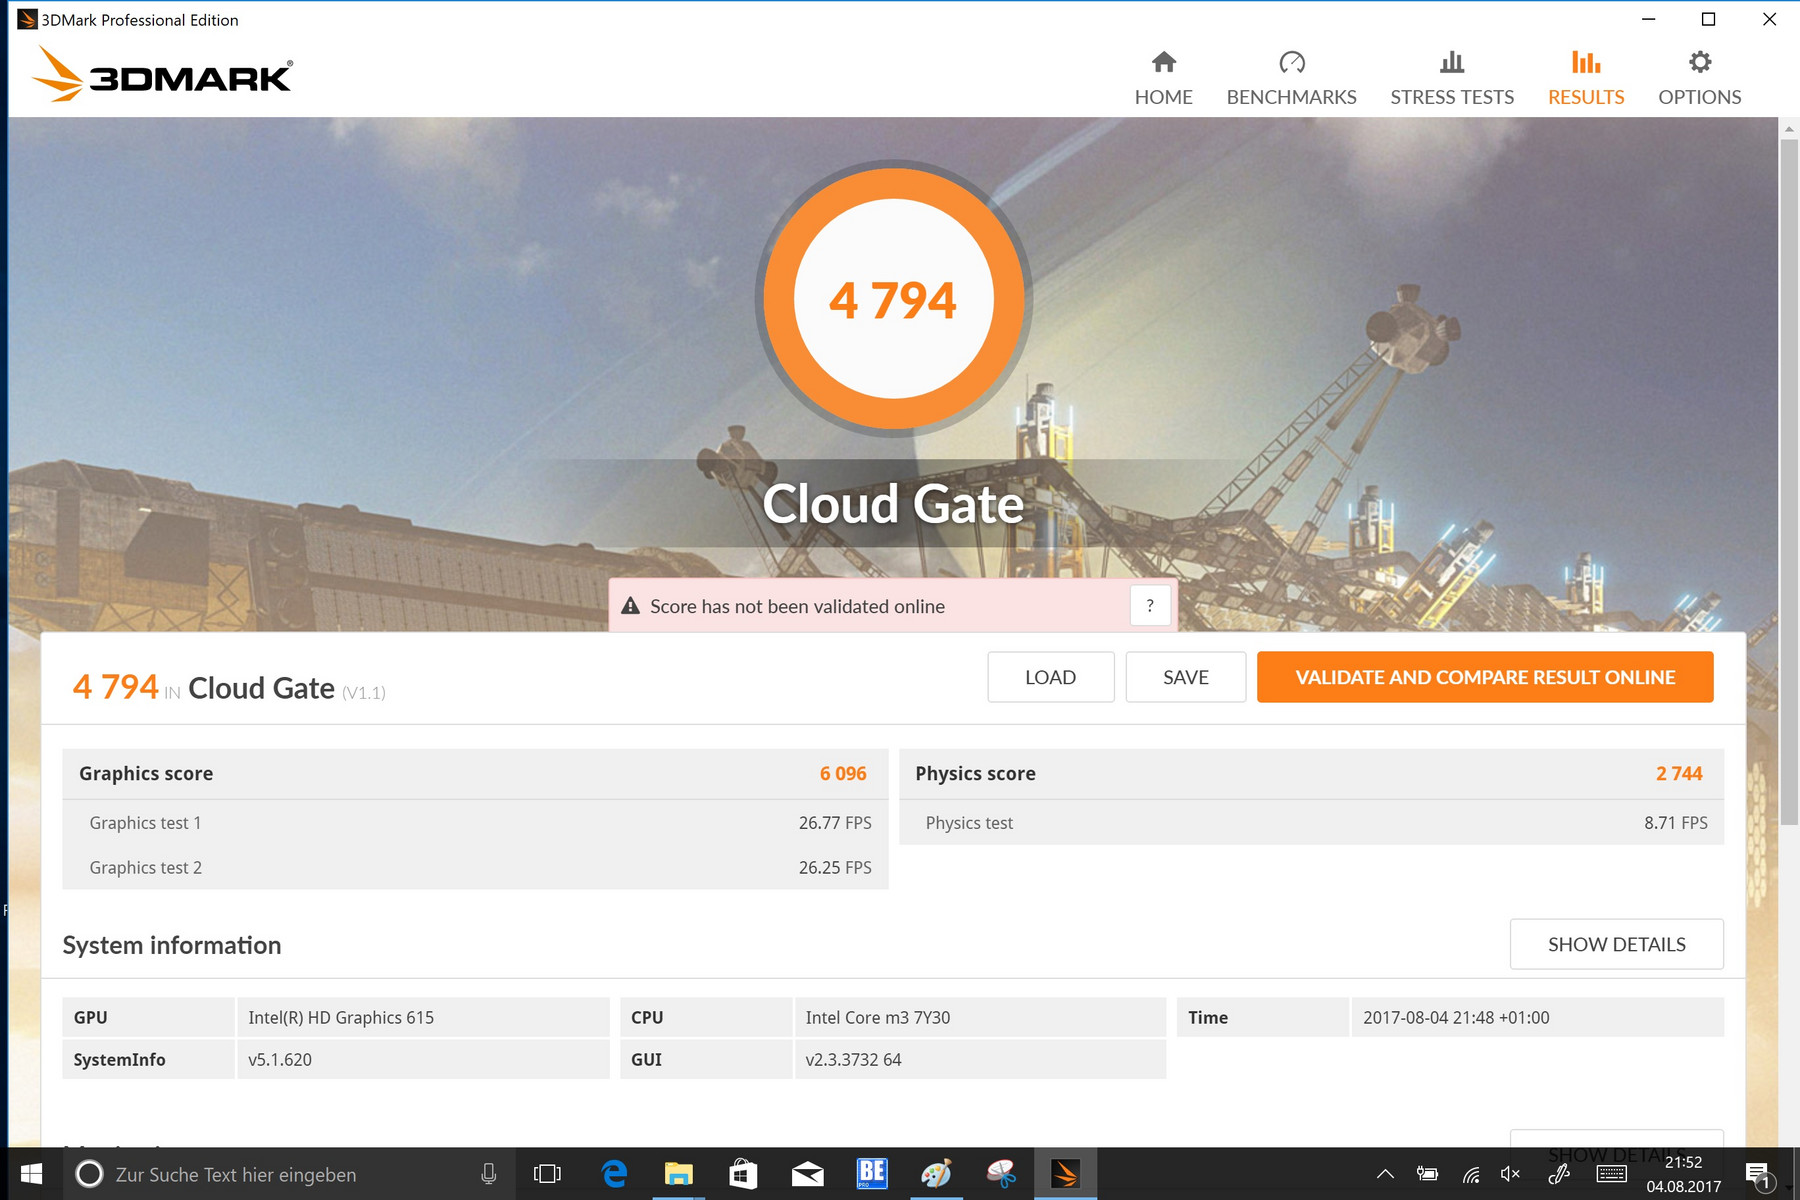
| 3DMark Cloud Gate Standard Score | 4794 punti | |
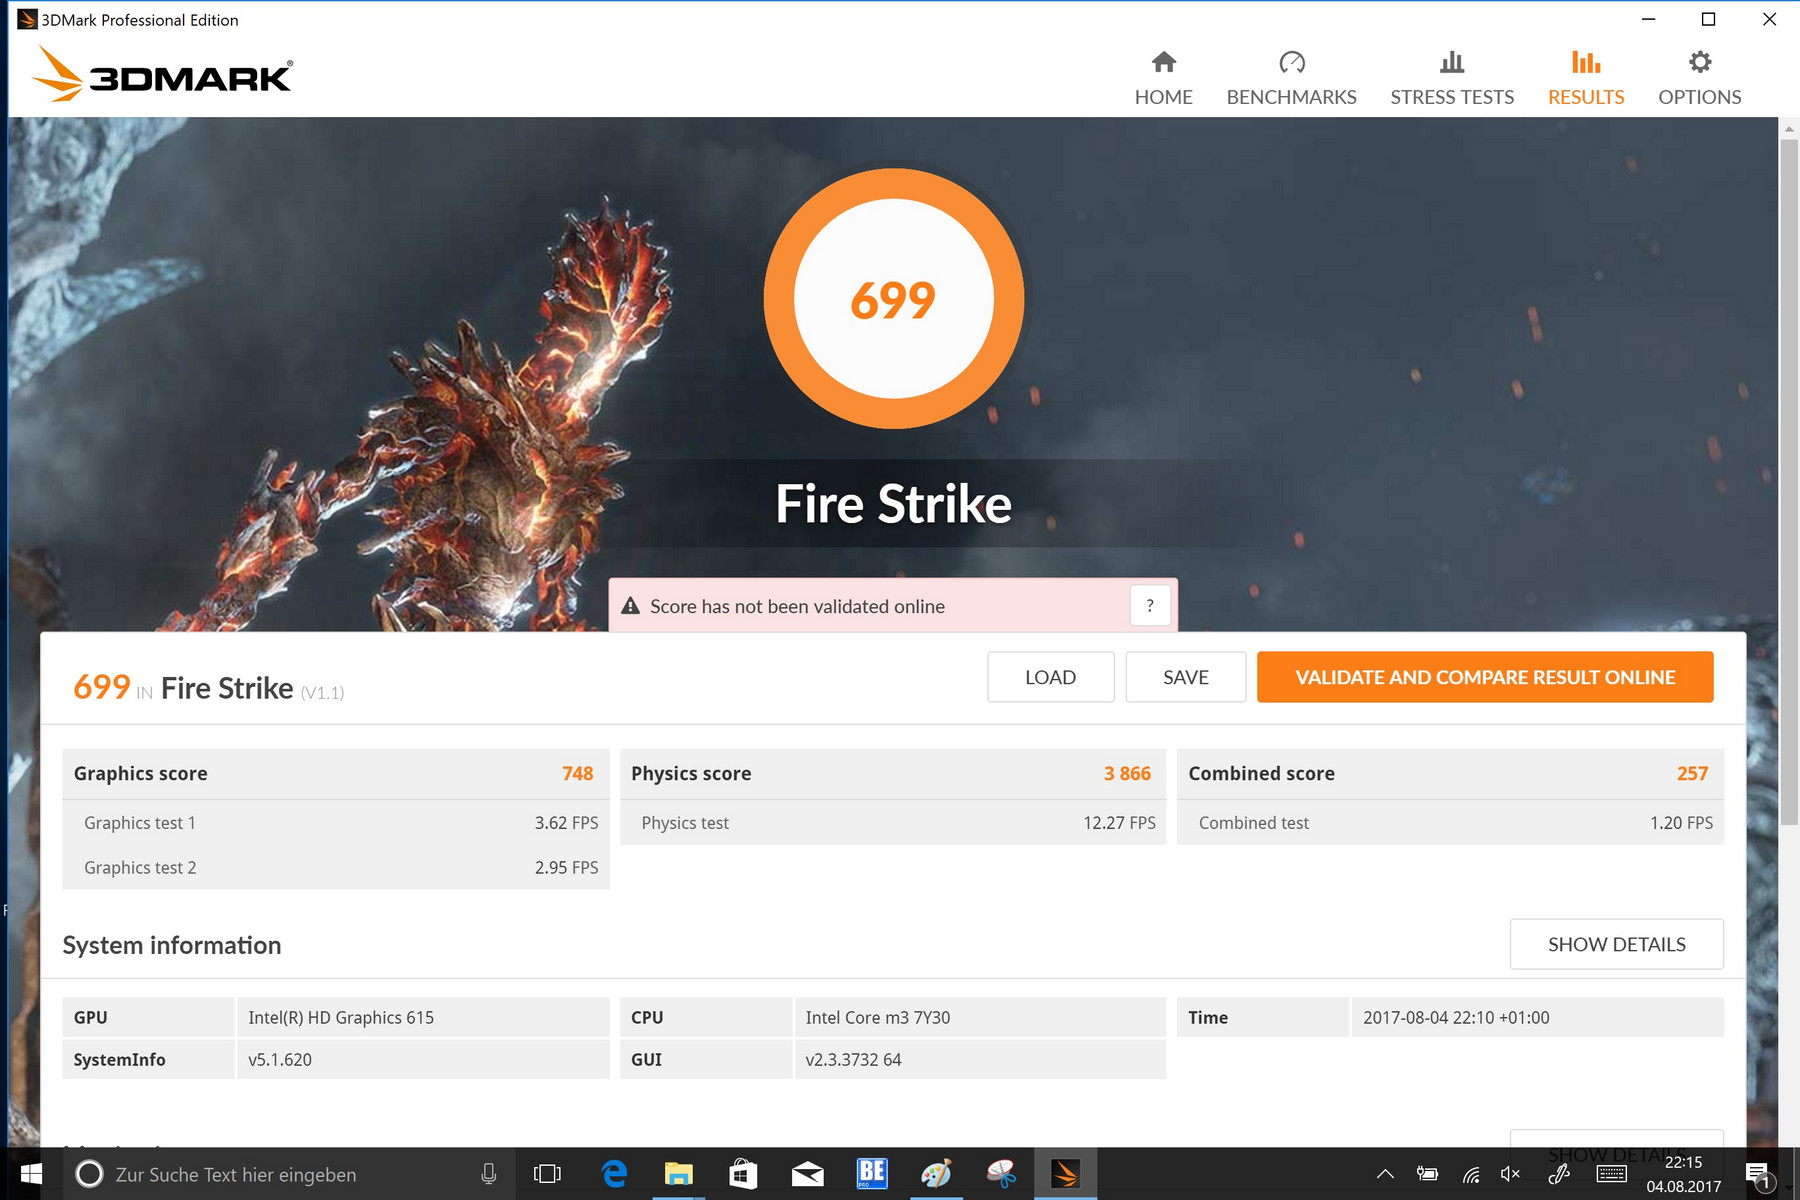
| 3DMark Fire Strike Score | 699 punti | |
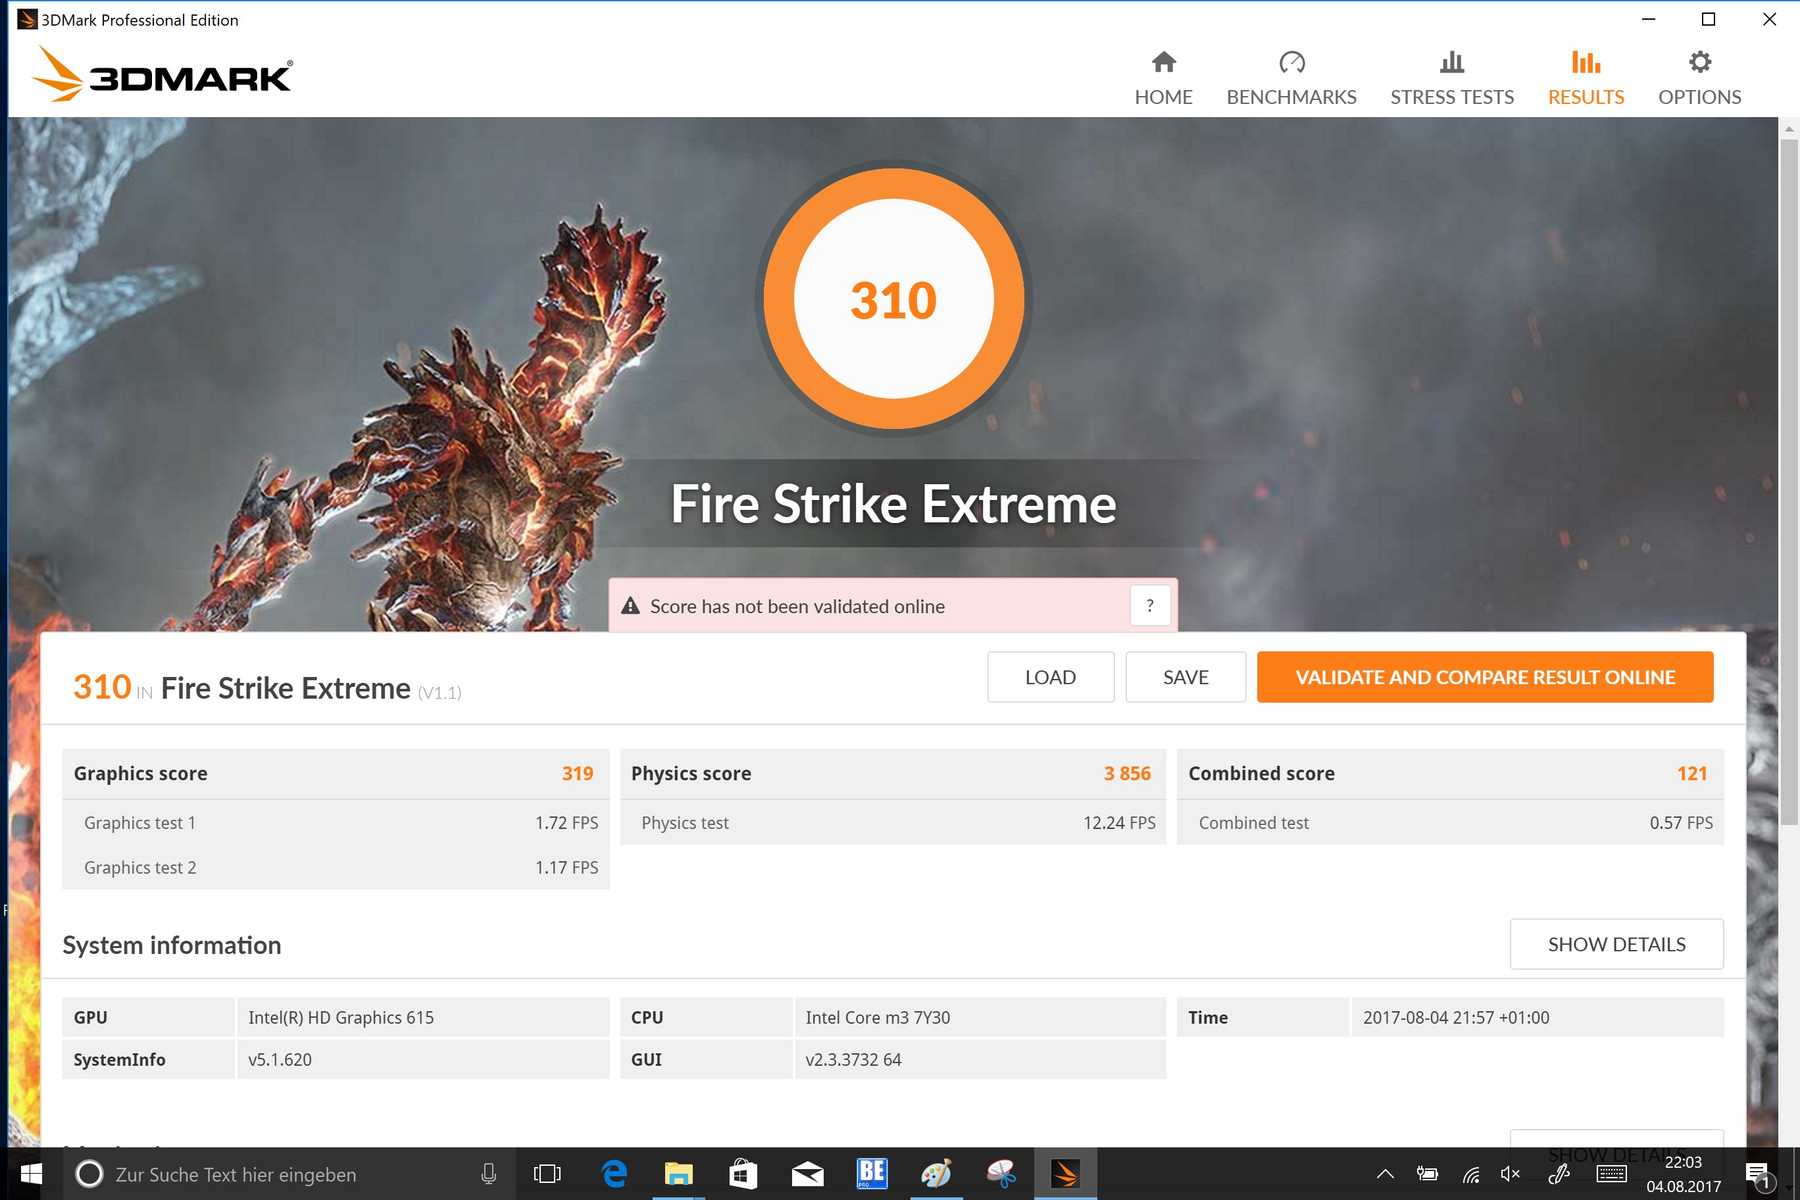
| 3DMark Fire Strike Extreme Score | 310 punti | |
Aiuto | ||
| basso | medio | alto | ultra | |
|---|---|---|---|---|
| BioShock Infinite (2013) | 42.6 | 25.2 | 20.8 | 4.6 |
| Battlefield 4 (2013) | 31.2 | 22.7 | 18.9 | |
| Rise of the Tomb Raider (2016) | 14.2 | 9.4 |
| Microsoft Surface Pro (2017) m3 HD Graphics 615, m3-7Y30, Samsung PM971 KUS020203M | Microsoft Surface Pro (2017) i5 HD Graphics 620, i5-7300U, Samsung PM971 KUS030202M | Microsoft Surface Pro (2017) i7 Iris Plus Graphics 640, i7-7660U, Samsung PM971 KUS040202M | Lenovo Ideapad Miix 720-12IKB HD Graphics 620, i7-7500U, Samsung SSD PM961 1TB M.2 PCIe 3.0 x4 NVMe (MZVLW1T0) | HP Elite x2 1012 G1 HD Graphics 515, 6Y54, Liteon L8H-256V2G | Lenovo ThinkPad X1 Tablet Gen 2 HD Graphics 615, i5-7Y54, Samsung PM961 MZVLW256HEHP | Samsung Galaxy Tab Pro S W700N HD Graphics 515, 6Y30, Lite-On CV1-8B128 | Acer Aspire Switch Alpha 12 SA5-271-56HM HD Graphics 520, 6200U, Kingston RBU-SNS8152S3256GG2 | |
|---|---|---|---|---|---|---|---|---|
| Heat | 1% | 6% | -3% | 8% | -3% | -8% | -2% | |
| Maximum Upper Side * (°C) | 40.5 | 39.2 3% | 42 -4% | 42 -4% | 39 4% | 47.2 -17% | 42.5 -5% | 46.7 -15% |
| Maximum Bottom * (°C) | 40.6 | 40.3 1% | 42 -3% | 43.6 -7% | 41.2 -1% | 49.8 -23% | 44.6 -10% | 51 -26% |
| Idle Upper Side * (°C) | 37.8 | 37 2% | 31 18% | 32.8 13% | 29.5 22% | 30.8 19% | 36.6 3% | 29.5 22% |
| Idle Bottom * (°C) | 32 | 32.3 -1% | 28 12% | 36.4 -14% | 29.8 7% | 29.2 9% | 38.6 -21% | 28.6 11% |
* ... Meglio usare valori piccoli
(±) La temperatura massima sul lato superiore è di 40.5 °C / 105 F, rispetto alla media di 35.4 °C / 96 F, che varia da 19.6 a 60 °C per questa classe Convertible.
(±) Il lato inferiore si riscalda fino ad un massimo di 40.6 °C / 105 F, rispetto alla media di 36.9 °C / 98 F
(±) In idle, la temperatura media del lato superiore è di 33 °C / 91 F, rispetto alla media deld ispositivo di 30.3 °C / 87 F.
(-) I poggiapolsi e il touchpad possono diventare molto caldi al tatto con un massimo di 40.5 °C / 104.9 F.
(-) La temperatura media della zona del palmo della mano di dispositivi simili e'stata di 28 °C / 82.4 F (-12.5 °C / -22.5 F).
Microsoft Surface Pro (2017) m3 analisi audio
(-) | altoparlanti non molto potenti (68.8 dB)
Bassi 100 - 315 Hz
(±) | bassi ridotti - in media 12.9% inferiori alla media
(±) | la linearità dei bassi è media (10.5% delta rispetto alla precedente frequenza)
Medi 400 - 2000 Hz
(+) | medi bilanciati - solo only 3.7% rispetto alla media
(±) | linearità dei medi adeguata (9.6% delta rispetto alla precedente frequenza)
Alti 2 - 16 kHz
(+) | Alti bilanciati - appena 4.1% dalla media
(±) | la linearità degli alti è media (8.6% delta rispetto alla precedente frequenza)
Nel complesso 100 - 16.000 Hz
(±) | la linearità complessiva del suono è media (19.1% di differenza rispetto alla media
Rispetto alla stessa classe
» 46% di tutti i dispositivi testati in questa classe è stato migliore, 7% simile, 48% peggiore
» Il migliore ha avuto un delta di 6%, medio di 20%, peggiore di 57%
Rispetto a tutti i dispositivi testati
» 46% di tutti i dispositivi testati in questa classe è stato migliore, 7% similare, 47% peggiore
» Il migliore ha avuto un delta di 4%, medio di 23%, peggiore di 134%
Microsoft Surface Pro (2017) i5 analisi audio
(-) | altoparlanti non molto potenti (68 dB)
Bassi 100 - 315 Hz
(±) | bassi ridotti - in media 9.7% inferiori alla media
(±) | la linearità dei bassi è media (7% delta rispetto alla precedente frequenza)
Medi 400 - 2000 Hz
(+) | medi bilanciati - solo only 4.6% rispetto alla media
(+) | medi lineari (6.3% delta rispetto alla precedente frequenza)
Alti 2 - 16 kHz
(+) | Alti bilanciati - appena 2.1% dalla media
(+) | alti lineari (5.2% delta rispetto alla precedente frequenza)
Nel complesso 100 - 16.000 Hz
(±) | la linearità complessiva del suono è media (18.2% di differenza rispetto alla media
Rispetto alla stessa classe
» 40% di tutti i dispositivi testati in questa classe è stato migliore, 7% simile, 53% peggiore
» Il migliore ha avuto un delta di 6%, medio di 20%, peggiore di 57%
Rispetto a tutti i dispositivi testati
» 39% di tutti i dispositivi testati in questa classe è stato migliore, 8% similare, 53% peggiore
» Il migliore ha avuto un delta di 4%, medio di 23%, peggiore di 134%
| Off / Standby | |
| Idle | |
| Sotto carico |
|
Leggenda:
min: | |
| Microsoft Surface Pro (2017) m3 m3-7Y30, HD Graphics 615, Samsung PM971 KUS020203M, IPS, 2736x1826, 12.3" | Microsoft Surface Pro (2017) i5 i5-7300U, HD Graphics 620, Samsung PM971 KUS030202M, IPS, 2736x1824, 12.3" | Microsoft Surface Pro (2017) i7 i7-7660U, Iris Plus Graphics 640, Samsung PM971 KUS040202M, IPS, 2736x1824, 12.3" | Lenovo Ideapad Miix 720-12IKB i7-7500U, HD Graphics 620, Samsung SSD PM961 1TB M.2 PCIe 3.0 x4 NVMe (MZVLW1T0), IPS, 2880x1920, 12" | HP Elite x2 1012 G1 6Y54, HD Graphics 515, Liteon L8H-256V2G, IPS, 1920x1280, 12.1" | Lenovo ThinkPad X1 Tablet Gen 2 i5-7Y54, HD Graphics 615, Samsung PM961 MZVLW256HEHP, IPS, 2160x1440, 12" | Samsung Galaxy Tab Pro S W700N 6Y30, HD Graphics 515, Lite-On CV1-8B128, sAMOLED, 2160x1440, 12.1" | Acer Aspire Switch Alpha 12 SA5-271-56HM 6200U, HD Graphics 520, Kingston RBU-SNS8152S3256GG2, IPS, 2160x1440, 12" | |
|---|---|---|---|---|---|---|---|---|
| Power Consumption | -2% | -40% | -7% | -4% | 4% | 17% | -38% | |
| Idle Minimum * (Watt) | 3.1 | 3.6 -16% | 4.2 -35% | 3.5 -13% | 3.7 -19% | 5 -61% | 3.4 -10% | 7.3 -135% |
| Idle Average * (Watt) | 8.8 | 8.1 8% | 10.1 -15% | 7.2 18% | 6.8 23% | 6.3 28% | 8 9% | 10 -14% |
| Idle Maximum * (Watt) | 9.8 | 8.7 11% | 14 -43% | 7.9 19% | 7.6 22% | 7.8 20% | 9 8% | 10.15 -4% |
| Load Average * (Watt) | 22.7 | 25.5 -12% | 37.4 -65% | 29.6 -30% | 22.5 1% | 19.5 14% | 12 47% | 25.2 -11% |
| Load Maximum * (Watt) | 23.6 | 23.5 -0% | 34 -44% | 30.8 -31% | 34.5 -46% | 19.6 17% | 16.1 32% | 29.3 -24% |
| Witcher 3 ultra * (Watt) | 38.1 |
* ... Meglio usare valori piccoli

| Microsoft Surface Pro (2017) m3 m3-7Y30, HD Graphics 615, 45 Wh | Microsoft Surface Pro (2017) i5 i5-7300U, HD Graphics 620, 45 Wh | Microsoft Surface Pro (2017) i7 i7-7660U, Iris Plus Graphics 640, 45 Wh | Lenovo Ideapad Miix 720-12IKB i7-7500U, HD Graphics 620, 41 Wh | HP Elite x2 1012 G1 6Y54, HD Graphics 515, 37 Wh | Lenovo ThinkPad X1 Tablet Gen 2 i5-7Y54, HD Graphics 615, 37 Wh | Samsung Galaxy Tab Pro S W700N 6Y30, HD Graphics 515, 39.5 Wh | Acer Aspire Switch Alpha 12 SA5-271-56HM 6200U, HD Graphics 520, 37 Wh | |
|---|---|---|---|---|---|---|---|---|
| Autonomia della batteria | 2% | -26% | -38% | -31% | -32% | -9% | -39% | |
| Reader / Idle (h) | 15.6 | 17.6 13% | 11.9 -24% | 12.2 -22% | 11 -29% | 18.5 19% | 10.7 -31% | |
| H.264 (h) | 11.1 | 10.2 -8% | 7.2 -35% | 8.6 -23% | 7.8 -30% | |||
| WiFi v1.3 (h) | 11.4 | 12.4 9% | 8.2 -28% | 5.8 -49% | 7.4 -35% | 7.4 -35% | 8.8 -23% | 5.4 -53% |
| Load (h) | 3.3 | 2.8 -15% | 1.9 -42% | 1.9 -42% | 2.2 -33% | 2.2 -33% | 1.9 -42% | |
| Witcher 3 ultra (h) | 1.9 |
Pro
Contro

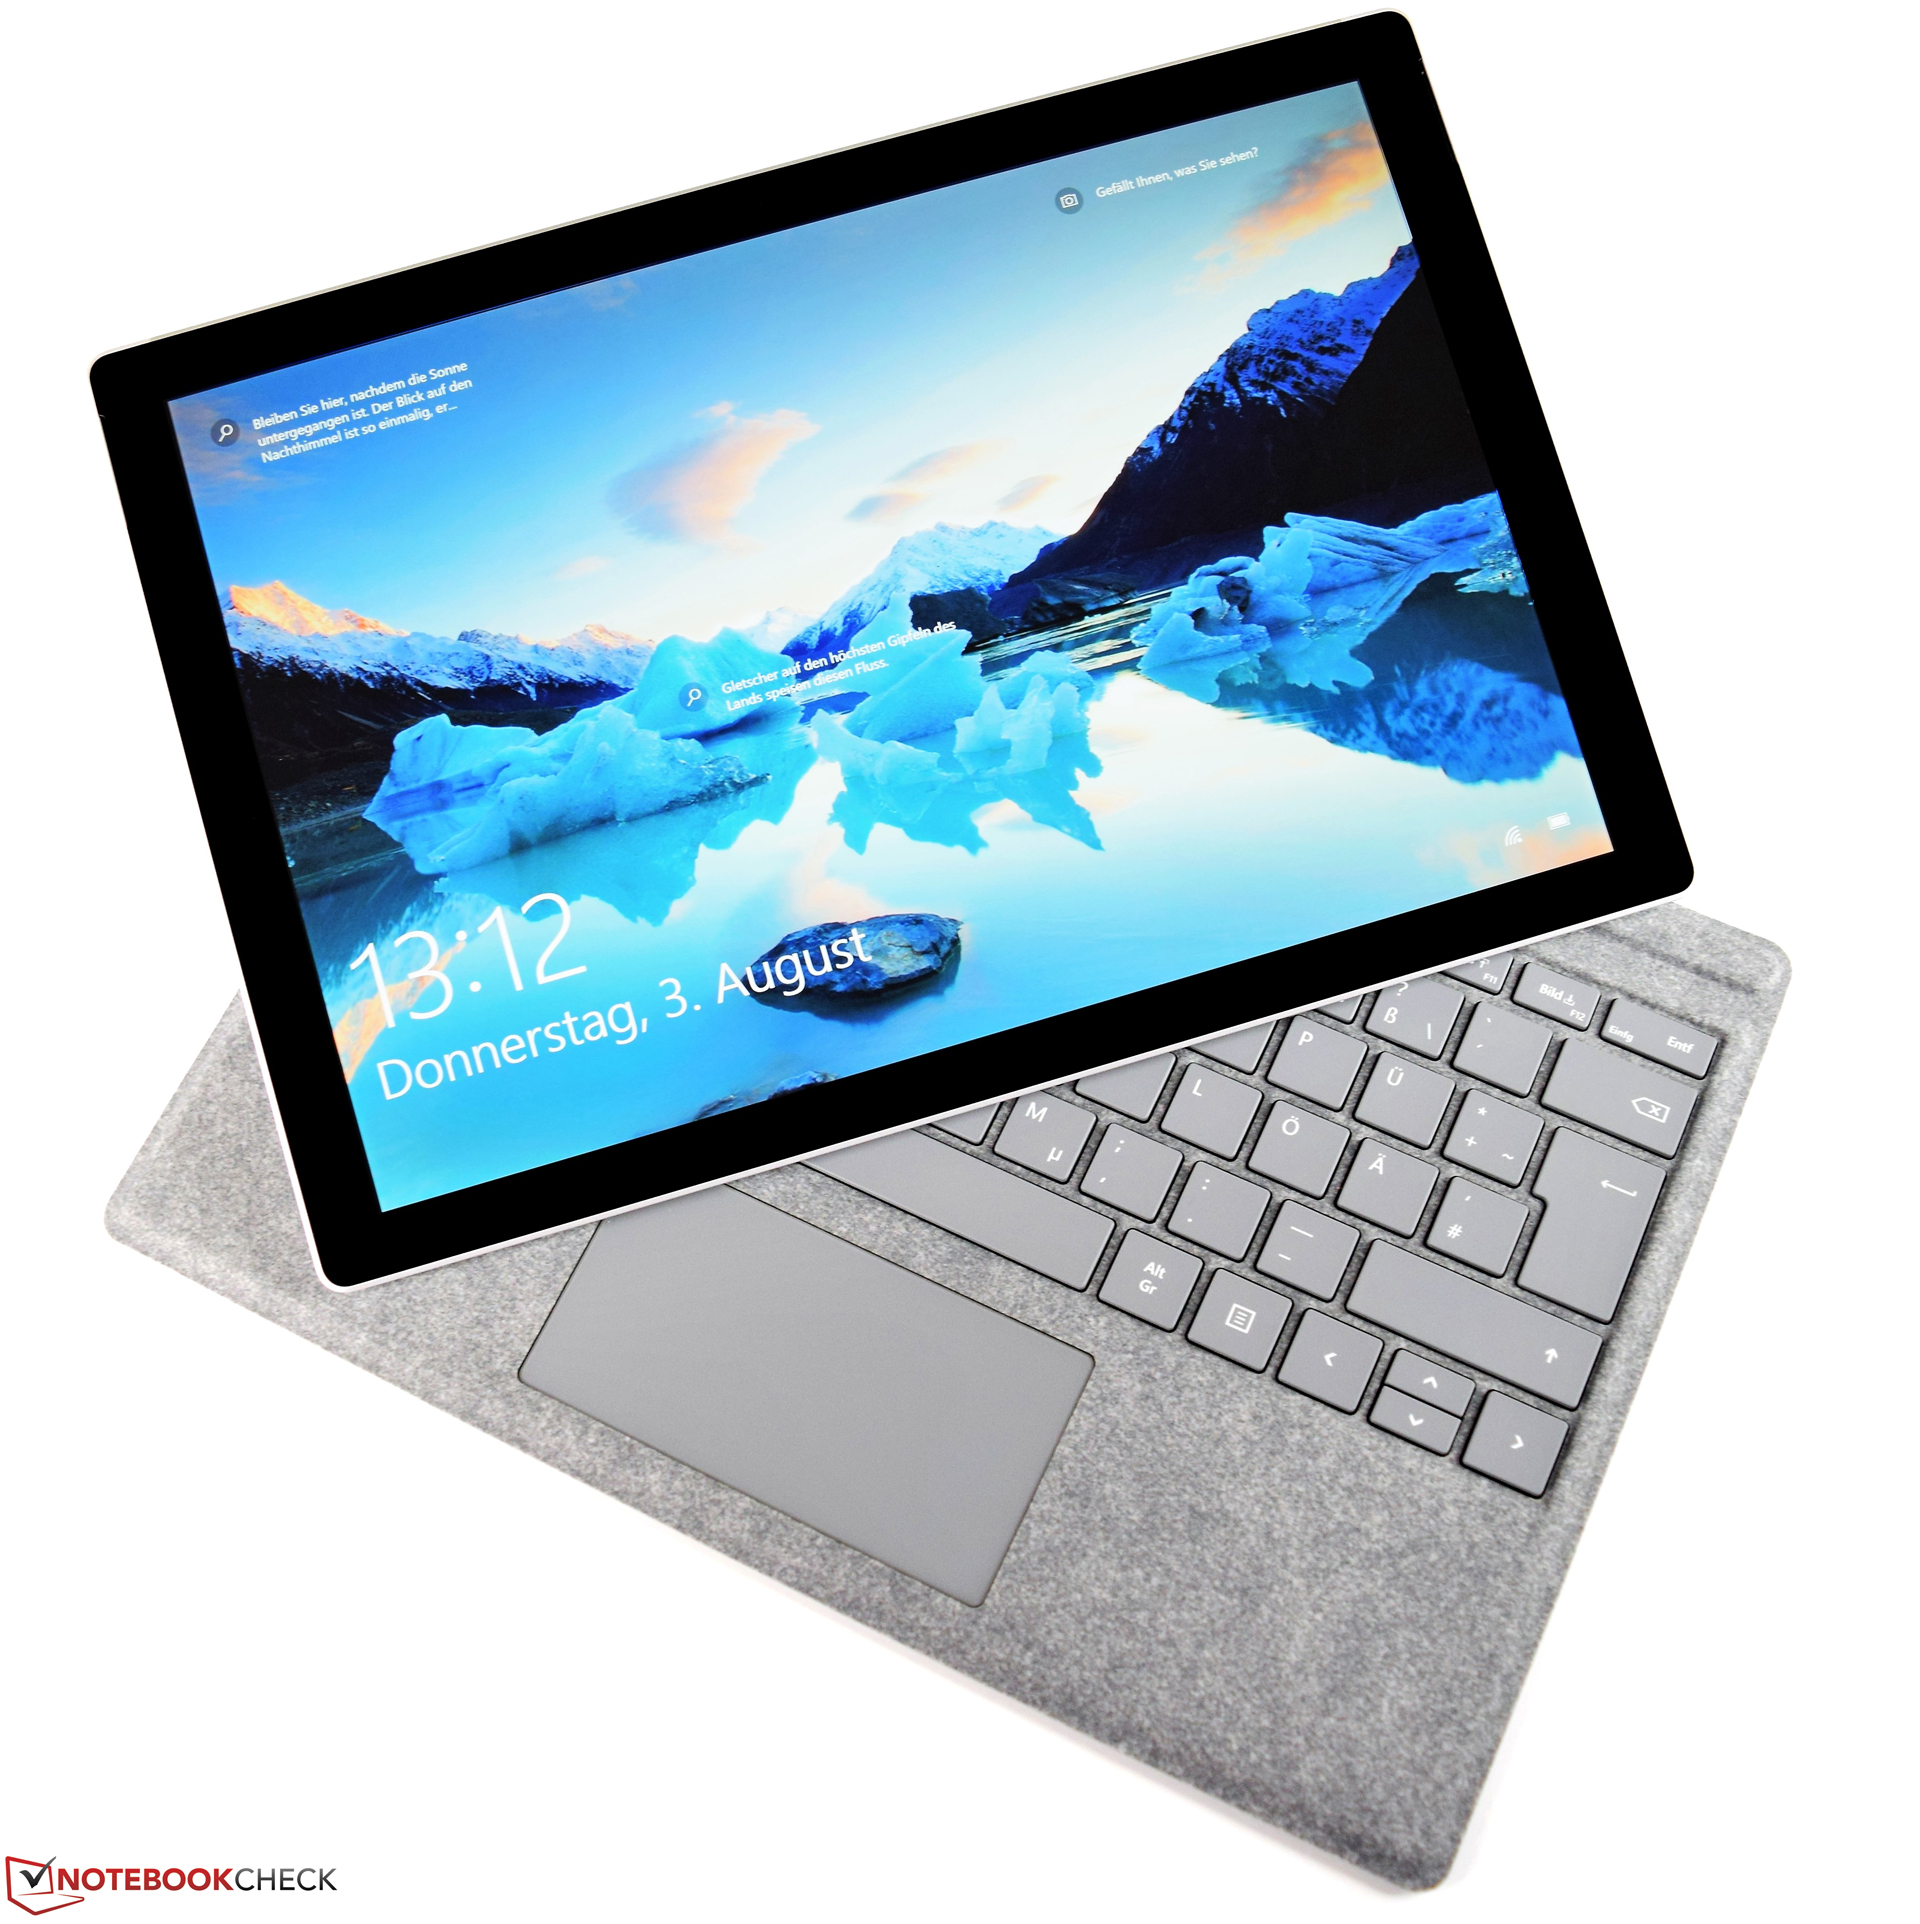
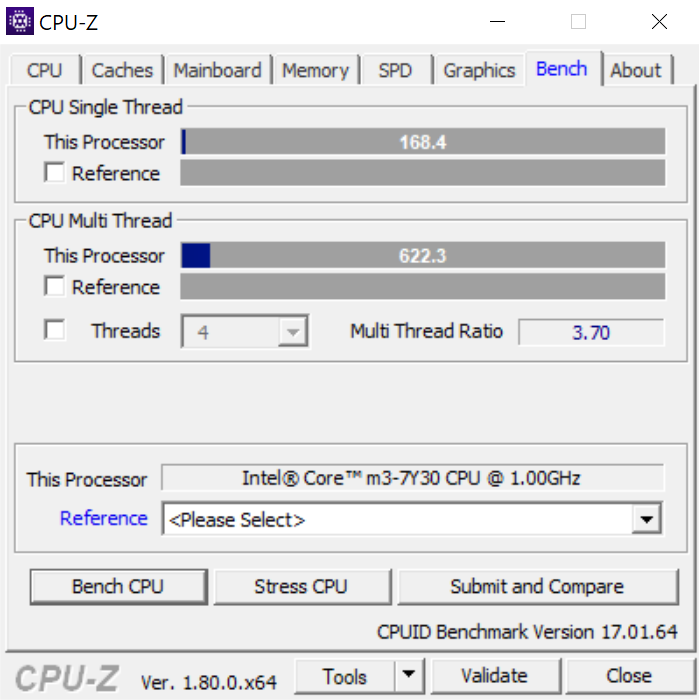
Il Microsoft Surface Pro 2017 basato sull'Intel Core m3 Y7Y30 fa bene molte cose e l'hardware usato è bilanciato molto bene. I componenti frugali possono migliorare la (già) buona autonomia. Tuttavia, questo riduce la potenza di calcolo. L'Intel Core m3 7Y30 ha abbastanza potenza per le attività quotidiane ma non può competere contro i più veloci convertibili i5 e i7 Surface Pro 2017. Le prestazioni di sistema tuttavia devono essere considerate buone e la distanza con i concorrenti più veloci spesso è limitata a pochi punti percentuali.
Il Microsoft Surface Pro 2017 nella configurazione entry-level attira l'attenzione soprattutto per il prezzo. Peccato che il produttore non offra altre configurazioni hardware su questa base.
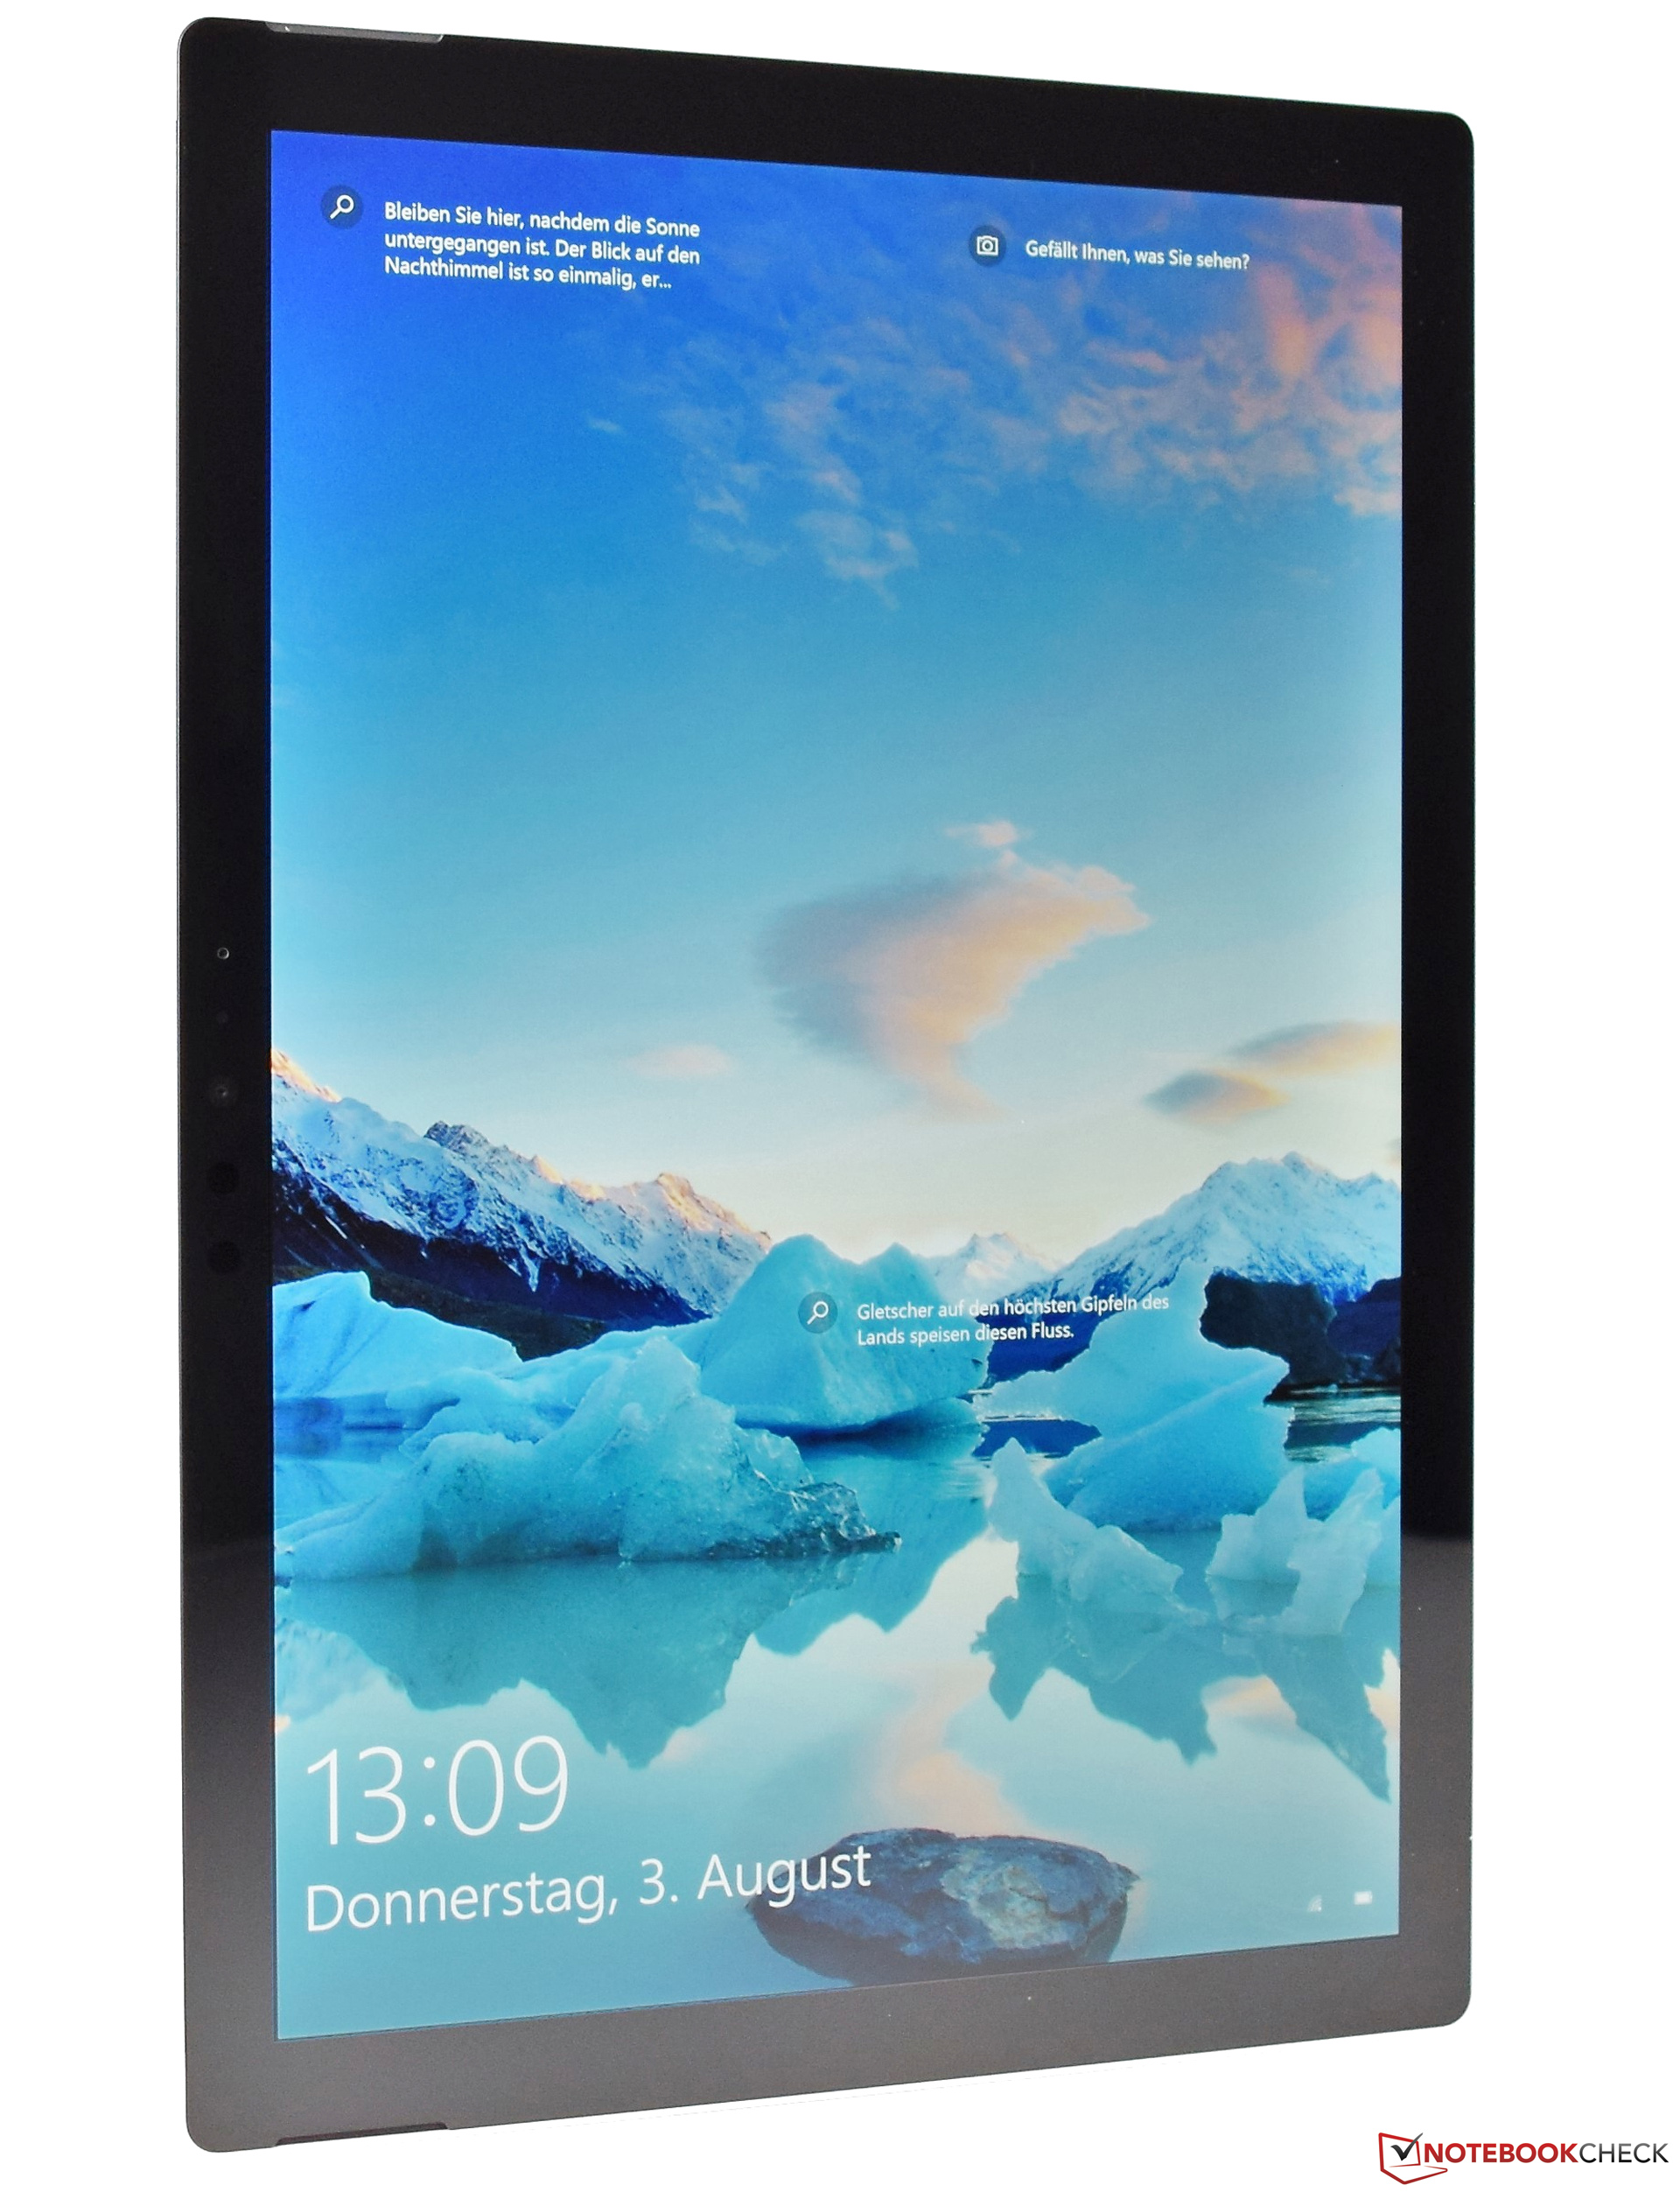
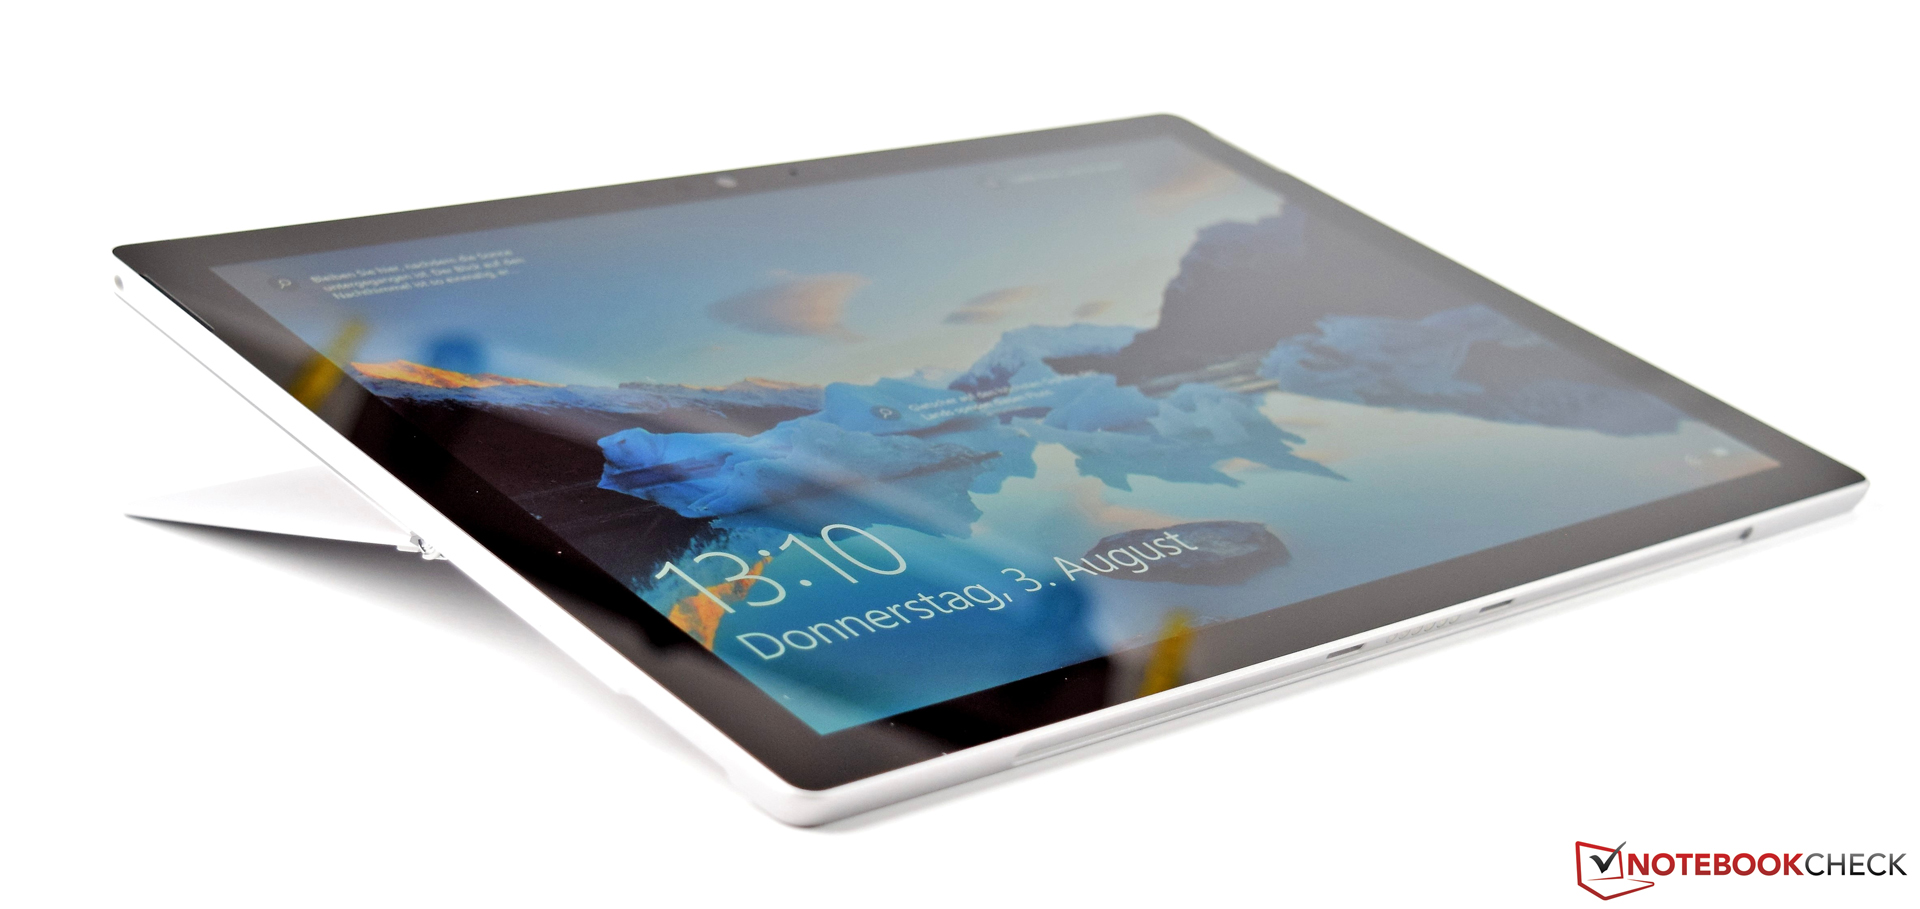
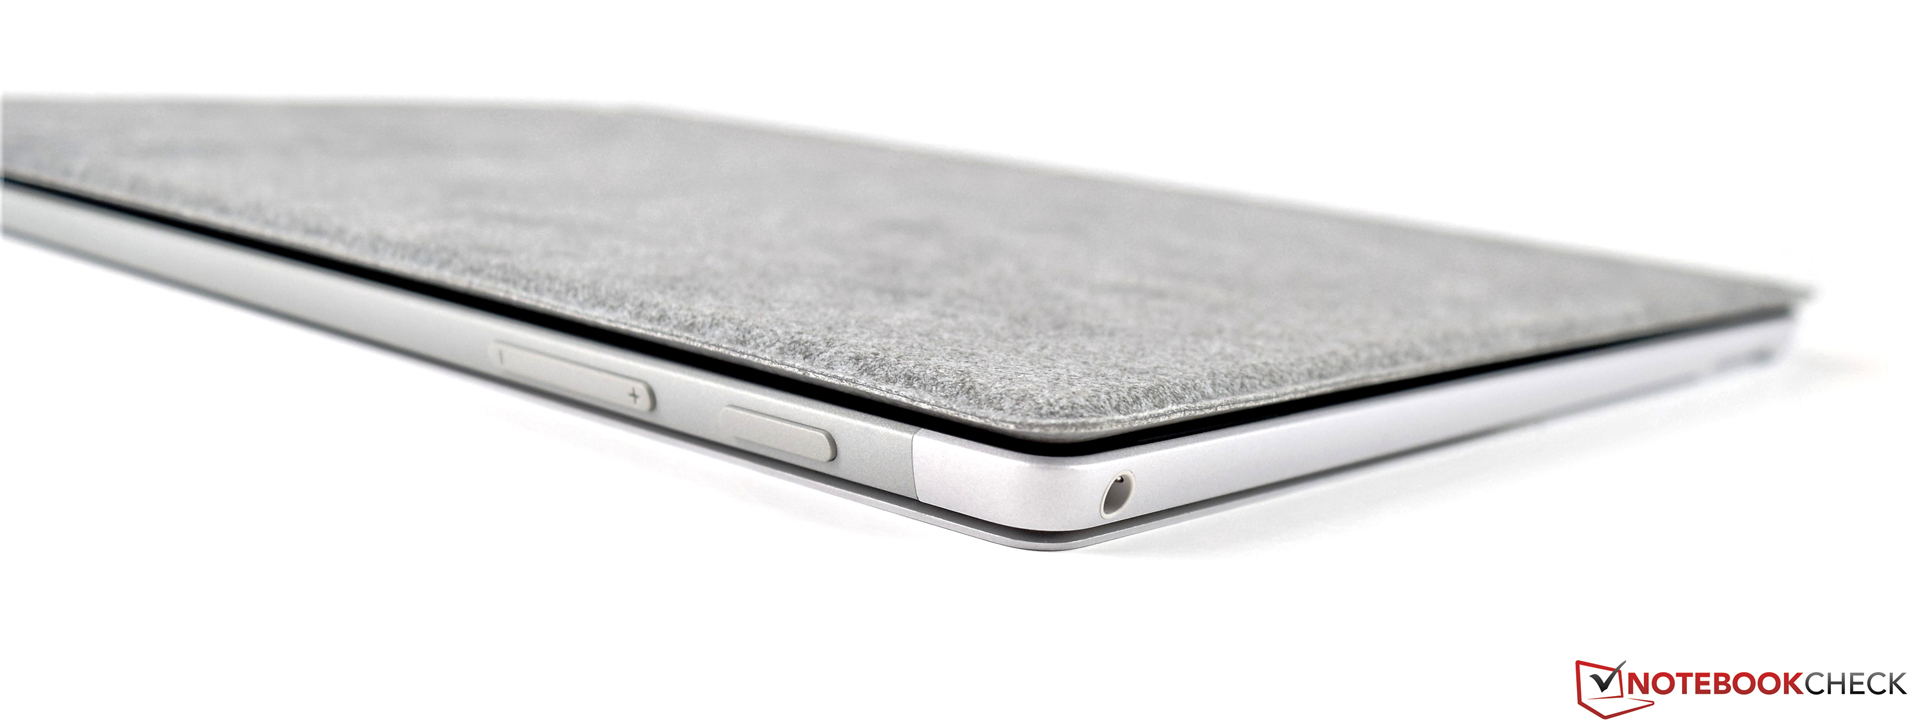
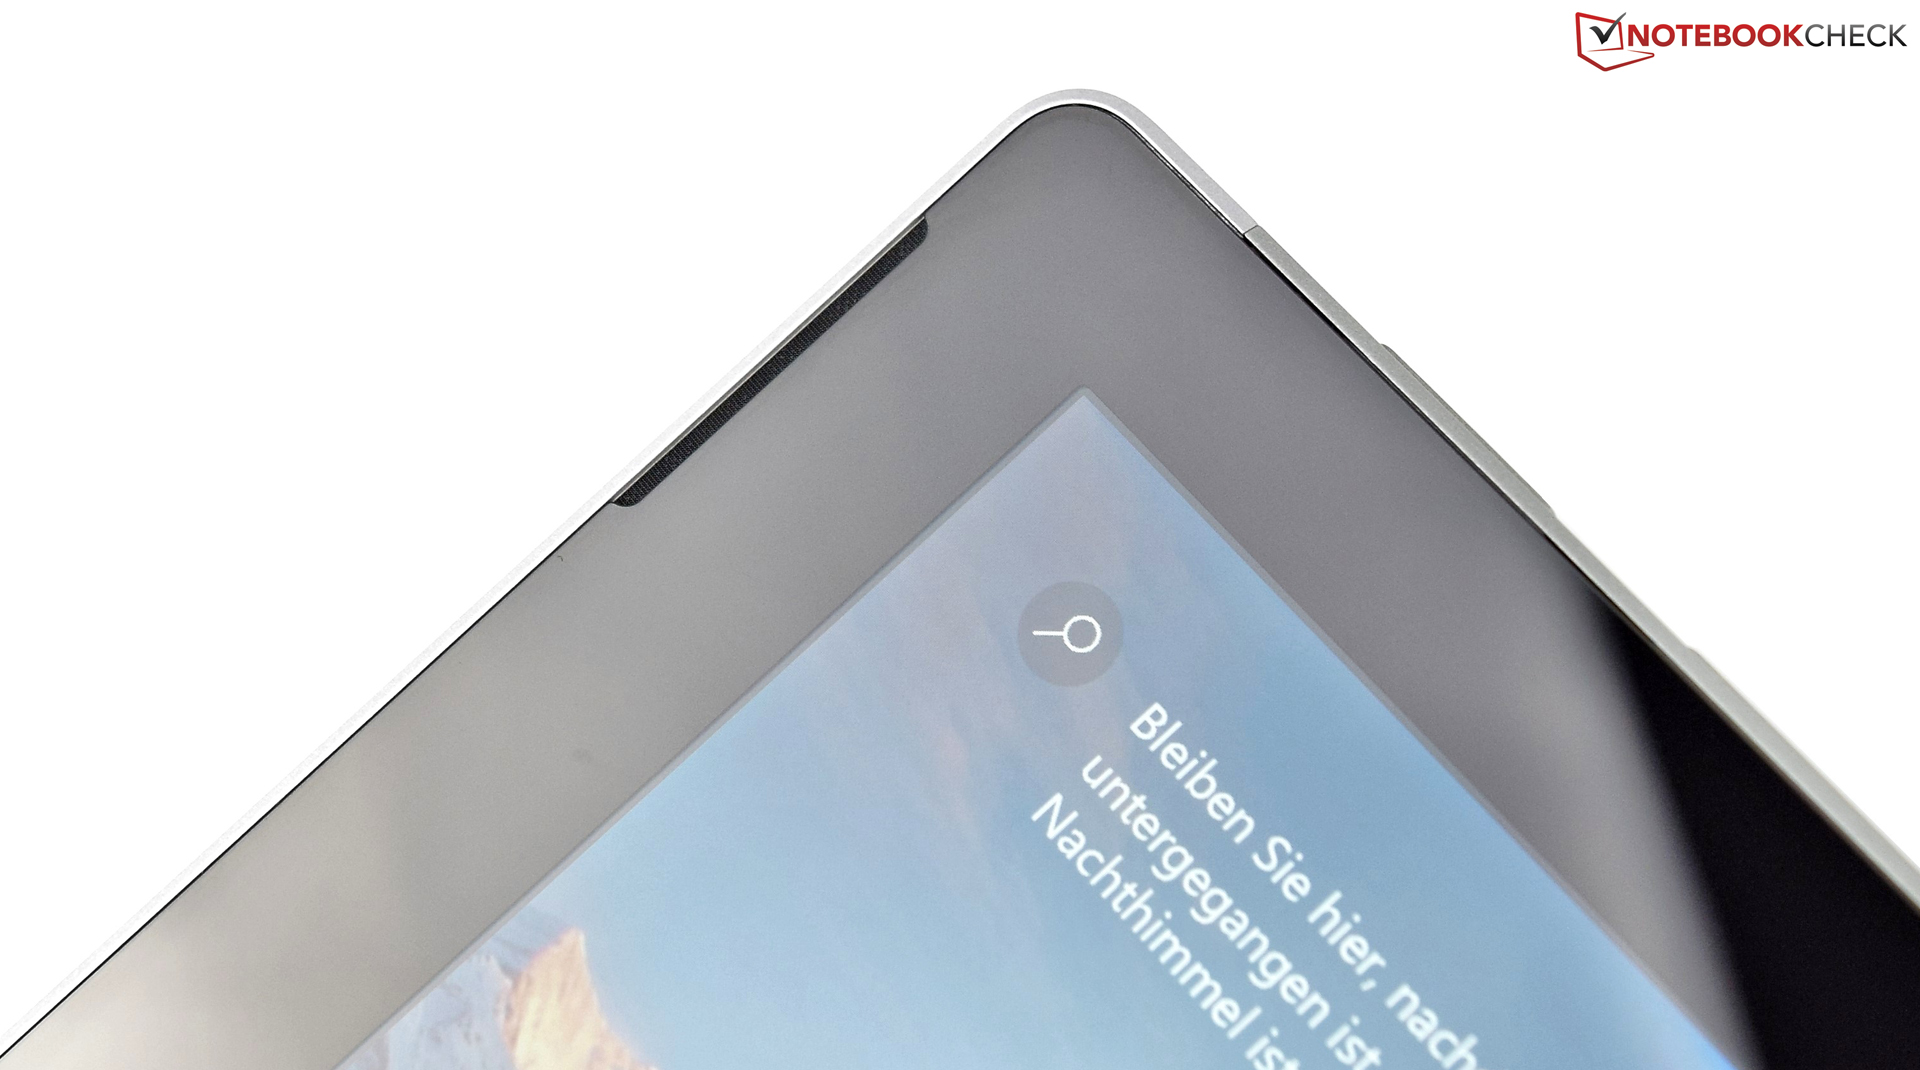
In particolare ci ha impressionato lo schermo molto buono. La sua elevata copertura del colore e l'elevata risoluzione sicuramente lo rendono adatto al settore semi-professionale. Tuttavia, il pannello deve essere criticato per la superficie molto riflettente che limita la possibilità di utilizzo all'aperto. Il principale punto di critica resta la limitazione delle opzioni di configurazione. 128 GB di spazio SSD si riempiono facilmente e non è possibile sostituire il dispositivo. Inoltre, non si capisce perché l'aspetto è moderno ma la connettività no. Nel 2017 dovrebbero esserci almeno una porta USB Type C con supporto Thunderbolt.
Nota: si tratta di una recensione breve, con alcune sezioni non tradotte, per la versione integrale in inglese guardate qui.
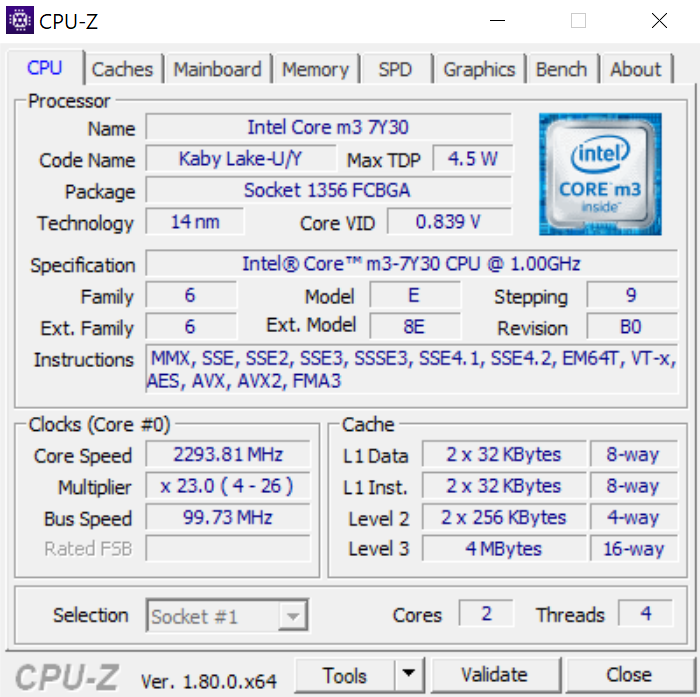
Microsoft Surface Pro (2017) m3
- 08/07/2017 v6 (old)
Sebastian Bade