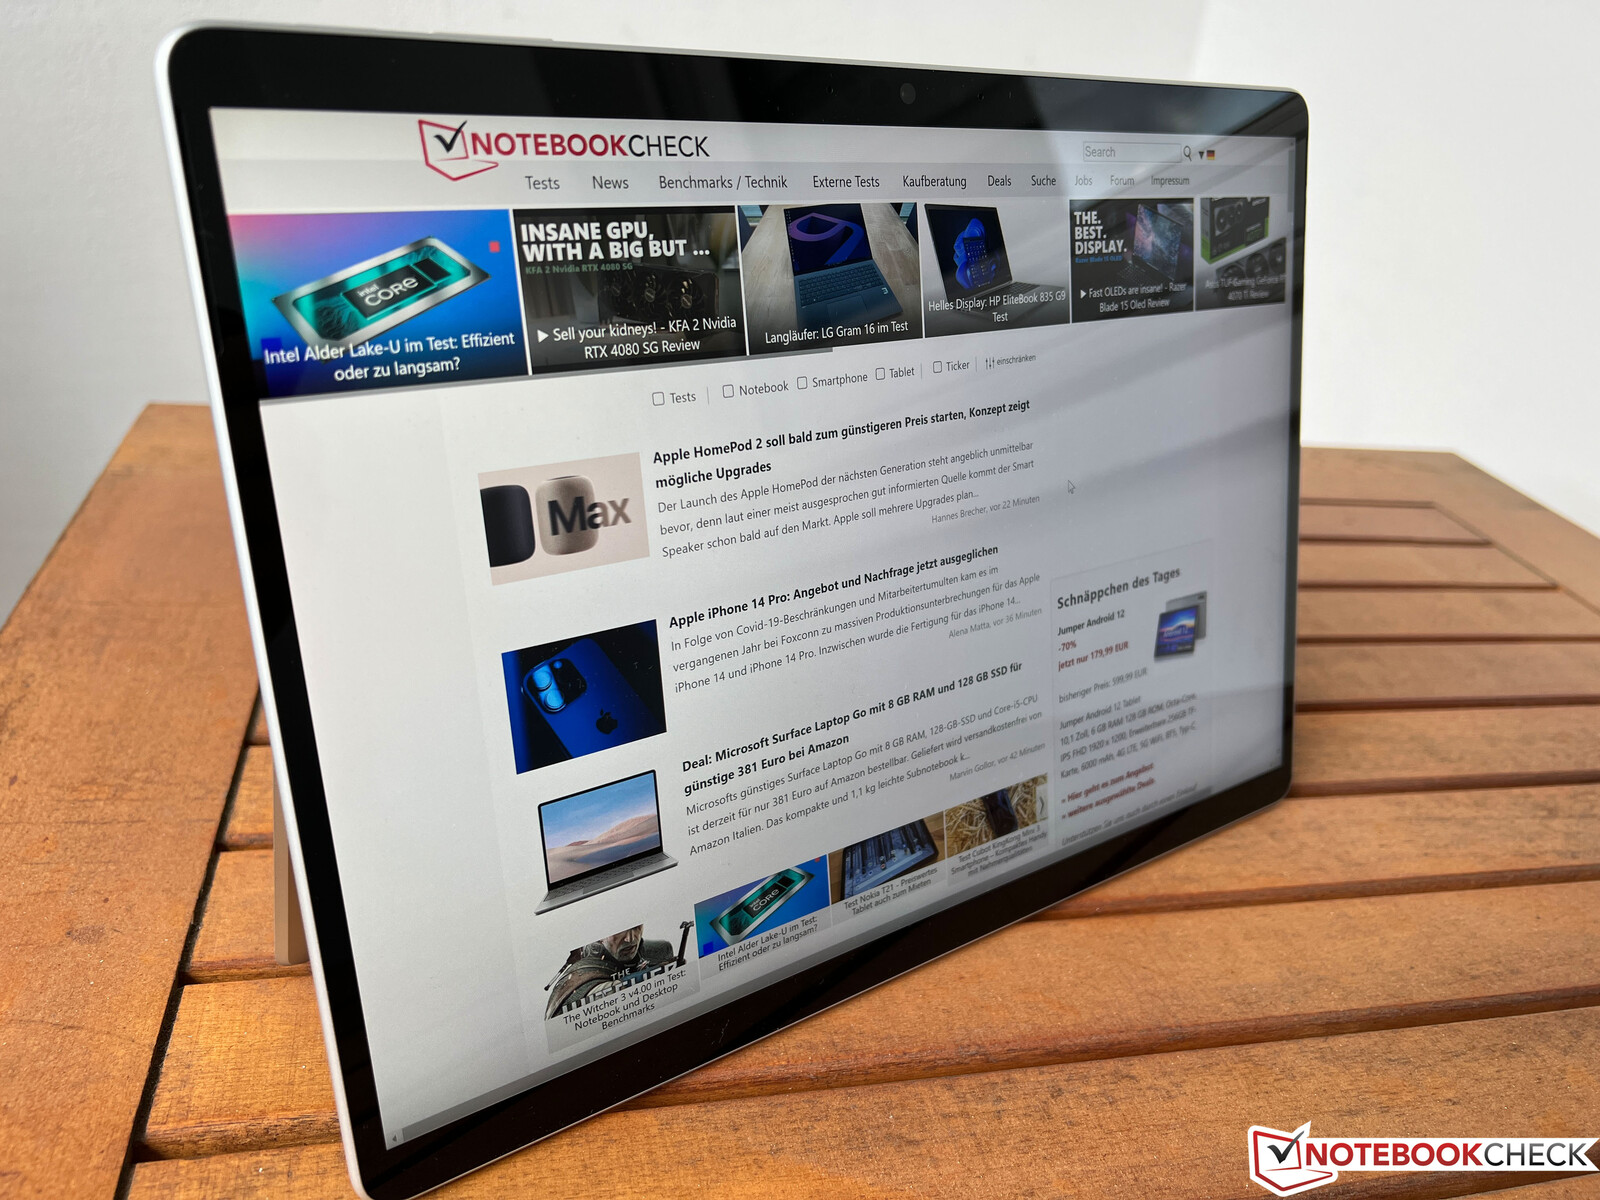
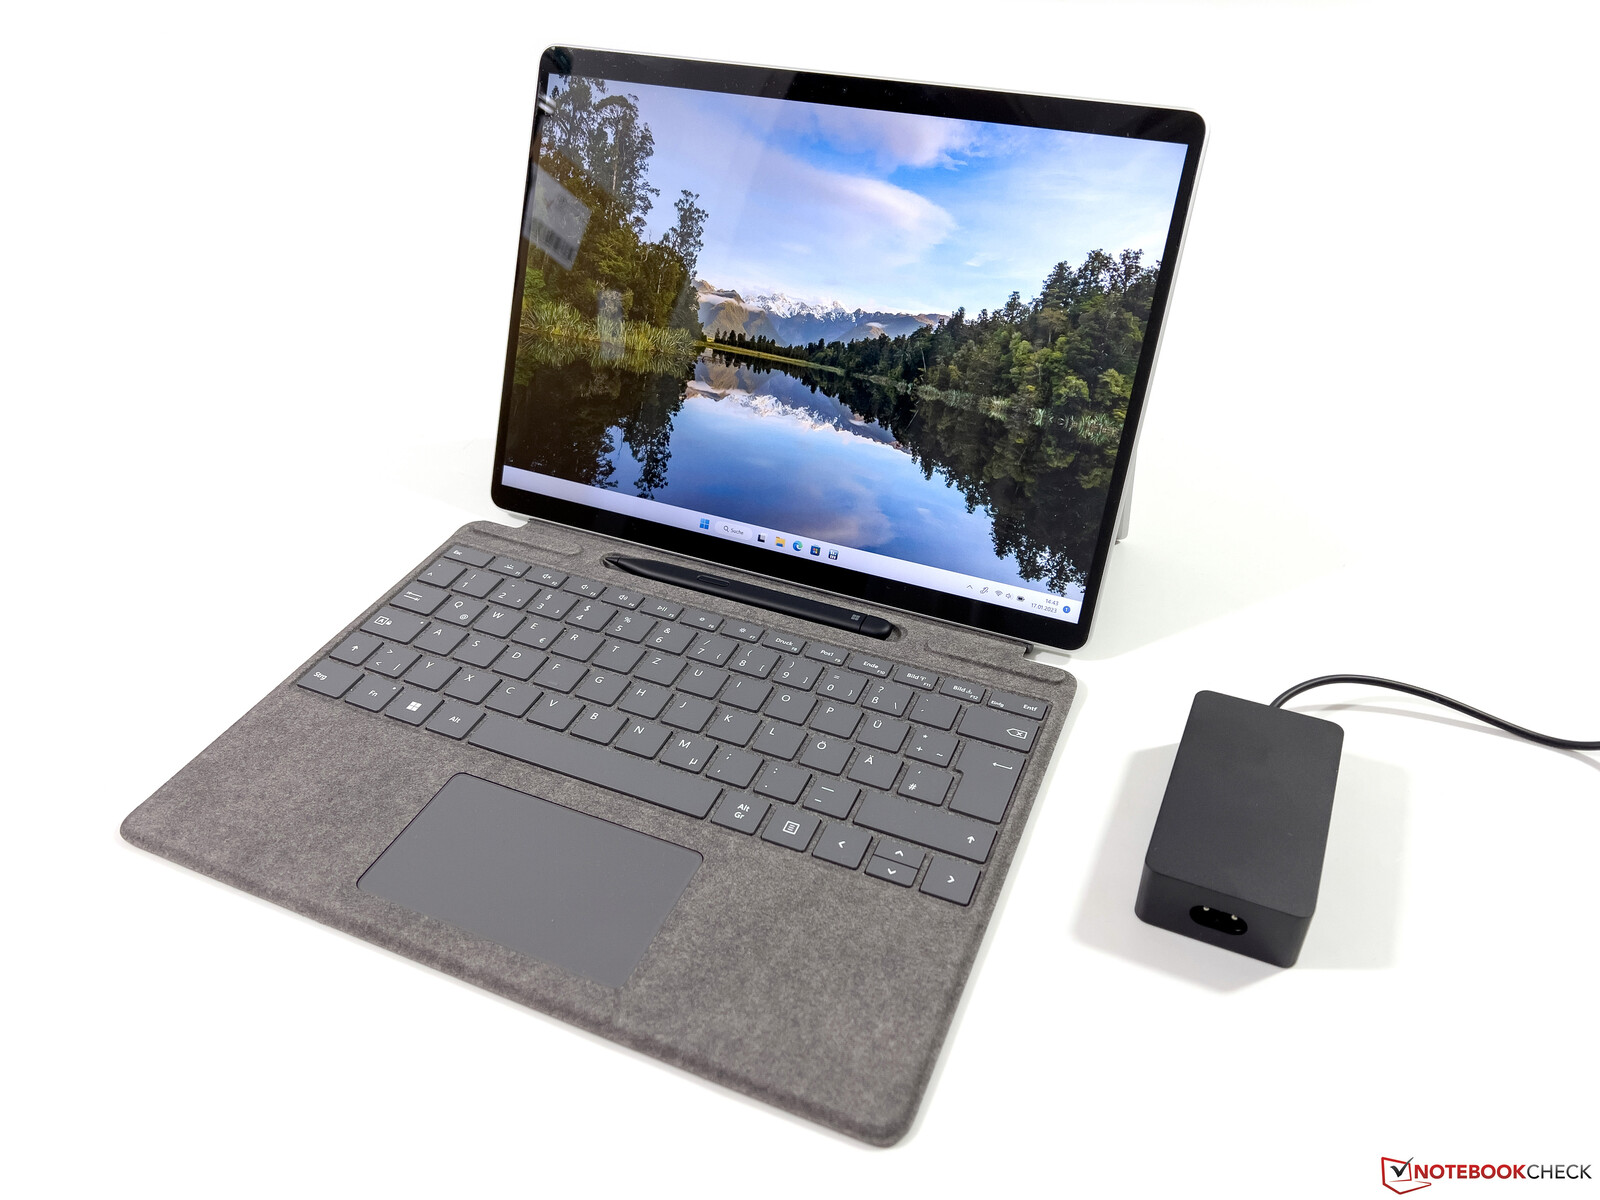
Recensione del Microsoft Surface Pro 9: Il convertibile ora con una CPU decisamente più potente
Microsoft ha apportato diverse modifiche ai suoi prodotti Surface, in quanto il precedente tablet Surface Pro X ARM non è più un prodotto a sé stante e d'ora in poi continuerà con il nome di Surface Pro 9. Questo significa che ora ci sono due varianti del Surface Pro 9, ovvero una con un normale processore Intel (a partire da 989,00 dollari) e l'altra con un chip ARM (1357,12 dollari), che supporta anche la connettività 5G. Presto recensiremo anche la nuova variante ARM con Microsoft SQ3 Adreno 8CX Gen3, ma il Surface Pro 9 con il suo processore Alder Lake-U è il nostro primo oggetto di prova per oggi.
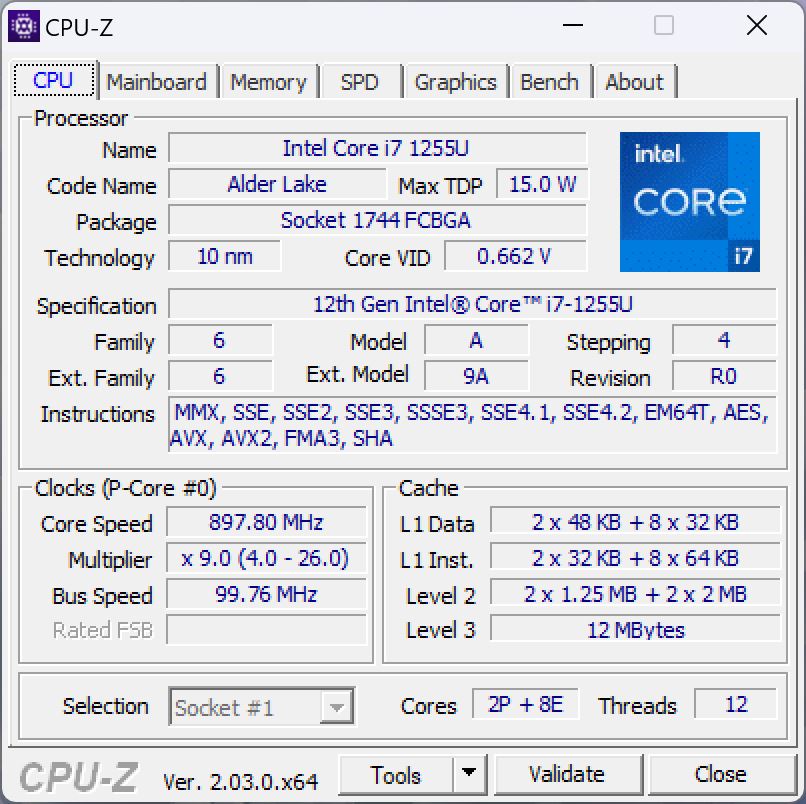
L'esemplare da noi recensito è la variante top della CPU con un Core i7 1255U, 16 GB di RAM e 512 GB PCIe-SSD. In questa configurazione, il convertibile costa 1.879,99 dollari, anche se bisogna mettere in conto altri 300 dollari per la Signature Keyboard e la Surface Slim Pen 2. Alcuni rivenditori online (a seconda del luogo in cui ci si trova) possono offrire questi bundle a prezzi più convenienti: il nostro bundle, ad esempio, è disponibile a partire da 2130 euro (2320 dollari). Un altro cambiamento riguarda la versione business del Surface Pro 9, che non è più disponibile con un modulo WWAN nella variante Intel.
A parte il nuovo processore Alder Lake, il modulo WLAN aggiornato e la rimozione del jack audio, non ci sono grandi cambiamenti tecnici, né per il Surface Pro stesso né per i dispositivi di input. Per ulteriori informazioni, rimandiamo alle nostre recensioni dei precedenti modelli di Surface Pro:
Potenziali concorrenti a confronto
Punteggio | Data | Modello | Peso | Altezza | Dimensione | Risoluzione | Prezzo |
|---|---|---|---|---|---|---|---|
| 88.4 % v7 (old) | 01/2023 | Microsoft Surface Pro 9, i7-1255U i7-1255U, Iris Xe G7 96EUs | 877 gr | 9.3 mm | 13.00" | 2880x1920 | |
| 90.1 % v7 (old) | 11/2022 | Dell XPS 13 9315 2-in-1 Core i5-1230U i5-1230U, Iris Xe G7 80EUs | 764 gr | 7.4 mm | 13.00" | 2880x1920 | |
| 88.5 % v7 (old) | 04/2021 | Lenovo ThinkPad X12 20UVS03G00 i7-1160G7, Iris Xe G7 96EUs | 1.1 kg | 14.5 mm | 12.30" | 1920x1280 | |
| 90.3 % v7 (old) | 12/2022 | HP Elite Dragonfly Folio 13.5 G3 i7-1265U, Iris Xe G7 96EUs | 1.4 kg | 17.8 mm | 13.50" | 1920x1280 | |
| 91.8 % v7 (old) | 11/2022 | Apple iPad Pro 12.9 2022 M2, M2 10-Core GPU | 682 gr | 6.4 mm | 12.90" | 2732x2048 | |
| 86.8 % v7 (old) | 03/2022 | Asus ROG Flow Z13 GZ301ZE i9-12900H, GeForce RTX 3050 Ti Laptop GPU | 1.2 kg | 12 mm | 13.40" | 1920x1200 |
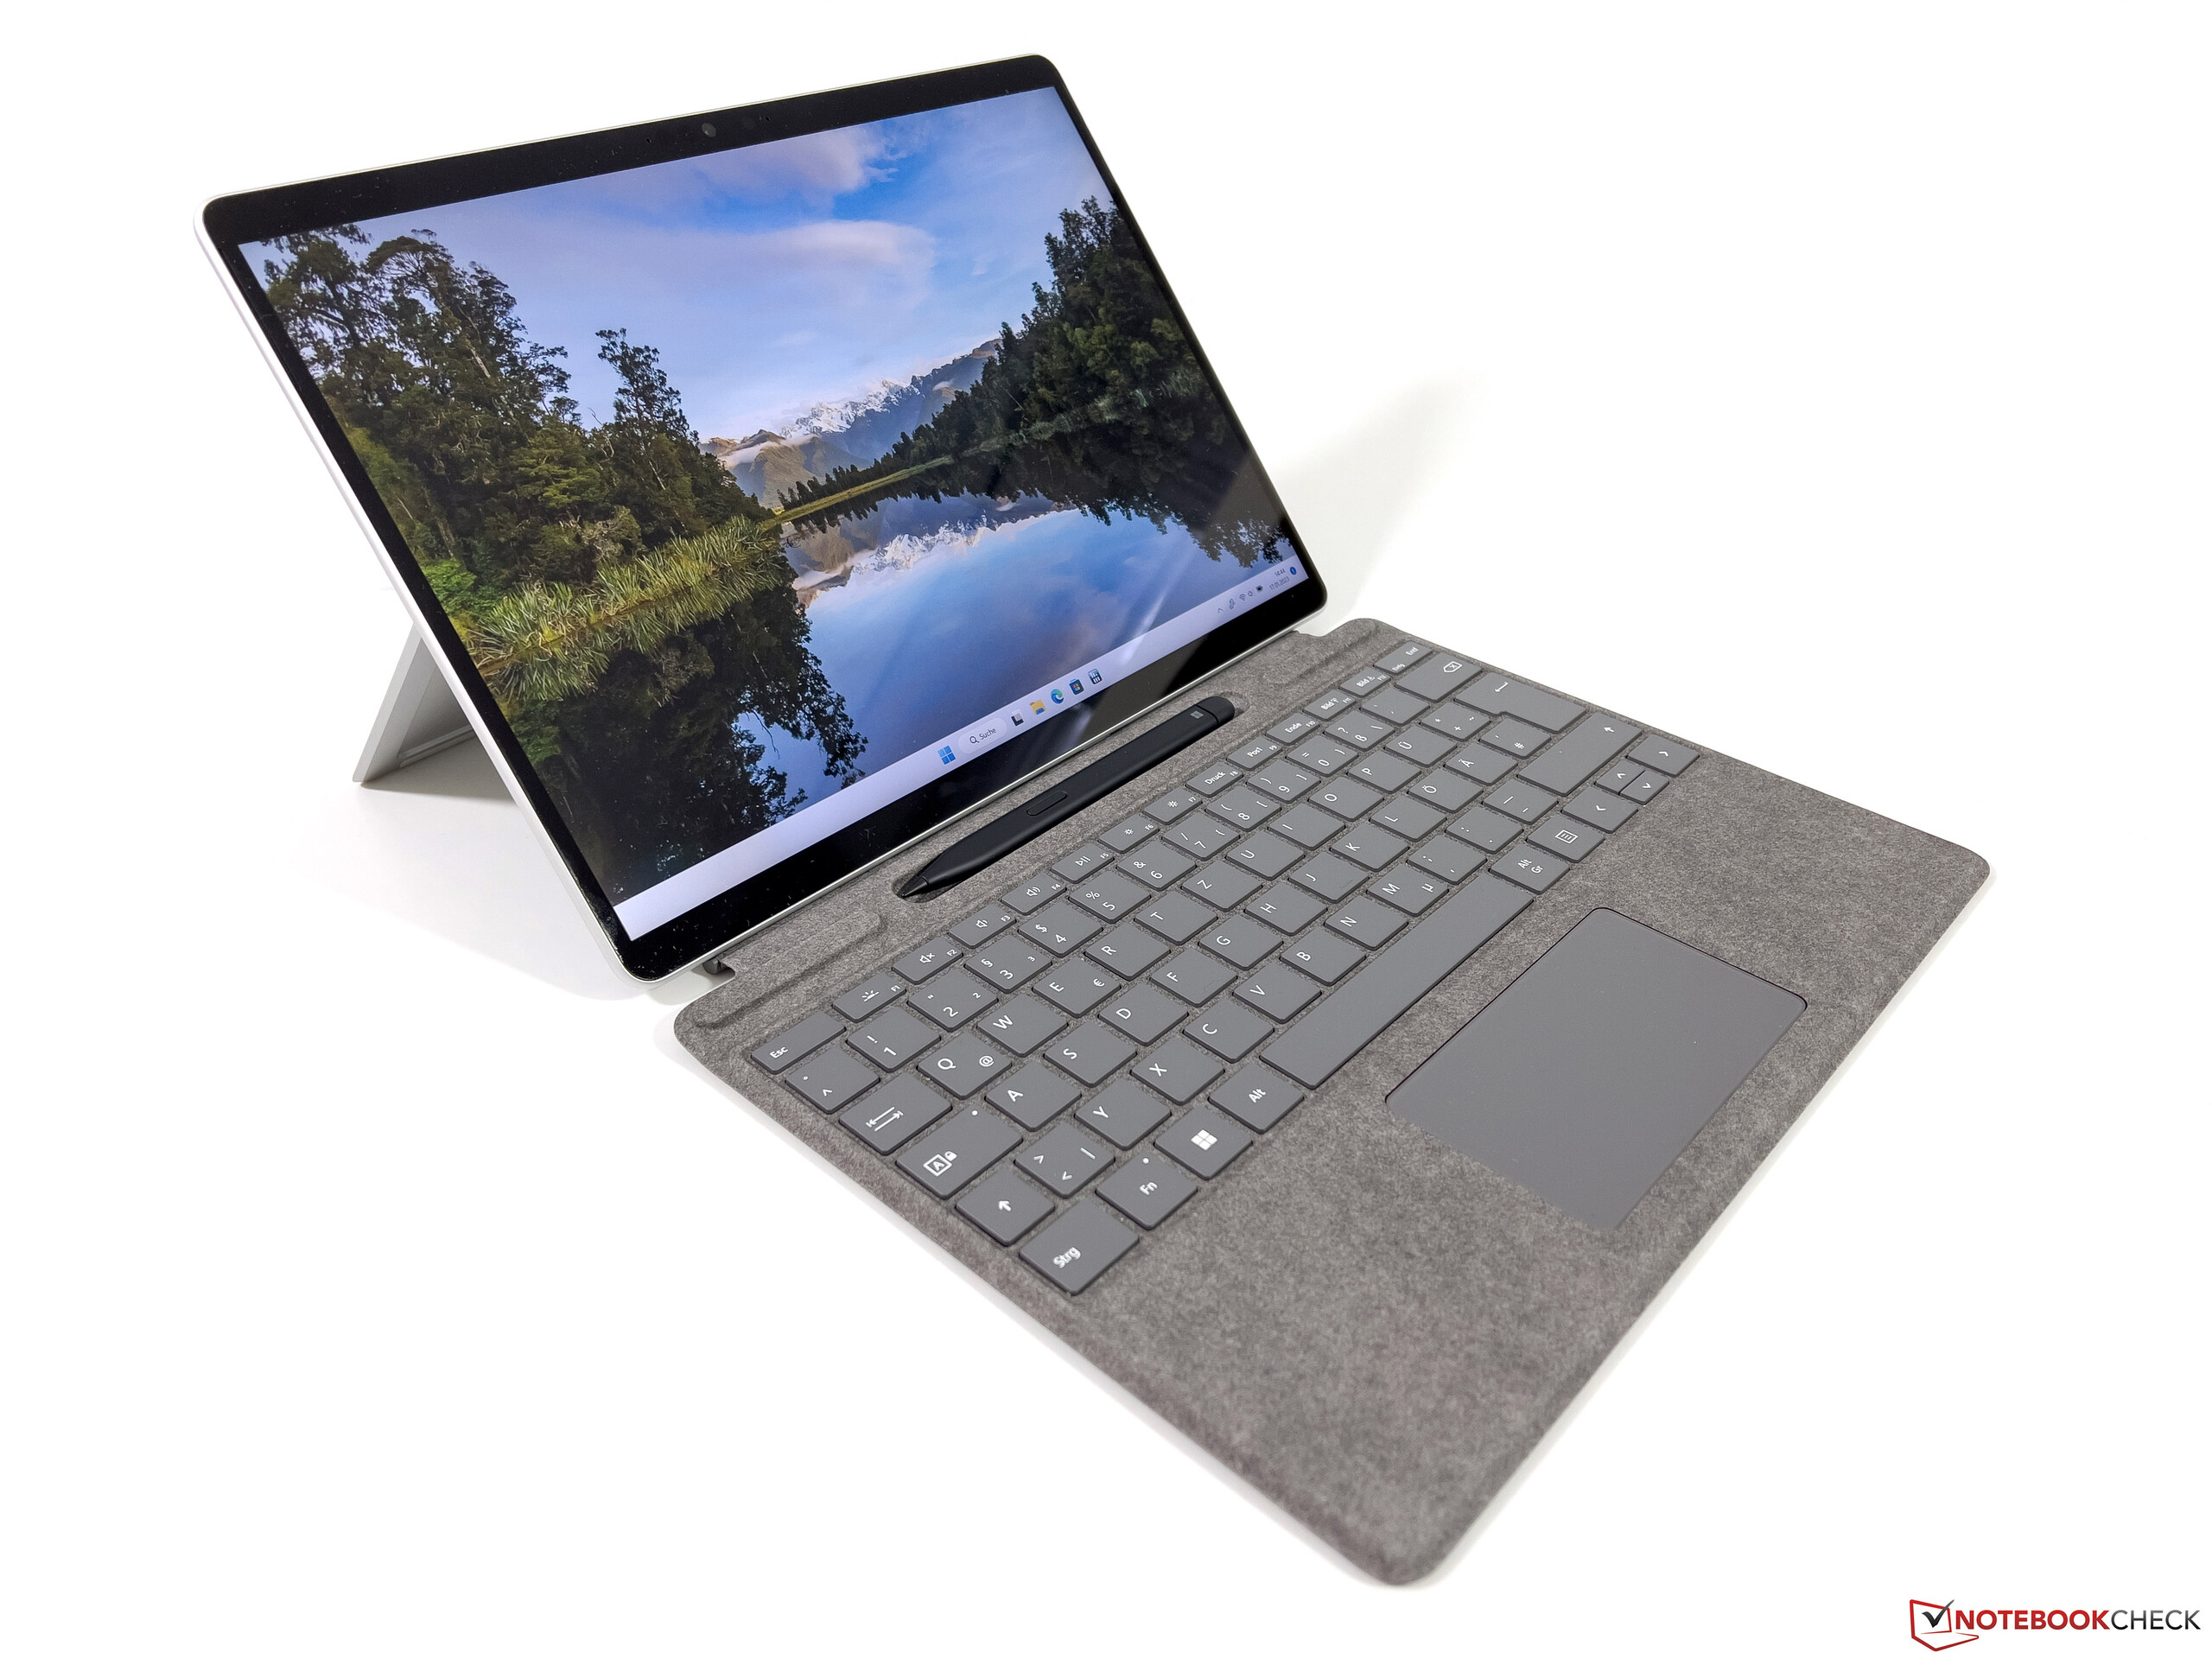
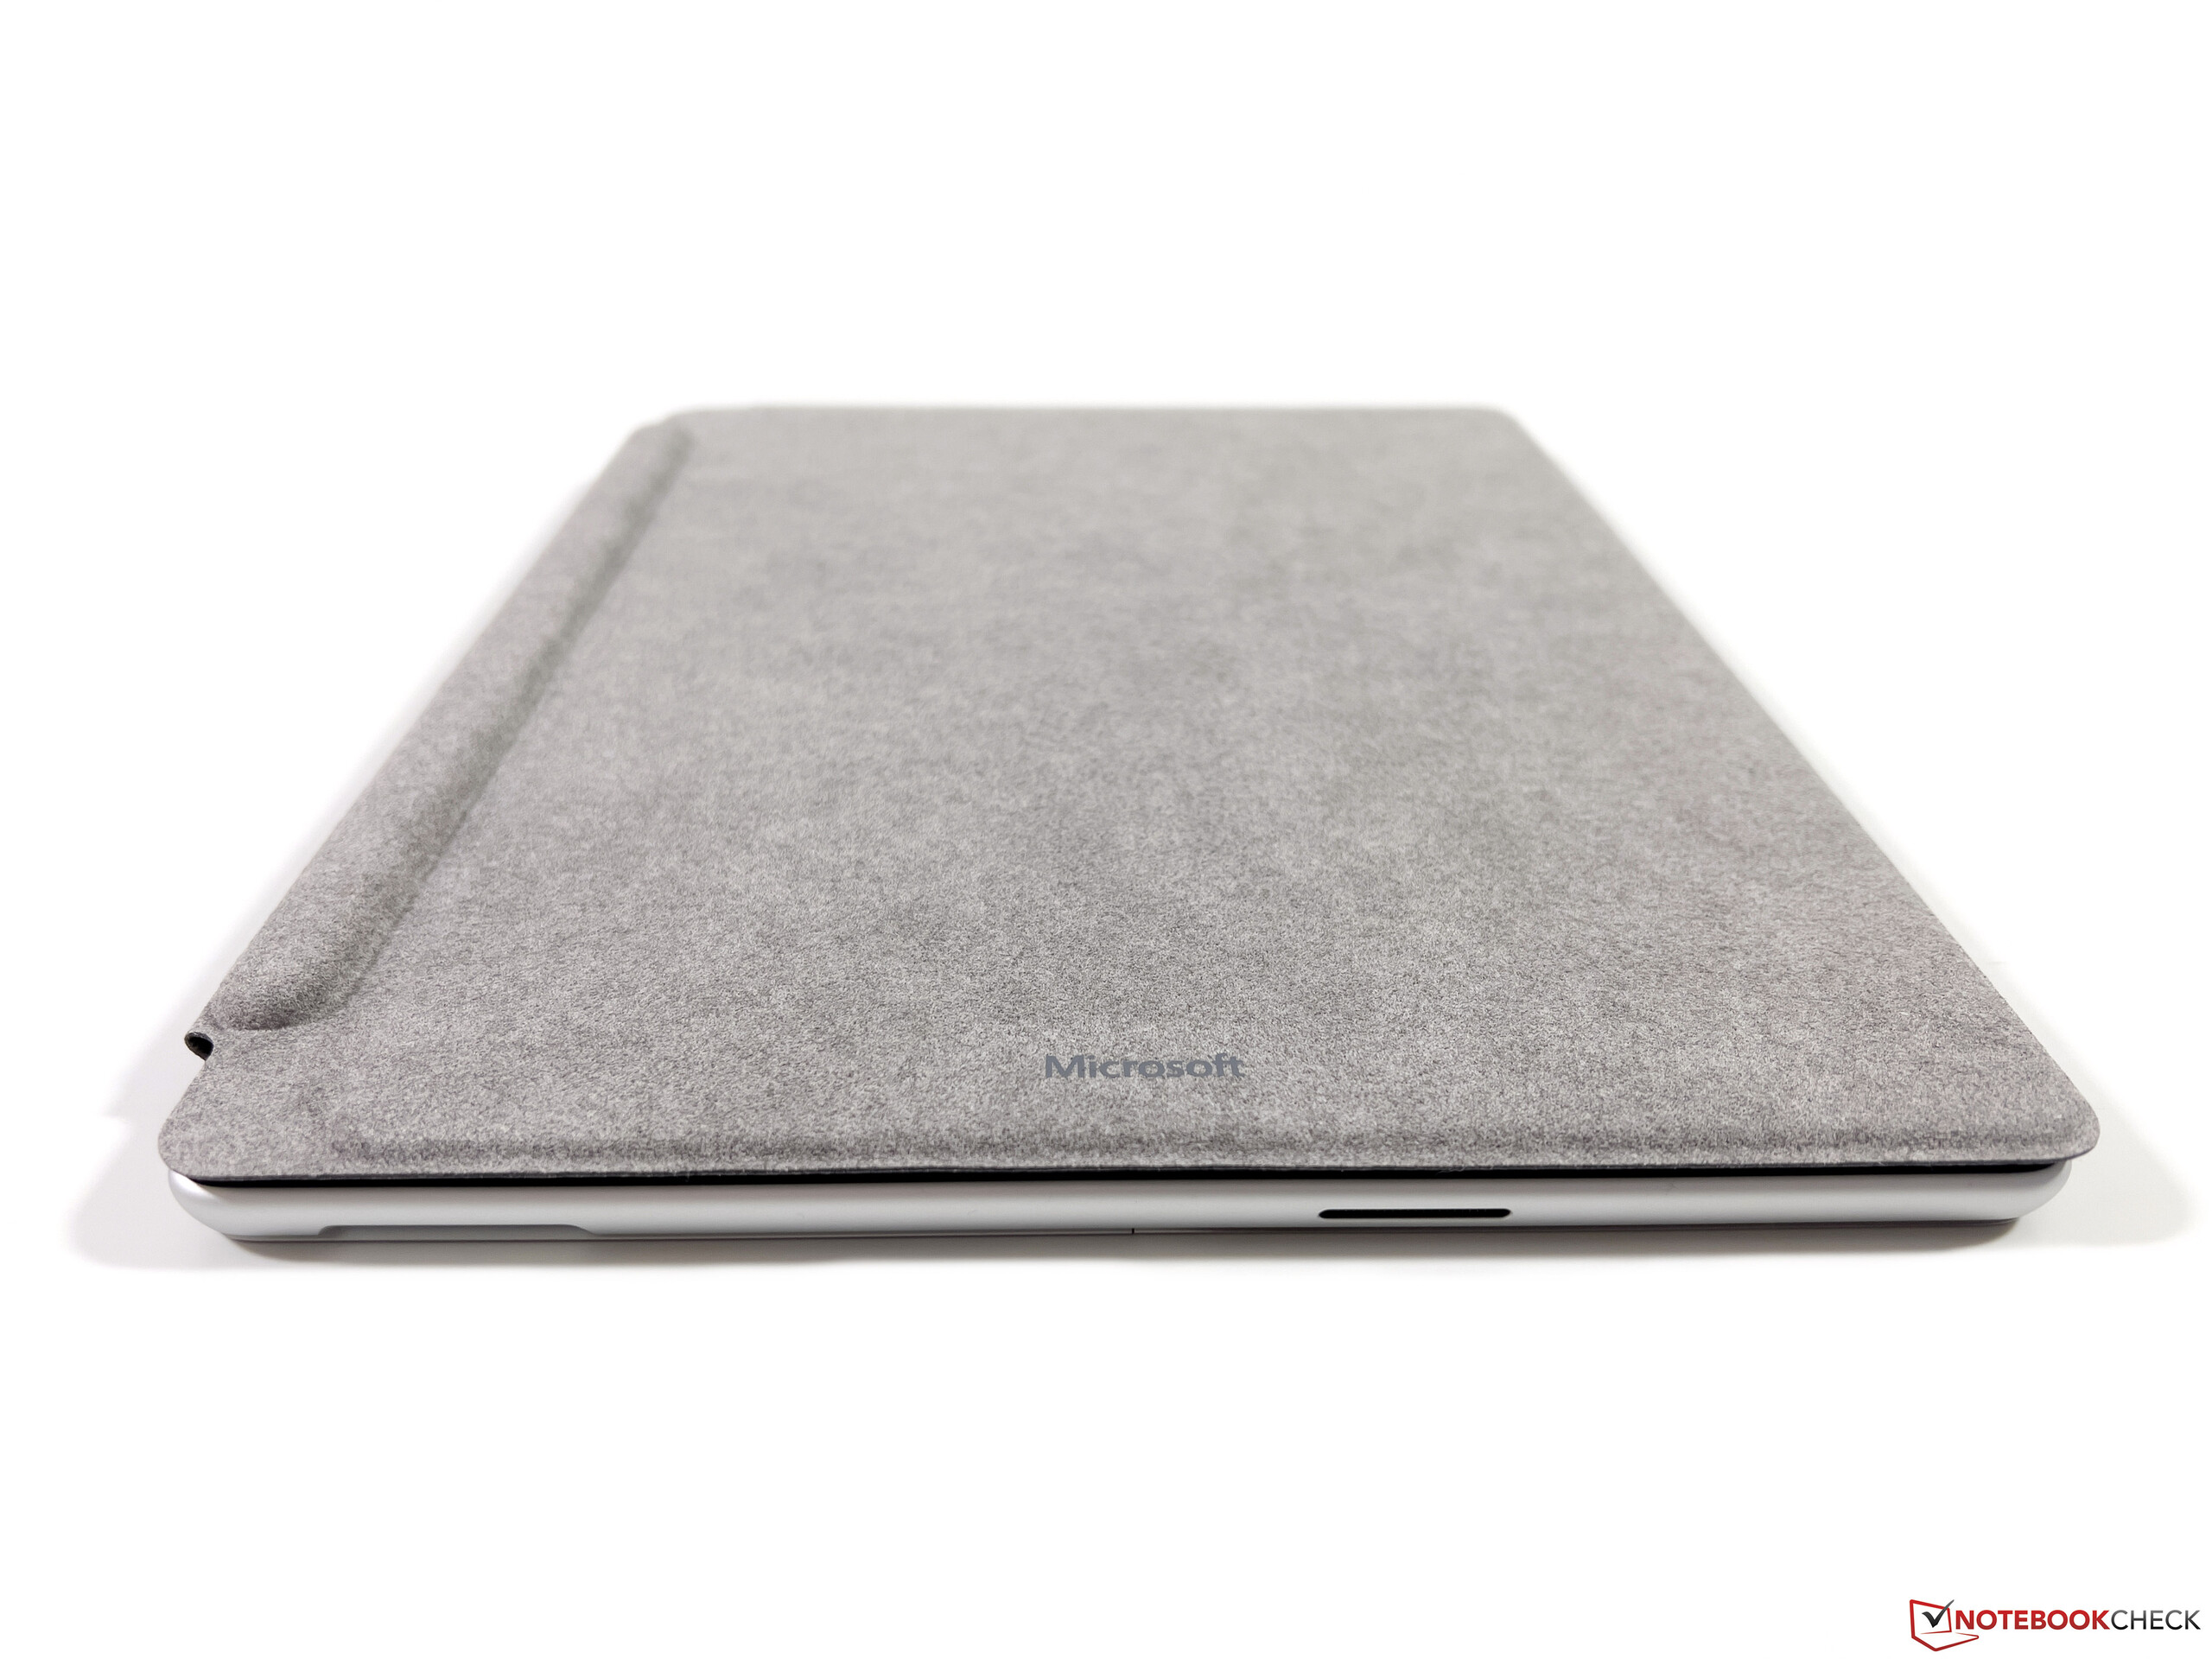
Caso - Modifiche minori al convertibile
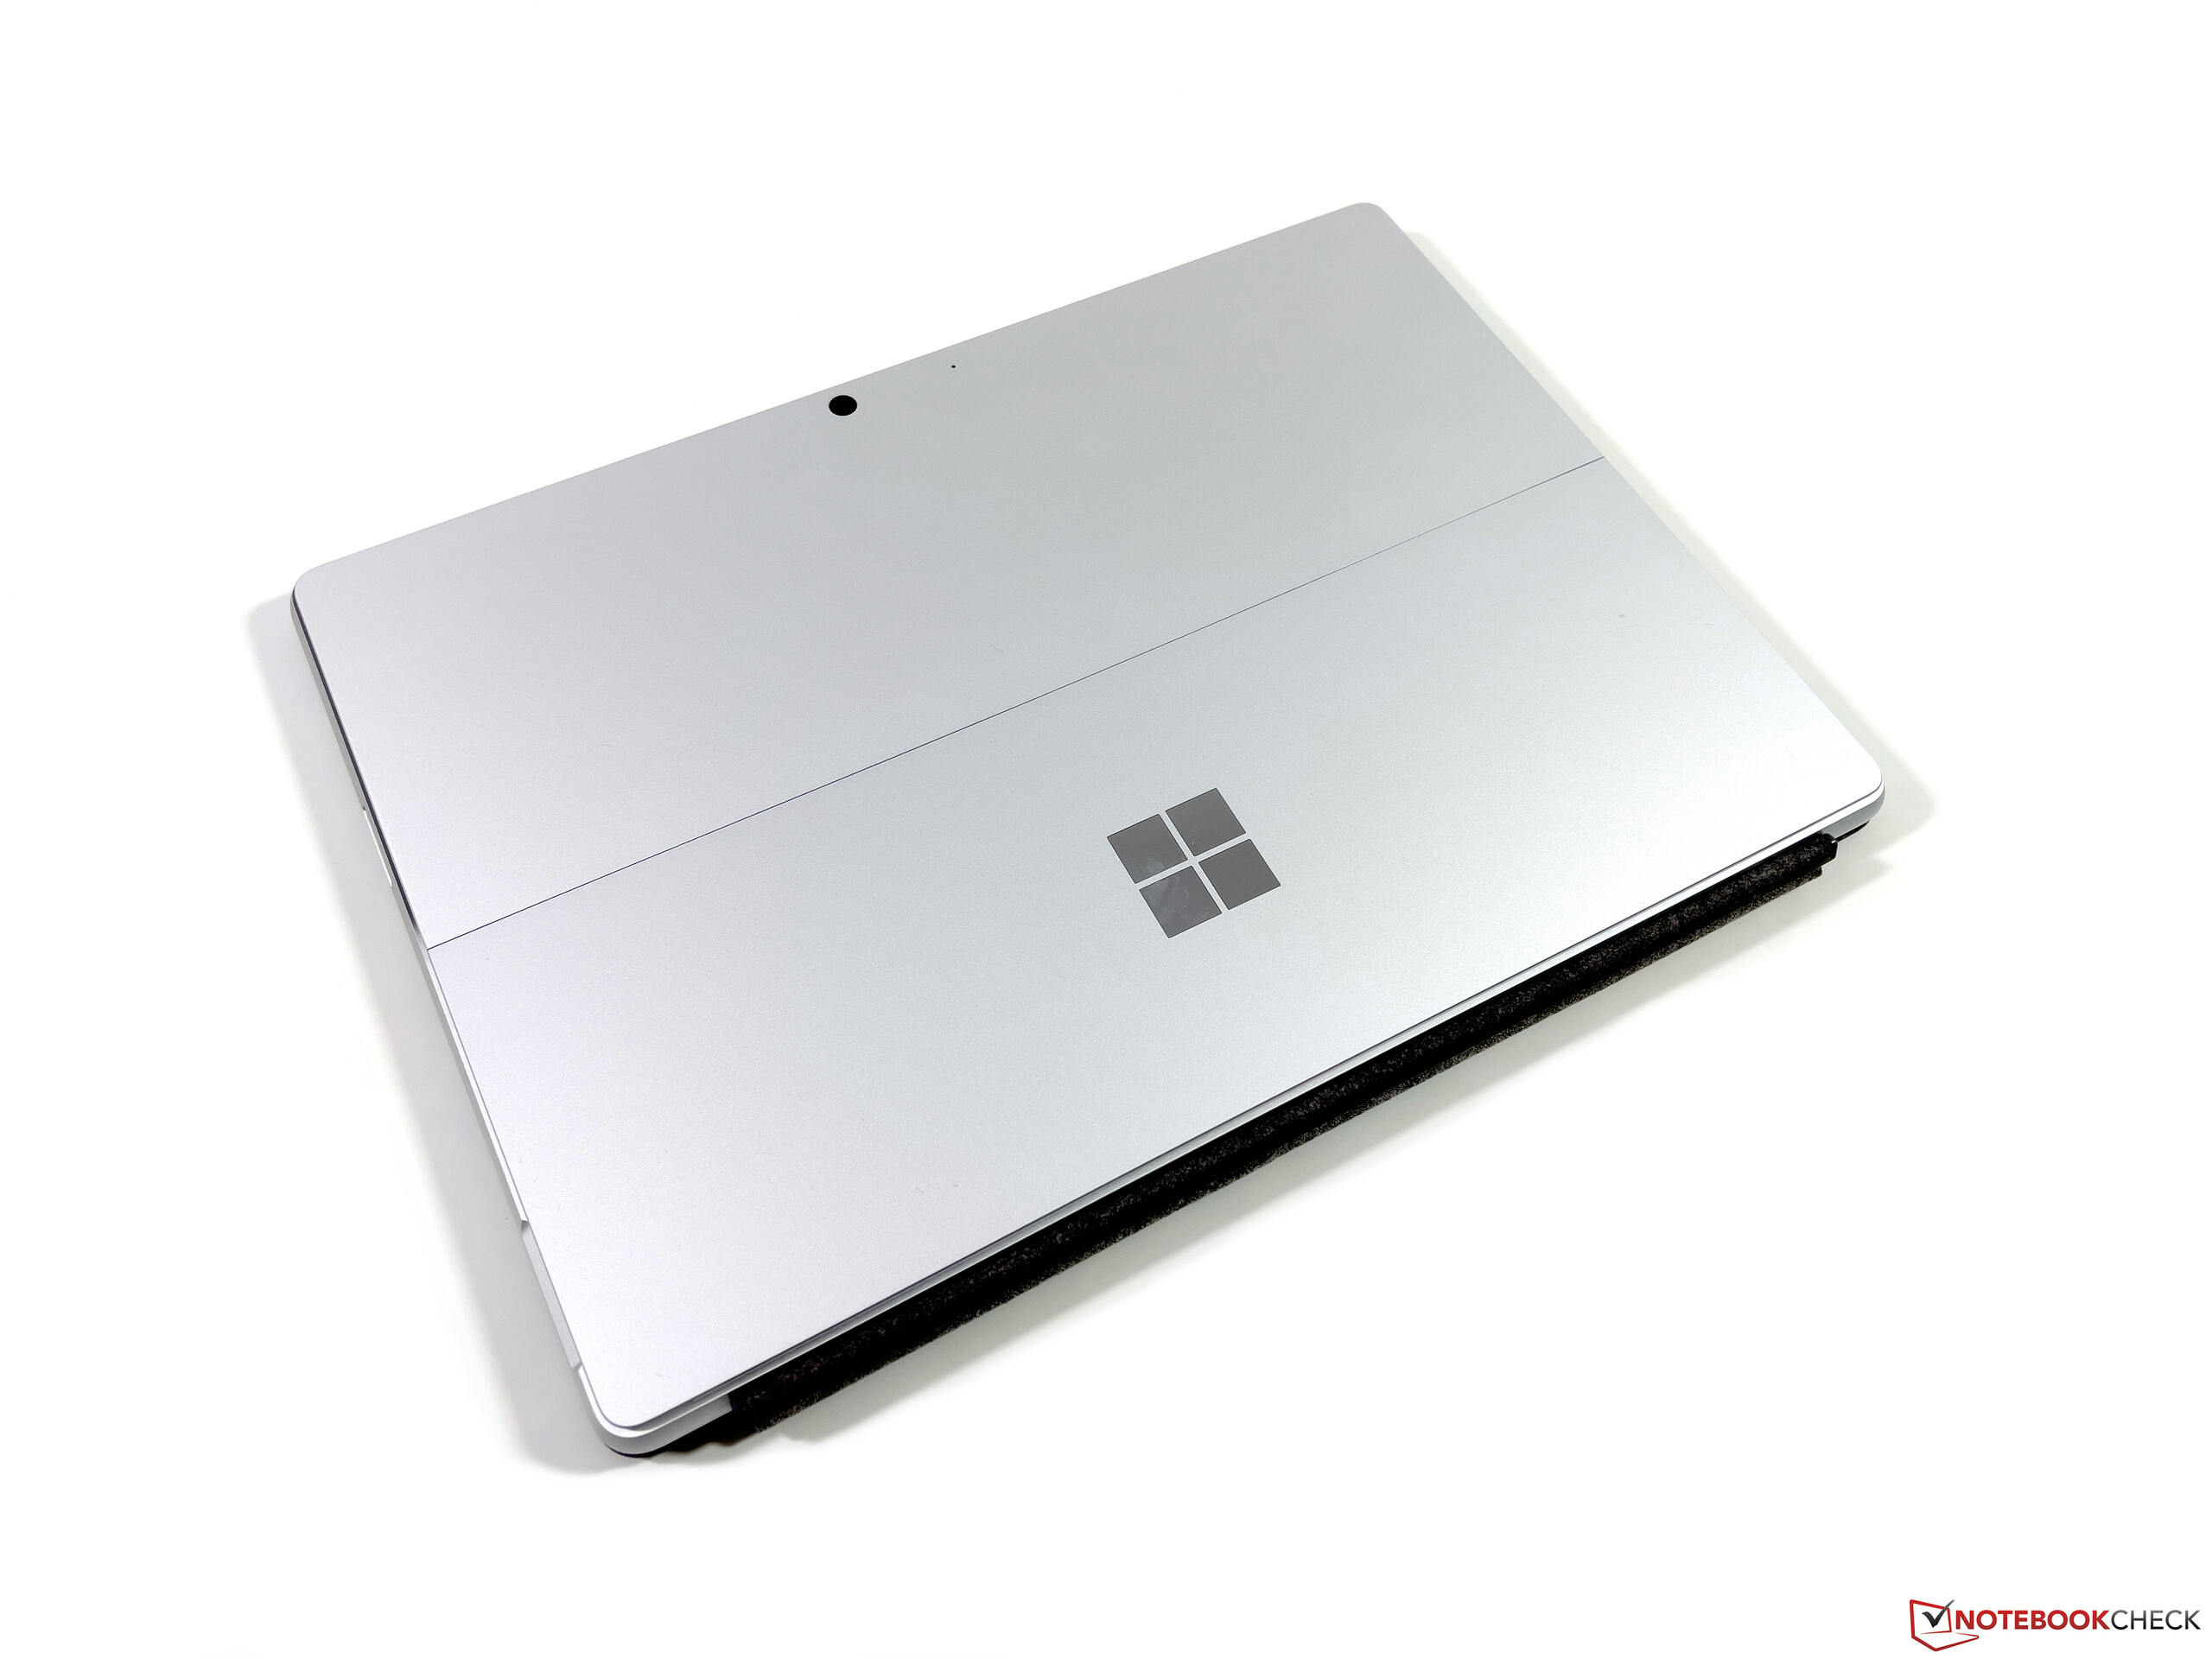
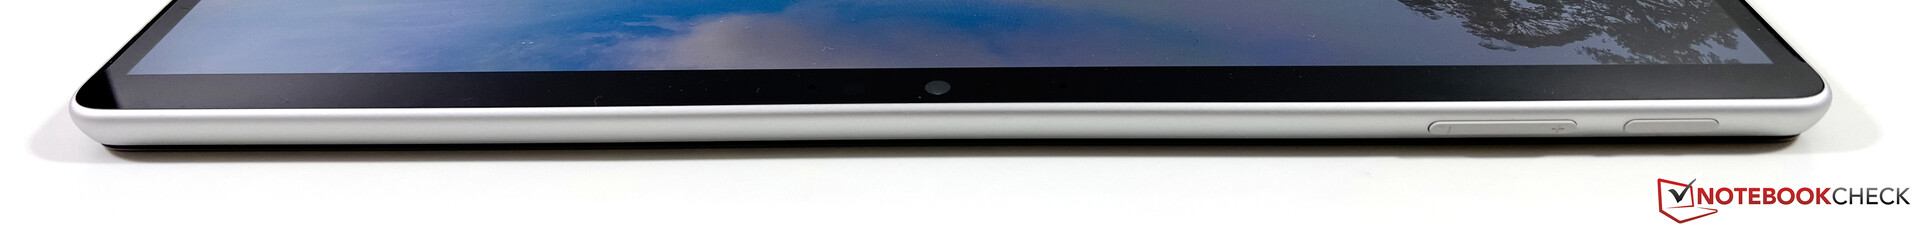
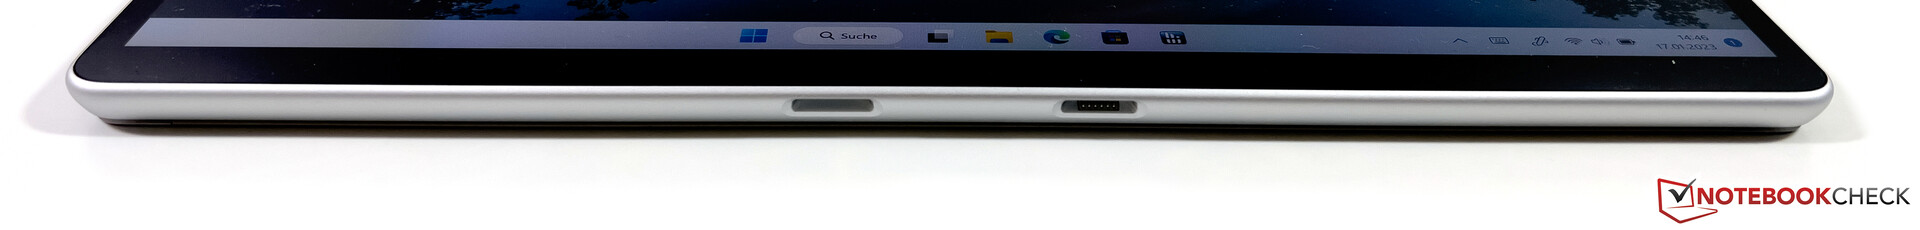
A prima vista, non è cambiato nulla nel case del Surface Pro 9, a parte la nuova disposizione delle porte. Il peso è leggermente diverso, quindi è probabile che siano state apportate piccole modifiche anche al layout interno. Microsoft offre il convertibile in quattro colori diversi, che vanno dall'argento (platino) del nostro dispositivo in prova, al blu zaffiro, dal verde bosco alla grafite (grigio scuro). Al contrario, il modello ARM è disponibile solo in color platino.
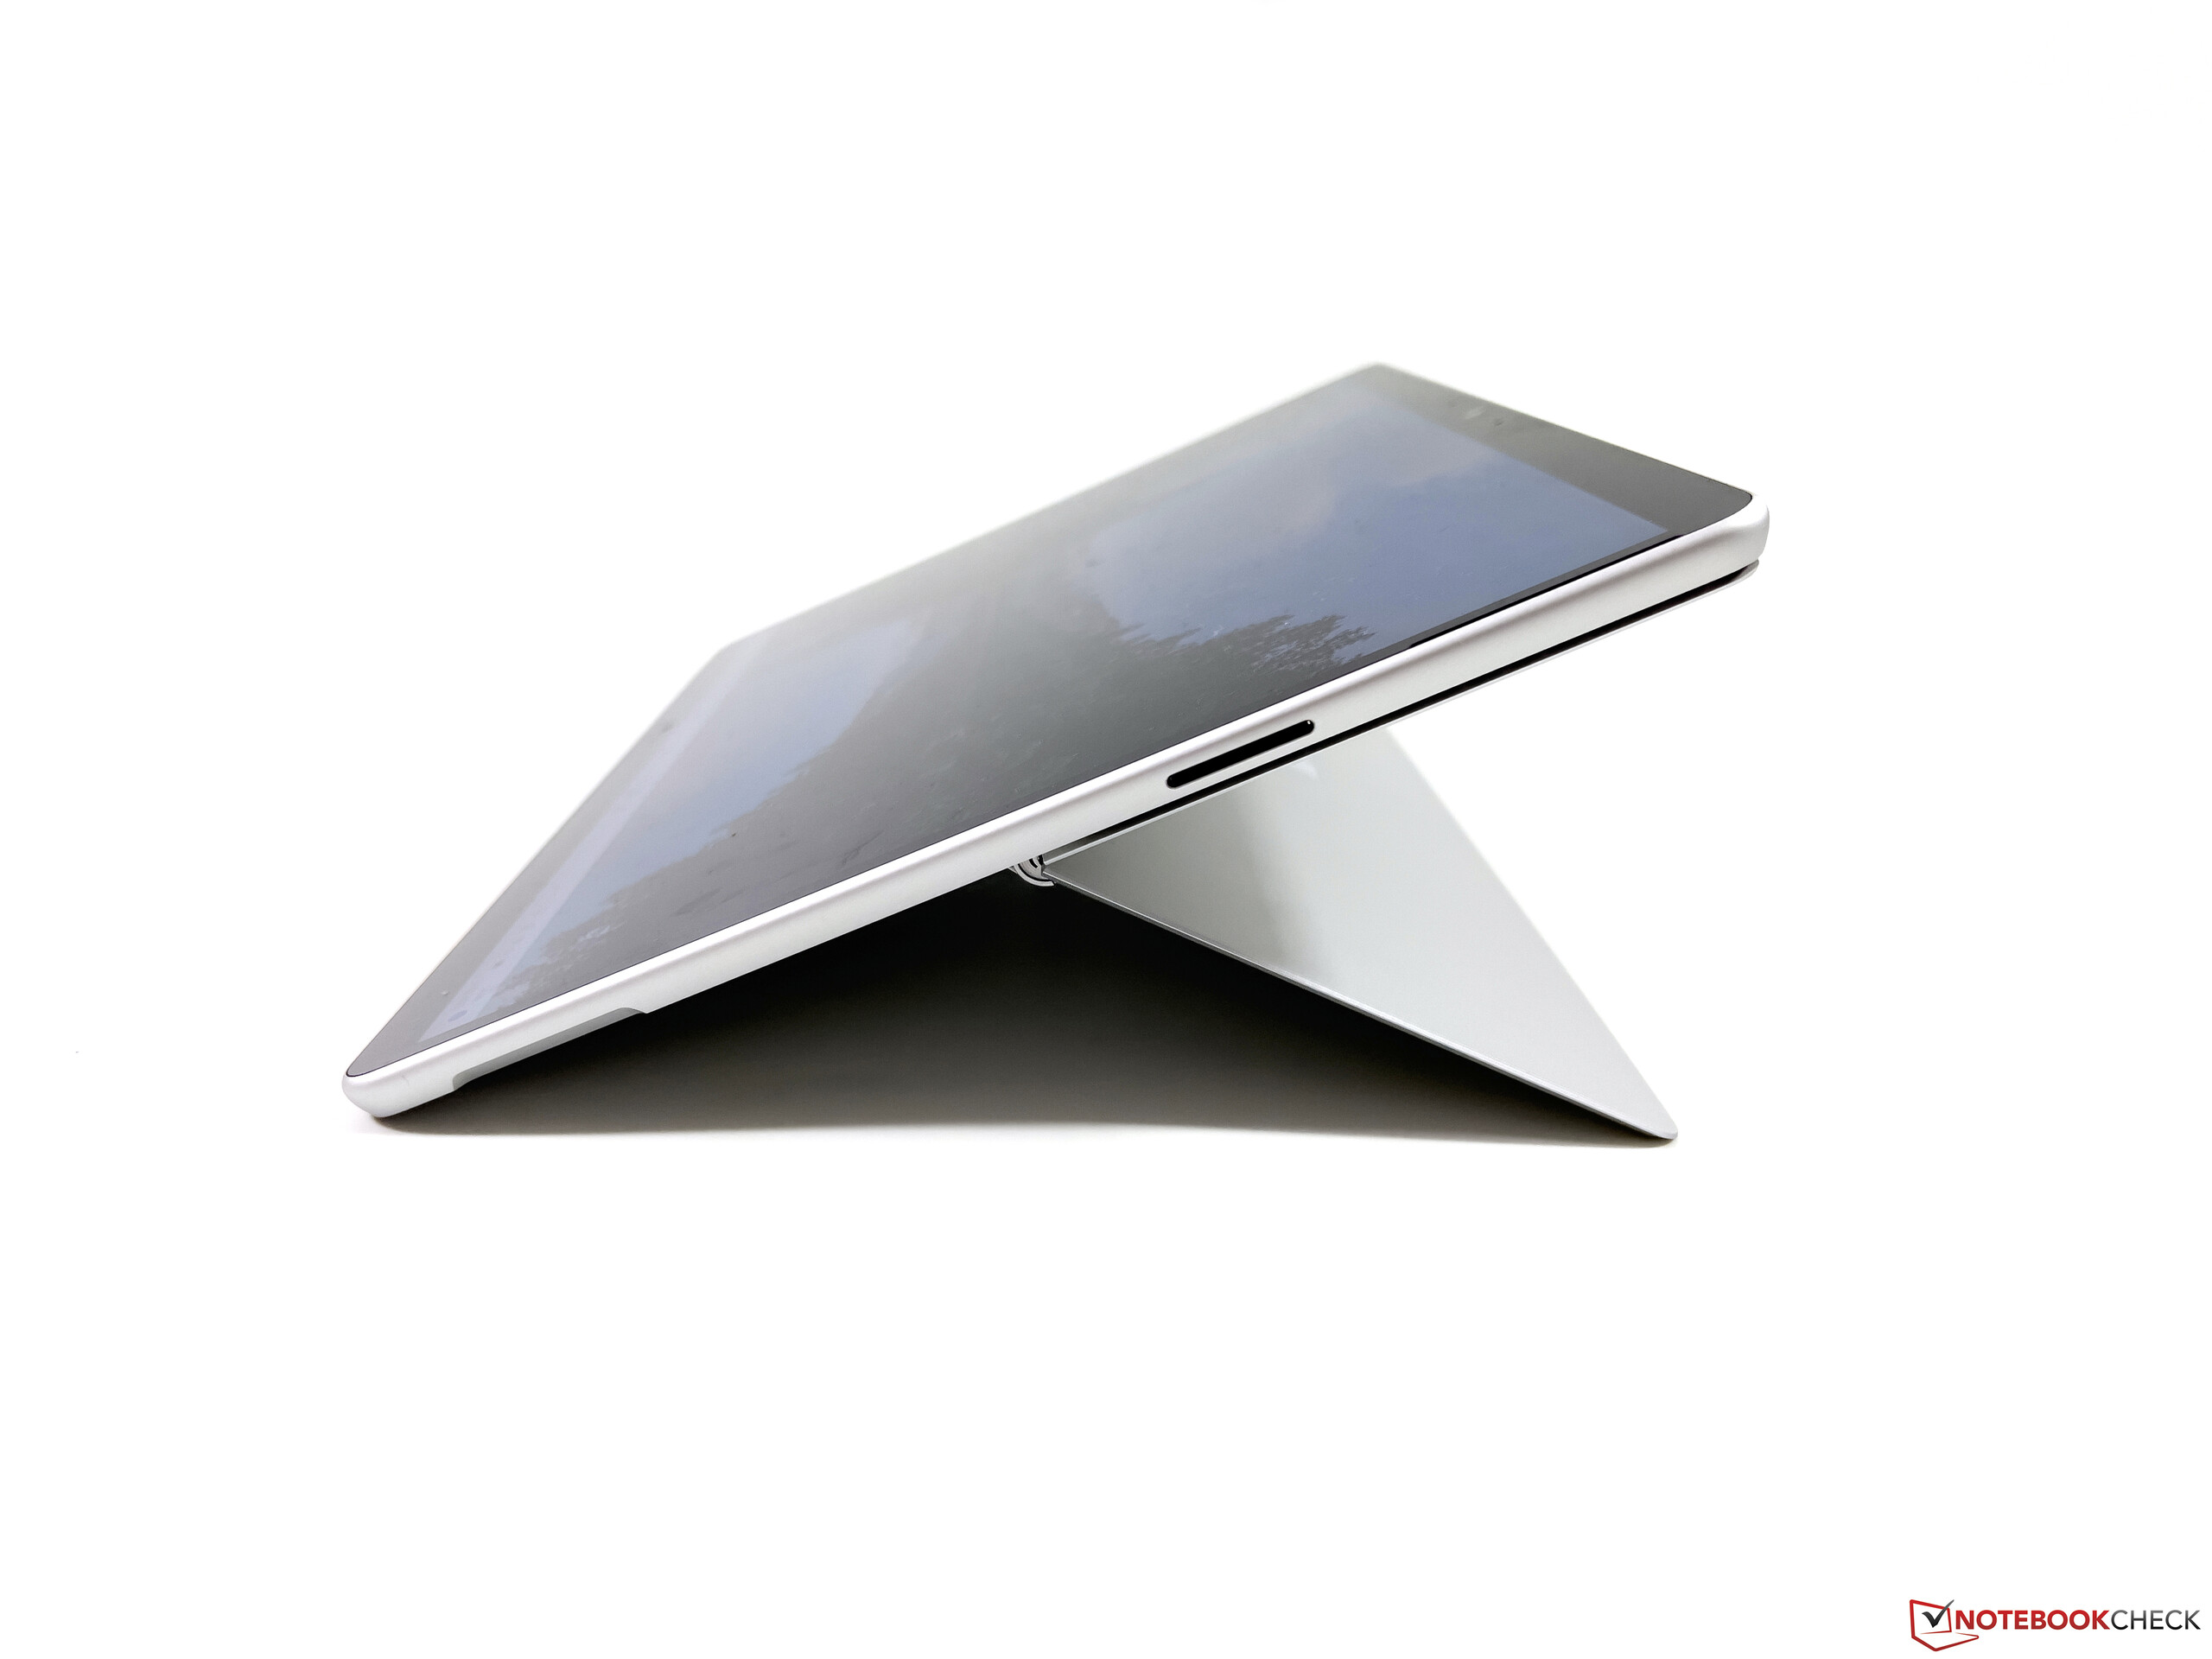
Come in precedenza, la qualità costruttiva è superba e il case in alluminio è estremamente robusto. Non ci sono scricchiolii o distorsioni dell'immagine, anche se la kickstand integrata continua a essere un punto debole. Il case è molto sottile, quindi i bordi premono rapidamente sulla pelle quando si appoggia il Surface Pro 9 sulle cosce, ad esempio. Il supporto è inoltre molto flessibile e le cerniere fanno sempre bene il loro lavoro.

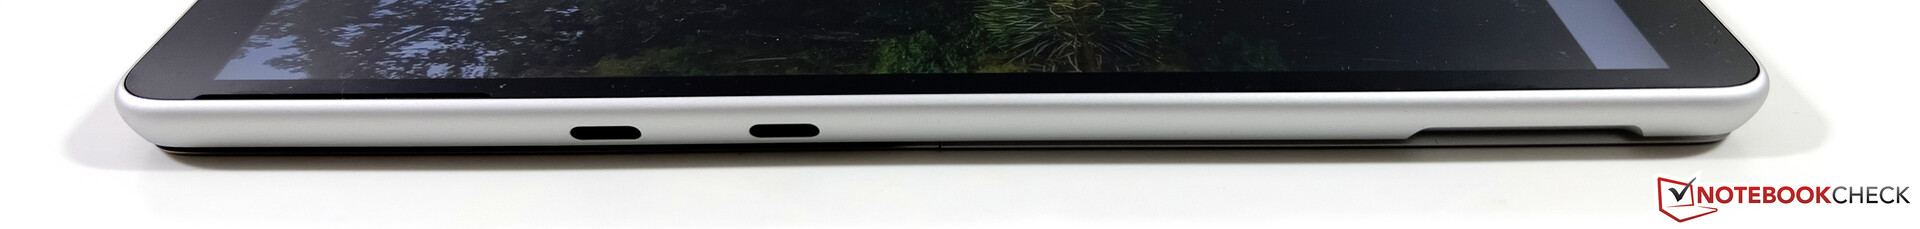
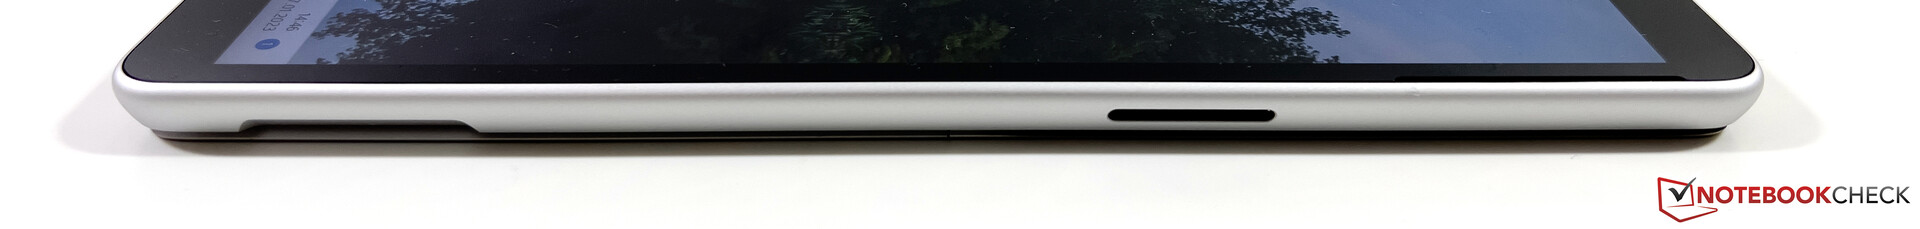
Apparecchiatura - Surface Pro con Thunderbolt 4
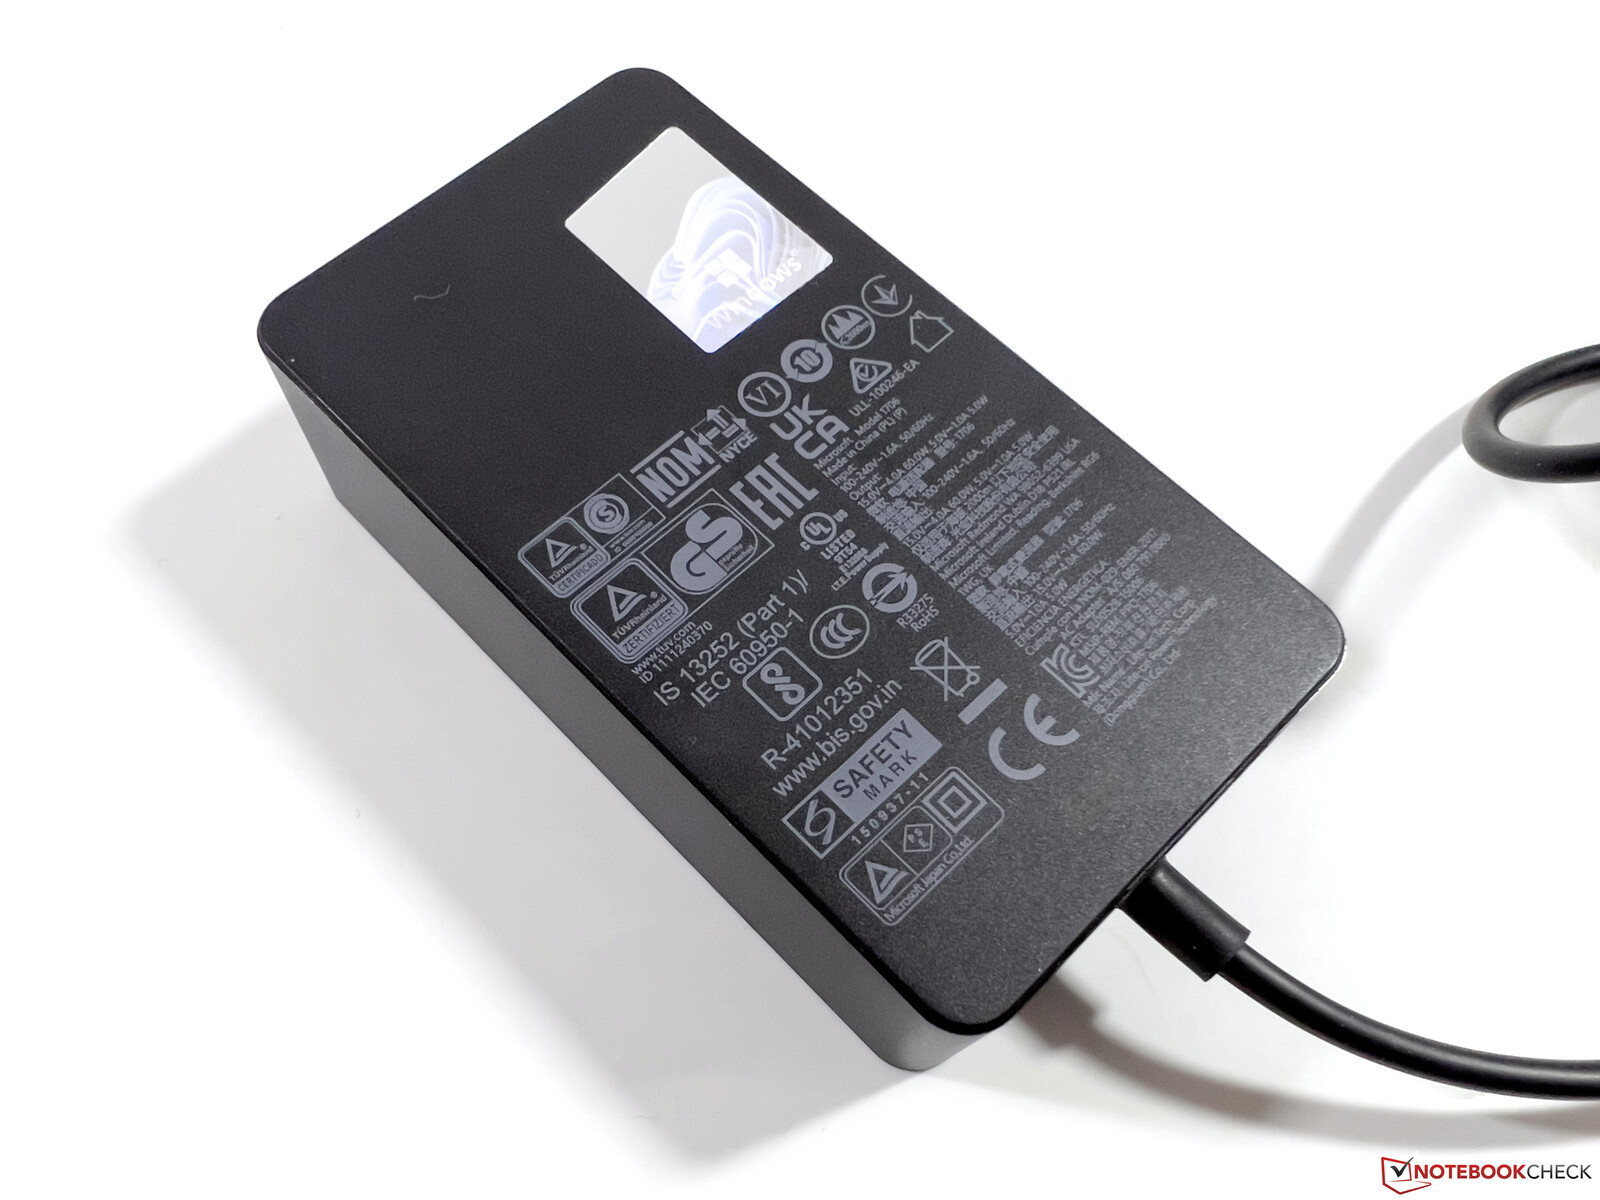
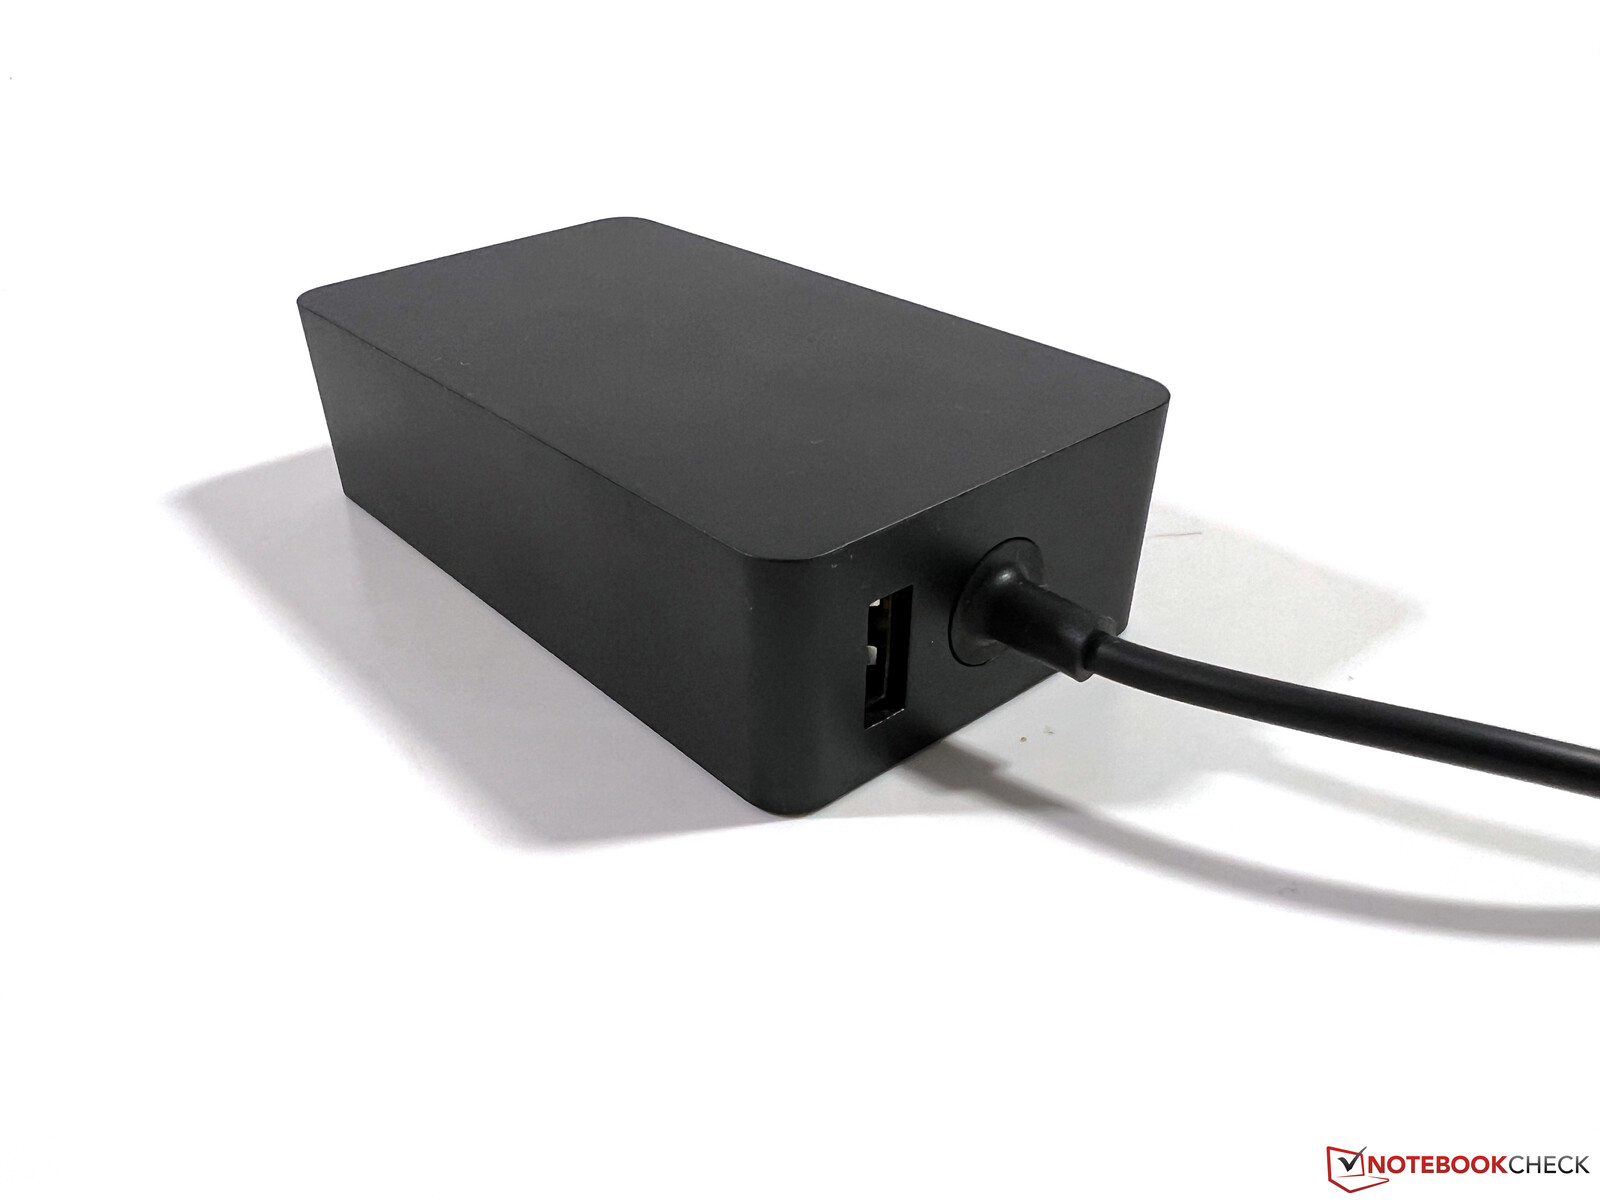
Le porte sono state riposizionate e rimangono 2 porte USB-C (inclusa Thunderbolt 4) e la porta proprietaria Surface Connect, ma Microsoft ha rimosso il jack da 3,5 mm. L'alimentatore in dotazione utilizza la porta Surface Connect, ma il convertibile può essere ricaricato anche tramite USB-C. Un po' deludente è la continua mancanza di un lettore di schede, che nell'ultimo modello era stato sostituito dallo slot Nano SIM opzionale. Poiché il modello Intel non è più dotato di modulo WWAN, Microsoft avrebbe potuto facilmente installare un lettore di schede micro SD.
Comunicazione
Come già detto, solo la variante ARM del Surface Pro 9 offre Internet mobile, mentre la versione Intel non lo fa. Almeno il modulo WLAN è stato aggiornato e il moderno standard WiFi 6E è ora supportato grazie al modulo AX211 di Intel. Siamo riusciti a connetterci alla rete a 6 GHZ del nostro router di riferimento Asus senza problemi, con velocità di trasferimento molto elevate e stabili.
| Networking | |
| Microsoft Surface Pro 9, i7-1255U | |
| iperf3 receive AXE11000 6GHz | |
| iperf3 transmit AXE11000 6GHz | |
| Dell XPS 13 9315 2-in-1 Core i5-1230U | |
| iperf3 receive AXE11000 6GHz | |
| iperf3 transmit AXE11000 6GHz | |
| Lenovo ThinkPad X12 20UVS03G00 | |
| iperf3 transmit AX12 | |
| iperf3 receive AX12 | |
| HP Elite Dragonfly Folio 13.5 G3 | |
| iperf3 receive AXE11000 6GHz | |
| iperf3 receive AXE11000 | |
| iperf3 transmit AXE11000 6GHz | |
| iperf3 transmit AXE11000 | |
| Apple iPad Pro 12.9 2022 | |
| iperf3 receive AXE11000 6GHz | |
| iperf3 receive AXE11000 | |
| iperf3 transmit AXE11000 6GHz | |
| iperf3 transmit AXE11000 | |
| Asus ROG Flow Z13 GZ301ZE | |
| iperf3 transmit AX12 | |
| iperf3 receive AX12 | |
| Microsoft Surface Pro 8, i7-1185G7 | |
| iperf3 transmit AX12 | |
| iperf3 receive AX12 | |
Webcam
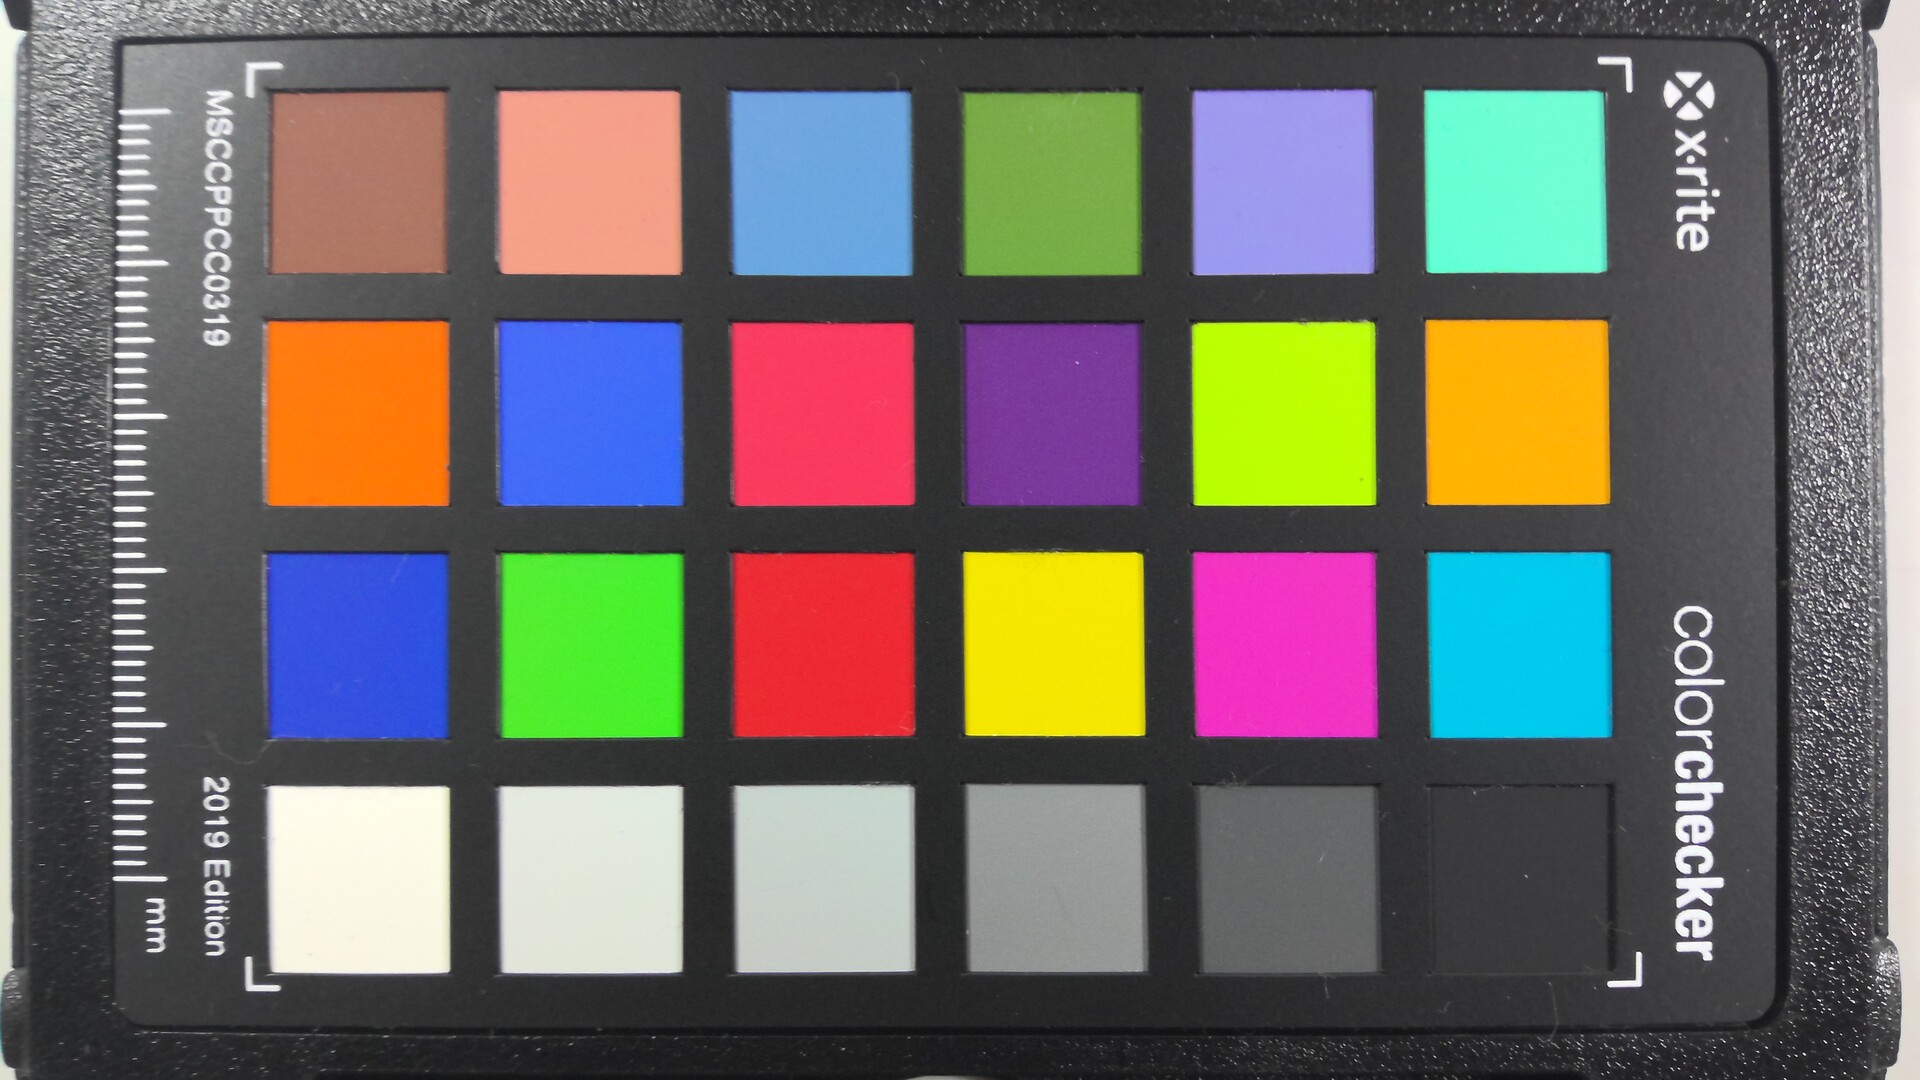
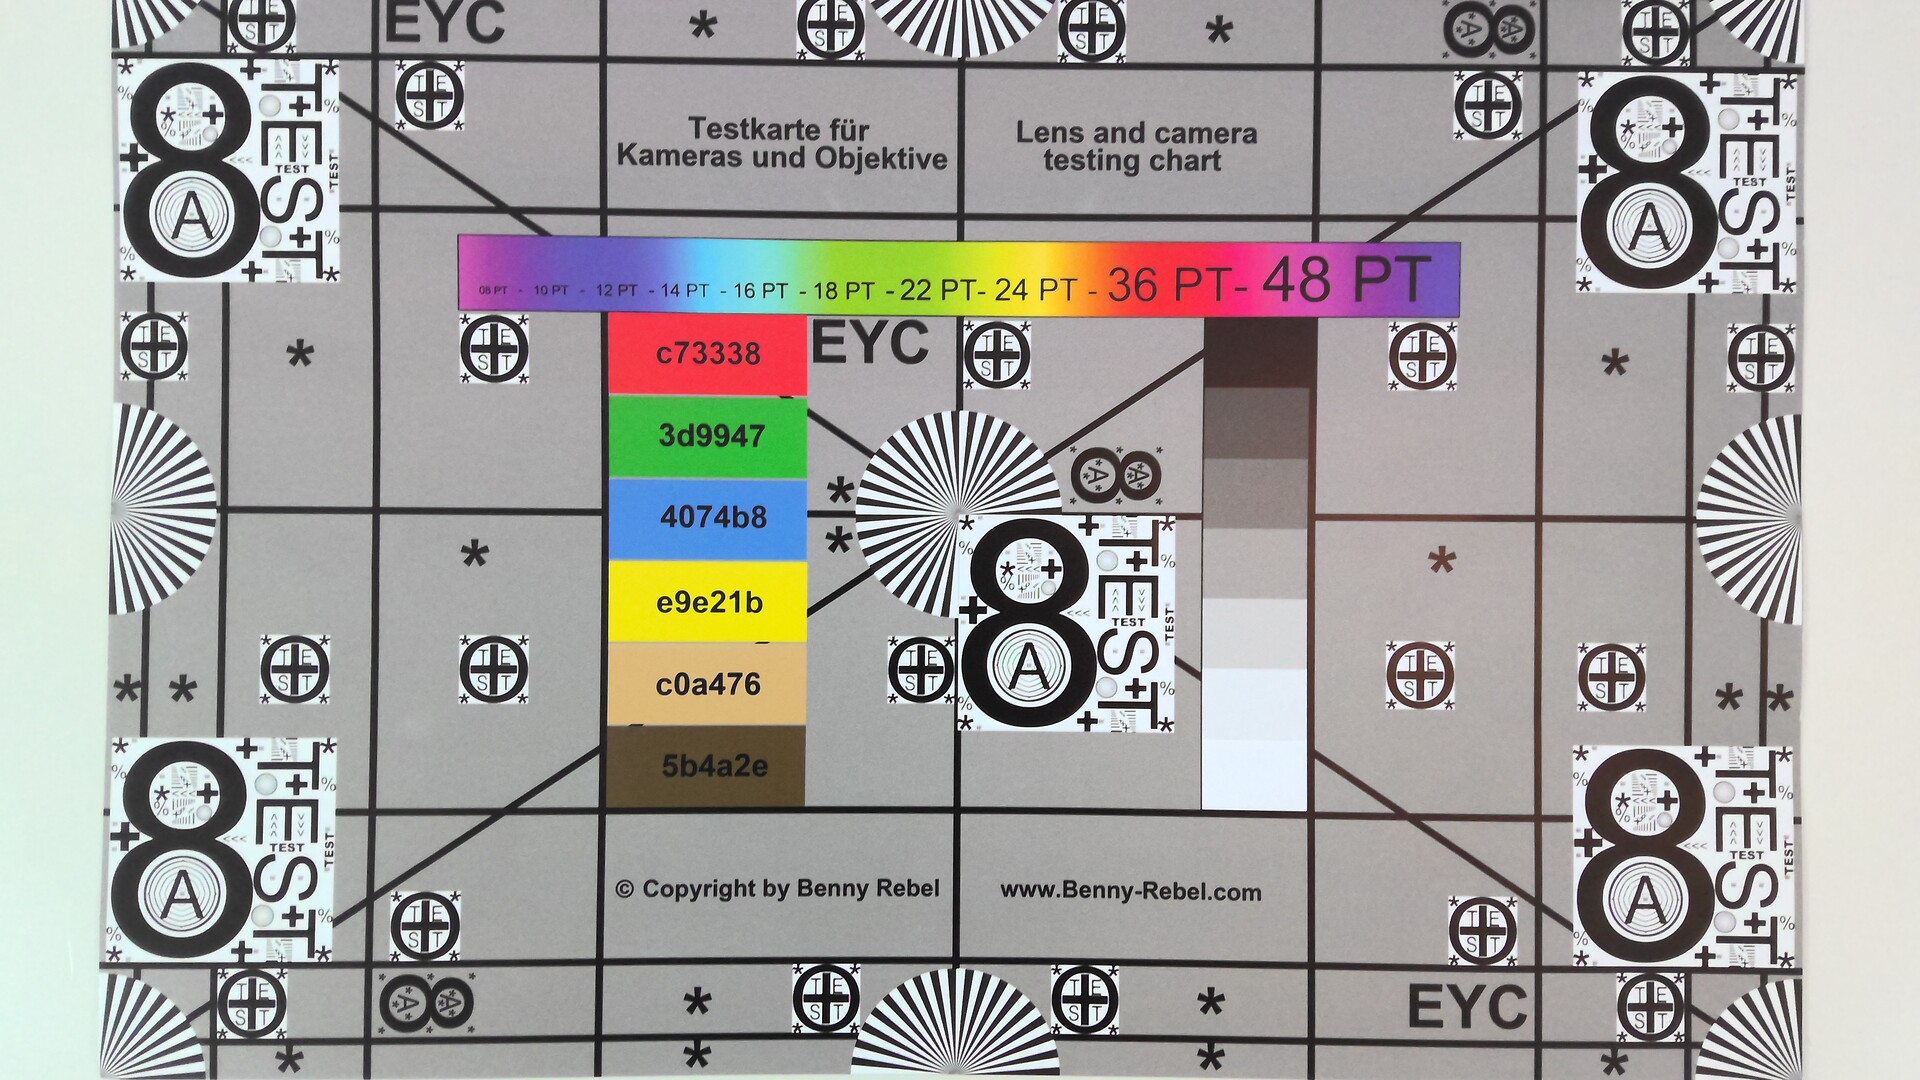
Non sono state apportate modifiche alla configurazione della webcam, con una fotocamera da 5 MP sul fronte e una da 10 MP sul retro. Il Surface Pro 9 rimane quindi tra i migliori dispositivi Windows in termini di prestazioni della fotocamera. Nella variante ARM del Surface Pro 9 sono disponibili ancora più funzioni della fotocamera, come il soft focus (o effetto bokeh) per lo sfondo, il contatto visivo automatico o il ritaglio automatico dell'immagine.


Manutenzione
Come in precedenza, il Surface Pro 9 offre agli utenti la possibilità di sostituire l'unità SSD compatta M.2-2230 e Microsoft ha reso questo processo ancora più semplice, poiché non sono più necessari strumenti SIM per aprire il coperchio. Al contrario, c'è un piccolo incavo in cui si spinge il dito, che apre il lato opposto (tenuto in posizione magneticamente) e consente di rimuovere facilmente il coperchio. Tuttavia, i restanti componenti interni non sono accessibili.
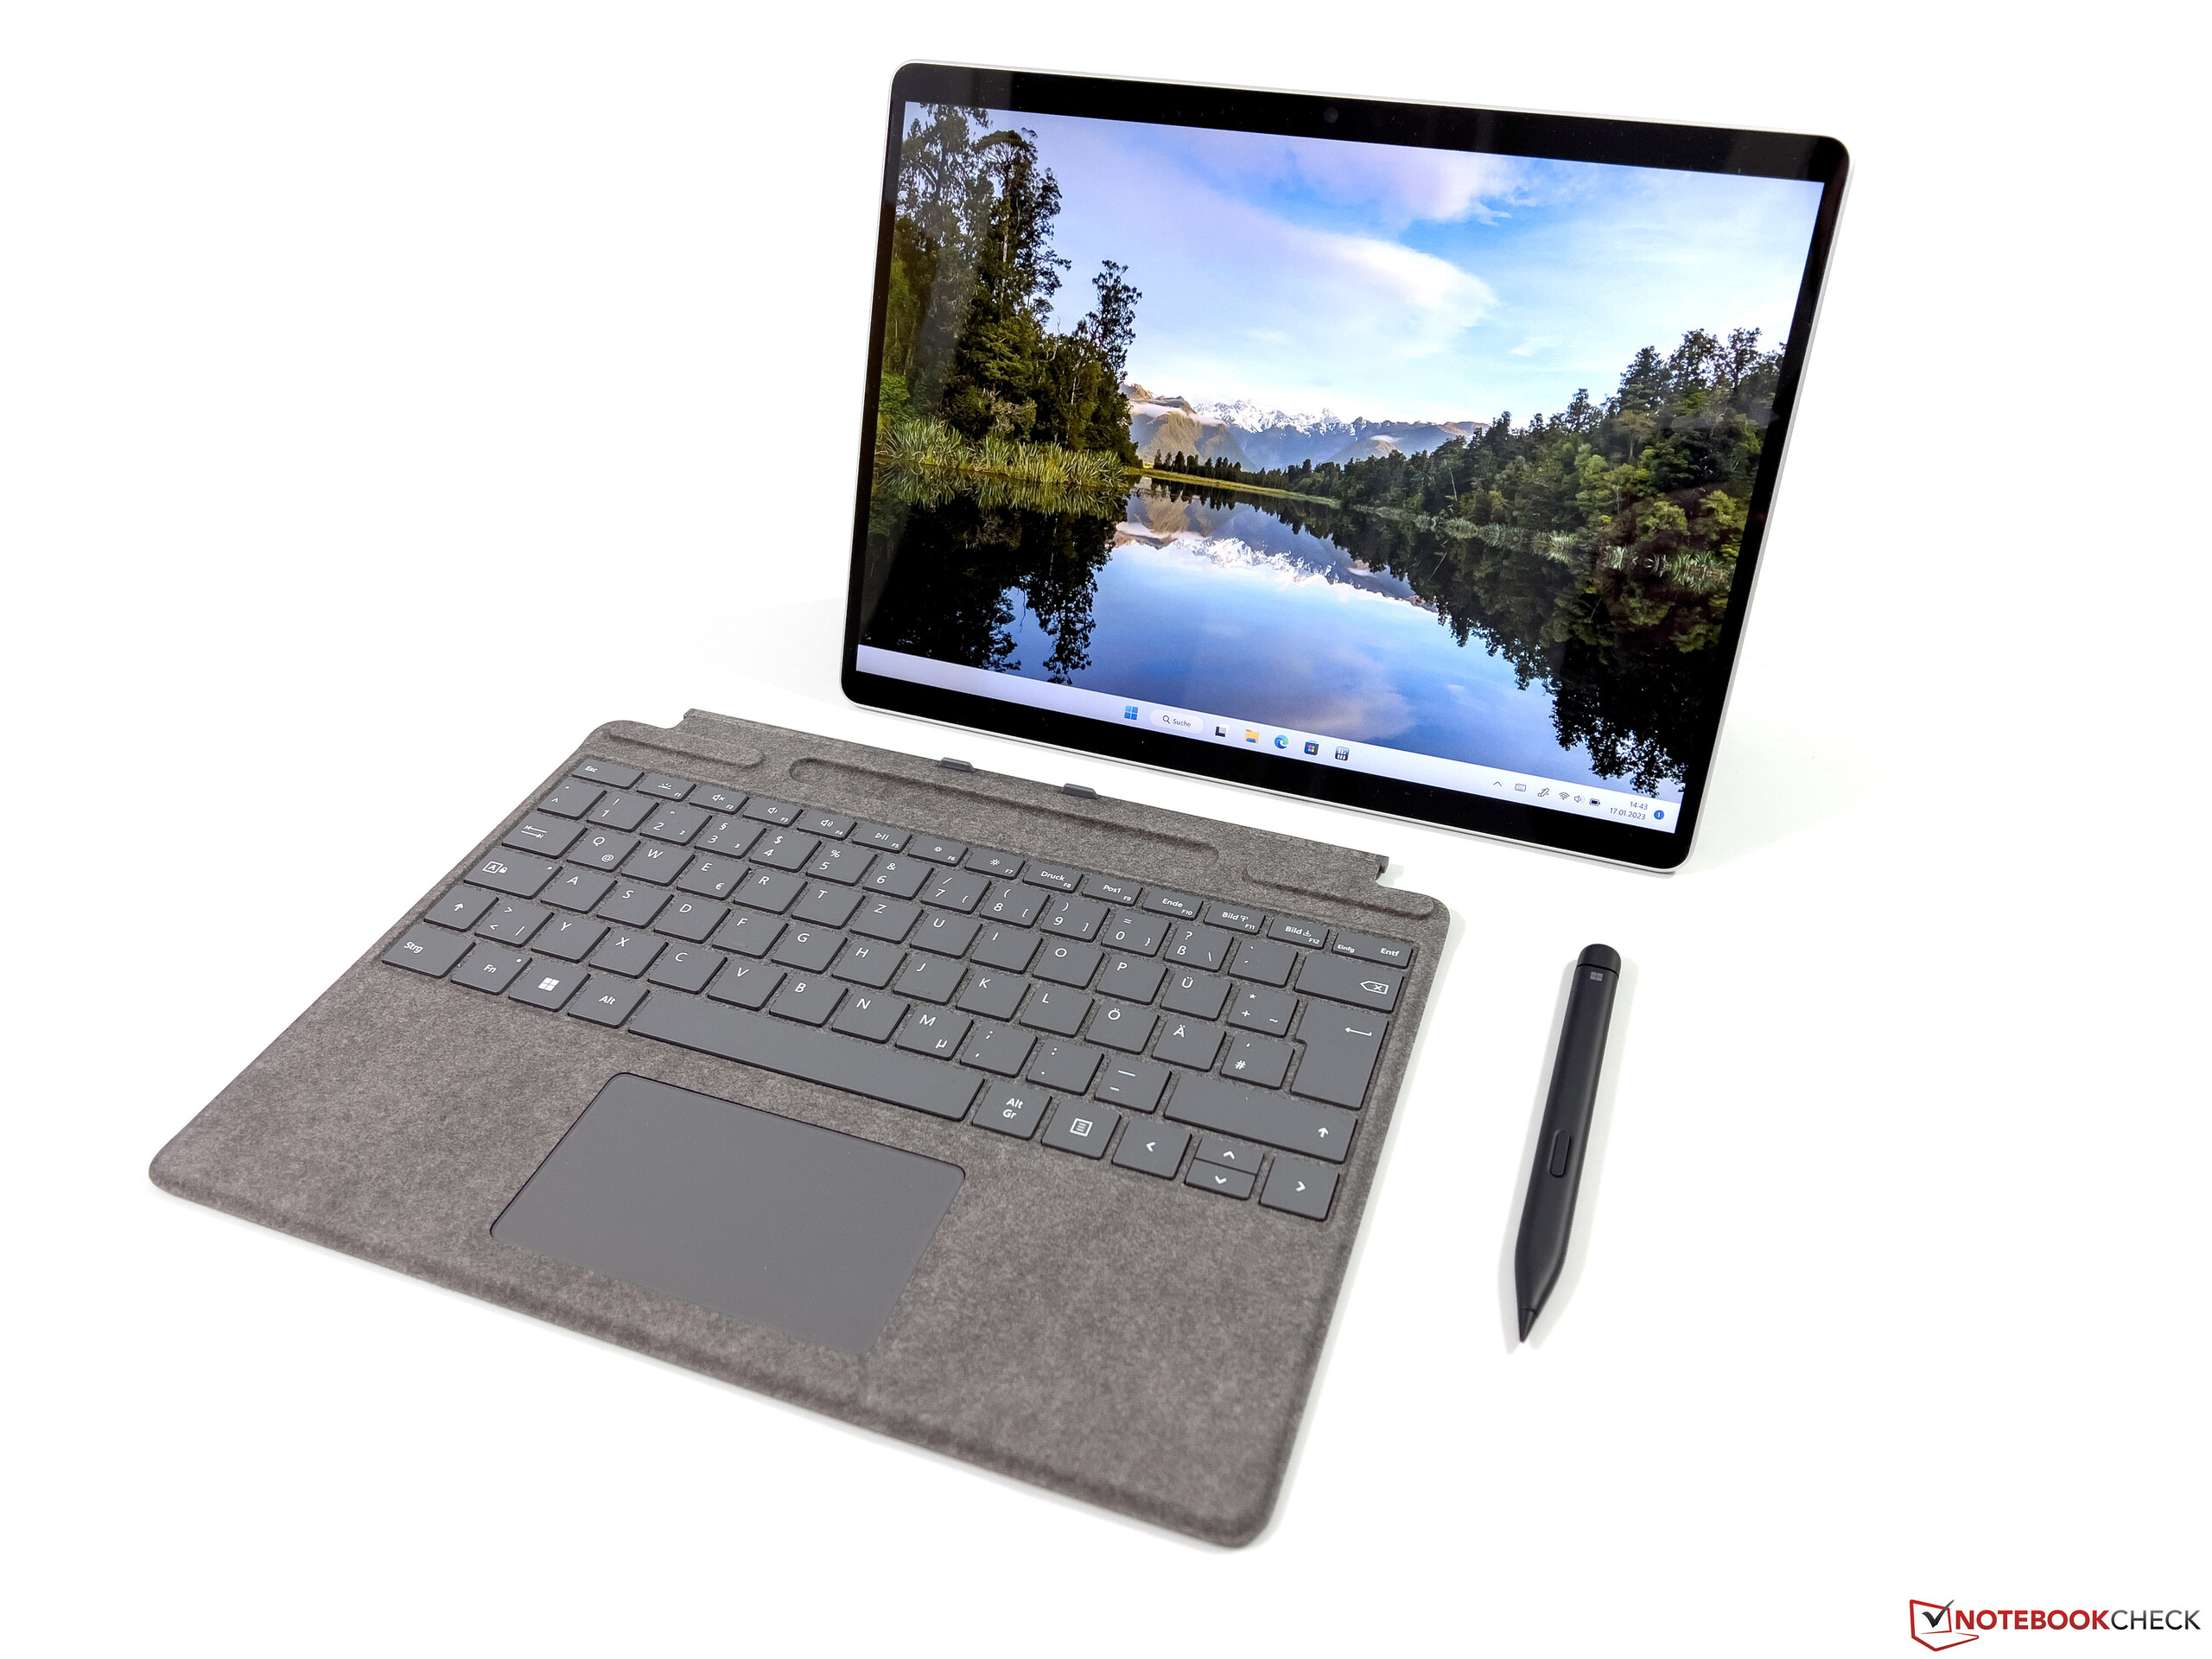
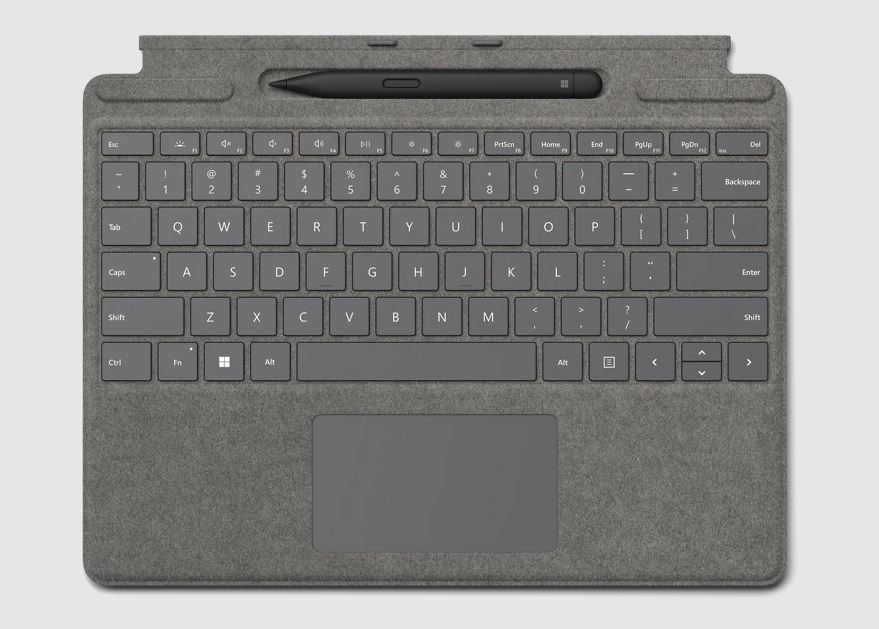
Dispositivi di input - La tastiera Signature Keyboard rimane invariata
Poiché le dimensioni del Surface Pro non sono cambiate, Microsoft continua a offrire due diverse cover per tastiera. Come per l'ultimo modello, abbiamo di nuovo la Signature Keyboard e la Slim Pen 2, che può essere riposta e ricaricata all'interno della tastiera. Lo stilo continua a funzionare molto bene e supporta anche il feedback aptico. Tuttavia, la penna non è più così ergonomica a causa della sua forma appiattita.
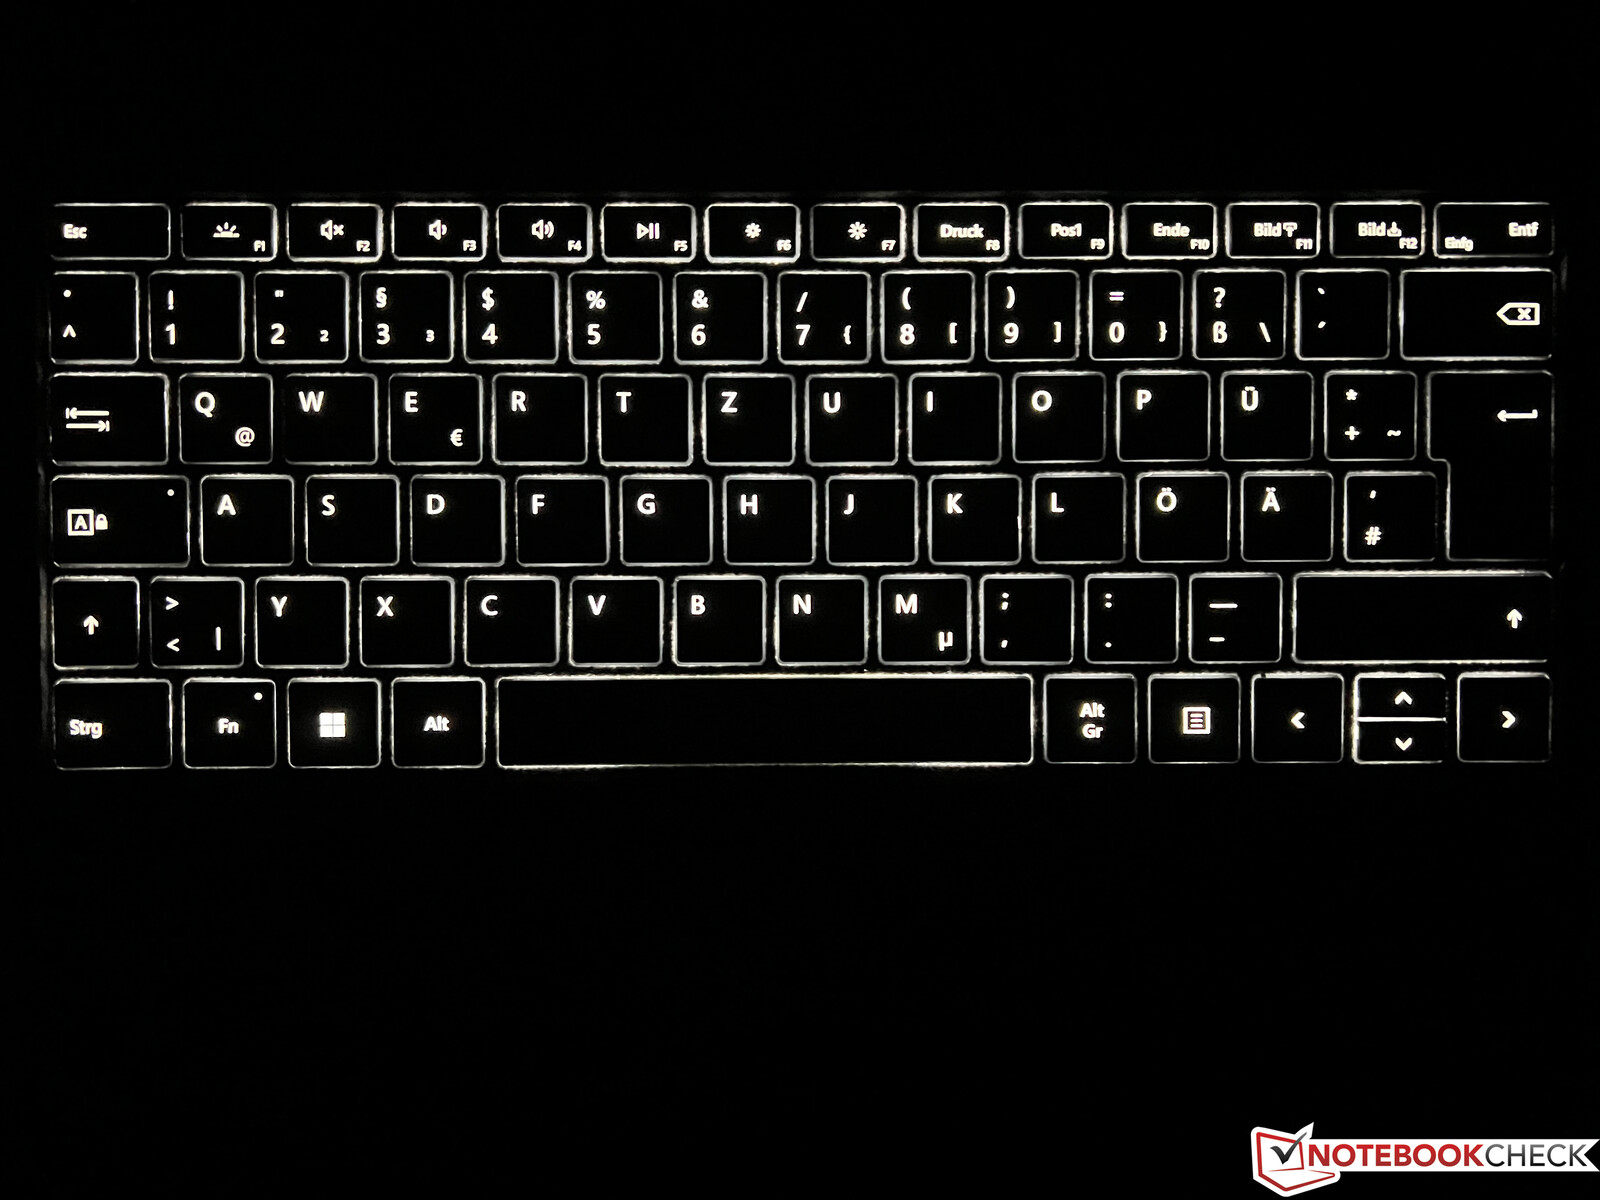
La tastiera offre una discreta sensazione di digitazione ed è anche retroilluminata. Inoltre, la tastiera può essere posizionata con una leggera angolazione (grazie ai magneti), ma la stabilità diventa limitata. In particolare, quando si è in movimento, il comfort di digitazione non è neanche lontanamente paragonabile a quello di un normale computer portatile, e il Surface richiede un'ampia area di posizionamento a causa delle cerniere integrate (ma questo vale anche per la maggior parte dei convertibili con copritastiera).
Display - IPS 3:2 a 120 Hz
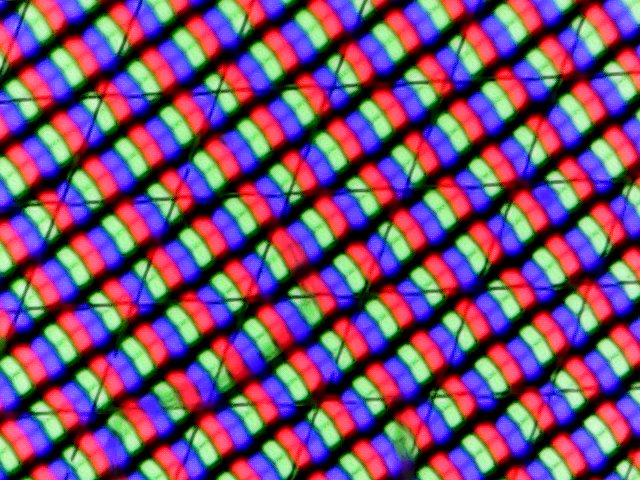
Nulla è cambiato nelle caratteristiche fondamentali del display, che rimane un touchscreen IPS in formato 3:2, offre una risoluzione di 2880 x 1920 (267 PPI) e una frequenza di aggiornamento fino a 120 Hz. i 60 Hz sono preimpostati come frequenza predefinita, quindi i 120 Hz devono essere selezionati manualmente nelle impostazioni. La nostra impressione soggettiva dello schermo lucido è ancora molto buona. Grazie ai sensori, la luminosità e la temperatura del colore vengono regolate automaticamente e anche questo funziona bene.
Il pannello proviene ancora una volta da LG Philips, ma l'ID del pannello è cambiato. Fondamentalmente i valori sono paragonabili, in quanto la luminosità massima si aggira nuovamente intorno ai 450 cd/m². Il livello del nero è leggermente migliore, ed è anche per questo che il rapporto di contrasto, pari a quasi 1.200:1, appare leggermente migliore. Ma i dispositivi della concorrenza fanno meglio, soprattutto in termini di contrasto, come il Mini-LED-Display dell'iPad Pro.
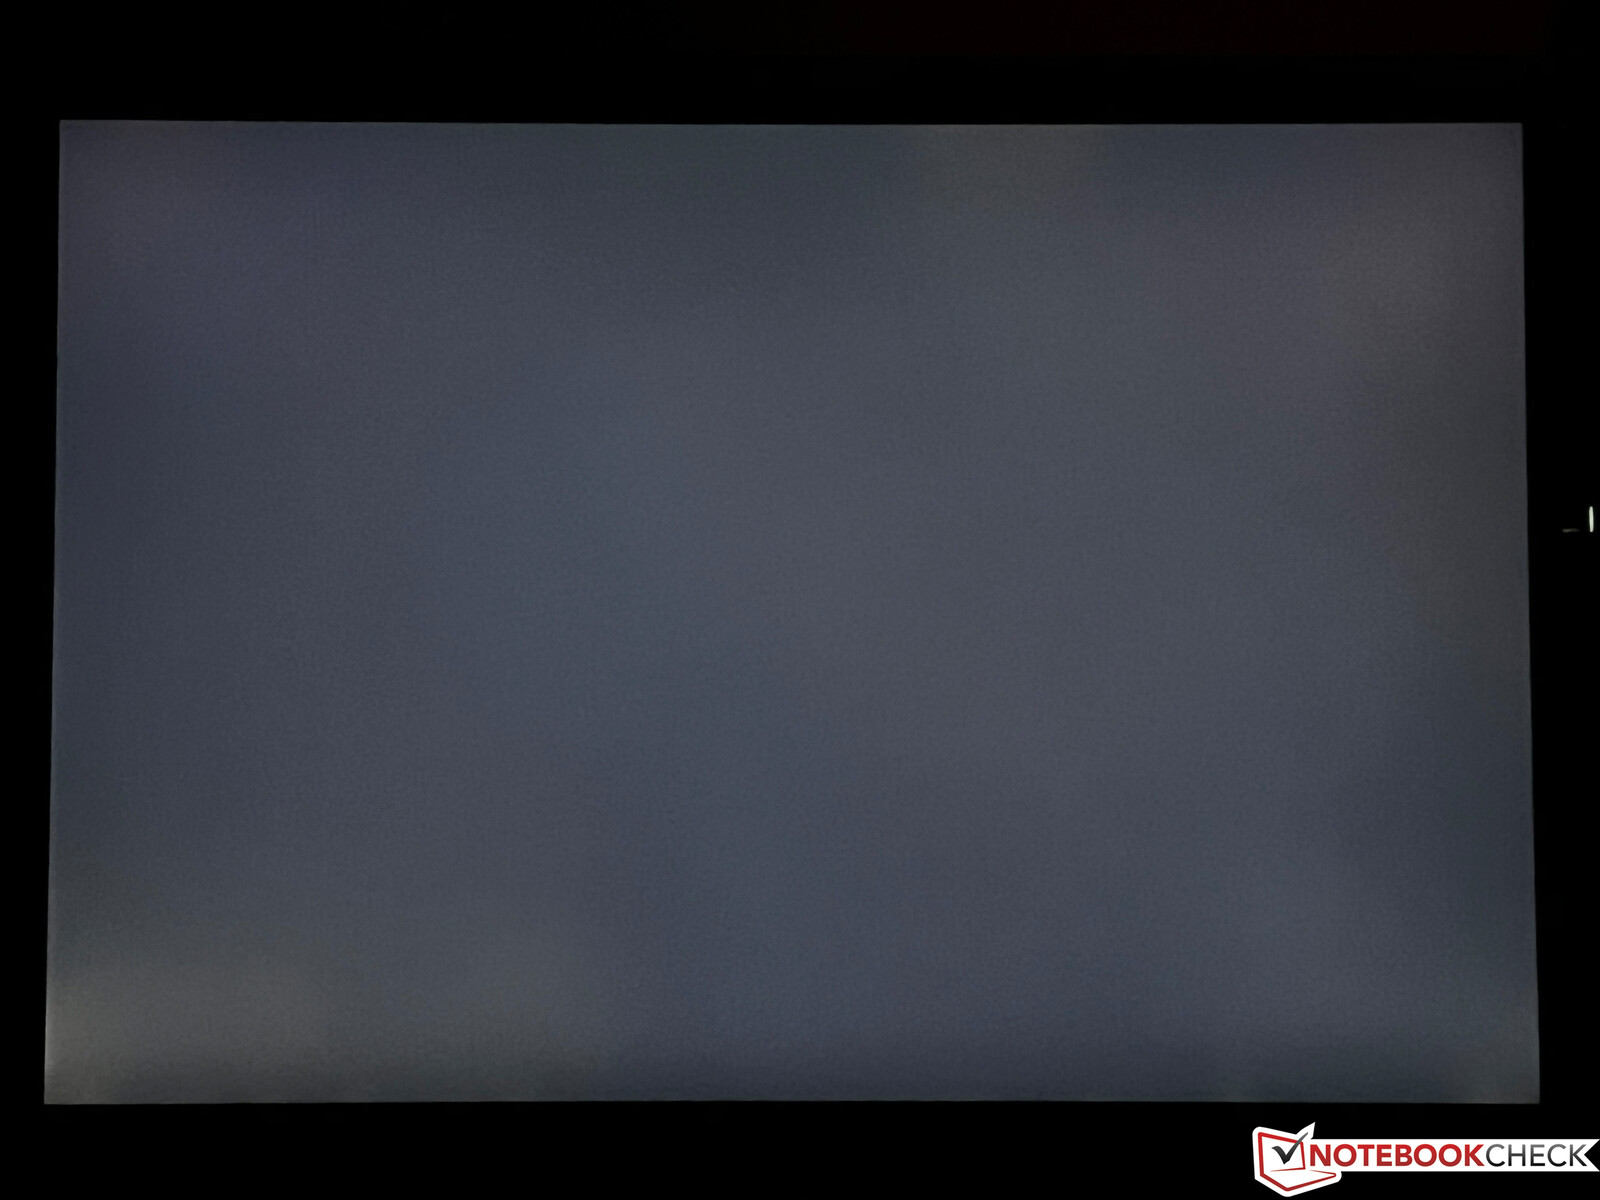
Non è presente il classico sfarfallio PWM, ma ancora una volta abbiamo registrato uno sfarfallio a ~30 KHz a una luminosità del 55% o inferiore. Ma questo non dovrebbe essere un problema, data l'alta frequenza. Questo vale anche per gli aloni, perché solo alla massima luminosità notiamo un punto leggermente più luminoso in basso a sinistra di uno schermo scuro.
| |||||||||||||||||||||||||
Distribuzione della luminosità: 94 %
Al centro con la batteria: 454 cd/m²
Contrasto: 1197:1 (Nero: 0.38 cd/m²)
ΔE ColorChecker Calman: 1.7 | ∀{0.5-29.43 Ø4.71}
calibrated: 1.5
ΔE Greyscale Calman: 1.5 | ∀{0.09-98 Ø4.96}
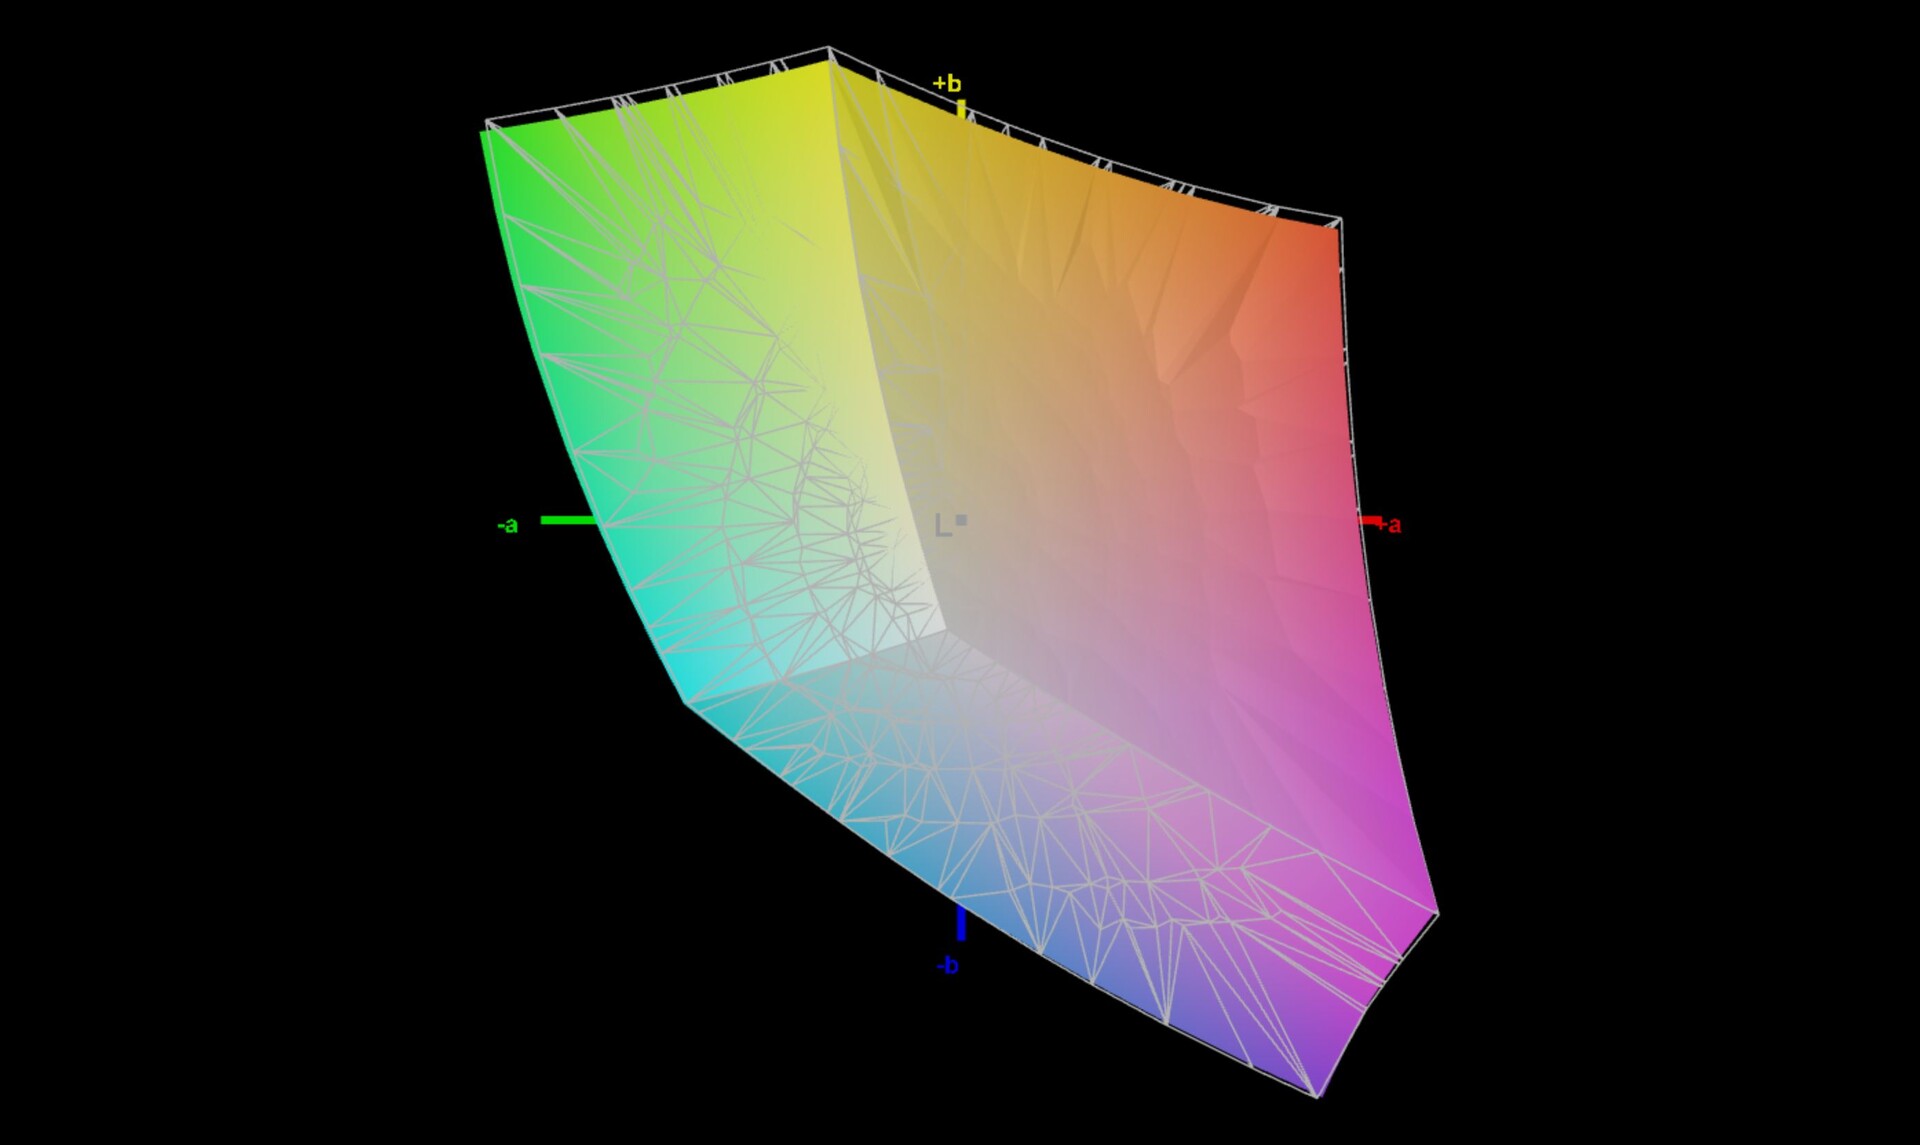
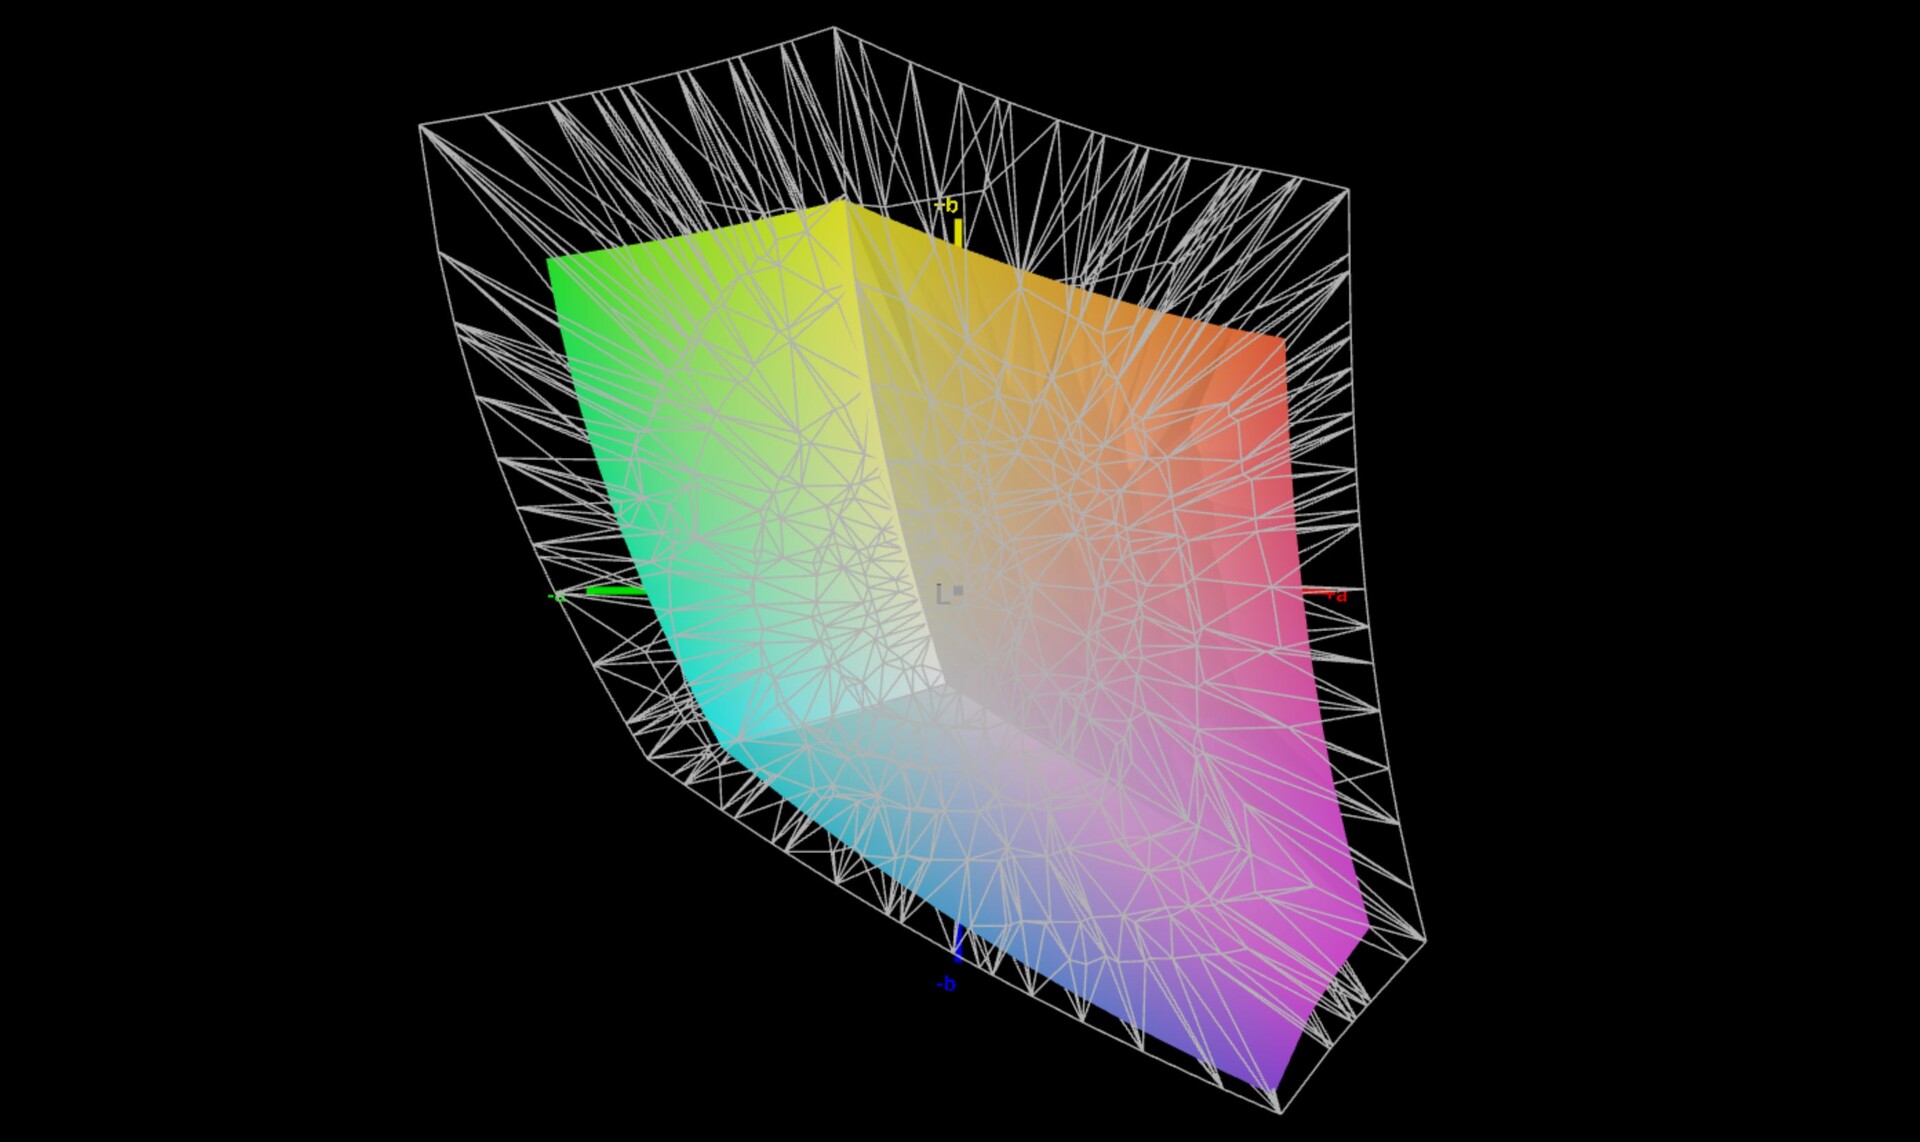
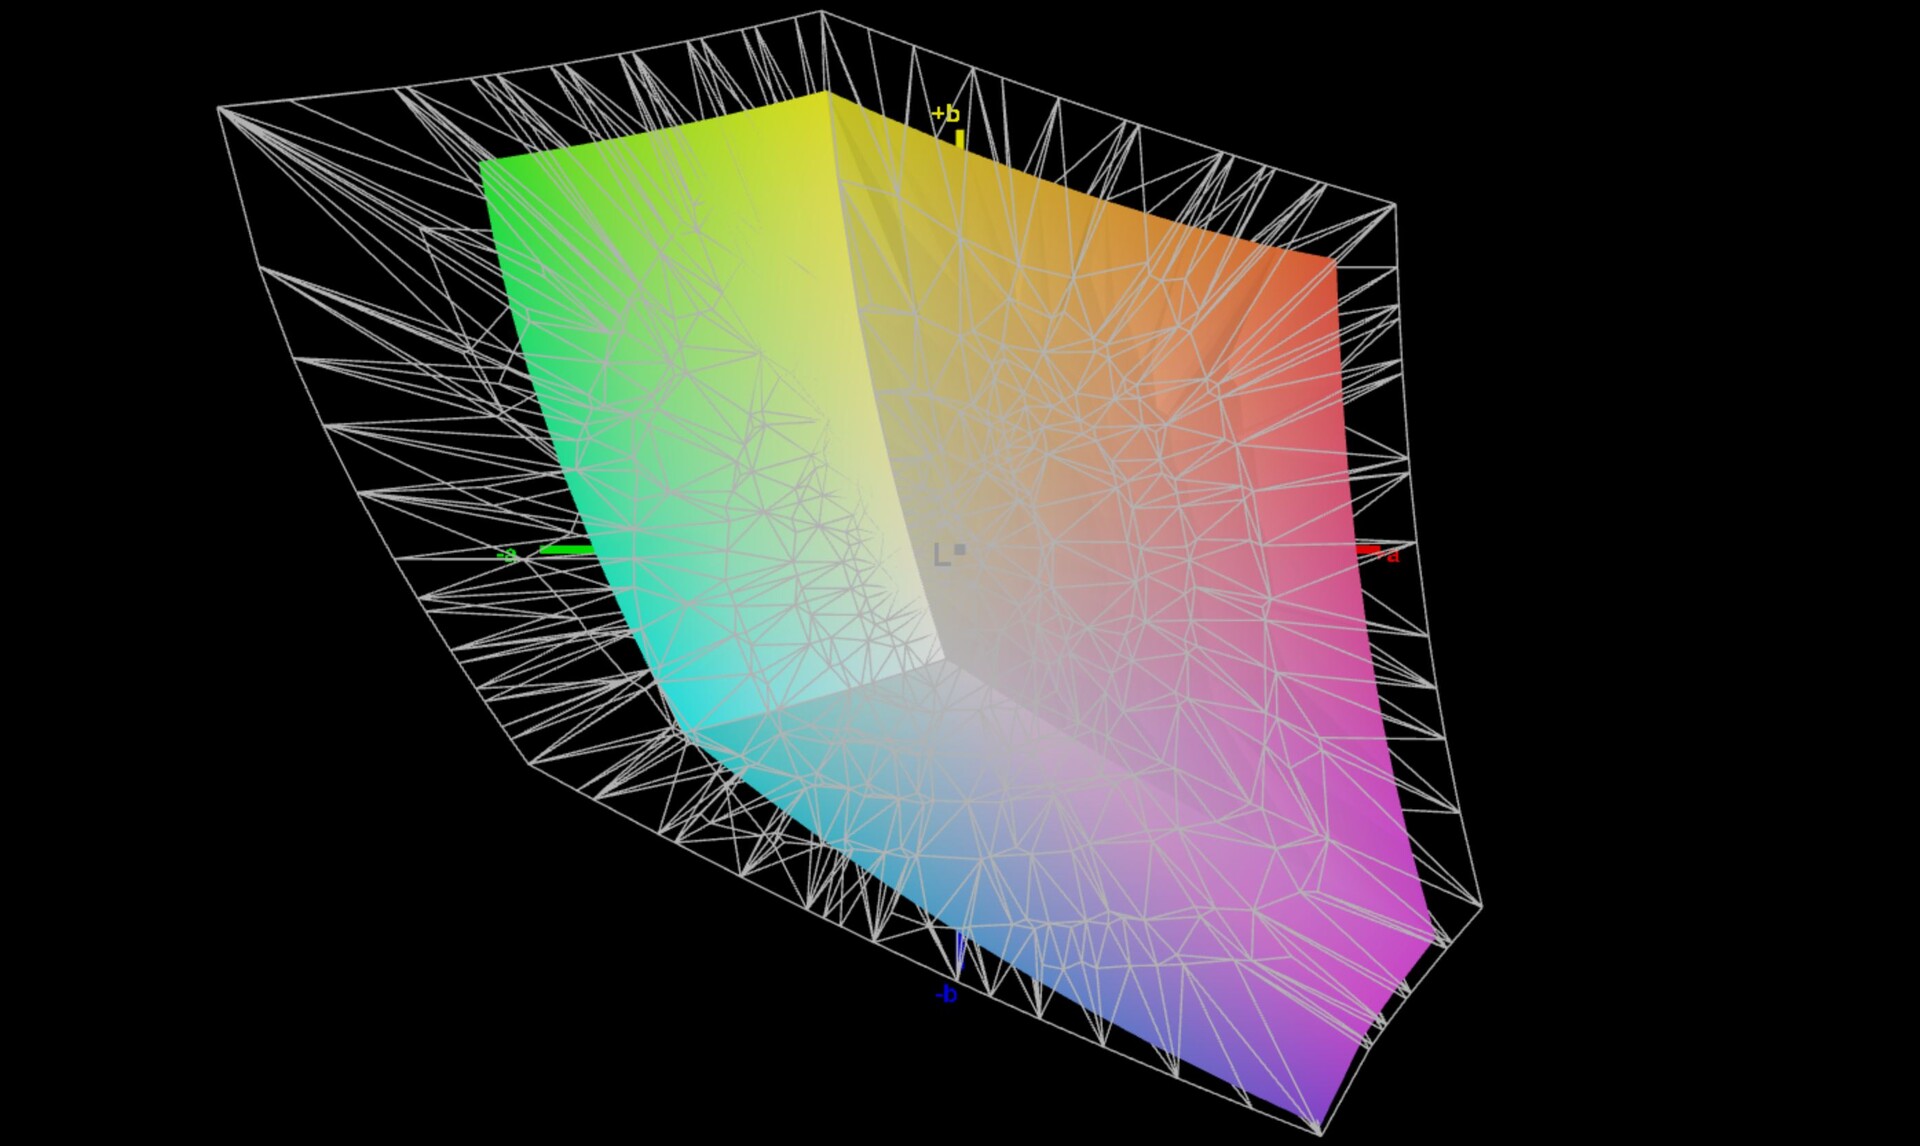
67.7% AdobeRGB 1998 (Argyll 3D)
97.7% sRGB (Argyll 3D)
65.6% Display P3 (Argyll 3D)
Gamma: 2.17
CCT: 6761 K
| Microsoft Surface Pro 9, i7-1255U LP129WT2-SPA6, IPS, 2880x1920, 13" | Dell XPS 13 9315 2-in-1 Core i5-1230U BOE NE13A1M, IPS, 2880x1920, 13" | Lenovo ThinkPad X12 20UVS03G00 N123NCA-GS1, a-Si IPS LED, 1920x1280, 12.3" | HP Elite Dragonfly Folio 13.5 G3 Chi Mei CMN13C0, IPS, 1920x1280, 13.5" | Apple iPad Pro 12.9 2022 Liquid Retina XDR Display, Mini-LED, 2732x2048, 12.9" | Asus ROG Flow Z13 GZ301ZE LQ134N1JW54, IPS, 1920x1200, 13.4" | Microsoft Surface Pro 8, i7-1185G7 LP129WT212166, IPS, 2880x1920, 13" | |
|---|---|---|---|---|---|---|---|
| Display | 6% | 2% | 3% | 1% | 12% | ||
| Display P3 Coverage (%) | 65.6 | 70.7 8% | 67 2% | 68.3 4% | 67.5 3% | 78.2 19% | |
| sRGB Coverage (%) | 97.7 | 99.8 2% | 99.2 2% | 98.6 1% | 97.1 -1% | 100 2% | |
| AdobeRGB 1998 Coverage (%) | 67.7 | 72.6 7% | 68.8 2% | 70.2 4% | 69.3 2% | 77.6 15% | |
| Response Times | -133% | -236% | -272% | -133% | -115% | -139% | |
| Response Time Grey 50% / Grey 80% * (ms) | 13 ? | 44 ? -238% | 63.2 ? -386% | 66.8 ? -414% | 35.3 ? -172% | 44 ? -238% | 46.4 ? -257% |
| Response Time Black / White * (ms) | 19.4 ? | 24.8 ? -28% | 36 ? -86% | 44.4 ? -129% | 37.53 ? -93% | 17.6 ? 9% | 23.2 ? -20% |
| PWM Frequency (Hz) | 29896 ? | 6401 ? | 29760 ? | ||||
| Screen | 8% | 24% | -9% | 7% | -0% | -7% | |
| Brightness middle (cd/m²) | 455 | 507 11% | 419 -8% | 369.5 -19% | 611 34% | 515 13% | 444 -2% |
| Brightness (cd/m²) | 453 | 486 7% | 406 -10% | 350 -23% | 605 34% | 476 5% | 451 0% |
| Brightness Distribution (%) | 94 | 87 -7% | 94 0% | 87 -7% | 92 -2% | 87 -7% | 91 -3% |
| Black Level * (cd/m²) | 0.38 | 0.34 11% | 0.23 39% | 0.24 37% | 0.35 8% | 0.43 -13% | |
| Contrast (:1) | 1197 | 1491 25% | 1822 52% | 1540 29% | 1471 23% | 1033 -14% | |
| Colorchecker dE 2000 * | 1.7 | 2.04 -20% | 1.1 35% | 2.3 -35% | 1.4 18% | 1.6 6% | 2 -18% |
| Colorchecker dE 2000 max. * | 3.8 | 3.1 18% | 2.2 42% | 4.34 -14% | 3.3 13% | 4 -5% | 3.2 16% |
| Colorchecker dE 2000 calibrated * | 1.5 | 0.86 43% | 0.5 67% | 0.6 60% | 1.2 20% | 1.7 -13% | |
| Greyscale dE 2000 * | 1.5 | 1.8 -20% | 1.5 -0% | 3.1 -107% | 2.3 -53% | 2.5 -67% | 1.8 -20% |
| Gamma | 2.17 101% | 2.12 104% | 2.06 107% | 2.1 105% | 2.22 99% | 2.2 100% | 2.11 104% |
| CCT | 6761 96% | 6561 99% | 6524 100% | 6248 104% | 6930 94% | 6939 94% | 6417 101% |
| Color Space (Percent of AdobeRGB 1998) (%) | 62.8 | ||||||
| Color Space (Percent of sRGB) (%) | 99.2 | ||||||
| Media totale (Programma / Settaggio) | -40% /
-13% | -70% /
-18% | -93% /
-44% | -63% /
-28% | -38% /
-16% | -45% /
-22% |
* ... Meglio usare valori piccoli

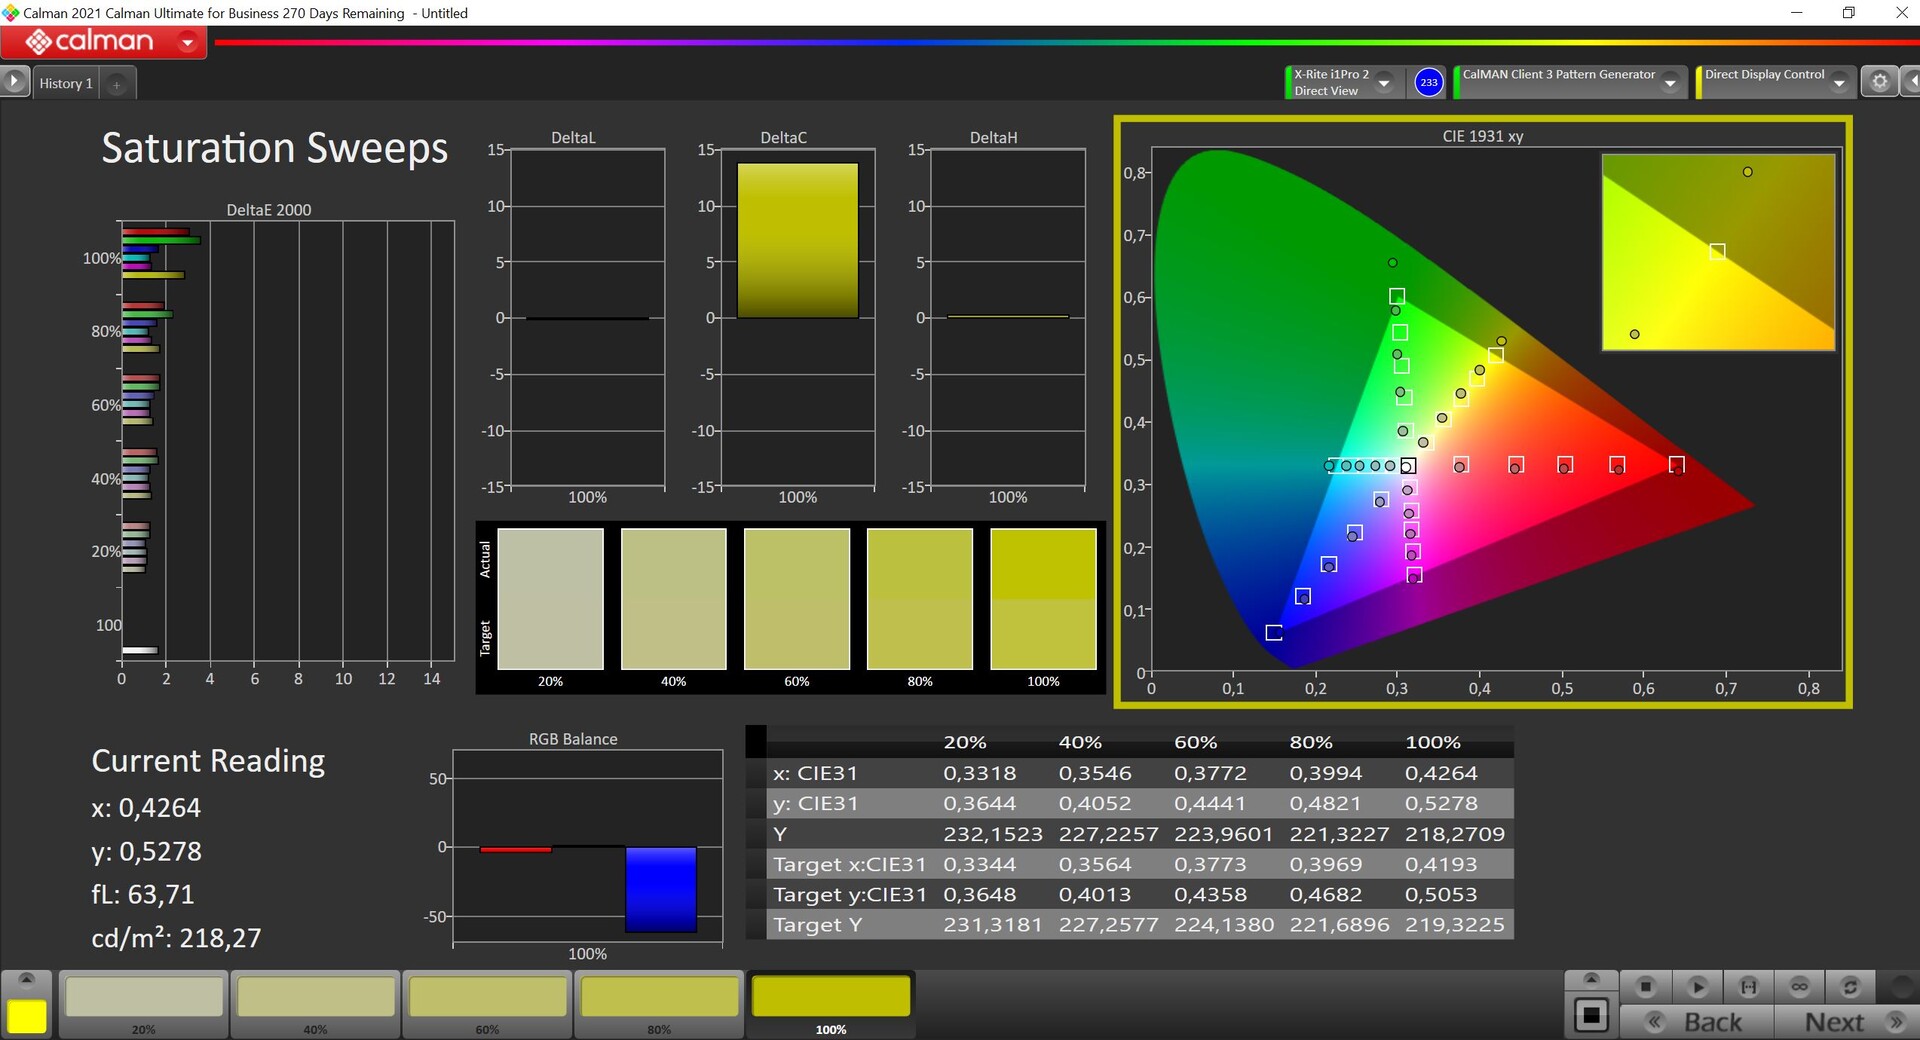
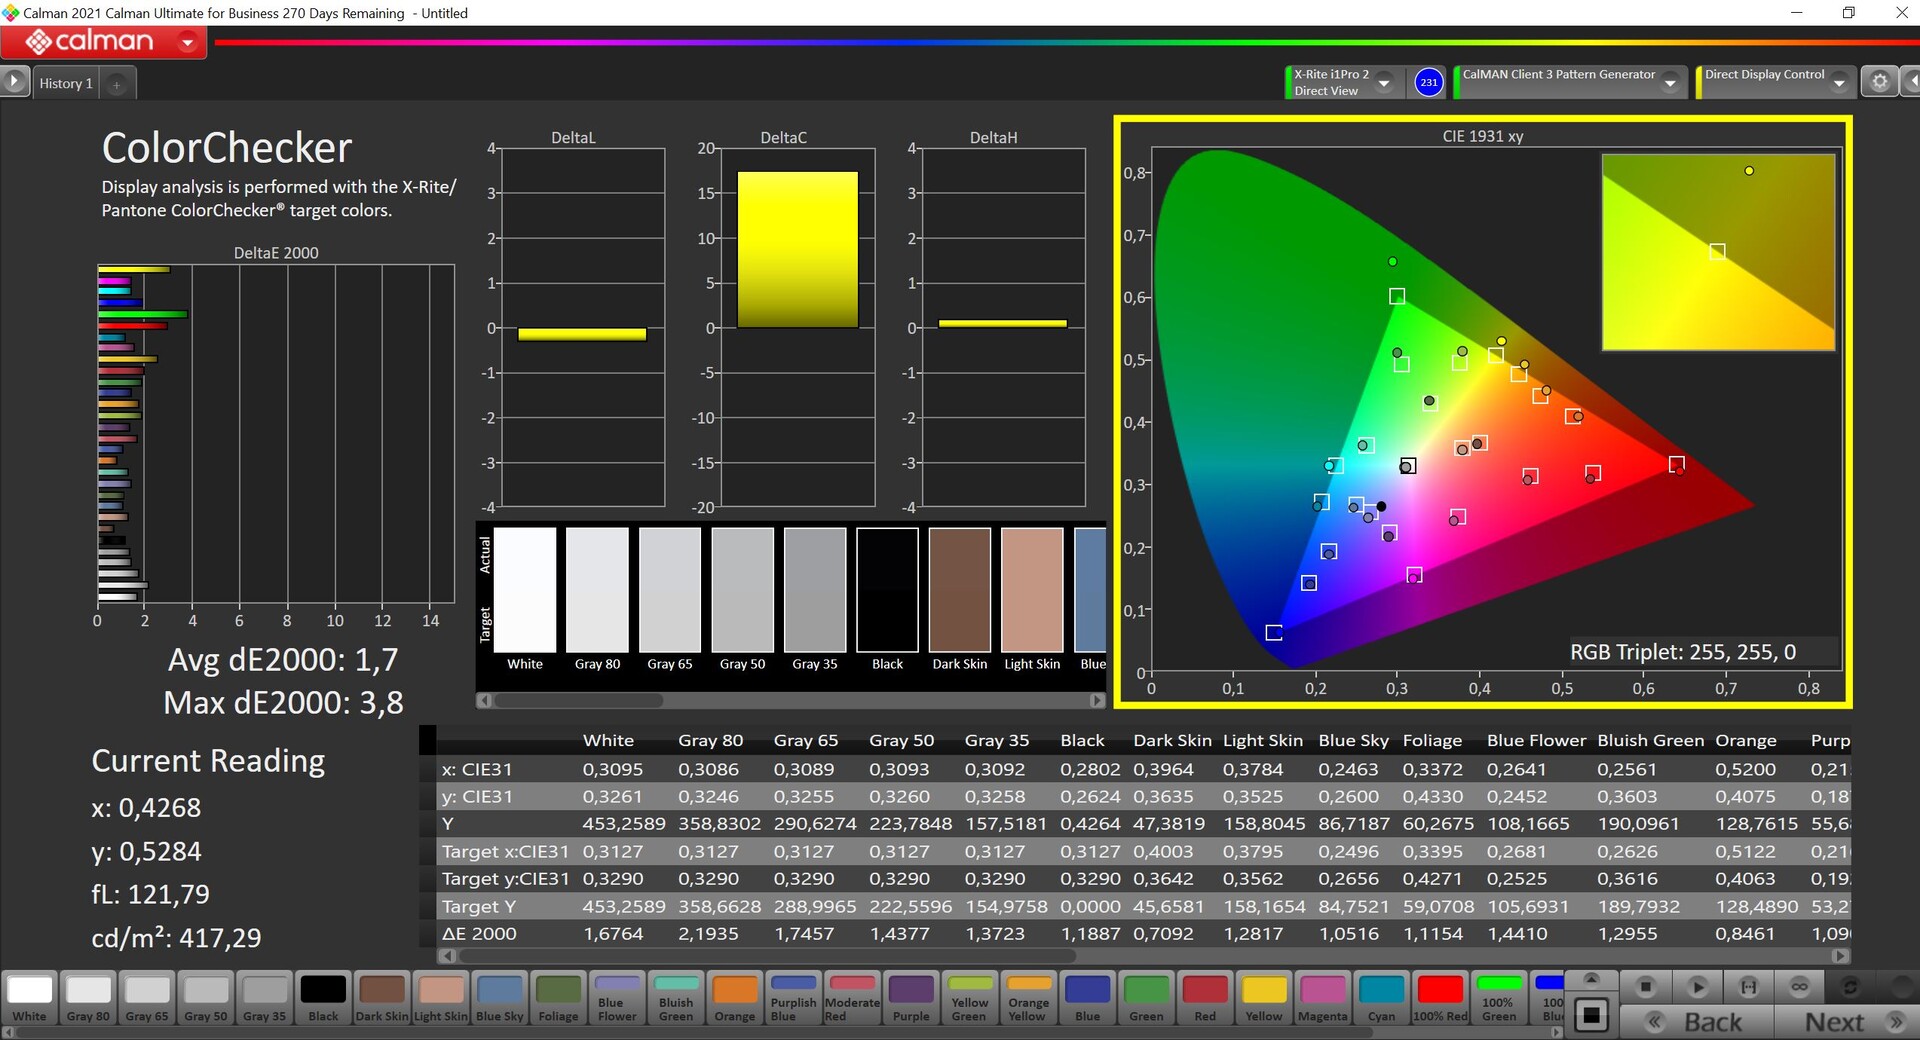
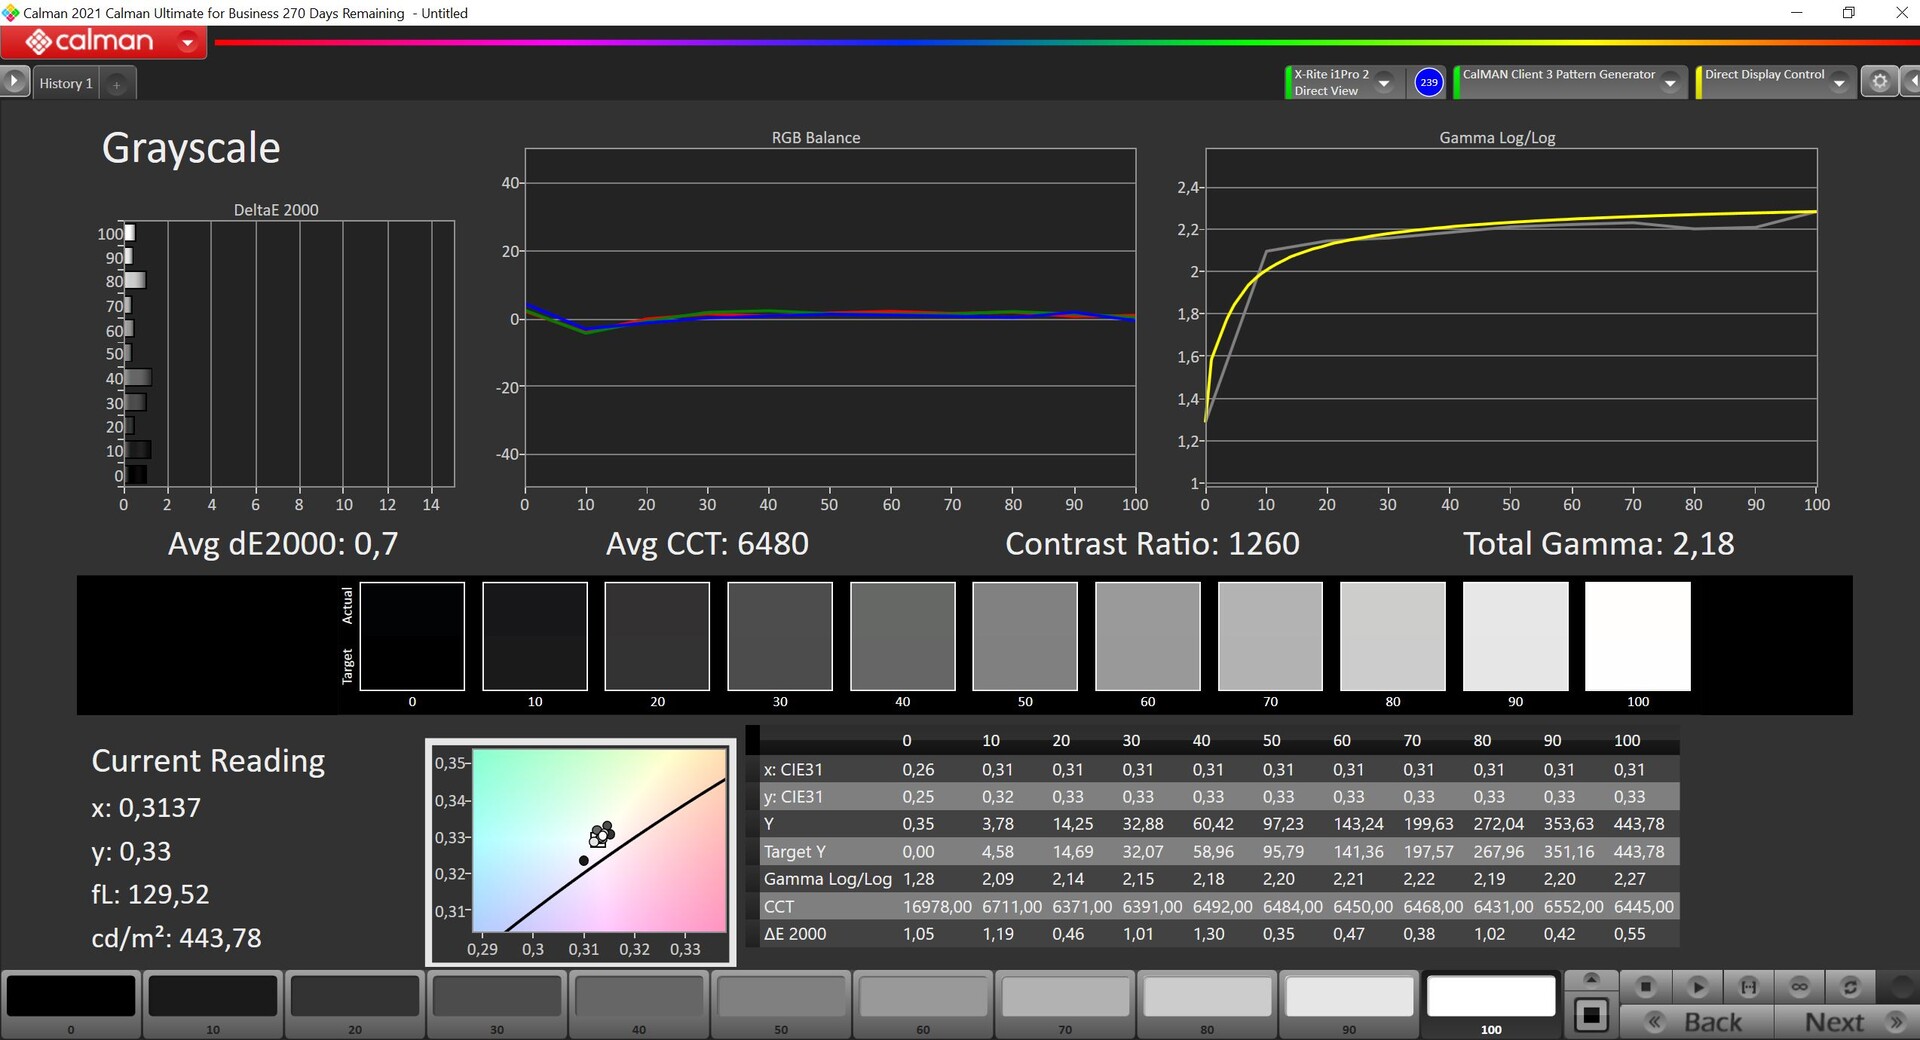
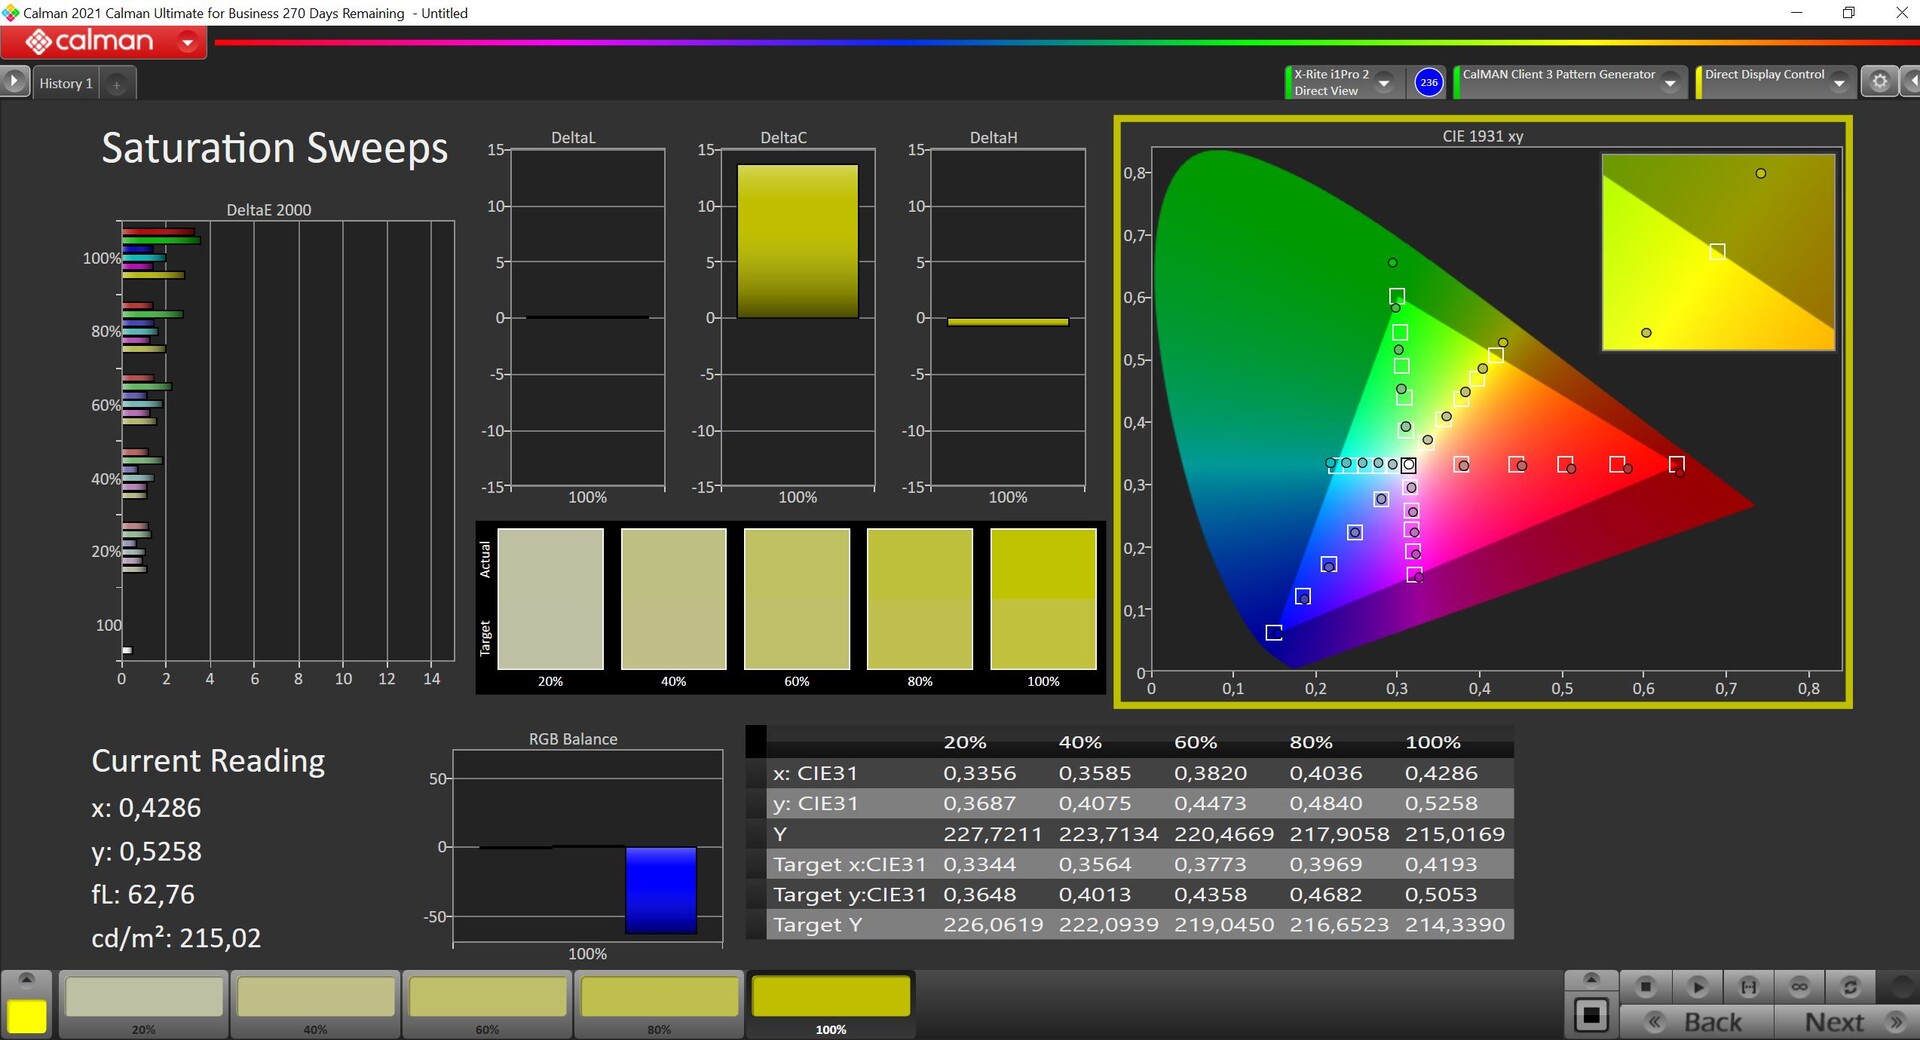
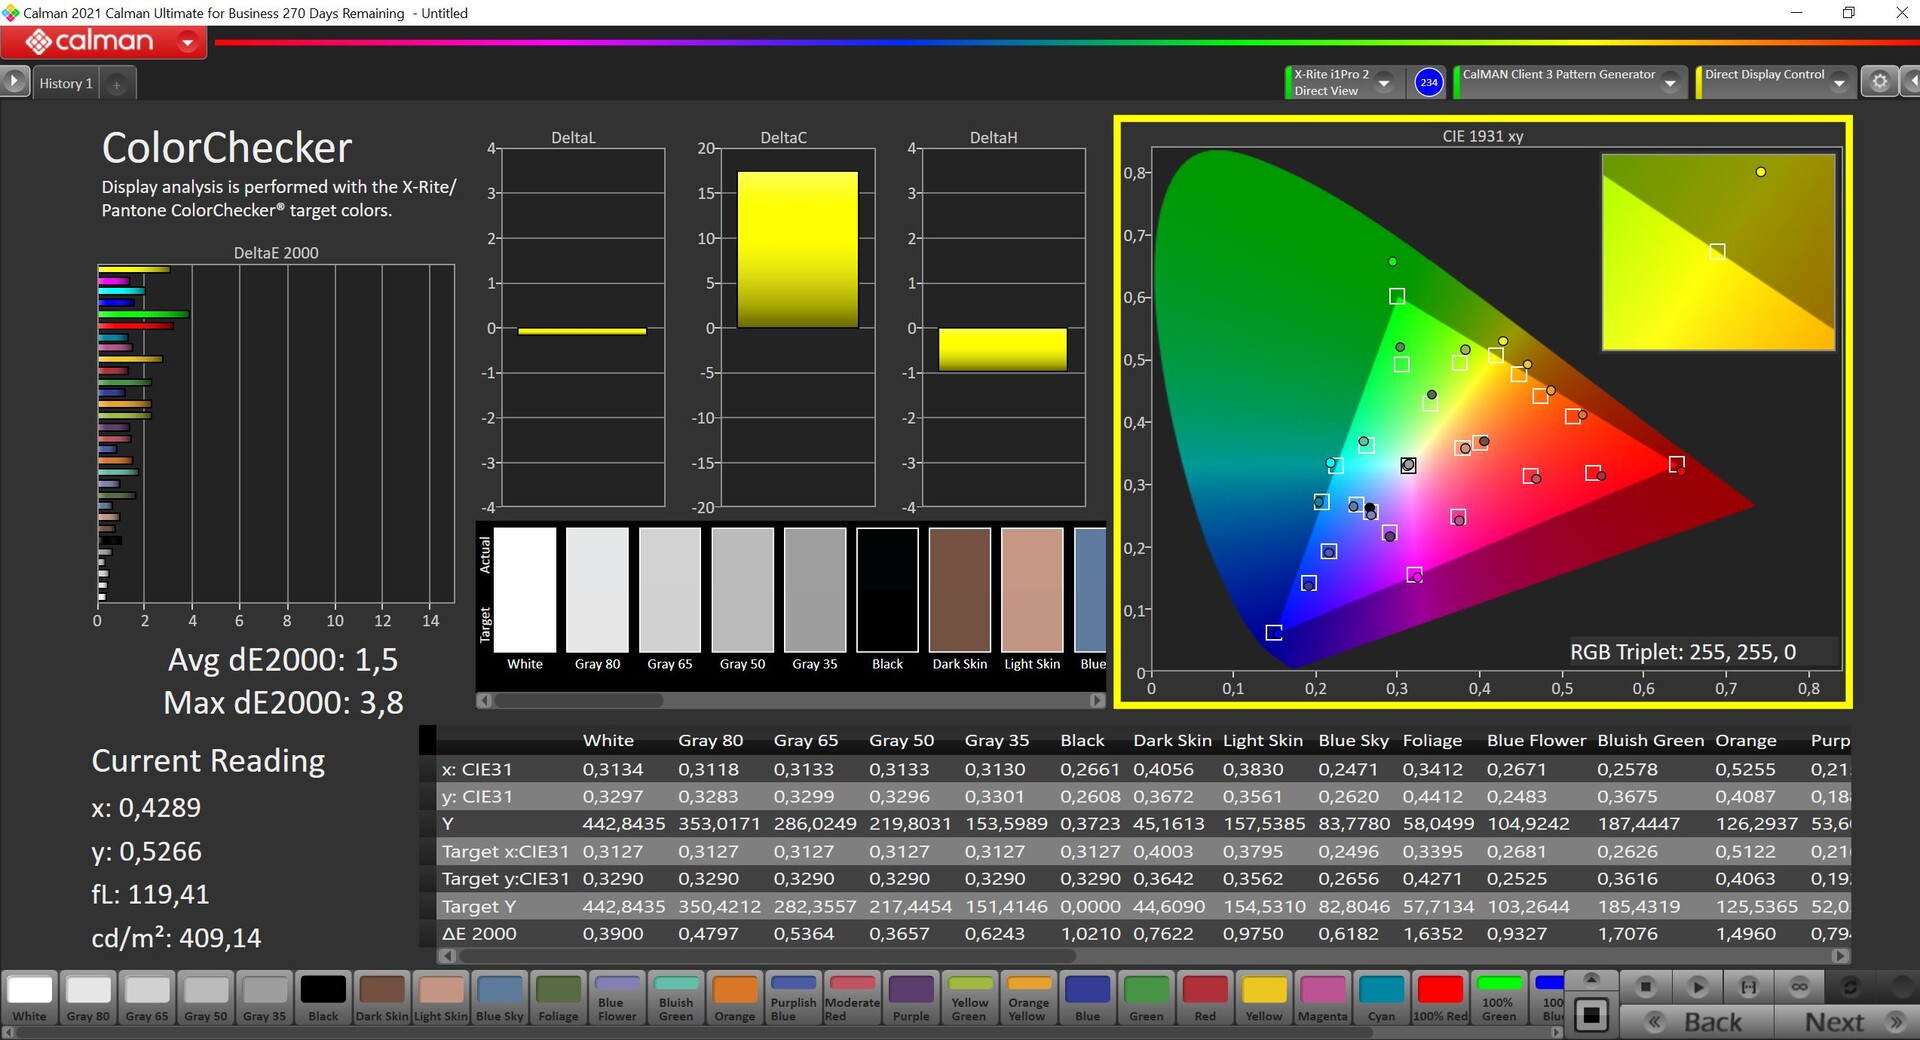
Abbiamo testato il pannello utilizzando il software professionale CalMAN (X-Rite i1 Pro 2): le sue prestazioni in stato di consegna sono già molto buone, anche se non siamo riusciti a rilevare alcuna differenza tra i profili sRGB e Vivid. La scala di grigi mostra un leggero effetto di fusione del colore, ma in pratica non si nota. Le deviazioni dei colori sono in linea con l'obiettivo; solo i colori al 100% presentano deviazioni leggermente maggiori (solo il verde supera il valore target di 3). Siamo stati in grado di migliorare ulteriormente questi valori tramite la nostra calibrazione (profilo disponibile in alto per il download gratuito), ma non è stato necessario. In termini di copertura dello spazio colore, tuttavia, il nuovo pannello è leggermente peggiore: sRGB raggiunge solo il 97,7% di copertura (prima era il 100%) e anche P3 e AdobeRGB sono leggermente inferiori rispetto a prima.
Tempi di risposta del Display
| ↔ Tempi di risposta dal Nero al Bianco | ||
|---|---|---|
| 19.4 ms ... aumenta ↗ e diminuisce ↘ combinato | ↗ 6.8 ms Incremento | 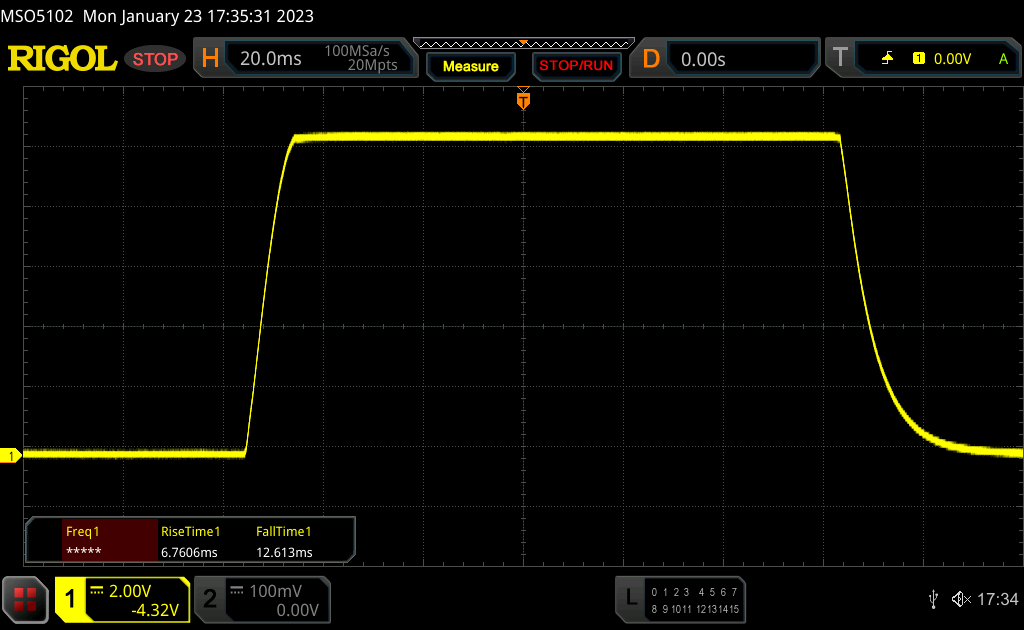 |
| ↘ 12.6 ms Calo | ||
| Lo schermo mostra buoni tempi di risposta durante i nostri tests, ma potrebbe essere troppo lento per i gamers competitivi. In confronto, tutti i dispositivi di test variano da 0.1 (minimo) a 240 (massimo) ms. » 43 % di tutti i dispositivi è migliore. Questo significa che i tempi di risposta rilevati sono simili alla media di tutti i dispositivi testati (19.8 ms). | ||
| ↔ Tempo di risposta dal 50% Grigio all'80% Grigio | ||
| 13 ms ... aumenta ↗ e diminuisce ↘ combinato | ↗ 6 ms Incremento | 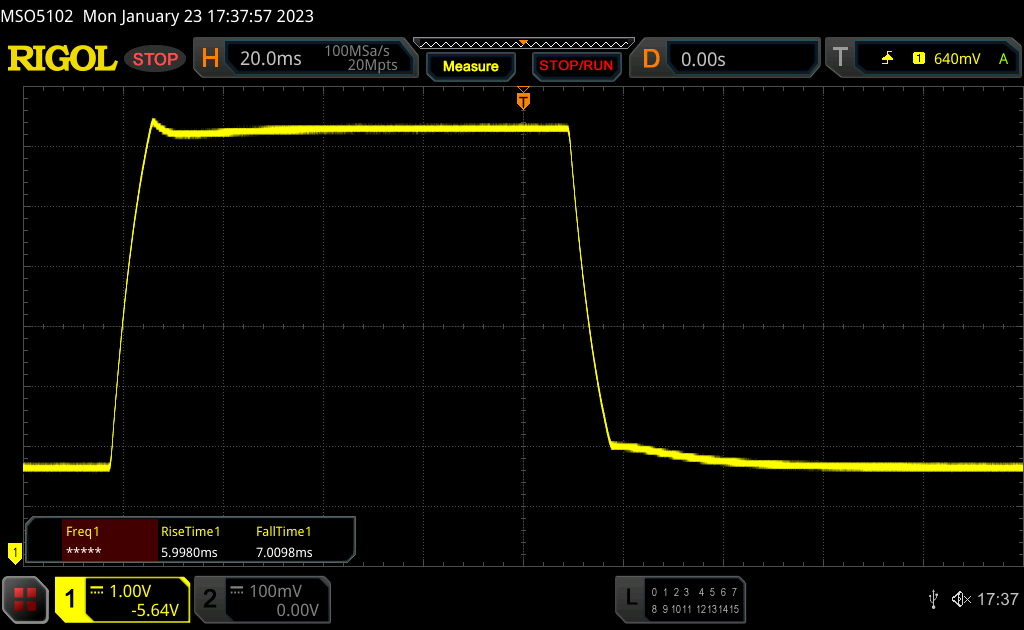 |
| ↘ 7 ms Calo | ||
| Lo schermo mostra buoni tempi di risposta durante i nostri tests, ma potrebbe essere troppo lento per i gamers competitivi. In confronto, tutti i dispositivi di test variano da 0.165 (minimo) a 636 (massimo) ms. » 27 % di tutti i dispositivi è migliore. Questo significa che i tempi di risposta rilevati sono migliori rispettto alla media di tutti i dispositivi testati (31 ms). | ||
Sfarfallio dello schermo / PWM (Pulse-Width Modulation)
| flickering dello schermo / PWM rilevato | 29896 Hz | ≤ 55 % settaggio luminosita' |  |
Il display sfarfalla a 29896 Hz (Probabilmente a causa dell'uso di PWM) Flickering rilevato ad una luminosita' di 55 % o inferiore. Non dovrebbe verificarsi flickering o PWM sopra questo valore di luminosita'. La frequenza di 29896 Hz è abbastanza alta, quindi la maggioranza degli utenti sensibili al PWM non dovrebbero notare alcun flickering. In confronto: 52 % di tutti i dispositivi testati non utilizza PWM per ridurre la luminosita' del display. Se è rilevato PWM, una media di 7747 (minimo: 5 - massimo: 343500) Hz è stata rilevata. | |||
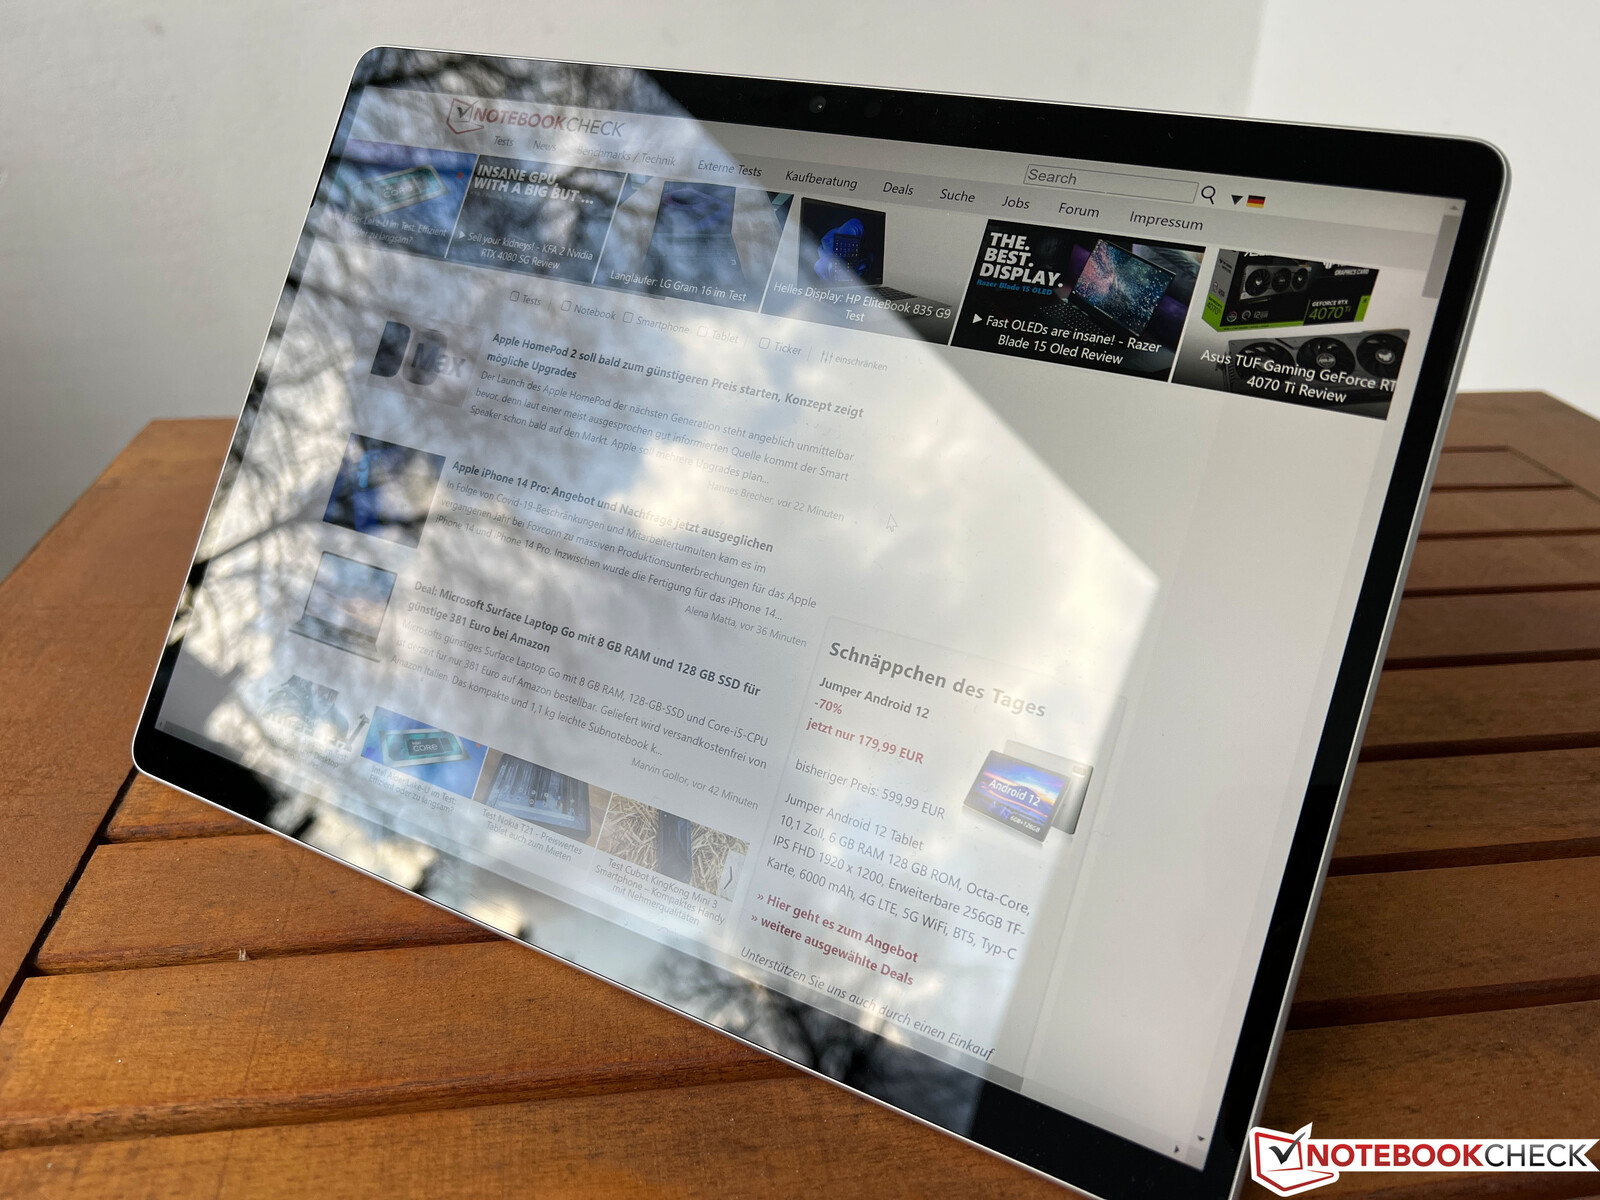
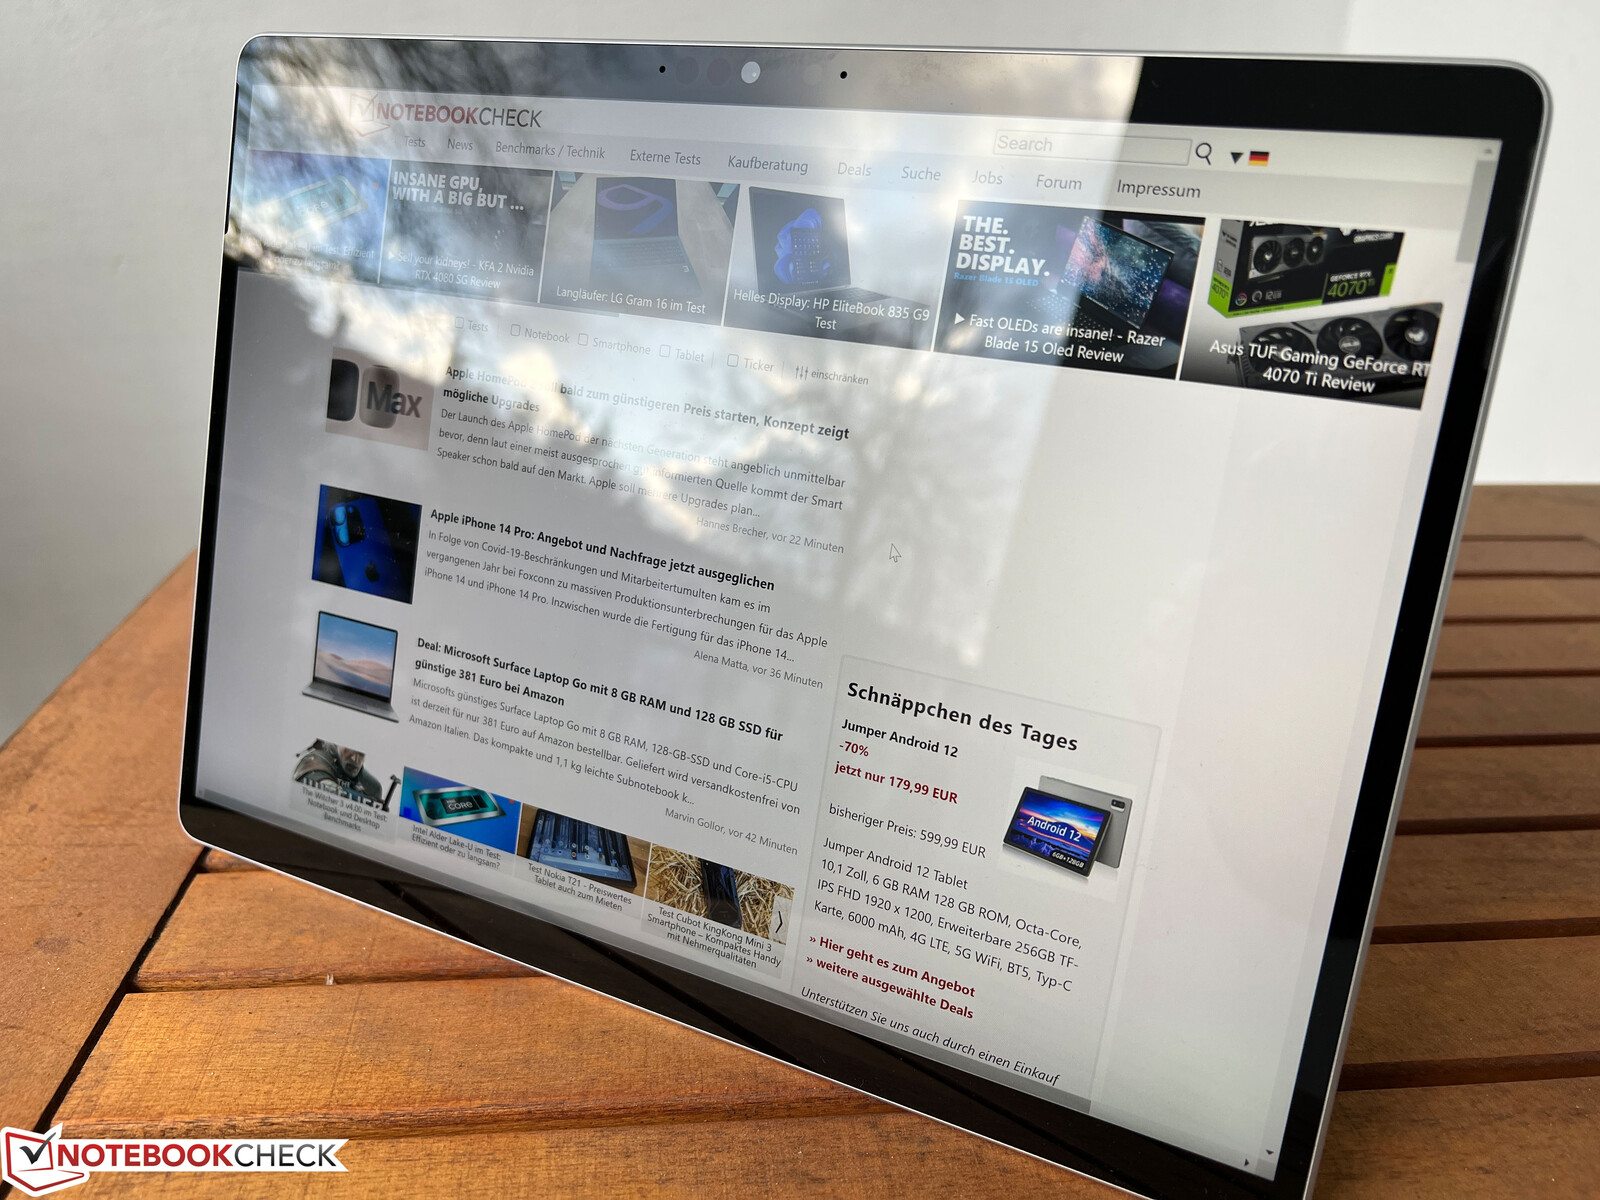
La superficie lucida dello schermo non è ideale per l'uso all'aperto, quindi è necessario evitare il più possibile i riflessi delle fonti di luce. Solo in questo caso il livello di luminosità massimo è sufficiente per una visione confortevole dei contenuti del display. La stabilità dell'angolo di visione non lascia spazio a critiche.

Prestazioni - Alder Lake-U offre una potenza significativamente maggiore
Le varianti Intel del nuovo Surface Pro 9 sono disponibili solo con i processori Alder Lake nella classe da 15 watt, ovvero i modelli Core i5 1235Uo il Core i7 1255U. Chi necessita di 16 GB di RAM o 256 GB di spazio di archiviazione dovrà optare per la variante i7. È possibile un massimo di 32 GB di RAM e un disco rigido da 1 TB (2499,99 dollari).
Condizioni di test
Microsoft utilizza solo le impostazioni energetiche di Windows, il cui nome è leggermente diverso da quello di altri dispositivi Windows(Consigliato, Prestazioni migliori e Prestazioni migliori). Per i benchmark abbiamo utilizzato Prestazioni migliori e per le misurazioni energetiche abbiamo utilizzato la modalità predefinita a 60 Hz.
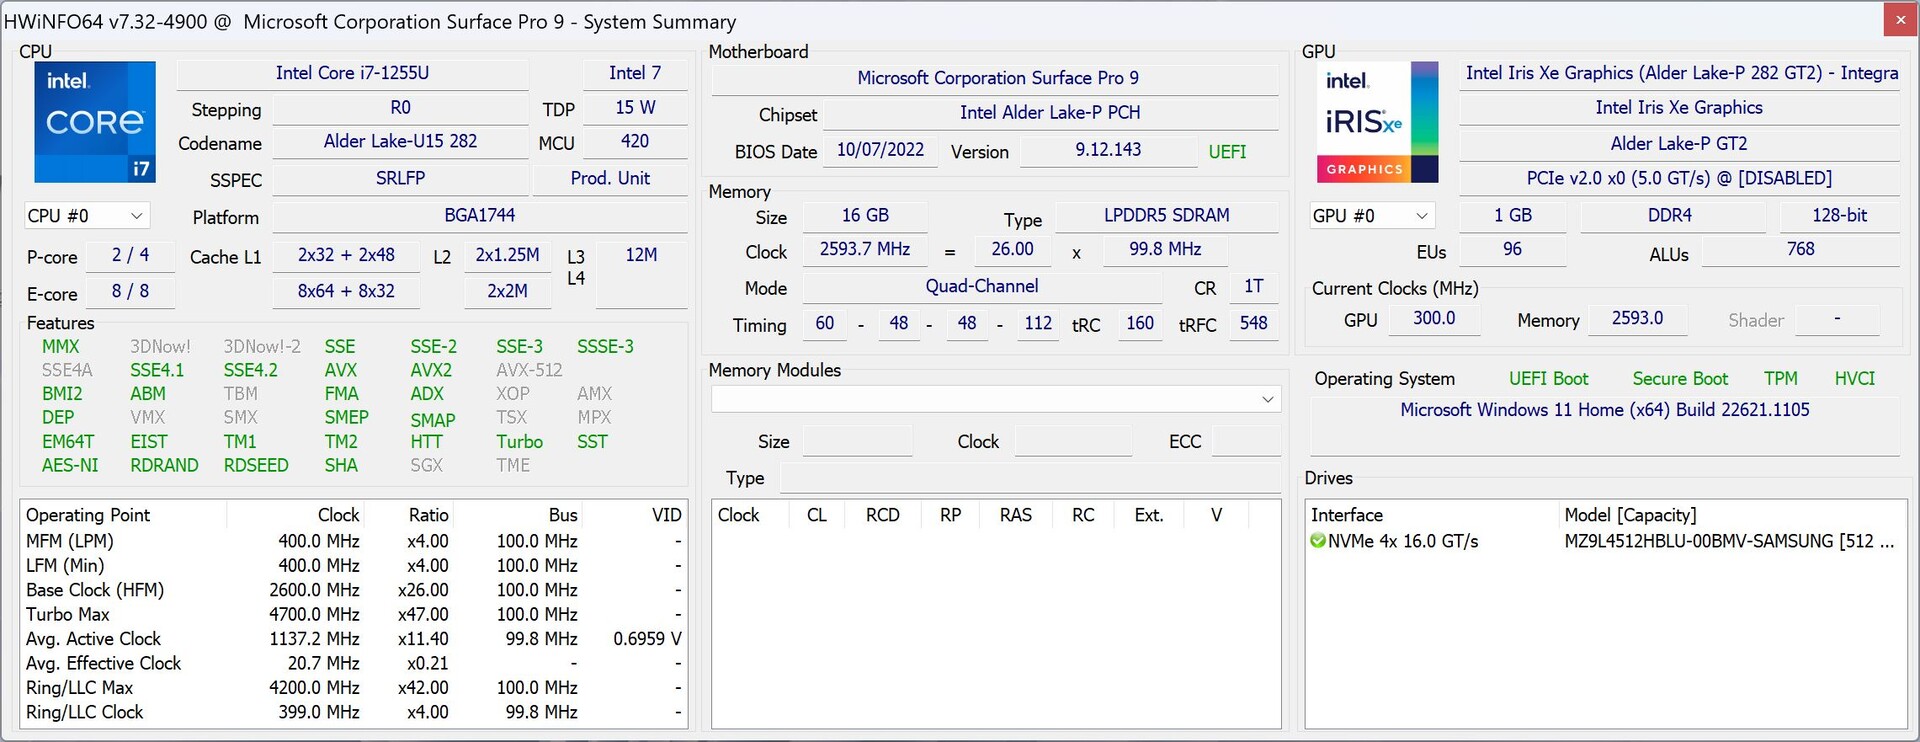
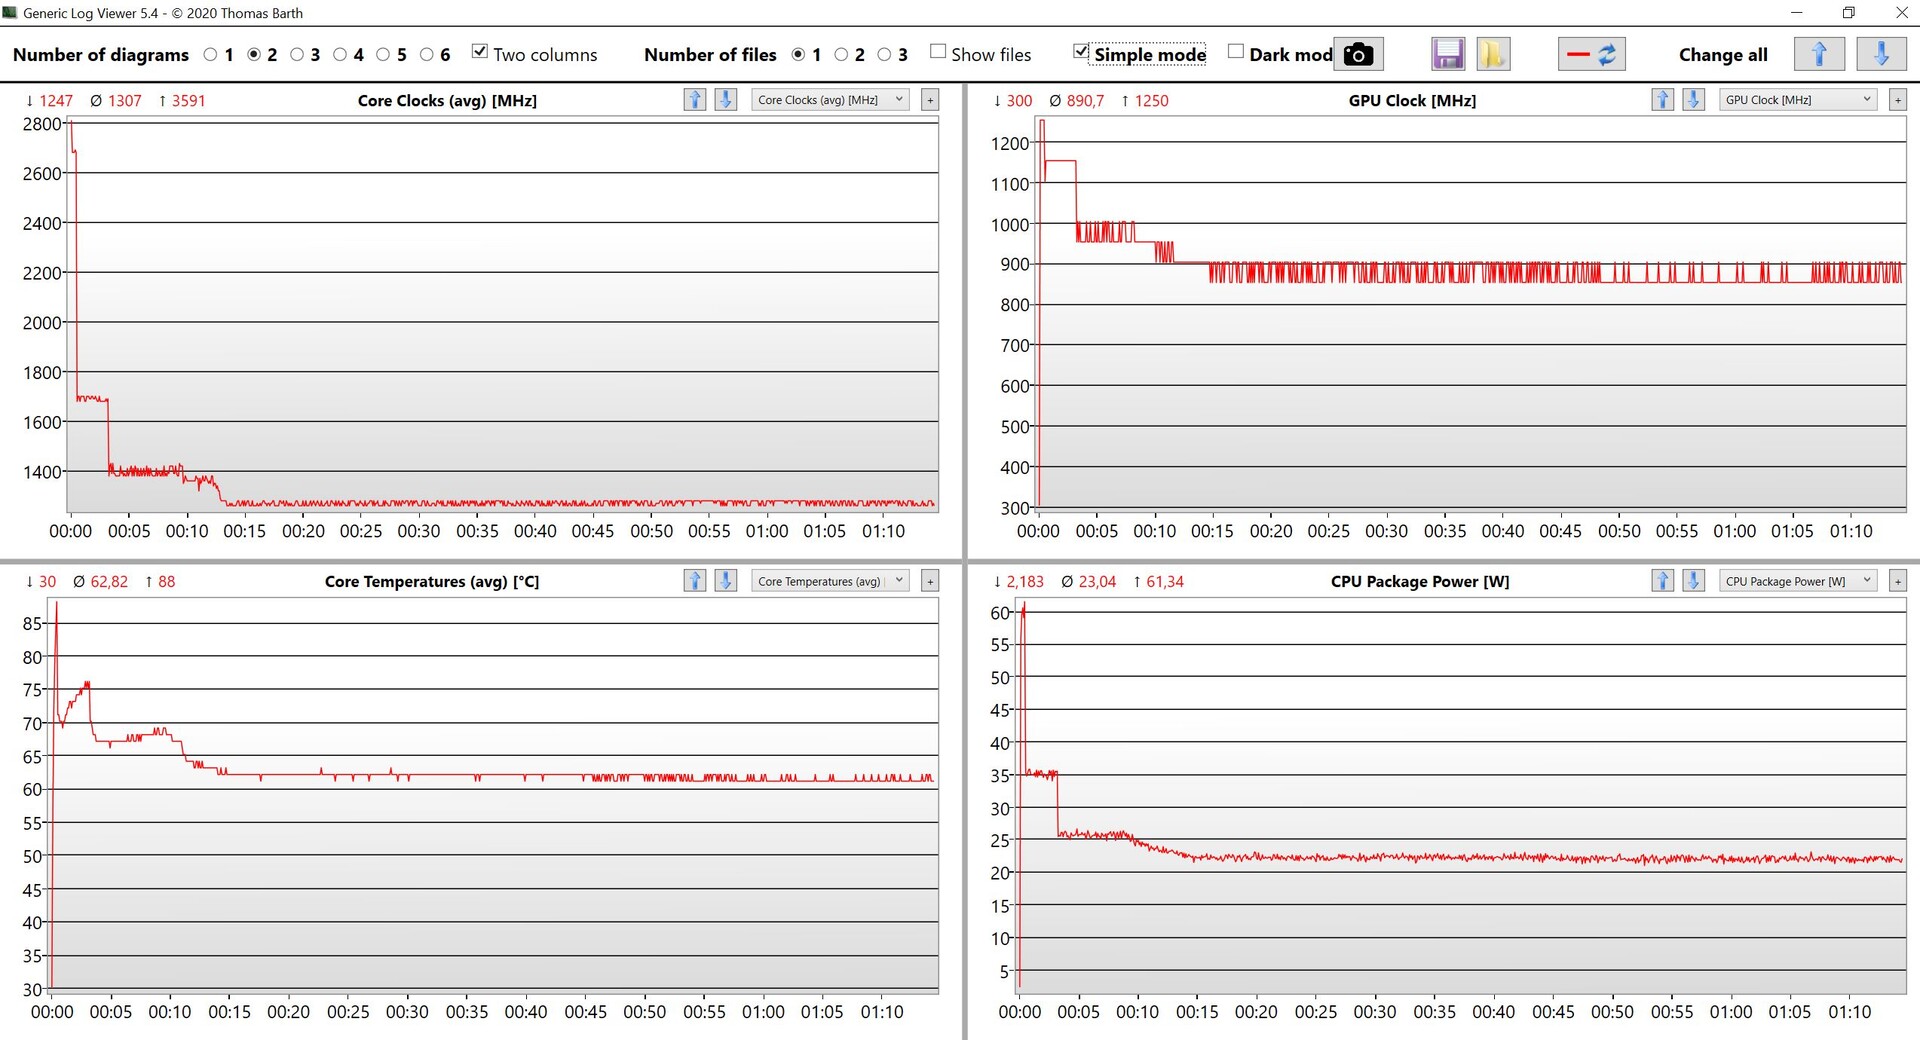
Processore - Core i7-1255U
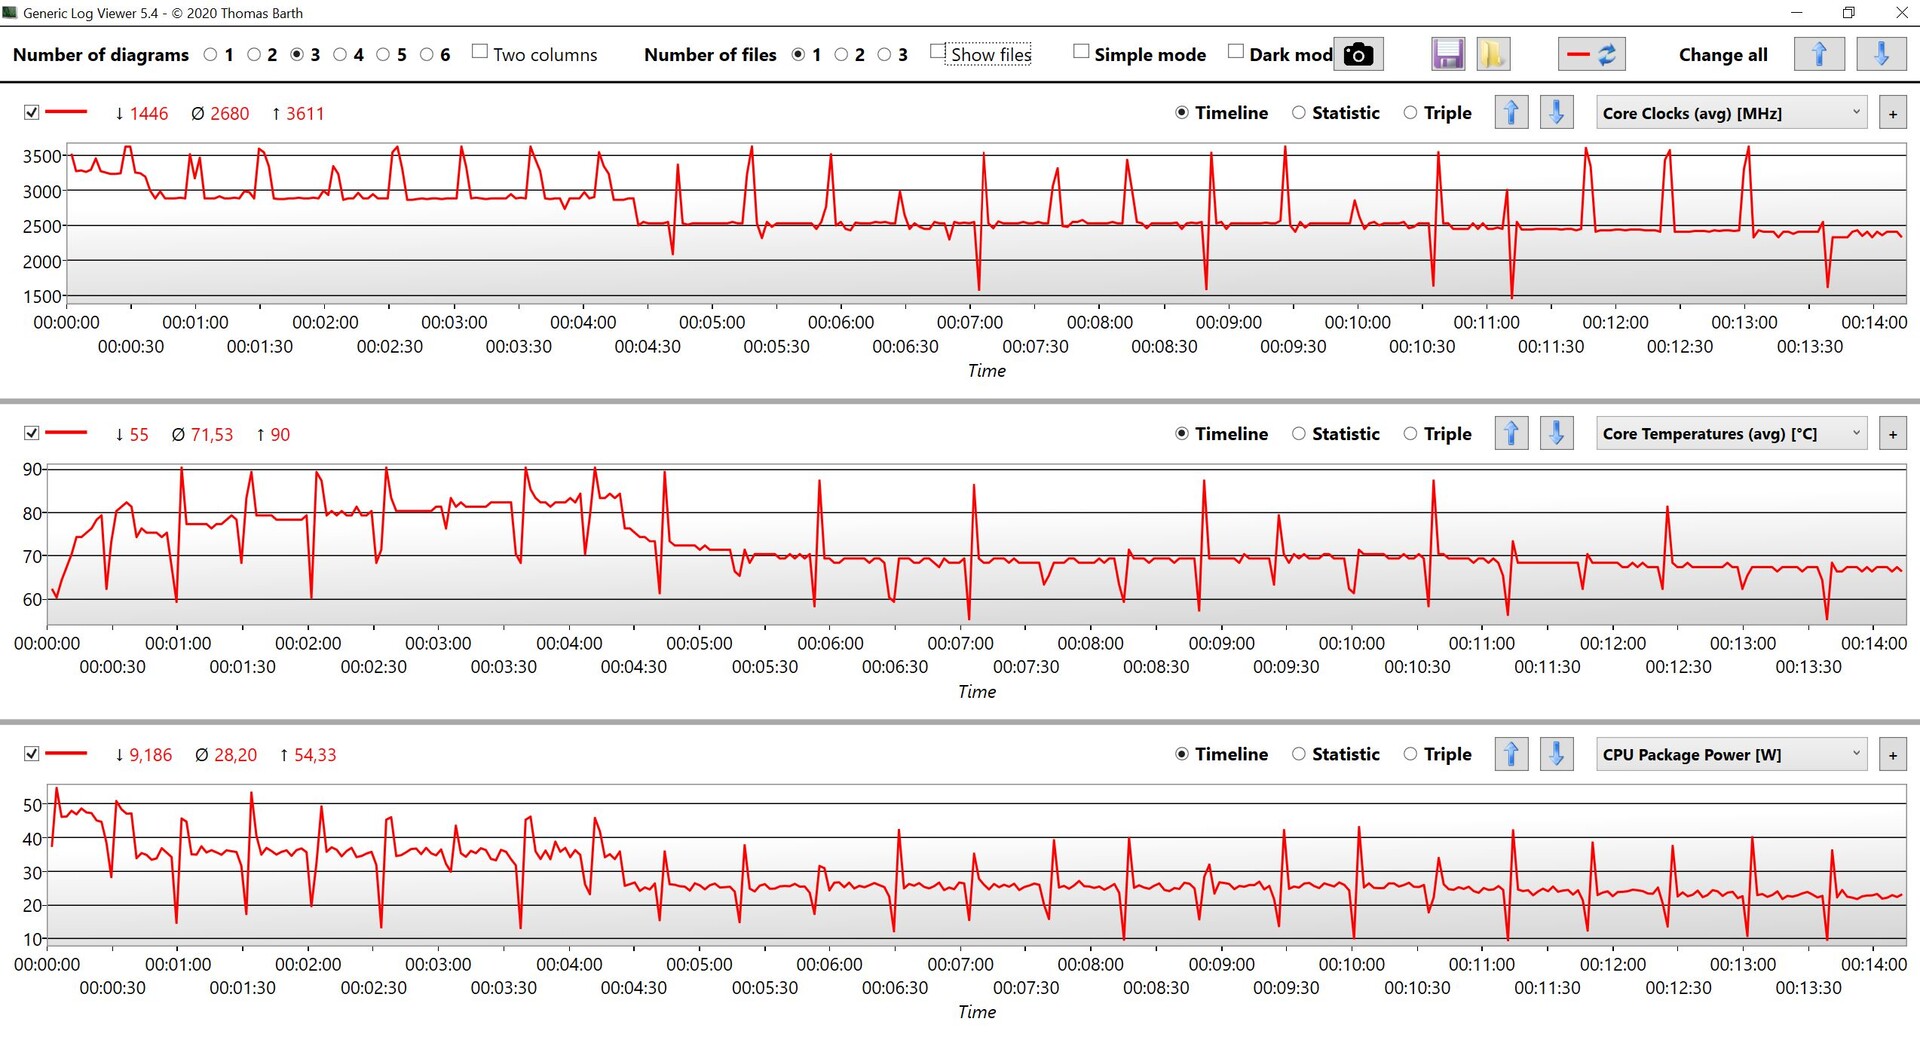
Il Core i7 1255Uappartiene all'attuale generazione Alder Lake di Intel e combina due core ad alte prestazioni con 8 core di efficienza. Si tratta fondamentalmente di una CPU da 15 watt, ma Microsoft dà libero sfogo al processore e abbiamo osservato un consumo massimo di circa 20 watt con carico single-core e fino a 54 watt con carico multi-core, che è anche vicino al limite massimo dei processori Alder Lake-U come specificato da Intel. Naturalmente, questi valori vengono mantenuti solo per un tempo molto breve, ma il Surface Pro 9 può mantenere 35 watt sotto carico costante per circa 4,5 minuti prima di scendere a circa 25 watt e addirittura a 22 watt. Se questi valori elevati abbiano un senso è ovviamente un'altra questione, per la nostra recente analisi delle CPU Alder Lake-U ha rivelato che un chip Alder Lake-P ha rivelato che un chip Alder Lake-P (per esempio il Core i7 1260P) con due core aggiuntivi offre maggiori prestazioni a questi valori.
Cinebench R15 Multi Sustained Load
Nei test sulla CPU, il Surface Pro 9 è battuto solo dall'Asus ROG Flow Z13.Asus ROG Flow Z13convertibile per il gaming, anch'esso equipaggiato con il Core i9 12900H.sia le prestazioni single-core che quelle multi-core sono significativamente migliori rispetto al vecchio Surface Pro 8 con il suo Core i7 1185G7. Per un confronto con il Processore M2 dell'iPad Pro iPad Pro, abbiamo incluso i risultati del MacBook Airpoiché non tutti i benchmark sono supportati dall'iPad. Apple M2 non è altrettanto veloce, ma è molto più efficiente (~5 watt single-core e ~20 watt multi-core).
In modalità batteria, le prestazioni della CPU sono leggermente peggiori perché i limiti di potenza sono abbassati a 45/30 watt. Nel test multi-core Cinebench R23, questo comporta una riduzione delle prestazioni di poco meno del 5%, ma le prestazioni single-core non sono peggiori. Altri benchmark della CPU sono disponibiliqui.
Cinebench R23: Multi Core | Single Core
Cinebench R20: CPU (Multi Core) | CPU (Single Core)
Cinebench R15: CPU Multi 64Bit | CPU Single 64Bit
Blender: v2.79 BMW27 CPU
7-Zip 18.03: 7z b 4 | 7z b 4 -mmt1
Geekbench 5.5: Multi-Core | Single-Core
HWBOT x265 Benchmark v2.2: 4k Preset
LibreOffice : 20 Documents To PDF
R Benchmark 2.5: Overall mean
| CPU Performance rating | |
| Asus ROG Flow Z13 GZ301ZE | |
| Media della classe Convertible | |
| Microsoft Surface Pro 9, i7-1255U | |
| Apple MacBook Air M2 10C GPU -5! | |
| HP Elite Dragonfly Folio 13.5 G3 | |
| Media Intel Core i7-1255U | |
| Dell XPS 13 9315 2-in-1 Core i5-1230U | |
| Microsoft Surface Pro 8, i7-1185G7 | |
| Lenovo ThinkPad X12 20UVS03G00 -1! | |
| Cinebench R23 / Multi Core | |
| Asus ROG Flow Z13 GZ301ZE | |
| Media della classe Convertible (1317 - 30959, n=48, ultimi 2 anni) | |
| Microsoft Surface Pro 9, i7-1255U | |
| Apple MacBook Air M2 10C GPU | |
| Media Intel Core i7-1255U (5269 - 9628, n=11) | |
| HP Elite Dragonfly Folio 13.5 G3 | |
| Dell XPS 13 9315 2-in-1 Core i5-1230U | |
| Microsoft Surface Pro 8, i7-1185G7 | |
| Lenovo ThinkPad X12 20UVS03G00 | |
| Cinebench R23 / Single Core | |
| Asus ROG Flow Z13 GZ301ZE | |
| Media della classe Convertible (740 - 2188, n=48, ultimi 2 anni) | |
| HP Elite Dragonfly Folio 13.5 G3 | |
| Microsoft Surface Pro 9, i7-1255U | |
| Media Intel Core i7-1255U (1408 - 1775, n=11) | |
| Apple MacBook Air M2 10C GPU | |
| Microsoft Surface Pro 8, i7-1185G7 | |
| Dell XPS 13 9315 2-in-1 Core i5-1230U | |
| Lenovo ThinkPad X12 20UVS03G00 | |
| Cinebench R20 / CPU (Multi Core) | |
| Asus ROG Flow Z13 GZ301ZE | |
| Media della classe Convertible (595 - 12102, n=48, ultimi 2 anni) | |
| Microsoft Surface Pro 9, i7-1255U | |
| Media Intel Core i7-1255U (2095 - 3702, n=11) | |
| HP Elite Dragonfly Folio 13.5 G3 | |
| Dell XPS 13 9315 2-in-1 Core i5-1230U | |
| Apple MacBook Air M2 10C GPU | |
| Microsoft Surface Pro 8, i7-1185G7 | |
| Lenovo ThinkPad X12 20UVS03G00 | |
| Cinebench R20 / CPU (Single Core) | |
| Asus ROG Flow Z13 GZ301ZE | |
| Media della classe Convertible (273 - 834, n=48, ultimi 2 anni) | |
| HP Elite Dragonfly Folio 13.5 G3 | |
| Microsoft Surface Pro 9, i7-1255U | |
| Media Intel Core i7-1255U (550 - 682, n=11) | |
| Dell XPS 13 9315 2-in-1 Core i5-1230U | |
| Microsoft Surface Pro 8, i7-1185G7 | |
| Lenovo ThinkPad X12 20UVS03G00 | |
| Apple MacBook Air M2 10C GPU | |
| Cinebench R15 / CPU Multi 64Bit | |
| Asus ROG Flow Z13 GZ301ZE | |
| Media della classe Convertible (478 - 4940, n=47, ultimi 2 anni) | |
| Microsoft Surface Pro 9, i7-1255U | |
| HP Elite Dragonfly Folio 13.5 G3 | |
| Media Intel Core i7-1255U (919 - 1577, n=11) | |
| Dell XPS 13 9315 2-in-1 Core i5-1230U | |
| Apple MacBook Air M2 10C GPU | |
| Microsoft Surface Pro 8, i7-1185G7 | |
| Lenovo ThinkPad X12 20UVS03G00 | |
| Cinebench R15 / CPU Single 64Bit | |
| Asus ROG Flow Z13 GZ301ZE | |
| Media della classe Convertible (149.8 - 317, n=47, ultimi 2 anni) | |
| HP Elite Dragonfly Folio 13.5 G3 | |
| Media Intel Core i7-1255U (161 - 251, n=12) | |
| Microsoft Surface Pro 8, i7-1185G7 | |
| Apple MacBook Air M2 10C GPU | |
| Microsoft Surface Pro 9, i7-1255U | |
| Dell XPS 13 9315 2-in-1 Core i5-1230U | |
| Lenovo ThinkPad X12 20UVS03G00 | |
| Blender / v2.79 BMW27 CPU | |
| Lenovo ThinkPad X12 20UVS03G00 | |
| Apple MacBook Air M2 10C GPU | |
| Microsoft Surface Pro 8, i7-1185G7 | |
| Dell XPS 13 9315 2-in-1 Core i5-1230U | |
| Media Intel Core i7-1255U (372 - 601, n=11) | |
| HP Elite Dragonfly Folio 13.5 G3 | |
| Microsoft Surface Pro 9, i7-1255U | |
| Media della classe Convertible (105 - 1051, n=47, ultimi 2 anni) | |
| Asus ROG Flow Z13 GZ301ZE | |
| 7-Zip 18.03 / 7z b 4 | |
| Asus ROG Flow Z13 GZ301ZE | |
| Media della classe Convertible (12977 - 121368, n=47, ultimi 2 anni) | |
| Microsoft Surface Pro 9, i7-1255U | |
| Dell XPS 13 9315 2-in-1 Core i5-1230U | |
| HP Elite Dragonfly Folio 13.5 G3 | |
| Media Intel Core i7-1255U (24126 - 37365, n=11) | |
| Microsoft Surface Pro 8, i7-1185G7 | |
| Lenovo ThinkPad X12 20UVS03G00 | |
| 7-Zip 18.03 / 7z b 4 -mmt1 | |
| Asus ROG Flow Z13 GZ301ZE | |
| Media della classe Convertible (3672 - 6655, n=47, ultimi 2 anni) | |
| Media Intel Core i7-1255U (5059 - 5529, n=11) | |
| HP Elite Dragonfly Folio 13.5 G3 | |
| Microsoft Surface Pro 8, i7-1185G7 | |
| Microsoft Surface Pro 9, i7-1255U | |
| Dell XPS 13 9315 2-in-1 Core i5-1230U | |
| Geekbench 5.5 / Multi-Core | |
| Asus ROG Flow Z13 GZ301ZE | |
| Media della classe Convertible (1608 - 22023, n=48, ultimi 2 anni) | |
| Apple MacBook Air M2 10C GPU | |
| Microsoft Surface Pro 9, i7-1255U | |
| HP Elite Dragonfly Folio 13.5 G3 | |
| Media Intel Core i7-1255U (4463 - 8821, n=12) | |
| Dell XPS 13 9315 2-in-1 Core i5-1230U | |
| Microsoft Surface Pro 8, i7-1185G7 | |
| Lenovo ThinkPad X12 20UVS03G00 | |
| Geekbench 5.5 / Single-Core | |
| Apple MacBook Air M2 10C GPU | |
| Asus ROG Flow Z13 GZ301ZE | |
| Media della classe Convertible (806 - 2275, n=48, ultimi 2 anni) | |
| Microsoft Surface Pro 9, i7-1255U | |
| HP Elite Dragonfly Folio 13.5 G3 | |
| Media Intel Core i7-1255U (1560 - 1712, n=12) | |
| Microsoft Surface Pro 8, i7-1185G7 | |
| Dell XPS 13 9315 2-in-1 Core i5-1230U | |
| Lenovo ThinkPad X12 20UVS03G00 | |
| HWBOT x265 Benchmark v2.2 / 4k Preset | |
| Asus ROG Flow Z13 GZ301ZE | |
| Media della classe Convertible (3.43 - 36.2, n=47, ultimi 2 anni) | |
| Microsoft Surface Pro 9, i7-1255U | |
| HP Elite Dragonfly Folio 13.5 G3 | |
| Media Intel Core i7-1255U (6.31 - 10.1, n=11) | |
| Dell XPS 13 9315 2-in-1 Core i5-1230U | |
| Microsoft Surface Pro 8, i7-1185G7 | |
| Lenovo ThinkPad X12 20UVS03G00 | |
| LibreOffice / 20 Documents To PDF | |
| Lenovo ThinkPad X12 20UVS03G00 | |
| Media della classe Convertible (42.5 - 84.3, n=47, ultimi 2 anni) | |
| Microsoft Surface Pro 9, i7-1255U | |
| Dell XPS 13 9315 2-in-1 Core i5-1230U | |
| Microsoft Surface Pro 8, i7-1185G7 | |
| HP Elite Dragonfly Folio 13.5 G3 | |
| Media Intel Core i7-1255U (35.6 - 52.5, n=11) | |
| Asus ROG Flow Z13 GZ301ZE | |
| R Benchmark 2.5 / Overall mean | |
| Lenovo ThinkPad X12 20UVS03G00 | |
| Microsoft Surface Pro 8, i7-1185G7 | |
| Dell XPS 13 9315 2-in-1 Core i5-1230U | |
| Microsoft Surface Pro 9, i7-1255U | |
| Media Intel Core i7-1255U (0.4688 - 0.558, n=11) | |
| Media della classe Convertible (0.3915 - 0.84, n=47, ultimi 2 anni) | |
| HP Elite Dragonfly Folio 13.5 G3 | |
| Asus ROG Flow Z13 GZ301ZE | |
* ... Meglio usare valori piccoli
AIDA64: FP32 Ray-Trace | FPU Julia | CPU SHA3 | CPU Queen | FPU SinJulia | FPU Mandel | CPU AES | CPU ZLib | FP64 Ray-Trace | CPU PhotoWorxx
| Performance rating | |
| Media della classe Convertible | |
| Asus ROG Flow Z13 GZ301ZE | |
| Microsoft Surface Pro 9, i7-1255U | |
| HP Elite Dragonfly Folio 13.5 G3 | |
| Media Intel Core i7-1255U | |
| Microsoft Surface Pro 8, i7-1185G7 | |
| Dell XPS 13 9315 2-in-1 Core i5-1230U | |
| Lenovo ThinkPad X12 20UVS03G00 | |
| AIDA64 / FP32 Ray-Trace | |
| Media della classe Convertible (1480 - 64158, n=47, ultimi 2 anni) | |
| Microsoft Surface Pro 9, i7-1255U | |
| Asus ROG Flow Z13 GZ301ZE | |
| Microsoft Surface Pro 8, i7-1185G7 | |
| Media Intel Core i7-1255U (4313 - 8127, n=11) | |
| HP Elite Dragonfly Folio 13.5 G3 | |
| Dell XPS 13 9315 2-in-1 Core i5-1230U | |
| Lenovo ThinkPad X12 20UVS03G00 | |
| AIDA64 / FPU Julia | |
| Media della classe Convertible (11392 - 184800, n=47, ultimi 2 anni) | |
| Microsoft Surface Pro 9, i7-1255U | |
| Asus ROG Flow Z13 GZ301ZE | |
| HP Elite Dragonfly Folio 13.5 G3 | |
| Media Intel Core i7-1255U (19813 - 41353, n=11) | |
| Dell XPS 13 9315 2-in-1 Core i5-1230U | |
| Microsoft Surface Pro 8, i7-1185G7 | |
| Lenovo ThinkPad X12 20UVS03G00 | |
| AIDA64 / CPU SHA3 | |
| Media della classe Convertible (797 - 8291, n=47, ultimi 2 anni) | |
| Asus ROG Flow Z13 GZ301ZE | |
| Microsoft Surface Pro 9, i7-1255U | |
| Microsoft Surface Pro 8, i7-1185G7 | |
| Media Intel Core i7-1255U (1325 - 2135, n=11) | |
| HP Elite Dragonfly Folio 13.5 G3 | |
| Dell XPS 13 9315 2-in-1 Core i5-1230U | |
| Lenovo ThinkPad X12 20UVS03G00 | |
| AIDA64 / CPU Queen | |
| Asus ROG Flow Z13 GZ301ZE | |
| Microsoft Surface Pro 9, i7-1255U | |
| HP Elite Dragonfly Folio 13.5 G3 | |
| Media Intel Core i7-1255U (61375 - 65892, n=11) | |
| Media della classe Convertible (14686 - 148874, n=38, ultimi 2 anni) | |
| Dell XPS 13 9315 2-in-1 Core i5-1230U | |
| Microsoft Surface Pro 8, i7-1185G7 | |
| Lenovo ThinkPad X12 20UVS03G00 | |
| AIDA64 / FPU SinJulia | |
| Asus ROG Flow Z13 GZ301ZE | |
| Media della classe Convertible (1120 - 29155, n=47, ultimi 2 anni) | |
| Microsoft Surface Pro 9, i7-1255U | |
| Microsoft Surface Pro 8, i7-1185G7 | |
| Media Intel Core i7-1255U (3577 - 5095, n=11) | |
| HP Elite Dragonfly Folio 13.5 G3 | |
| Dell XPS 13 9315 2-in-1 Core i5-1230U | |
| Lenovo ThinkPad X12 20UVS03G00 | |
| AIDA64 / FPU Mandel | |
| Media della classe Convertible (4929 - 97193, n=47, ultimi 2 anni) | |
| Asus ROG Flow Z13 GZ301ZE | |
| Microsoft Surface Pro 9, i7-1255U | |
| Microsoft Surface Pro 8, i7-1185G7 | |
| HP Elite Dragonfly Folio 13.5 G3 | |
| Media Intel Core i7-1255U (11759 - 20187, n=11) | |
| Dell XPS 13 9315 2-in-1 Core i5-1230U | |
| Lenovo ThinkPad X12 20UVS03G00 | |
| AIDA64 / CPU AES | |
| Asus ROG Flow Z13 GZ301ZE | |
| Lenovo ThinkPad X12 20UVS03G00 | |
| Media della classe Convertible (5271 - 190280, n=47, ultimi 2 anni) | |
| Microsoft Surface Pro 9, i7-1255U | |
| Microsoft Surface Pro 8, i7-1185G7 | |
| Media Intel Core i7-1255U (27900 - 67458, n=11) | |
| HP Elite Dragonfly Folio 13.5 G3 | |
| Dell XPS 13 9315 2-in-1 Core i5-1230U | |
| AIDA64 / CPU ZLib | |
| Asus ROG Flow Z13 GZ301ZE | |
| Media della classe Convertible (218 - 2017, n=47, ultimi 2 anni) | |
| Microsoft Surface Pro 9, i7-1255U | |
| Media Intel Core i7-1255U (393 - 640, n=11) | |
| HP Elite Dragonfly Folio 13.5 G3 | |
| Dell XPS 13 9315 2-in-1 Core i5-1230U | |
| Microsoft Surface Pro 8, i7-1185G7 | |
| Lenovo ThinkPad X12 20UVS03G00 | |
| AIDA64 / FP64 Ray-Trace | |
| Media della classe Convertible (1169 - 34297, n=47, ultimi 2 anni) | |
| Asus ROG Flow Z13 GZ301ZE | |
| Microsoft Surface Pro 9, i7-1255U | |
| Microsoft Surface Pro 8, i7-1185G7 | |
| HP Elite Dragonfly Folio 13.5 G3 | |
| Media Intel Core i7-1255U (2474 - 4400, n=11) | |
| Dell XPS 13 9315 2-in-1 Core i5-1230U | |
| Lenovo ThinkPad X12 20UVS03G00 | |
| AIDA64 / CPU PhotoWorxx | |
| Media della classe Convertible (14193 - 85327, n=47, ultimi 2 anni) | |
| Microsoft Surface Pro 9, i7-1255U | |
| Asus ROG Flow Z13 GZ301ZE | |
| HP Elite Dragonfly Folio 13.5 G3 | |
| Microsoft Surface Pro 8, i7-1185G7 | |
| Lenovo ThinkPad X12 20UVS03G00 | |
| Dell XPS 13 9315 2-in-1 Core i5-1230U | |
| Media Intel Core i7-1255U (13899 - 44054, n=11) | |
Prestazioni del sistema
Le prestazioni soggettive del Surface Pro 9 sono molto buone e tutti gli input vengono eseguiti senza ritardi o blocchi. Il merito è senza dubbio dell'unità SSD PCIe. Anche le prestazioni nei benchmark sintetici sono molto buone.
CrossMark: Overall | Productivity | Creativity | Responsiveness
Jetstream 2: 2.0 Total
Speedometer 2.0: Result 2.0
WebXPRT 3: Overall
WebXPRT 4: Overall
| PCMark 10 / Score | |
| Media della classe Convertible (3229 - 10123, n=45, ultimi 2 anni) | |
| Asus ROG Flow Z13 GZ301ZE | |
| HP Elite Dragonfly Folio 13.5 G3 | |
| Media Intel Core i7-1255U, Intel Iris Xe Graphics G7 96EUs (4676 - 5523, n=9) | |
| Microsoft Surface Pro 9, i7-1255U | |
| Microsoft Surface Pro 8, i7-1185G7 | |
| Dell XPS 13 9315 2-in-1 Core i5-1230U | |
| Lenovo ThinkPad X12 20UVS03G00 | |
| PCMark 10 / Essentials | |
| HP Elite Dragonfly Folio 13.5 G3 | |
| Asus ROG Flow Z13 GZ301ZE | |
| Media della classe Convertible (7233 - 12222, n=45, ultimi 2 anni) | |
| Media Intel Core i7-1255U, Intel Iris Xe Graphics G7 96EUs (9381 - 11654, n=9) | |
| Dell XPS 13 9315 2-in-1 Core i5-1230U | |
| Microsoft Surface Pro 9, i7-1255U | |
| Lenovo ThinkPad X12 20UVS03G00 | |
| Microsoft Surface Pro 8, i7-1185G7 | |
| PCMark 10 / Productivity | |
| Media della classe Convertible (5062 - 17914, n=45, ultimi 2 anni) | |
| Asus ROG Flow Z13 GZ301ZE | |
| HP Elite Dragonfly Folio 13.5 G3 | |
| Media Intel Core i7-1255U, Intel Iris Xe Graphics G7 96EUs (6530 - 7418, n=9) | |
| Dell XPS 13 9315 2-in-1 Core i5-1230U | |
| Microsoft Surface Pro 9, i7-1255U | |
| Microsoft Surface Pro 8, i7-1185G7 | |
| Lenovo ThinkPad X12 20UVS03G00 | |
| PCMark 10 / Digital Content Creation | |
| Media della classe Convertible (2496 - 16551, n=45, ultimi 2 anni) | |
| Asus ROG Flow Z13 GZ301ZE | |
| HP Elite Dragonfly Folio 13.5 G3 | |
| Microsoft Surface Pro 9, i7-1255U | |
| Media Intel Core i7-1255U, Intel Iris Xe Graphics G7 96EUs (4498 - 6203, n=9) | |
| Microsoft Surface Pro 8, i7-1185G7 | |
| Dell XPS 13 9315 2-in-1 Core i5-1230U | |
| Lenovo ThinkPad X12 20UVS03G00 | |
| CrossMark / Overall | |
| Asus ROG Flow Z13 GZ301ZE | |
| HP Elite Dragonfly Folio 13.5 G3 | |
| Media della classe Convertible (524 - 2274, n=48, ultimi 2 anni) | |
| Apple iPad Pro 12.9 2022 | |
| Microsoft Surface Pro 9, i7-1255U | |
| Media Intel Core i7-1255U, Intel Iris Xe Graphics G7 96EUs (1329 - 1573, n=9) | |
| Microsoft Surface Pro 8, i7-1185G7 | |
| Dell XPS 13 9315 2-in-1 Core i5-1230U | |
| CrossMark / Productivity | |
| Asus ROG Flow Z13 GZ301ZE | |
| HP Elite Dragonfly Folio 13.5 G3 | |
| Media della classe Convertible (554 - 1942, n=48, ultimi 2 anni) | |
| Microsoft Surface Pro 9, i7-1255U | |
| Media Intel Core i7-1255U, Intel Iris Xe Graphics G7 96EUs (1364 - 1554, n=9) | |
| Apple iPad Pro 12.9 2022 | |
| Microsoft Surface Pro 8, i7-1185G7 | |
| Dell XPS 13 9315 2-in-1 Core i5-1230U | |
| CrossMark / Creativity | |
| Asus ROG Flow Z13 GZ301ZE | |
| Apple iPad Pro 12.9 2022 | |
| Media della classe Convertible (550 - 2949, n=48, ultimi 2 anni) | |
| HP Elite Dragonfly Folio 13.5 G3 | |
| Microsoft Surface Pro 9, i7-1255U | |
| Media Intel Core i7-1255U, Intel Iris Xe Graphics G7 96EUs (1372 - 1660, n=9) | |
| Microsoft Surface Pro 8, i7-1185G7 | |
| Dell XPS 13 9315 2-in-1 Core i5-1230U | |
| CrossMark / Responsiveness | |
| Asus ROG Flow Z13 GZ301ZE | |
| HP Elite Dragonfly Folio 13.5 G3 | |
| Media della classe Convertible (381 - 1719, n=48, ultimi 2 anni) | |
| Microsoft Surface Pro 9, i7-1255U | |
| Media Intel Core i7-1255U, Intel Iris Xe Graphics G7 96EUs (1117 - 1434, n=9) | |
| Dell XPS 13 9315 2-in-1 Core i5-1230U | |
| Apple iPad Pro 12.9 2022 | |
| Microsoft Surface Pro 8, i7-1185G7 | |
| Jetstream 2 / 2.0 Total | |
| Media della classe Convertible (127.2 - 454, n=15, ultimi 2 anni) | |
| Microsoft Surface Pro 9, i7-1255U | |
| Media Intel Core i7-1255U, Intel Iris Xe Graphics G7 96EUs (206 - 249, n=7) | |
| Dell XPS 13 9315 2-in-1 Core i5-1230U | |
| Apple iPad Pro 12.9 2022 | |
| Asus ROG Flow Z13 GZ301ZE | |
| Microsoft Surface Pro 8, i7-1185G7 | |
| Lenovo ThinkPad X12 20UVS03G00 | |
| Speedometer 2.0 / Result 2.0 | |
| Media della classe Convertible (168.2 - 644, n=12, ultimi 2 anni) | |
| Apple iPad Pro 12.9 2022 | |
| Media Intel Core i7-1255U, Intel Iris Xe Graphics G7 96EUs (222 - 299, n=5) | |
| Microsoft Surface Pro 9, i7-1255U | |
| Microsoft Surface Pro 8, i7-1185G7 | |
| Asus ROG Flow Z13 GZ301ZE | |
| WebXPRT 3 / Overall | |
| Apple iPad Pro 12.9 2022 | |
| Asus ROG Flow Z13 GZ301ZE | |
| Media della classe Convertible (171 - 426, n=48, ultimi 2 anni) | |
| HP Elite Dragonfly Folio 13.5 G3 | |
| Media Intel Core i7-1255U, Intel Iris Xe Graphics G7 96EUs (200 - 366, n=9) | |
| Microsoft Surface Pro 9, i7-1255U | |
| Microsoft Surface Pro 8, i7-1185G7 | |
| Dell XPS 13 9315 2-in-1 Core i5-1230U | |
| Lenovo ThinkPad X12 20UVS03G00 | |
| WebXPRT 4 / Overall | |
| Media della classe Convertible (91.2 - 317, n=47, ultimi 2 anni) | |
| HP Elite Dragonfly Folio 13.5 G3 | |
| Media Intel Core i7-1255U, Intel Iris Xe Graphics G7 96EUs (183.4 - 249, n=9) | |
| Microsoft Surface Pro 9, i7-1255U | |
| Apple iPad Pro 12.9 2022 | |
| Dell XPS 13 9315 2-in-1 Core i5-1230U | |
| PCMark 10 Score | 5257 punti | |
Aiuto | ||
| AIDA64 / Memory Copy | |
| Media della classe Convertible (23880 - 161475, n=47, ultimi 2 anni) | |
| Asus ROG Flow Z13 GZ301ZE | |
| Microsoft Surface Pro 9, i7-1255U | |
| HP Elite Dragonfly Folio 13.5 G3 | |
| Dell XPS 13 9315 2-in-1 Core i5-1230U | |
| Microsoft Surface Pro 8, i7-1185G7 | |
| Lenovo ThinkPad X12 20UVS03G00 | |
| Media Intel Core i7-1255U (22846 - 67017, n=11) | |
| AIDA64 / Memory Read | |
| Media della classe Convertible (19931 - 131960, n=47, ultimi 2 anni) | |
| Asus ROG Flow Z13 GZ301ZE | |
| HP Elite Dragonfly Folio 13.5 G3 | |
| Microsoft Surface Pro 9, i7-1255U | |
| Microsoft Surface Pro 8, i7-1185G7 | |
| Lenovo ThinkPad X12 20UVS03G00 | |
| Dell XPS 13 9315 2-in-1 Core i5-1230U | |
| Media Intel Core i7-1255U (22877 - 67398, n=11) | |
| AIDA64 / Memory Write | |
| Media della classe Convertible (17473 - 216896, n=47, ultimi 2 anni) | |
| HP Elite Dragonfly Folio 13.5 G3 | |
| Dell XPS 13 9315 2-in-1 Core i5-1230U | |
| Asus ROG Flow Z13 GZ301ZE | |
| Microsoft Surface Pro 9, i7-1255U | |
| Lenovo ThinkPad X12 20UVS03G00 | |
| Microsoft Surface Pro 8, i7-1185G7 | |
| Media Intel Core i7-1255U (22883 - 65839, n=11) | |
| AIDA64 / Memory Latency | |
| Media della classe Convertible (6.9 - 536, n=47, ultimi 2 anni) | |
| HP Elite Dragonfly Folio 13.5 G3 | |
| Asus ROG Flow Z13 GZ301ZE | |
| Dell XPS 13 9315 2-in-1 Core i5-1230U | |
| Microsoft Surface Pro 9, i7-1255U | |
| Microsoft Surface Pro 8, i7-1185G7 | |
| Lenovo ThinkPad X12 20UVS03G00 | |
| Media Intel Core i7-1255U (76 - 163.2, n=11) | |
* ... Meglio usare valori piccoli
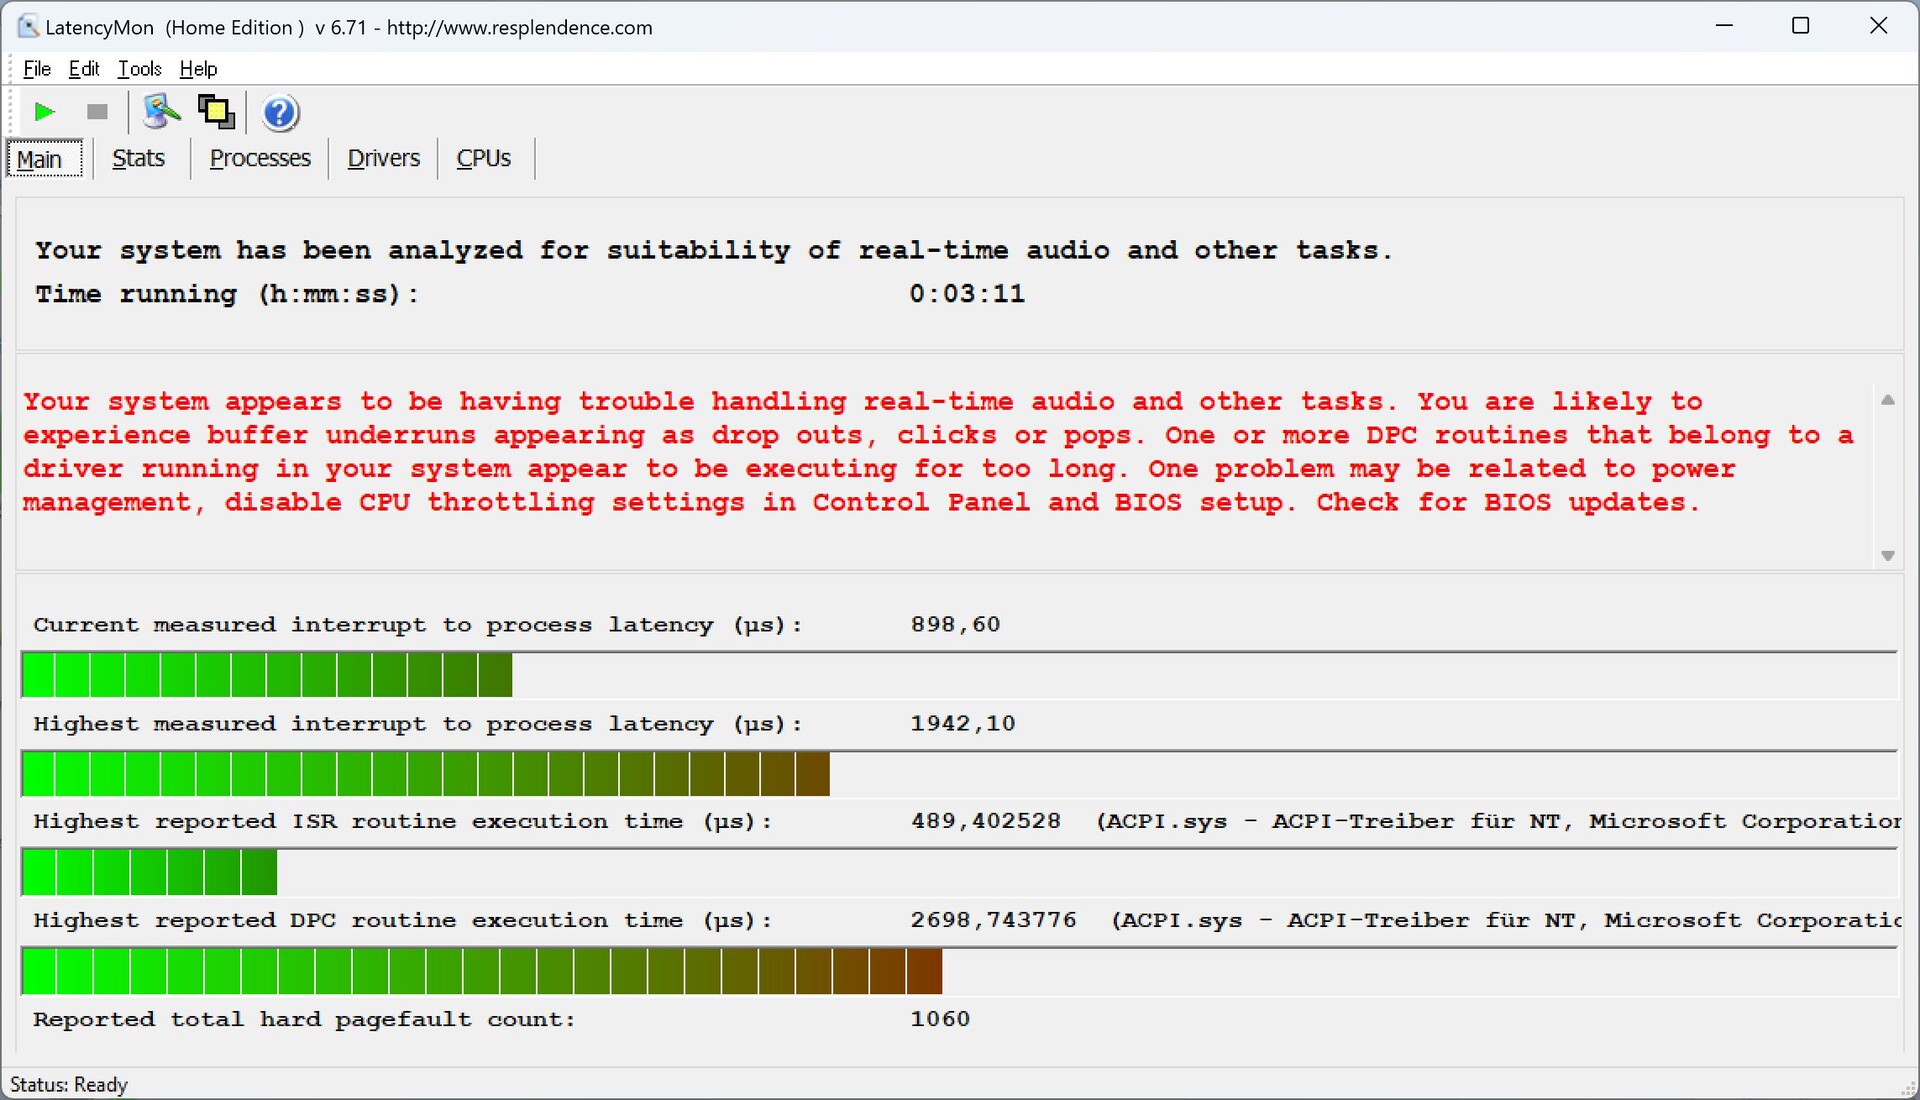
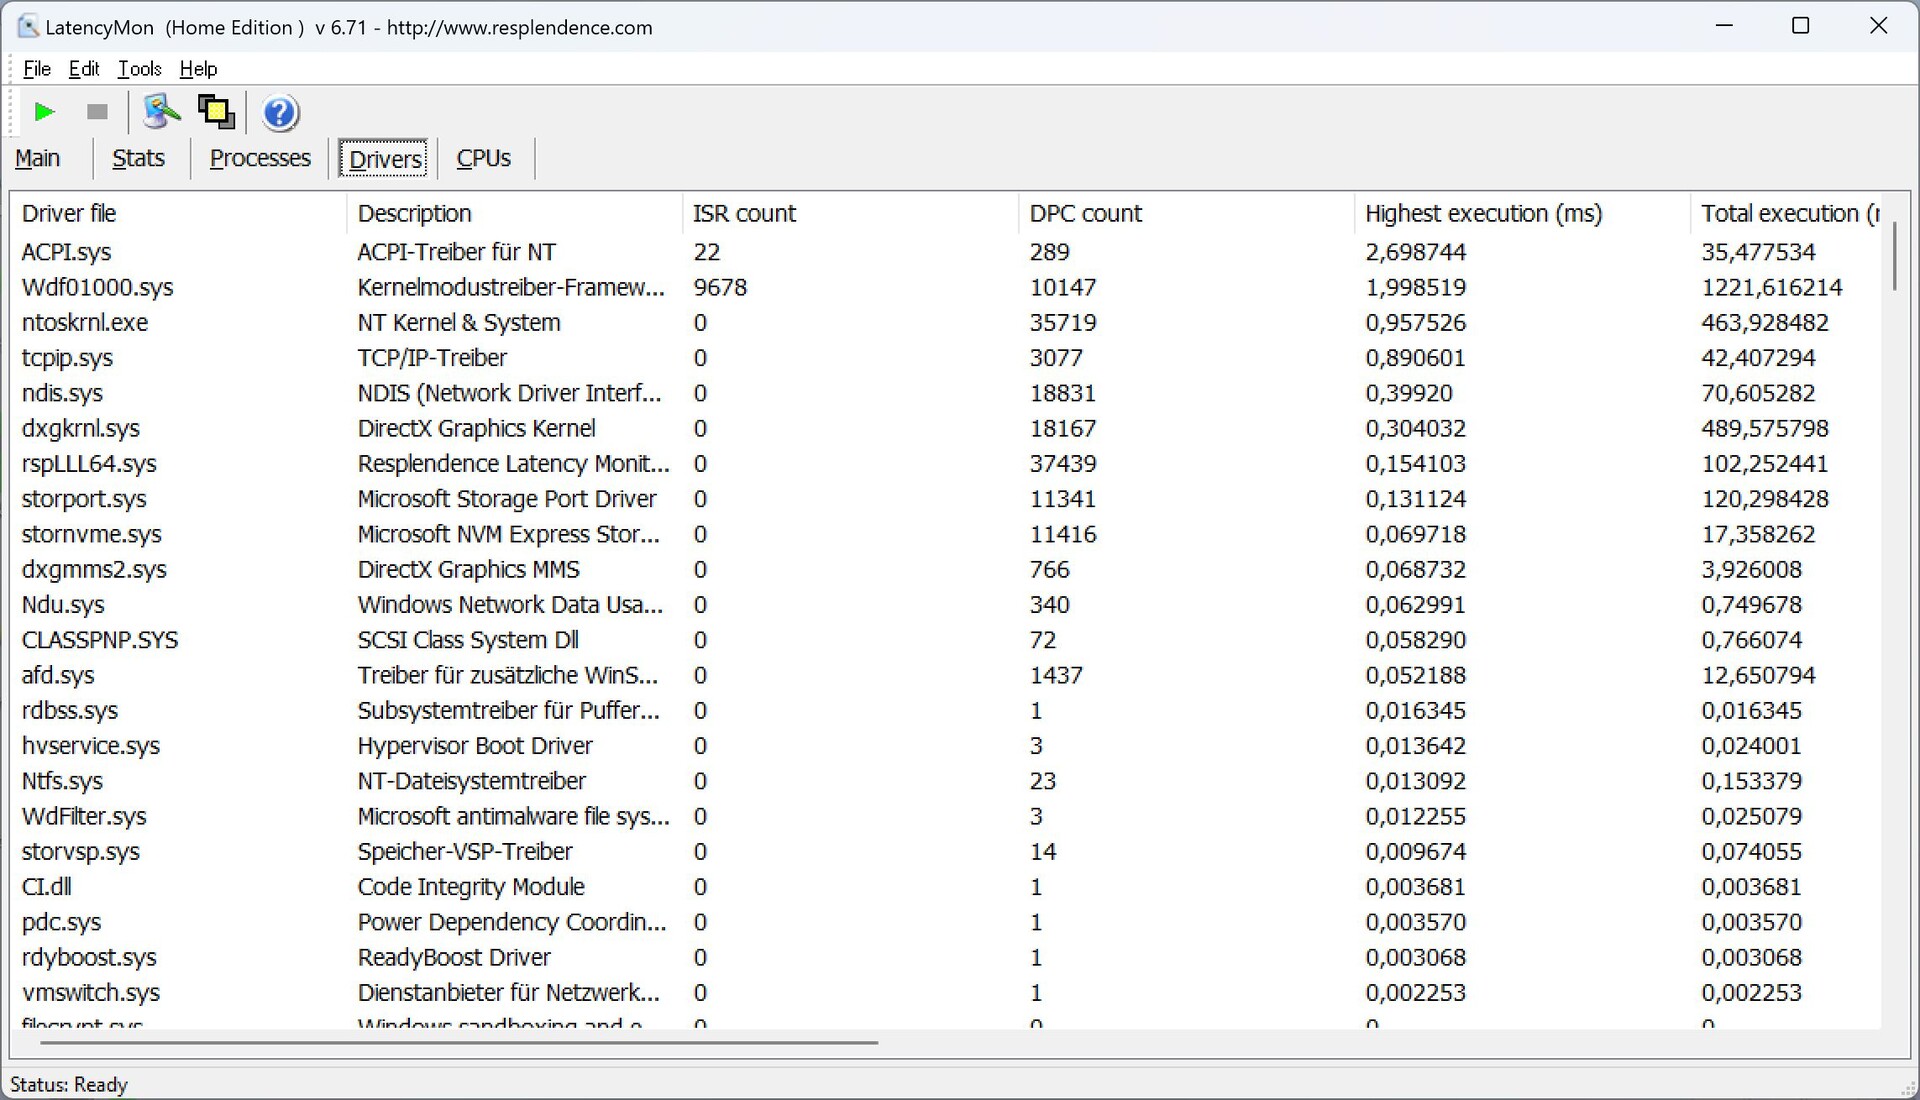
Latenza DPC
Nel nostro test di latenza standardizzato (navigazione web, riproduzione YouTube 4K, carico della CPU), il nuovo Surface Pro 9 con l'attuale versione del BIOS si comporta peggio del suo predecessore.predecessoree quindi è solo condizionatamente adatto alle applicazioni audio in tempo reale.
| DPC Latencies / LatencyMon - interrupt to process latency (max), Web, Youtube, Prime95 | |
| HP Elite Dragonfly Folio 13.5 G3 | |
| Dell XPS 13 9315 2-in-1 Core i5-1230U | |
| Microsoft Surface Pro 9, i7-1255U | |
| Asus ROG Flow Z13 GZ301ZE | |
| Microsoft Surface Pro 8, i7-1185G7 | |
| Lenovo ThinkPad X12 20UVS03G00 | |
* ... Meglio usare valori piccoli
Dispositivi di archiviazione
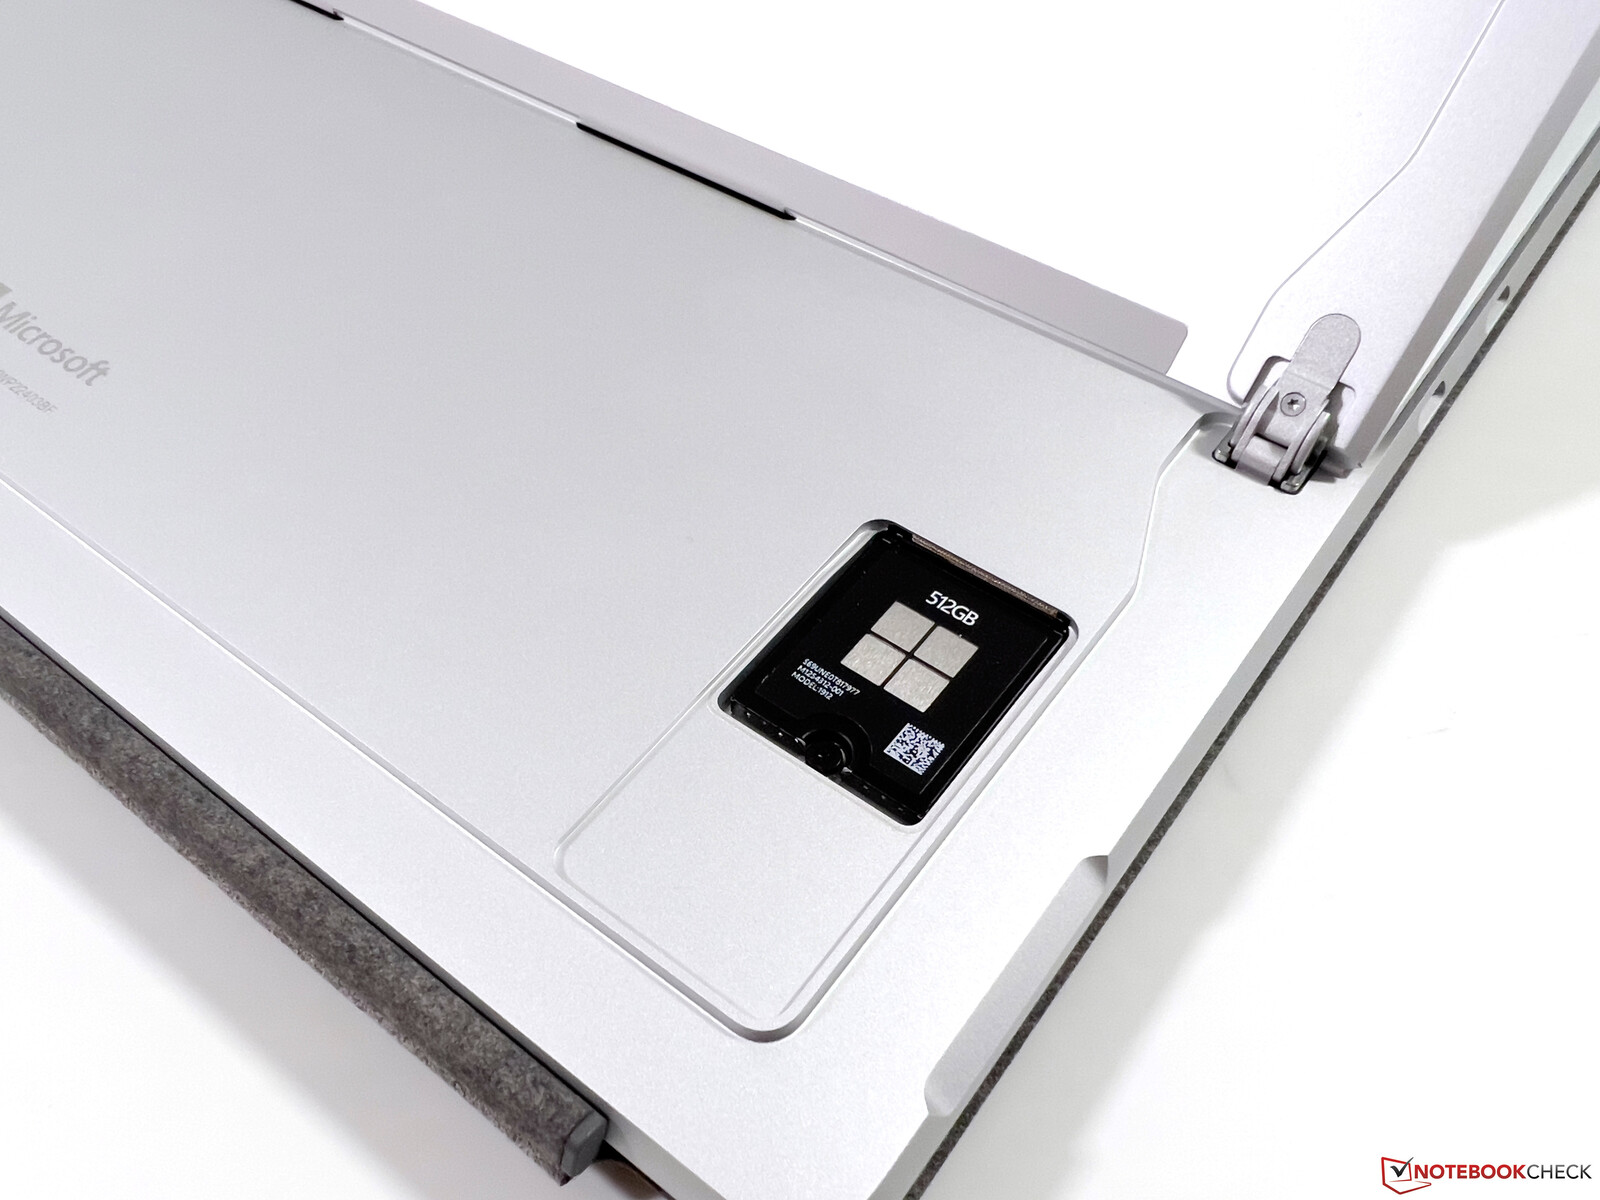
Microsoft utilizza ancora unità SSD M.2-2230 compatte e i dispositivi possono essere sostituiti dall'utente. Nel nostro esemplare in prova è stata utilizzata un'unità da 512 GB di Samsung che, secondo i Microsoft Tools, sembra essere collegata tramite PCIe 4.0. Tuttavia, la velocità massima di trasferimento è limitata a circa 3,4 GB/s e non sappiamo esattamente se la causa sia l'unità SSD o il Surface Pro. D'altra parte, questo non ha un ruolo importante nell'uso quotidiano e la velocità è perfettamente sufficiente. Dei 512 GB, 429 GB sono ancora disponibili dopo l'installazione del sistema operativo. Altri benchmark sulle SSD sono elencati nellala nostra sezione tecnica.

* ... Meglio usare valori piccoli
Dauerleistung Lesen: DiskSpd Read Loop, Queue Depth 8
Scheda grafica
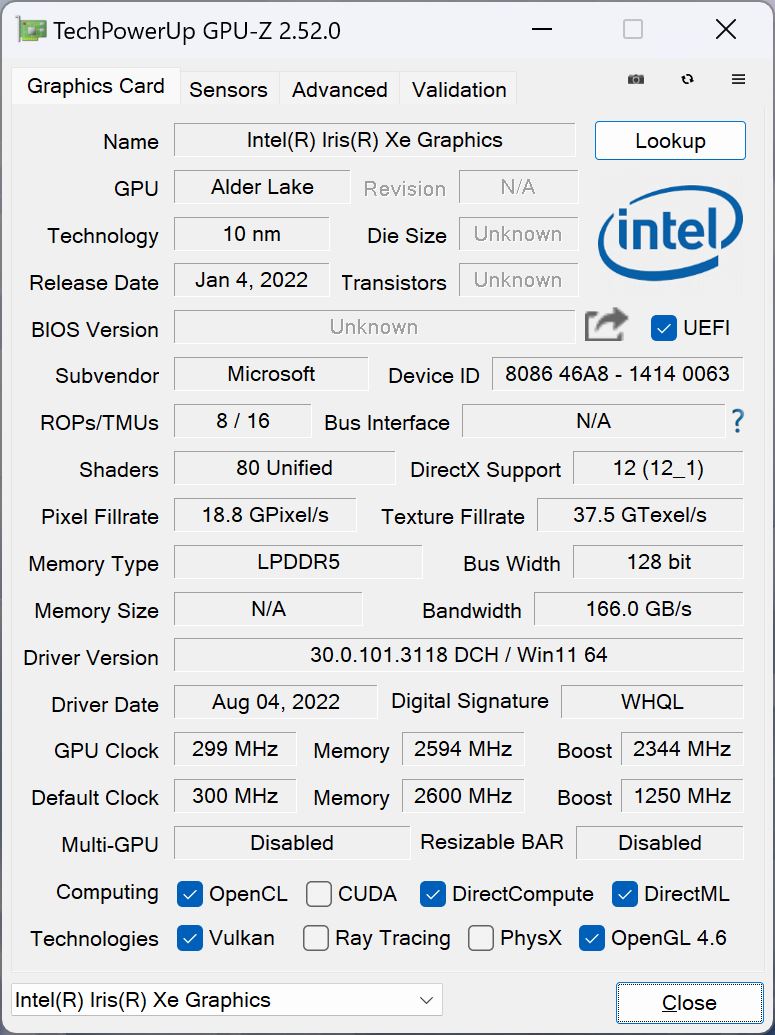
Le CPU Alder Lake di Intel sono ancora dotate della nota graficaGrafica Iris Xe G7. In combinazione con il Core i5 1235U, viene utilizzato il chip con 80 unità di esecuzione; nell'esemplare da noi recensito con il Core i7, abbiamo il chip più veloce con 96 EU. In termini di prestazioni, non ci sono differenze rispetto al vecchio modello e le GPU integrate di AMD e Apple sono significativamente più veloci (anche se al momento non esistono praticamente convertibili/tablet comparabili con hardware AMD).
Le prestazioni sono perfettamente sufficienti per l'uso quotidiano e anche i video ad alta risoluzione girano senza problemi, ma i giochi sono generalmente limitati a dettagli minimi o medi e a risoluzioni ridotte. Chi è appassionato di videogiochi può collegare una GPU esterna o dare un'occhiata al modelloROG Flow Z13che offre maggiori prestazioni di gioco grazie alla sua RTX 3050.
Almeno le prestazioni della GPU rimangono stabili durante le lunghe sessioni di gioco. Con l'alimentazione a batteria, tuttavia, le prestazioni calano di circa il 75%. Altri benchmark della GPU sono disponibiliqui.
| 3DMark 11 Performance | 6903 punti | |
| 3DMark Fire Strike Score | 4873 punti | |
| 3DMark Time Spy Score | 1821 punti | |
Aiuto | ||
* ... Meglio usare valori piccoli
| The Witcher 3 - 1920x1080 Ultra Graphics & Postprocessing (HBAO+) | |
| Media della classe Convertible (13.4 - 101, n=3, ultimi 2 anni) | |
| Asus ROG Flow Z13 GZ301ZE | |
| Microsoft Surface Pro 8, i7-1185G7 | |
| HP Elite Dragonfly Folio 13.5 G3 | |
| Microsoft Surface Pro 9, i7-1255U | |
| Dell XPS 13 9315 2-in-1 Core i5-1230U | |
| Final Fantasy XV Benchmark - 1920x1080 High Quality | |
| Asus ROG Flow Z13 GZ301ZE | |
| Media della classe Convertible (4.48 - 86.6, n=44, ultimi 2 anni) | |
| Microsoft Surface Pro 8, i7-1185G7 | |
| Microsoft Surface Pro 9, i7-1255U | |
| HP Elite Dragonfly Folio 13.5 G3 | |
| Strange Brigade - 1920x1080 ultra AA:ultra AF:16 | |
| Asus ROG Flow Z13 GZ301ZE | |
| Media della classe Convertible (10.8 - 176.8, n=44, ultimi 2 anni) | |
| Microsoft Surface Pro 8, i7-1185G7 | |
| Microsoft Surface Pro 9, i7-1255U | |
| HP Elite Dragonfly Folio 13.5 G3 | |
Witcher 3 FPS Chart
| basso | medio | alto | ultra | |
|---|---|---|---|---|
| GTA V (2015) | 104.3 | 93.1 | 24.7 | 10.6 |
| The Witcher 3 (2015) | 91 | 59 | 33 | 12.8 |
| Dota 2 Reborn (2015) | 104.2 | 82.2 | 64.8 | 57 |
| Final Fantasy XV Benchmark (2018) | 42.9 | 24.2 | 16.8 | |
| X-Plane 11.11 (2018) | 46.3 | 36.6 | 31.6 | |
| Far Cry 5 (2018) | 28 | 24 | 20 | |
| Strange Brigade (2018) | 88.9 | 41.7 | 32.5 | 26.2 |
| F1 2021 (2021) | 107.8 | 51.6 | 40.6 | 27.8 |
| Farming Simulator 22 (2021) | 81 | 37 | 28 | 26 |
| F1 22 (2022) | 47.4 | 43.5 | 30.7 |
Emissioni - La CPU più veloce comporta una maggiore attività della ventola
Rumore
La ventola del Surface Pro 9 è paragonabile a quella del vecchio Surface Pro 8 alla massima velocità e raggiunge quasi 42 dB(A) a pieno carico. La piccola ventola è chiaramente udibile, ma più problematico è il fatto che la ventola entra in funzione più spesso nell'uso quotidiano a causa degli elevati limiti di potenza. È quindi consigliabile selezionare una modalità energetica più debole per le attività semplici, in modo che il convertibile rimanga silenzioso più a lungo nell'uso ordinario. Non sono stati rilevati altri rumori elettronici. Entrambi i modelli XPS 13 9315 e l'iPad iPad Prohanno un chiaro vantaggio in questo senso, in quanto sono raffreddati passivamente e quindi rimangono silenziosi.
Rumorosità
| Idle |
| 24.3 / 24.3 / 24.3 dB(A) |
| Sotto carico |
| 37.9 / 41.8 dB(A) |
 | ||
30 dB silenzioso 40 dB(A) udibile 50 dB(A) rumoroso |
||
min: | ||
| Microsoft Surface Pro 9, i7-1255U Iris Xe G7 96EUs, i7-1255U, Samsung MZ9L4512HBLU-00BMV | Dell XPS 13 9315 2-in-1 Core i5-1230U Iris Xe G7 80EUs, i5-1230U | Lenovo ThinkPad X12 20UVS03G00 Iris Xe G7 96EUs, i7-1160G7, Toshiba BG4 KBG40ZNT512G | HP Elite Dragonfly Folio 13.5 G3 Iris Xe G7 96EUs, i7-1265U, Samsung PM9A1 MZVL2512HCJQ | Apple iPad Pro 12.9 2022 M2 10-Core GPU, M2, 128 GB NVMe | Asus ROG Flow Z13 GZ301ZE GeForce RTX 3050 Ti Laptop GPU, i9-12900H, Micron 2450 1TB MTFDKBK1T0TFK | Microsoft Surface Pro 8, i7-1185G7 Iris Xe G7 96EUs, i7-1185G7, Toshiba KBG40ZNS256G NVMe | |
|---|---|---|---|---|---|---|---|
| Noise | 2% | 8% | -2% | -0% | |||
| off /ambiente * (dB) | 24.3 | 25.1 -3% | 24.6 -1% | 24.5 -1% | 24.7 -2% | ||
| Idle Minimum * (dB) | 24.3 | 25.1 -3% | 24.6 -1% | 24.5 -1% | 24.7 -2% | ||
| Idle Average * (dB) | 24.3 | 25.1 -3% | 24.6 -1% | 24.5 -1% | 24.7 -2% | ||
| Idle Maximum * (dB) | 24.3 | 26 -7% | 24.6 -1% | 24.5 -1% | 24.7 -2% | ||
| Load Average * (dB) | 37.9 | 34.6 9% | 27.8 27% | 41 -8% | 36.8 3% | ||
| Witcher 3 ultra * (dB) | 39.6 | 34.6 13% | 33.4 16% | 41 -4% | 36.8 7% | ||
| Load Maximum * (dB) | 41.8 | 37 11% | 33.4 20% | 41 2% | 43.8 -5% |
* ... Meglio usare valori piccoli
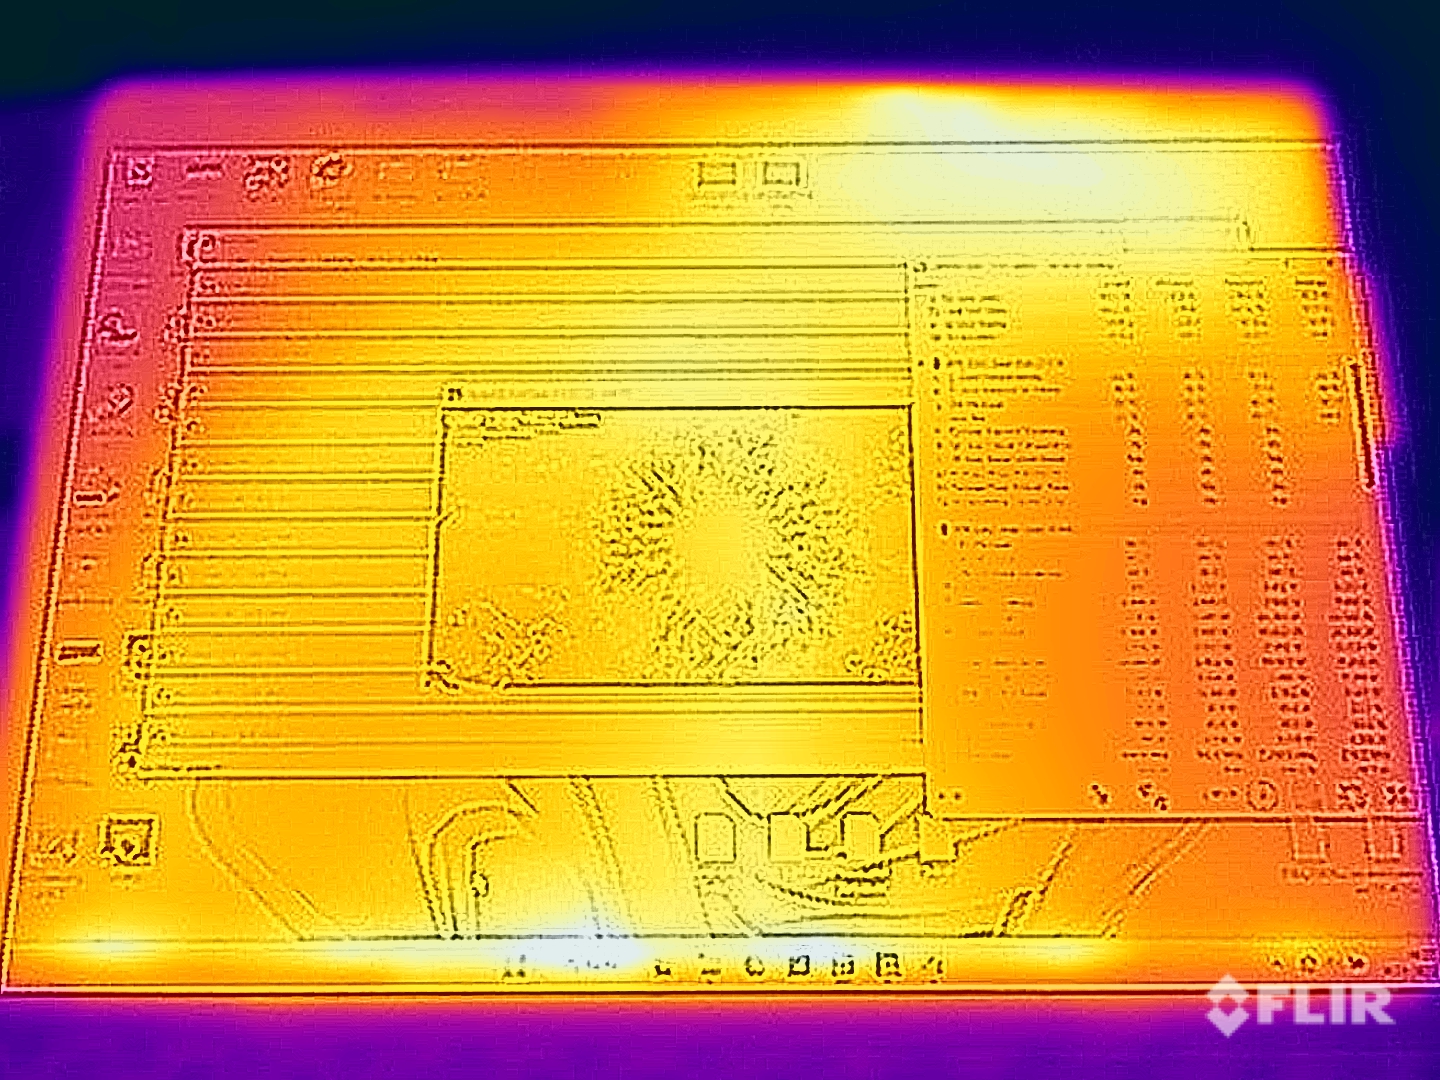
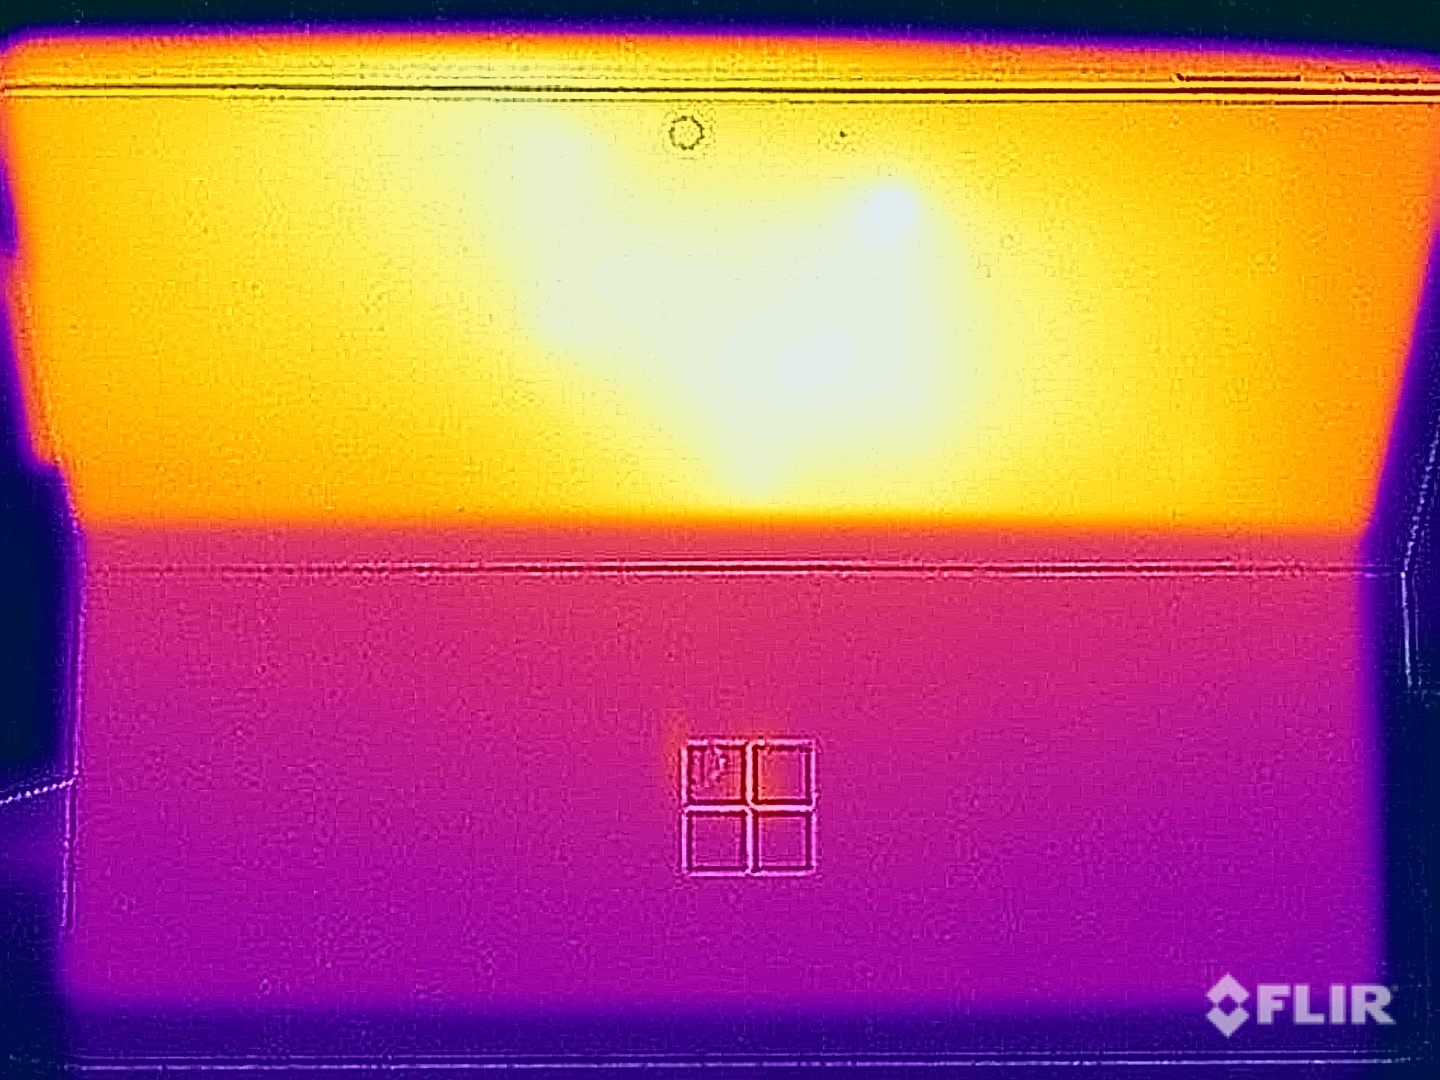
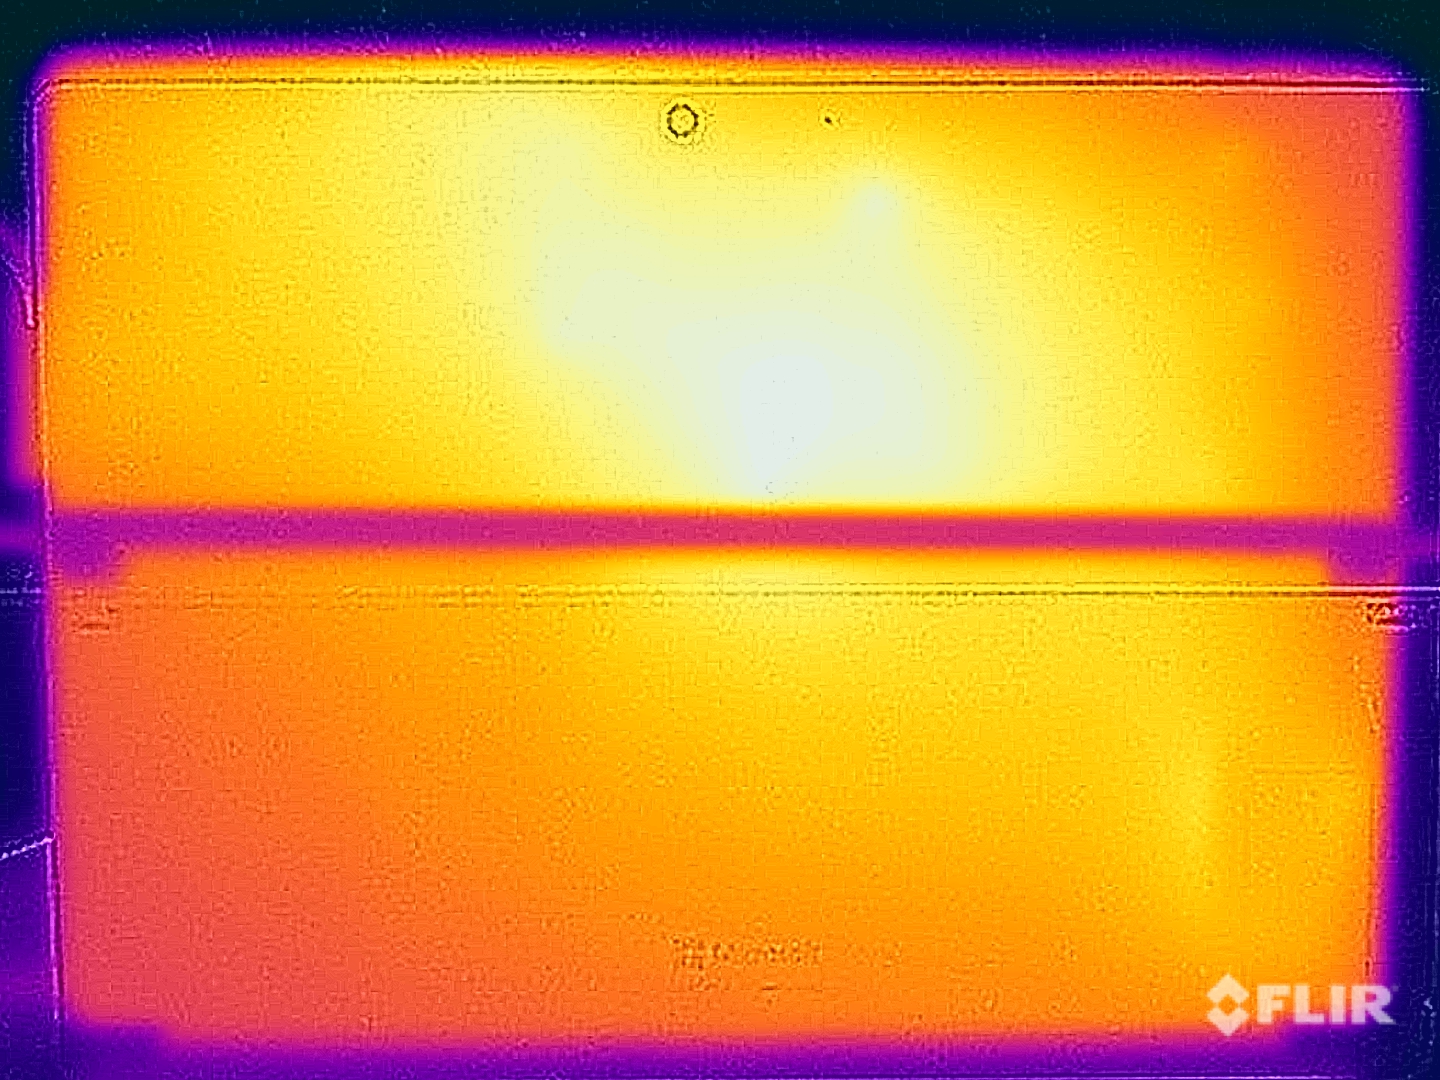
Temperatura
Il case metallico del Surface Pro 9 non si scalda quasi mai nell'uso quotidiano e durante le attività leggere, ma abbiamo misurato più di 45 °C sul retro in condizioni di carico elevato (ad esempio con un carico elevato della CPU o durante i giochi). A causa della superficie metallica, la sensazione è sgradevole e in queste situazioni non si dovrebbe tenere il dispositivo in mano, ma piuttosto appoggiarlo sulle cosce o su un tavolo.
Lo stress test mostra lo stesso comportamento del carico puro della CPU. Dopo aver raggiunto un picco di 60 watt, il processore rimane a 35 watt per alcuni minuti prima di stabilizzarsi a 22 watt. È interessante notare che Microsoft supera addirittura il consumo massimo di 55 watt specificato (da Intel) per la CPU Alder Lake-U.
(±) La temperatura massima sul lato superiore è di 44.6 °C / 112 F, rispetto alla media di 35.4 °C / 96 F, che varia da 19.6 a 60 °C per questa classe Convertible.
(-) Il lato inferiore si riscalda fino ad un massimo di 45.9 °C / 115 F, rispetto alla media di 36.9 °C / 98 F
(+) In idle, la temperatura media del lato superiore è di 24.6 °C / 76 F, rispetto alla media deld ispositivo di 30.3 °C / 87 F.
(-) Riproducendo The Witcher 3, la temperatura media per il lato superiore e' di 41.5 °C / 107 F, rispetto alla media del dispositivo di 30.3 °C / 87 F.
(-) I poggiapolsi e il touchpad possono diventare molto caldi al tatto con un massimo di 42.6 °C / 108.7 F.
(-) La temperatura media della zona del palmo della mano di dispositivi simili e'stata di 28 °C / 82.4 F (-14.6 °C / -26.3 F).
| Microsoft Surface Pro 9, i7-1255U Intel Core i7-1255U, Intel Iris Xe Graphics G7 96EUs | Dell XPS 13 9315 2-in-1 Core i5-1230U Intel Core i5-1230U, Intel Iris Xe Graphics G7 80EUs | Lenovo ThinkPad X12 20UVS03G00 Intel Core i7-1160G7, Intel Iris Xe Graphics G7 96EUs | HP Elite Dragonfly Folio 13.5 G3 Intel Core i7-1265U, Intel Iris Xe Graphics G7 96EUs | Apple iPad Pro 12.9 2022 Apple M2, Apple M2 10-Core GPU | Asus ROG Flow Z13 GZ301ZE Intel Core i9-12900H, NVIDIA GeForce RTX 3050 Ti Laptop GPU | Microsoft Surface Pro 8, i7-1185G7 Intel Core i7-1185G7, Intel Iris Xe Graphics G7 96EUs | |
|---|---|---|---|---|---|---|---|
| Heat | 1% | 5% | 14% | -3% | -11% | 2% | |
| Maximum Upper Side * (°C) | 44.6 | 41.8 6% | 39 13% | 32.8 26% | 36.9 17% | 45.3 -2% | 45 -1% |
| Maximum Bottom * (°C) | 45.9 | 38.2 17% | 41.7 9% | 33.4 27% | 37.6 18% | 48.3 -5% | 47.2 -3% |
| Idle Upper Side * (°C) | 24.8 | 27.4 -10% | 25.6 -3% | 24.6 1% | 31.9 -29% | 29.2 -18% | 24.1 3% |
| Idle Bottom * (°C) | 25.3 | 27.2 -8% | 25.6 -1% | 24.6 3% | 29.4 -16% | 30 -19% | 23.4 8% |
* ... Meglio usare valori piccoli
Altoparlanti
I due altoparlanti stereo (2 watt) sono comunque molto buoni e hanno un suono abbastanza voluminoso. Tuttavia, non bisogna aspettarsi troppo in termini di bassi, il che è generalmente vero per questa categoria di dispositivi (ad esempio, anche per gli altoparlanti dell'iPad Pro).iPad Pro).
Microsoft Surface Pro 9, i7-1255U analisi audio
(±) | potenza degli altiparlanti media ma buona (79.4 dB)
Bassi 100 - 315 Hz
(±) | bassi ridotti - in media 11.7% inferiori alla media
(±) | la linearità dei bassi è media (8.8% delta rispetto alla precedente frequenza)
Medi 400 - 2000 Hz
(±) | medi elevati - circa 5.1% superiore alla media
(+) | medi lineari (3% delta rispetto alla precedente frequenza)
Alti 2 - 16 kHz
(+) | Alti bilanciati - appena 4% dalla media
(+) | alti lineari (3.4% delta rispetto alla precedente frequenza)
Nel complesso 100 - 16.000 Hz
(+) | suono nel complesso lineare (14.9% differenza dalla media)
Rispetto alla stessa classe
» 24% di tutti i dispositivi testati in questa classe è stato migliore, 5% simile, 72% peggiore
» Il migliore ha avuto un delta di 6%, medio di 20%, peggiore di 57%
Rispetto a tutti i dispositivi testati
» 20% di tutti i dispositivi testati in questa classe è stato migliore, 4% similare, 76% peggiore
» Il migliore ha avuto un delta di 4%, medio di 23%, peggiore di 134%
Apple iPad Pro 12.9 2022 analisi audio
(+) | gli altoparlanti sono relativamente potenti (84.3 dB)
Bassi 100 - 315 Hz
(±) | bassi ridotti - in media 9.6% inferiori alla media
(±) | la linearità dei bassi è media (9% delta rispetto alla precedente frequenza)
Medi 400 - 2000 Hz
(+) | medi bilanciati - solo only 2.4% rispetto alla media
(+) | medi lineari (3.4% delta rispetto alla precedente frequenza)
Alti 2 - 16 kHz
(+) | Alti bilanciati - appena 1.5% dalla media
(+) | alti lineari (3.2% delta rispetto alla precedente frequenza)
Nel complesso 100 - 16.000 Hz
(+) | suono nel complesso lineare (8.8% differenza dalla media)
Rispetto alla stessa classe
» 2% di tutti i dispositivi testati in questa classe è stato migliore, 2% simile, 96% peggiore
» Il migliore ha avuto un delta di 7%, medio di 20%, peggiore di 129%
Rispetto a tutti i dispositivi testati
» 3% di tutti i dispositivi testati in questa classe è stato migliore, 1% similare, 97% peggiore
» Il migliore ha avuto un delta di 4%, medio di 23%, peggiore di 134%
Dell XPS 13 9315 2-in-1 Core i5-1230U analisi audio
(±) | potenza degli altiparlanti media ma buona (80.3 dB)
Bassi 100 - 315 Hz
(±) | bassi ridotti - in media 8.9% inferiori alla media
(+) | bassi in lineaa (5.7% delta rispetto alla precedente frequenza)
Medi 400 - 2000 Hz
(+) | medi bilanciati - solo only 2.2% rispetto alla media
(+) | medi lineari (5.2% delta rispetto alla precedente frequenza)
Alti 2 - 16 kHz
(±) | alti elevati - circa 5.5% superiori alla media
(+) | alti lineari (6.8% delta rispetto alla precedente frequenza)
Nel complesso 100 - 16.000 Hz
(+) | suono nel complesso lineare (11.9% differenza dalla media)
Rispetto alla stessa classe
» 11% di tutti i dispositivi testati in questa classe è stato migliore, 3% simile, 85% peggiore
» Il migliore ha avuto un delta di 6%, medio di 20%, peggiore di 57%
Rispetto a tutti i dispositivi testati
» 9% di tutti i dispositivi testati in questa classe è stato migliore, 2% similare, 89% peggiore
» Il migliore ha avuto un delta di 4%, medio di 23%, peggiore di 134%
Gestione dell'alimentazione - 120 Hz costa la durata della batteria
Consumo di energia
Abbiamo effettuato le misurazioni di potenza anche in modalità 60 Hz, ma i valori di idle, compresi tra 5,1 e 11,3 watt, sono leggermente superiori a quelli del vecchio modello. I valori sono simili sotto carico, ma i limiti di potenza elevati del processore diventano evidenti sotto pieno carico, perché abbiamo raggiunto il limite di 68 watt dell'alimentatore nei primi ~30 secondi. In questo caso, il dispositivo deve attingere brevemente alla batteria per fornire l'energia necessaria. In seguito, il consumo si stabilizza su valori più bassi (prima ~58 e poi ~46 watt), quindi l'alimentatore da 60 watt è ancora sufficiente nella pratica.
Microsoft è riuscita a ridurre il consumo di energia quando è spento e in standby. L'alimentatore offre anche una porta USB-A, che può essere utilizzata ad esempio per ricaricare uno smartphone (max. 5 watt).
| Off / Standby | |
| Idle | |
| Sotto carico |
|
Leggenda:
min: | |
| Microsoft Surface Pro 9, i7-1255U i7-1255U, Iris Xe G7 96EUs, Samsung MZ9L4512HBLU-00BMV, IPS, 2880x1920, 13" | Dell XPS 13 9315 2-in-1 Core i5-1230U i5-1230U, Iris Xe G7 80EUs, , IPS, 2880x1920, 13" | Lenovo ThinkPad X12 20UVS03G00 i7-1160G7, Iris Xe G7 96EUs, Toshiba BG4 KBG40ZNT512G, a-Si IPS LED, 1920x1280, 12.3" | HP Elite Dragonfly Folio 13.5 G3 i7-1265U, Iris Xe G7 96EUs, Samsung PM9A1 MZVL2512HCJQ, IPS, 1920x1280, 13.5" | Apple iPad Pro 12.9 2022 M2, M2 10-Core GPU, 128 GB NVMe, Mini-LED, 2732x2048, 12.9" | Asus ROG Flow Z13 GZ301ZE i9-12900H, GeForce RTX 3050 Ti Laptop GPU, Micron 2450 1TB MTFDKBK1T0TFK, IPS, 1920x1200, 13.4" | Microsoft Surface Pro 8, i7-1185G7 i7-1185G7, Iris Xe G7 96EUs, Toshiba KBG40ZNS256G NVMe, IPS, 2880x1920, 13" | Media Intel Iris Xe Graphics G7 96EUs | Media della classe Convertible | |
|---|---|---|---|---|---|---|---|---|---|
| Power Consumption | 22% | 26% | 19% | 36% | -54% | 7% | 3% | 16% | |
| Idle Minimum * (Watt) | 5.1 | 5.2 -2% | 4 22% | 3.4 33% | 2.54 50% | 8.8 -73% | 3.9 24% | 5.51 ? -8% | 4.2 ? 18% |
| Idle Average * (Watt) | 9.8 | 7.9 19% | 5.9 40% | 4.9 50% | 11.24 -15% | 12.1 -23% | 8.5 13% | 8.66 ? 12% | 6.89 ? 30% |
| Idle Maximum * (Watt) | 11.3 | 8 29% | 8.3 27% | 9.3 18% | 11.48 -2% | 12.7 -12% | 9.8 13% | 10.9 ? 4% | 8.63 ? 24% |
| Load Average * (Watt) | 47.5 | 31.2 34% | 30.1 37% | 41.9 12% | 12.97 73% | 72.3 -52% | 48 -1% | 45.6 ? 4% | 44.1 ? 7% |
| Witcher 3 ultra * (Watt) | 36 | 28.2 22% | 30.8 14% | 36.4 -1% | 77.3 -115% | 41.5 -15% | |||
| Load Maximum * (Watt) | 68.5 | 47.6 31% | 59 14% | 67.5 1% | 16.6 76% | 103.1 -51% | 63 8% | 67.8 ? 1% | 66.5 ? 3% |
* ... Meglio usare valori piccoli
Power Consumption Witcher 3 / Stress Test
Power Consumption with an External Monitor
Durata della batteria
Microsoft ha ridotto la capacità della batteria da 51,5 a 47,7 Wh, ma nel complesso i tempi di esecuzione sono molto simili a quelli del vecchio Surface Pro 8con una luminosità di 150 cd/m² (corrispondente al 62% della luminosità massima del dispositivo in prova). Nel test video sono state raggiunte quasi 9,5 ore e 7,5 ore per il test Wi-Fi. Il nostro test Wi-Fi dura poco più di 5 ore con la massima luminosità.
Non appena si passa alla modalità a 120 Hz, l'autonomia diminuisce di nuovo sensibilmente. Abbiamo elencato i valori per i tre scenari nella tabella seguente. È quindi consigliabile evitare la modalità a 120 Hz quando si è in viaggio.
| Test WLAN luminosità massima | Test WLAN 150 cd/m² | Test video | |
|---|---|---|---|
| 60 Hz | 314 minuti | 451 minuti | 562 minuti |
| 120 Hz | 274 minuti | 369 minuti | 529 minuti |
Nel confronto con i suoi concorrenti, il Surface Pro 9 è solo davanti all'Asus Flow Z13.Asus ROG Flow Z13 ma tutti gli altri concorrenti offrono una maggiore resistenza. Una carica completa richiede circa 2 ore con il dispositivo acceso, mentre il 35% è disponibile dopo 21 minuti e l'80% dopo circa 63 minuti.
Nota: le dichiarazioni di Microsoft sulla durata della batteria sono significativamente più alte, fino a 15,5 ore di utilizzo tipico, ma includono anche i tempi in modalità standby.
| Microsoft Surface Pro 9, i7-1255U i7-1255U, Iris Xe G7 96EUs, 47.7 Wh | Dell XPS 13 9315 2-in-1 Core i5-1230U i5-1230U, Iris Xe G7 80EUs, 49.5 Wh | Lenovo ThinkPad X12 20UVS03G00 i7-1160G7, Iris Xe G7 96EUs, 42 Wh | HP Elite Dragonfly Folio 13.5 G3 i7-1265U, Iris Xe G7 96EUs, 53 Wh | Apple iPad Pro 12.9 2022 M2, M2 10-Core GPU, 40.88 Wh | Asus ROG Flow Z13 GZ301ZE i9-12900H, GeForce RTX 3050 Ti Laptop GPU, 56 Wh | Microsoft Surface Pro 8, i7-1185G7 i7-1185G7, Iris Xe G7 96EUs, 51.5 Wh | Media della classe Convertible | |
|---|---|---|---|---|---|---|---|---|
| Autonomia della batteria | 32% | 19% | 56% | 67% | -25% | -2% | 47% | |
| H.264 (h) | 9.4 | 10 6% | 13.6 45% | 6 -36% | 10.1 7% | 15 ? 60% | ||
| WiFi v1.3 (h) | 7.5 | 9 20% | 8.2 9% | 9.4 25% | 11.2 49% | 5.6 -25% | 7.6 1% | 12 ? 60% |
| Load (h) | 1.4 | 2 43% | 2 43% | 2.6 86% | 2.9 107% | 1.2 -14% | 1.2 -14% | 1.713 ? 22% |
| Witcher 3 ultra (h) | 0.8 |
Pro
Contro
Verdetto: il Surface Pro 9 ha più potenza, ma perde funzionalità

Dall'esterno, il nuovo Surface Pro 9 sembra più un piccolo aggiornamento con un nuovo processore. Nel dettaglio, tuttavia, Microsoft ha apportato alcune modifiche e non tutte sono positive. Innanzitutto, va detto che le prestazioni della CPU sono aumentate in modo significativo grazie al nuovo processore Alder Lake-U. Tuttavia, un po' di potenziale è ancora sprecato perché un chip Alder Lake P con due core aggiuntivi genera maggiori prestazioni a questi valori di TDP, come dimostrato dalla nostra analisi di Alder Lake-U Analisi di Alder Lake-U.
Microsoft ha dotato il Surface Pro 9 di un modulo WLAN aggiornato con supporto per le reti a 6 GHz. Allo stesso tempo, la versione LTE del modello Intel è stata abbandonata, dato che il precedente Surface Pro X viene ora venduto anche come Surface Pro 9. Resta da vedere se la versione ARM con Windows possa davvero essere un sostituto completo. Avremmo preferito un modello Intel opzionale con LTE o 5G. A questo proposito, critichiamo anche la precedente decisione di Microsoft di rimuovere il lettore microSD per lo slot SIM opzionale. Poiché il modello Intel non ha più uno slot SIM, si sarebbe potuto installare nuovamente un lettore di schede. D'altra parte, l'omissione del jack da 3,5 mm è molto più discreta, ma anche questa decisione ci sembra incomprensibile.
Il nuovo Microsoft Surface Pro 9 offre ora una maggiore potenza della CPU, ma il modello WWAN opzionale è stato abbandonato e il jack audio è stato rimosso. Inoltre, la durata della batteria rimane un punto debole del convertibile.
Negli altri settori, le prestazioni sono solide, ma il display in particolare deve essere aggiornato al più presto. 120 Hz sono molto piacevoli nella pratica, ma i dispositivi rivali di solito offrono di più in termini di copertura dello spazio colore e rapporto di contrasto. Inoltre, il convertibile con Core i7 è piuttosto costoso e la versione base con Core i5, 8 GB di RAM e 256 GB di memoria SSD difficilmente soddisfa i requisiti di un dispositivo "Pro" nel 2023.
Presto recensiremo anche la versione ARM del Surface Pro 9 + 5G e siamo curiosi di vedere se Windows funziona meglio con il SoC ARM e se rappresenta una vera alternativa all'iPad Pro 12,9 Apple iPad Pro 12.9. Il Dell XPS 13 9315 offre una potenza della CPU inferiore, ma di solito è sufficiente per l'uso quotidiano e beneficia anche del raffreddamento passivo.
Prezzo e disponibilità
Il Microsoft Surface Pro 9 sembra essere ampiamente disponibile in tutte le configurazioni, sia direttamente tramite il negozio online ufficiale di Microsoft che tramite fornitori tipici come Amazon. La configurazione oggetto della nostra recensione (Core i7, 16 GB di RAM, 512 GB) è quotata a US$1.879,99 su Amazon USe a £1.799,00 su Amazon UK. Gli acquirenti interessati in Australia o a Singapore, ad esempio, possono acquistare direttamente da Microsoft, dove i prezzi partono da AU$1.649,00 e SG$1.608,00rispettivamente.
Gli esempi citati non sono esaustivi. I prezzi sono aggiornati al 25.01.2023 e sono soggetti a modifiche.
Microsoft Surface Pro 9, i7-1255U
- 01/24/2023 v7 (old)
Andreas Osthoff
Transparency
La selezione dei dispositivi da recensire viene effettuata dalla nostra redazione. Il campione di prova è stato fornito all'autore come prestito dal produttore o dal rivenditore ai fini di questa recensione. L'istituto di credito non ha avuto alcuna influenza su questa recensione, né il produttore ne ha ricevuto una copia prima della pubblicazione. Non vi era alcun obbligo di pubblicare questa recensione. In quanto società mediatica indipendente, Notebookcheck non è soggetta all'autorità di produttori, rivenditori o editori.
Ecco come Notebookcheck esegue i test
Ogni anno, Notebookcheck esamina in modo indipendente centinaia di laptop e smartphone utilizzando procedure standardizzate per garantire che tutti i risultati siano comparabili. Da circa 20 anni sviluppiamo continuamente i nostri metodi di prova e nel frattempo stabiliamo gli standard di settore. Nei nostri laboratori di prova, tecnici ed editori esperti utilizzano apparecchiature di misurazione di alta qualità. Questi test comportano un processo di validazione in più fasi. Il nostro complesso sistema di valutazione si basa su centinaia di misurazioni e parametri di riferimento ben fondati, che mantengono l'obiettività.Price comparison

