Recensione del Microsoft Surface Pro OLED for Business: Lunar Lake vs. Snapdragon all'interno di un convertibile
Un altro colpo per Windows on ARM?
Microsoft offre ora anche il suo Surface Pro convertibile equipaggiato con i processori Lunar Lake di Intel, ma in modo specifico per i clienti aziendali. Abbiamo testato la versione OLED e indagato se i clienti privati potrebbero perdere il modello migliore.Andreas Osthoff, 👁 Andreas Osthoff (traduzione a cura di DeepL / Ninh Duy) Pubblicato 🇺🇸 🇩🇪 ...
Verdetto - Intel e Qualcomm sono più vicine sul Surface Pro
Mentre il nostro verdetto sul Surface Laptop 15 era ancora chiaramente a favore del modello Intel, la situazione è un po' più complicata quando si tratta del Surface Pro OLED convertibile. In linea di principio, la variante Lunar Lake ha naturalmente il vantaggio di una migliore compatibilità e di prestazioni più elevate della GPU. Supporta anche Thunderbolt 4 e, sorprendentemente, il comportamento della ventola è diverso. Probabilmente non si sentirà mai la ventola della variante Intel durante l'uso quotidiano, anche utilizzando la modalità di prestazioni migliori.
D'altra parte, la variante Snapdragon offre prestazioni multi-core nettamente superiori e in generale una migliore efficienza della CPU. Inoltre, il modello ARM presenta alcuni vantaggi in termini di durata della batteria e Microsoft offre un modulo 5G solo per la versione ARM, che potrebbe essere un enorme vantaggio, soprattutto per un dispositivo mobile come il Surface Pro.
Nel complesso, però, dobbiamo ancora una volta criticare la politica dei prodotti di Microsoft. Sembra che i clienti aziendali non vogliano dispositivi ARM, ma i clienti privati sono praticamente costretti ad acquistare modelli Qualcomm. Sebbene sia possibile acquistare i prodotti Surface for Business anche come privati, i prezzi elevati (che i clienti aziendali generalmente non pagano se acquistano grandi quantità) rendono semplicemente la variante Intel poco interessante per gli utenti privati. Il nostro dispositivo di prova, ad esempio, costa più di 2.400 dollari senza la tastiera, mentre il modello ARM corrispondente è disponibile per circa 2.100 dollari. Microsoft dovrebbe davvero permettere ai clienti di scegliere tra Qualcomm e Intel.
Pro
Contro
Prezzo e disponibilità

Può acquistare il nuovo Surface Pro dal sito di Microsoftcon prezzi a partire da 1.499,99 dollari.
L'anno scorso, il Surface Pro OLED è stato lanciato esclusivamente con i nuovi processori Snapdragon di Qualcomm. Tuttavia, come per il Surface Laptop, a febbraio sono stati rilasciati altri modelli con i processori Lunar Lake di Intel, che si rivolgono specificamente ai clienti aziendali ma possono essere acquistati anche dai clienti privati. Stiamo testando la versione con il Core Ultra 7 268Vcon 32 GB di RAM, un SSD da 1 TB e uno schermo OLED da 120 Hz, al prezzo MRSP di 2.499,99 dollari. Nella seguente recensione, esamineremo principalmente le differenze rispetto al modello ARM. Informazioni più dettagliate sul case e sul display OLED sono disponibili nella nostra recensione dettagliata della versione ARM:
Specifiche
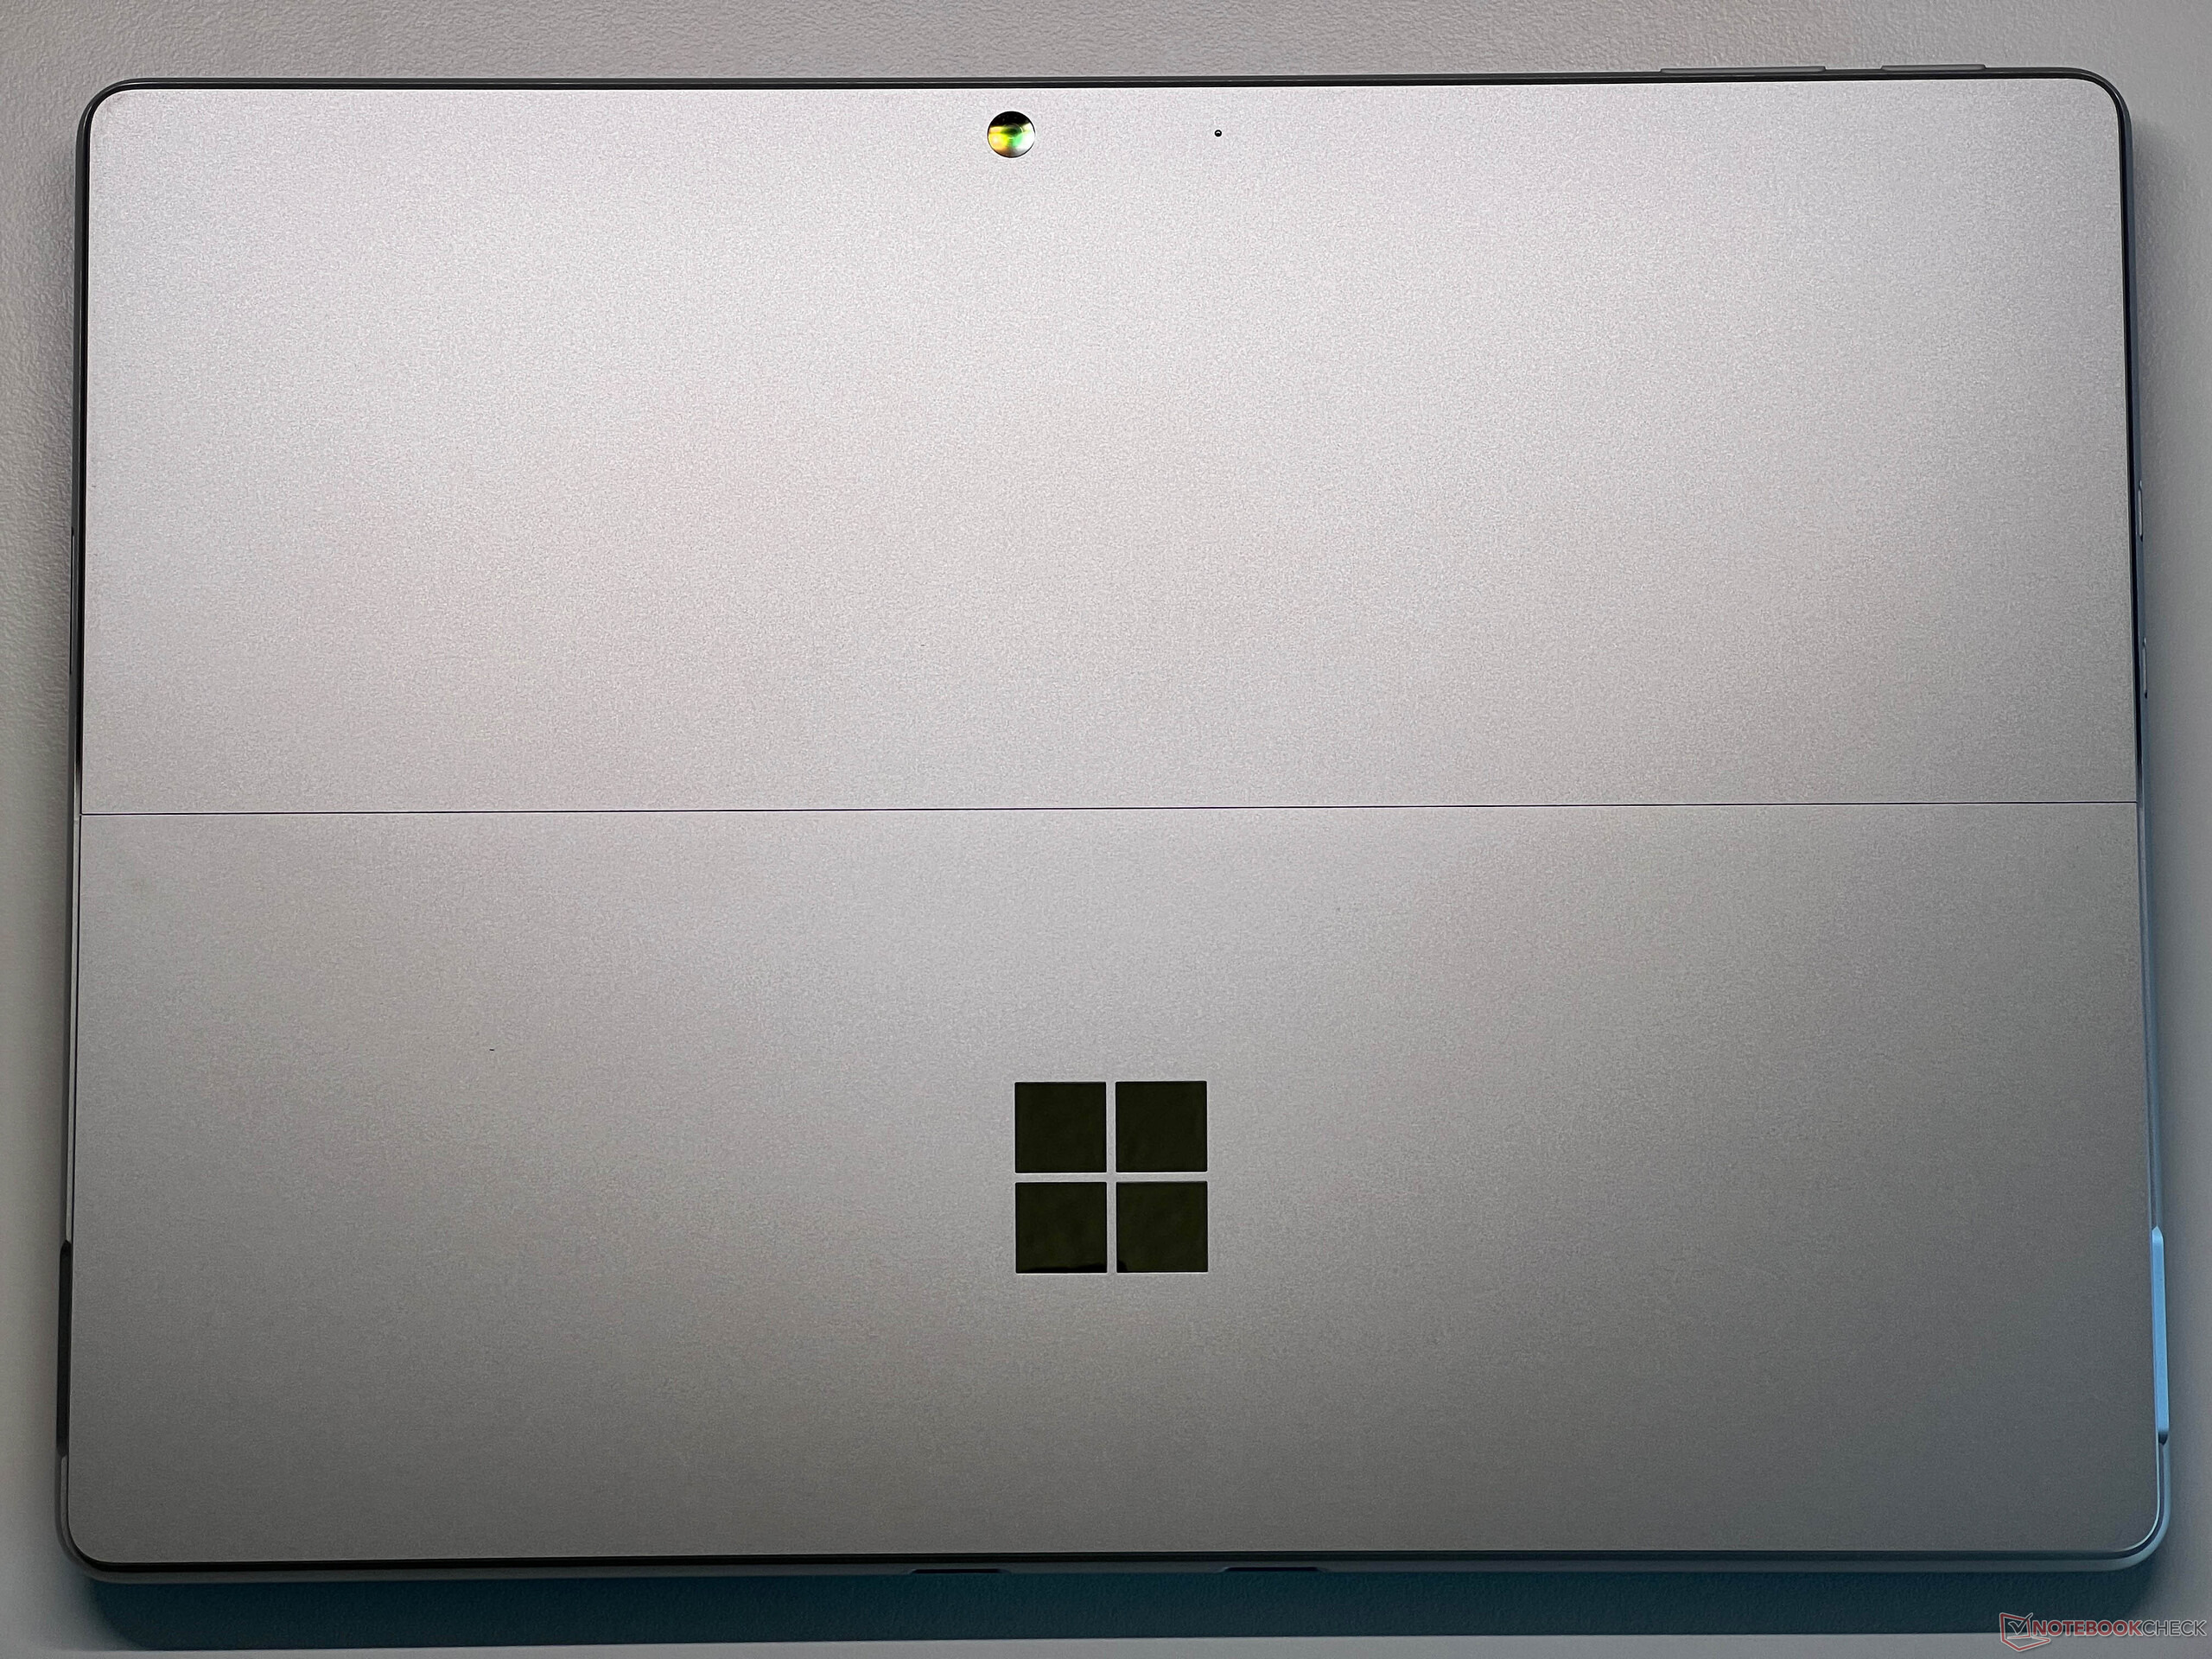
Differenze rispetto al Surface Pro con SoC Snapdragon
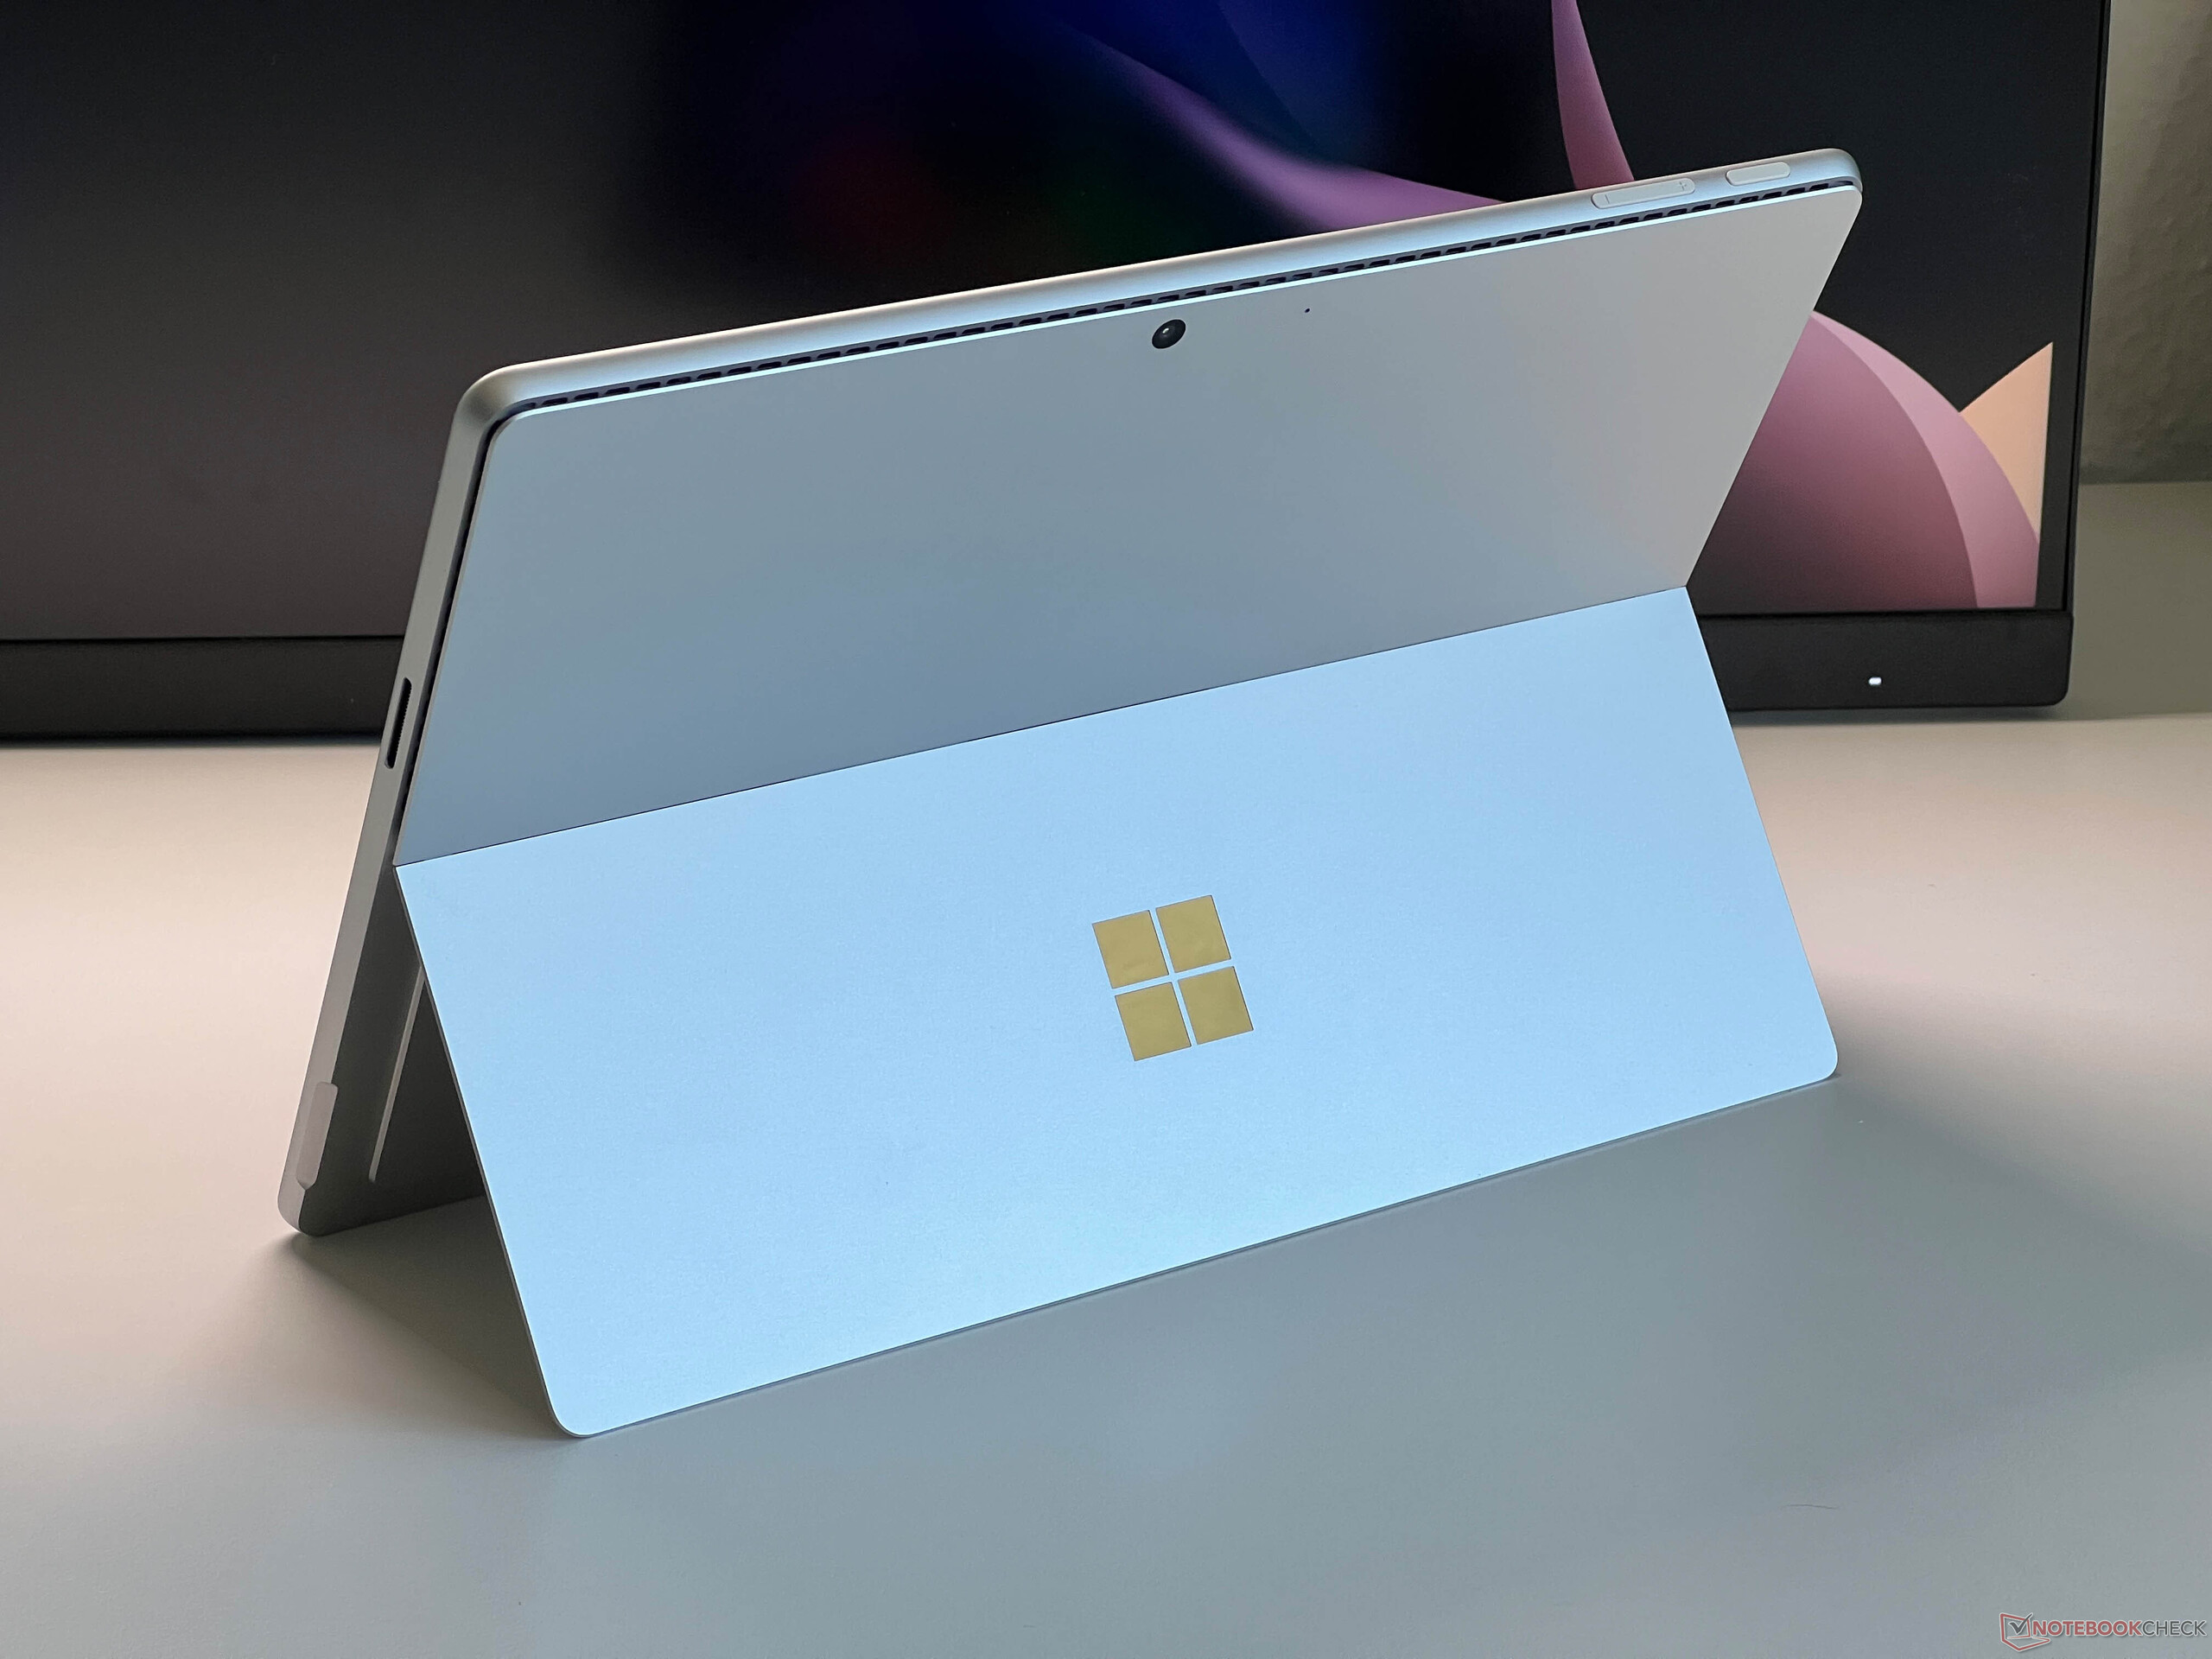
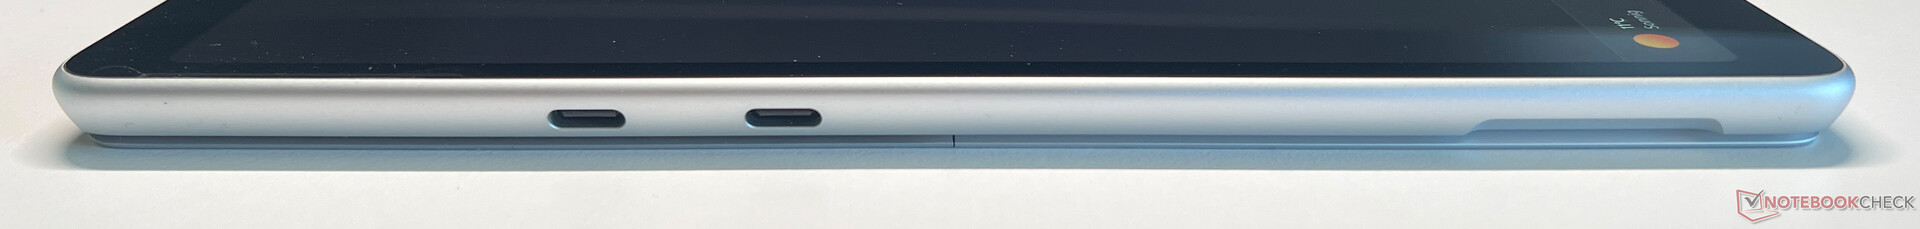
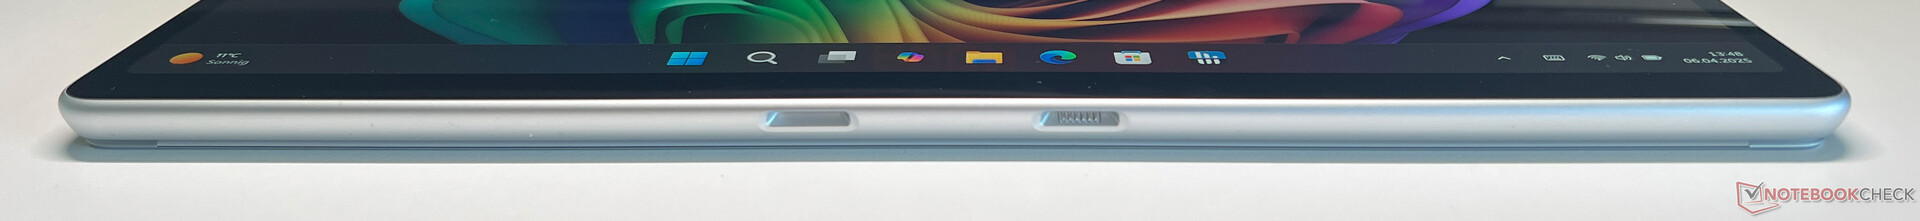
Non ci sono differenze con il modello Modello Snapdragon in termini di case del portatile. La versione Intel è dotata di supporto Thunderbolt 4, ma per il resto le sue caratteristiche, tra cui il Wi-Fi 7 e le fotocamere ad alta risoluzione, sono identiche. Entrambe le varianti hanno una certificazione Copilot+, il che significa che supportano le funzioni avanzate di Windows AI. Il modello Snapdragon è ora dotato di un modulo 5G opzionale, che non è disponibile sul modello Intel.

| Networking | |
| Microsoft Surface Pro OLED Lunar Lake | |
| iperf3 transmit AXE11000 | |
| iperf3 receive AXE11000 | |
| Microsoft Surface Pro OLED Copilot+ | |
| iperf3 transmit AXE11000 | |
| iperf3 receive AXE11000 | |
| Dell Latitude 7350 Detachable | |
| iperf3 transmit AXE11000 | |
| iperf3 receive AXE11000 | |
| iperf3 transmit AXE11000 6GHz | |
| iperf3 receive AXE11000 6GHz | |
| Asus ProArt PZ13 HT5306 | |
| iperf3 transmit AXE11000 | |
| iperf3 receive AXE11000 | |
| Minisforum V3 | |
| iperf3 transmit AXE11000 | |
| iperf3 receive AXE11000 | |
| iperf3 transmit AXE11000 6GHz | |
| iperf3 receive AXE11000 6GHz | |


Sostenibilità
Il Surface Pro è certificato Energy Star e Microsoft fornisce ampie informazioni sul suo sito web sull'uso di materiali riciclati per il dispositivo e per il suo imballaggio (ad esempio, la custodia è realizzata con l'89,1% di materiali riciclati). Il suo imballaggio è realizzato interamente in carta e cartone.
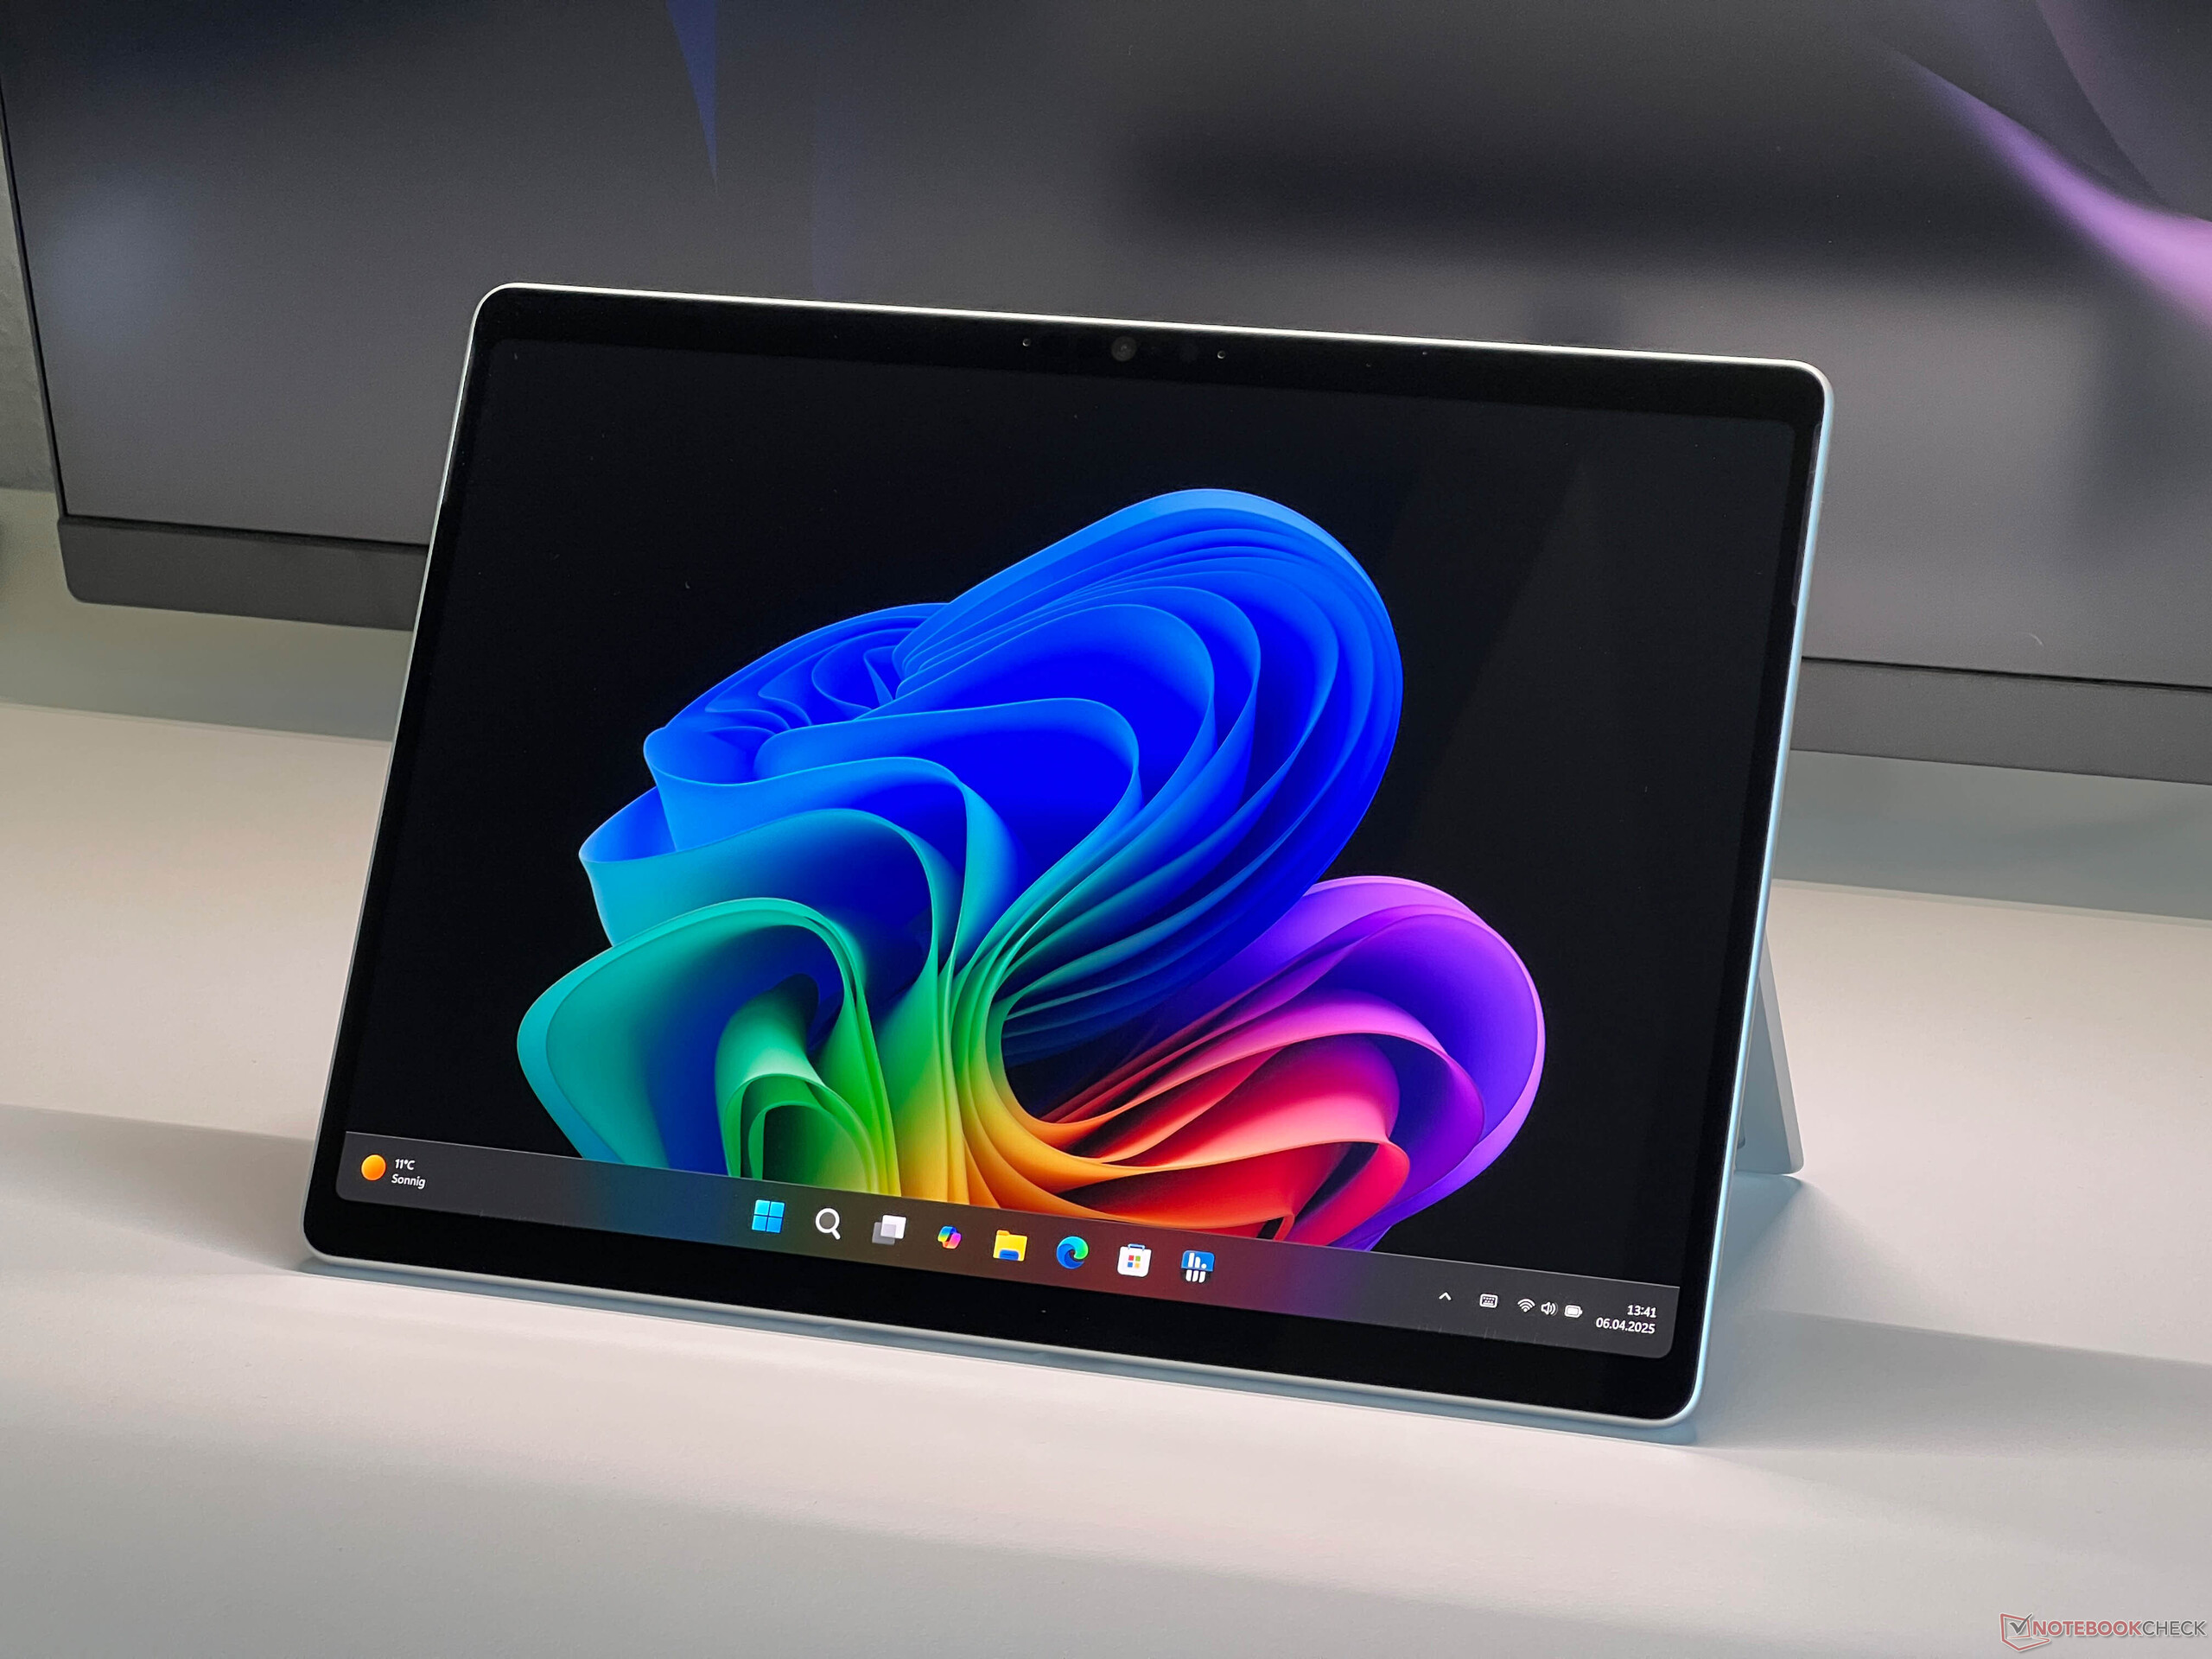
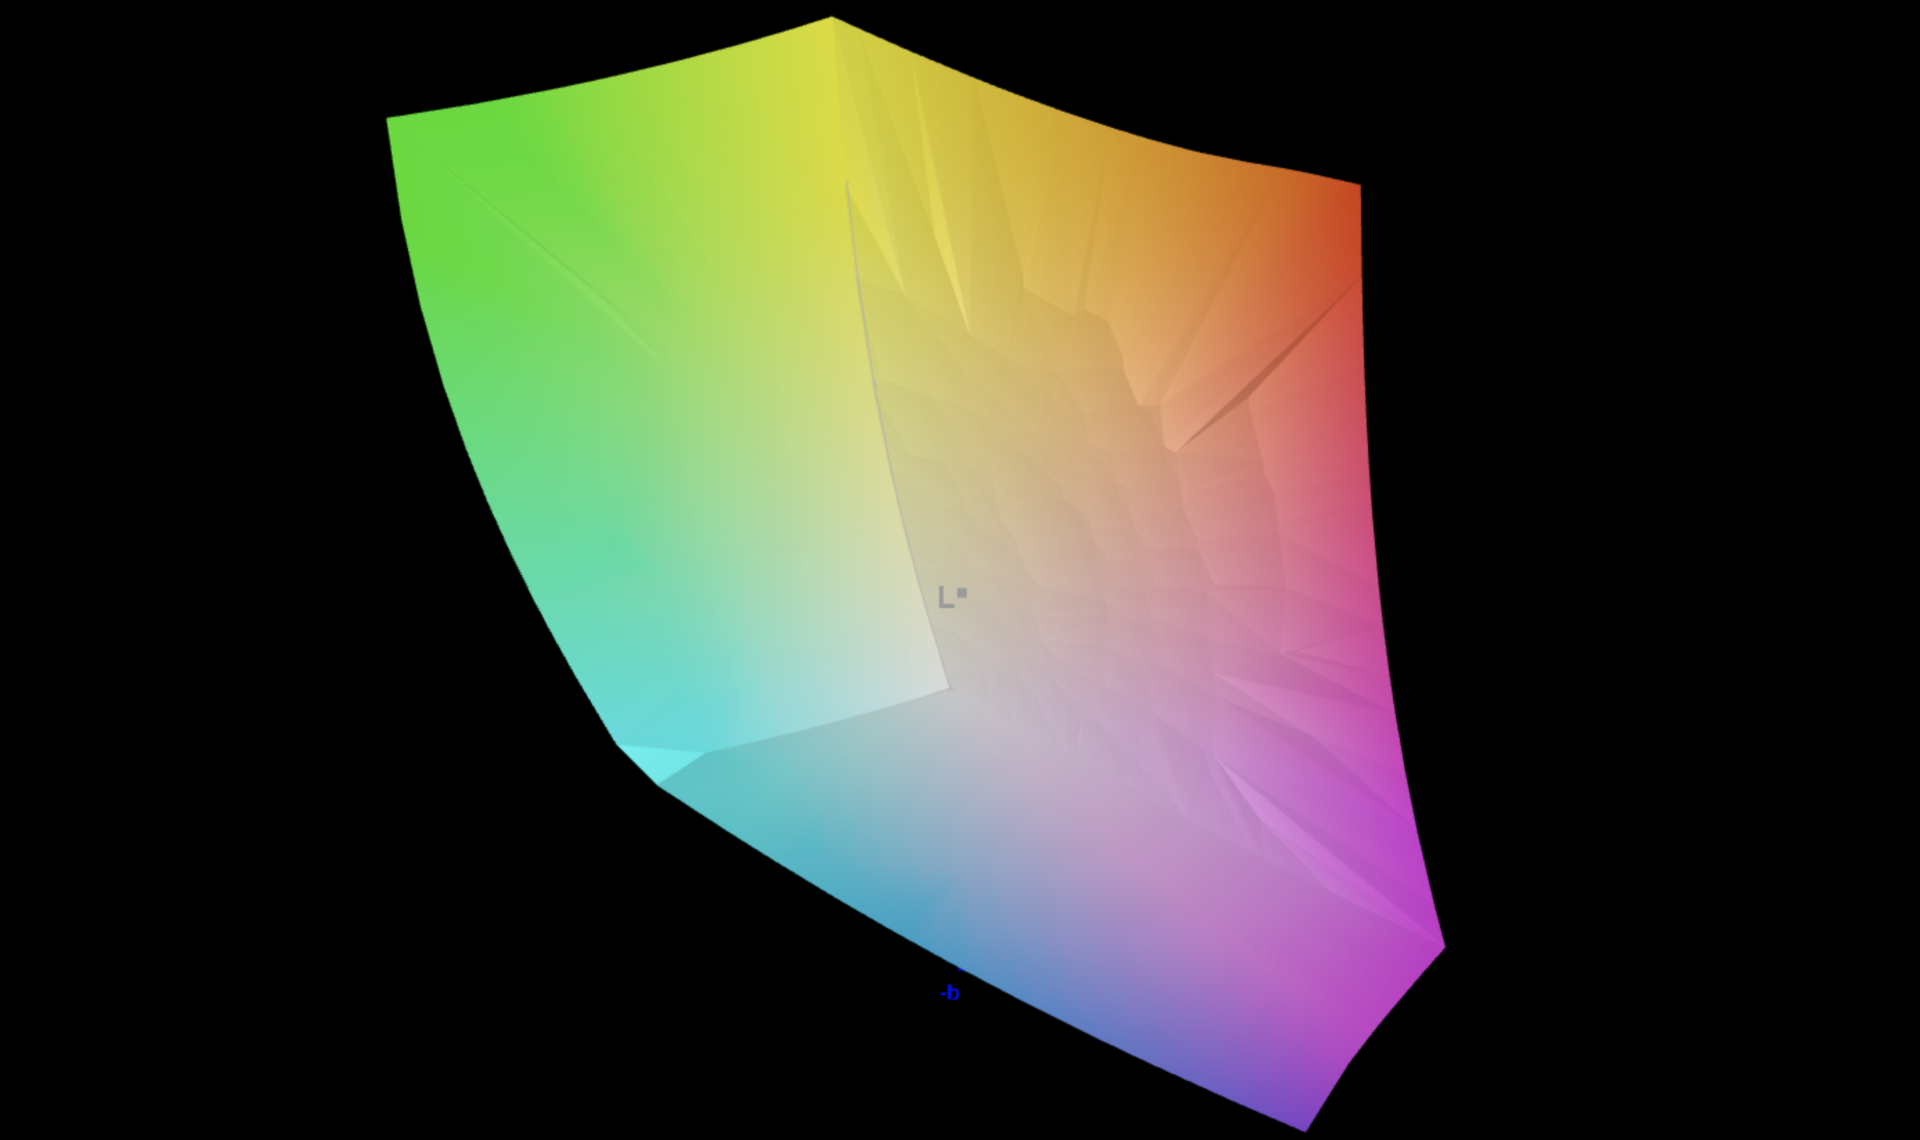
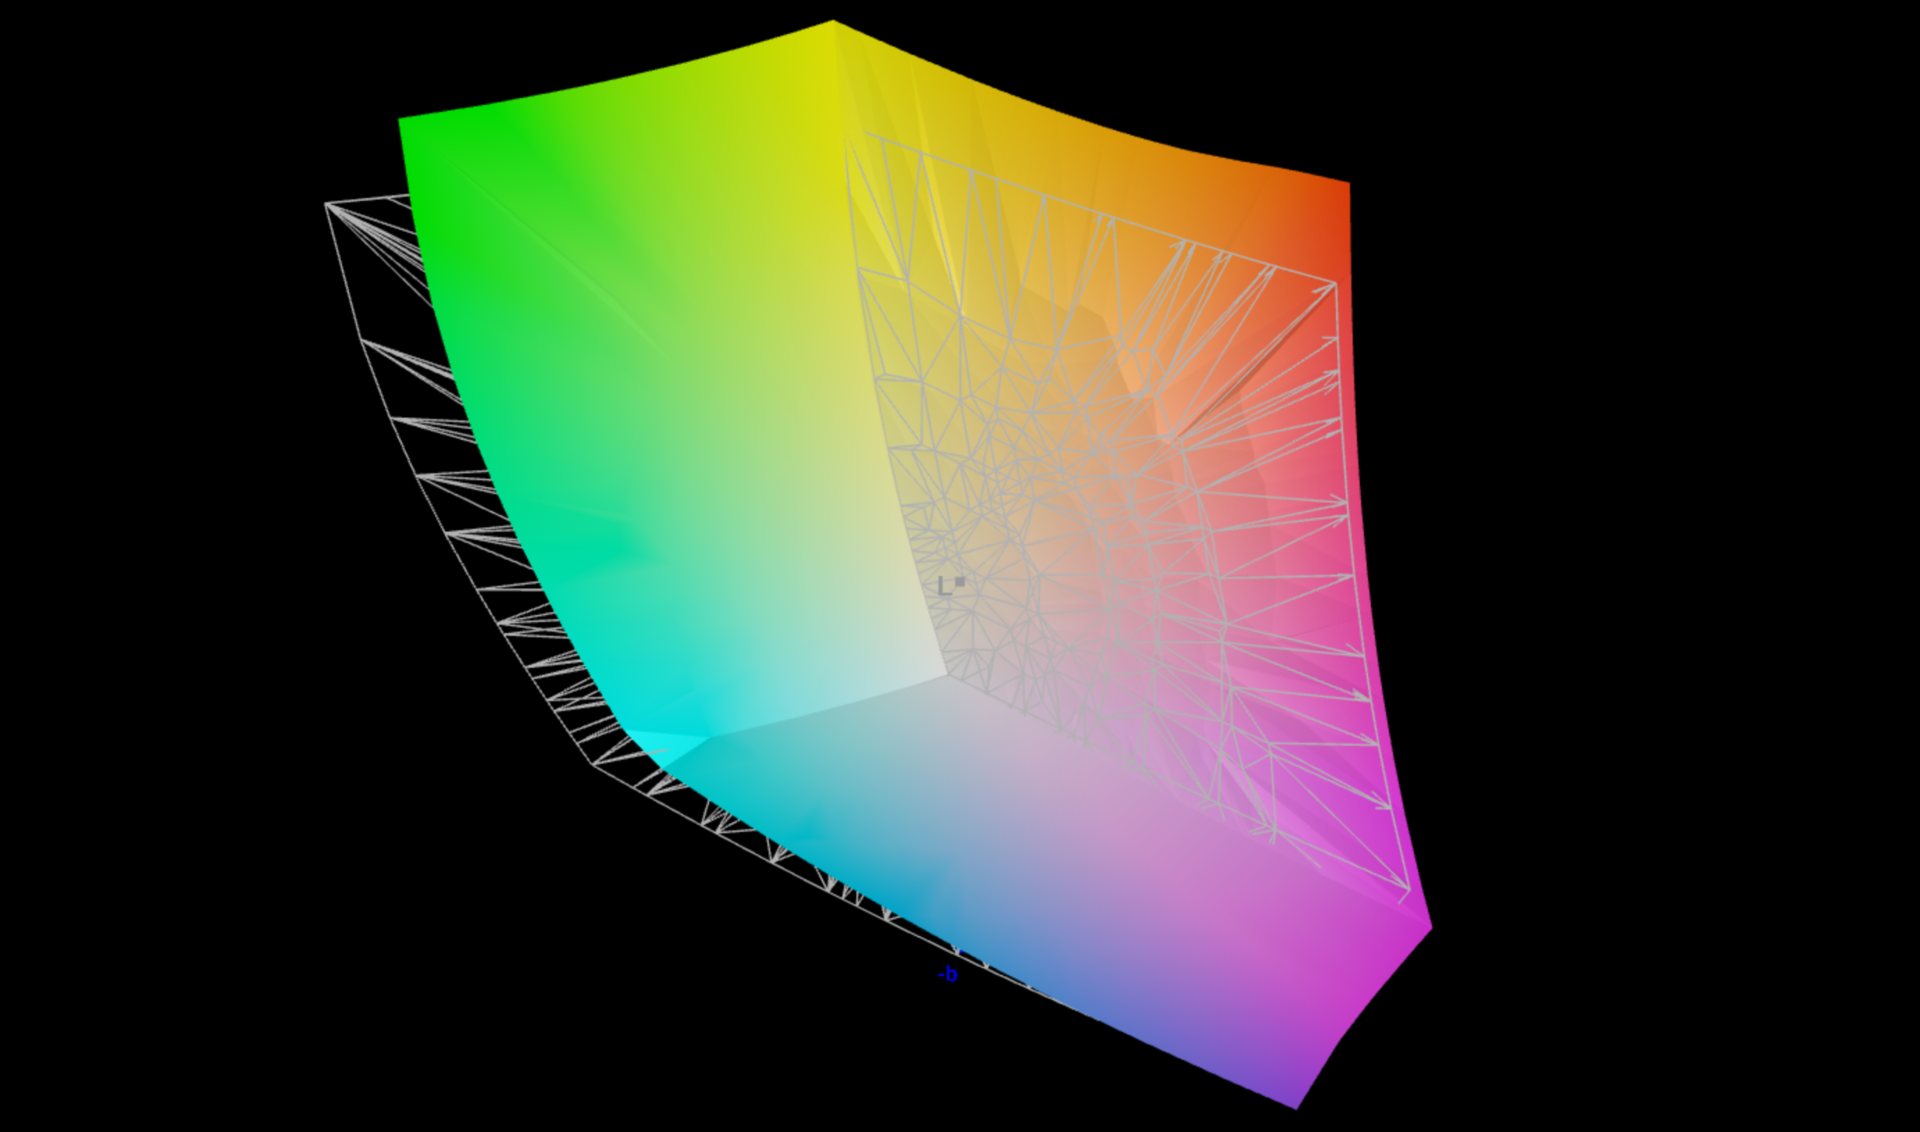
Display - OLED a 120 Hz
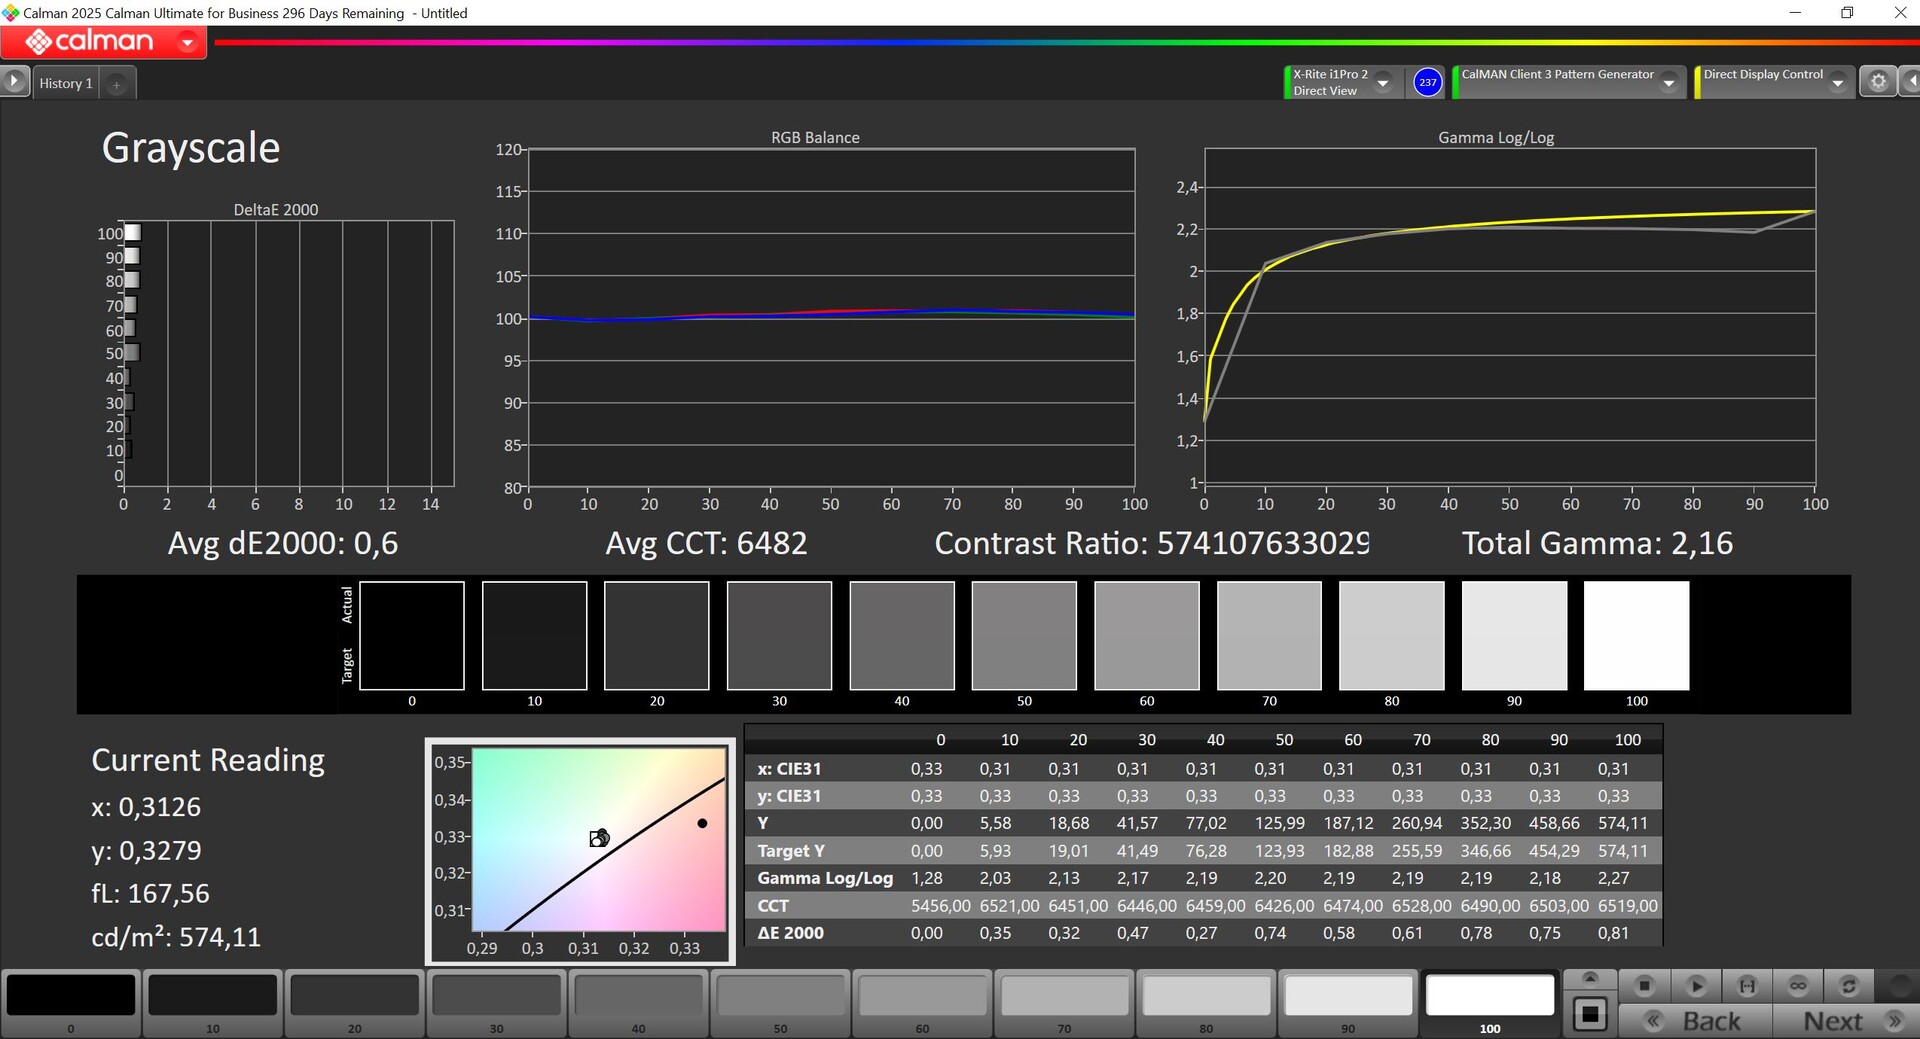
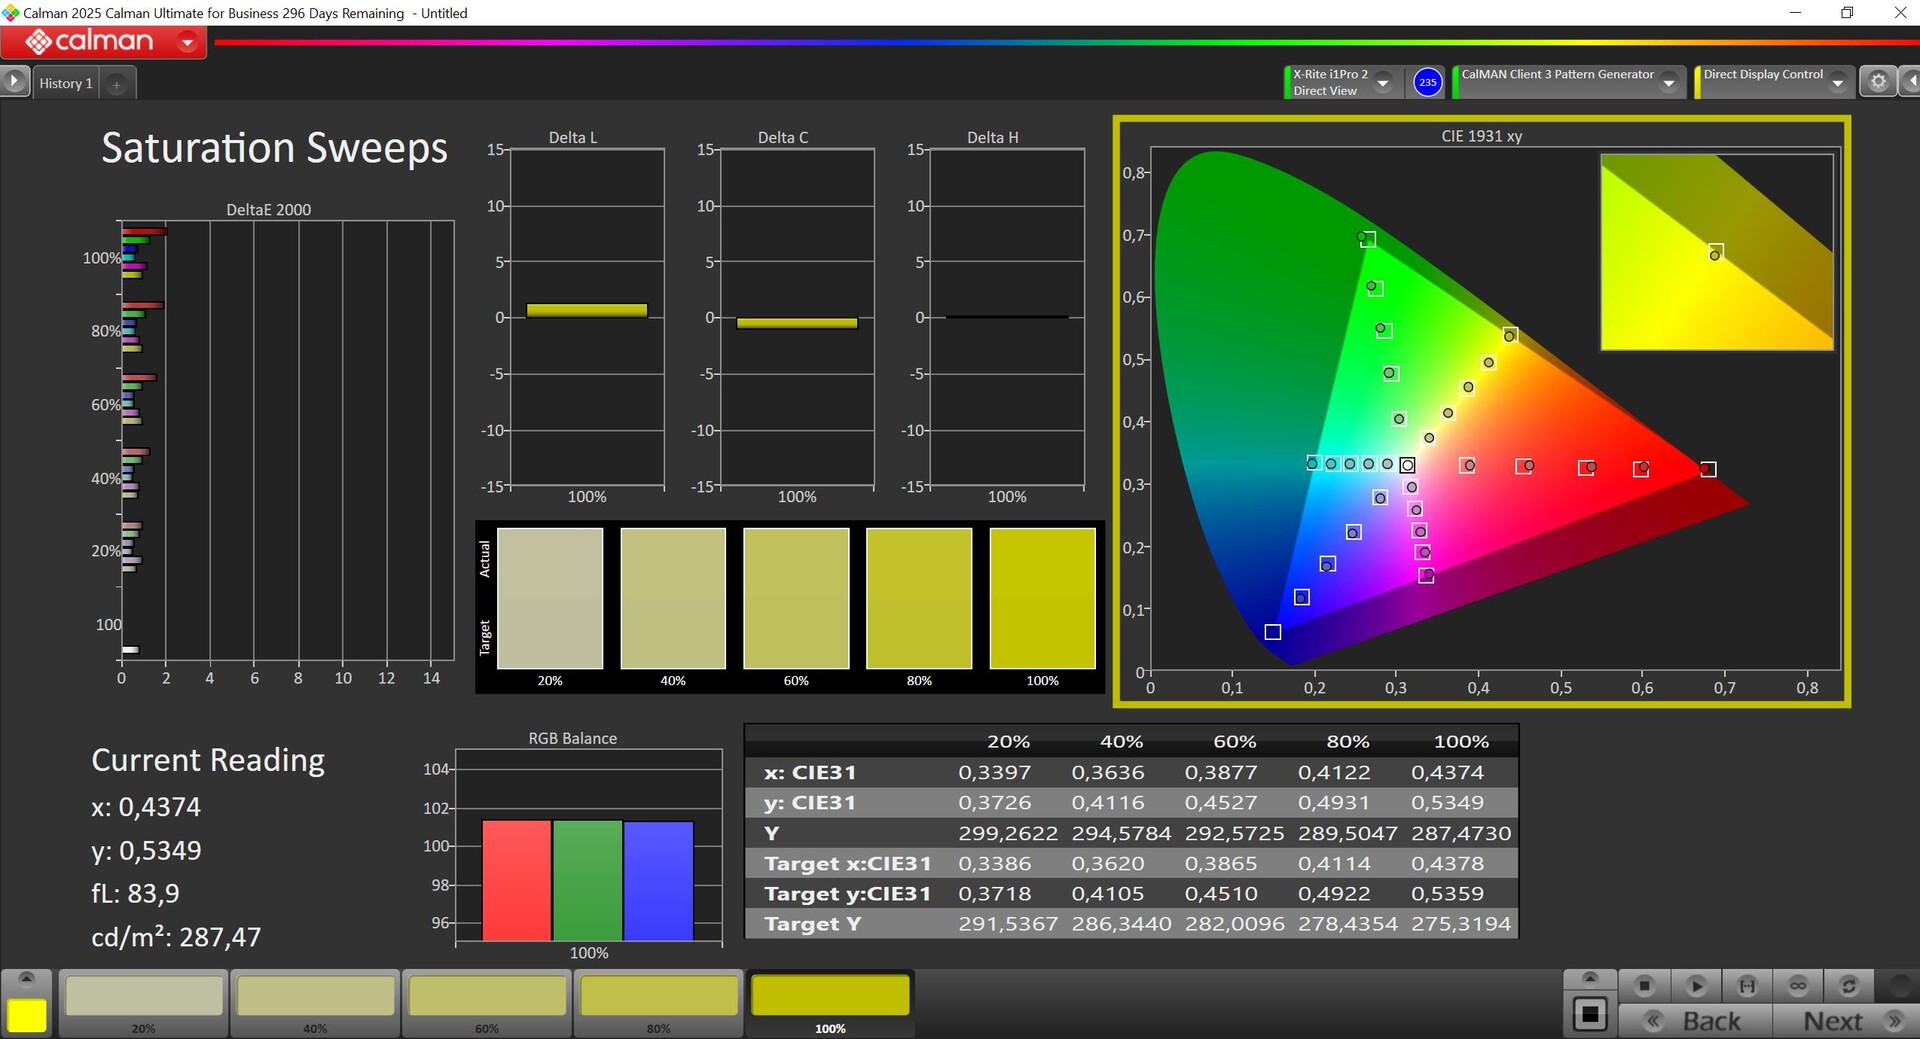
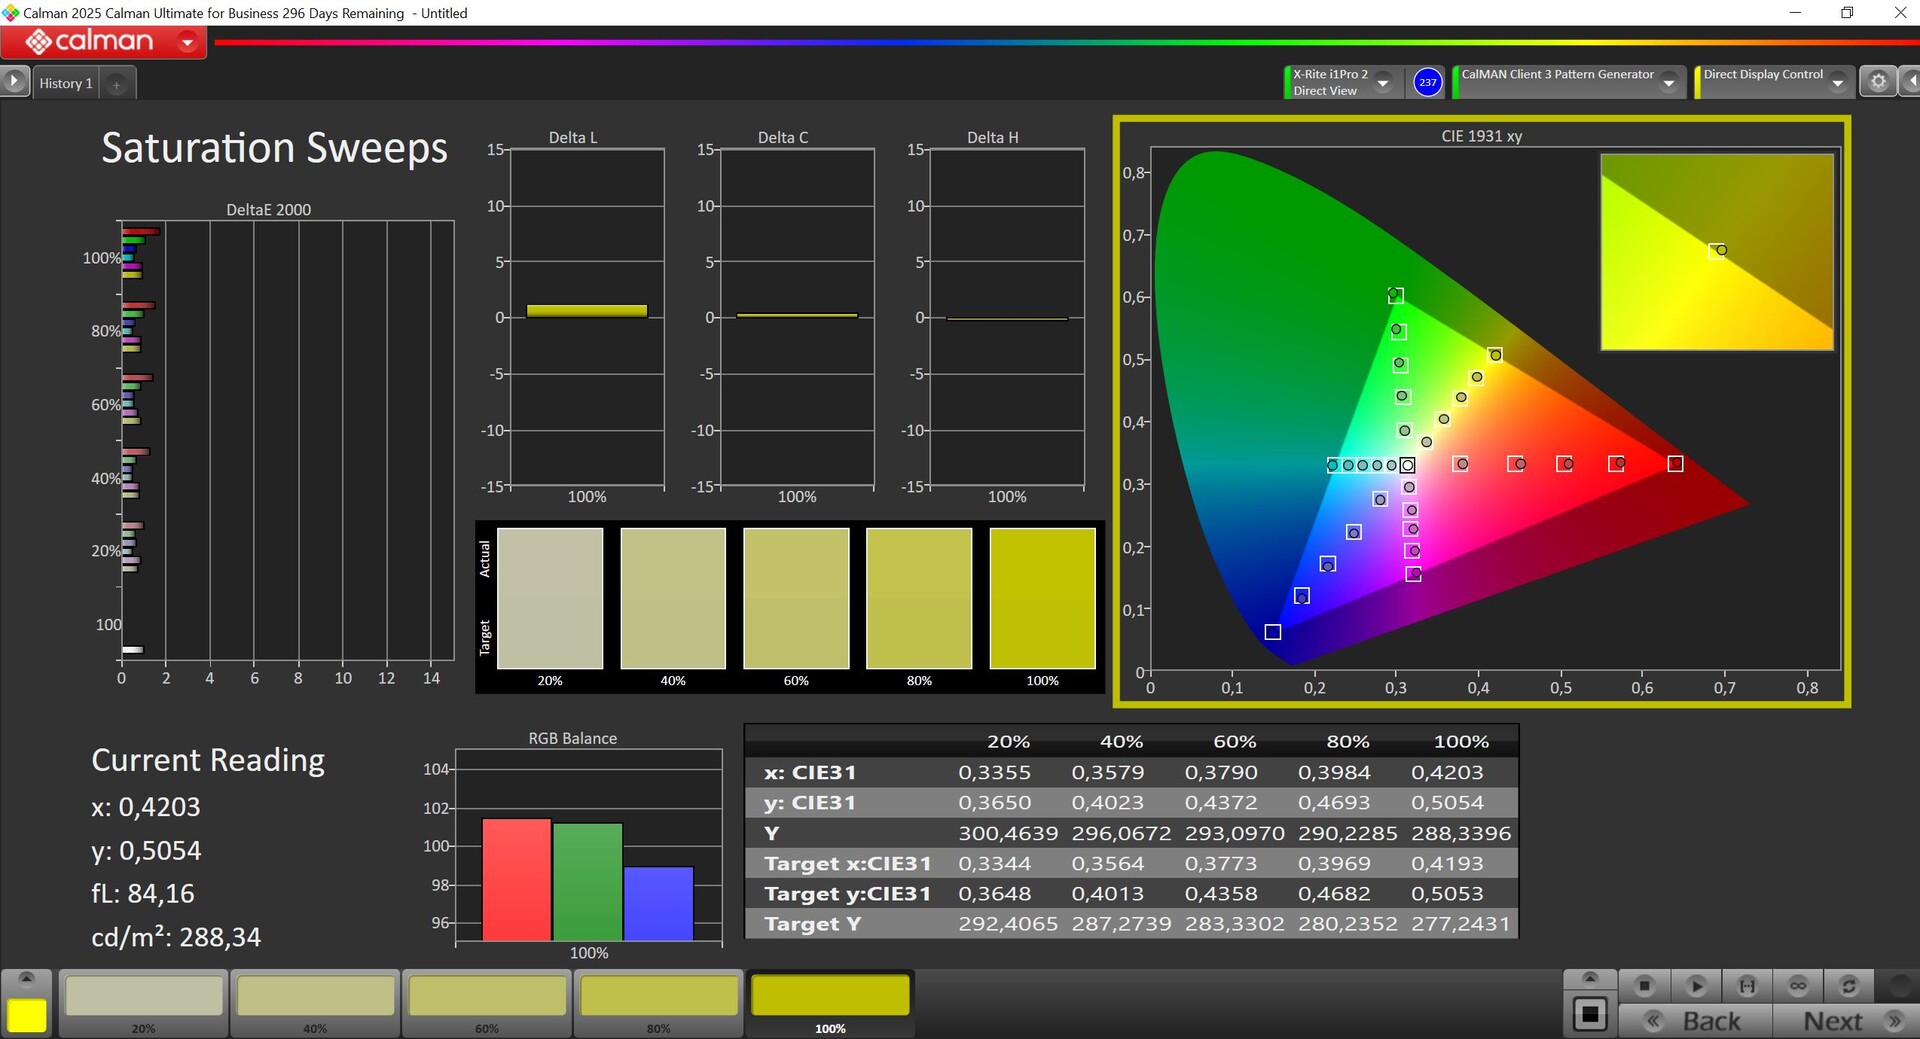
L'ID del pannello OLED della versione Intel differisce leggermente dal modello Snapdragon, ma i risultati sono stati paragonabili nelle nostre misurazioni. Ciò significa che gli utenti ottengono un'elevata luminosità (poco meno di 600 cd/m² SDR, massimo 942 cd/m² HDR) e una buona qualità d'immagine soggettiva, anche se abbiamo notato un leggero effetto raster sulle superfici chiare. I due profili Vivid (P3) e sRGB sono ancora una volta molto precisi, per cui è possibile modificare facilmente immagini/video.
| |||||||||||||||||||||||||
Distribuzione della luminosità: 99 %
Al centro con la batteria: 574 cd/m²
Contrasto: ∞:1 (Nero: 0 cd/m²)
ΔE ColorChecker Calman: 0.9 | ∀{0.5-29.43 Ø4.73}
ΔE Greyscale Calman: 0.6 | ∀{0.09-98 Ø4.97}
89.7% AdobeRGB 1998 (Argyll 3D)
100% sRGB (Argyll 3D)
99.5% Display P3 (Argyll 3D)
Gamma: 2.16
CCT: 6482 K
| Microsoft Surface Pro OLED Lunar Lake ATNA30DW02-0, OLED, 2880x1920, 13", 120 Hz | Microsoft Surface Pro OLED Copilot+ ATNA30DW01-1, OLED, 2880x1920, 13", 120 Hz | Dell Latitude 7350 Detachable BOE NE13A1M, IPS, 2880x1920, 13", 60 Hz | Asus ProArt PZ13 HT5306 ATNA33AA08-0, OLED, 2880x1800, 13.3", 60 Hz | Minisforum V3 BOE, NE140QDM-NY1, IPS, 2560x1600, 14", 165 Hz | |
|---|---|---|---|---|---|
| Display | -1% | -17% | 0% | -2% | |
| Display P3 Coverage (%) | 99.5 | 98.9 -1% | 70.2 -29% | 99.5 0% | 97.7 -2% |
| sRGB Coverage (%) | 100 | 99.4 -1% | 98.9 -1% | 99.6 0% | 99.8 0% |
| AdobeRGB 1998 Coverage (%) | 89.7 | 89.5 0% | 72.1 -20% | 89.9 0% | 85.4 -5% |
| Response Times | 6% | -7225% | -196% | -1804% | |
| Response Time Grey 50% / Grey 80% * (ms) | 0.43 ? | 0.32 ? 26% | 43.8 ? -10086% | 1.54 ? -258% | 10 ? -2226% |
| Response Time Black / White * (ms) | 0.54 ? | 0.58 ? -7% | 24.1 ? -4363% | 1.41 ? -161% | 8 ? -1381% |
| PWM Frequency (Hz) | 480 ? | 480 ? | 240 ? | ||
| PWM Amplitude * (%) | 25 | 25 -0% | 67 -168% | ||
| Screen | 6% | -190% | -57% | -204% | |
| Brightness middle (cd/m²) | 574 | 580 1% | 508.5 -11% | 362 -37% | 512 -11% |
| Brightness (cd/m²) | 578 | 581 1% | 507 -12% | 364 -37% | 495 -14% |
| Brightness Distribution (%) | 99 | 99 0% | 87 -12% | 99 0% | 91 -8% |
| Black Level * (cd/m²) | 0.04 | 0.24 | 0.01 | 0.48 | |
| Colorchecker dE 2000 * | 0.9 | 0.7 22% | 3 -233% | 1.5 -67% | 4.32 -380% |
| Colorchecker dE 2000 max. * | 2.3 | 2.1 9% | 7.03 -206% | 3.1 -35% | 7.04 -206% |
| Greyscale dE 2000 * | 0.6 | 0.6 -0% | 4.6 -667% | 1.6 -167% | 4.22 -603% |
| Gamma | 2.16 102% | 2.16 102% | 2.17 101% | 2.12 104% | 2.31 95% |
| CCT | 6482 100% | 6484 100% | 6929 94% | 6514 100% | 6770 96% |
| Contrast (:1) | 14500 | 2119 | 36200 | 1067 | |
| Colorchecker dE 2000 calibrated * | 1.28 | 4.17 | |||
| Media totale (Programma / Settaggio) | 4% /
4% | -2477% /
-1422% | -84% /
-78% | -670% /
-440% |
* ... Meglio usare valori piccoli


Tempi di risposta del Display
| ↔ Tempi di risposta dal Nero al Bianco | ||
|---|---|---|
| 0.54 ms ... aumenta ↗ e diminuisce ↘ combinato | ↗ 0.29 ms Incremento | 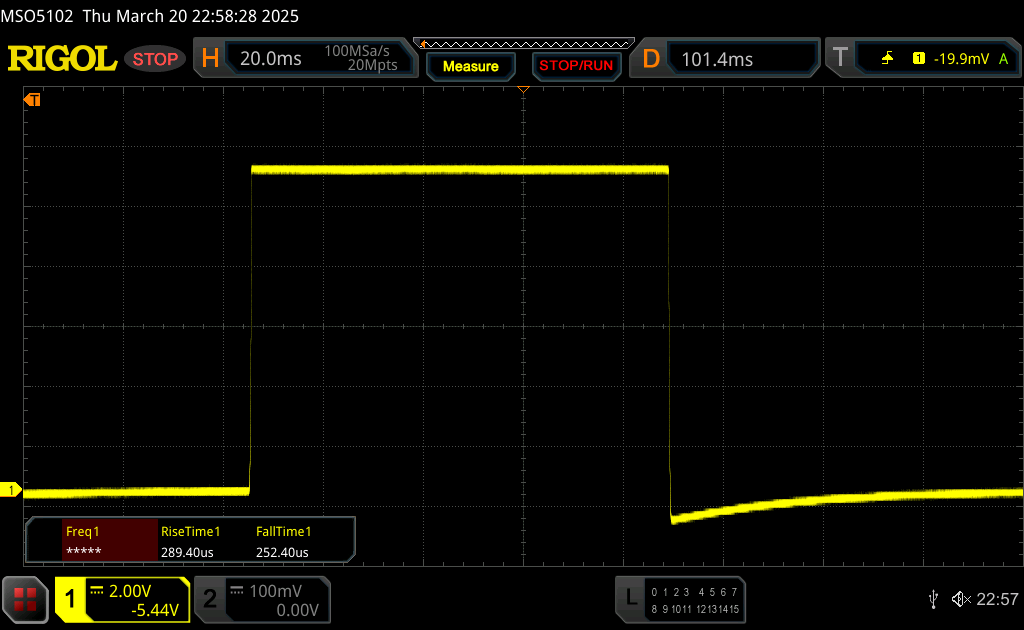 |
| ↘ 0.25 ms Calo | ||
| Lo schermo ha mostrato valori di risposta molto veloci nei nostri tests ed è molto adatto per i gaming veloce. In confronto, tutti i dispositivi di test variano da 0.1 (minimo) a 240 (massimo) ms. » 1 % di tutti i dispositivi è migliore. Questo significa che i tempi di risposta rilevati sono migliori rispettto alla media di tutti i dispositivi testati (19.9 ms). | ||
| ↔ Tempo di risposta dal 50% Grigio all'80% Grigio | ||
| 0.43 ms ... aumenta ↗ e diminuisce ↘ combinato | ↗ 0.26 ms Incremento | 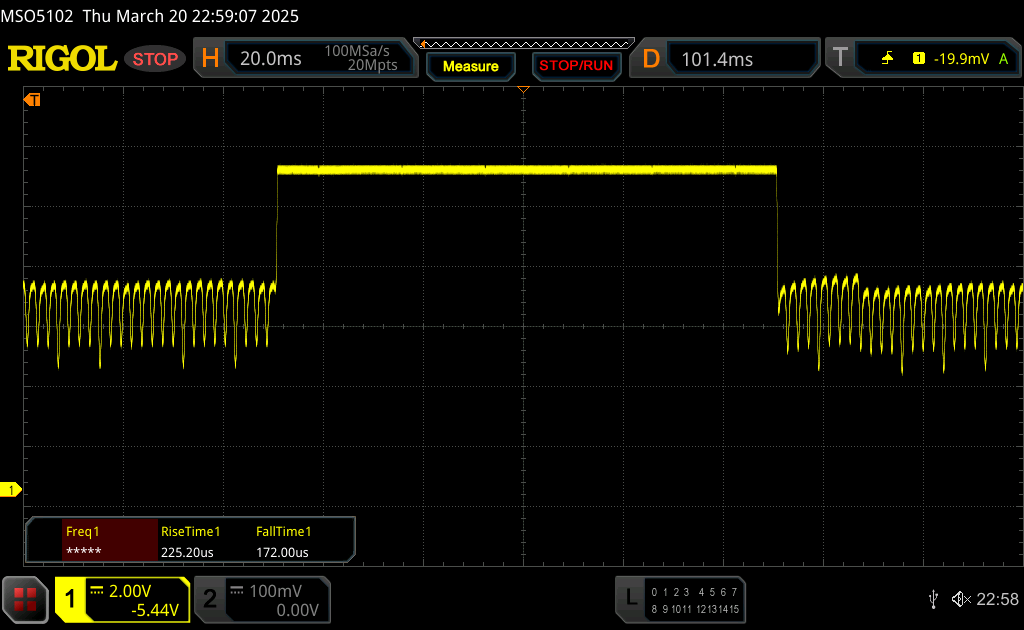 |
| ↘ 0.17 ms Calo | ||
| Lo schermo ha mostrato valori di risposta molto veloci nei nostri tests ed è molto adatto per i gaming veloce. In confronto, tutti i dispositivi di test variano da 0.165 (minimo) a 636 (massimo) ms. » 1 % di tutti i dispositivi è migliore. Questo significa che i tempi di risposta rilevati sono migliori rispettto alla media di tutti i dispositivi testati (31.1 ms). | ||
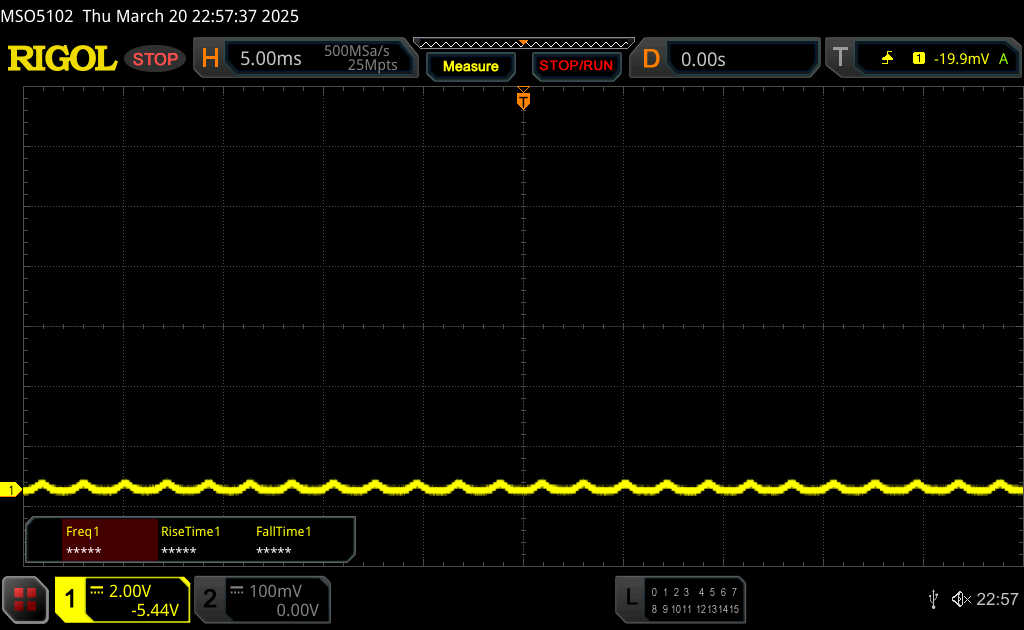
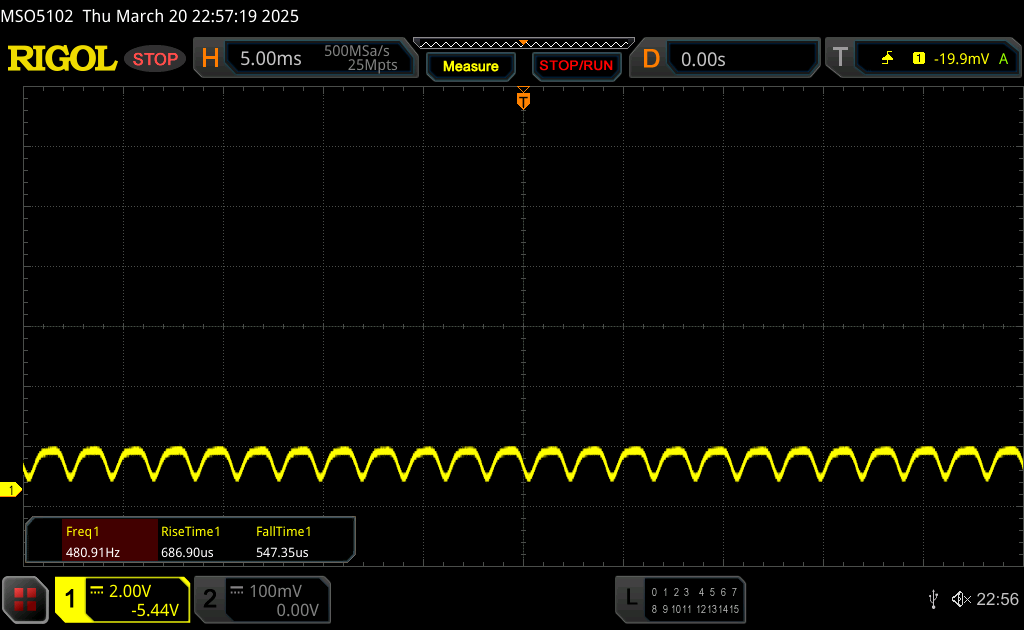
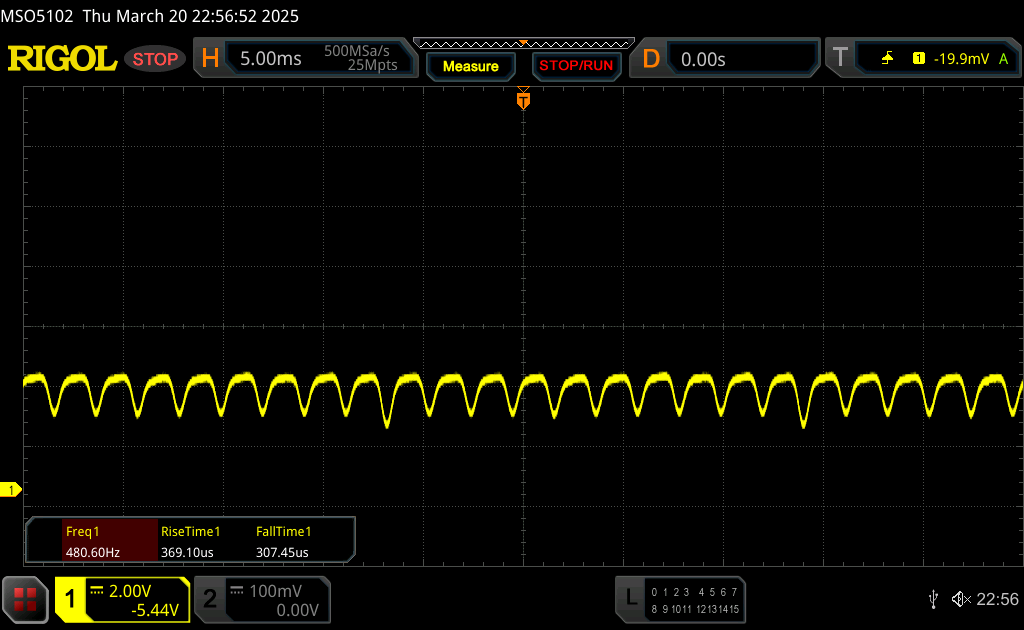
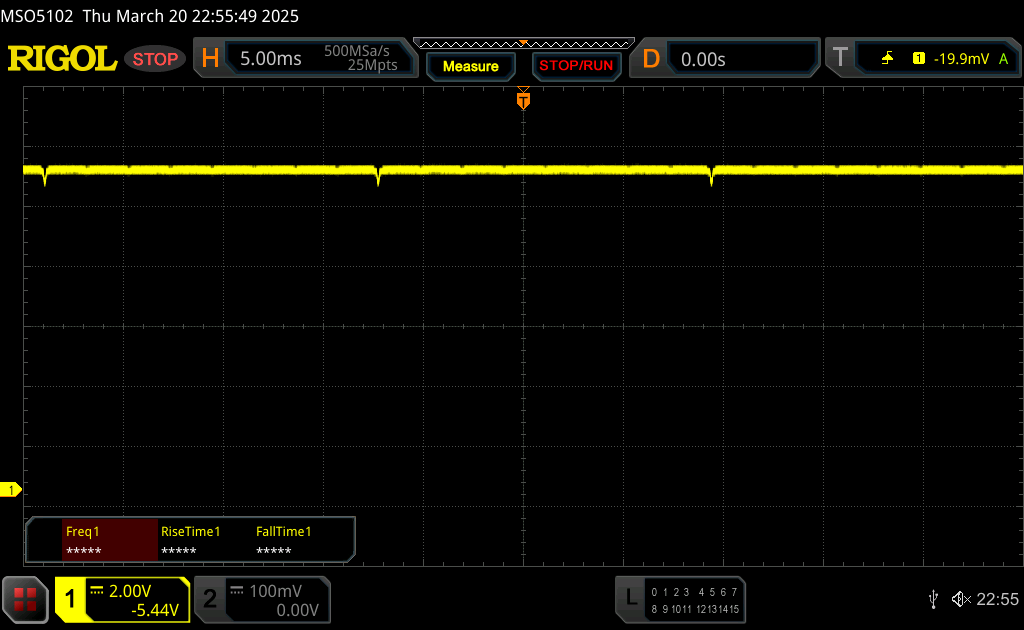
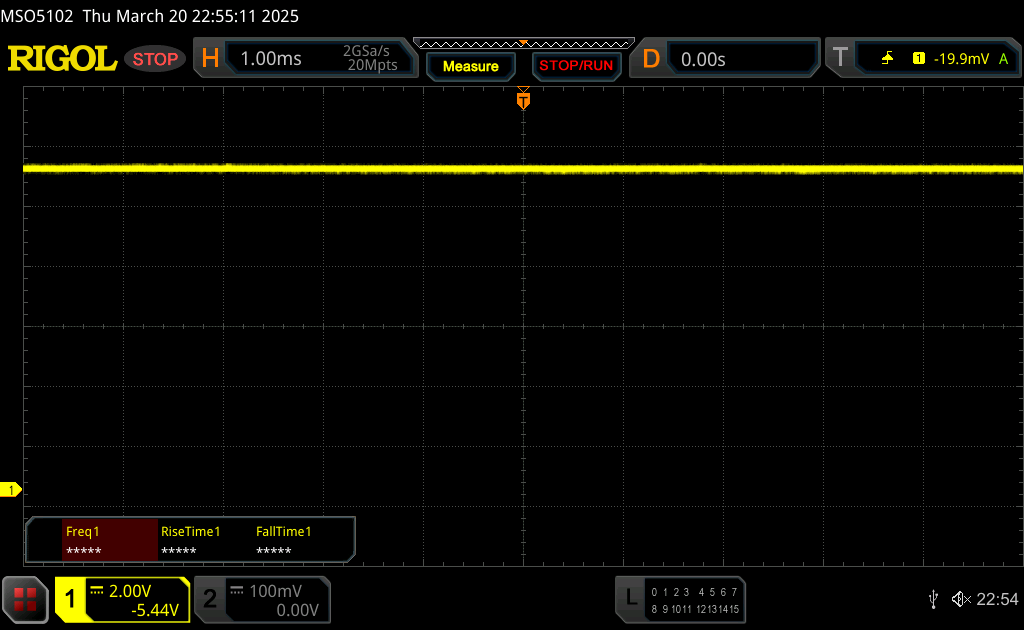
Sfarfallio dello schermo / PWM (Pulse-Width Modulation)
| flickering dello schermo / PWM rilevato | 480 Hz Amplitude: 25 % | ≤ 69 % settaggio luminosita' | 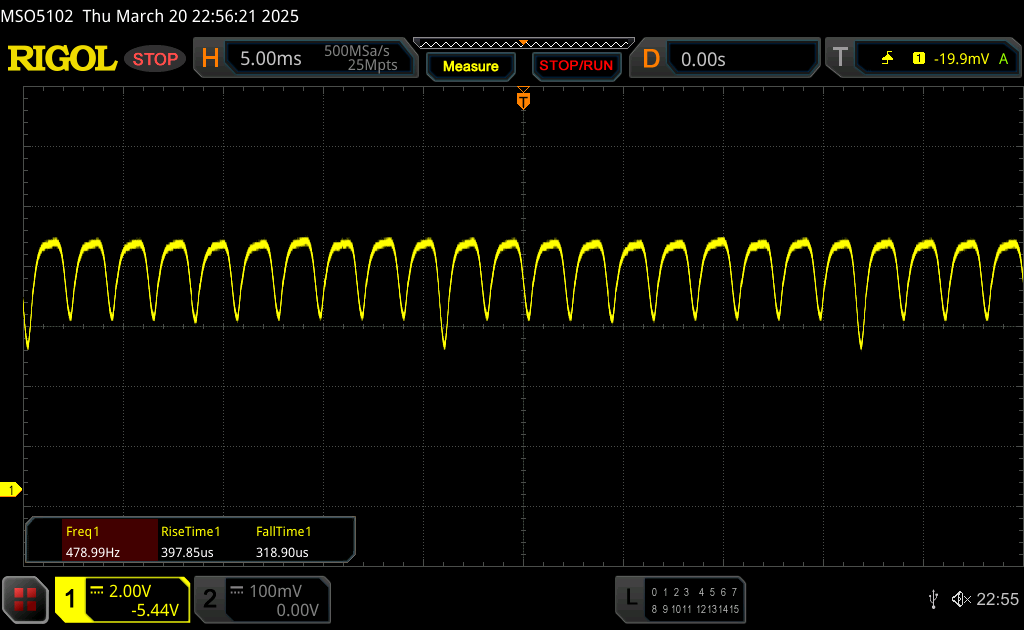 |
Il display sfarfalla a 480 Hz (Probabilmente a causa dell'uso di PWM) Flickering rilevato ad una luminosita' di 69 % o inferiore. Non dovrebbe verificarsi flickering o PWM sopra questo valore di luminosita'. La frequenza di 480 Hz è relativamente elevata, quindi la maggioranza degli utenti sensibili al PWM non dovrebbe notare alcun flickering. Tuttavia, è stato segnalato che alcuni utenti sono sensibili al PWM a 500 Hz ed oltre, quindi prestate attenzione. In confronto: 52 % di tutti i dispositivi testati non utilizza PWM per ridurre la luminosita' del display. Se è rilevato PWM, una media di 7794 (minimo: 5 - massimo: 343500) Hz è stata rilevata. | |||


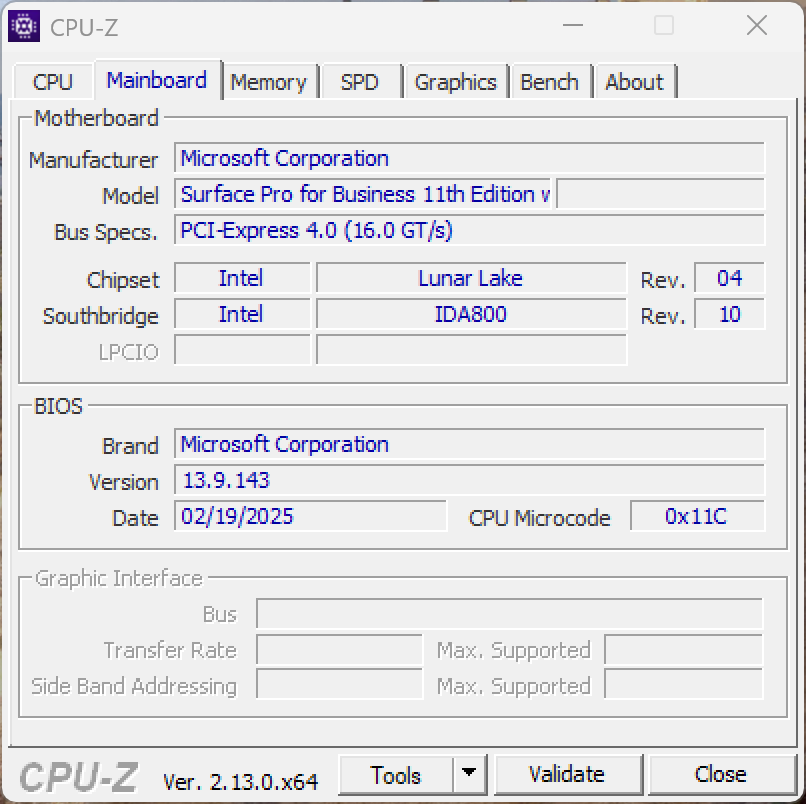
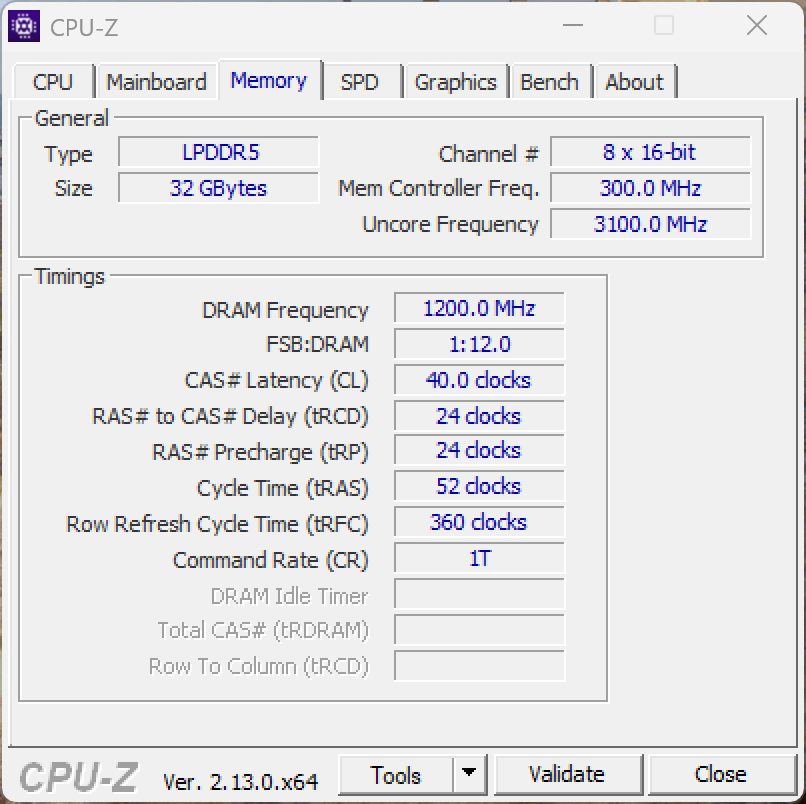
Prestazioni - Lunar Lake con 16 o 32 GB di RAM
Microsoft ha scelto ancora una volta esclusivamente processori Intel (Core Ultra 5 o 7) con vPro, con 16 o 32 GB di RAM (LPDDR5x-8533). Il supporto vPro del portatile sottolinea ancora una volta la sua attenzione per i clienti aziendali.
Condizioni di test
Microsoft non offre alcun profilo energetico aggiuntivo. Come per il Surface Laptop for Business, Microsoft ha adattato i nomi dei profili energetici di Windows e ora utilizza questi nomi per impostazione predefinita. Abbiamo eseguito i benchmark in modalità " best performance".
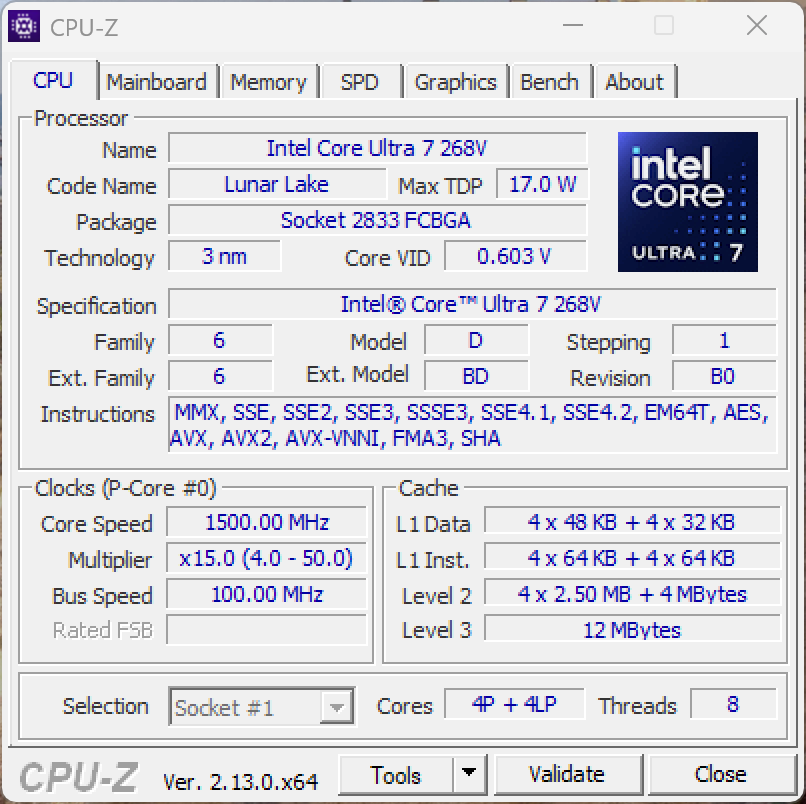
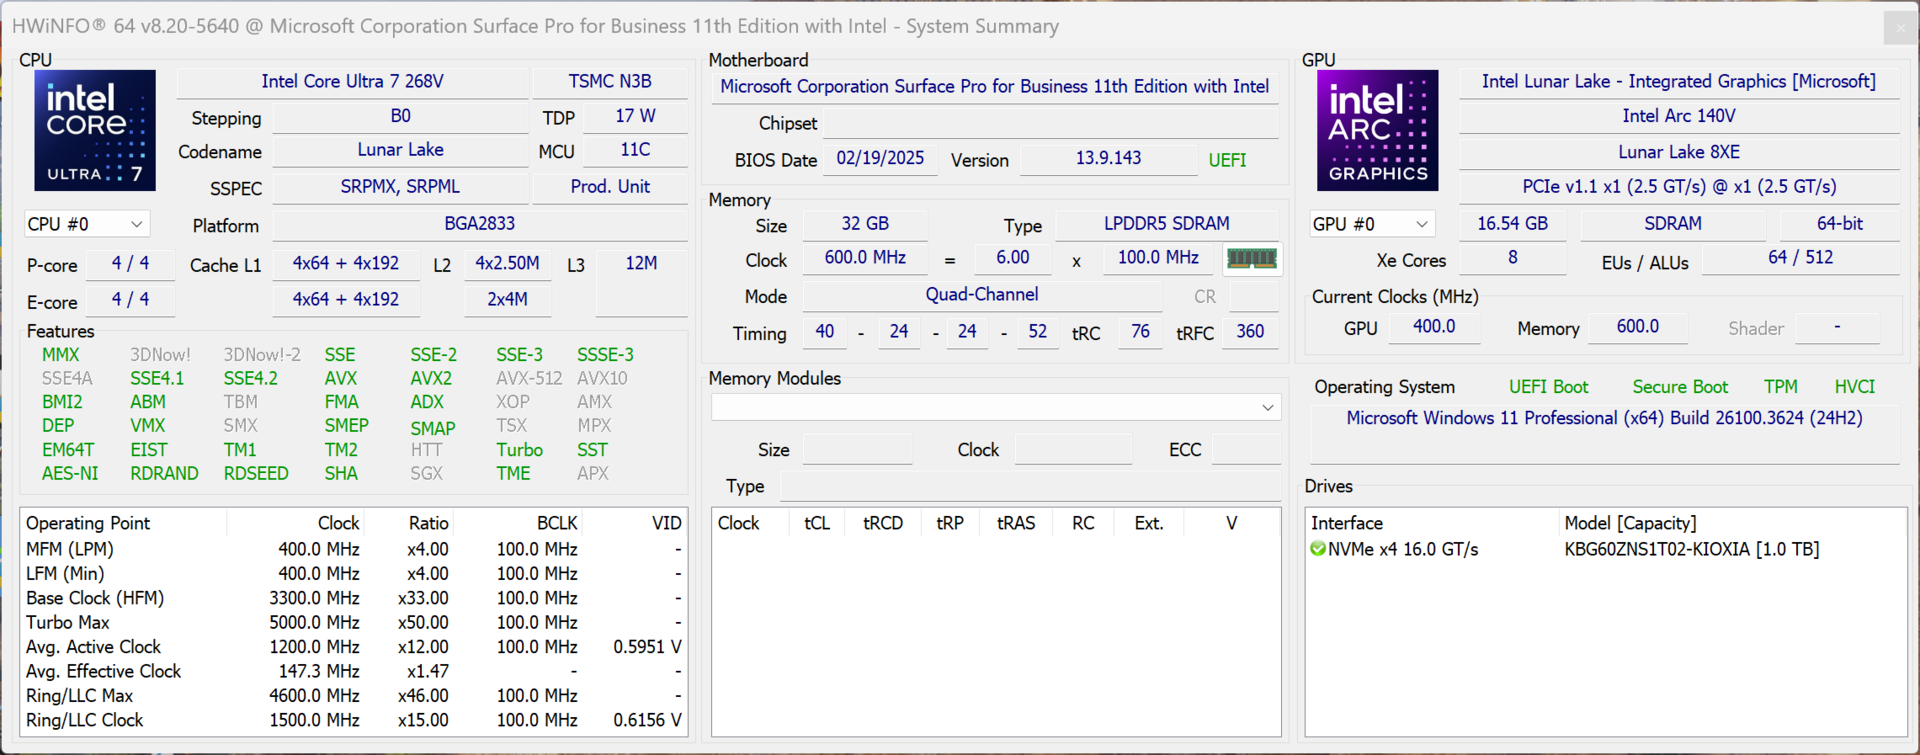
Processore - Core Ultra 7 268V
Il nostro dispositivo di prova è dotato di Core Ultra 7 268Vche consuma 37 watt per brevi periodi e 30 watt in modo continuo. Per consentire un confronto più equo possibile con il modello Snapdragon, ci siamo concentrati sulle ultime versioni di Cinebench e Geekbench, che girano nativamente anche sulla versione ARM. Questo ha rivelato che lo Snapdragon X Elite offre prestazioni multi-core significativamente superiori, ma nei test single-core, entrambi erano praticamente alla pari (con un vantaggio minimo per il modello Intel). Grazie alle sue elevate prestazioni multi-core, il dispositivo Snapdragon ha avuto spesso un vantaggio anche durante i test emulati. Le misurazioni dell'efficienza hanno inoltre mostrato un vantaggio per il modello ARM. Le prestazioni della CPU del nostro dispositivo di prova sono rimaste stabili in modalità batteria, mentre le prestazioni multi-core sono diminuite di circa il 15% sotto carico continuo.
Cinebench 2024: CPU Multi Core | CPU Single Core
Geekbench 6.7: Multi-Core | Single-Core
| CPU Performance rating | |
| Microsoft Surface Pro OLED Copilot+ | |
| Microsoft Surface Pro OLED Lunar Lake | |
| Media Intel Core Ultra 7 268V | |
| Minisforum V3 | |
| Asus ProArt PZ13 HT5306 | |
| Media della classe Tablet | |
| Dell Latitude 7350 Detachable | |
| Cinebench 2024 / CPU Multi Core | |
| Microsoft Surface Pro OLED Copilot+ | |
| Minisforum V3 | |
| Media Intel Core Ultra 7 268V (600 - 656, n=4) | |
| Microsoft Surface Pro OLED Lunar Lake | |
| Media della classe Tablet (n=1ultimi 2 anni) | |
| Asus ProArt PZ13 HT5306 | |
| Dell Latitude 7350 Detachable | |
| Cinebench 2024 / CPU Single Core | |
| Microsoft Surface Pro OLED Lunar Lake | |
| Media della classe Tablet (n=1ultimi 2 anni) | |
| Media Intel Core Ultra 7 268V (122.6 - 124.9, n=4) | |
| Microsoft Surface Pro OLED Copilot+ | |
| Asus ProArt PZ13 HT5306 | |
| Minisforum V3 | |
| Dell Latitude 7350 Detachable | |
| Geekbench 6.7 / Multi-Core | |
| Microsoft Surface Pro OLED Copilot+ | |
| Microsoft Surface Pro OLED Lunar Lake | |
| Minisforum V3 | |
| Media Intel Core Ultra 7 268V (10589 - 11388, n=6) | |
| Asus ProArt PZ13 HT5306 | |
| Dell Latitude 7350 Detachable | |
| Media della classe Tablet (1104 - 16544, n=87, ultimi 2 anni) | |
| Geekbench 6.7 / Single-Core | |
| Microsoft Surface Pro OLED Lunar Lake | |
| Microsoft Surface Pro OLED Copilot+ | |
| Media Intel Core Ultra 7 268V (2583 - 2871, n=6) | |
| Minisforum V3 | |
| Asus ProArt PZ13 HT5306 | |
| Dell Latitude 7350 Detachable | |
| Media della classe Tablet (323 - 4128, n=87, ultimi 2 anni) | |
| Power Consumption | |
| Cinebench 2024 Single Power Efficiency - external Monitor | |
| Asus ProArt PZ13 HT5306 | |
| Microsoft Surface Pro OLED Copilot+ | |
| Microsoft Surface Pro OLED Lunar Lake | |
| Cinebench 2024 Multi Power Efficiency - external Monitor | |
| Microsoft Surface Pro OLED Copilot+ | |
| Asus ProArt PZ13 HT5306 | |
| Microsoft Surface Pro OLED Lunar Lake | |
Cinebench R15 Multi continuous test
Cinebench R23: Multi Core | Single Core
Cinebench R20: CPU (Multi Core) | CPU (Single Core)
Cinebench R15: CPU Multi 64Bit | CPU Single 64Bit
Blender: v2.79 BMW27 CPU
7-Zip 18.03: 7z b 4 | 7z b 4 -mmt1
Geekbench 6.7: Multi-Core | Single-Core
Geekbench 5.5: Multi-Core | Single-Core
HWBOT x265 Benchmark v2.2: 4k Preset
LibreOffice : 20 Documents To PDF
R Benchmark 2.5: Overall mean
| CPU Performance rating | |
| Minisforum V3 | |
| Microsoft Surface Pro OLED Lunar Lake | |
| Media Intel Core Ultra 7 268V | |
| Microsoft Surface Pro OLED Copilot+ -2! | |
| Dell Latitude 7350 Detachable | |
| Media della classe Tablet | |
| Asus ProArt PZ13 HT5306 -2! | |
| Cinebench R23 / Multi Core | |
| Minisforum V3 | |
| Microsoft Surface Pro OLED Lunar Lake | |
| Media Intel Core Ultra 7 268V (9835 - 10913, n=5) | |
| Microsoft Surface Pro OLED Copilot+ | |
| Media della classe Tablet (8043 - 10868, n=3, ultimi 2 anni) | |
| Dell Latitude 7350 Detachable | |
| Asus ProArt PZ13 HT5306 | |
| Cinebench R23 / Single Core | |
| Media Intel Core Ultra 7 268V (1903 - 1985, n=5) | |
| Microsoft Surface Pro OLED Lunar Lake | |
| Media della classe Tablet (1822 - 1921, n=3, ultimi 2 anni) | |
| Minisforum V3 | |
| Dell Latitude 7350 Detachable | |
| Microsoft Surface Pro OLED Copilot+ | |
| Asus ProArt PZ13 HT5306 | |
| Cinebench R20 / CPU (Multi Core) | |
| Minisforum V3 | |
| Microsoft Surface Pro OLED Lunar Lake | |
| Media Intel Core Ultra 7 268V (3811 - 4255, n=5) | |
| Media della classe Tablet (3137 - 4255, n=2, ultimi 2 anni) | |
| Microsoft Surface Pro OLED Copilot+ | |
| Dell Latitude 7350 Detachable | |
| Asus ProArt PZ13 HT5306 | |
| Cinebench R20 / CPU (Single Core) | |
| Media Intel Core Ultra 7 268V (733 - 764, n=5) | |
| Microsoft Surface Pro OLED Lunar Lake | |
| Media della classe Tablet (705 - 739, n=2, ultimi 2 anni) | |
| Minisforum V3 | |
| Dell Latitude 7350 Detachable | |
| Microsoft Surface Pro OLED Copilot+ | |
| Asus ProArt PZ13 HT5306 | |
| Cinebench R15 / CPU Multi 64Bit | |
| Microsoft Surface Pro OLED Copilot+ | |
| Minisforum V3 | |
| Microsoft Surface Pro OLED Lunar Lake | |
| Media Intel Core Ultra 7 268V (1574 - 1651, n=5) | |
| Media della classe Tablet (1285 - 1651, n=2, ultimi 2 anni) | |
| Asus ProArt PZ13 HT5306 | |
| Dell Latitude 7350 Detachable | |
| Cinebench R15 / CPU Single 64Bit | |
| Microsoft Surface Pro OLED Lunar Lake | |
| Media Intel Core Ultra 7 268V (287 - 302, n=5) | |
| Media della classe Tablet (274 - 299, n=2, ultimi 2 anni) | |
| Minisforum V3 | |
| Microsoft Surface Pro OLED Copilot+ | |
| Dell Latitude 7350 Detachable | |
| Asus ProArt PZ13 HT5306 | |
| Blender / v2.79 BMW27 CPU | |
| Asus ProArt PZ13 HT5306 | |
| Media della classe Tablet (337 - 484, n=2, ultimi 2 anni) | |
| Dell Latitude 7350 Detachable | |
| Microsoft Surface Pro OLED Copilot+ | |
| Media Intel Core Ultra 7 268V (311 - 410, n=5) | |
| Microsoft Surface Pro OLED Lunar Lake | |
| Minisforum V3 | |
| 7-Zip 18.03 / 7z b 4 | |
| Minisforum V3 | |
| Microsoft Surface Pro OLED Copilot+ | |
| Microsoft Surface Pro OLED Lunar Lake | |
| Media Intel Core Ultra 7 268V (32797 - 36654, n=5) | |
| Asus ProArt PZ13 HT5306 | |
| Media della classe Tablet (24486 - 36610, n=2, ultimi 2 anni) | |
| Dell Latitude 7350 Detachable | |
| 7-Zip 18.03 / 7z b 4 -mmt1 | |
| Microsoft Surface Pro OLED Lunar Lake | |
| Minisforum V3 | |
| Media Intel Core Ultra 7 268V (5688 - 6021, n=5) | |
| Media della classe Tablet (4769 - 5991, n=2, ultimi 2 anni) | |
| Microsoft Surface Pro OLED Copilot+ | |
| Dell Latitude 7350 Detachable | |
| Asus ProArt PZ13 HT5306 | |
| Geekbench 6.7 / Multi-Core | |
| Microsoft Surface Pro OLED Copilot+ | |
| Microsoft Surface Pro OLED Lunar Lake | |
| Minisforum V3 | |
| Media Intel Core Ultra 7 268V (10589 - 11388, n=6) | |
| Asus ProArt PZ13 HT5306 | |
| Dell Latitude 7350 Detachable | |
| Media della classe Tablet (1104 - 16544, n=87, ultimi 2 anni) | |
| Geekbench 6.7 / Single-Core | |
| Microsoft Surface Pro OLED Lunar Lake | |
| Microsoft Surface Pro OLED Copilot+ | |
| Media Intel Core Ultra 7 268V (2583 - 2871, n=6) | |
| Minisforum V3 | |
| Asus ProArt PZ13 HT5306 | |
| Dell Latitude 7350 Detachable | |
| Media della classe Tablet (323 - 4128, n=87, ultimi 2 anni) | |
| Geekbench 5.5 / Multi-Core | |
| Minisforum V3 | |
| Microsoft Surface Pro OLED Lunar Lake | |
| Media Intel Core Ultra 7 268V (9491 - 9855, n=6) | |
| Dell Latitude 7350 Detachable | |
| Media della classe Tablet (303 - 10522, n=40, ultimi 2 anni) | |
| Geekbench 5.5 / Single-Core | |
| Microsoft Surface Pro OLED Lunar Lake | |
| Media Intel Core Ultra 7 268V (2008 - 2097, n=6) | |
| Minisforum V3 | |
| Dell Latitude 7350 Detachable | |
| Media della classe Tablet (103 - 2286, n=40, ultimi 2 anni) | |
| HWBOT x265 Benchmark v2.2 / 4k Preset | |
| Minisforum V3 | |
| Microsoft Surface Pro OLED Lunar Lake | |
| Media Intel Core Ultra 7 268V (10.4 - 13.9, n=5) | |
| Media della classe Tablet (7.11 - 12.9, n=2, ultimi 2 anni) | |
| Dell Latitude 7350 Detachable | |
| Microsoft Surface Pro OLED Copilot+ | |
| Asus ProArt PZ13 HT5306 | |
| LibreOffice / 20 Documents To PDF | |
| Asus ProArt PZ13 HT5306 | |
| Media della classe Tablet (48.3 - 62.8, n=2, ultimi 2 anni) | |
| Minisforum V3 | |
| Microsoft Surface Pro OLED Copilot+ | |
| Media Intel Core Ultra 7 268V (44.9 - 60.8, n=5) | |
| Microsoft Surface Pro OLED Lunar Lake | |
| Dell Latitude 7350 Detachable | |
| R Benchmark 2.5 / Overall mean | |
| Asus ProArt PZ13 HT5306 | |
| Microsoft Surface Pro OLED Copilot+ | |
| Dell Latitude 7350 Detachable | |
| Media della classe Tablet (0.4361 - 0.542, n=2, ultimi 2 anni) | |
| Minisforum V3 | |
| Media Intel Core Ultra 7 268V (0.4344 - 0.4565, n=5) | |
| Microsoft Surface Pro OLED Lunar Lake | |
* ... Meglio usare valori piccoli
AIDA64: FP32 Ray-Trace | FPU Julia | CPU SHA3 | CPU Queen | FPU SinJulia | FPU Mandel | CPU AES | CPU ZLib | FP64 Ray-Trace | CPU PhotoWorxx
| Performance rating | |
| Minisforum V3 | |
| Microsoft Surface Pro OLED Lunar Lake | |
| Media Intel Core Ultra 7 268V | |
| Media della classe Tablet | |
| Microsoft Surface Pro OLED Copilot+ | |
| Dell Latitude 7350 Detachable | |
| Asus ProArt PZ13 HT5306 | |
| AIDA64 / FP32 Ray-Trace | |
| Minisforum V3 | |
| Microsoft Surface Pro OLED Lunar Lake | |
| Media Intel Core Ultra 7 268V (10556 - 12759, n=5) | |
| Media della classe Tablet (8485 - 12759, n=2, ultimi 2 anni) | |
| Dell Latitude 7350 Detachable | |
| Asus ProArt PZ13 HT5306 | |
| Microsoft Surface Pro OLED Copilot+ | |
| AIDA64 / FPU Julia | |
| Minisforum V3 | |
| Microsoft Surface Pro OLED Lunar Lake | |
| Media Intel Core Ultra 7 268V (47659 - 62563, n=5) | |
| Media della classe Tablet (42586 - 62102, n=2, ultimi 2 anni) | |
| Dell Latitude 7350 Detachable | |
| Asus ProArt PZ13 HT5306 | |
| Microsoft Surface Pro OLED Copilot+ | |
| AIDA64 / CPU SHA3 | |
| Minisforum V3 | |
| Microsoft Surface Pro OLED Lunar Lake | |
| Microsoft Surface Pro OLED Copilot+ | |
| Media Intel Core Ultra 7 268V (2117 - 2803, n=5) | |
| Media della classe Tablet (2056 - 2784, n=2, ultimi 2 anni) | |
| Asus ProArt PZ13 HT5306 | |
| Dell Latitude 7350 Detachable | |
| AIDA64 / CPU Queen | |
| Minisforum V3 | |
| Microsoft Surface Pro OLED Copilot+ | |
| Media Intel Core Ultra 7 268V (49629 - 49759, n=5) | |
| Microsoft Surface Pro OLED Lunar Lake | |
| Media della classe Tablet (n=1ultimi 2 anni) | |
| Asus ProArt PZ13 HT5306 | |
| Dell Latitude 7350 Detachable | |
| AIDA64 / FPU SinJulia | |
| Minisforum V3 | |
| Microsoft Surface Pro OLED Lunar Lake | |
| Media Intel Core Ultra 7 268V (4351 - 4429, n=5) | |
| Dell Latitude 7350 Detachable | |
| Media della classe Tablet (4083 - 4429, n=2, ultimi 2 anni) | |
| Microsoft Surface Pro OLED Copilot+ | |
| Asus ProArt PZ13 HT5306 | |
| AIDA64 / FPU Mandel | |
| Minisforum V3 | |
| Microsoft Surface Pro OLED Lunar Lake | |
| Media Intel Core Ultra 7 268V (25929 - 33207, n=5) | |
| Media della classe Tablet (22775 - 31836, n=2, ultimi 2 anni) | |
| Microsoft Surface Pro OLED Copilot+ | |
| Dell Latitude 7350 Detachable | |
| Asus ProArt PZ13 HT5306 | |
| AIDA64 / CPU AES | |
| Microsoft Surface Pro OLED Copilot+ | |
| Minisforum V3 | |
| Microsoft Surface Pro OLED Lunar Lake | |
| Media Intel Core Ultra 7 268V (33196 - 39140, n=5) | |
| Asus ProArt PZ13 HT5306 | |
| Media della classe Tablet (34551 - 38941, n=2, ultimi 2 anni) | |
| Dell Latitude 7350 Detachable | |
| AIDA64 / CPU ZLib | |
| Minisforum V3 | |
| Microsoft Surface Pro OLED Copilot+ | |
| Microsoft Surface Pro OLED Lunar Lake | |
| Media Intel Core Ultra 7 268V (441 - 633, n=5) | |
| Media della classe Tablet (434 - 631, n=2, ultimi 2 anni) | |
| Asus ProArt PZ13 HT5306 | |
| Dell Latitude 7350 Detachable | |
| AIDA64 / FP64 Ray-Trace | |
| Minisforum V3 | |
| Microsoft Surface Pro OLED Lunar Lake | |
| Media Intel Core Ultra 7 268V (5938 - 6960, n=5) | |
| Media della classe Tablet (4660 - 6803, n=2, ultimi 2 anni) | |
| Microsoft Surface Pro OLED Copilot+ | |
| Dell Latitude 7350 Detachable | |
| Asus ProArt PZ13 HT5306 | |
| AIDA64 / CPU PhotoWorxx | |
| Microsoft Surface Pro OLED Lunar Lake | |
| Media della classe Tablet (52755 - 54886, n=2, ultimi 2 anni) | |
| Media Intel Core Ultra 7 268V (46733 - 55083, n=5) | |
| Dell Latitude 7350 Detachable | |
| Microsoft Surface Pro OLED Copilot+ | |
| Minisforum V3 | |
| Asus ProArt PZ13 HT5306 | |
Prestazioni del sistema
Come previsto, la versione Intel del Surface Pro è un dispositivo super reattivo e ha anche battuto la versione ARM nel CrossMark cross-system. D'altra parte, il modello Snapdragon ha avuto un vantaggio durante i test del browser.
CrossMark: Overall | Productivity | Creativity | Responsiveness
WebXPRT 3: Overall
WebXPRT 4: Overall
Mozilla Kraken 1.1: Total
| PCMark 10 / Score | |
| Media della classe Tablet (6924 - 7420, n=2, ultimi 2 anni) | |
| Minisforum V3 | |
| Media Intel Core Ultra 7 268V, Intel Arc Graphics 140V (6729 - 7236, n=5) | |
| Microsoft Surface Pro OLED Lunar Lake | |
| Dell Latitude 7350 Detachable | |
| PCMark 10 / Essentials | |
| Minisforum V3 | |
| Dell Latitude 7350 Detachable | |
| Media Intel Core Ultra 7 268V, Intel Arc Graphics 140V (10007 - 10701, n=5) | |
| Microsoft Surface Pro OLED Lunar Lake | |
| Media della classe Tablet (9991 - 10351, n=2, ultimi 2 anni) | |
| PCMark 10 / Productivity | |
| Media della classe Tablet (8823 - 13600, n=2, ultimi 2 anni) | |
| Minisforum V3 | |
| Media Intel Core Ultra 7 268V, Intel Arc Graphics 140V (8766 - 9217, n=5) | |
| Dell Latitude 7350 Detachable | |
| Microsoft Surface Pro OLED Lunar Lake | |
| PCMark 10 / Digital Content Creation | |
| Media Intel Core Ultra 7 268V, Intel Arc Graphics 140V (9425 - 10429, n=5) | |
| Microsoft Surface Pro OLED Lunar Lake | |
| Media della classe Tablet (8160 - 9863, n=2, ultimi 2 anni) | |
| Minisforum V3 | |
| Dell Latitude 7350 Detachable | |
| CrossMark / Overall | |
| Microsoft Surface Pro OLED Lunar Lake | |
| Media Intel Core Ultra 7 268V, Intel Arc Graphics 140V (1643 - 1763, n=5) | |
| Minisforum V3 | |
| Microsoft Surface Pro OLED Copilot+ | |
| Dell Latitude 7350 Detachable | |
| Asus ProArt PZ13 HT5306 | |
| Media della classe Tablet (319 - 2375, n=47, ultimi 2 anni) | |
| CrossMark / Productivity | |
| Microsoft Surface Pro OLED Lunar Lake | |
| Media Intel Core Ultra 7 268V, Intel Arc Graphics 140V (1577 - 1696, n=5) | |
| Minisforum V3 | |
| Microsoft Surface Pro OLED Copilot+ | |
| Dell Latitude 7350 Detachable | |
| Asus ProArt PZ13 HT5306 | |
| Media della classe Tablet (346 - 2036, n=45, ultimi 2 anni) | |
| CrossMark / Creativity | |
| Microsoft Surface Pro OLED Lunar Lake | |
| Media Intel Core Ultra 7 268V, Intel Arc Graphics 140V (1866 - 2021, n=5) | |
| Minisforum V3 | |
| Microsoft Surface Pro OLED Copilot+ | |
| Dell Latitude 7350 Detachable | |
| Asus ProArt PZ13 HT5306 | |
| Media della classe Tablet (288 - 2620, n=45, ultimi 2 anni) | |
| CrossMark / Responsiveness | |
| Media della classe Tablet (333 - 12671, n=45, ultimi 2 anni) | |
| Microsoft Surface Pro OLED Copilot+ | |
| Microsoft Surface Pro OLED Lunar Lake | |
| Media Intel Core Ultra 7 268V, Intel Arc Graphics 140V (1239 - 1313, n=5) | |
| Minisforum V3 | |
| Dell Latitude 7350 Detachable | |
| Asus ProArt PZ13 HT5306 | |
| WebXPRT 3 / Overall | |
| Microsoft Surface Pro OLED Copilot+ | |
| Asus ProArt PZ13 HT5306 | |
| Minisforum V3 | |
| Media Intel Core Ultra 7 268V, Intel Arc Graphics 140V (266 - 317, n=5) | |
| Microsoft Surface Pro OLED Lunar Lake | |
| Media della classe Tablet (108 - 480, n=10, ultimi 2 anni) | |
| Dell Latitude 7350 Detachable | |
| WebXPRT 4 / Overall | |
| Microsoft Surface Pro OLED Copilot+ | |
| Asus ProArt PZ13 HT5306 | |
| Microsoft Surface Pro OLED Lunar Lake | |
| Media Intel Core Ultra 7 268V, Intel Arc Graphics 140V (245 - 292, n=5) | |
| Minisforum V3 | |
| Dell Latitude 7350 Detachable | |
| Media della classe Tablet (39 - 376, n=57, ultimi 2 anni) | |
| Mozilla Kraken 1.1 / Total | |
| Media della classe Tablet (243 - 27101, n=67, ultimi 2 anni) | |
| Dell Latitude 7350 Detachable | |
| Minisforum V3 | |
| Media Intel Core Ultra 7 268V, Intel Arc Graphics 140V (460 - 476, n=5) | |
| Microsoft Surface Pro OLED Lunar Lake | |
| Asus ProArt PZ13 HT5306 | |
| Microsoft Surface Pro OLED Copilot+ | |
* ... Meglio usare valori piccoli
| PCMark 10 Score | 6924 punti | |
Aiuto | ||
| AIDA64 / Memory Copy | |
| Media della classe Tablet (108317 - 110050, n=2, ultimi 2 anni) | |
| Microsoft Surface Pro OLED Lunar Lake | |
| Media Intel Core Ultra 7 268V (100445 - 108317, n=5) | |
| Dell Latitude 7350 Detachable | |
| Minisforum V3 | |
| Microsoft Surface Pro OLED Copilot+ | |
| Asus ProArt PZ13 HT5306 | |
| AIDA64 / Memory Read | |
| Asus ProArt PZ13 HT5306 | |
| Microsoft Surface Pro OLED Copilot+ | |
| Microsoft Surface Pro OLED Lunar Lake | |
| Media della classe Tablet (85395 - 87747, n=2, ultimi 2 anni) | |
| Media Intel Core Ultra 7 268V (82511 - 88341, n=5) | |
| Dell Latitude 7350 Detachable | |
| Minisforum V3 | |
| AIDA64 / Memory Write | |
| Microsoft Surface Pro OLED Lunar Lake | |
| Media Intel Core Ultra 7 268V (104206 - 117888, n=5) | |
| Media della classe Tablet (108824 - 117859, n=2, ultimi 2 anni) | |
| Minisforum V3 | |
| Dell Latitude 7350 Detachable | |
| Asus ProArt PZ13 HT5306 | |
| Microsoft Surface Pro OLED Copilot+ | |
| AIDA64 / Memory Latency | |
| Dell Latitude 7350 Detachable | |
| Minisforum V3 | |
| Media Intel Core Ultra 7 268V (94.4 - 101.5, n=5) | |
| Media della classe Tablet (94.4 - 101.7, n=2, ultimi 2 anni) | |
| Microsoft Surface Pro OLED Lunar Lake | |
* ... Meglio usare valori piccoli
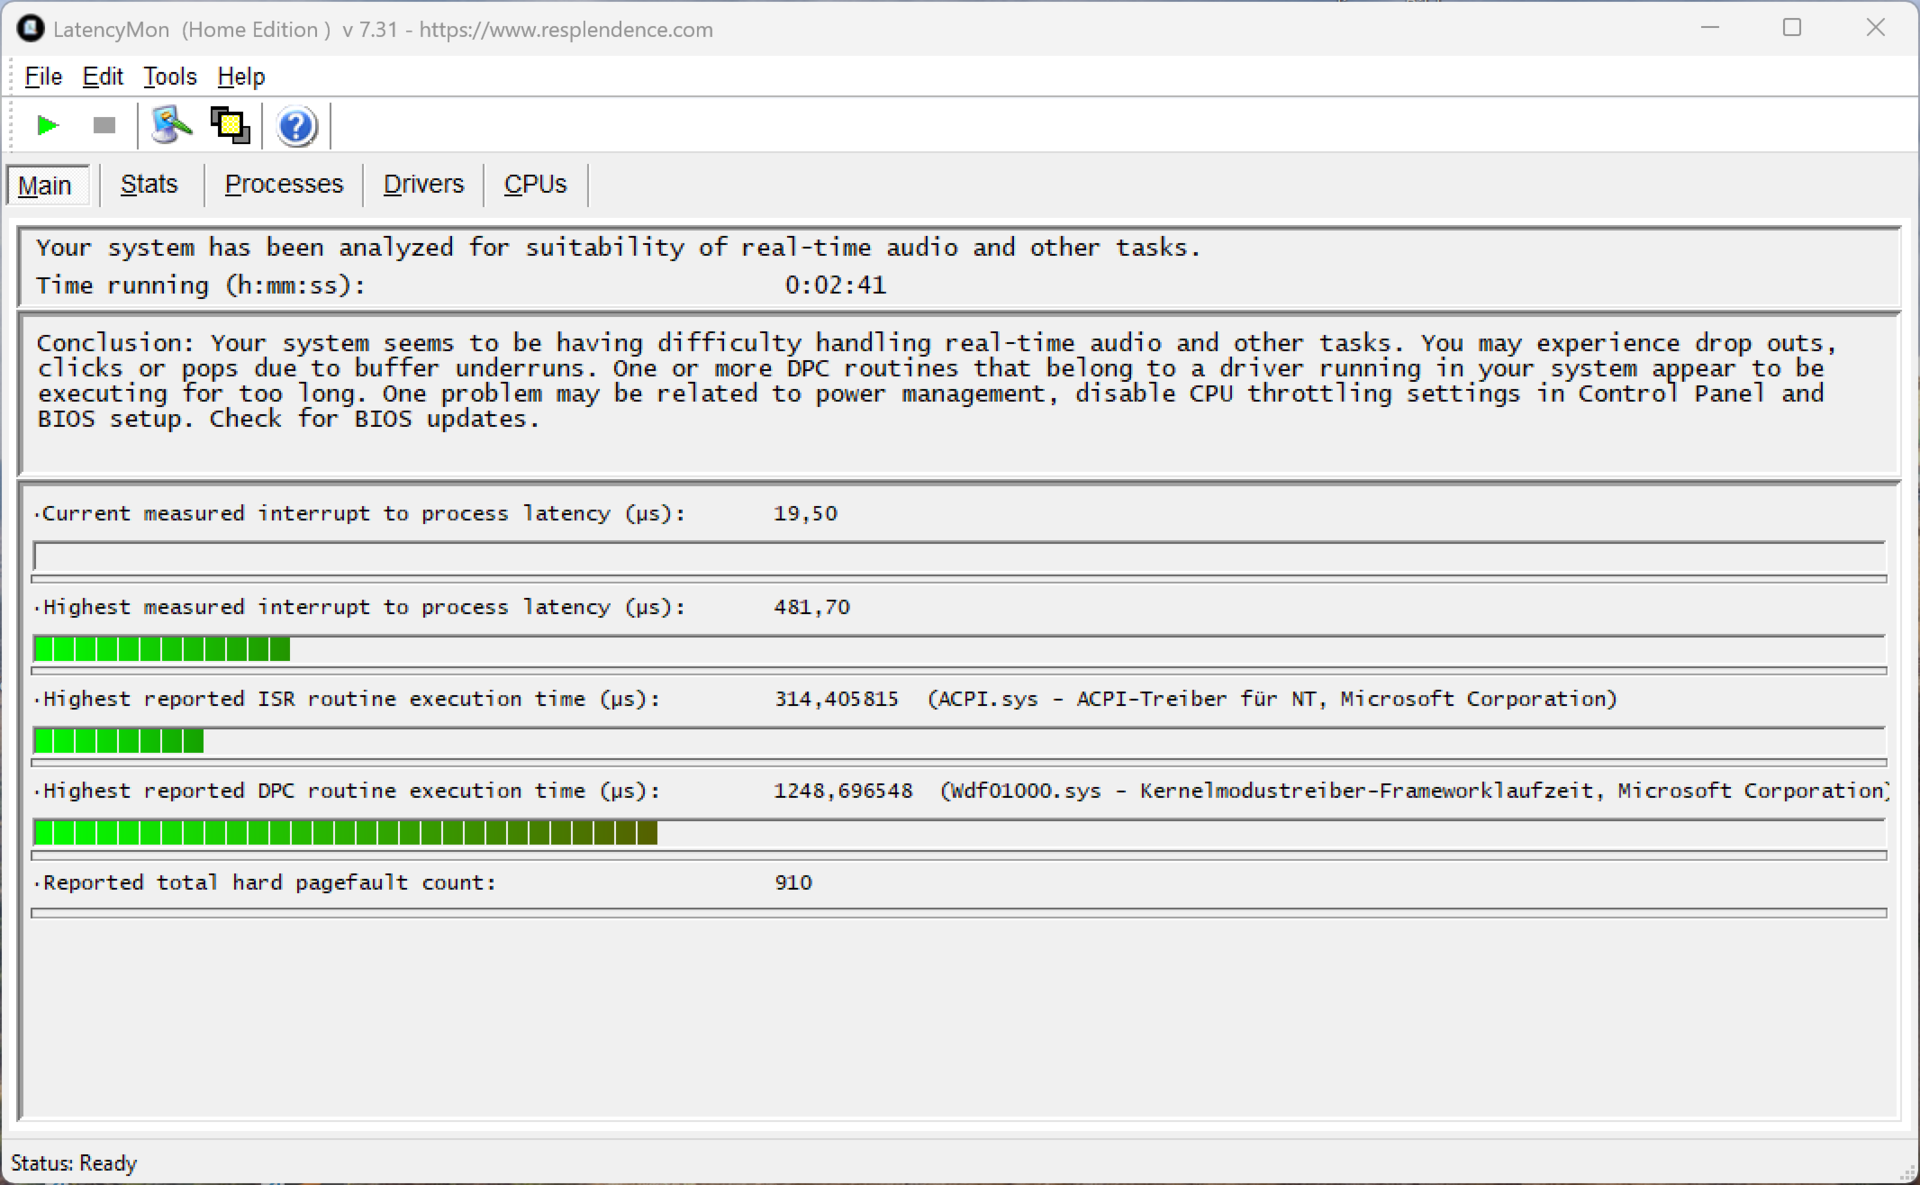
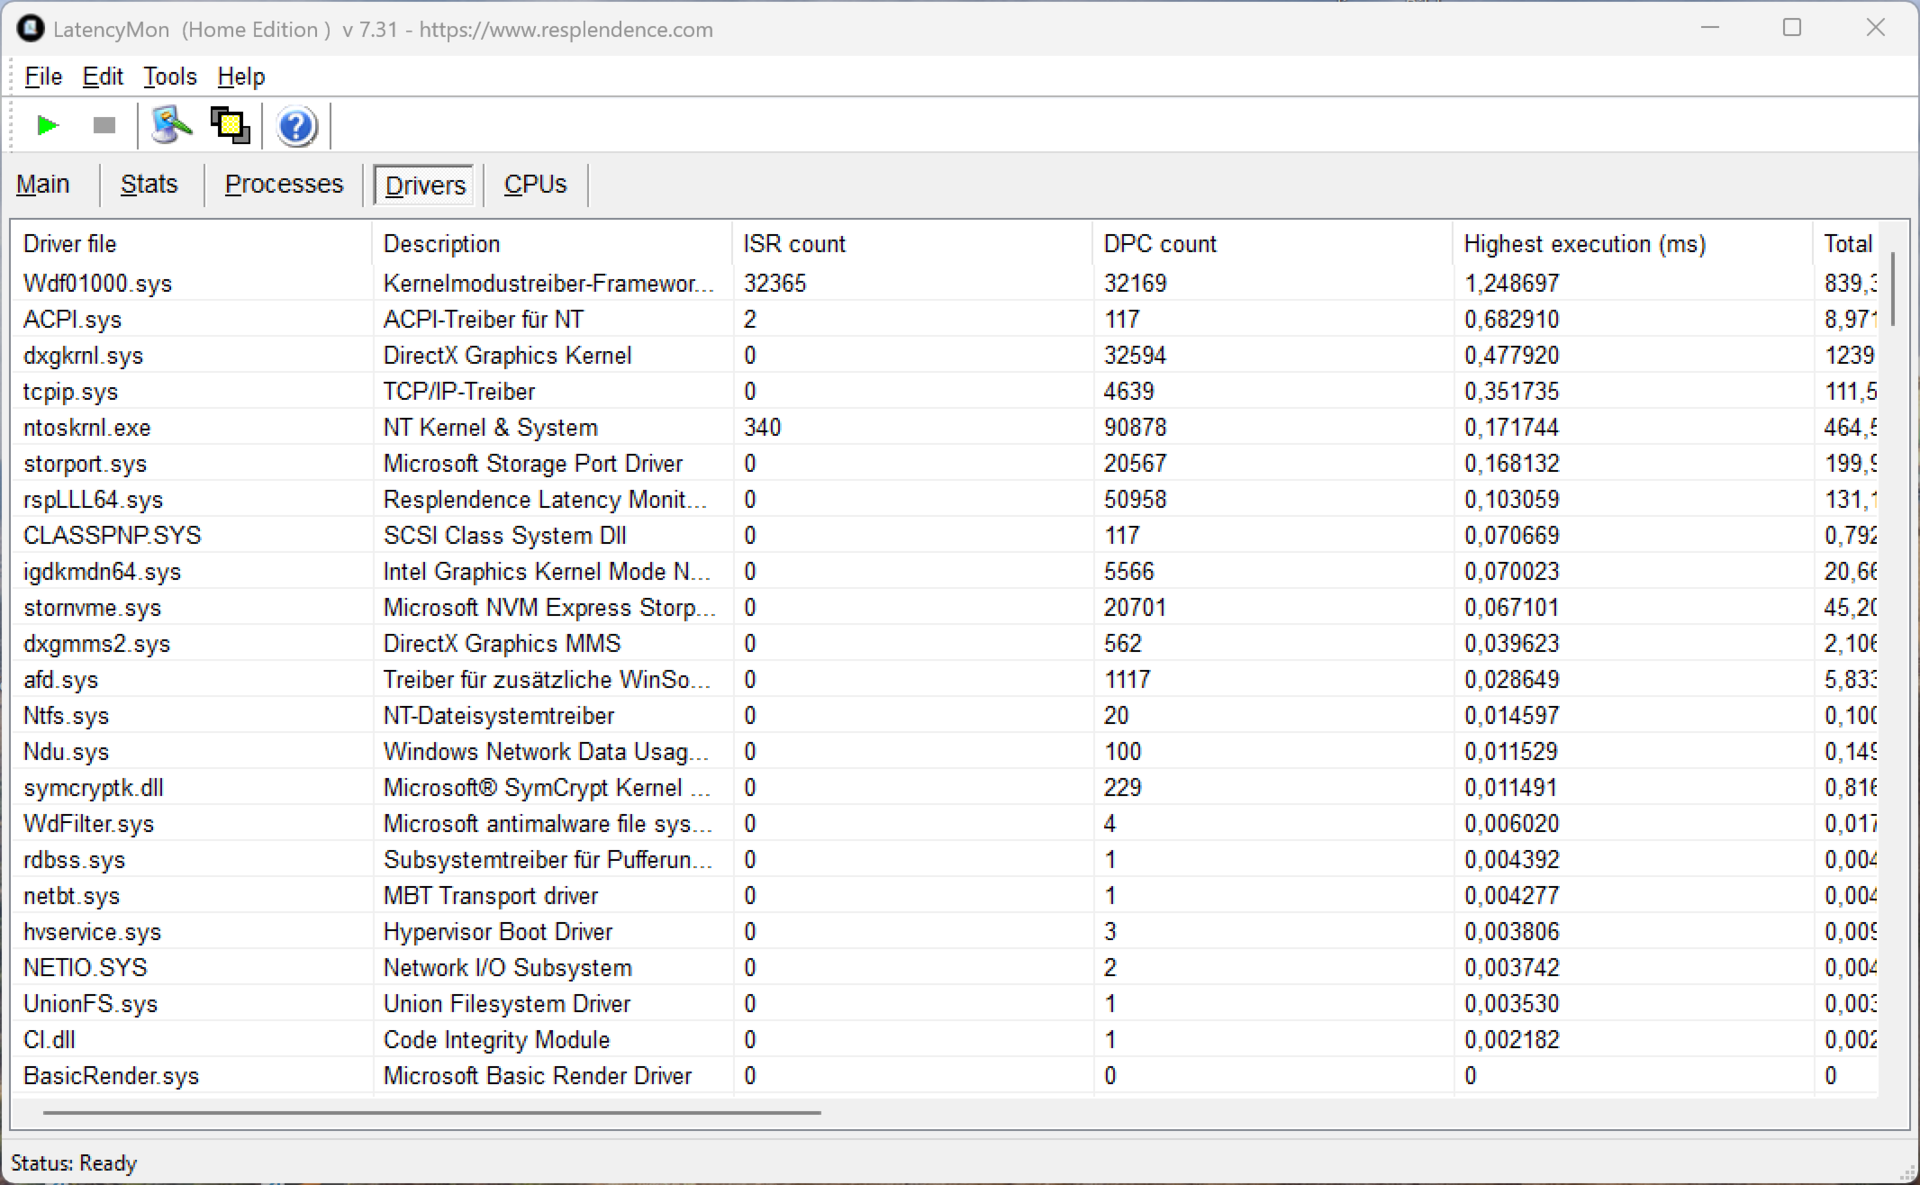
Latenze DPC
Nel nostro test di latenza standardizzato (navigazione web, riproduzione YouTube 4K, carico della CPU), il nostro dispositivo di prova con l'attuale versione del BIOS non ha mostrato alcuna limitazione. Anche se un driver ha fallito in minima parte, l'importante valore "interrupt-to-process-latency" era molto basso.
| DPC Latencies / LatencyMon - interrupt to process latency (max), Web, Youtube, Prime95 | |
| Dell Latitude 7350 Detachable | |
| Minisforum V3 | |
| Microsoft Surface Pro OLED Lunar Lake | |
* ... Meglio usare valori piccoli
Dispositivo di archiviazione
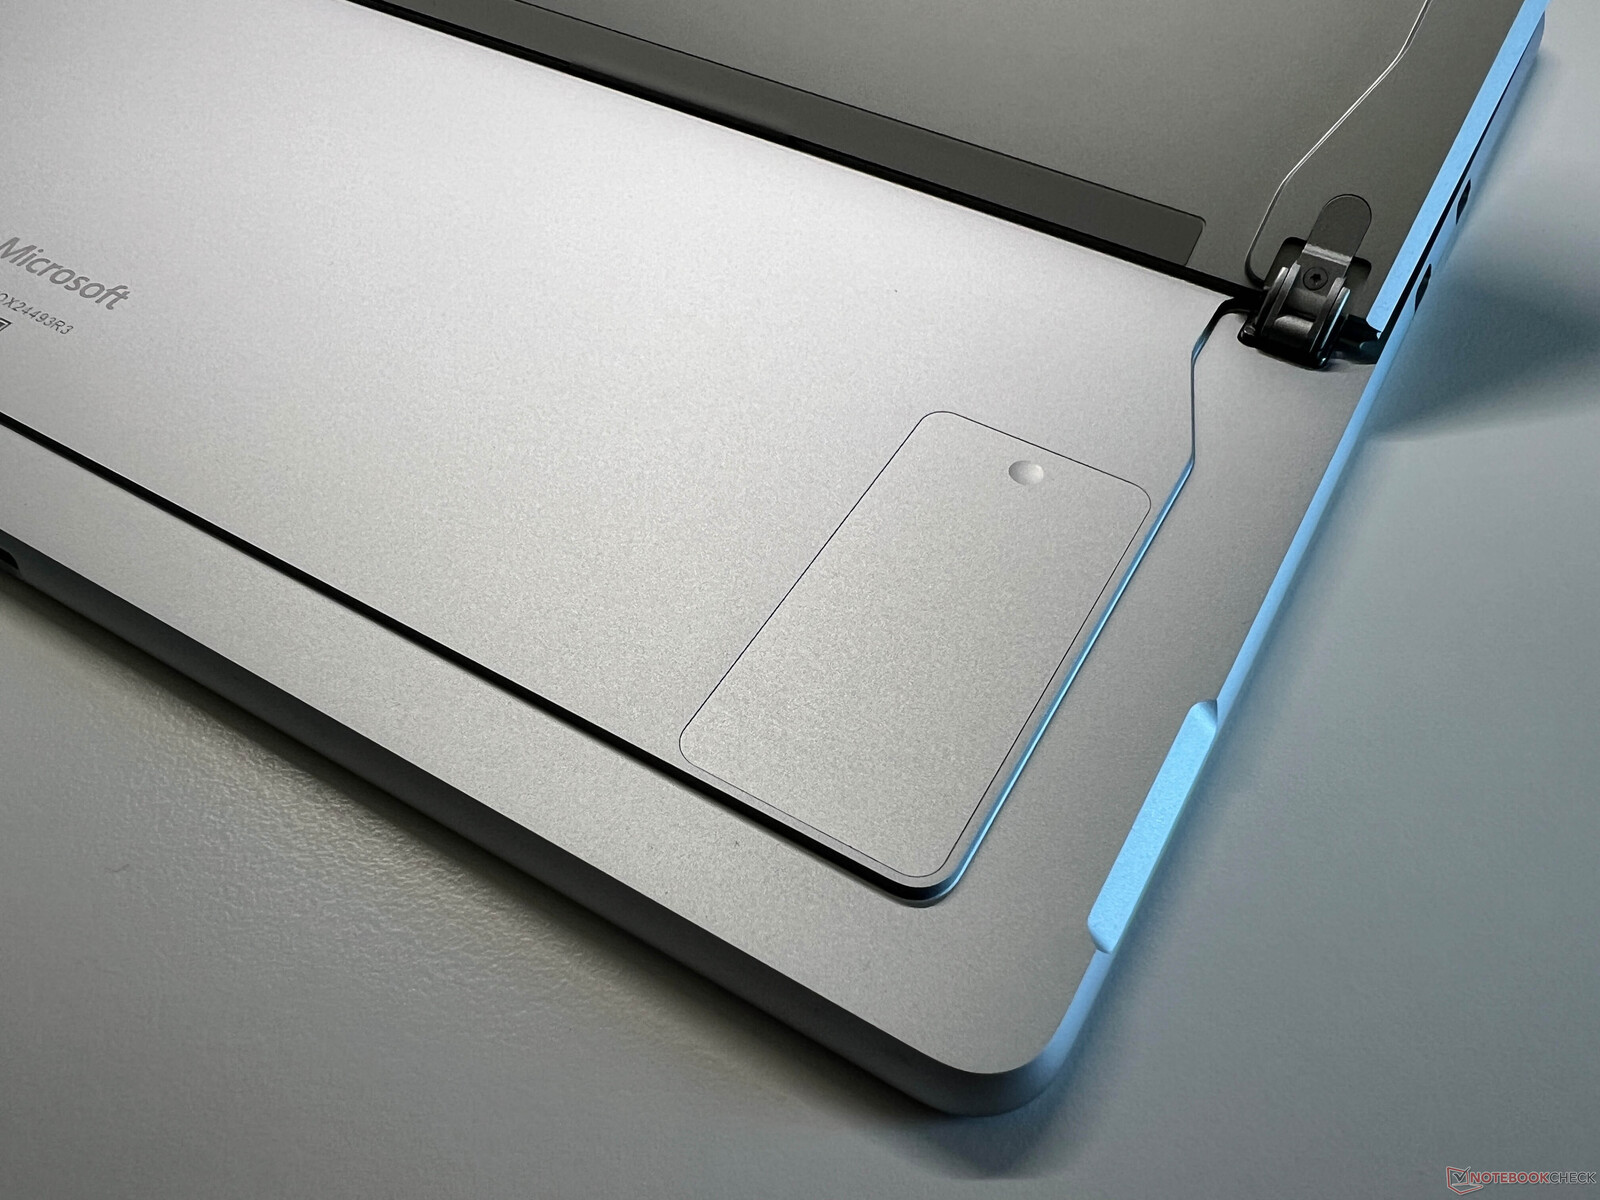
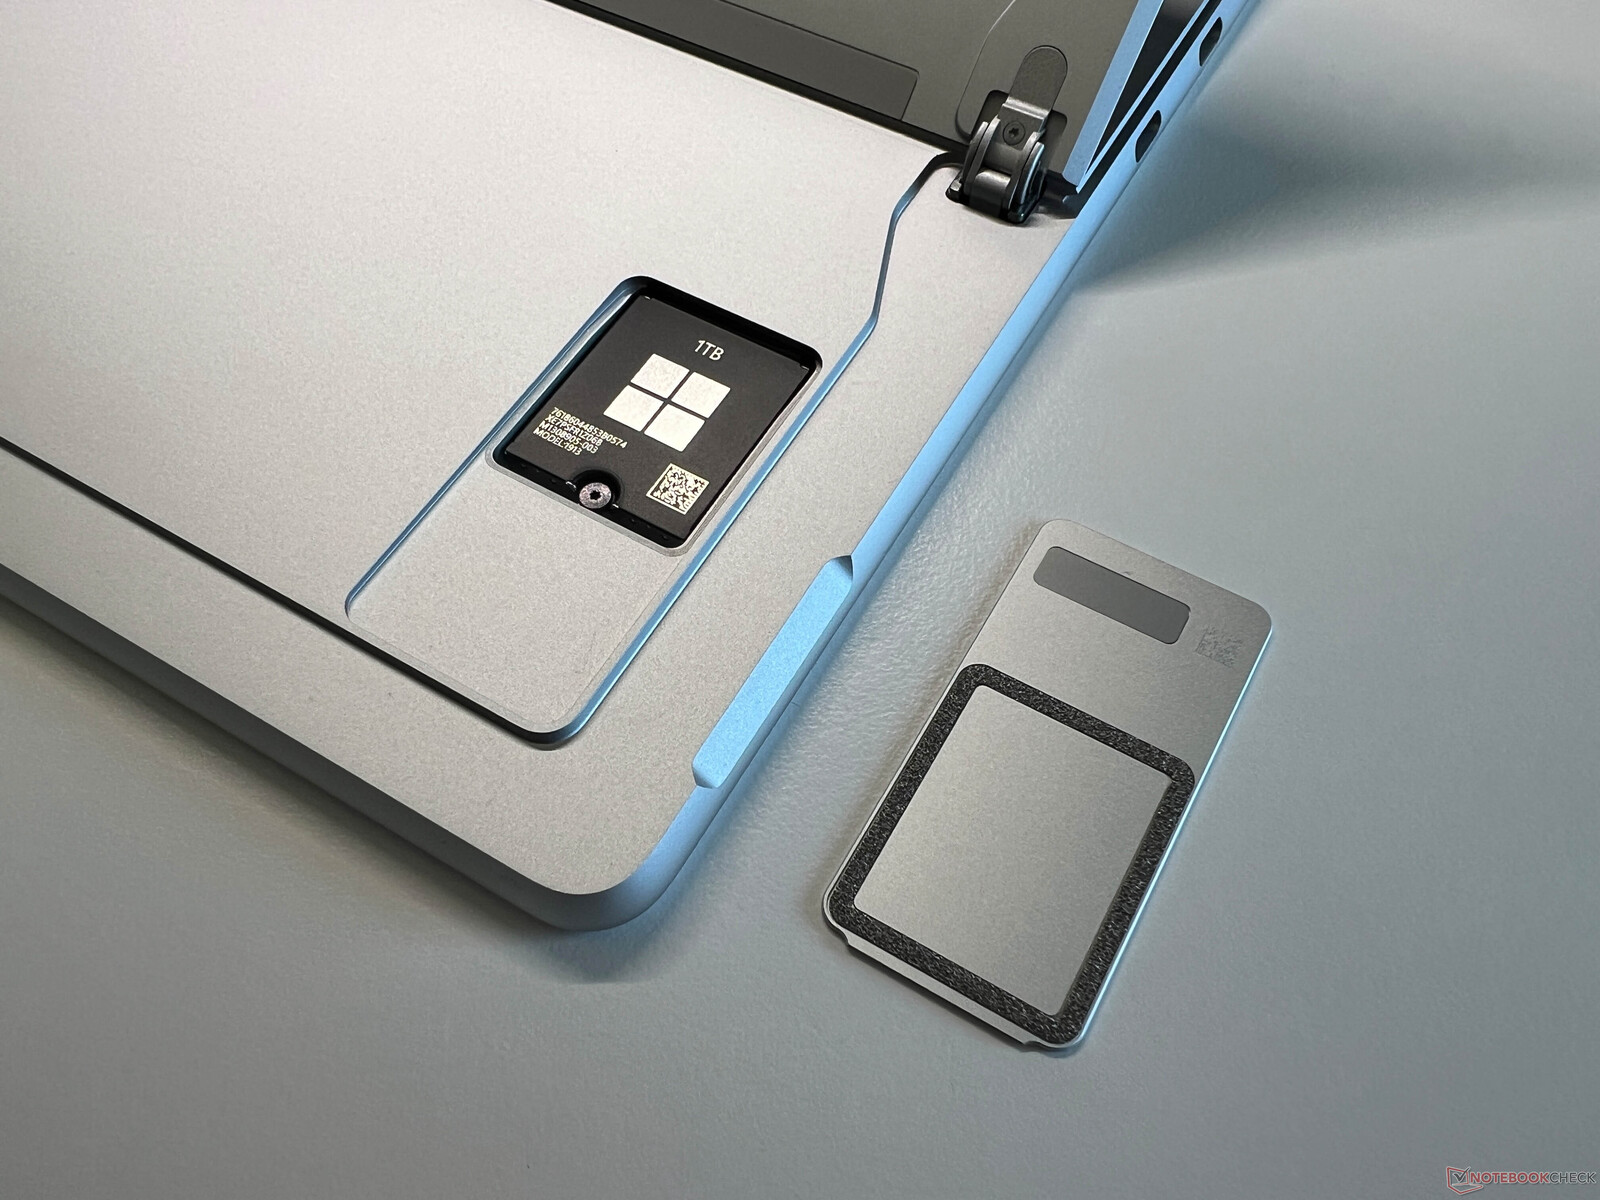
Il Surface Pro è dotato di un SSD da 1 TB di Kioxia (898 GB gratuiti dopo il primo avvio del dispositivo) e le sue velocità di trasferimento sono ottime. Inoltre, le sue prestazioni rimangono completamente stabili anche sotto carico prolungato. L'SSD compatto M.2-2230 può essere sostituito molto facilmente.

* ... Meglio usare valori piccoli
Reading continuous performance: DiskSpd Read Loop, Queue Depth 8
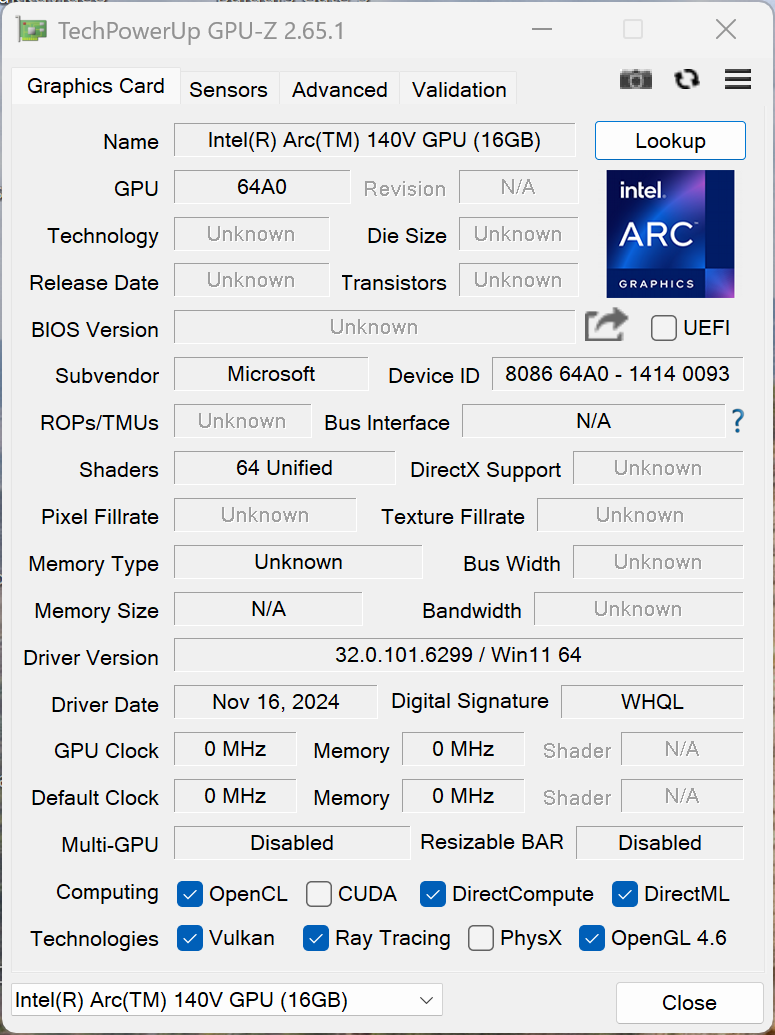
Scheda grafica
In termini di prestazioni grafiche, la Intel Arc Graphics 140V ha fornito un chiaro vantaggio rispetto alla Adreno X1-85 durante il nostro test. Oltre alle prestazioni della GPU pura, lo stesso si può dire per le prestazioni di gioco, dove la compatibilità è ovviamente un vantaggio importante della variante x86. Naturalmente, il gioco non è l'obiettivo principale di un dispositivo come il Surface Pro, ma il modello Intel non è semplicemente così limitato in questo senso, con giochi anche più impegnativi come Cyberpunk che funzionano senza problemi con una risoluzione di 1080p e dettagli medio-bassi. Le prestazioni della GPU sono rimaste completamente stabili sotto carico costante e in modalità batteria.
| 3DMark 11 Performance | 11898 punti | |
| 3DMark Fire Strike Score | 9008 punti | |
| 3DMark Time Spy Score | 4532 punti | |
| 3DMark Steel Nomad Score | 828 punti | |
| 3DMark Steel Nomad Light Score | 3323 punti | |
| 3DMark Steel Nomad Light Unlimited Score | 3318 punti | |
Aiuto | ||
* ... Meglio usare valori piccoli
| Performance rating - Percent | |
| Microsoft Surface Pro OLED Lunar Lake | |
| Media della classe Tablet | |
| Minisforum V3 -1! | |
| Microsoft Surface Pro OLED Copilot+ -2! | |
| Dell Latitude 7350 Detachable | |
| Asus ProArt PZ13 HT5306 -3! | |
| Cyberpunk 2077 - 1920x1080 Ultra Preset (FSR off) | |
| Microsoft Surface Pro OLED Lunar Lake | |
| Media della classe Tablet (21.2 - 28.7, n=2, ultimi 2 anni) | |
| Minisforum V3 | |
| Microsoft Surface Pro OLED Copilot+ | |
| Dell Latitude 7350 Detachable | |
| Asus ProArt PZ13 HT5306 | |
| Baldur's Gate 3 - 1920x1080 Ultra Preset AA:T | |
| Microsoft Surface Pro OLED Lunar Lake | |
| Media della classe Tablet (22.8 - 28.3, n=2, ultimi 2 anni) | |
| Microsoft Surface Pro OLED Copilot+ | |
| Dell Latitude 7350 Detachable | |
| GTA V - 1920x1080 Highest AA:4xMSAA + FX AF:16x | |
| Microsoft Surface Pro OLED Lunar Lake | |
| Minisforum V3 | |
| Media della classe Tablet (21.1 - 27.8, n=2, ultimi 2 anni) | |
| Asus ProArt PZ13 HT5306 | |
| Dell Latitude 7350 Detachable | |
| Final Fantasy XV Benchmark - 1920x1080 High Quality | |
| Microsoft Surface Pro OLED Lunar Lake | |
| Media della classe Tablet (25.4 - 34.4, n=3, ultimi 2 anni) | |
| Minisforum V3 | |
| Microsoft Surface Pro OLED Copilot+ | |
| Dell Latitude 7350 Detachable | |
| Asus ProArt PZ13 HT5306 | |
| Strange Brigade - 1920x1080 ultra AA:ultra AF:16 | |
| Microsoft Surface Pro OLED Lunar Lake | |
| Media della classe Tablet (44.4 - 58, n=2, ultimi 2 anni) | |
| Minisforum V3 | |
| Microsoft Surface Pro OLED Copilot+ | |
| Dell Latitude 7350 Detachable | |
| Dota 2 Reborn - 1920x1080 ultra (3/3) best looking | |
| Microsoft Surface Pro OLED Lunar Lake | |
| Media della classe Tablet (70.9 - 84.5, n=2, ultimi 2 anni) | |
| Minisforum V3 | |
| Microsoft Surface Pro OLED Copilot+ | |
| Dell Latitude 7350 Detachable | |
| Asus ProArt PZ13 HT5306 | |
| X-Plane 11.11 - 1920x1080 high (fps_test=3) | |
| Minisforum V3 | |
| Media della classe Tablet (29.4 - 30.1, n=2, ultimi 2 anni) | |
| Microsoft Surface Pro OLED Lunar Lake | |
| Dell Latitude 7350 Detachable | |
Cyberpunk 2077 ultra FPS diagram
| basso | medio | alto | ultra | |
|---|---|---|---|---|
| GTA V (2015) | 151.1 | 124.7 | 68.9 | 27.8 |
| Dota 2 Reborn (2015) | 103.5 | 82.5 | 56.6 | 84.5 |
| Final Fantasy XV Benchmark (2018) | 86.9 | 47.9 | 34.4 | |
| X-Plane 11.11 (2018) | 41 | 37.6 | 29.4 | |
| Strange Brigade (2018) | 212 | 79.9 | 67 | 58 |
| Baldur's Gate 3 (2023) | 41 | 32.4 | 28.9 | 28.3 |
| Cyberpunk 2077 (2023) | 47.6 | 37.5 | 32.7 | 28.7 |
Emissioni ed energia
Emissioni di rumore
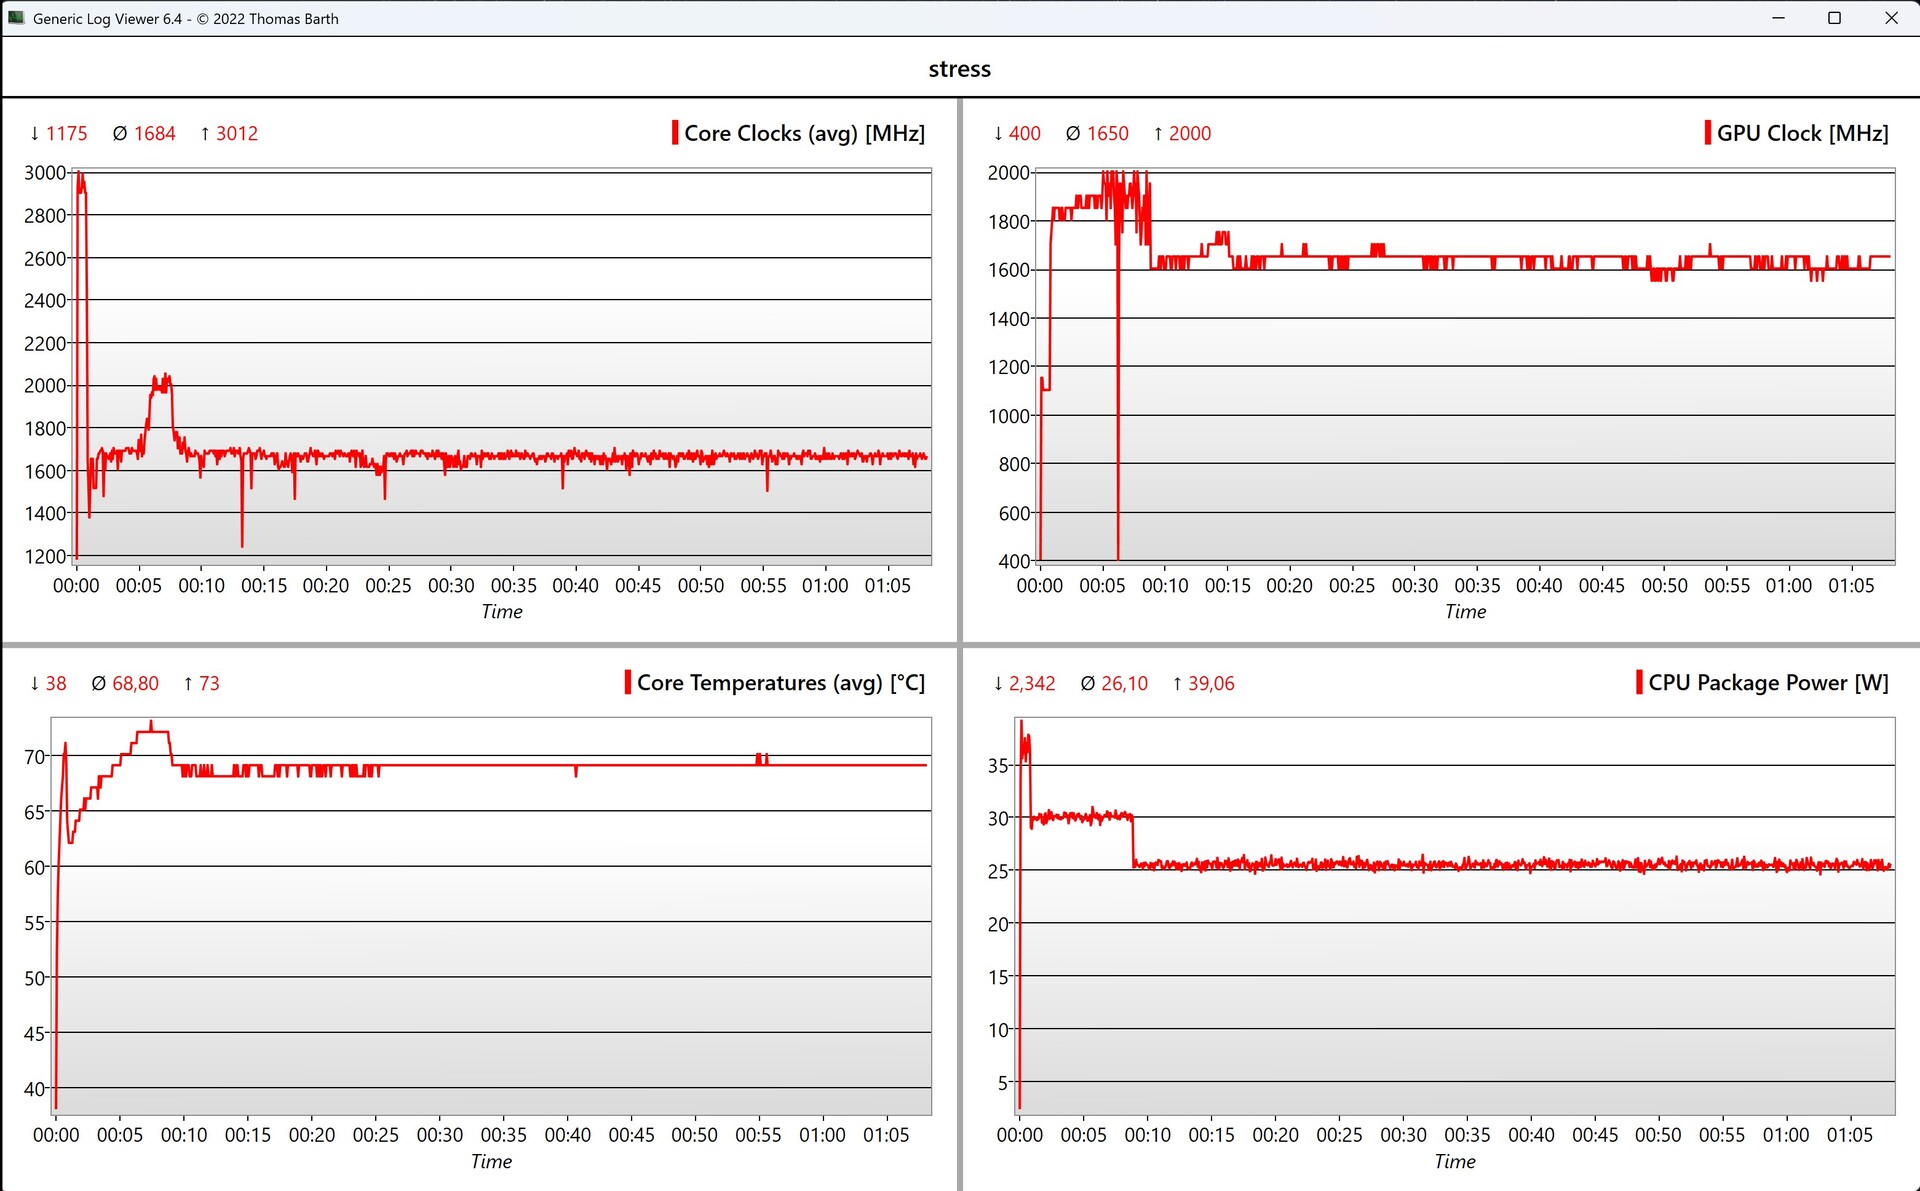
La grande sorpresa del modello Intel è senza dubbio il comportamento della ventola: anche a pieno carico, ci vuole facilmente un minuto intero prima di poterla sentire in modo silenzioso, anche nella modalità con le migliori prestazioni. Dopo di che, la velocità aumenta continuamente: sia durante il gioco che durante lo stress test, abbiamo misurato un forte rumore di 44,9 dB(A), che è lo stesso del modello Snapdragon Modello Snapdragondel modello Snapdragon. Detto questo, ci sono voluti circa 8 minuti prima di raggiungere questo livello. Nel nostro test di carico medio, ossia la prima scena di 3DMark 06, la ventola del modello Intel non si è avviata affatto, ad esempio. Si tratta di una prestazione molto buona e difficilmente si sentirà la ventola durante le attività quotidiane. Non c'erano altri rumori elettronici sul nostro dispositivo di prova.
Rumorosità
| Idle |
| 23.6 / 23.6 / 23.6 dB(A) |
| Sotto carico |
| 23.6 / 44.9 dB(A) |
 | ||
30 dB silenzioso 40 dB(A) udibile 50 dB(A) rumoroso |
||
min: | ||
| Microsoft Surface Pro OLED Lunar Lake Arc 140V, Core Ultra 7 268V, Kioxia BG6 KBG60ZNS1T02 | Microsoft Surface Pro OLED Copilot+ Adreno X1-85 3.8 TFLOPS, SD X Elite X1E-80-100, Samsung PM9B1 1024GB MZVL41T0HBLB | Dell Latitude 7350 Detachable Graphics 4-Core iGPU (Arrow Lake), Ultra 7 164U, Micron 2550 1TB | Asus ProArt PZ13 HT5306 Adreno X1-45 1.7 TFLOPS, SD X Plus X1P-42-100, WD PC SN740 SDDPTQD-1T00 | Minisforum V3 Radeon 780M, R7 8840U, Kingston OM8PGP41024Q-A0 | |
|---|---|---|---|---|---|
| Noise | -8% | -4% | 3% | -18% | |
| off /ambiente * (dB) | 23.6 | 23.6 -0% | 22.9 3% | 23.7 -0% | 25.4 -8% |
| Idle Minimum * (dB) | 23.6 | 23.6 -0% | 22.9 3% | 23.7 -0% | 26.7 -13% |
| Idle Average * (dB) | 23.6 | 23.6 -0% | 22.9 3% | 23.7 -0% | 31.6 -34% |
| Idle Maximum * (dB) | 23.6 | 25.2 -7% | 24.4 -3% | 23.7 -0% | 32.5 -38% |
| Load Average * (dB) | 23.6 | 39 -65% | 29.7 -26% | 26.7 -13% | 32.7 -39% |
| Cyberpunk 2077 ultra * (dB) | 44.9 | 39 13% | 47.2 -5% | 35.1 22% | |
| Load Maximum * (dB) | 44.9 | 44.8 -0% | 47.2 -5% | 40 11% | 34 24% |
| Witcher 3 ultra * (dB) | 33.2 |
* ... Meglio usare valori piccoli
Temperatura
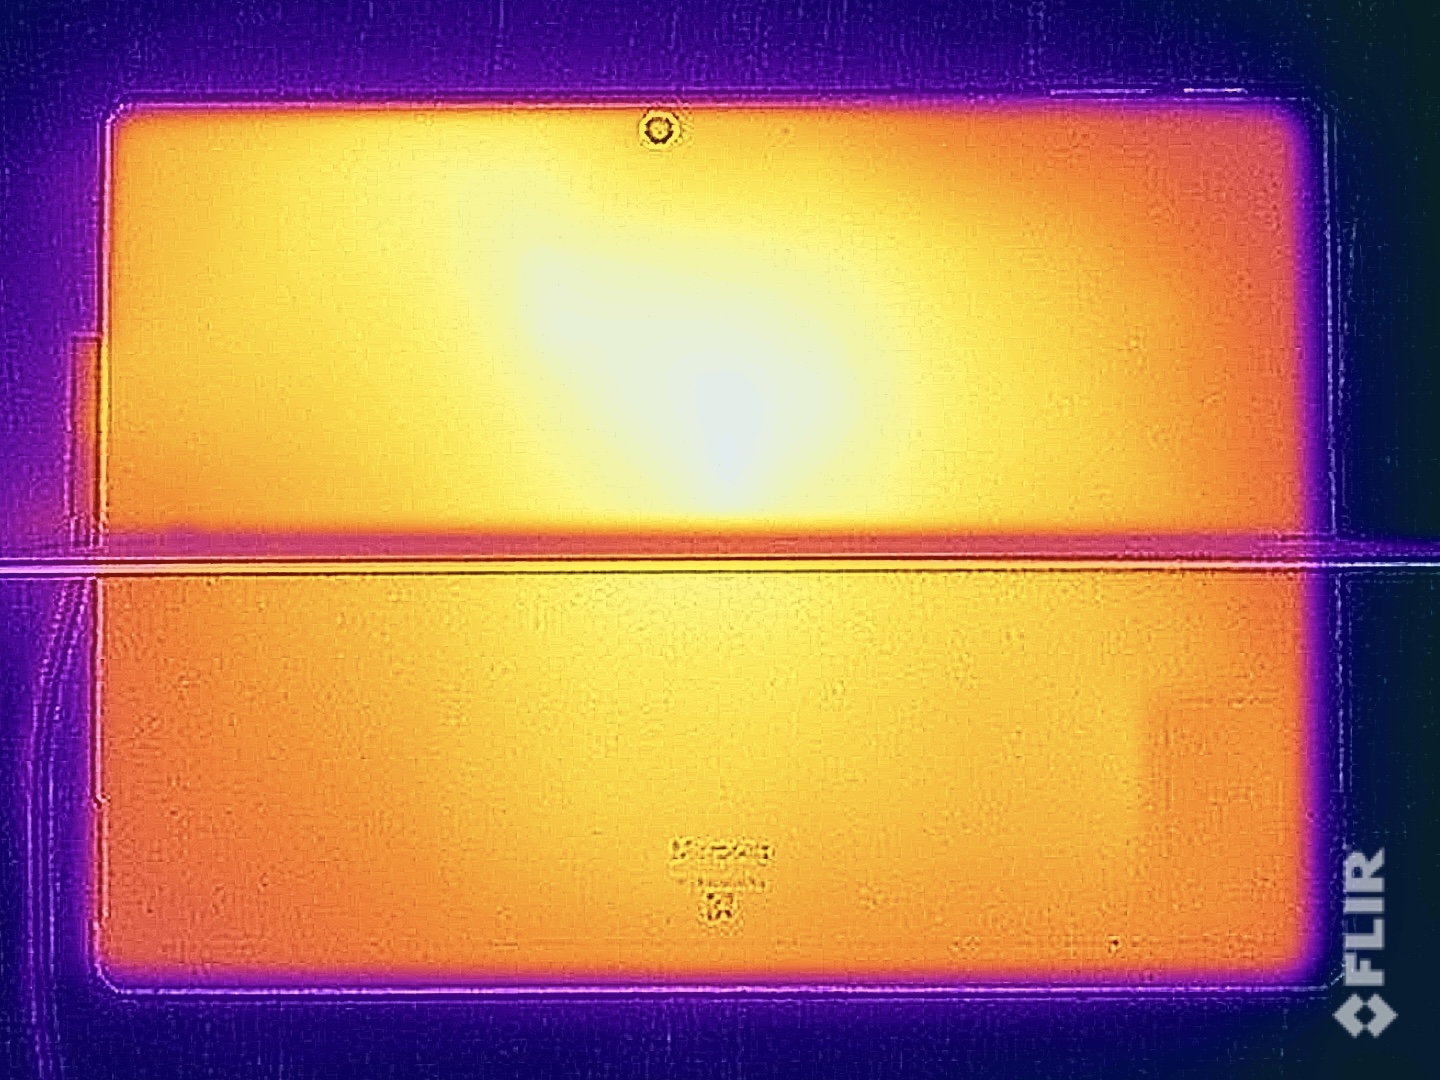
Il case in alluminio del portatile rimane bello fresco durante le attività semplici, ma si riscalda sensibilmente sotto carico elevato e, a questo proposito, i valori tra la variante Intel/ARM sono comparabili. Tuttavia, grazie al suo design, questo non è necessariamente un problema, purché non si tenga il dispositivo tra le mani. Durante lo stress test, il processore ha funzionato a 30 watt per circa 8 minuti e poi si è stabilizzato a 25 watt.
(±) La temperatura massima sul lato superiore è di 43.9 °C / 111 F, rispetto alla media di 33.6 °C / 92 F, che varia da 20.7 a 53.2 °C per questa classe Tablet.
(-) Il lato inferiore si riscalda fino ad un massimo di 45.3 °C / 114 F, rispetto alla media di 33.2 °C / 92 F
(+) In idle, la temperatura media del lato superiore è di 26.5 °C / 80 F, rispetto alla media deld ispositivo di 30 °C / 86 F.
(-) 3: The average temperature for the upper side is 43.2 °C / 110 F, compared to the average of 30 °C / 86 F for the class Tablet.

| Microsoft Surface Pro OLED Lunar Lake Intel Core Ultra 7 268V, Intel Arc Graphics 140V | Microsoft Surface Pro OLED Copilot+ Qualcomm Snapdragon X Elite X1E-80-100, Qualcomm SD X Adreno X1-85 3.8 TFLOPS | Dell Latitude 7350 Detachable Intel Core Ultra 7 164U, Intel Graphics 4-Core iGPU (Meteor / Arrow Lake) | Asus ProArt PZ13 HT5306 Qualcomm Snapdragon X Plus X1P-42-100, Qualcomm SD X Adreno X1-45 1.7 TFLOPS | Minisforum V3 AMD Ryzen 7 8840U, AMD Radeon 780M | |
|---|---|---|---|---|---|
| Heat | 1% | 4% | -3% | -24% | |
| Maximum Upper Side * (°C) | 43.9 | 43.1 2% | 38.4 13% | 43.7 -0% | 50.5 -15% |
| Maximum Bottom * (°C) | 45.3 | 46.3 -2% | 40.6 10% | 43.9 3% | 54.8 -21% |
| Idle Upper Side * (°C) | 29.5 | 27.5 7% | 28.2 4% | 31.9 -8% | 34.9 -18% |
| Idle Bottom * (°C) | 25.7 | 26.8 -4% | 28.6 -11% | 27.6 -7% | 36.3 -41% |
* ... Meglio usare valori piccoli
Altoparlanti
Nella nostra analisi, gli altoparlanti della versione Intel si sono comportati leggermente meglio rispetto al modello ARM e, nel complesso, offrono un'ottima qualità del suono.
Microsoft Surface Pro OLED Lunar Lake analisi audio
(+) | gli altoparlanti sono relativamente potenti (83.1 dB)
Bassi 100 - 315 Hz
(±) | bassi ridotti - in media 11.3% inferiori alla media
(±) | la linearità dei bassi è media (8.7% delta rispetto alla precedente frequenza)
Medi 400 - 2000 Hz
(+) | medi bilanciati - solo only 3.6% rispetto alla media
(+) | medi lineari (3.4% delta rispetto alla precedente frequenza)
Alti 2 - 16 kHz
(+) | Alti bilanciati - appena 2.2% dalla media
(+) | alti lineari (3.2% delta rispetto alla precedente frequenza)
Nel complesso 100 - 16.000 Hz
(+) | suono nel complesso lineare (11.1% differenza dalla media)
Rispetto alla stessa classe
» 11% di tutti i dispositivi testati in questa classe è stato migliore, 4% simile, 86% peggiore
» Il migliore ha avuto un delta di 7%, medio di 20%, peggiore di 129%
Rispetto a tutti i dispositivi testati
» 7% di tutti i dispositivi testati in questa classe è stato migliore, 2% similare, 92% peggiore
» Il migliore ha avuto un delta di 4%, medio di 24%, peggiore di 134%
Microsoft Surface Pro OLED Copilot+ analisi audio
(+) | gli altoparlanti sono relativamente potenti (82.4 dB)
Bassi 100 - 315 Hz
(±) | bassi ridotti - in media 8.9% inferiori alla media
(±) | la linearità dei bassi è media (9.3% delta rispetto alla precedente frequenza)
Medi 400 - 2000 Hz
(±) | medi elevati - circa 6.4% superiore alla media
(+) | medi lineari (3.3% delta rispetto alla precedente frequenza)
Alti 2 - 16 kHz
(+) | Alti bilanciati - appena 3.9% dalla media
(+) | alti lineari (3.2% delta rispetto alla precedente frequenza)
Nel complesso 100 - 16.000 Hz
(+) | suono nel complesso lineare (13.5% differenza dalla media)
Rispetto alla stessa classe
» 25% di tutti i dispositivi testati in questa classe è stato migliore, 4% simile, 71% peggiore
» Il migliore ha avuto un delta di 7%, medio di 20%, peggiore di 129%
Rispetto a tutti i dispositivi testati
» 14% di tutti i dispositivi testati in questa classe è stato migliore, 4% similare, 82% peggiore
» Il migliore ha avuto un delta di 4%, medio di 24%, peggiore di 134%
Dell Latitude 7350 Detachable analisi audio
(+) | gli altoparlanti sono relativamente potenti (84.5 dB)
Bassi 100 - 315 Hz
(-) | quasi nessun basso - in media 19.7% inferiori alla media
(±) | la linearità dei bassi è media (11.8% delta rispetto alla precedente frequenza)
Medi 400 - 2000 Hz
(+) | medi bilanciati - solo only 3.9% rispetto alla media
(+) | medi lineari (5.2% delta rispetto alla precedente frequenza)
Alti 2 - 16 kHz
(+) | Alti bilanciati - appena 4.8% dalla media
(+) | alti lineari (3% delta rispetto alla precedente frequenza)
Nel complesso 100 - 16.000 Hz
(±) | la linearità complessiva del suono è media (16.2% di differenza rispetto alla media
Rispetto alla stessa classe
» 29% di tutti i dispositivi testati in questa classe è stato migliore, 3% simile, 68% peggiore
» Il migliore ha avuto un delta di 6%, medio di 20%, peggiore di 57%
Rispetto a tutti i dispositivi testati
» 26% di tutti i dispositivi testati in questa classe è stato migliore, 6% similare, 68% peggiore
» Il migliore ha avuto un delta di 4%, medio di 24%, peggiore di 134%
Asus ProArt PZ13 HT5306 analisi audio
(±) | potenza degli altiparlanti media ma buona (79.7 dB)
Bassi 100 - 315 Hz
(±) | bassi ridotti - in media 13% inferiori alla media
(±) | la linearità dei bassi è media (11% delta rispetto alla precedente frequenza)
Medi 400 - 2000 Hz
(+) | medi bilanciati - solo only 4.1% rispetto alla media
(+) | medi lineari (5.3% delta rispetto alla precedente frequenza)
Alti 2 - 16 kHz
(+) | Alti bilanciati - appena 3.1% dalla media
(+) | alti lineari (5.1% delta rispetto alla precedente frequenza)
Nel complesso 100 - 16.000 Hz
(±) | la linearità complessiva del suono è media (15.6% di differenza rispetto alla media
Rispetto alla stessa classe
» 26% di tutti i dispositivi testati in questa classe è stato migliore, 4% simile, 70% peggiore
» Il migliore ha avuto un delta di 6%, medio di 20%, peggiore di 57%
Rispetto a tutti i dispositivi testati
» 23% di tutti i dispositivi testati in questa classe è stato migliore, 5% similare, 72% peggiore
» Il migliore ha avuto un delta di 4%, medio di 24%, peggiore di 134%
Minisforum V3 analisi audio
(±) | potenza degli altiparlanti media ma buona (74.8 dB)
Bassi 100 - 315 Hz
(±) | bassi ridotti - in media 13.5% inferiori alla media
(±) | la linearità dei bassi è media (10.2% delta rispetto alla precedente frequenza)
Medi 400 - 2000 Hz
(+) | medi bilanciati - solo only 3.2% rispetto alla media
(±) | linearità dei medi adeguata (8.2% delta rispetto alla precedente frequenza)
Alti 2 - 16 kHz
(+) | Alti bilanciati - appena 4.6% dalla media
(±) | la linearità degli alti è media (7.8% delta rispetto alla precedente frequenza)
Nel complesso 100 - 16.000 Hz
(±) | la linearità complessiva del suono è media (21.3% di differenza rispetto alla media
Rispetto alla stessa classe
» 56% di tutti i dispositivi testati in questa classe è stato migliore, 12% simile, 32% peggiore
» Il migliore ha avuto un delta di 6%, medio di 20%, peggiore di 57%
Rispetto a tutti i dispositivi testati
» 59% di tutti i dispositivi testati in questa classe è stato migliore, 7% similare, 33% peggiore
» Il migliore ha avuto un delta di 4%, medio di 24%, peggiore di 134%
Consumo di energia
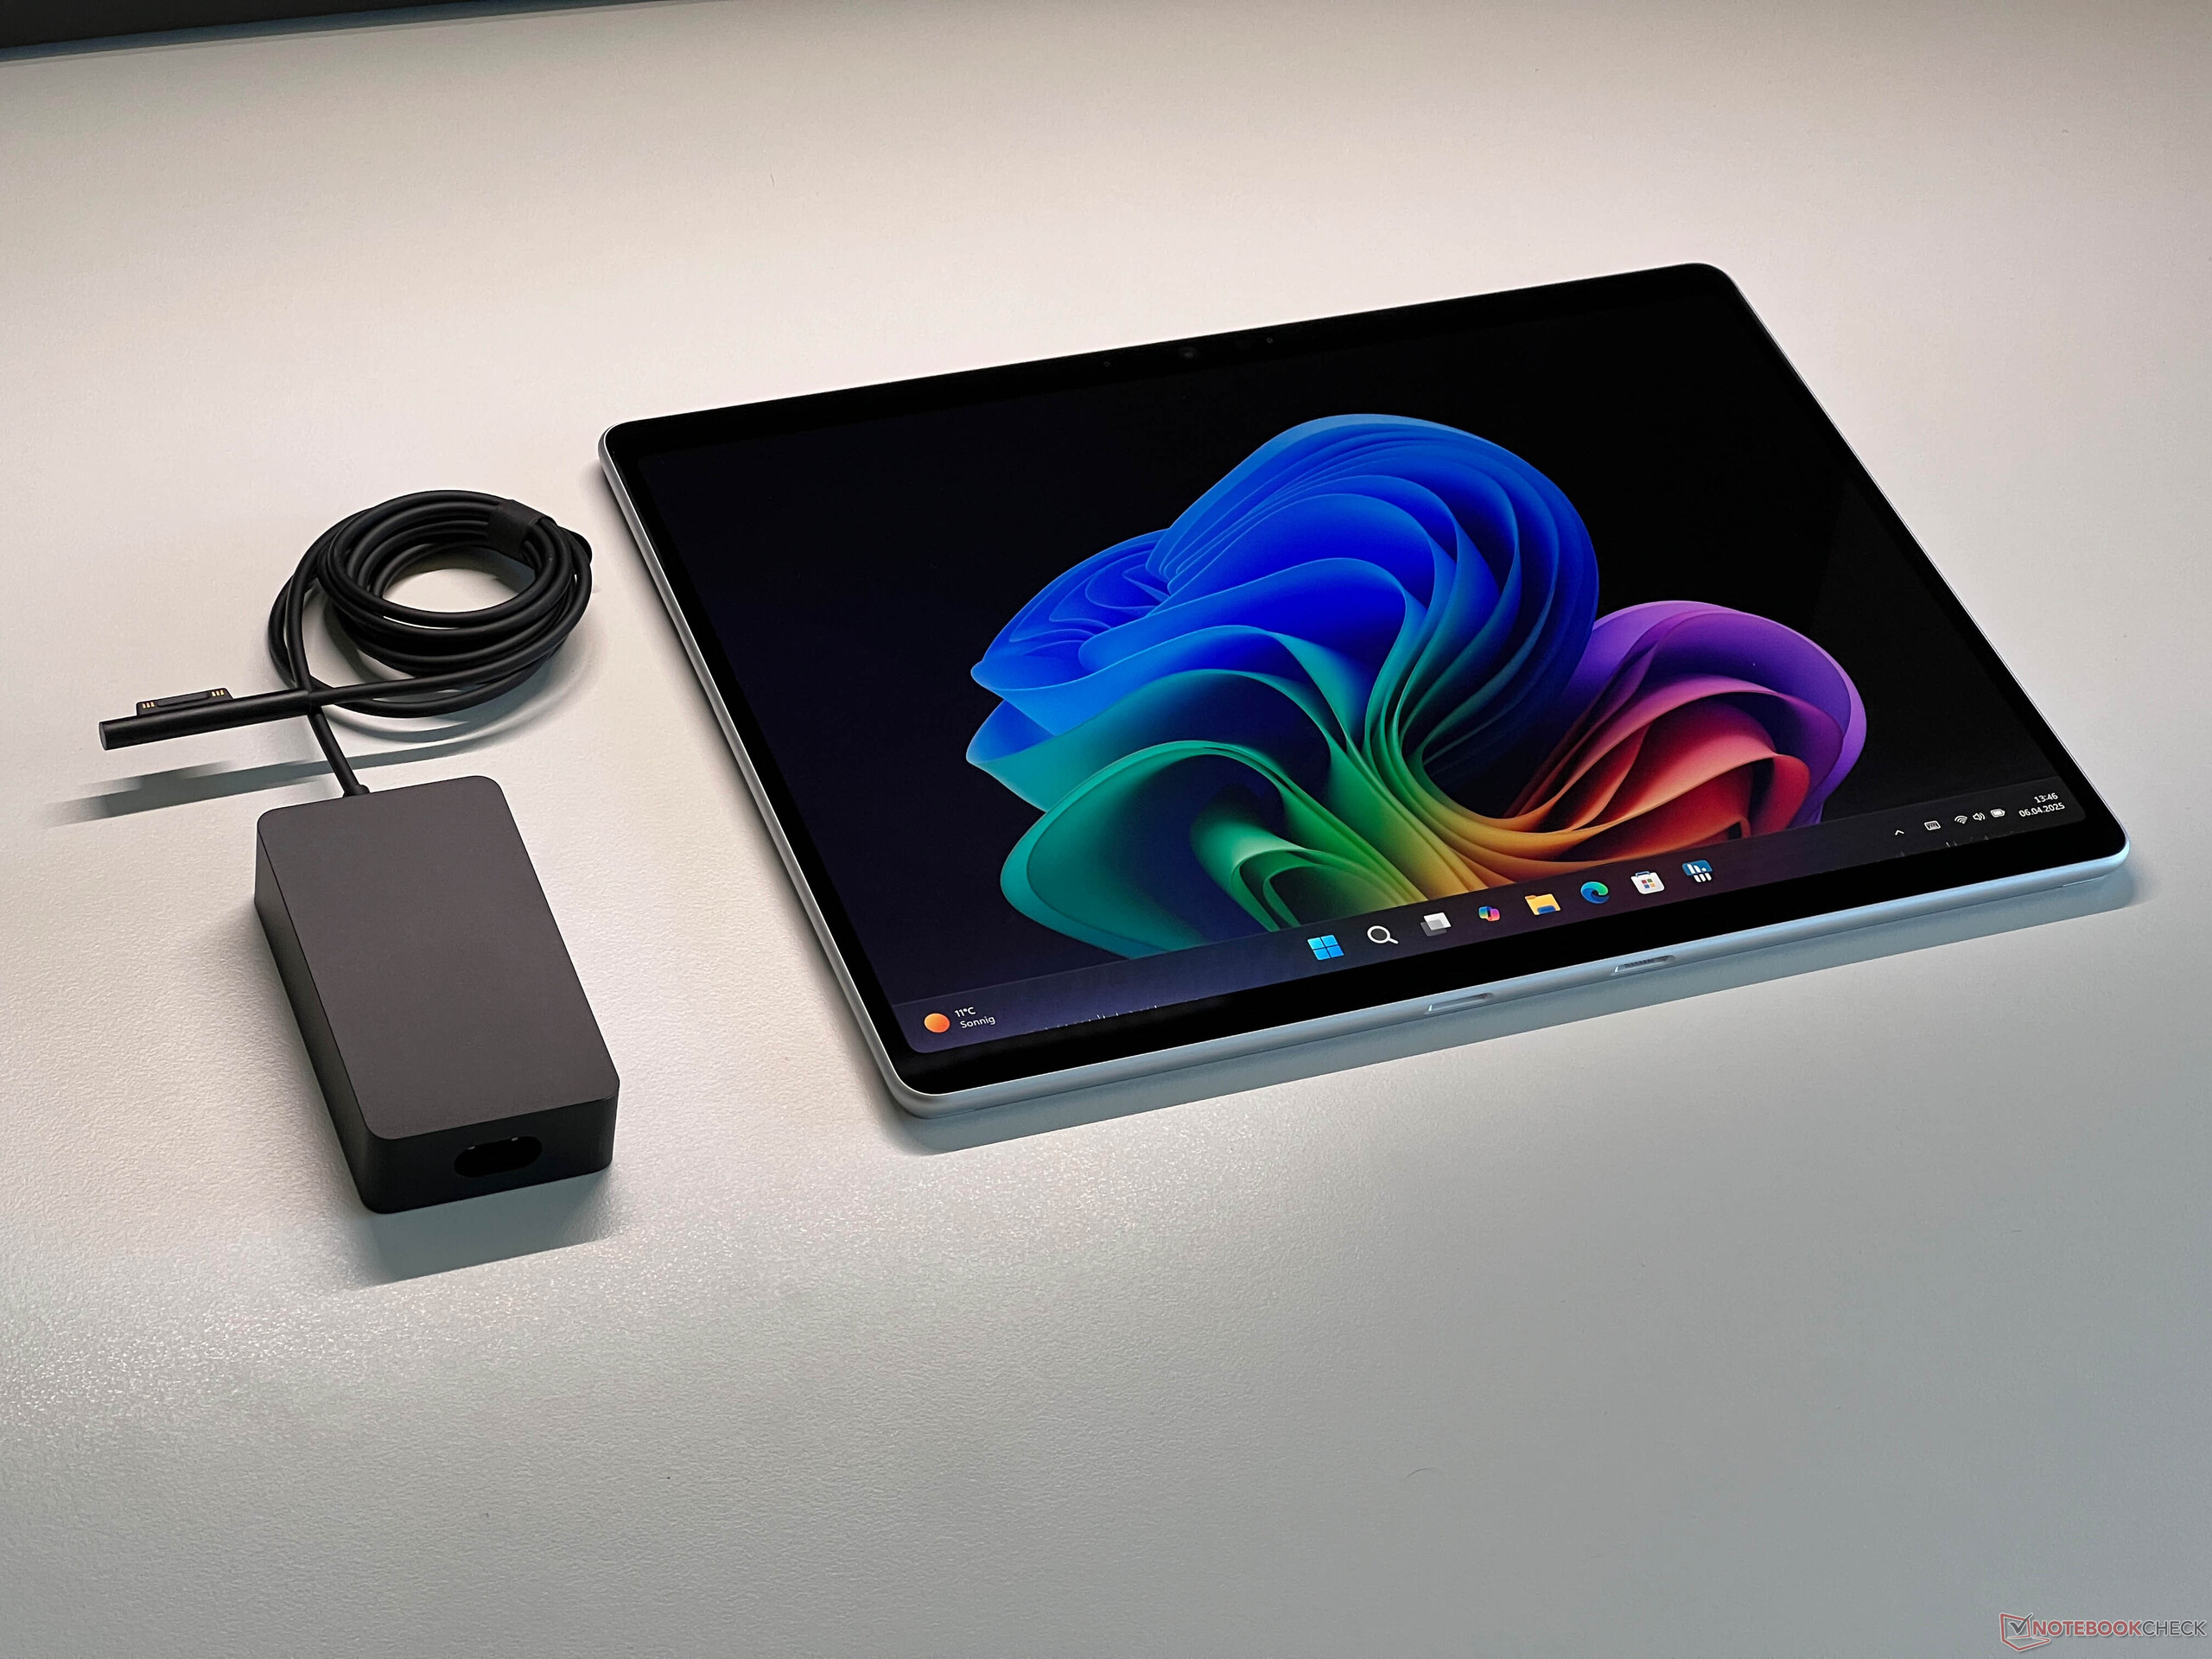
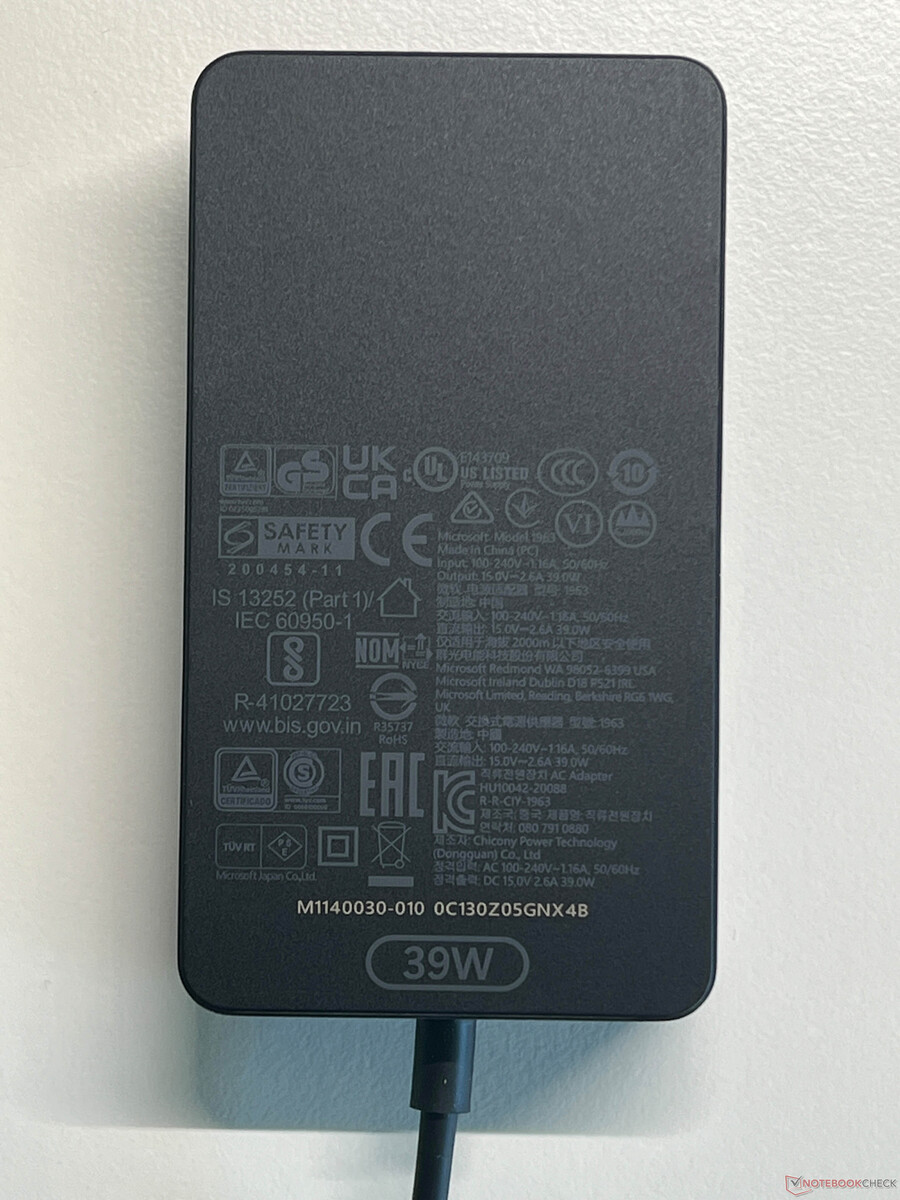
In modalità idle, il modello Intel richiede un po' più di energia rispetto alla variante ARM, ma i valori sono praticamente identici sotto carico. Come abbiamo già visto, la versione Snapdragon ha un chiaro vantaggio quando si tratta di efficienza della CPU, ma non per quanto riguarda l'efficienza della GPU, a causa delle sue prestazioni inferiori. Quando il processore utilizza il suo TDP massimo di 37 watt, l'alimentatore da 39 watt è il fattore limitante e la batteria deve essere sfruttata per un breve periodo, il che ovviamente non è ideale.
| Off / Standby | |
| Idle | |
| Sotto carico |
|
Leggenda:
min: | |
| Microsoft Surface Pro OLED Lunar Lake Core Ultra 7 268V, Arc 140V, Kioxia BG6 KBG60ZNS1T02, OLED, 2880x1920, 13" | Microsoft Surface Pro OLED Copilot+ SD X Elite X1E-80-100, Adreno X1-85 3.8 TFLOPS, Samsung PM9B1 1024GB MZVL41T0HBLB, OLED, 2880x1920, 13" | Dell Latitude 7350 Detachable Ultra 7 164U, Graphics 4-Core iGPU (Arrow Lake), Micron 2550 1TB, IPS, 2880x1920, 13" | Asus ProArt PZ13 HT5306 SD X Plus X1P-42-100, Adreno X1-45 1.7 TFLOPS, WD PC SN740 SDDPTQD-1T00, OLED, 2880x1800, 13.3" | Minisforum V3 R7 8840U, Radeon 780M, Kingston OM8PGP41024Q-A0, IPS, 2560x1600, 14" | |
|---|---|---|---|---|---|
| Power Consumption | 17% | 2% | 20% | -122% | |
| Idle Minimum * (Watt) | 4.5 | 2.8 38% | 3.6 20% | 3.5 22% | 10.1 -124% |
| Idle Average * (Watt) | 6 | 3.9 35% | 6.1 -2% | 5.3 12% | 16.9 -182% |
| Idle Maximum * (Watt) | 6.7 | 4.9 27% | 6.7 -0% | 6.1 9% | 20.6 -207% |
| Load Average * (Watt) | 34.9 | 34.3 2% | 33.7 3% | 14.9 57% | 51.7 -48% |
| Cyberpunk 2077 ultra * (Watt) | 39.4 | 35.8 9% | 37 6% | 23.1 41% | |
| Cyberpunk 2077 ultra external monitor * (Watt) | 39 | 36 8% | 31.8 18% | 23.5 40% | |
| Load Maximum * (Watt) | 41.6 | 41.2 1% | 55.1 -32% | 59.9 -44% | 61.2 -47% |
| Witcher 3 ultra * (Watt) | 55.4 |
* ... Meglio usare valori piccoli
Power consumption Cyberpunk / stress test
Power consumption with external monitor
Tempi di esecuzione
In termini di durata della batteria, il modello Intel è stato battuto di poco dalla versione ARM durante il nostro test. Nel nostro test Wi-Fi a 150 cd/m², i due erano quasi alla pari al minuto, ma la variante Snapdragon era in vantaggio alla massima luminosità (+30 minuti) e nel test video (+1,5 ore).
| Microsoft Surface Pro OLED Lunar Lake Core Ultra 7 268V, Arc 140V, 53 Wh | Microsoft Surface Pro OLED Copilot+ SD X Elite X1E-80-100, Adreno X1-85 3.8 TFLOPS, 53 Wh | Dell Latitude 7350 Detachable Ultra 7 164U, Graphics 4-Core iGPU (Arrow Lake), 46.5 Wh | Asus ProArt PZ13 HT5306 SD X Plus X1P-42-100, Adreno X1-45 1.7 TFLOPS, 70 Wh | Minisforum V3 R7 8840U, Radeon 780M, 50.82 Wh | Media della classe Tablet | |
|---|---|---|---|---|---|---|
| Autonomia della batteria | 5% | -7% | 27% | -47% | 29% | |
| H.264 (h) | 14.6 | 15.9 9% | 18.4 26% | 16.9 ? 16% | ||
| WiFi v1.3 (h) | 11.1 | 11.1 0% | 10.3 -7% | 14.2 28% | 5.9 -47% | 15.8 ? 42% |
Valutazione totale di Notebookcheck
Microsoft Surface Pro OLED Lunar Lake
- 04/14/2025 v8
Andreas Osthoff
 Total Sustainability Score:
 Possible alternatives compared
Immagine | Modello | Prezzo | Peso | Altezza | Schermo |
|---|---|---|---|---|---|
1. 84.2% 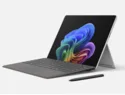 | Microsoft Surface Pro OLED Lunar Lake Intel Core Ultra 7 268V ⎘ Intel Arc Graphics 140V ⎘ 32 GB Memoria, 512 GB SSD | Amazon: 1. $1,099.99 Microsoft Surface Pro Copilo... 2. $869.99 Microsoft Surface Pro 2-in-1... 3. $1,299.00 Microsoft Surface Pro 2-in-1... Prezzo di listino: 2640€ | 882 gr | 9.3 mm | 13.00" 2880x1920 266 PPI OLED |
2. 82.5%  | Microsoft Surface Pro OLED Copilot+ Qualcomm Snapdragon X Elite X1E-80-100 ⎘ Qualcomm SD X Adreno X1-85 3.8 TFLOPS ⎘ 16 GB Memoria, 1024 GB SSD | Amazon: Prezzo di listino: 1999€ | 870 gr | 9.3 mm | 13.00" 2880x1920 266 PPI OLED |
3. 83.3%  | Dell Latitude 7350 Detachable Intel Core Ultra 7 164U ⎘ Intel Graphics 4-Core iGPU (Meteor / Arrow Lake) ⎘ 32 GB Memoria, 1024 GB SSD | Amazon: Prezzo di listino: 2390 USD | 865 gr | 8.9 mm | 13.00" 2880x1920 266 PPI IPS |
4. 85.3%  | Asus ProArt PZ13 HT5306 Qualcomm Snapdragon X Plus X1P-42-100 ⎘ Qualcomm SD X Adreno X1-45 1.7 TFLOPS ⎘ 16 GB Memoria, 1024 GB SSD | Amazon: 1. $1,149.99 ASUS ProArt PZ13 AI Powered ... 2. $2,079.99 ASUS 2025 ProArt PX13 (Repla... 3. $929.99 ASUS ProArt PZ13 2-in-1 AI C... Prezzo di listino: 1599€ | 874 gr | 9 mm | 13.30" 2880x1800 255 PPI OLED |
5. 85.7% v7 (old)  | Minisforum V3 AMD Ryzen 7 8840U ⎘ AMD Radeon 780M ⎘ 32 GB Memoria, 1024 GB SSD | Amazon: 1. $1,439.00 MINISFORUM G1 Pro Gaming Min... 2. $569.00 MINISFORUM MS-02 Ultra Works... 3. $369.99 HIGOLEPC Mini PC Win 11 Pro ... Prezzo di listino: 1699 EUR | 928 gr | 9.8 mm | 14.00" 2560x1600 IPS |
Transparency
La selezione dei dispositivi da recensire viene effettuata dalla nostra redazione. Il campione di prova è stato fornito all'autore come prestito dal produttore o dal rivenditore ai fini di questa recensione. L'istituto di credito non ha avuto alcuna influenza su questa recensione, né il produttore ne ha ricevuto una copia prima della pubblicazione. Non vi era alcun obbligo di pubblicare questa recensione. In quanto società mediatica indipendente, Notebookcheck non è soggetta all'autorità di produttori, rivenditori o editori.
Ecco come Notebookcheck esegue i test
Ogni anno, Notebookcheck esamina in modo indipendente centinaia di laptop e smartphone utilizzando procedure standardizzate per garantire che tutti i risultati siano comparabili. Da circa 20 anni sviluppiamo continuamente i nostri metodi di prova e nel frattempo stabiliamo gli standard di settore. Nei nostri laboratori di prova, tecnici ed editori esperti utilizzano apparecchiature di misurazione di alta qualità. Questi test comportano un processo di validazione in più fasi. Il nostro complesso sistema di valutazione si basa su centinaia di misurazioni e parametri di riferimento ben fondati, che mantengono l'obiettività.
