Recensione della workstation di fascia alta Dell Precision 7875: AMD Ryzen Threadripper PRO 7995WX con 96 core e Nvidia RTX 6000
")
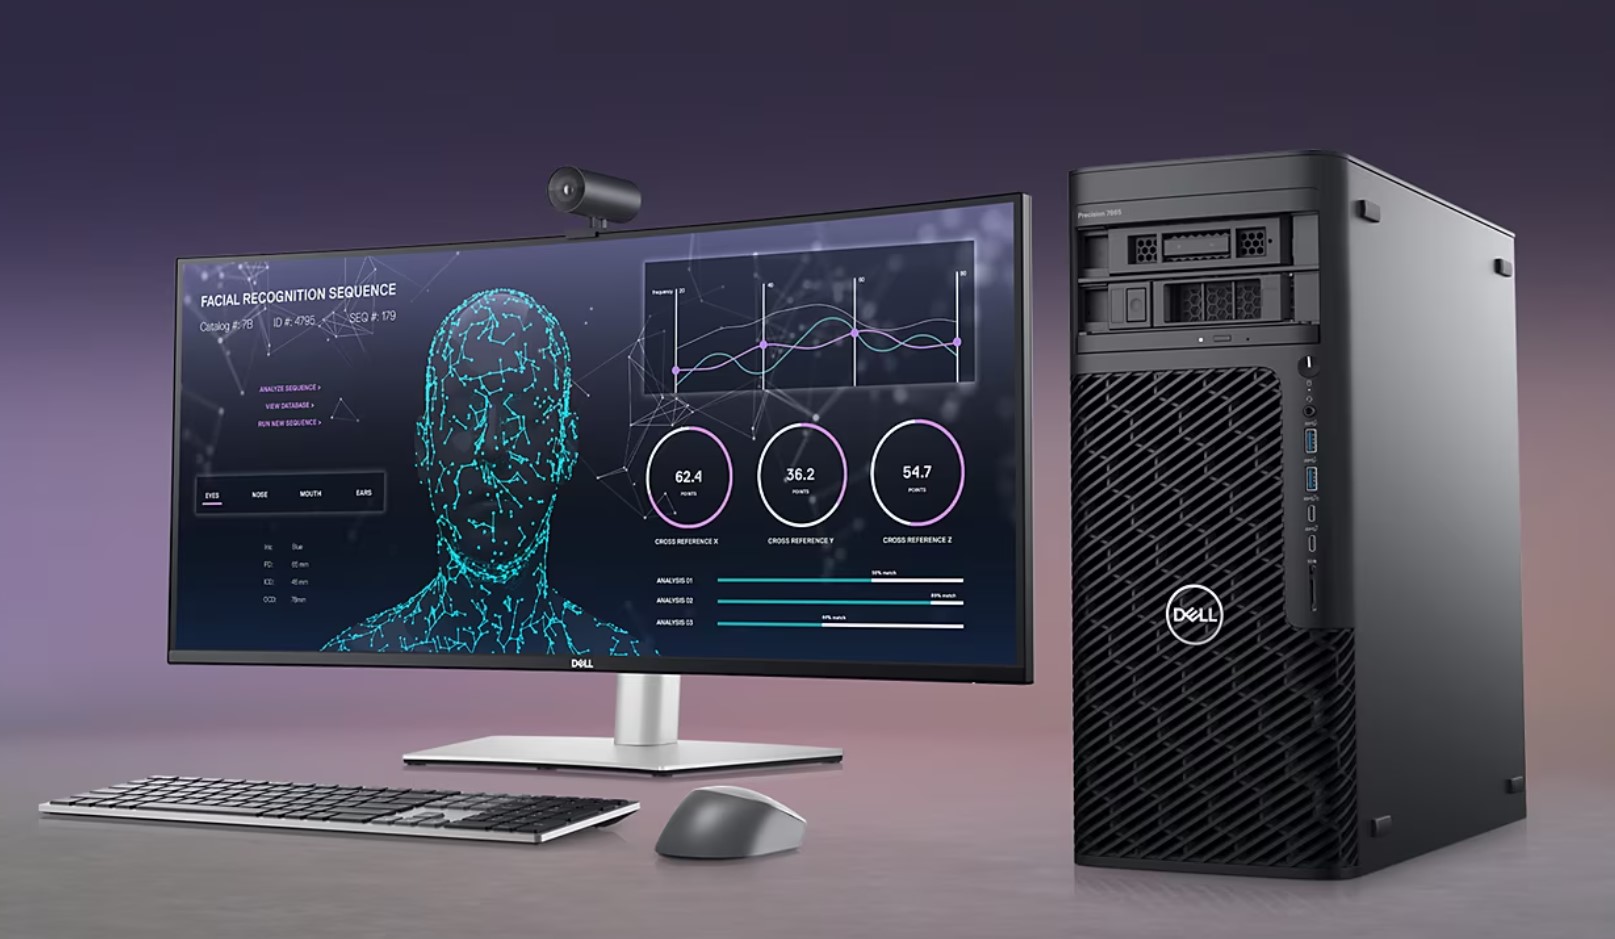
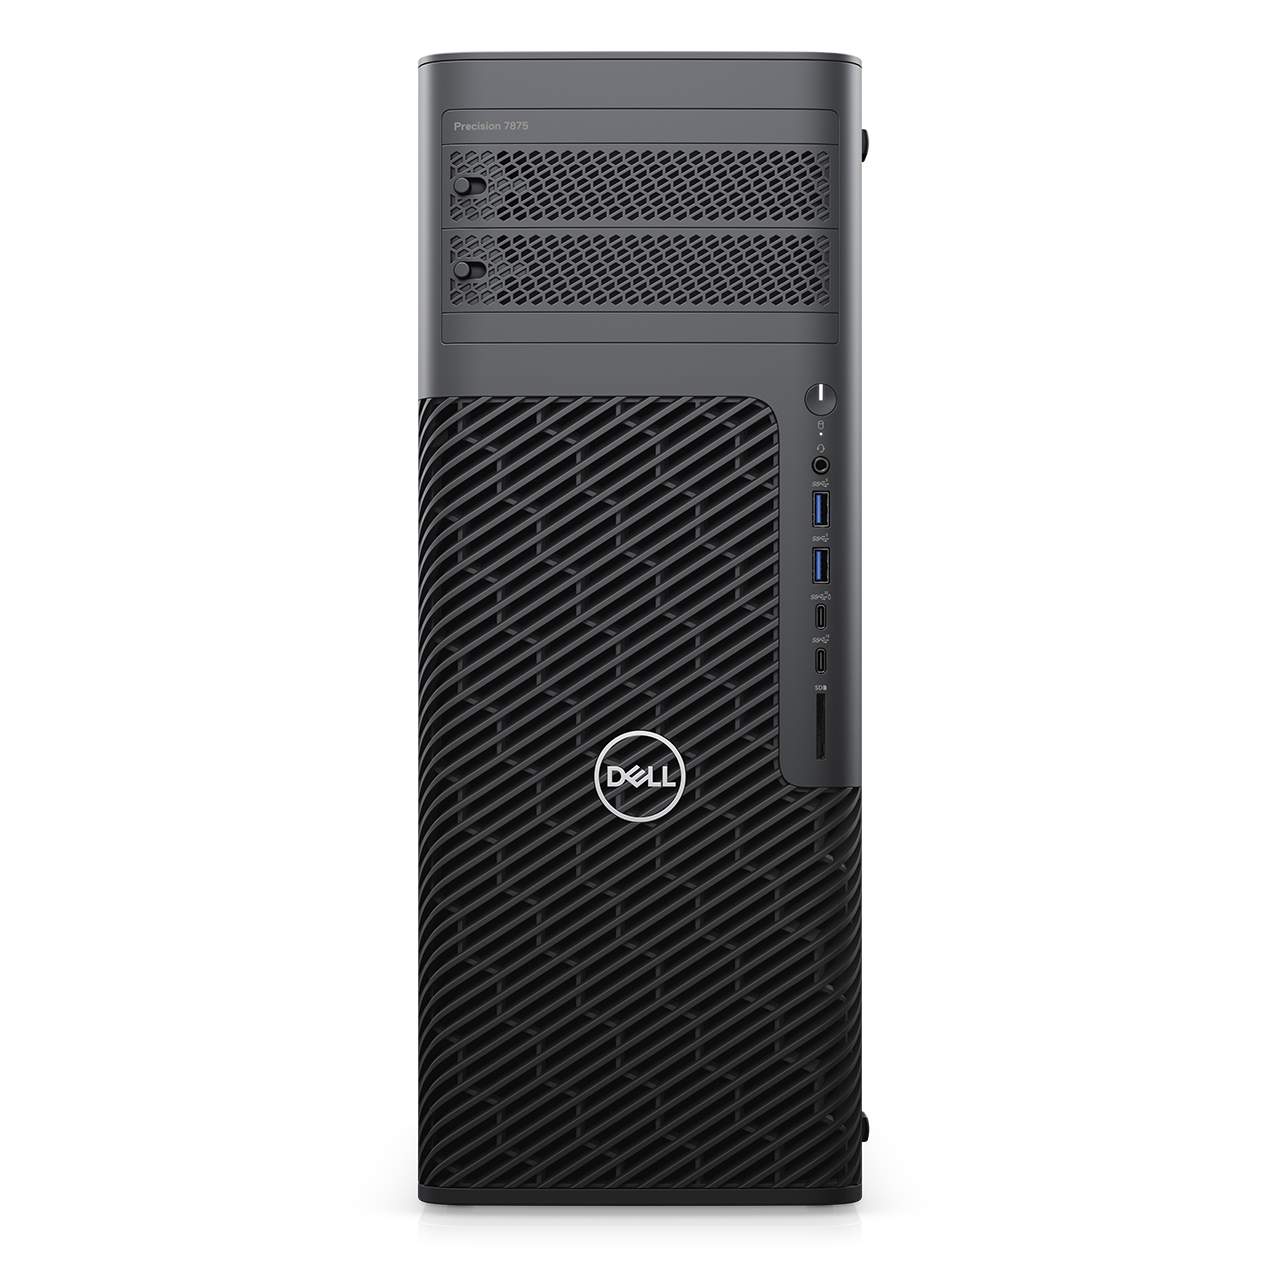
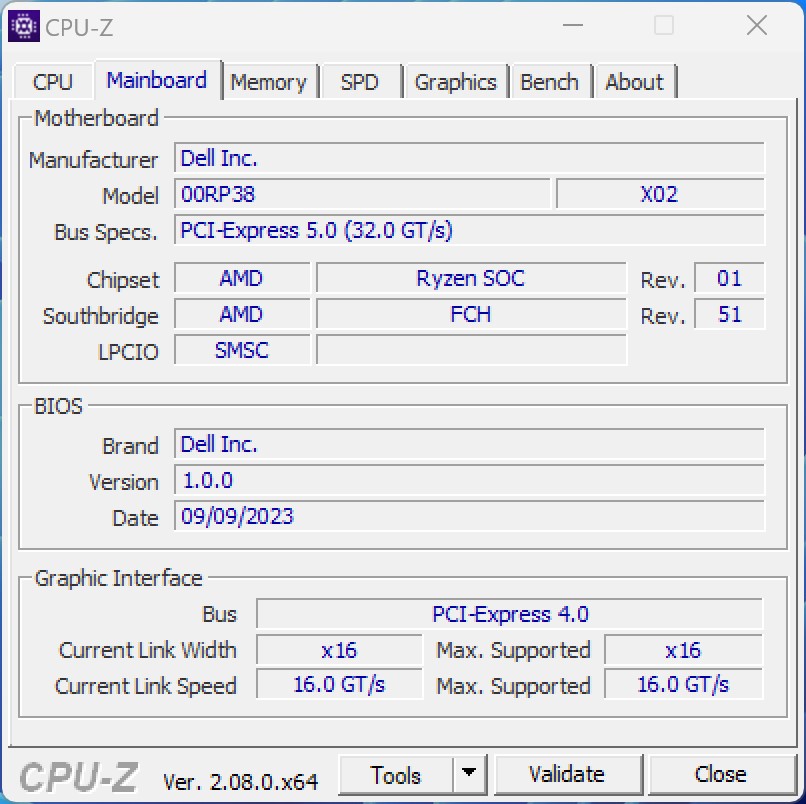
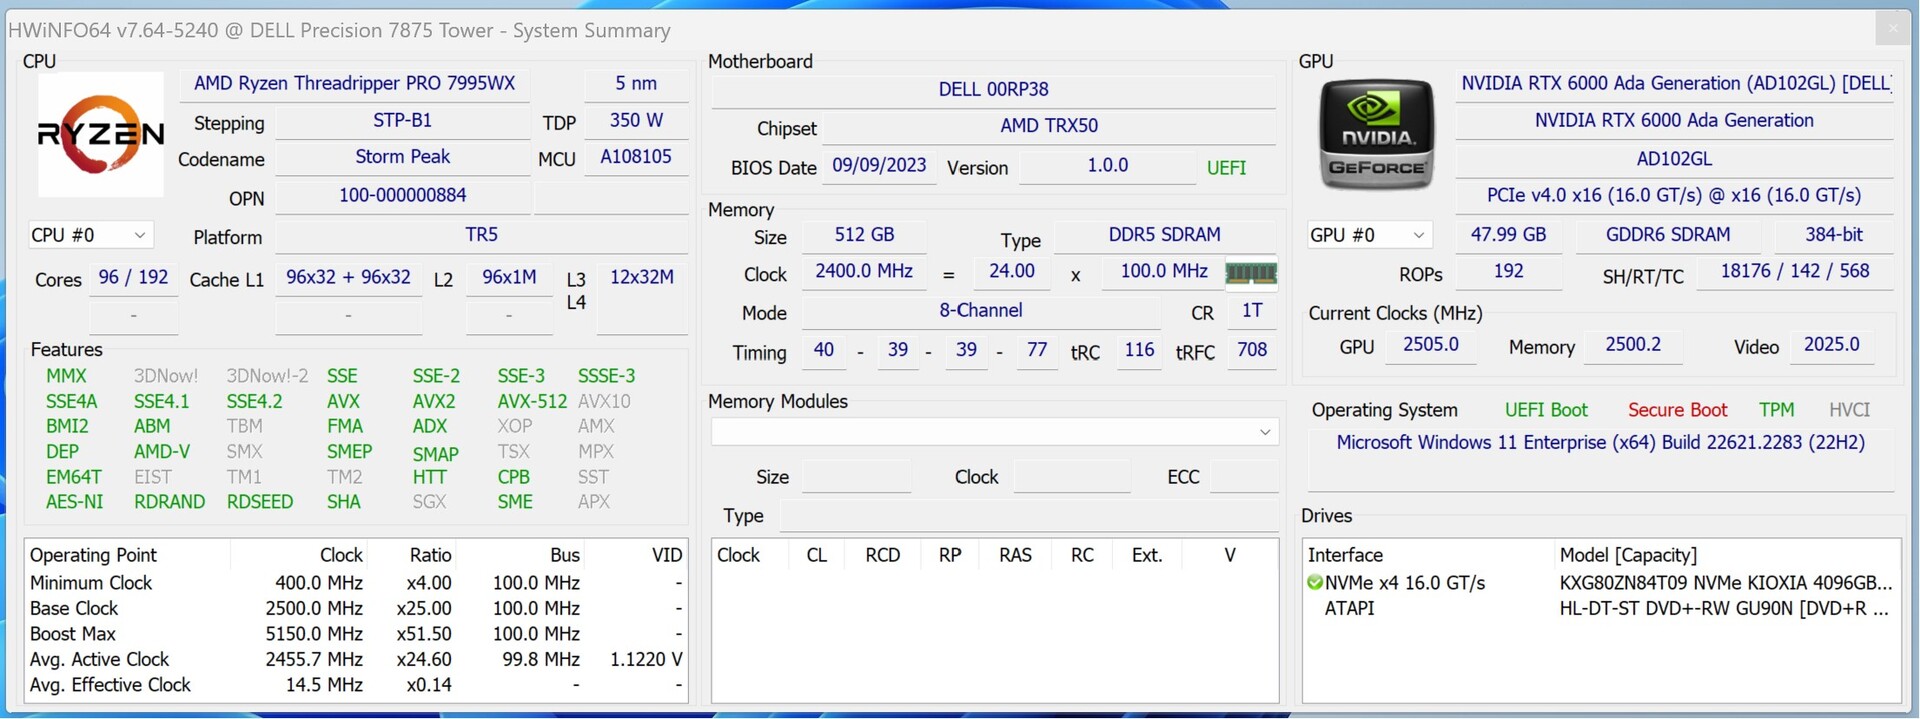
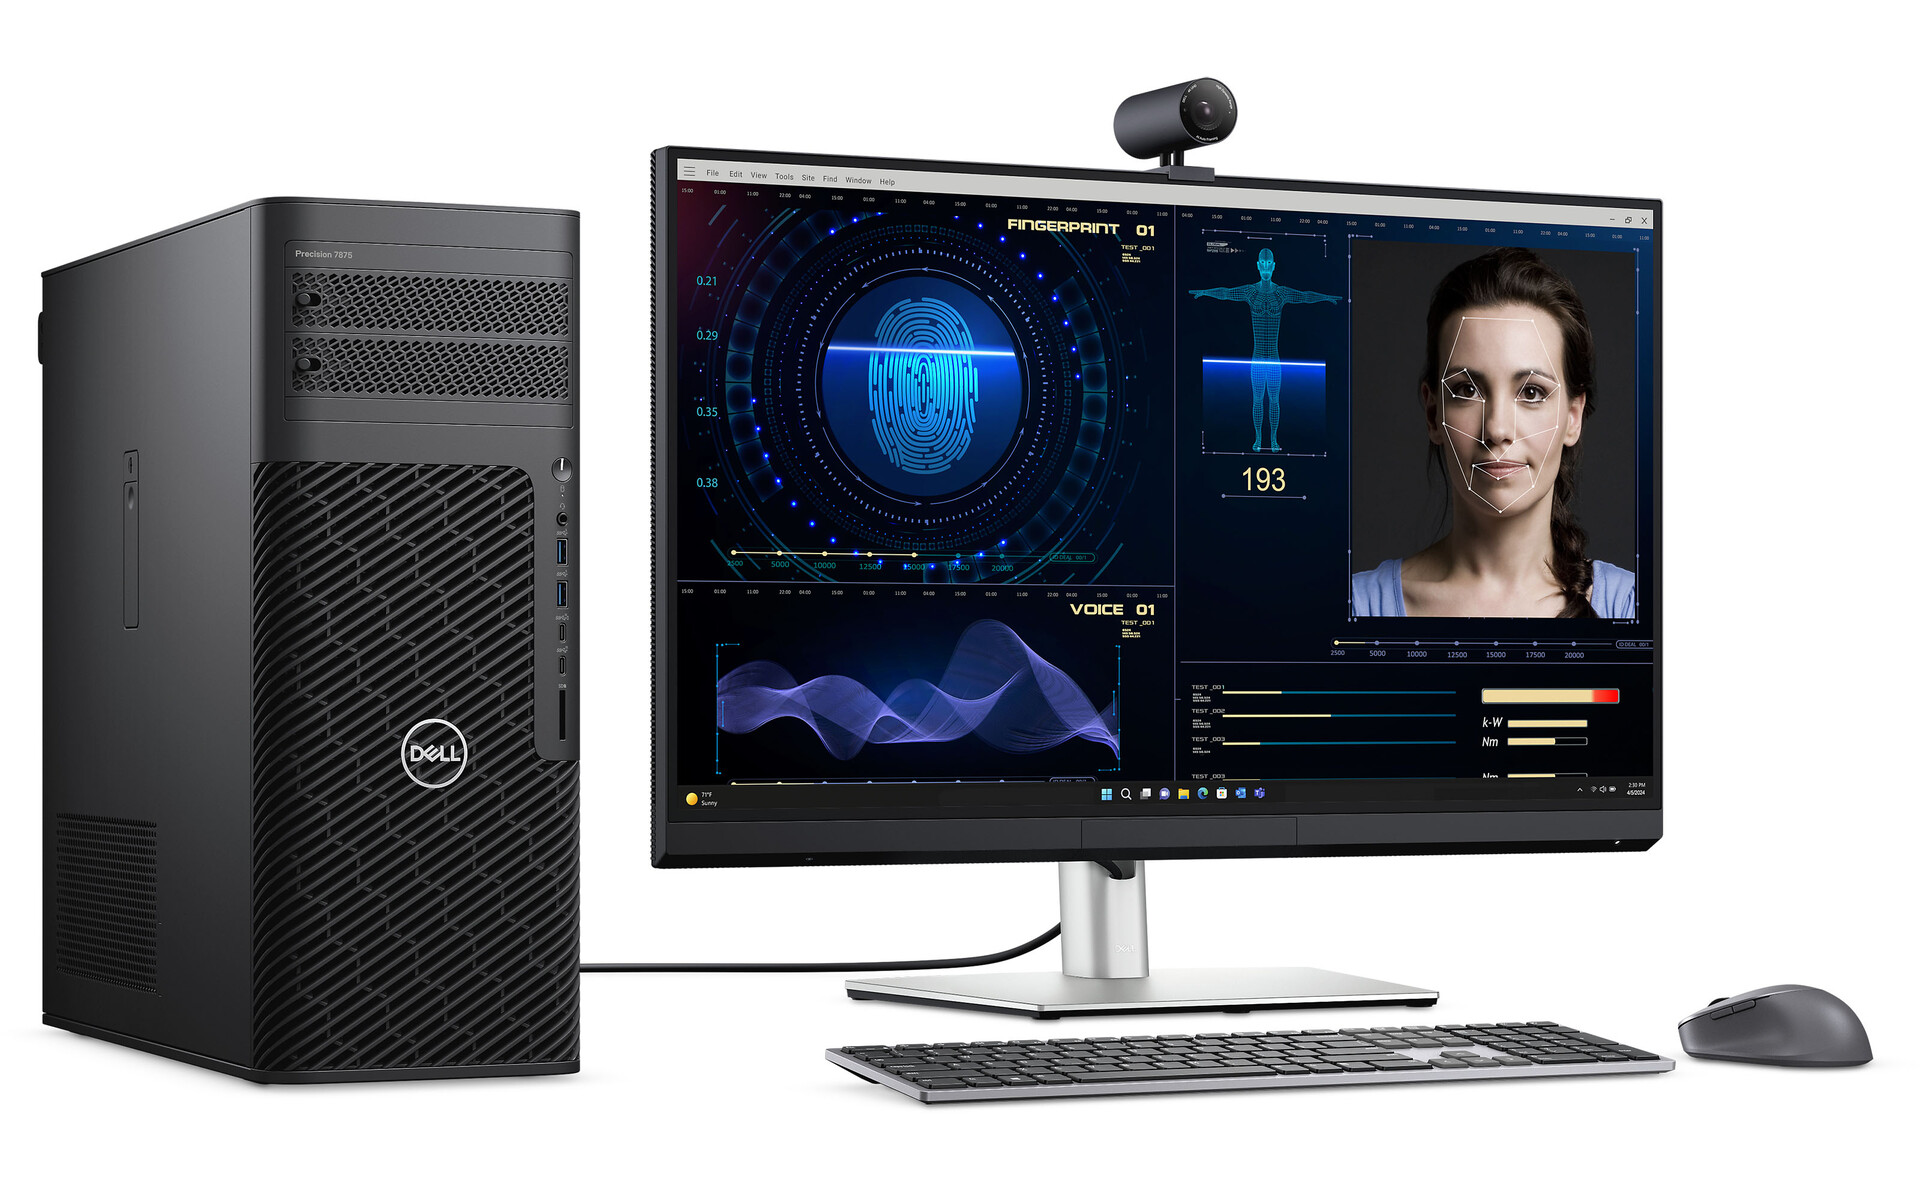
La Precision 7865 Tower Workstation è una workstation ad alte prestazioni di Dell. Con l'aggiunta degli ultimi processori AMD Ryzen Threadripper della serie 7000, la workstation supporta ora fino a 96 core di calcolo e 192 thread. Oltre a questo, vanta fino a 1.024 GB di RAM ed è dotata di due schede grafiche workstation di fascia alta, che la rendono adatta a compiti eccezionalmente impegnativi.
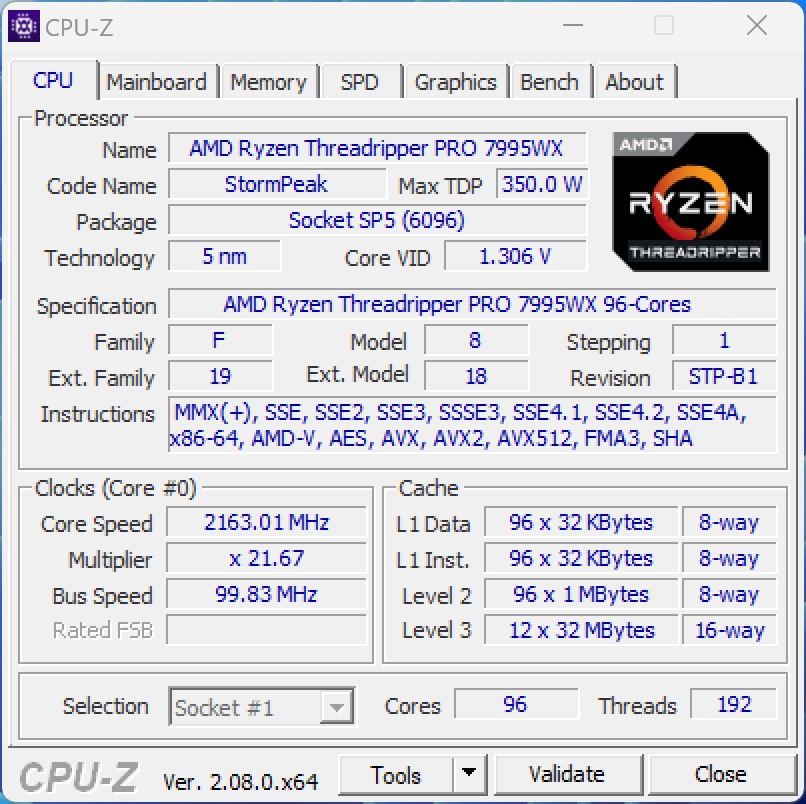
Abbiamo avuto l'opportunità di testare la nuova workstation di fascia alta, che presenta la scheda grafica AMD Ryzen Threadripper Pro 7995WX con 512 GB RDIMM e un SSD da 4 TB. Inoltre, il sistema incorpora due Nvidia RTX 6000 Ada Generation di Nvidia RTX 6000 Ada. Sebbene non ci siano informazioni ufficiali sul prezzo del sistema di prova, uno sguardo dettagliato ai prezzi indica una fascia di prezzo a cinque cifre per la configurazione di prova. Queste unità non sono destinate all'uso domestico, ma trovano la loro nicchia negli ambienti commerciali dove è essenziale una notevole potenza di calcolo e il tempo è denaro. A lungo termine, questi sistemi possono rivelarsi convenienti se il tempo risparmiato giustifica l'investimento.
Naturalmente, Dell non si limita a fornire il modello di punta; i sistemi possono essere personalizzati e adattati a esigenze specifiche attraverso le opzioni di configurazione del negozio.
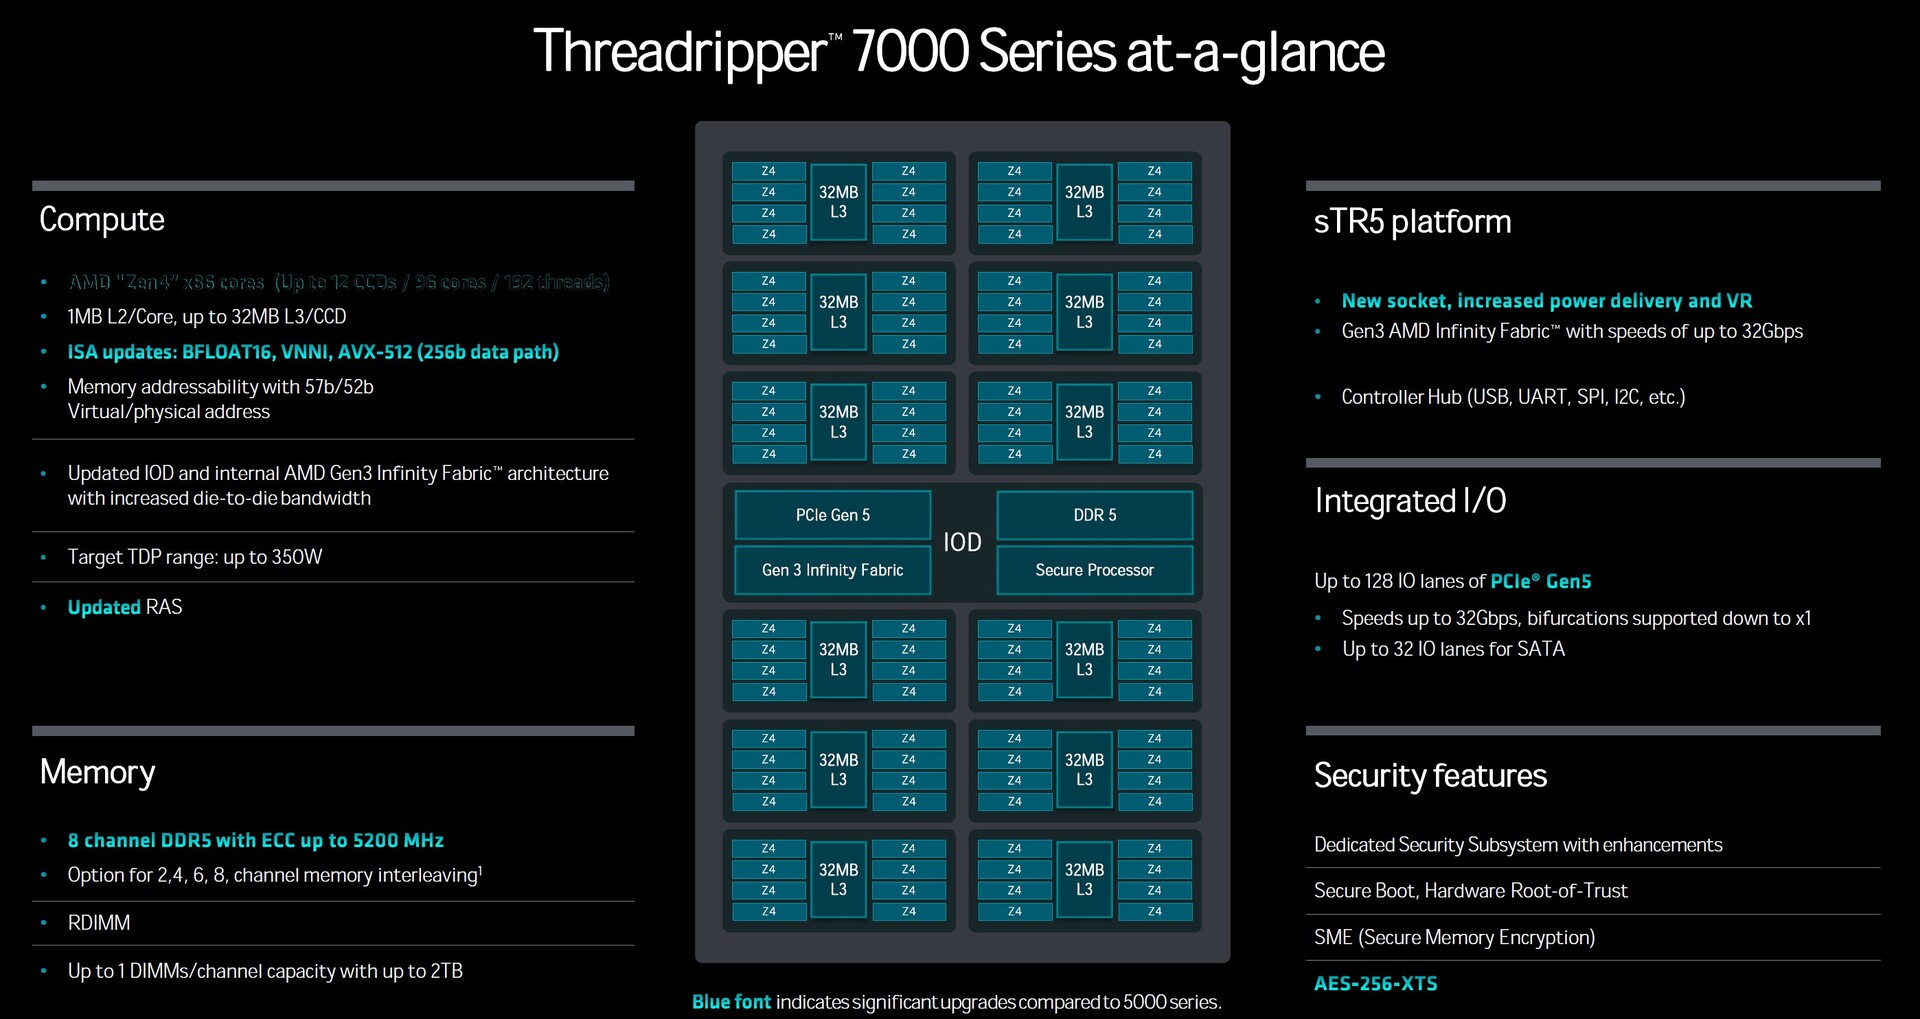
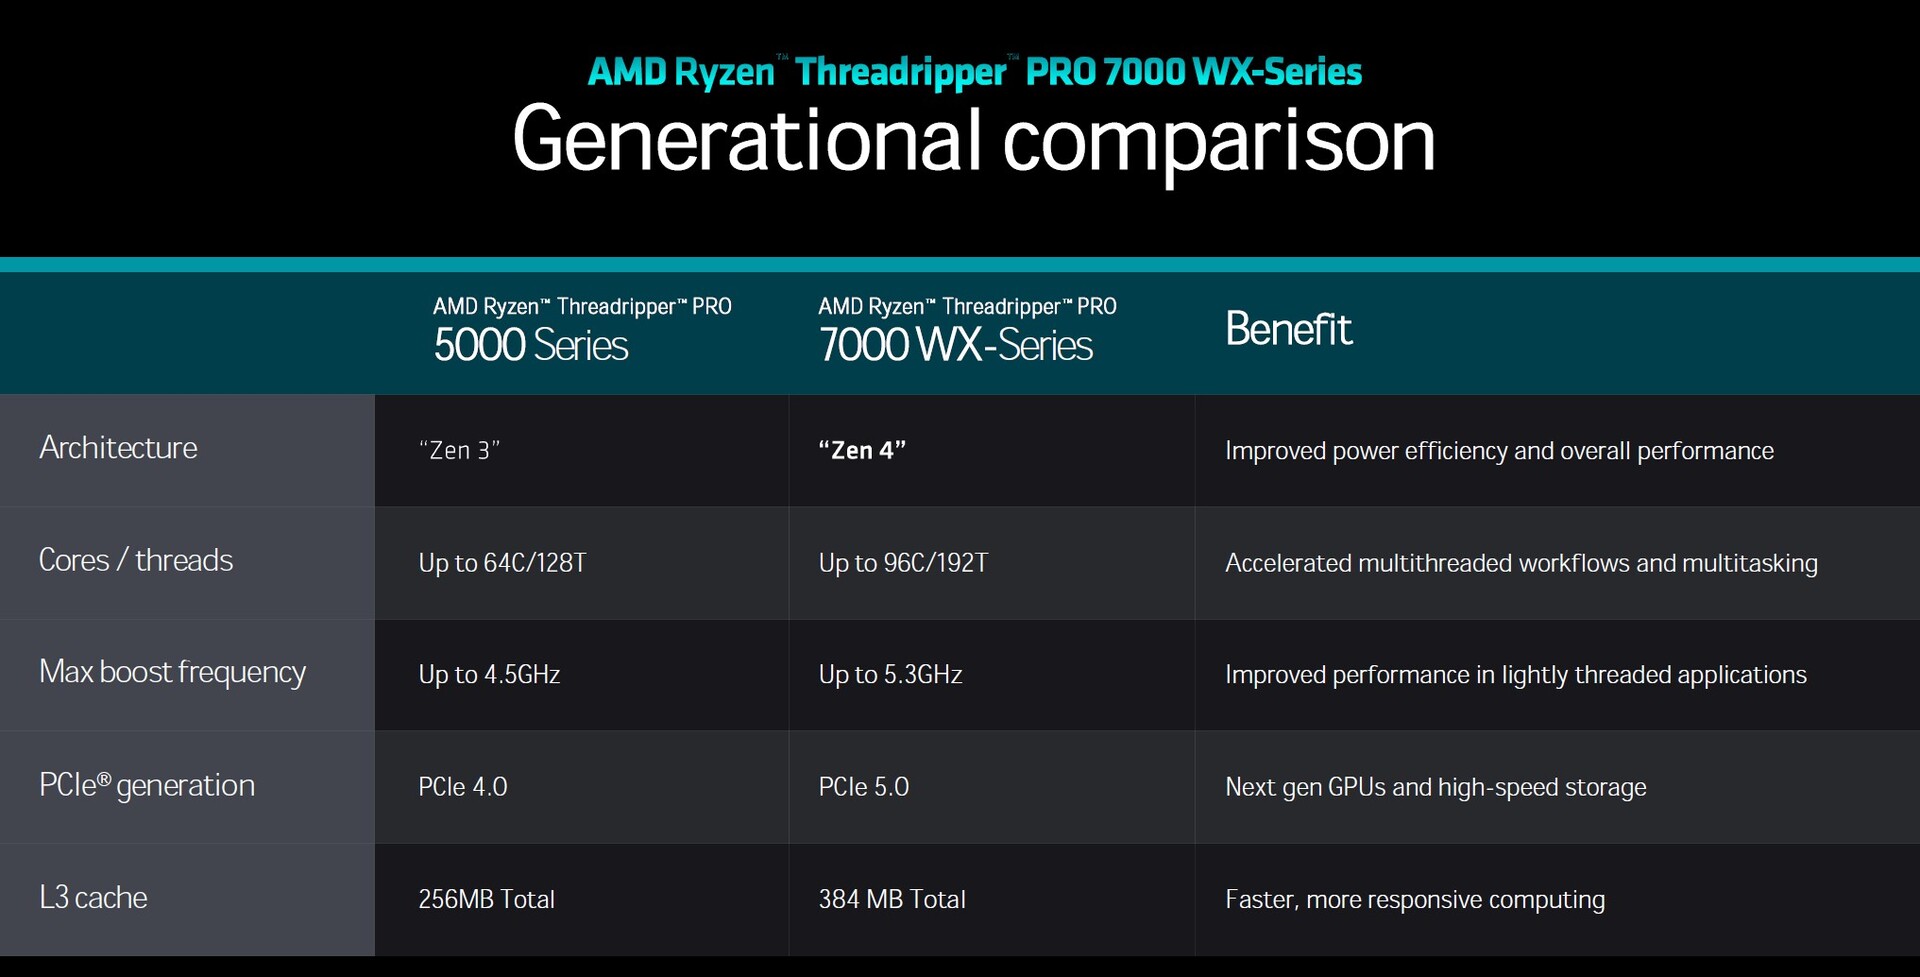
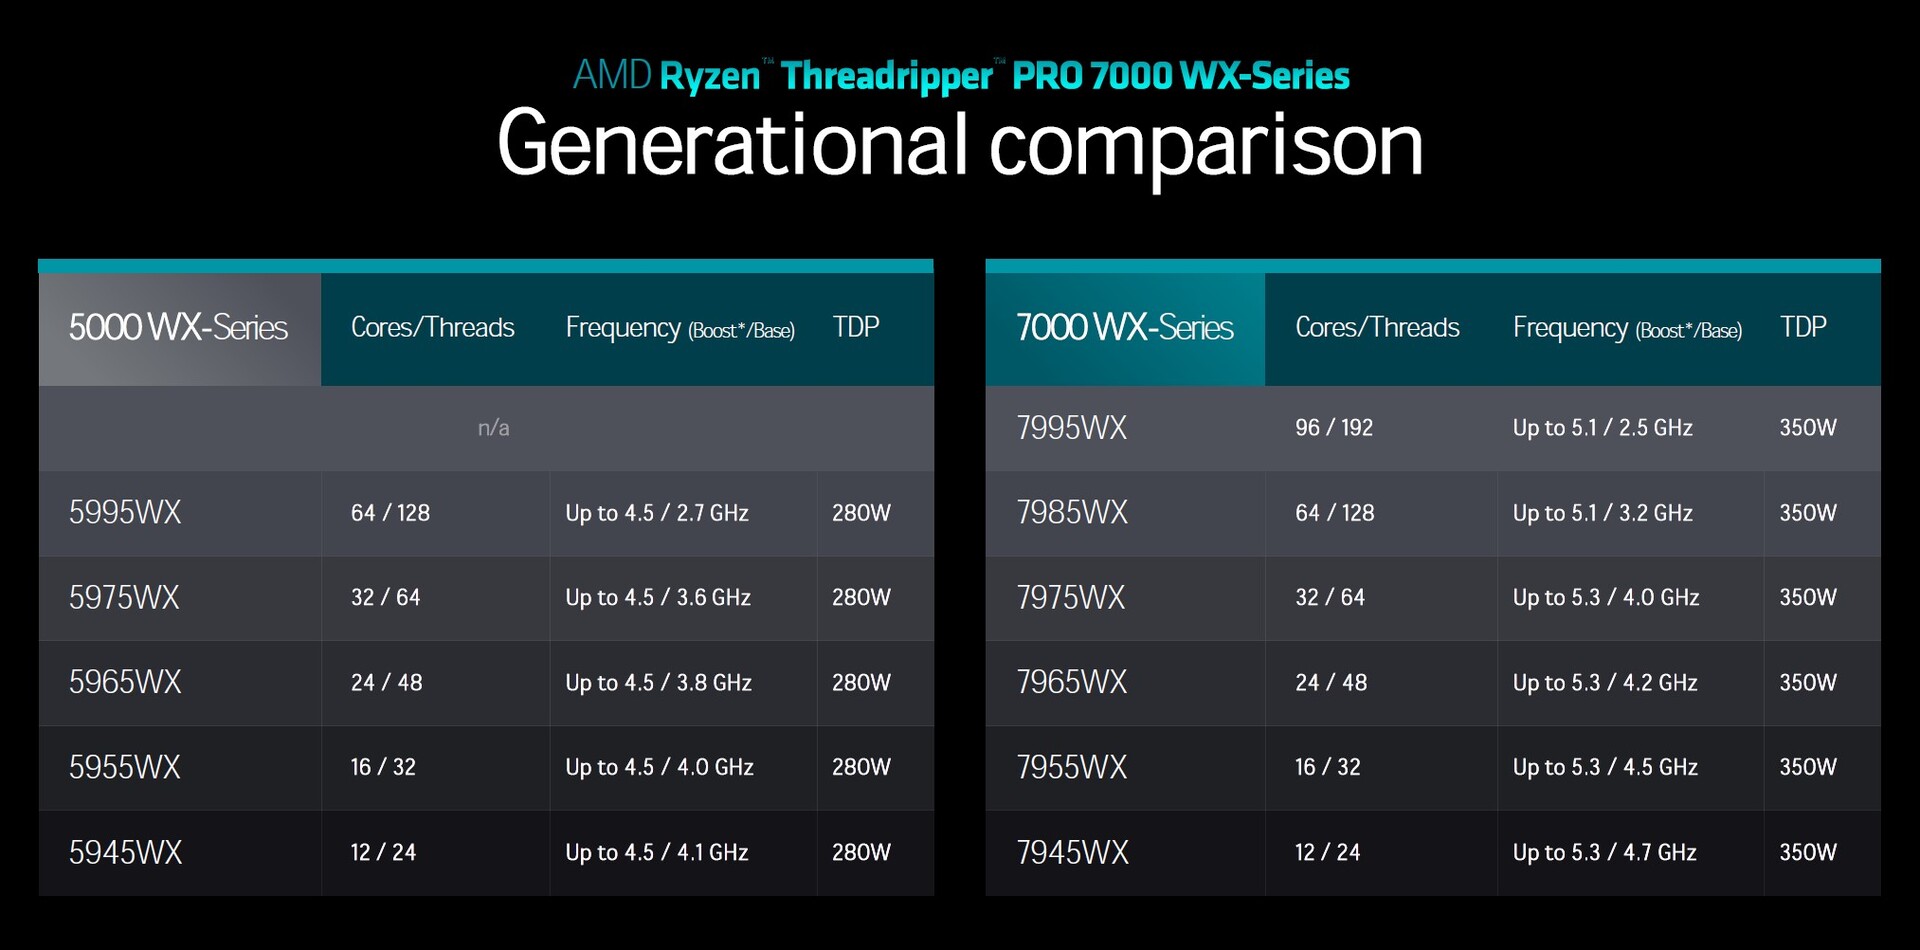
Dettagli su Threadripper-7000-WX-Serie
AMD ha offerto un significativo aumento delle prestazioni rispetto a Zen3 con le sue CPU Ryzen 7000 basate su Zen4, estendendo la sua attenzione ai settori dei server e delle workstation. Mentre i precedenti processori Threadripper della serie 5000 utilizzavano core Zen3 e avevano un massimo di 64 core nativi, l'ultima versione di fascia alta, AMD Ryzen Threadripper Pro 7995WX, ha ben 96 core. L'architettura del chipset è stata mantenuta, con 12 CPU Compute Dies (CCD) situati sotto il diffusore di calore. Le velocità di clock più elevate, che raggiungono i 5,1 GHz in modalità boost, e l'aumento della cache L3 sono aggiornamenti notevoli. L'aggiunta di PCIe 5.0 supporta lo standard più recente, garantendo che le future schede grafiche possano lavorare alla massima capacità. Questo standard migliora anche i dispositivi di archiviazione di massa, utilizzando velocità di dati elevate nei settori dei server e delle workstation.
Informazioni importanti sulle condizioni del test
Dell ci ha offerto l'opportunità di testare in remoto la Workstation Dell Precision 7875 Tower. Purtroppo, questo significa che non abbiamo avuto accesso diretto all'hardware. La connessione al sistema di test è stata stabilita tramite Parsec, con una conseguente leggera perdita di prestazioni, come ha fatto notare Dell. Tuttavia, si prevede che questa perdita sia a una sola cifra. Anche la connessione attiva ha un impatto sulle prestazioni 3D. Purtroppo non è stato possibile condurre tutti i test, poiché spesso non era possibile avviare l'applicazione 3D tramite Parsec. Inoltre, non siamo in grado di fornire informazioni sulle emissioni dell'unità di test.
Parametri di riferimento del processore
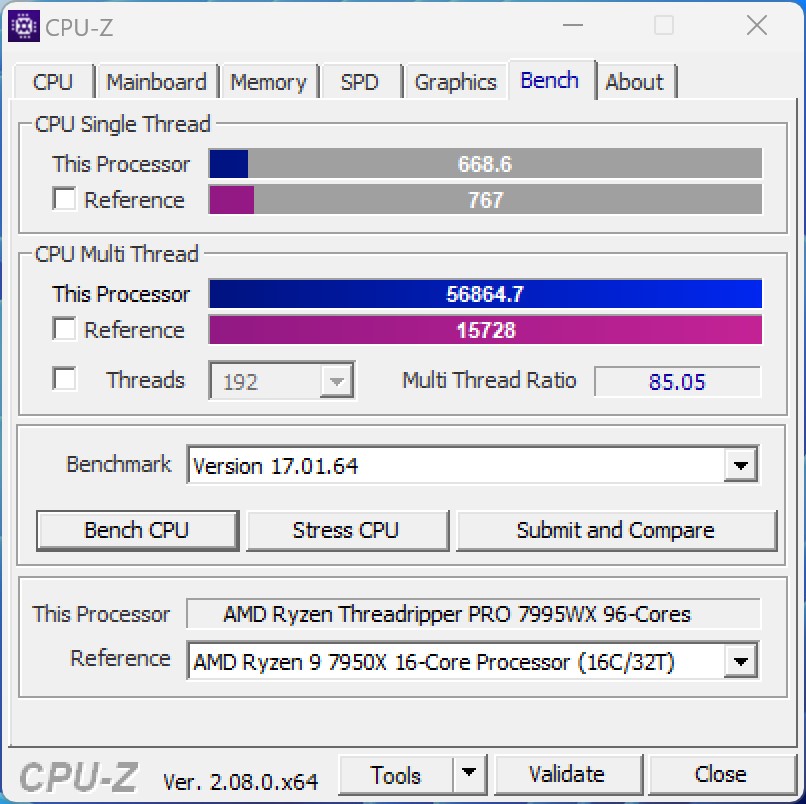
AMD Ryzen Threadripper Pro 7995WX offre prestazioni sostanziali, soprattutto negli scenari in cui il software gestisce in modo efficiente un numero elevato di core di calcolo. Nei nostri test, abbiamo riscontrato esempi negativi in cui alcuni software hanno faticato a gestire questa abbondanza di core di calcolo. Tuttavia, AMD Ryzen Threadripper Pro 7995WX rimane competitivo rispetto a tutti i processori che abbiamo testato finora. Tuttavia, in termini di prestazioni single-core, è inferiore agli attuali processori Intel e AMD nel settore consumer. Tuttavia, se confrontato con il suo predecessore, l' AMD Ryzen Threadripper Pro 3995WXosserviamo un aumento significativo delle prestazioni di oltre il 40 percento. Per la controparte di Intel ai modelli Threadripper di AMD, i modelli Sapphire Rapids, che attualmente offrono un massimo di 56 core, purtroppo non abbiamo dati comparativi.
L'AMD Ryzen Threadripper Pro 7995WX funziona con un clock di base di 2,5 GHz, con il potenziale di raggiungere fino a 5,1 GHz in modalità boost. Rispetto ai suoi predecessori, AMD ha anche aumentato il consumo energetico massimo, che ora raggiunge i 350 watt, un valore che abbiamo confermato durante i test.
Per ulteriori confronti e benchmark, consulti la nostra Tabella di confronto delle CPU.
| Cinebench R23 | |
| Single Core | |
| Intel Core i9-14900K | |
| AMD Ryzen 9 7950X3D | |
| AMD Ryzen 9 7950X | |
| AMD Ryzen Threadripper PRO 7995WX | |
| AMD Ryzen Threadripper PRO 3995WX | |
| Multi Core | |
| AMD Ryzen Threadripper PRO 7995WX | |
| AMD Ryzen Threadripper PRO 3995WX | |
| Intel Core i9-14900K | |
| AMD Ryzen 9 7950X | |
| AMD Ryzen 9 7950X3D | |
| Cinebench R20 | |
| CPU (Single Core) | |
| Intel Core i9-14900K | |
| AMD Ryzen 9 7950X | |
| AMD Ryzen 9 7950X3D | |
| AMD Ryzen Threadripper PRO 7995WX | |
| AMD Ryzen Threadripper PRO 3995WX | |
| CPU (Multi Core) | |
| AMD Ryzen Threadripper PRO 7995WX | |
| AMD Ryzen Threadripper PRO 3995WX | |
| Intel Core i9-14900K | |
| AMD Ryzen 9 7950X | |
| AMD Ryzen 9 7950X3D | |
| Cinebench 2024 | |
| CPU Multi Core | |
| AMD Ryzen Threadripper PRO 7995WX | |
| Intel Core i9-14900K | |
| CPU Single Core | |
| Intel Core i9-14900K | |
| AMD Ryzen Threadripper PRO 7995WX | |
| Cinebench R15 | |
| CPU Single 64Bit | |
| Intel Core i9-14900K | |
| AMD Ryzen 9 7950X | |
| AMD Ryzen 9 7950X3D | |
| AMD Ryzen Threadripper PRO 7995WX | |
| AMD Ryzen Threadripper PRO 3995WX | |
| CPU Multi 64Bit | |
| AMD Ryzen Threadripper PRO 7995WX | |
| AMD Ryzen Threadripper PRO 3995WX | |
| Intel Core i9-14900K | |
| AMD Ryzen 9 7950X | |
| AMD Ryzen 9 7950X3D | |
| Cinebench R11.5 | |
| CPU Single 64Bit | |
| Intel Core i9-14900K | |
| AMD Ryzen 9 7950X | |
| AMD Ryzen 9 7950X3D | |
| AMD Ryzen Threadripper PRO 7995WX | |
| AMD Ryzen Threadripper PRO 3995WX | |
| CPU Multi 64Bit | |
| AMD Ryzen Threadripper PRO 7995WX | |
| Intel Core i9-14900K | |
| AMD Ryzen 9 7950X | |
| AMD Ryzen 9 7950X3D | |
| AMD Ryzen Threadripper PRO 3995WX | |
| Cinebench R10 | |
| Rendering Single CPUs 64Bit | |
| Intel Core i9-14900K | |
| AMD Ryzen 9 7950X | |
| AMD Ryzen Threadripper PRO 3995WX | |
| AMD Ryzen 9 7950X3D | |
| AMD Ryzen Threadripper PRO 7995WX | |
| Rendering Multiple CPUs 64Bit | |
| Intel Core i9-14900K | |
| AMD Ryzen 9 7950X | |
| AMD Ryzen Threadripper PRO 3995WX | |
| AMD Ryzen 9 7950X3D | |
| AMD Ryzen Threadripper PRO 7995WX | |
| Blender - v2.79 BMW27 CPU | |
| AMD Ryzen 9 7950X3D | |
| AMD Ryzen 9 7950X | |
| Intel Core i9-14900K | |
| AMD Ryzen Threadripper PRO 3995WX | |
| AMD Ryzen Threadripper PRO 7995WX | |
| wPrime 2.10 | |
| 32m | |
| AMD Ryzen Threadripper PRO 7995WX | |
| AMD Ryzen Threadripper PRO 3995WX | |
| Intel Core i9-14900K | |
| AMD Ryzen 9 7950X3D | |
| AMD Ryzen 9 7950X | |
| 1024m | |
| Intel Core i9-14900K | |
| AMD Ryzen 9 7950X3D | |
| AMD Ryzen 9 7950X | |
| AMD Ryzen Threadripper PRO 3995WX | |
| AMD Ryzen Threadripper PRO 7995WX | |
| X264 HD Benchmark 4.0 | |
| Pass 1 | |
| Intel Core i9-14900K | |
| AMD Ryzen 9 7950X3D | |
| AMD Ryzen 9 7950X | |
| AMD Ryzen Threadripper PRO 7995WX | |
| AMD Ryzen Threadripper PRO 3995WX | |
| Pass 2 | |
| Intel Core i9-14900K | |
| AMD Ryzen Threadripper PRO 7995WX | |
| AMD Ryzen 9 7950X | |
| AMD Ryzen 9 7950X3D | |
| AMD Ryzen Threadripper PRO 3995WX | |
| WinRAR - Result | |
| AMD Ryzen Threadripper PRO 7995WX | |
| AMD Ryzen 9 7950X | |
| Intel Core i9-14900K | |
| AMD Ryzen 9 7950X3D | |
| AMD Ryzen Threadripper PRO 3995WX | |
| TrueCrypt | |
| AES Mean 100MB | |
| AMD Ryzen Threadripper PRO 7995WX | |
| AMD Ryzen 9 7950X | |
| AMD Ryzen 9 7950X3D | |
| Intel Core i9-14900K | |
| AMD Ryzen Threadripper PRO 3995WX | |
| Twofish Mean 100MB | |
| Intel Core i9-14900K | |
| AMD Ryzen Threadripper PRO 7995WX | |
| AMD Ryzen Threadripper PRO 3995WX | |
| AMD Ryzen 9 7950X | |
| AMD Ryzen 9 7950X3D | |
| Serpent Mean 100MB | |
| AMD Ryzen Threadripper PRO 7995WX | |
| AMD Ryzen Threadripper PRO 3995WX | |
| AMD Ryzen 9 7950X | |
| AMD Ryzen 9 7950X3D | |
| Intel Core i9-14900K | |
| 3DMark 11 - 1280x720 Performance Physics | |
| AMD Ryzen 9 7950X3D | |
| Intel Core i9-14900K | |
| AMD Ryzen 9 7950X | |
| AMD Ryzen Threadripper PRO 7995WX | |
| AMD Ryzen Threadripper PRO 3995WX | |
| AMD Ryzen Threadripper PRO 3975WX | |
| 7-Zip 18.03 | |
| 7z b 4 | |
| AMD Ryzen Threadripper PRO 7995WX | |
| AMD Ryzen 9 7950X | |
| AMD Ryzen 9 7950X3D | |
| Intel Core i9-14900K | |
| AMD Ryzen Threadripper PRO 3995WX | |
| 7z b 4 -mmt1 | |
| AMD Ryzen 9 7950X | |
| AMD Ryzen 9 7950X3D | |
| Intel Core i9-14900K | |
| AMD Ryzen Threadripper PRO 7995WX | |
| AMD Ryzen Threadripper PRO 3995WX | |
| HWBOT x265 Benchmark v2.2 - 4k Preset | |
| AMD Ryzen Threadripper PRO 7995WX | |
| AMD Ryzen Threadripper PRO 3995WX | |
| AMD Ryzen 9 7950X | |
| Intel Core i9-14900K | |
| AMD Ryzen 9 7950X3D | |
| R Benchmark 2.5 - Overall mean | |
| AMD Ryzen Threadripper PRO 3995WX | |
| AMD Ryzen Threadripper PRO 7995WX | |
| AMD Ryzen 9 7950X3D | |
| AMD Ryzen 9 7950X | |
| Intel Core i9-14900K | |
| LibreOffice - 20 Documents To PDF | |
| AMD Ryzen Threadripper PRO 3995WX | |
| AMD Ryzen Threadripper PRO 7995WX | |
| AMD Ryzen 9 7950X3D | |
| AMD Ryzen 9 7950X | |
| Intel Core i9-14900K | |
| WebXPRT 3 - Overall | |
| AMD Ryzen 9 7950X3D | |
| Intel Core i9-14900K | |
| AMD Ryzen 9 7950X | |
| AMD Ryzen Threadripper PRO 7995WX | |
| AMD Ryzen Threadripper PRO 3995WX | |
| Mozilla Kraken 1.1 - Total | |
| AMD Ryzen Threadripper PRO 3995WX | |
| AMD Ryzen Threadripper PRO 7995WX | |
| AMD Ryzen 9 7950X3D | |
| AMD Ryzen 9 7950X | |
| Intel Core i9-14900K | |
| 3DMark | |
| 3840x2160 Fire Strike Ultra Physics | |
| Intel Core i9-14900K | |
| AMD Ryzen 9 7950X3D | |
| AMD Ryzen 9 7950X | |
| AMD Ryzen Threadripper PRO 7995WX | |
| AMD Ryzen Threadripper PRO 3995WX | |
| AMD Ryzen Threadripper PRO 3975WX | |
| 1920x1080 Fire Strike Physics | |
| Intel Core i9-14900K | |
| AMD Ryzen 9 7950X3D | |
| AMD Ryzen 9 7950X | |
| AMD Ryzen Threadripper PRO 7995WX | |
| AMD Ryzen Threadripper PRO 3995WX | |
| AMD Ryzen Threadripper PRO 3975WX | |
| 2560x1440 Time Spy CPU | |
| Intel Core i9-14900K | |
| AMD Ryzen 9 7950X3D | |
| AMD Ryzen 9 7950X | |
| AMD Ryzen Threadripper PRO 7995WX | |
| AMD Ryzen Threadripper PRO 3975WX | |
| AMD Ryzen Threadripper PRO 3995WX | |
| Geekbench 6.0 | |
| Multi-Core | |
| AMD Ryzen Threadripper PRO 7995WX | |
| Intel Core i9-14900K | |
| Single-Core | |
| Intel Core i9-14900K | |
| AMD Ryzen Threadripper PRO 7995WX | |
| Geekbench 6.7 | |
| Multi-Core | |
| AMD Ryzen Threadripper PRO 7995WX | |
| Intel Core i9-14900K | |
| AMD Ryzen 9 7950X3D | |
| Single-Core | |
| Intel Core i9-14900K | |
| AMD Ryzen 9 7950X3D | |
| AMD Ryzen Threadripper PRO 7995WX | |
* ... Meglio usare valori piccoli
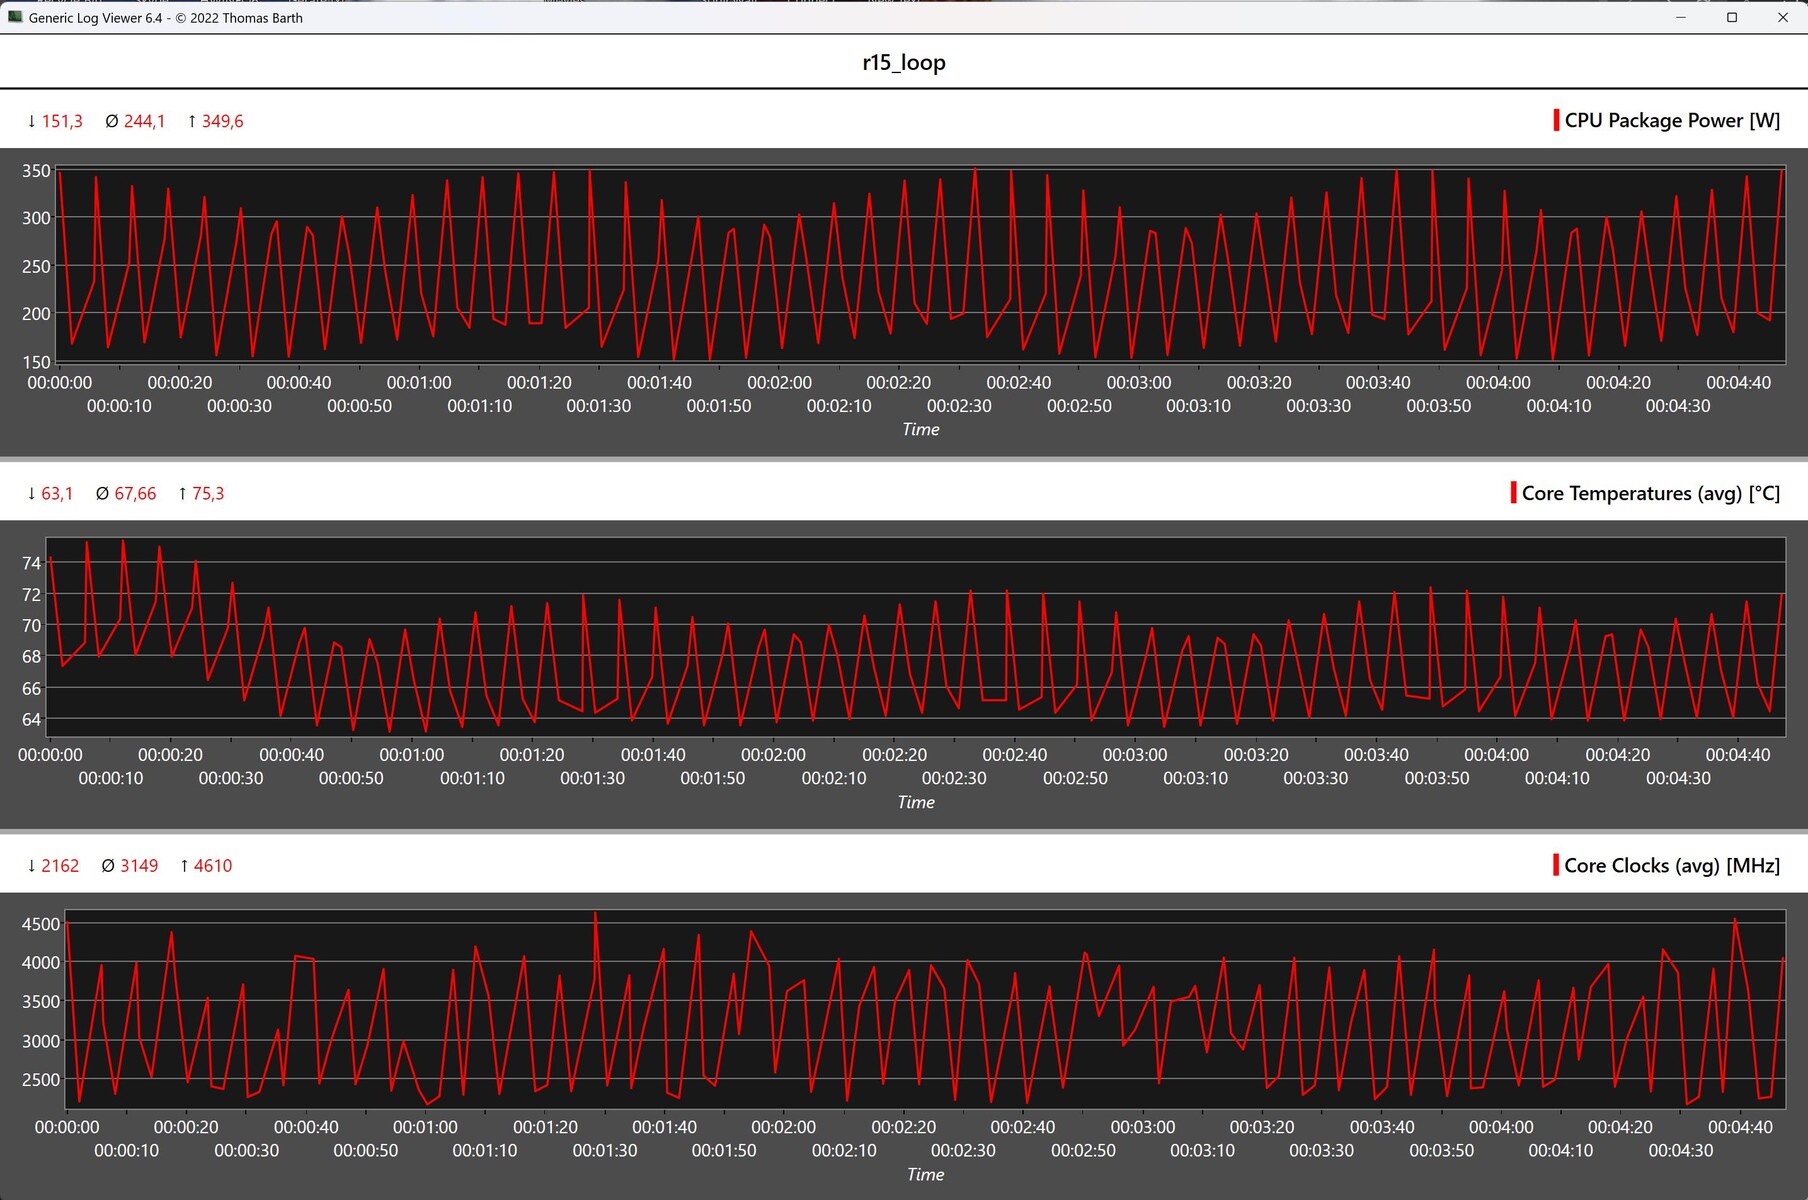
Dell Precision 7875 Tower Workstation in Cinebench R15 Multi Loop
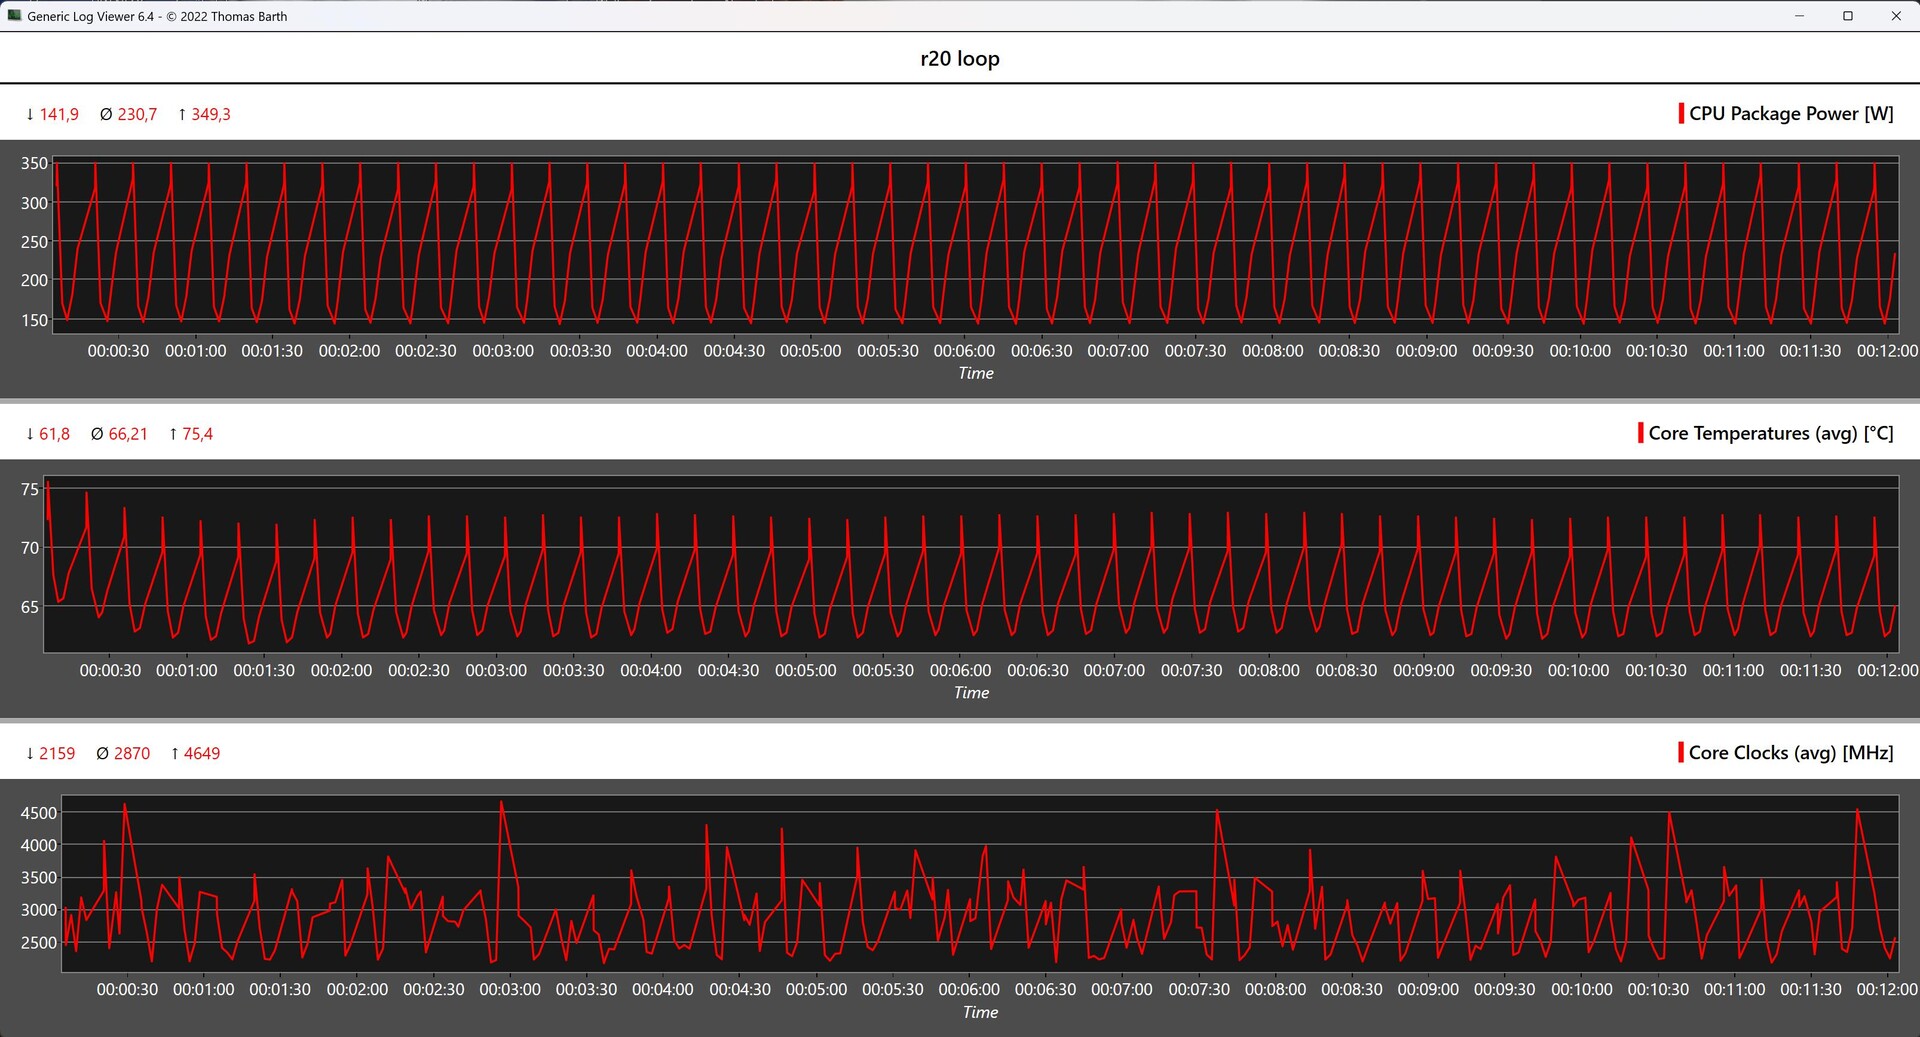
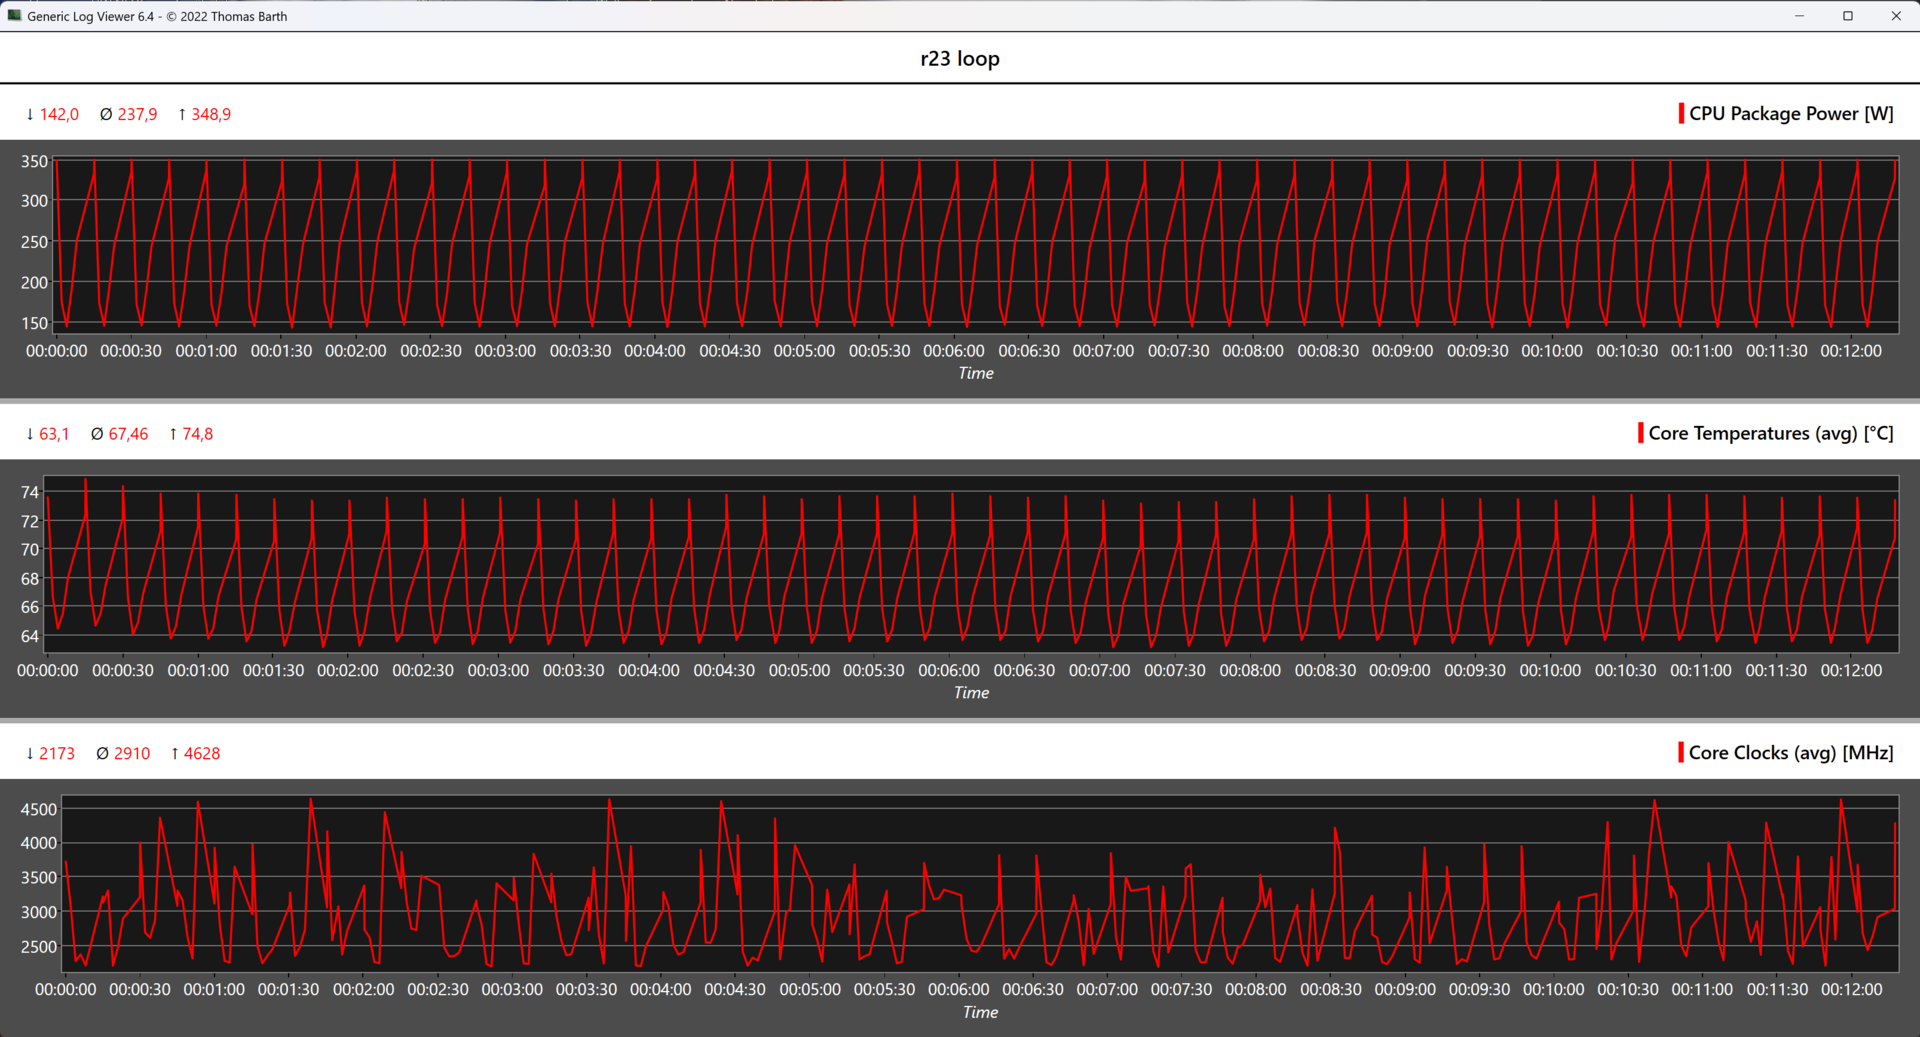
La Workstation Dell Precision 7875 Tower eccelle durante lo stress test di Cinebench R15 Multi Loop, offrendo un risultato eccezionale. Nel corso delle 50 prove, abbiamo osservato solo lievi fluttuazioni nelle prestazioni, escludendo un calo significativo della potenza con capacità in costante diminuzione. I dati di telemetria rivelano che il processore può essere utilizzato costantemente alla potenza massima di 350 watt senza incontrare problemi. Inoltre, il sistema ha dimostrato prestazioni stabili nei test di stress con Cinebench R20 Multi Loop e Cinebench R23 Multi Loop.
Benchmark sintetici e prestazioni delle applicazioni
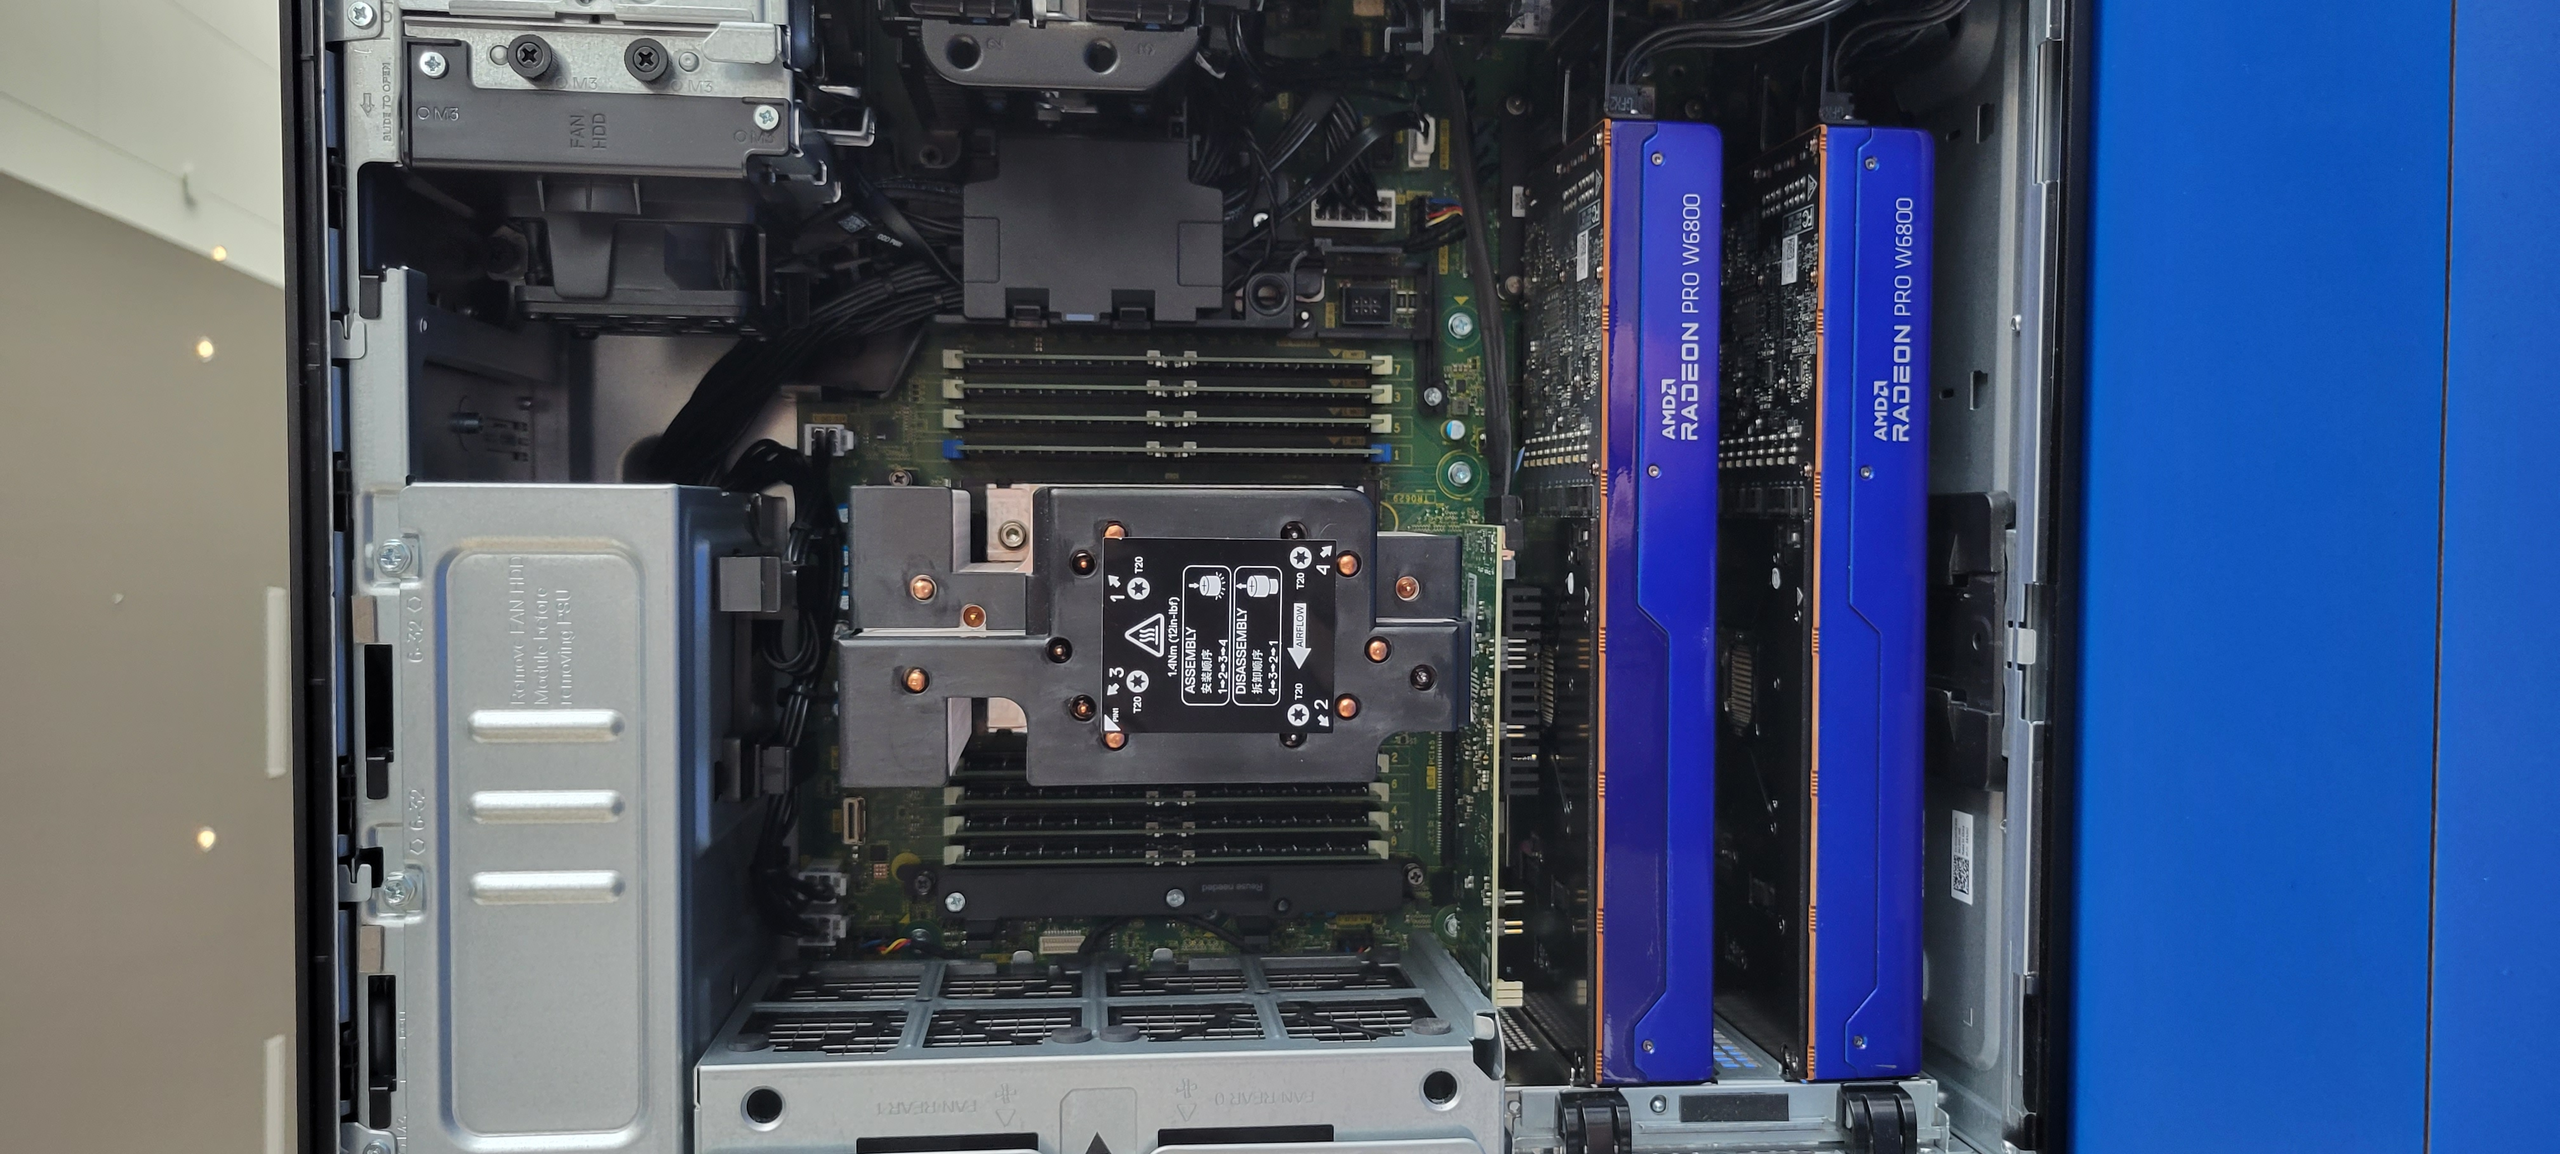
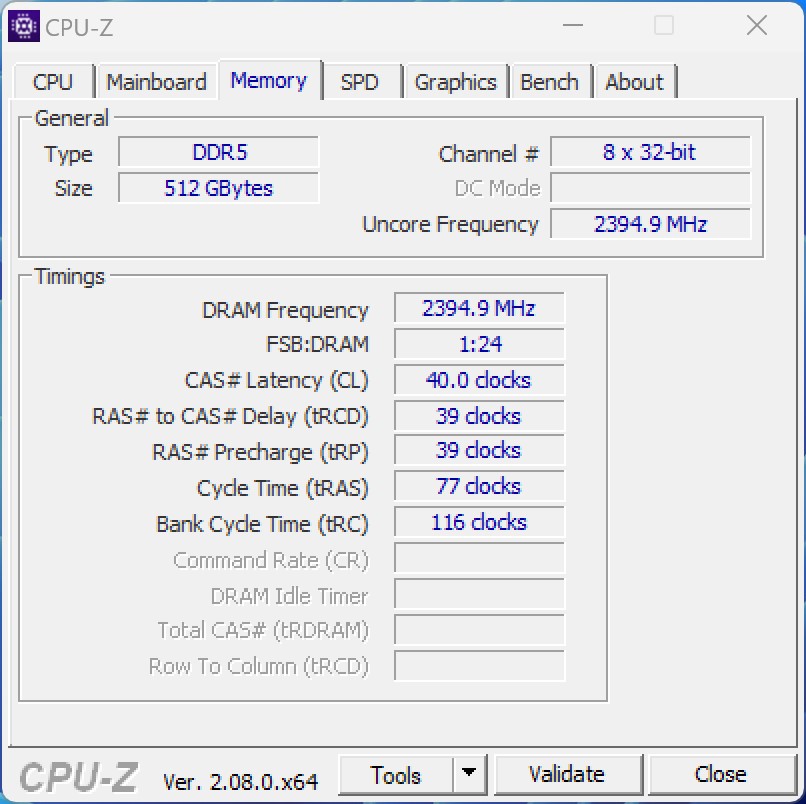
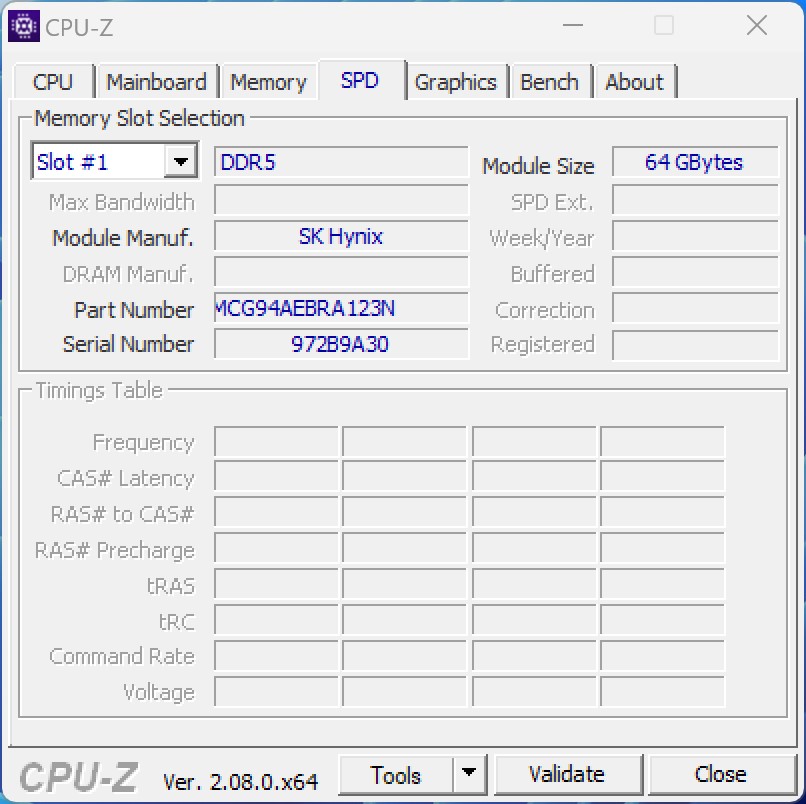
I test sintetici condotti con il sistema di prova indicano che il numero sostanziale di core di calcolo non può essere sfruttato appieno, con il risultato che il sistema fatica a superare i suoi concorrenti. Mentre il Dell Precision 7875 Tower emerge vittorioso in un confronto diretto con la Lenovo ThinkStation P620 basata su AMD Ryzen Threadripper Pro 3995WXil vantaggio più significativo si trova nei test della RAM. Il funzionamento octa-channel del nostro sistema di test gli consente di affermare un chiaro vantaggio con valori impressionanti. La RDRAMM installata, con clock a 4.800 MT/s, è notevolmente grande, con 512 GB. Inoltre, la RAM vanta il supporto ECC, una caratteristica attesa come standard nel settore delle workstation.
| 3DMark | |
| 1920x1080 Fire Strike Physics | |
| Intel Core i9-14900K | |
| AMD Ryzen 9 7950X3D | |
| AMD Ryzen 9 7950X | |
| AMD Ryzen Threadripper PRO 7995WX | |
| AMD Ryzen Threadripper PRO 3995WX | |
| AMD Ryzen Threadripper PRO 3975WX | |
| 2560x1440 Time Spy CPU | |
| Intel Core i9-14900K | |
| AMD Ryzen 9 7950X3D | |
| AMD Ryzen 9 7950X | |
| AMD Ryzen Threadripper PRO 7995WX | |
| AMD Ryzen Threadripper PRO 3975WX | |
| AMD Ryzen Threadripper PRO 3995WX | |
| 3DMark 11 - 1280x720 Performance Physics | |
| AMD Ryzen 9 7950X3D | |
| Intel Core i9-14900K | |
| AMD Ryzen 9 7950X | |
| AMD Ryzen Threadripper PRO 7995WX | |
| AMD Ryzen Threadripper PRO 3995WX | |
| AMD Ryzen Threadripper PRO 3975WX | |
| CrossMark - Overall | |
| Intel Core i9-14900K | |
| AMD Ryzen 9 7950X | |
| AMD Ryzen 9 7950X3D | |
| AMD Ryzen Threadripper PRO 7995WX | |
| AIDA64 / Memory Copy | |
| AMD Ryzen Threadripper PRO 7995WX | |
| AMD Ryzen Threadripper PRO 3995WX | |
| Intel Core i9-14900K | |
| Intel Core i9-14900K | |
| AMD Ryzen 9 7950X3D | |
| AMD Ryzen 9 7950X | |
| Media della classe (4514 - 234662, n=2212) | |
| AIDA64 / Memory Read | |
| AMD Ryzen Threadripper PRO 7995WX | |
| AMD Ryzen Threadripper PRO 3995WX | |
| Intel Core i9-14900K | |
| Intel Core i9-14900K | |
| AMD Ryzen 9 7950X3D | |
| AMD Ryzen 9 7950X | |
| Media della classe (4031 - 271066, n=2174) | |
| AIDA64 / Memory Write | |
| AMD Ryzen Threadripper PRO 7995WX | |
| AMD Ryzen Threadripper PRO 3995WX | |
| AMD Ryzen 9 7950X3D | |
| Intel Core i9-14900K | |
| Intel Core i9-14900K | |
| AMD Ryzen 9 7950X | |
| Media della classe (3506 - 242868, n=2179) | |
| AIDA64 / Memory Latency | |
| AMD Ryzen Threadripper PRO 3995WX | |
| Media della classe (6.1 - 536, n=2240) | |
| AMD Ryzen Threadripper PRO 7995WX | |
| Intel Core i9-14900K | |
| Intel Core i9-14900K | |
| AMD Ryzen 9 7950X3D | |
| AMD Ryzen 9 7950X | |
* ... Meglio usare valori piccoli
prestazioni in 3D
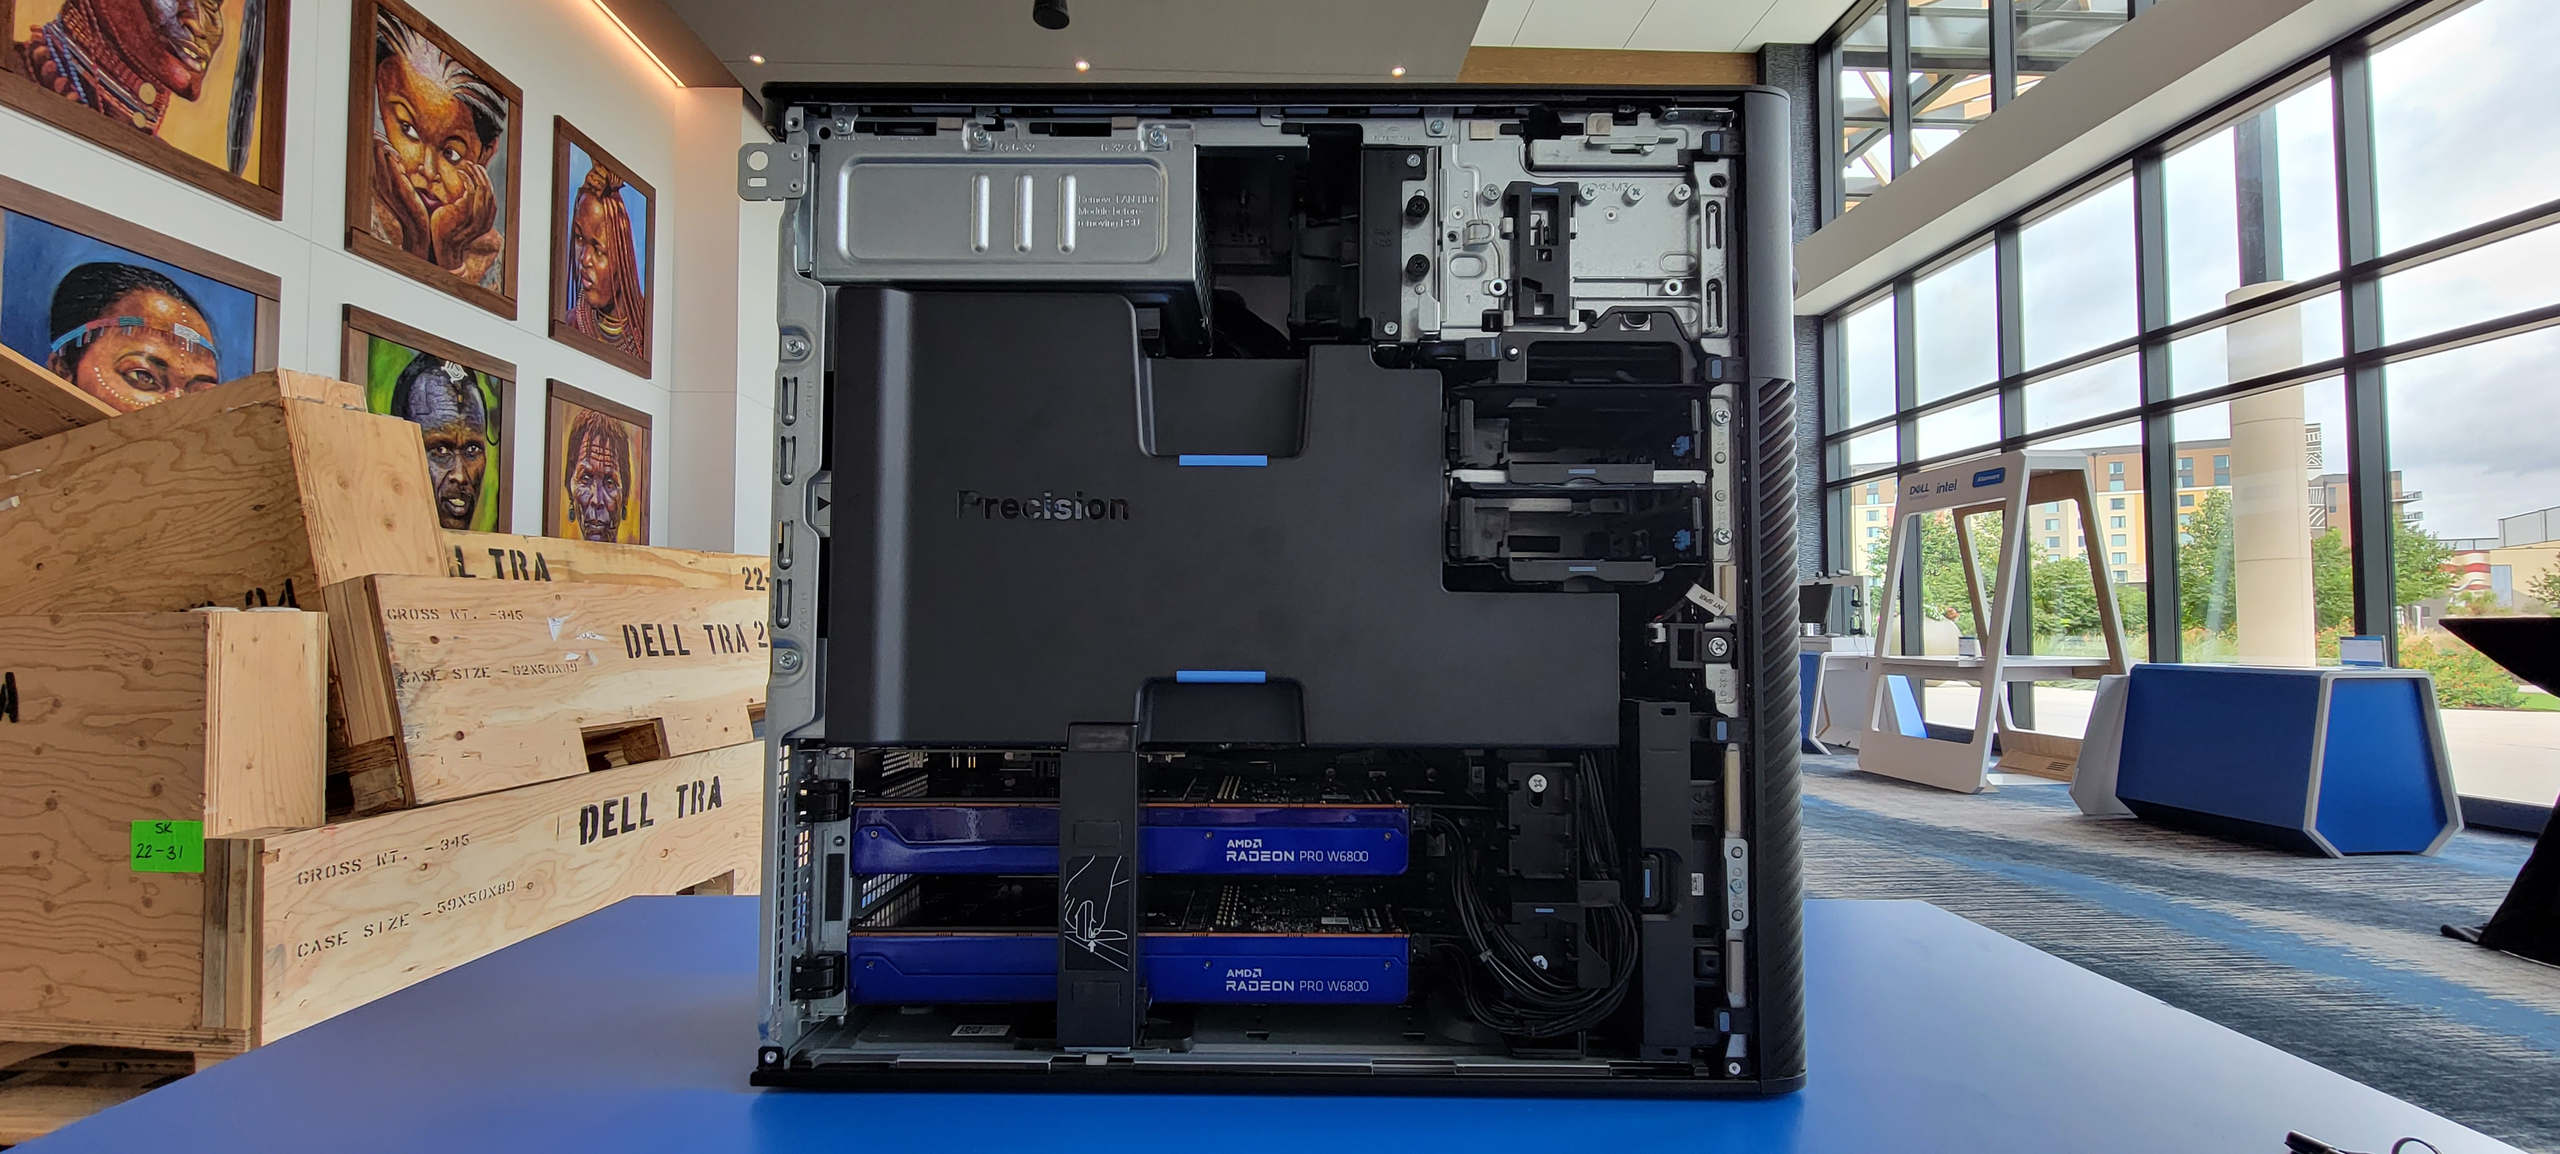
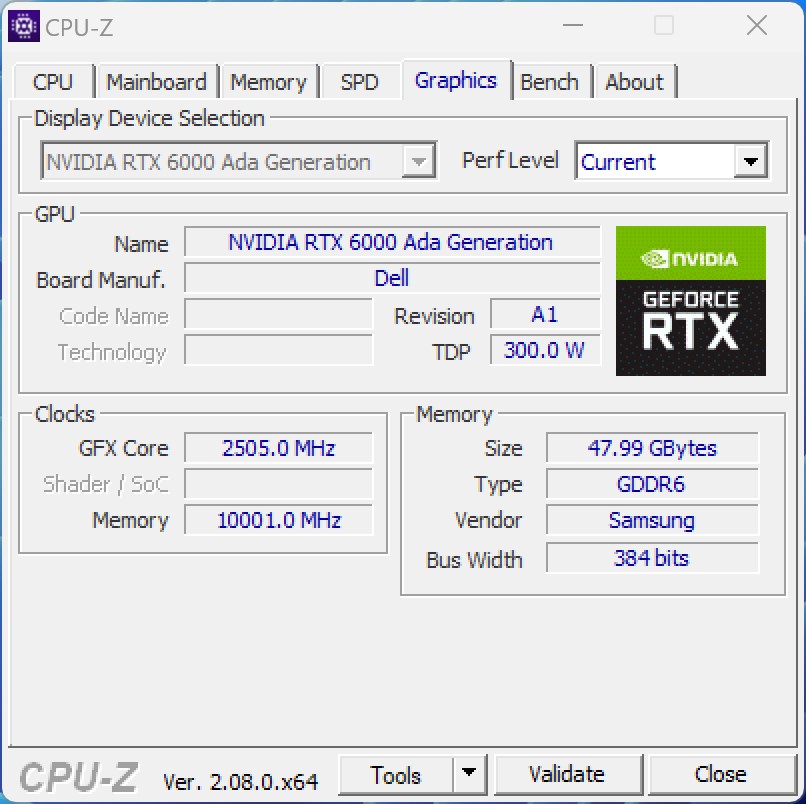
Dell ha equipaggiato la Workstation Dell Precision 7875 Tower con due schede grafiche Nvidia, in particolare i modelli RTX 6000 dell'attuale generazione Ada, ciascuno dei quali vanta 48 GB di VRAM. A causa di potenziali difficoltà con più GPU in alcuni test, abbiamo condotto i test con una sola scheda grafica. Il chip grafico utilizzato è l'AD102 in configurazione completa, con 18.176 shader. In particolare, la scheda Nvidia GeForce RTX 4090 utilizza un modello leggermente più piccolo, con Nvidia che limita il consumo energetico a 300 watt. A differenza di Nvidia GeForce RTX 4090, RTX 6000 impiega una VRAM GDDR6 standard con una larghezza di banda di memoria leggermente inferiore.
Durante i nostri test, i risultati sono stati un po' inferiori rispetto agli altri sistemi di prova. È importante ribadire che le prestazioni 3D complete non potevano essere replicate a causa delle limitazioni dell'ambiente di test. Tuttavia, la Nvidia RTX 6000 Ada Generation brilla nei test di rendering, mostrando guadagni di prestazioni significativi in alcuni casi. A seconda della recensione, osserviamo un aumento di potenza fino al 96 percento rispetto a una Nvidia GeForce RTX 4090. Questo evidenzia l'impatto sostanziale delle ottimizzazioni dei driver, purtroppo limitate alle GPU per workstation professionali.
La Workstation Tower Dell Precision 7875 supporta anche le schede grafiche Radeon PRO di AMD. L'attuale ammiraglia, la AMD Radeon Pro W7900, offre 48 GB di VRAM.
Per ulteriori confronti e benchmark, consulti la nostra tabella di confronto delle GPU.
| AMD Ryzen Threadripper PRO 7995WX, NVIDIA RTX 6000 Ada Generation RTX 6000 Ada Generation, TR Pro 7995WX | AMD Ryzen Threadripper PRO 3995WX, AMD Radeon Pro W6800 Radeon Pro W6800, TR Pro 3995WX, WDC PC SN720 SDAPNTW-256G | AMD Ryzen Threadripper PRO 3975WX, NVIDIA RTX A6000 RTX A6000, TR Pro 3975WX | AMD Ryzen 9 7950X, NVIDIA Titan RTX Titan RTX, R9 7950X | Intel Core i9-14900K, NVIDIA GeForce RTX 4090 GeForce RTX 4090, i9-14900K, WDC PC SN720 SDAQNTW-512G | AMD Ryzen 9 7950X, NVIDIA GeForce RTX 4090 GeForce RTX 4090, R9 7950X, Corsair MP600 GS | AMD Ryzen 9 7950X3D, NVIDIA GeForce RTX 4090 GeForce RTX 4090, R9 7950X3D | |
|---|---|---|---|---|---|---|---|
| SPECviewperf 2020 | -49% | -51% | -54% | -39% | -43% | -42% | |
| 3840x2160 Siemens NX (snx-04) (fps) | 974 | 434 -55% | 481 -51% | 375 -61% | 47.2 -95% | 41.3 -96% | 42.5 -96% |
| 3840x2160 Medical (medical-03) (fps) | 79 | 52 -34% | 37.9 -52% | 16.5 -79% | 40.3 -49% | 45.9 -42% | 46.2 -42% |
| 3840x2160 Energy (energy-03) (fps) | 457 | 87.7 -81% | 63 -86% | 93.9 -79% | 230 -50% | 141 -69% | 140 -69% |
| 3840x2160 Creo (creo-03) (fps) | 191 | 87.8 -54% | 111 -42% | 135 -29% | 148 -23% | 133 -30% | 140 -27% |
| 3840x2160 CATIA (catia-06) (fps) | 139 | 76.2 -45% | 82.4 -41% | 90.9 -35% | 97.1 -30% | 95.3 -31% | 95.9 -31% |
| 3840x2160 3ds Max (3dsmax-07) (fps) | 207 | 162 -22% | 137 -34% | 118 -43% | 236 14% | 228 10% | 236 14% |
| SPECviewperf 13 | -46% | -38% | -41% | -12% | -16% | -14% | |
| 3ds Max (3dsmax-06) (fps) | 496.95 | 318 -36% | 338 -32% | 321 -35% | 567 14% | 563 13% | 573 15% |
| Catia (catia-05) (fps) | 578.86 | 389 -33% | 371 -36% | 534 -8% | 428 -26% | 402 -31% | 427 -26% |
| Creo (creo-02) (fps) | 590.13 | 366 -38% | 386 -35% | 618 5% | 552 -6% | 577 -2% | |
| Energy (energy-02) (fps) | 230.06 | 87.8 -62% | 132 -43% | 51.8 -77% | 127 -45% | 126 -45% | 127 -45% |
| Maya (maya-05) (fps) | 637.3 | 395 -38% | 415 -35% | 499 -22% | 881 38% | 715 12% | 748 17% |
| Medical (medical-02) (fps) | 331.9 | 116 -65% | 184 -45% | 92 -72% | 180 -46% | 186 -44% | 189 -43% |
| Showcase (showcase-02) (fps) | 430.2 | 216 -50% | 255 -41% | 198 -54% | 400 -7% | 455 6% | 456 6% |
| Siemens NX (snx-03) (fps) | 437 | 638 | 512 | 56.3 | 49.1 | 49.3 | |
| Solidworks (sw-04) (fps) | 278 | 173 -38% | 192 -31% | 218 -22% | 199 -28% | 186 -33% | 191 -31% |
| SPECviewperf 12 | -44% | -39% | -36% | -14% | -28% | -19% | |
| 1900x1060 3ds Max (3dsmax-05) (fps) | 473 | 311 -34% | 336 -29% | 315 -33% | 565 19% | 571 21% | 560 18% |
| 1900x1060 Catia (catia-04) (fps) | 349 | 248 -29% | 229 -34% | 332 -5% | 291 -17% | 257 -26% | 274 -21% |
| 1900x1060 Creo (creo-01) (fps) | 250 | 101 -60% | 136 -46% | 197 -21% | 127 -49% | 115 -54% | 118 -53% |
| 1900x1060 Energy (energy-01) (fps) | 58.2 | 37.8 -35% | 39.8 -32% | 28.8 -51% | 84.7 46% | 54.7 -6% | 80.1 38% |
| 1900x1060 Maya (maya-04) (fps) | 266 | 157 -41% | 144 -46% | 260 -2% | 340 28% | 317 19% | 329 24% |
| 1900x1060 Medical (medical-01) (fps) | 282 | 165 -41% | 159 -44% | 101 -64% | 303 7% | 119 -58% | 212 -25% |
| 1900x1060 Showcase (showcase-01) (fps) | 429 | 215 -50% | 255 -41% | 197 -54% | 398 -7% | 457 7% | 427 0% |
| 1900x1060 Siemens NX (snx-02) (fps) | 677 | 243 -64% | 351 -48% | 283 -58% | 31.4 -95% | 27.1 -96% | 27.4 -96% |
| 1900x1060 Solidworks (sw-03) (fps) | 319 | 185 -42% | 225 -29% | 207 -35% | 139 -56% | 126 -61% | 130 -59% |
| Media totale (Programma / Settaggio) | -46% /
-46% | -43% /
-42% | -44% /
-42% | -22% /
-20% | -29% /
-28% | -25% /
-23% |
Parametri di gioco
| Performance rating - Percent | |
| AMD Ryzen 7 7800X3D, NVIDIA GeForce RTX 4090 | |
| AMD Ryzen 9 7950X3D, NVIDIA GeForce RTX 4090 | |
| Intel Core i9-13900K, NVIDIA GeForce RTX 4090 | |
| AMD Ryzen 9 7950X, NVIDIA GeForce RTX 4090 | |
| AMD Ryzen 5 7600X, NVIDIA GeForce RTX 4090 | |
| Intel Core i7-13700K, NVIDIA GeForce RTX 4090 | |
| Intel Core i7-13700, NVIDIA GeForce RTX 4090 | |
| Intel Core i7-12700, NVIDIA GeForce RTX 4090 | |
| AMD Ryzen Threadripper PRO 7995WX, NVIDIA RTX 6000 Ada Generation | |
| Intel Core i5-13400, NVIDIA GeForce RTX 4090 | |
| Intel Core i5-12400F, NVIDIA GeForce RTX 4090 | |
| Far Cry 5 | |
| 1920x1080 Ultra Preset AA:T | |
| AMD Ryzen 7 7800X3D, NVIDIA GeForce RTX 4090 | |
| AMD Ryzen 9 7950X3D, NVIDIA GeForce RTX 4090 | |
| Intel Core i9-13900K, NVIDIA GeForce RTX 4090 | |
| AMD Ryzen 9 7950X, NVIDIA GeForce RTX 4090 | |
| AMD Ryzen 5 7600X, NVIDIA GeForce RTX 4090 | |
| Intel Core i7-13700, NVIDIA GeForce RTX 4090 | |
| Intel Core i7-13700K, NVIDIA GeForce RTX 4090 | |
| Intel Core i7-12700, NVIDIA GeForce RTX 4090 | |
| Intel Core i5-13400, NVIDIA GeForce RTX 4090 | |
| Intel Core i5-12400F, NVIDIA GeForce RTX 4090 | |
| AMD Ryzen Threadripper PRO 7995WX, NVIDIA RTX 6000 Ada Generation | |
| 1280x720 Low Preset AA:T | |
| AMD Ryzen 7 7800X3D, NVIDIA GeForce RTX 4090 | |
| AMD Ryzen 9 7950X3D, NVIDIA GeForce RTX 4090 | |
| Intel Core i9-13900K, NVIDIA GeForce RTX 4090 | |
| Intel Core i7-13700K, NVIDIA GeForce RTX 4090 | |
| AMD Ryzen 5 7600X, NVIDIA GeForce RTX 4090 | |
| AMD Ryzen 9 7950X, NVIDIA GeForce RTX 4090 | |
| Intel Core i7-13700, NVIDIA GeForce RTX 4090 | |
| Intel Core i7-12700, NVIDIA GeForce RTX 4090 | |
| Intel Core i5-13400, NVIDIA GeForce RTX 4090 | |
| Intel Core i5-12400F, NVIDIA GeForce RTX 4090 | |
| AMD Ryzen Threadripper PRO 7995WX, NVIDIA RTX 6000 Ada Generation | |
| X-Plane 11.11 | |
| 1920x1080 high (fps_test=3) | |
| AMD Ryzen 7 7800X3D, NVIDIA GeForce RTX 4090 | |
| AMD Ryzen 9 7950X3D, NVIDIA GeForce RTX 4090 | |
| Intel Core i9-13900K, NVIDIA GeForce RTX 4090 | |
| AMD Ryzen 9 7950X, NVIDIA GeForce RTX 4090 | |
| AMD Ryzen 5 7600X, NVIDIA GeForce RTX 4090 | |
| Intel Core i7-13700K, NVIDIA GeForce RTX 4090 | |
| Intel Core i7-13700, NVIDIA GeForce RTX 4090 | |
| AMD Ryzen Threadripper PRO 7995WX, NVIDIA RTX 6000 Ada Generation | |
| Intel Core i7-12700, NVIDIA GeForce RTX 4090 | |
| Intel Core i5-13400, NVIDIA GeForce RTX 4090 | |
| Intel Core i5-12400F, NVIDIA GeForce RTX 4090 | |
| 1280x720 low (fps_test=1) | |
| Intel Core i9-13900K, NVIDIA GeForce RTX 4090 | |
| AMD Ryzen 9 7950X3D, NVIDIA GeForce RTX 4090 | |
| Intel Core i7-13700K, NVIDIA GeForce RTX 4090 | |
| AMD Ryzen 9 7950X, NVIDIA GeForce RTX 4090 | |
| AMD Ryzen 7 7800X3D, NVIDIA GeForce RTX 4090 | |
| Intel Core i7-13700, NVIDIA GeForce RTX 4090 | |
| AMD Ryzen 5 7600X, NVIDIA GeForce RTX 4090 | |
| Intel Core i7-12700, NVIDIA GeForce RTX 4090 | |
| AMD Ryzen Threadripper PRO 7995WX, NVIDIA RTX 6000 Ada Generation | |
| Intel Core i5-13400, NVIDIA GeForce RTX 4090 | |
| Intel Core i5-12400F, NVIDIA GeForce RTX 4090 | |
| Final Fantasy XV Benchmark | |
| 1920x1080 High Quality | |
| AMD Ryzen 9 7950X, NVIDIA GeForce RTX 4090 | |
| AMD Ryzen 7 7800X3D, NVIDIA GeForce RTX 4090 | |
| Intel Core i9-13900K, NVIDIA GeForce RTX 4090 | |
| AMD Ryzen 9 7950X3D, NVIDIA GeForce RTX 4090 | |
| Intel Core i7-13700K, NVIDIA GeForce RTX 4090 | |
| AMD Ryzen 5 7600X, NVIDIA GeForce RTX 4090 | |
| Intel Core i7-13700, NVIDIA GeForce RTX 4090 | |
| Intel Core i7-12700, NVIDIA GeForce RTX 4090 | |
| AMD Ryzen Threadripper PRO 7995WX, NVIDIA RTX 6000 Ada Generation | |
| Intel Core i5-13400, NVIDIA GeForce RTX 4090 | |
| Intel Core i5-12400F, NVIDIA GeForce RTX 4090 | |
| 1280x720 Lite Quality | |
| Intel Core i9-13900K, NVIDIA GeForce RTX 4090 | |
| AMD Ryzen 9 7950X, NVIDIA GeForce RTX 4090 | |
| AMD Ryzen 5 7600X, NVIDIA GeForce RTX 4090 | |
| Intel Core i7-13700, NVIDIA GeForce RTX 4090 | |
| Intel Core i7-13700K, NVIDIA GeForce RTX 4090 | |
| AMD Ryzen 7 7800X3D, NVIDIA GeForce RTX 4090 | |
| AMD Ryzen 9 7950X3D, NVIDIA GeForce RTX 4090 | |
| Intel Core i7-12700, NVIDIA GeForce RTX 4090 | |
| AMD Ryzen Threadripper PRO 7995WX, NVIDIA RTX 6000 Ada Generation | |
| Intel Core i5-12400F, NVIDIA GeForce RTX 4090 | |
| Intel Core i5-13400, NVIDIA GeForce RTX 4090 | |
| Dota 2 Reborn | |
| 1920x1080 ultra (3/3) best looking | |
| AMD Ryzen 7 7800X3D, NVIDIA GeForce RTX 4090 | |
| AMD Ryzen 9 7950X3D, NVIDIA GeForce RTX 4090 | |
| AMD Ryzen 9 7950X, NVIDIA GeForce RTX 4090 | |
| Intel Core i9-13900K, NVIDIA GeForce RTX 4090 | |
| AMD Ryzen 5 7600X, NVIDIA GeForce RTX 4090 | |
| Intel Core i7-13700K, NVIDIA GeForce RTX 4090 | |
| Intel Core i7-13700, NVIDIA GeForce RTX 4090 | |
| Intel Core i7-12700, NVIDIA GeForce RTX 4090 | |
| Intel Core i5-13400, NVIDIA GeForce RTX 4090 | |
| Intel Core i5-12400F, NVIDIA GeForce RTX 4090 | |
| AMD Ryzen Threadripper PRO 7995WX, NVIDIA RTX 6000 Ada Generation | |
| 1280x720 min (0/3) fastest | |
| AMD Ryzen 7 7800X3D, NVIDIA GeForce RTX 4090 | |
| AMD Ryzen 9 7950X3D, NVIDIA GeForce RTX 4090 | |
| AMD Ryzen 9 7950X, NVIDIA GeForce RTX 4090 | |
| Intel Core i9-13900K, NVIDIA GeForce RTX 4090 | |
| AMD Ryzen 5 7600X, NVIDIA GeForce RTX 4090 | |
| Intel Core i7-13700K, NVIDIA GeForce RTX 4090 | |
| Intel Core i7-13700, NVIDIA GeForce RTX 4090 | |
| Intel Core i7-12700, NVIDIA GeForce RTX 4090 | |
| Intel Core i5-12400F, NVIDIA GeForce RTX 4090 | |
| Intel Core i5-13400, NVIDIA GeForce RTX 4090 | |
| AMD Ryzen Threadripper PRO 7995WX, NVIDIA RTX 6000 Ada Generation | |
| The Witcher 3 | |
| 1920x1080 Ultra Graphics & Postprocessing (HBAO+) | |
| Intel Core i9-13900K, NVIDIA GeForce RTX 4090 | |
| AMD Ryzen 9 7950X, NVIDIA GeForce RTX 4090 | |
| AMD Ryzen 7 7800X3D, NVIDIA GeForce RTX 4090 | |
| AMD Ryzen 5 7600X, NVIDIA GeForce RTX 4090 | |
| Intel Core i7-13700K, NVIDIA GeForce RTX 4090 | |
| Intel Core i7-13700, NVIDIA GeForce RTX 4090 | |
| AMD Ryzen 9 7950X3D, NVIDIA GeForce RTX 4090 | |
| Intel Core i7-12700, NVIDIA GeForce RTX 4090 | |
| Intel Core i5-13400, NVIDIA GeForce RTX 4090 | |
| Intel Core i5-12400F, NVIDIA GeForce RTX 4090 | |
| AMD Ryzen Threadripper PRO 7995WX, NVIDIA RTX 6000 Ada Generation | |
| 1024x768 Low Graphics & Postprocessing | |
| AMD Ryzen 9 7950X3D, NVIDIA GeForce RTX 4090 | |
| AMD Ryzen 7 7800X3D, NVIDIA GeForce RTX 4090 | |
| AMD Ryzen 9 7950X, NVIDIA GeForce RTX 4090 | |
| Intel Core i9-13900K, NVIDIA GeForce RTX 4090 | |
| AMD Ryzen 5 7600X, NVIDIA GeForce RTX 4090 | |
| Intel Core i7-13700K, NVIDIA GeForce RTX 4090 | |
| Intel Core i7-13700, NVIDIA GeForce RTX 4090 | |
| AMD Ryzen Threadripper PRO 7995WX, NVIDIA RTX 6000 Ada Generation | |
| Intel Core i7-12700, NVIDIA GeForce RTX 4090 | |
| Intel Core i5-13400, NVIDIA GeForce RTX 4090 | |
| Intel Core i5-12400F, NVIDIA GeForce RTX 4090 | |
| Borderlands 3 | |
| 1280x720 Very Low Overall Quality (DX11) | |
| AMD Ryzen 7 7800X3D, NVIDIA GeForce RTX 4090 | |
| AMD Ryzen 9 7950X3D, NVIDIA GeForce RTX 4090 | |
| Intel Core i9-13900K, NVIDIA GeForce RTX 4090 | |
| AMD Ryzen 9 7950X, NVIDIA GeForce RTX 4090 | |
| AMD Ryzen 5 7600X, NVIDIA GeForce RTX 4090 | |
| Intel Core i7-13700, NVIDIA GeForce RTX 4090 | |
| Intel Core i7-13700K, NVIDIA GeForce RTX 4090 | |
| Intel Core i7-12700, NVIDIA GeForce RTX 4090 | |
| AMD Ryzen Threadripper PRO 7995WX, NVIDIA RTX 6000 Ada Generation | |
| Intel Core i5-13400, NVIDIA GeForce RTX 4090 | |
| Intel Core i5-12400F, NVIDIA GeForce RTX 4090 | |
| 1920x1080 Badass Overall Quality (DX11) | |
| AMD Ryzen 9 7950X3D, NVIDIA GeForce RTX 4090 | |
| AMD Ryzen 7 7800X3D, NVIDIA GeForce RTX 4090 | |
| AMD Ryzen 9 7950X, NVIDIA GeForce RTX 4090 | |
| Intel Core i9-13900K, NVIDIA GeForce RTX 4090 | |
| AMD Ryzen 5 7600X, NVIDIA GeForce RTX 4090 | |
| Intel Core i7-13700K, NVIDIA GeForce RTX 4090 | |
| Intel Core i7-13700, NVIDIA GeForce RTX 4090 | |
| Intel Core i7-12700, NVIDIA GeForce RTX 4090 | |
| AMD Ryzen Threadripper PRO 7995WX, NVIDIA RTX 6000 Ada Generation | |
| Intel Core i5-13400, NVIDIA GeForce RTX 4090 | |
| Intel Core i5-12400F, NVIDIA GeForce RTX 4090 | |
| Far Cry New Dawn | |
| 1280x720 Low Preset | |
| AMD Ryzen 7 7800X3D, NVIDIA GeForce RTX 4090 | |
| AMD Ryzen 9 7950X3D, NVIDIA GeForce RTX 4090 | |
| Intel Core i9-13900K, NVIDIA GeForce RTX 4090 | |
| Intel Core i7-13700, NVIDIA GeForce RTX 4090 | |
| Intel Core i7-13700K, NVIDIA GeForce RTX 4090 | |
| AMD Ryzen 9 7950X, NVIDIA GeForce RTX 4090 | |
| AMD Ryzen 5 7600X, NVIDIA GeForce RTX 4090 | |
| Intel Core i7-12700, NVIDIA GeForce RTX 4090 | |
| Intel Core i5-13400, NVIDIA GeForce RTX 4090 | |
| Intel Core i5-12400F, NVIDIA GeForce RTX 4090 | |
| AMD Ryzen Threadripper PRO 7995WX, NVIDIA RTX 6000 Ada Generation | |
| 1920x1080 Ultra Preset | |
| AMD Ryzen 7 7800X3D, NVIDIA GeForce RTX 4090 | |
| AMD Ryzen 9 7950X3D, NVIDIA GeForce RTX 4090 | |
| Intel Core i9-13900K, NVIDIA GeForce RTX 4090 | |
| AMD Ryzen 9 7950X, NVIDIA GeForce RTX 4090 | |
| Intel Core i7-13700K, NVIDIA GeForce RTX 4090 | |
| AMD Ryzen 5 7600X, NVIDIA GeForce RTX 4090 | |
| Intel Core i7-13700, NVIDIA GeForce RTX 4090 | |
| Intel Core i7-12700, NVIDIA GeForce RTX 4090 | |
| Intel Core i5-13400, NVIDIA GeForce RTX 4090 | |
| Intel Core i5-12400F, NVIDIA GeForce RTX 4090 | |
| AMD Ryzen Threadripper PRO 7995WX, NVIDIA RTX 6000 Ada Generation | |
| Shadow of the Tomb Raider | |
| 1280x720 Lowest Preset | |
| AMD Ryzen 7 7800X3D, NVIDIA GeForce RTX 4090 | |
| AMD Ryzen 9 7950X3D, NVIDIA GeForce RTX 4090 | |
| AMD Ryzen 9 7950X, NVIDIA GeForce RTX 4090 | |
| AMD Ryzen 5 7600X, NVIDIA GeForce RTX 4090 | |
| Intel Core i9-13900K, NVIDIA GeForce RTX 4090 | |
| Intel Core i7-13700, NVIDIA GeForce RTX 4090 | |
| Intel Core i7-13700K, NVIDIA GeForce RTX 4090 | |
| AMD Ryzen Threadripper PRO 7995WX, NVIDIA RTX 6000 Ada Generation | |
| Intel Core i7-12700, NVIDIA GeForce RTX 4090 | |
| Intel Core i5-13400, NVIDIA GeForce RTX 4090 | |
| Intel Core i5-12400F, NVIDIA GeForce RTX 4090 | |
| 1920x1080 Highest Preset AA:T | |
| AMD Ryzen 7 7800X3D, NVIDIA GeForce RTX 4090 | |
| AMD Ryzen 9 7950X3D, NVIDIA GeForce RTX 4090 | |
| AMD Ryzen 9 7950X, NVIDIA GeForce RTX 4090 | |
| Intel Core i9-13900K, NVIDIA GeForce RTX 4090 | |
| AMD Ryzen 5 7600X, NVIDIA GeForce RTX 4090 | |
| Intel Core i7-13700K, NVIDIA GeForce RTX 4090 | |
| Intel Core i7-13700, NVIDIA GeForce RTX 4090 | |
| AMD Ryzen Threadripper PRO 7995WX, NVIDIA RTX 6000 Ada Generation | |
| Intel Core i7-12700, NVIDIA GeForce RTX 4090 | |
| Intel Core i5-13400, NVIDIA GeForce RTX 4090 | |
| Intel Core i5-12400F, NVIDIA GeForce RTX 4090 | |
| Tiny Tina's Wonderlands | |
| 1920x1080 Low Preset (DX12) | |
| AMD Ryzen 7 7800X3D, NVIDIA GeForce RTX 4090 | |
| AMD Ryzen 9 7950X3D, NVIDIA GeForce RTX 4090 | |
| AMD Ryzen 9 7950X, NVIDIA GeForce RTX 4090 | |
| AMD Ryzen 5 7600X, NVIDIA GeForce RTX 4090 | |
| Intel Core i9-13900K, NVIDIA GeForce RTX 4090 | |
| Intel Core i7-13700, NVIDIA GeForce RTX 4090 | |
| Intel Core i7-13700K, NVIDIA GeForce RTX 4090 | |
| AMD Ryzen Threadripper PRO 7995WX, NVIDIA RTX 6000 Ada Generation | |
| Intel Core i7-12700, NVIDIA GeForce RTX 4090 | |
| Intel Core i5-13400, NVIDIA GeForce RTX 4090 | |
| Intel Core i5-12400F, NVIDIA GeForce RTX 4090 | |
| 1920x1080 Badass Preset (DX12) | |
| AMD Ryzen 7 7800X3D, NVIDIA GeForce RTX 4090 | |
| AMD Ryzen 9 7950X3D, NVIDIA GeForce RTX 4090 | |
| AMD Ryzen 9 7950X, NVIDIA GeForce RTX 4090 | |
| AMD Ryzen 5 7600X, NVIDIA GeForce RTX 4090 | |
| Intel Core i9-13900K, NVIDIA GeForce RTX 4090 | |
| Intel Core i7-13700, NVIDIA GeForce RTX 4090 | |
| Intel Core i7-13700K, NVIDIA GeForce RTX 4090 | |
| Intel Core i7-12700, NVIDIA GeForce RTX 4090 | |
| AMD Ryzen Threadripper PRO 7995WX, NVIDIA RTX 6000 Ada Generation | |
| Intel Core i5-13400, NVIDIA GeForce RTX 4090 | |
| Intel Core i5-12400F, NVIDIA GeForce RTX 4090 | |
| Metro Exodus | |
| 1280x720 Low Quality AF:4x | |
| AMD Ryzen 7 7800X3D, NVIDIA GeForce RTX 4090 | |
| AMD Ryzen 5 7600X, NVIDIA GeForce RTX 4090 | |
| AMD Ryzen 9 7950X, NVIDIA GeForce RTX 4090 | |
| AMD Ryzen 9 7950X3D, NVIDIA GeForce RTX 4090 | |
| Intel Core i7-13700, NVIDIA GeForce RTX 4090 | |
| Intel Core i9-13900K, NVIDIA GeForce RTX 4090 | |
| Intel Core i7-13700K, NVIDIA GeForce RTX 4090 | |
| Intel Core i7-12700, NVIDIA GeForce RTX 4090 | |
| Intel Core i5-12400F, NVIDIA GeForce RTX 4090 | |
| Intel Core i5-13400, NVIDIA GeForce RTX 4090 | |
| AMD Ryzen Threadripper PRO 7995WX, NVIDIA RTX 6000 Ada Generation | |
| 1920x1080 Ultra Quality AF:16x | |
| AMD Ryzen 7 7800X3D, NVIDIA GeForce RTX 4090 | |
| AMD Ryzen 9 7950X, NVIDIA GeForce RTX 4090 | |
| AMD Ryzen 5 7600X, NVIDIA GeForce RTX 4090 | |
| AMD Ryzen 9 7950X3D, NVIDIA GeForce RTX 4090 | |
| Intel Core i9-13900K, NVIDIA GeForce RTX 4090 | |
| Intel Core i7-13700, NVIDIA GeForce RTX 4090 | |
| Intel Core i7-13700K, NVIDIA GeForce RTX 4090 | |
| Intel Core i7-12700, NVIDIA GeForce RTX 4090 | |
| Intel Core i5-13400, NVIDIA GeForce RTX 4090 | |
| Intel Core i5-12400F, NVIDIA GeForce RTX 4090 | |
| AMD Ryzen Threadripper PRO 7995WX, NVIDIA RTX 6000 Ada Generation | |
| basso | medio | alto | ultra | QHD | 4K DLSS | 4K | |
|---|---|---|---|---|---|---|---|
| The Witcher 3 (2015) | 661 | 579 | 489 | 260 | 219 | 183.5 | |
| Dota 2 Reborn (2015) | 168.7 | 159 | 164.8 | 153.6 | 153.1 | ||
| Final Fantasy XV Benchmark (2018) | 228 | 228 | 201 | 194.7 | 124.2 | ||
| X-Plane 11.11 (2018) | 163.5 | 155.6 | 123.3 | 100.7 | |||
| Far Cry 5 (2018) | 144 | 130 | 126 | 118 | 118 | 115 | |
| Shadow of the Tomb Raider (2018) | 265 | 250 | 240 | 233 | 219 | 127.9 | |
| Far Cry New Dawn (2019) | 127 | 113 | 109 | 100 | 99 | 98 | |
| Metro Exodus (2019) | 167.6 | 125 | 114.4 | 103.6 | 94.5 | 89.8 | |
| Borderlands 3 (2019) | 181.9 | 156.5 | 153.2 | 141 | 138.1 | 87.7 | |
| Horizon Zero Dawn (2020) | 238 | 220 | 208 | 199 | 192 | 173 | 125 |
| Far Cry 6 (2021) | 177.8 | 159.2 | 143.5 | 142.9 | 138.9 | 109.9 | |
| Tiny Tina's Wonderlands (2022) | 334 | 265 | 232 | 219 | 175.3 | 87.3 | |
| A Plague Tale Requiem (2022) | 183.6 | 169.3 | 160.6 | 131 | 94.2 | 108.4 | 54 |
| The Witcher 3 v4 (2023) | 287 | 248 | 219 | 210 | 208 | 128.1 | |
| Starfield (2023) | 140.5 | 129 | 112.6 | 103.9 | 89.1 | 62.9 | |
| Cyberpunk 2077 (2023) | 164.2 | 162.5 | 155.3 | 147.2 | 131 | 60.3 | |
| Total War Pharaoh (2023) | 330.6 | 215.3 | 157.5 | 140.9 | 140.7 | 112.7 |
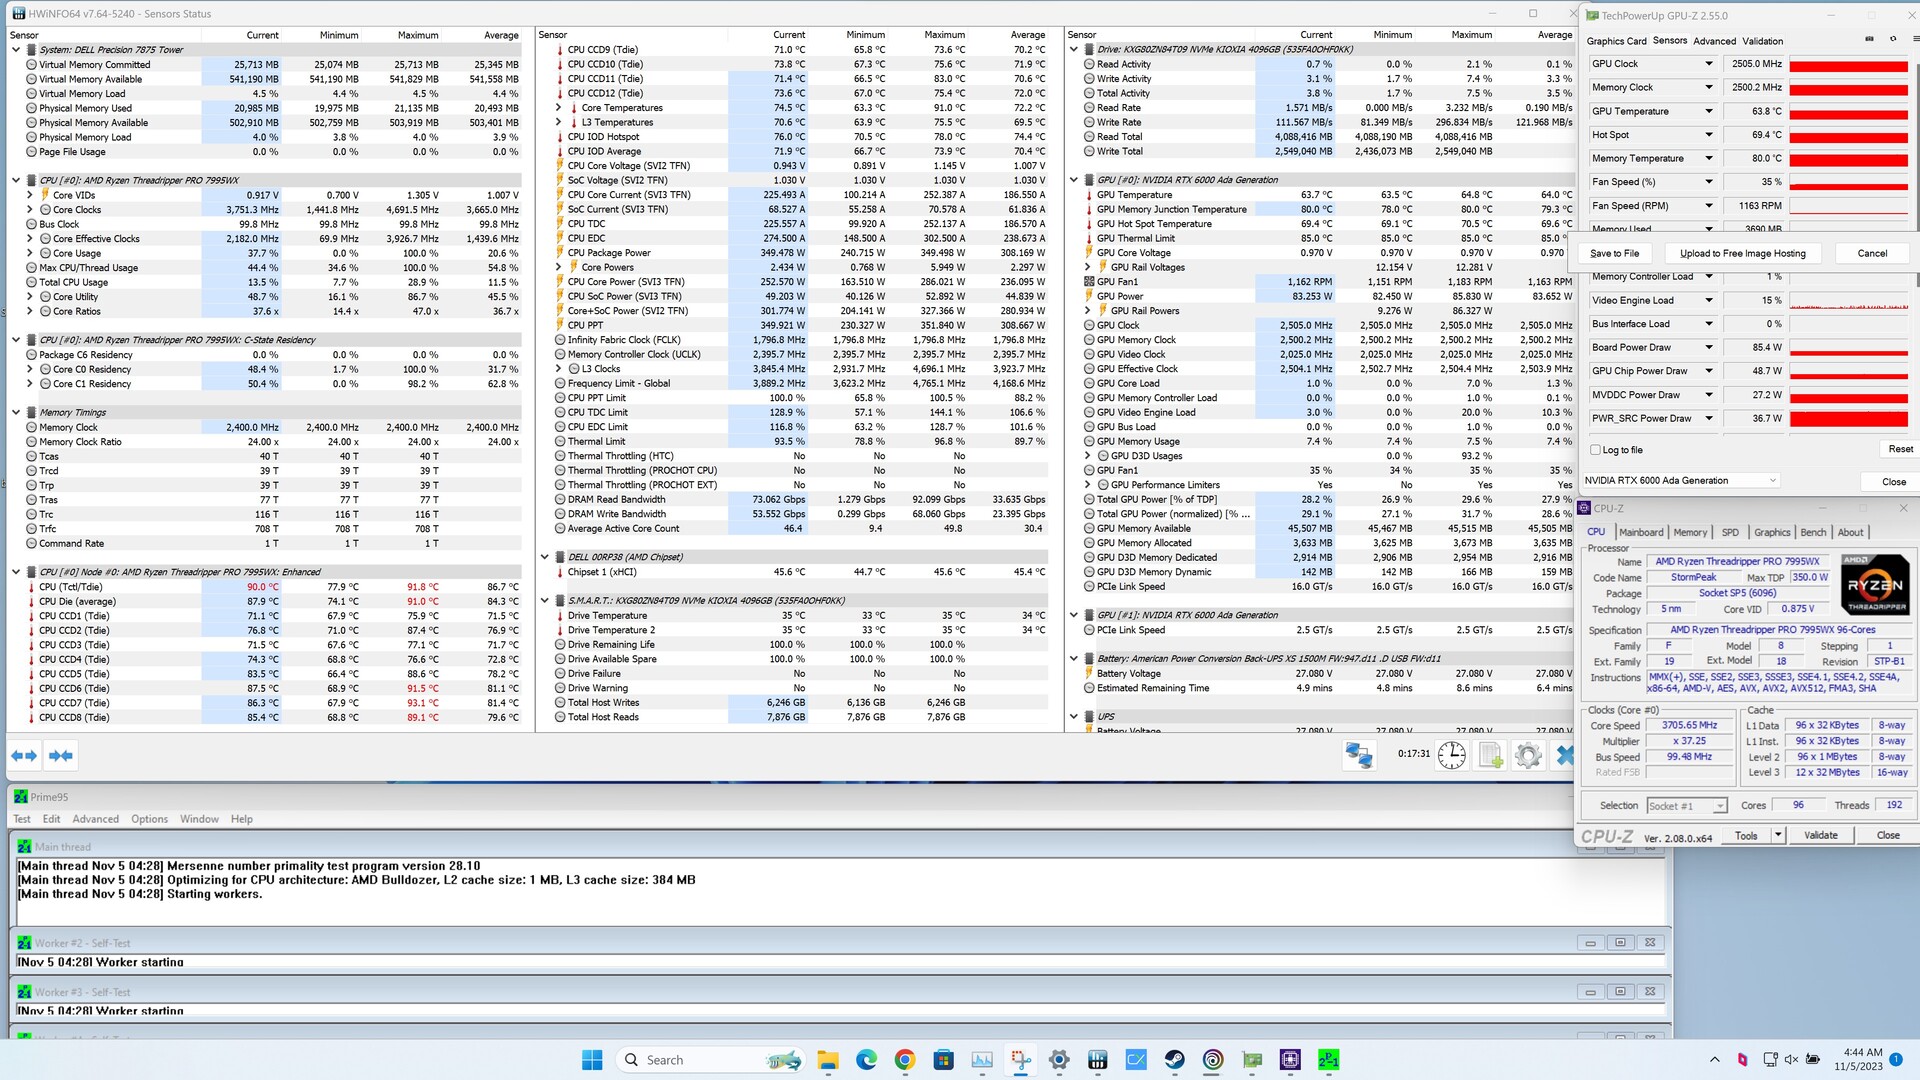
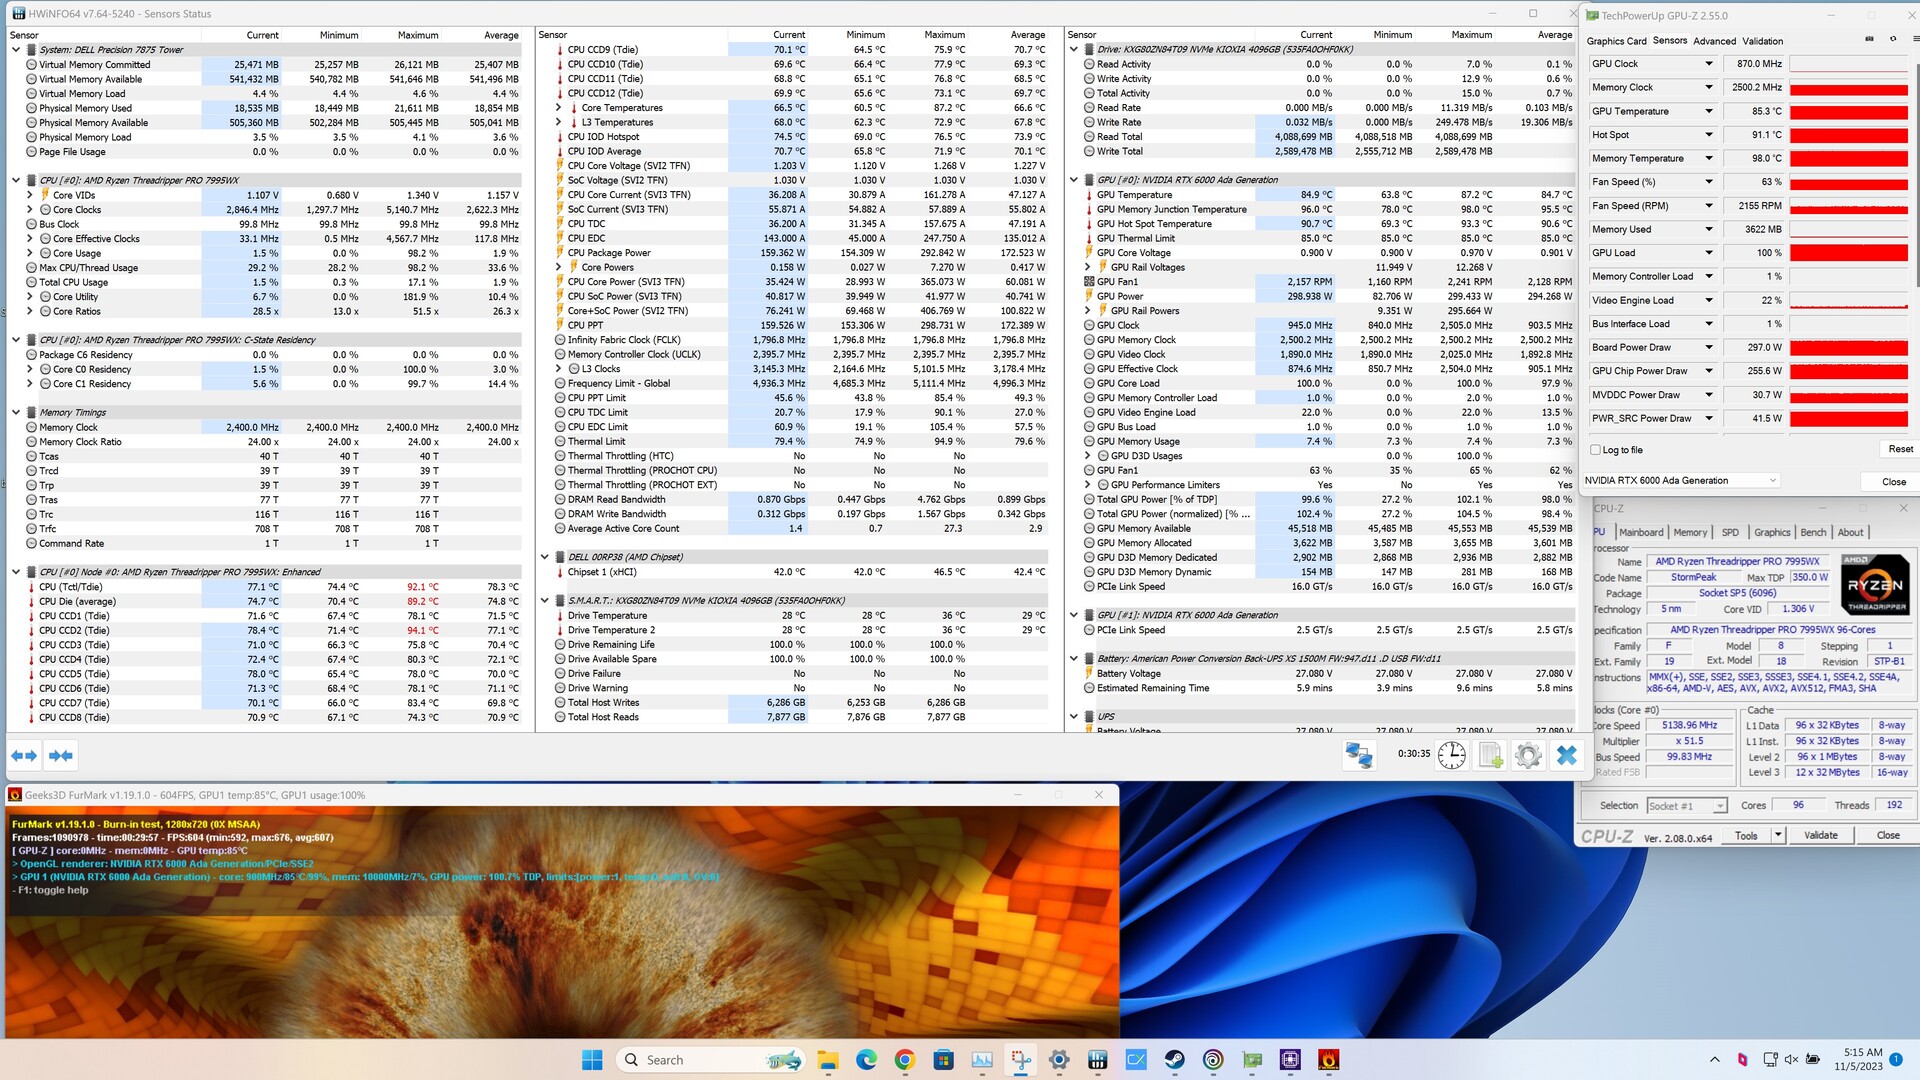
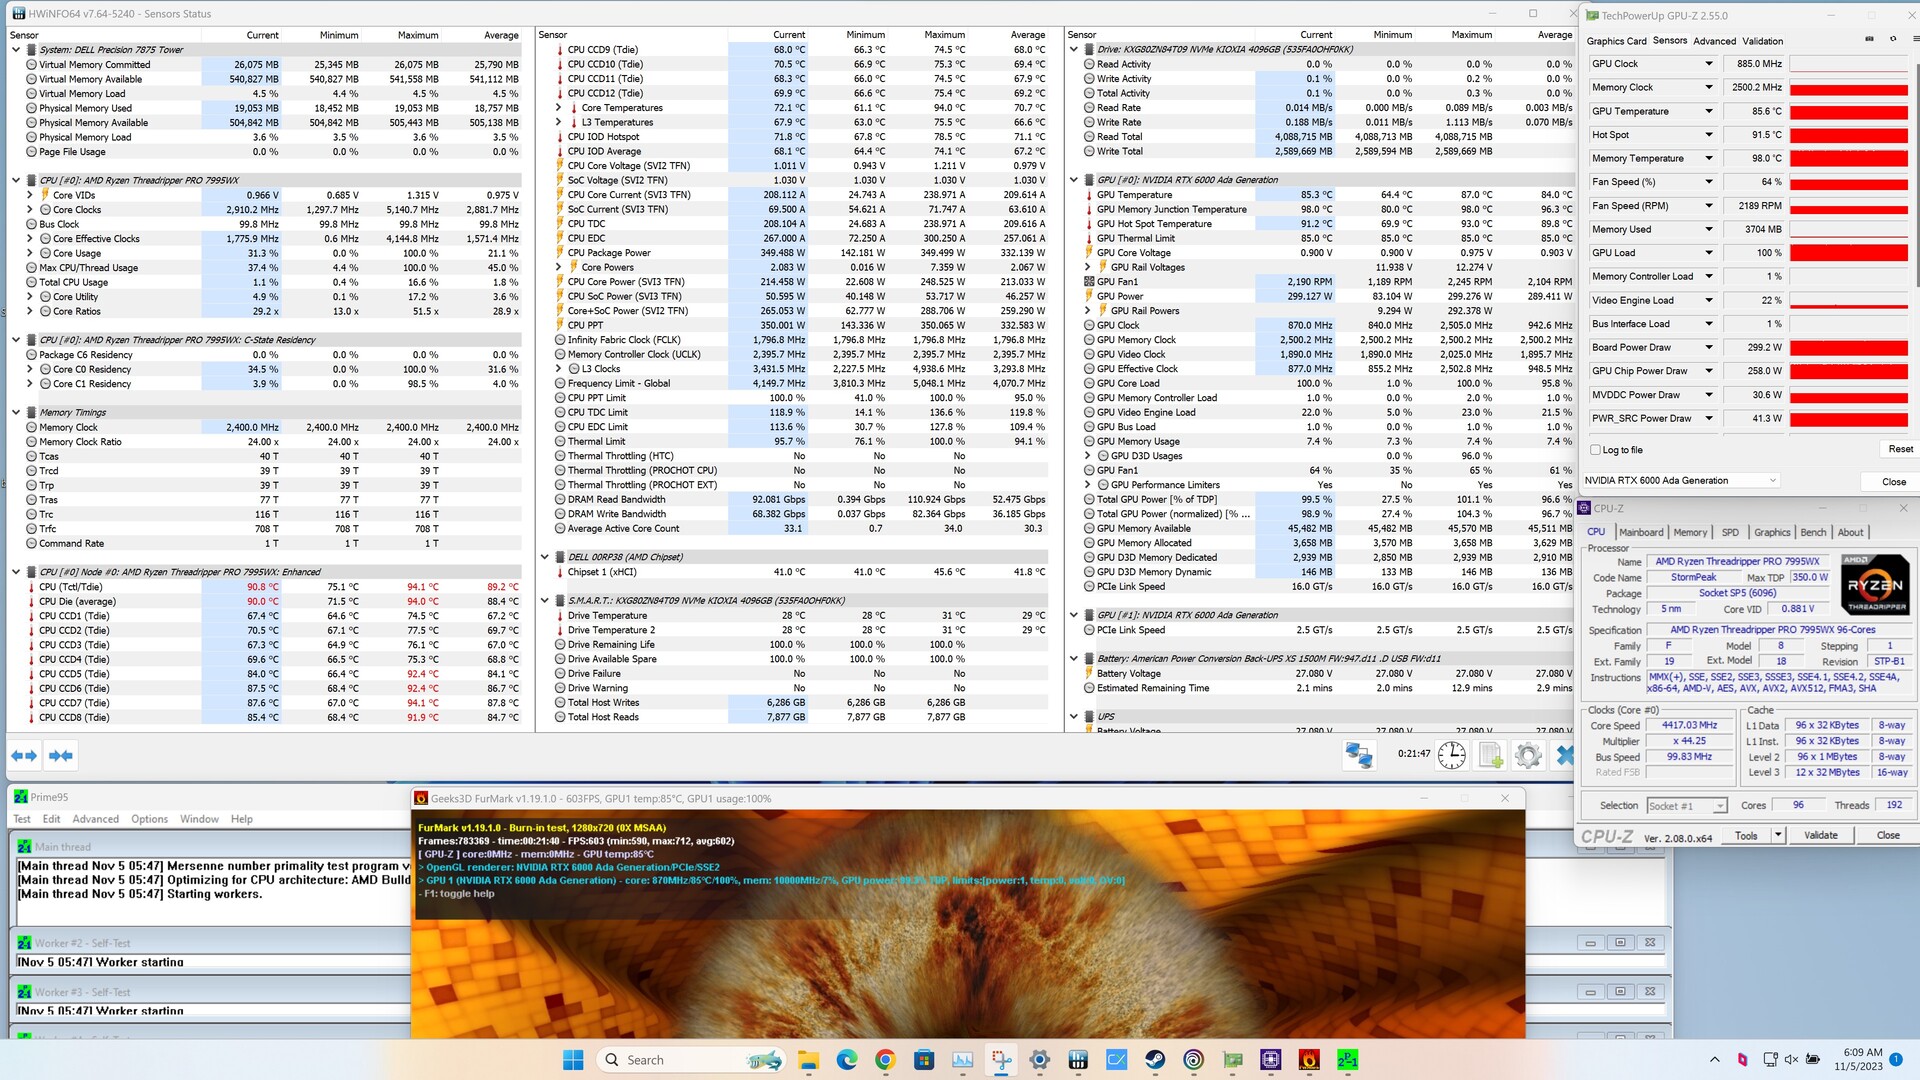
Emissioni
A causa delle condizioni di prova, i valori di emissione sono derivati esclusivamente dai risultati di HWiNFO. Il sistema è stato sottoposto a uno stress test in tre diversi scenari. Nel test di stress Prime95, AMD Ryzen Threadripper Pro 7995WX ha dimostrato un funzionamento stabile. Operando a 3,6 GHz, il processore ha superato costantemente il clock di base di 2,5 GHz. La temperatura si è stabilizzata intorno agli 87 °C, raggiungendo poco meno di 92 °C al suo picco. La generazione Nvidia RTX 6000 Ada ha mantenuto le massime prestazioni per tutta la durata dello stress test, senza alcuna perdita di prestazioni osservata a 300 watt. Tuttavia, abbiamo registrato un valore hot spot di 91 °C per la GPU, mentre la VRAM ha raggiunto i 98 °C. Quando la CPU e la GPU sono state caricate simultaneamente, non ci sono state differenze significative. La temperatura media dell'AMD Ryzen Threadripper Pro 7995WX è aumentata leggermente fino a 89 °C.
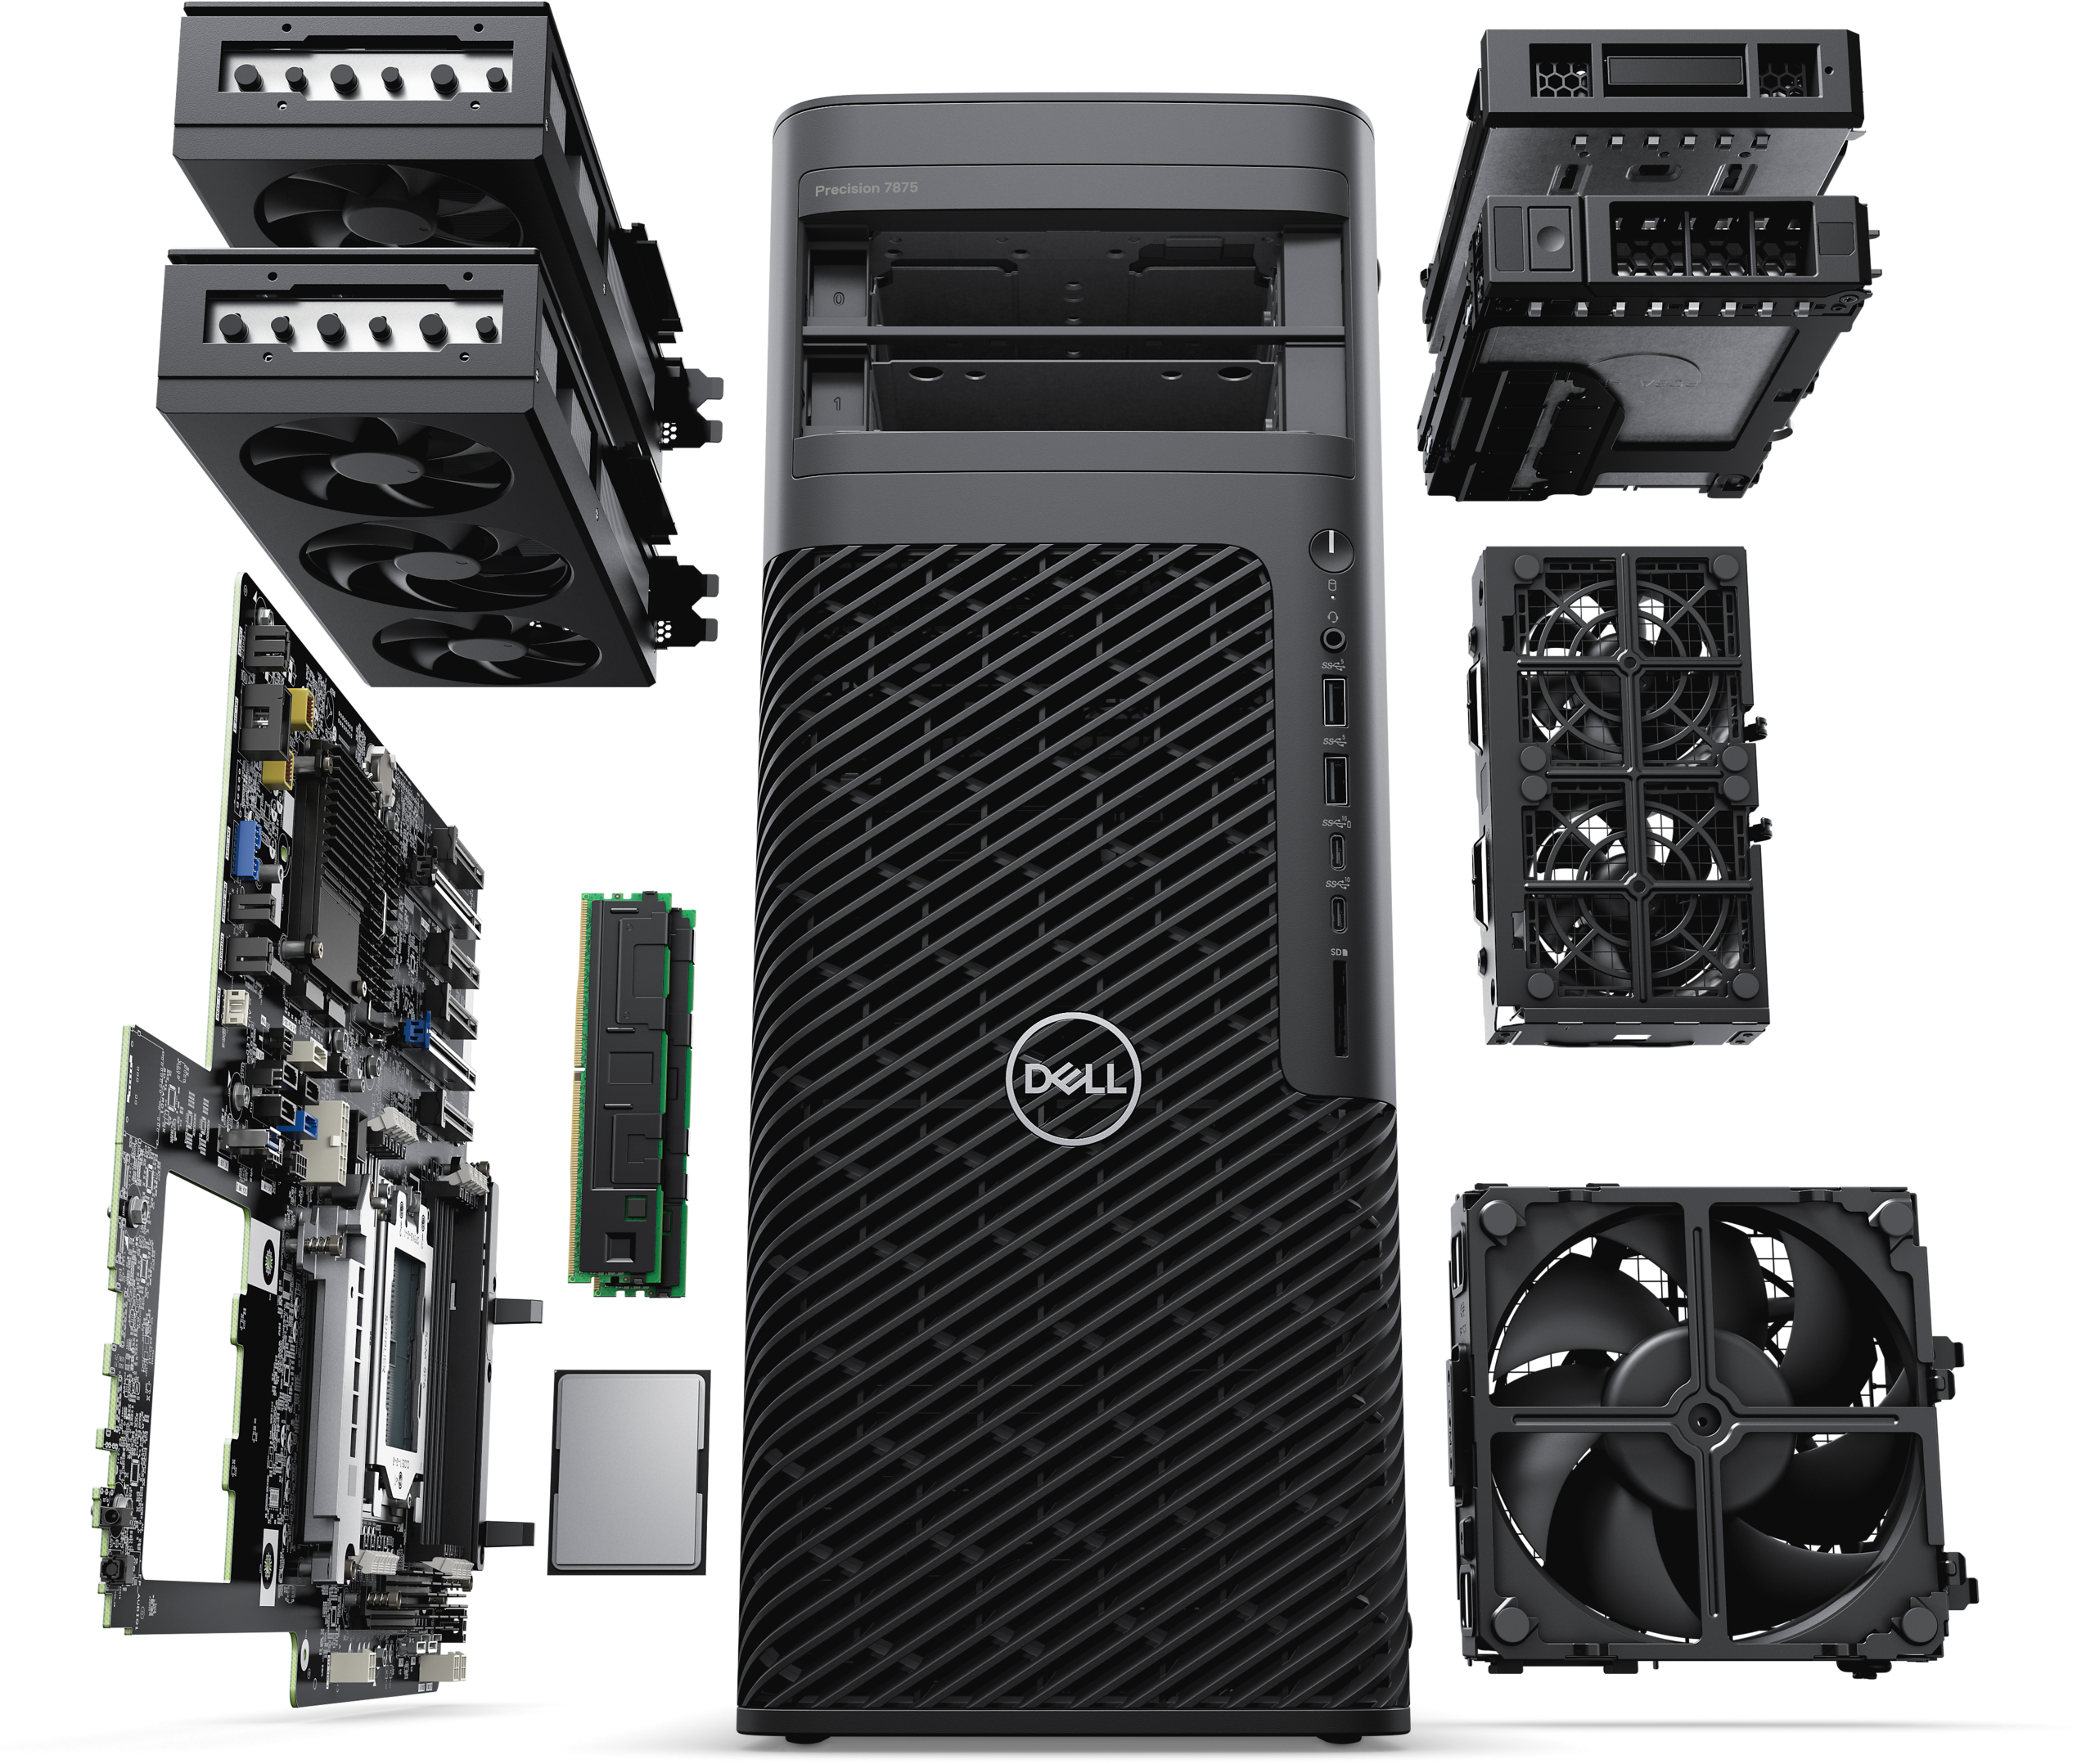
Il concetto di raffreddamento della Workstation Dell Precision 7875 Tower adotta un design a camera. L'area superiore copre il processore e la RAM, dirigendo il flusso d'aria direttamente sui componenti per il raffreddamento. Le due schede grafiche sono situate nell'area inferiore e ricevono aria fresca da una ventola montata frontalmente. Vale la pena notare che Nvidia ha dotato la generazione RTX 6000 Ada di un design a soffiante, che espelle il calore residuo direttamente dall'alloggiamento. Questo concetto è stato talvolta utilizzato anche per le schede grafiche consumer.
Pro
Contro
Verdetto - Una workstation di fascia alta al prezzo di un'auto di fascia media
La Workstation Tower Dell Precision 7875 integra i processori per workstation più veloci di AMD, stabilendo nuovi parametri di riferimento in termini di prestazioni pure. Alimentato dall'architettura Zen4, AMD Ryzen Threadripper Pro 7995WX offre una notevole potenza di calcolo e combina fino a 96 core sotto il diffusore di calore, un risultato rivoluzionario. Di conseguenza, il processore può gestire contemporaneamente fino a 192 thread. Abbinata a 512 GB di RAM e a due schede grafiche Nvidia RTX 6000 Ada generation, questa workstation può affrontare efficacemente progetti ad alta intensità di risorse.
Tutti questi componenti sono alloggiati in un case a torre relativamente compatto, dotato di un sofisticato sistema di raffreddamento. Durante i test, non sono state raggiunte temperature critiche superiori a 100°C, affermando l'efficacia del concetto di raffreddamento e garantendo un funzionamento regolare anche a pieno carico.
Equipaggiata con AMD Ryzen Threadripper Pro 7995WX, la Workstation Dell Precision 7875 Tower vanta il processore più veloce attualmente disponibile per le applicazioni multi-core.
Insieme al processore, la scheda grafica integrata è un elemento cruciale di un PC workstation. Il modello di punta di Nvidia, la generazione RTX 6000 Ada, offre un'ampia potenza. Rispetto a GeForce RTX 4090 di Nvidia, il modello professionale, dotato della versione completa di AD102, può offrire prestazioni significativamente superiori, a condizione che sia presente un supporto driver efficace durante i vari test di rendering.
Anche se l'azienda non ha ancora definito i dettagli dei prezzi, il negozio interno di Dell permette agli utenti di configurare la Workstation Dell Precision 7875 Tower in base alle loro preferenze. I modelli entry-level partono da soli ~ 3.000 dollari USA. Per coloro che desiderano spingersi oltre i limiti, è possibile assemblare un sistema che costa oltre 50.000 dollari.
Prezzo e disponibilità
La Tower Workstation Dell Precision 7875, nella configurazione qui testata, non è attualmente disponibile. Tuttavia, la Tower Workstation Dell Precision 7875 con modelli Threadripper della generazione 5000 è disponibile sulla pagina del negozio del produttore. I prezzi per il modello base partono da circa 3.000 dollari USA.
Transparency
La selezione dei dispositivi da recensire viene effettuata dalla nostra redazione. Il campione di prova è stato fornito all'autore come prestito dal produttore o dal rivenditore ai fini di questa recensione. L'istituto di credito non ha avuto alcuna influenza su questa recensione, né il produttore ne ha ricevuto una copia prima della pubblicazione. Non vi era alcun obbligo di pubblicare questa recensione. In quanto società mediatica indipendente, Notebookcheck non è soggetta all'autorità di produttori, rivenditori o editori.
Ecco come Notebookcheck esegue i test
Ogni anno, Notebookcheck esamina in modo indipendente centinaia di laptop e smartphone utilizzando procedure standardizzate per garantire che tutti i risultati siano comparabili. Da circa 20 anni sviluppiamo continuamente i nostri metodi di prova e nel frattempo stabiliamo gli standard di settore. Nei nostri laboratori di prova, tecnici ed editori esperti utilizzano apparecchiature di misurazione di alta qualità. Questi test comportano un processo di validazione in più fasi. Il nostro complesso sistema di valutazione si basa su centinaia di misurazioni e parametri di riferimento ben fondati, che mantengono l'obiettività.
