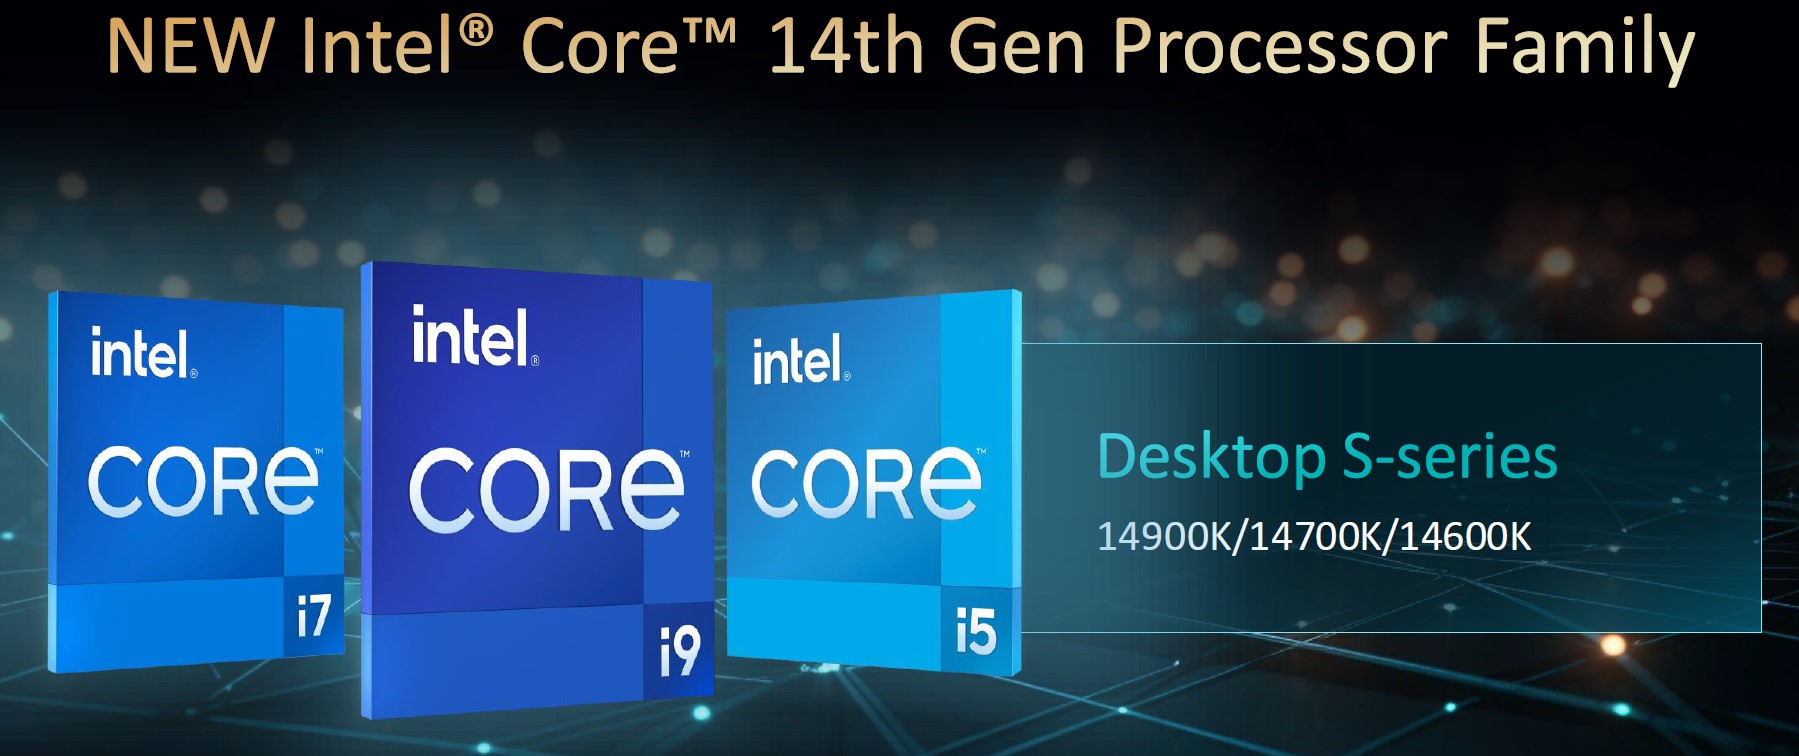
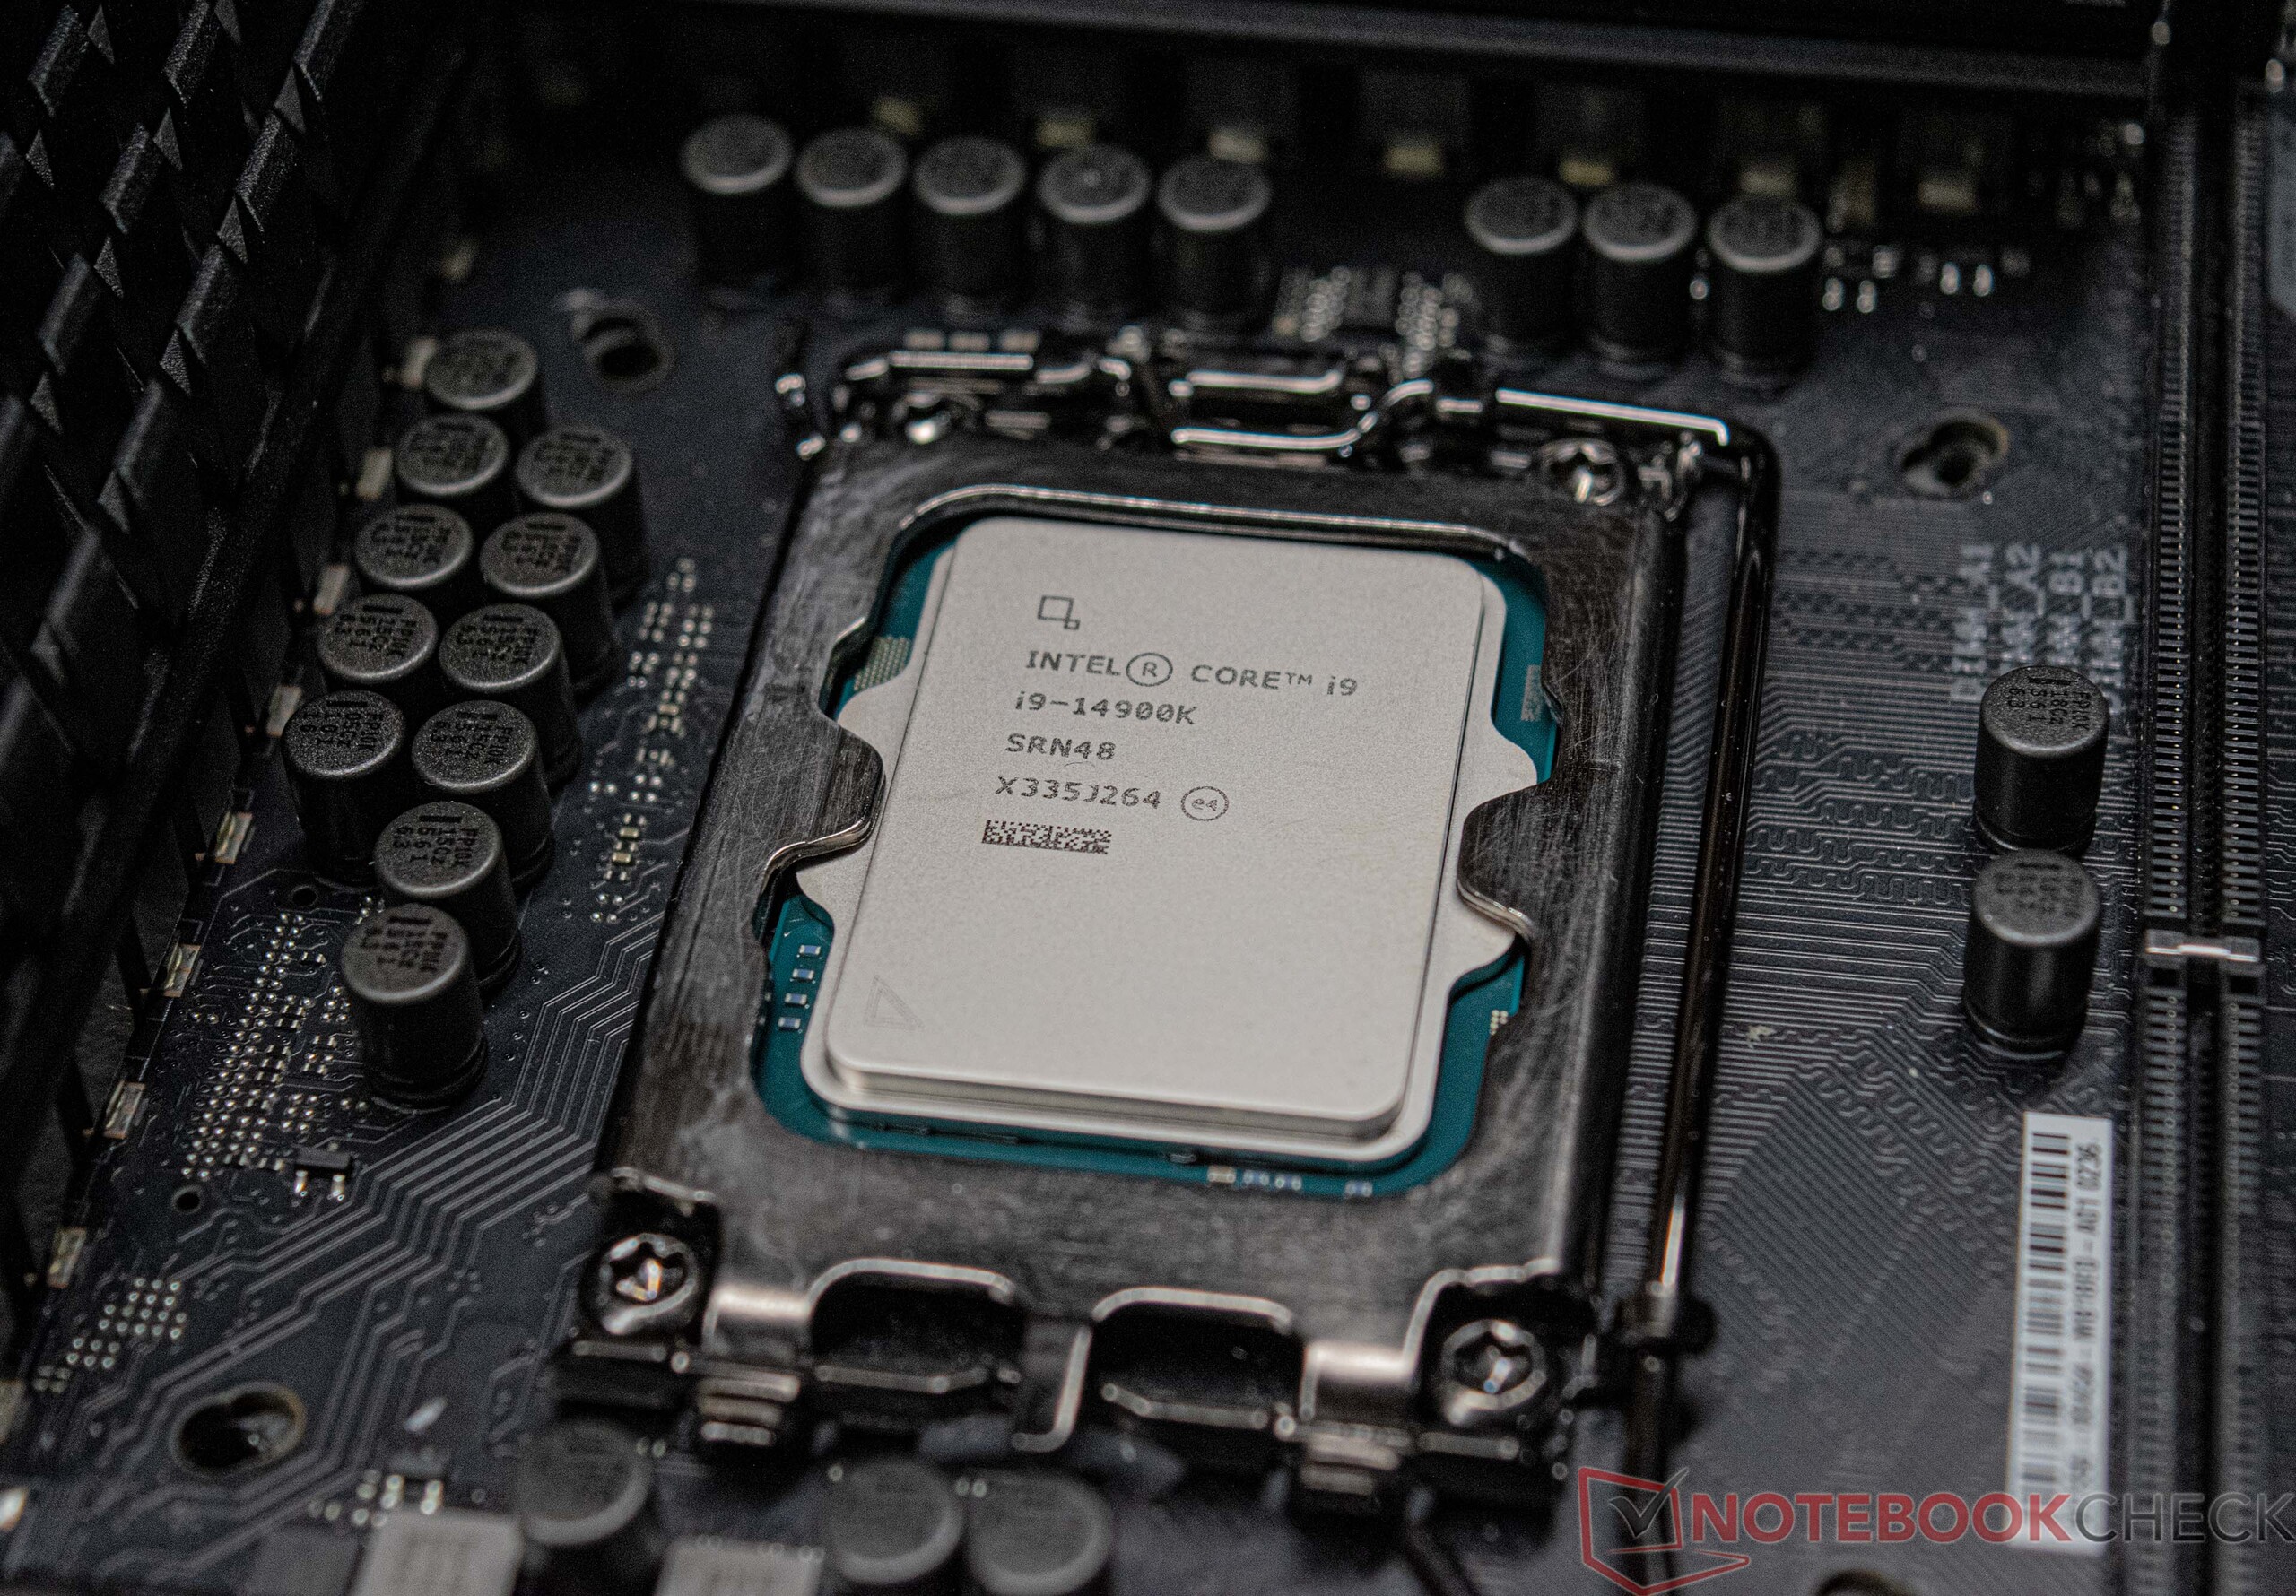
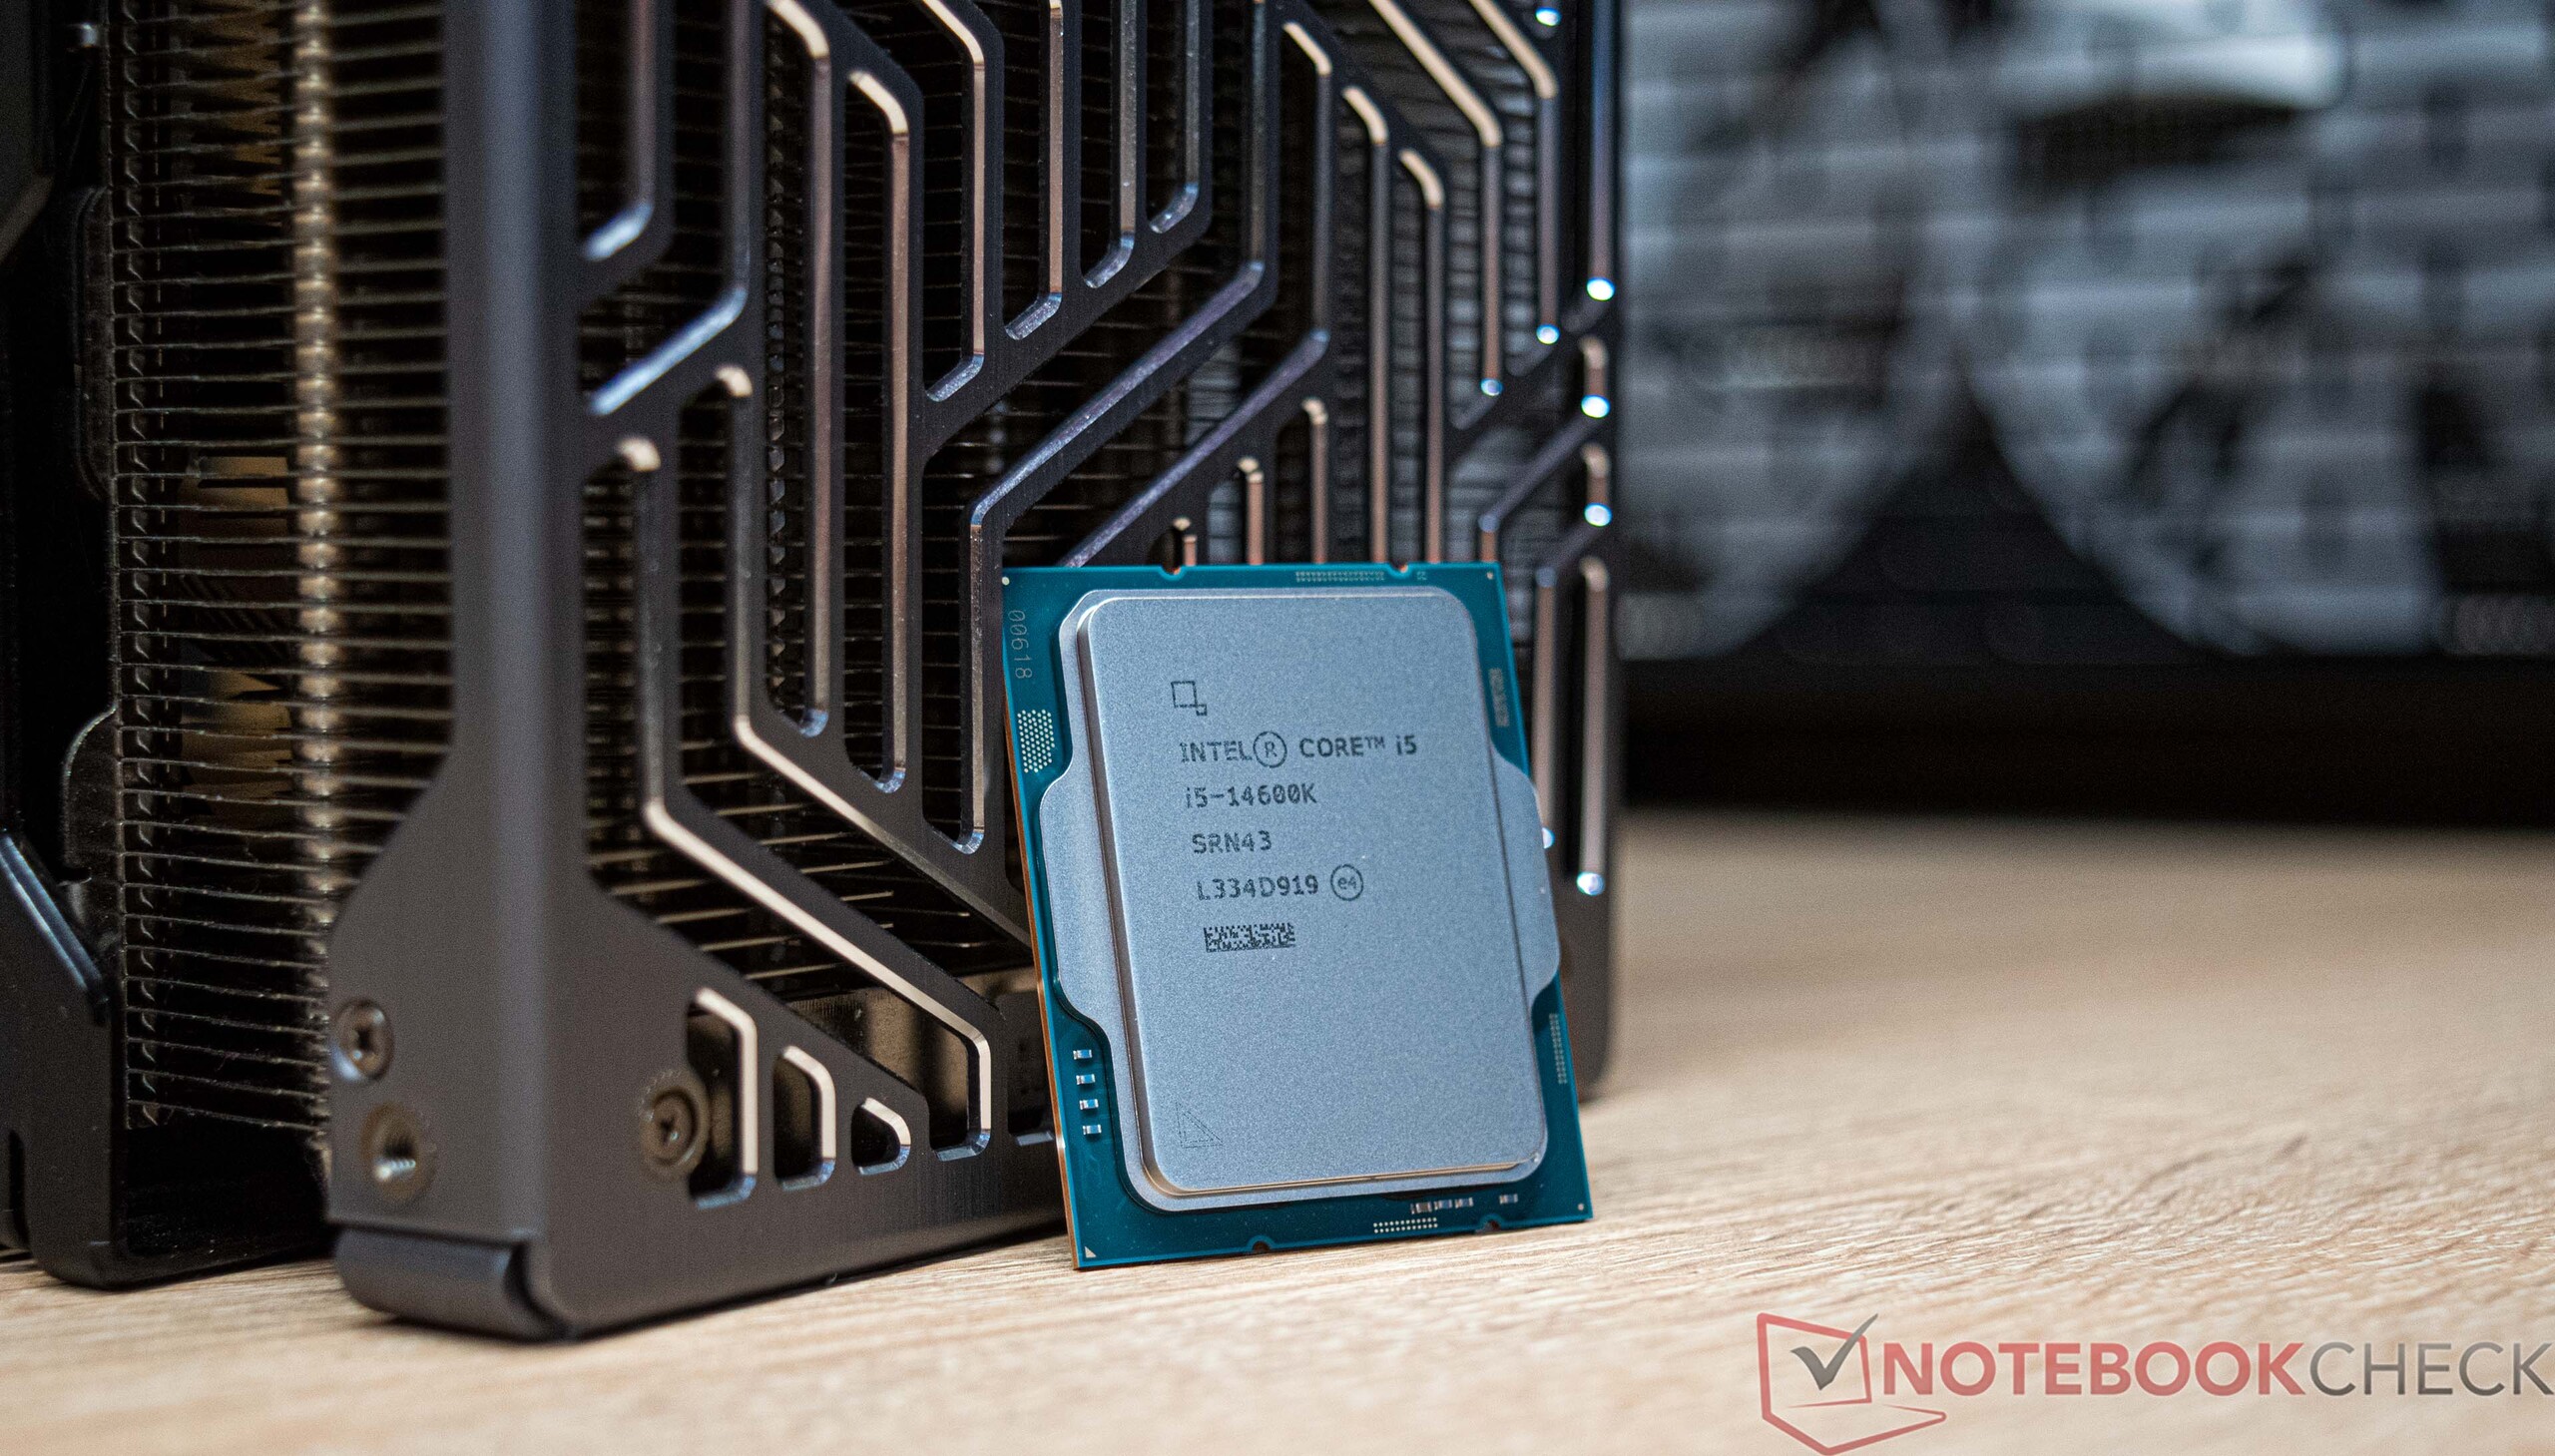
Recensione degli Intel Core i9-14900K e Intel Core i5-14600K - Con 6 GHz contro i processori X3D di AMD
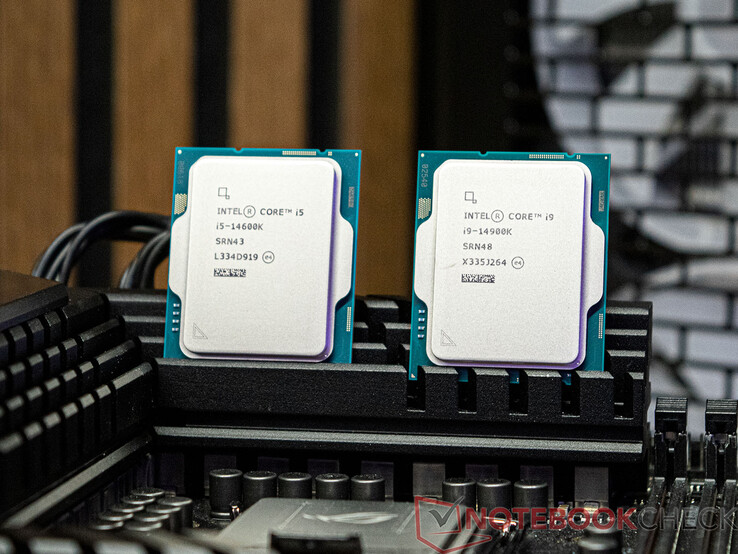
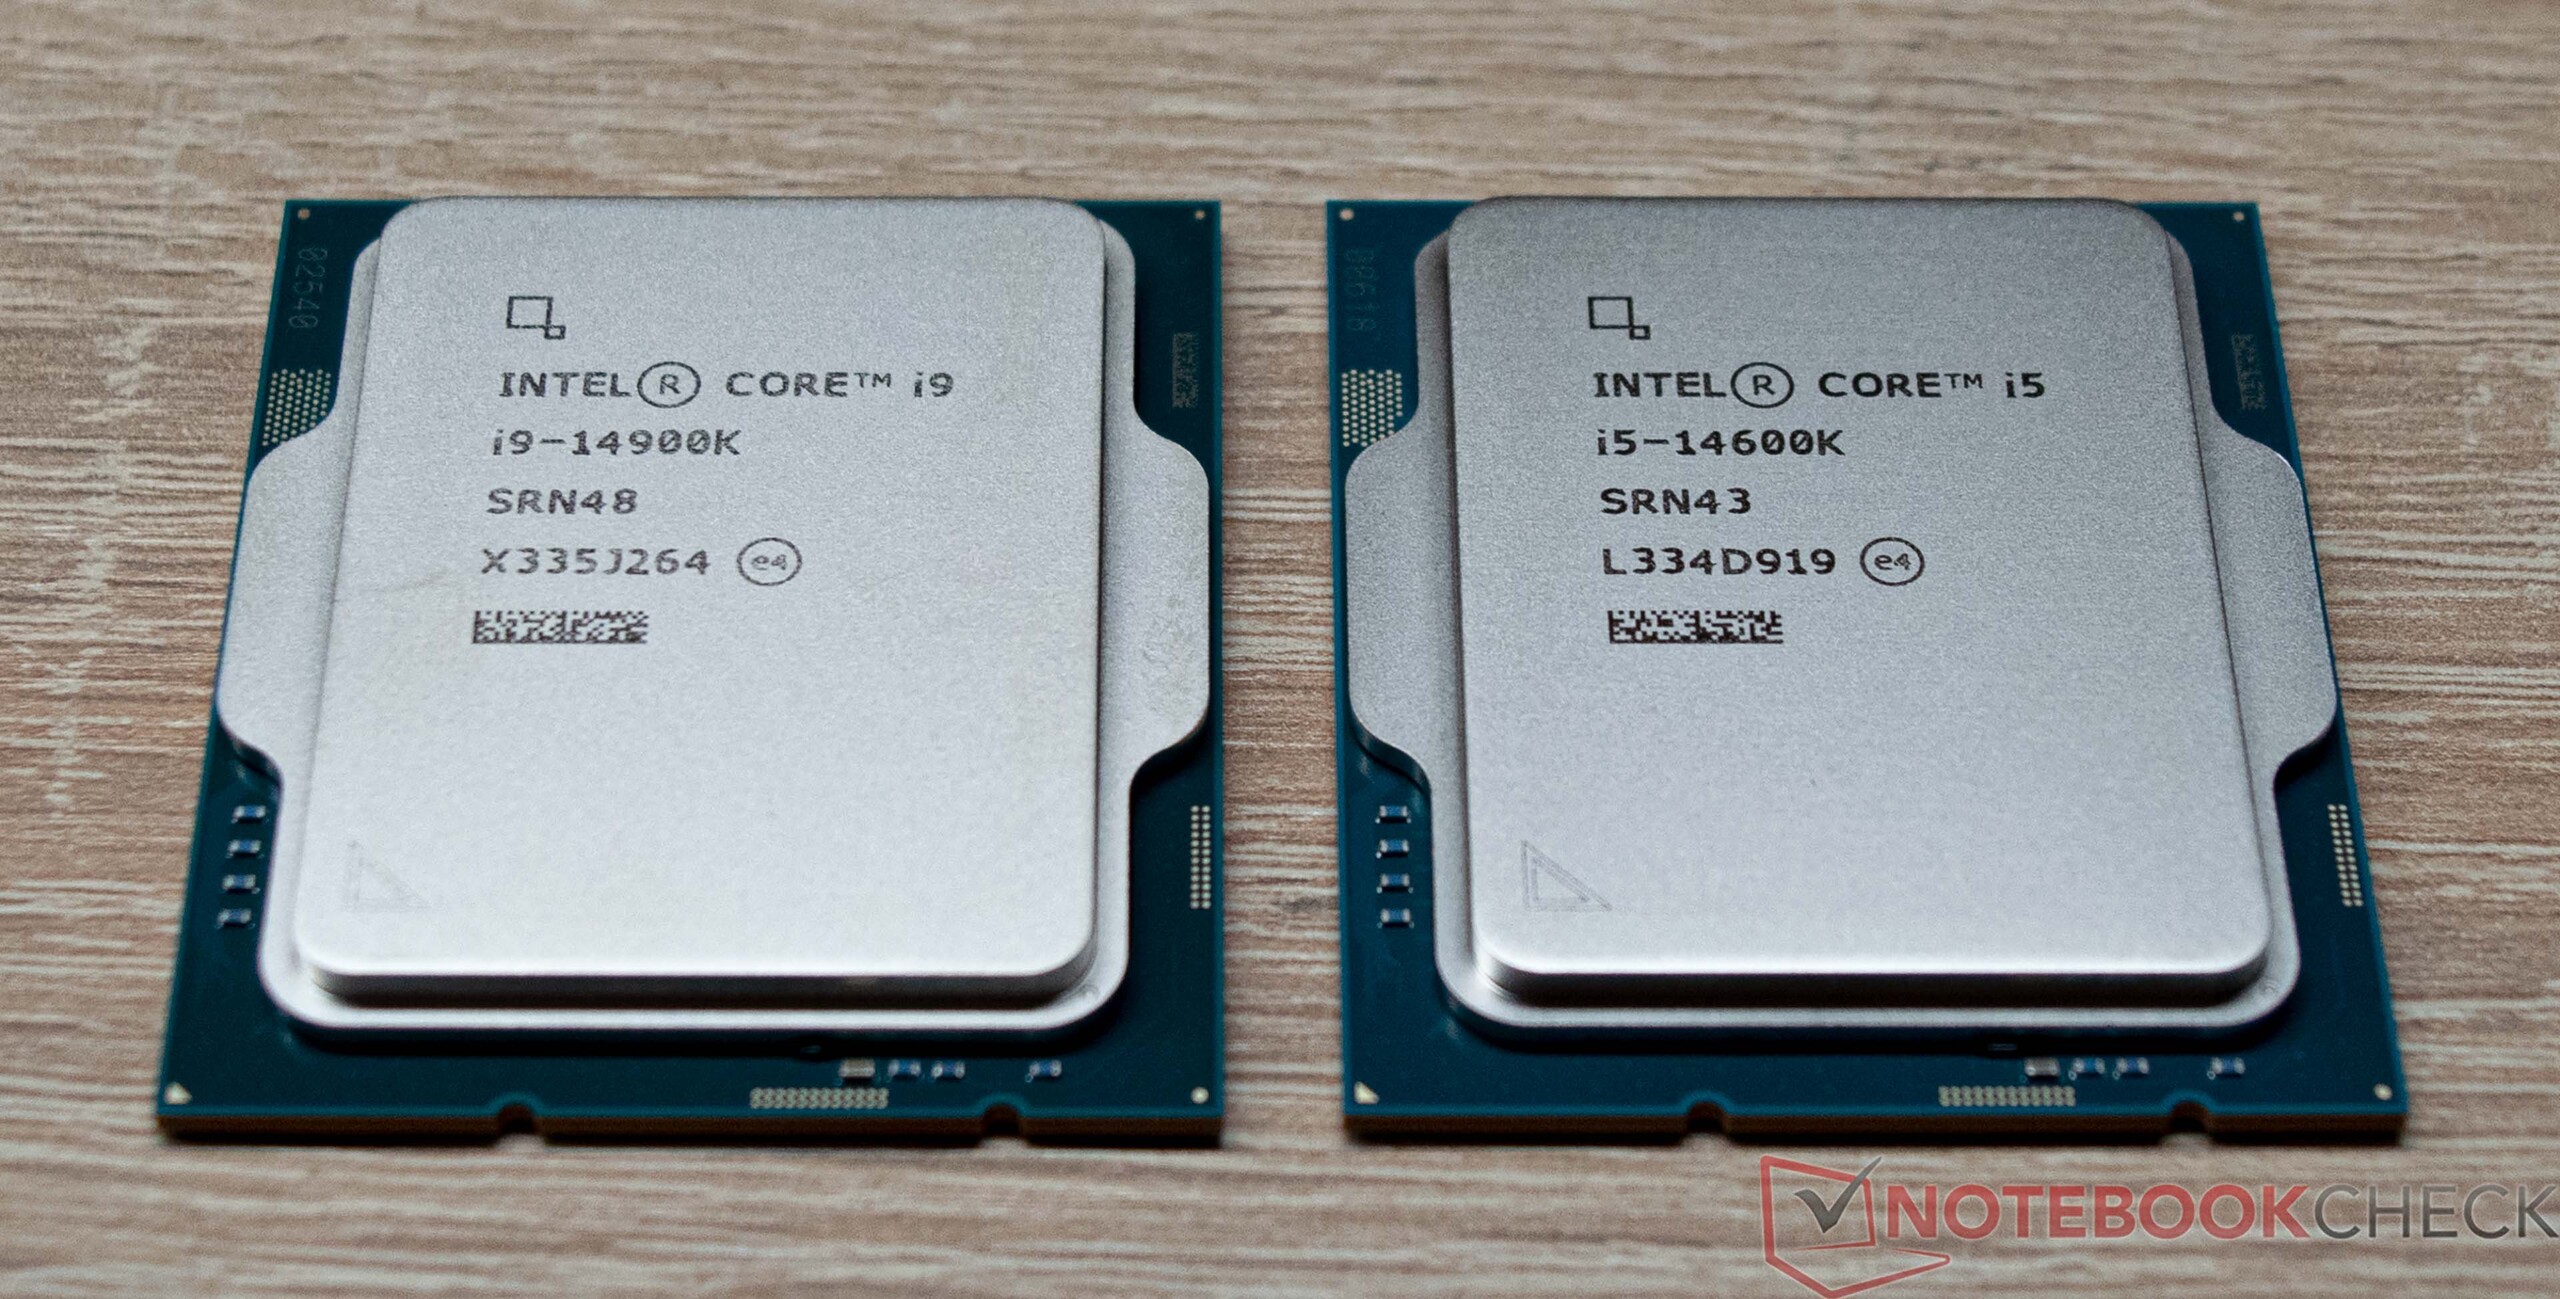
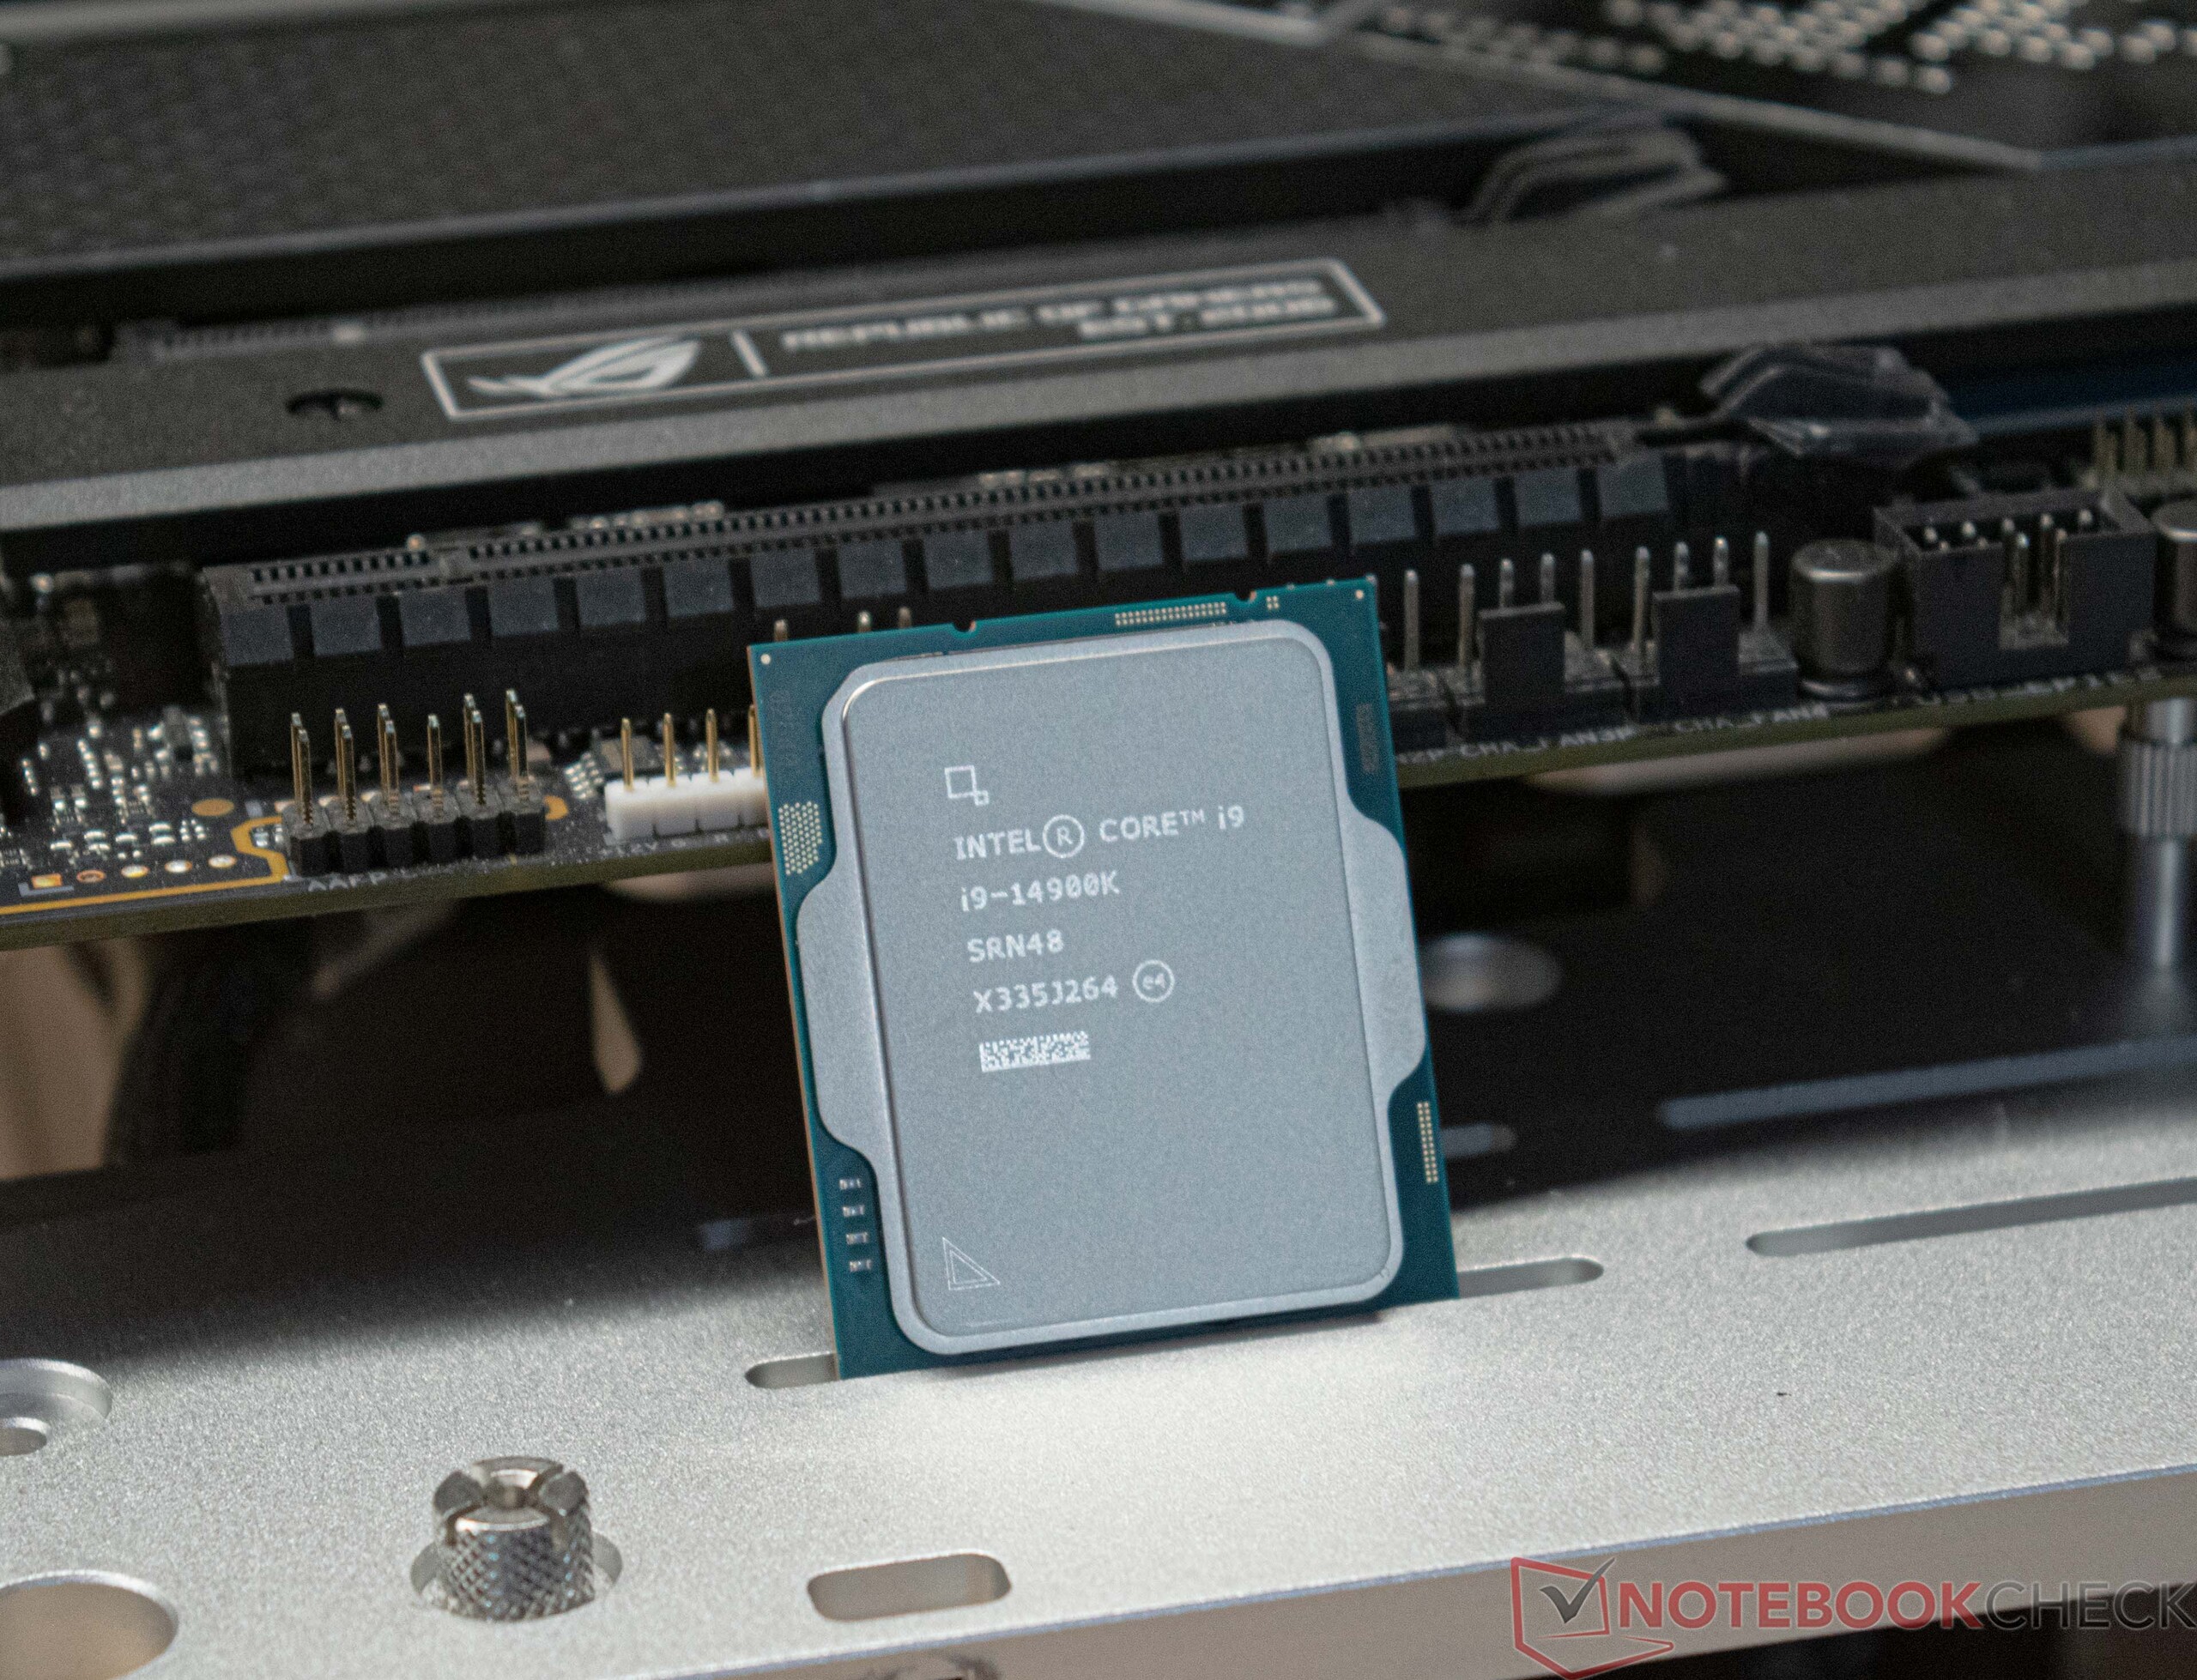
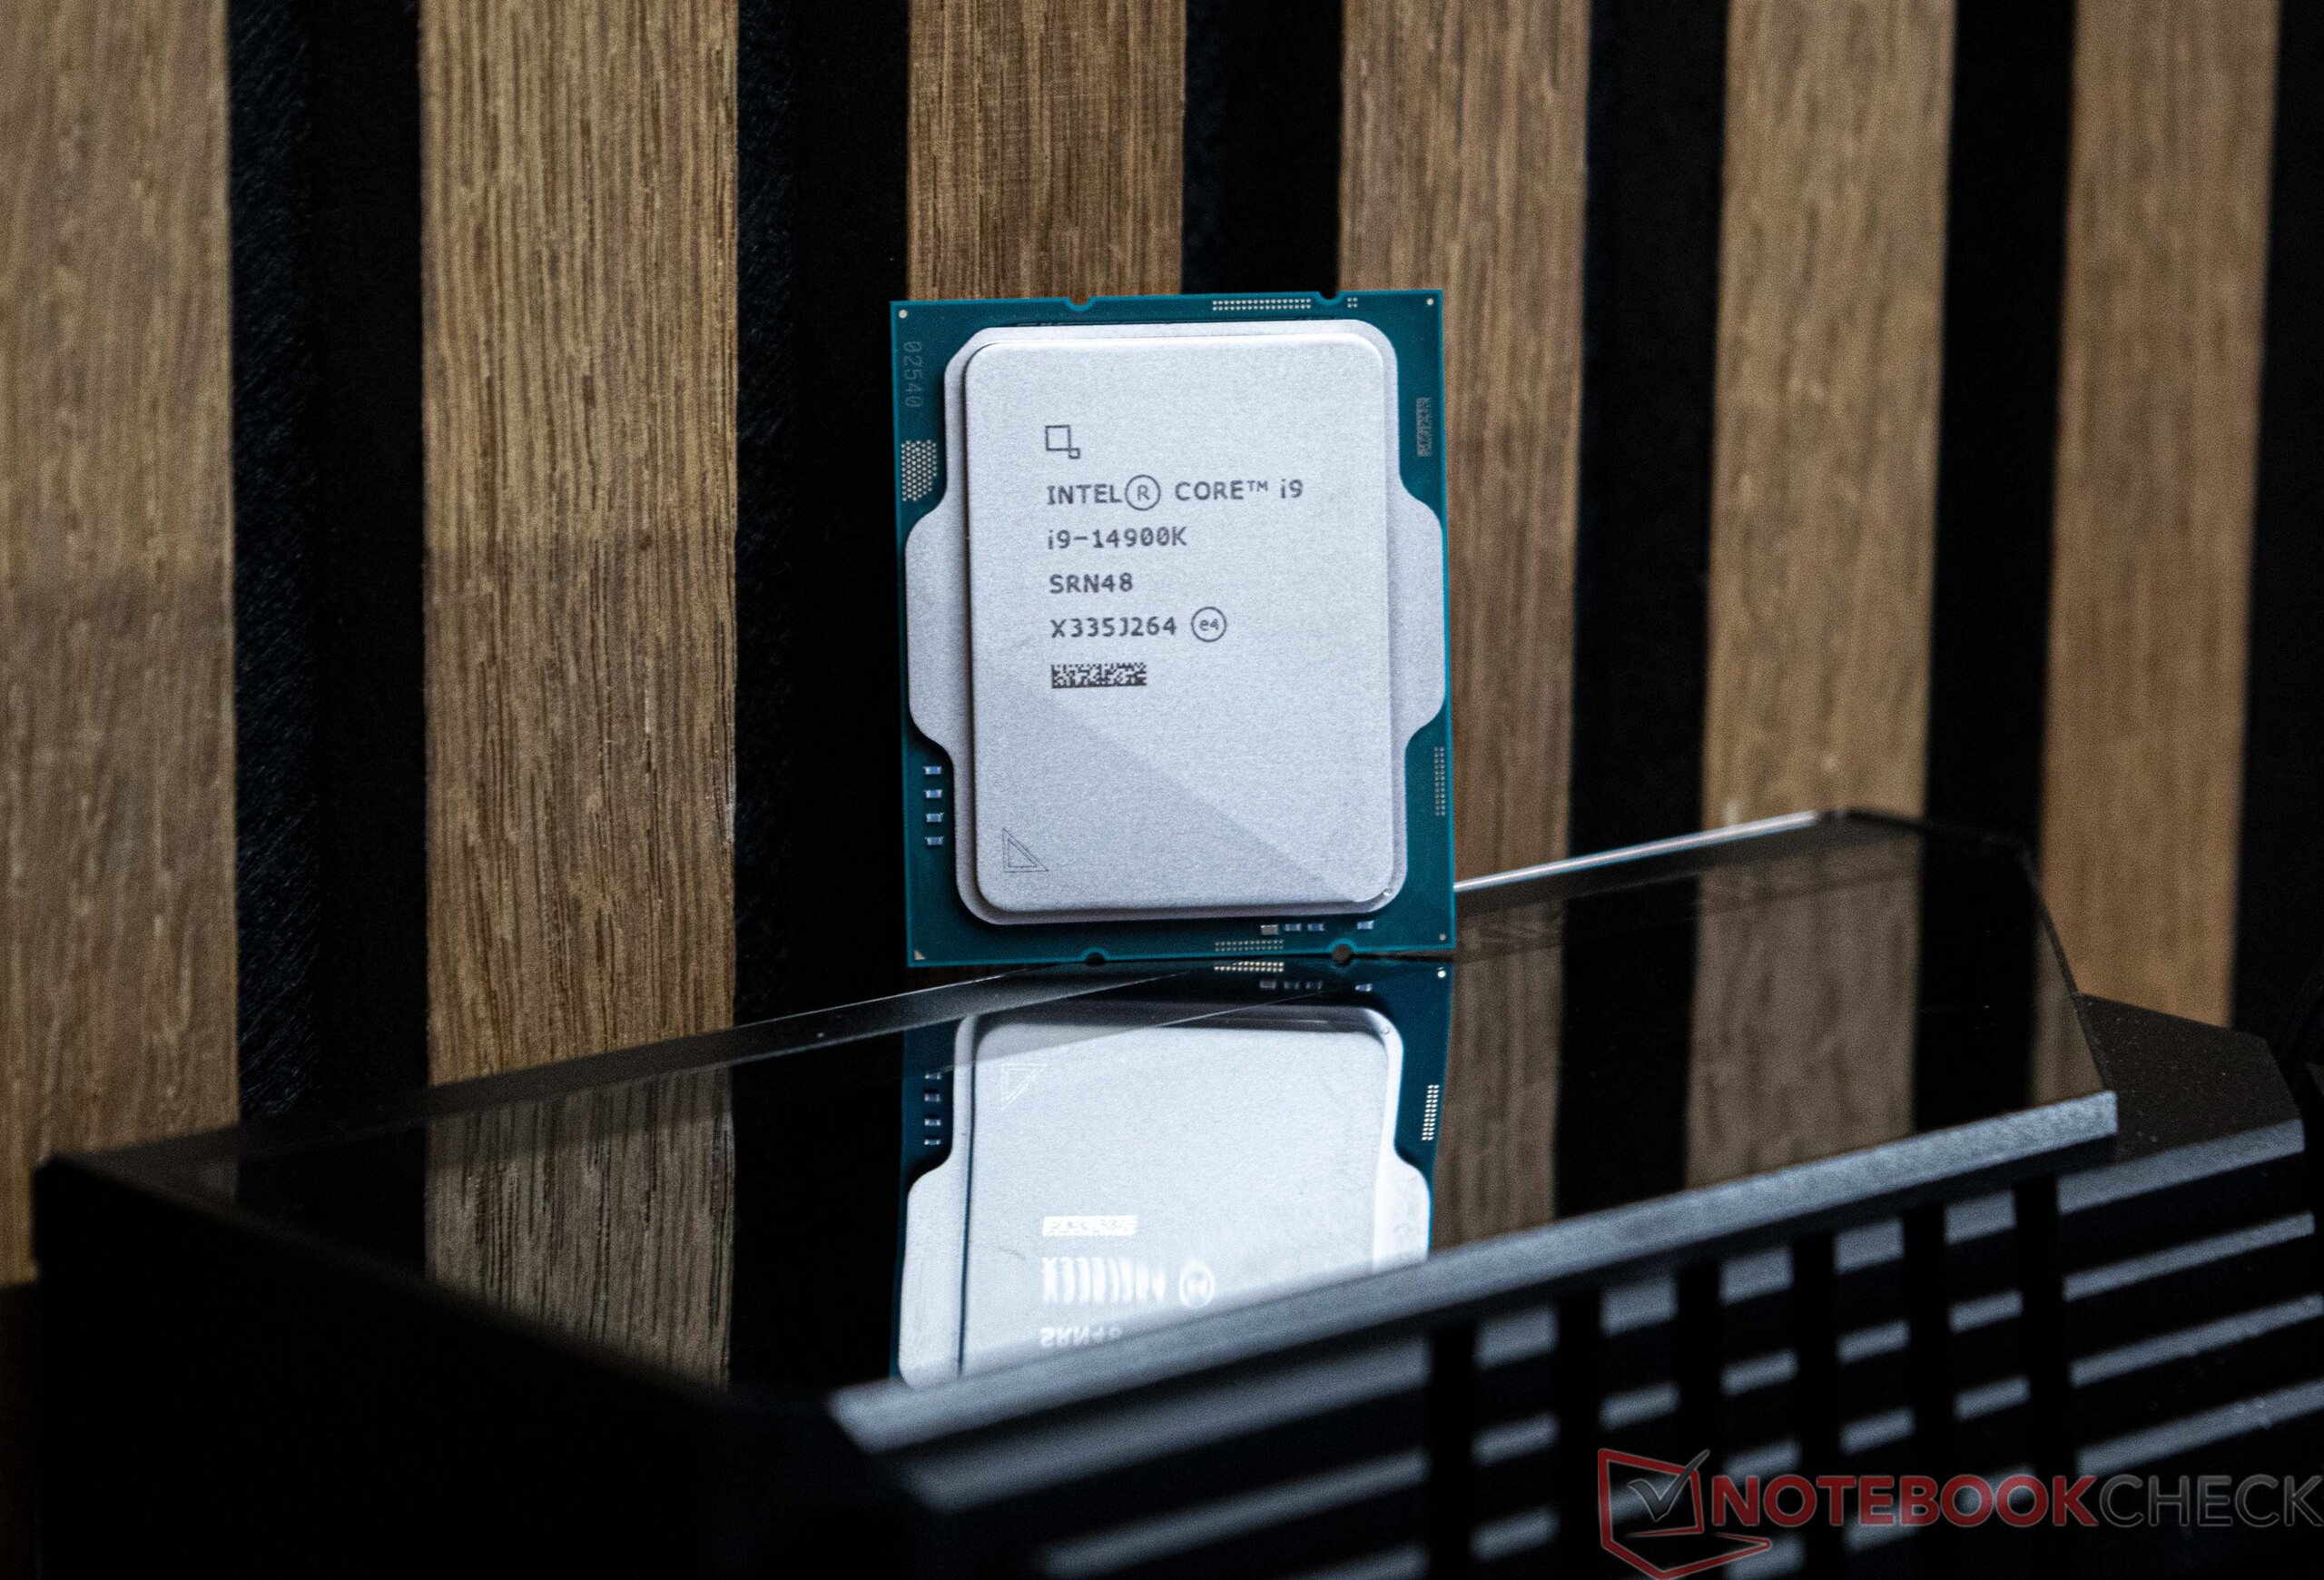
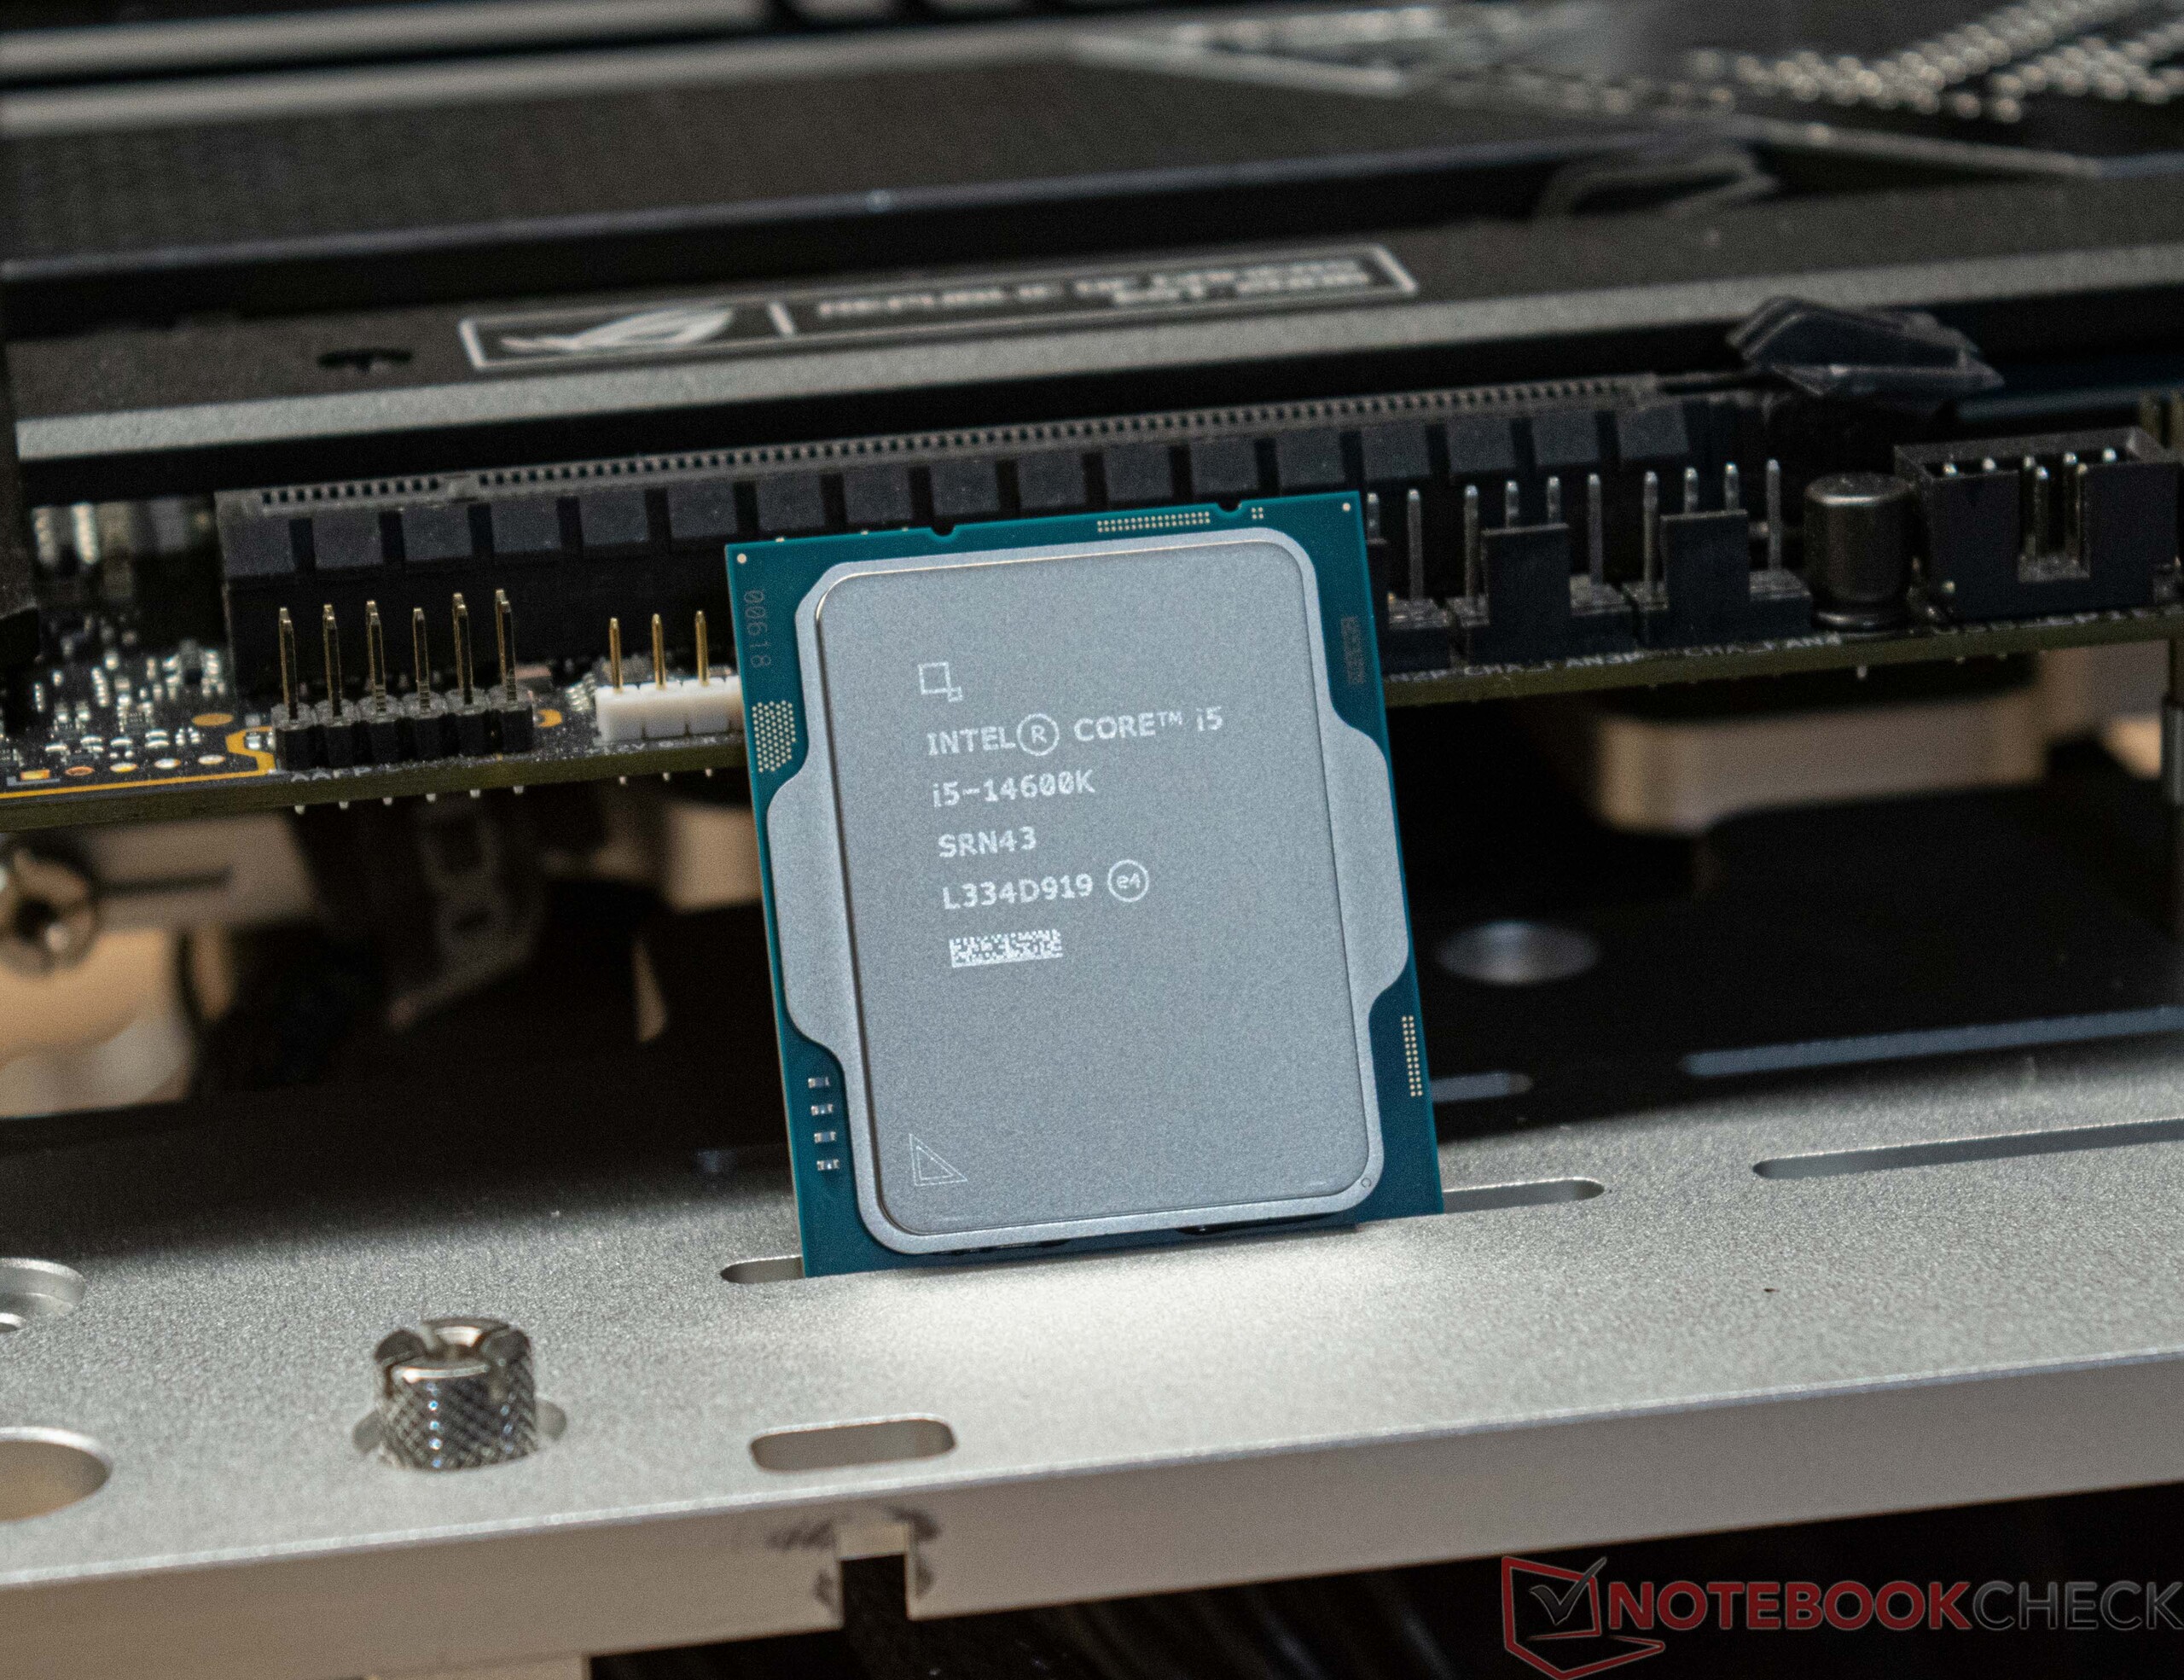
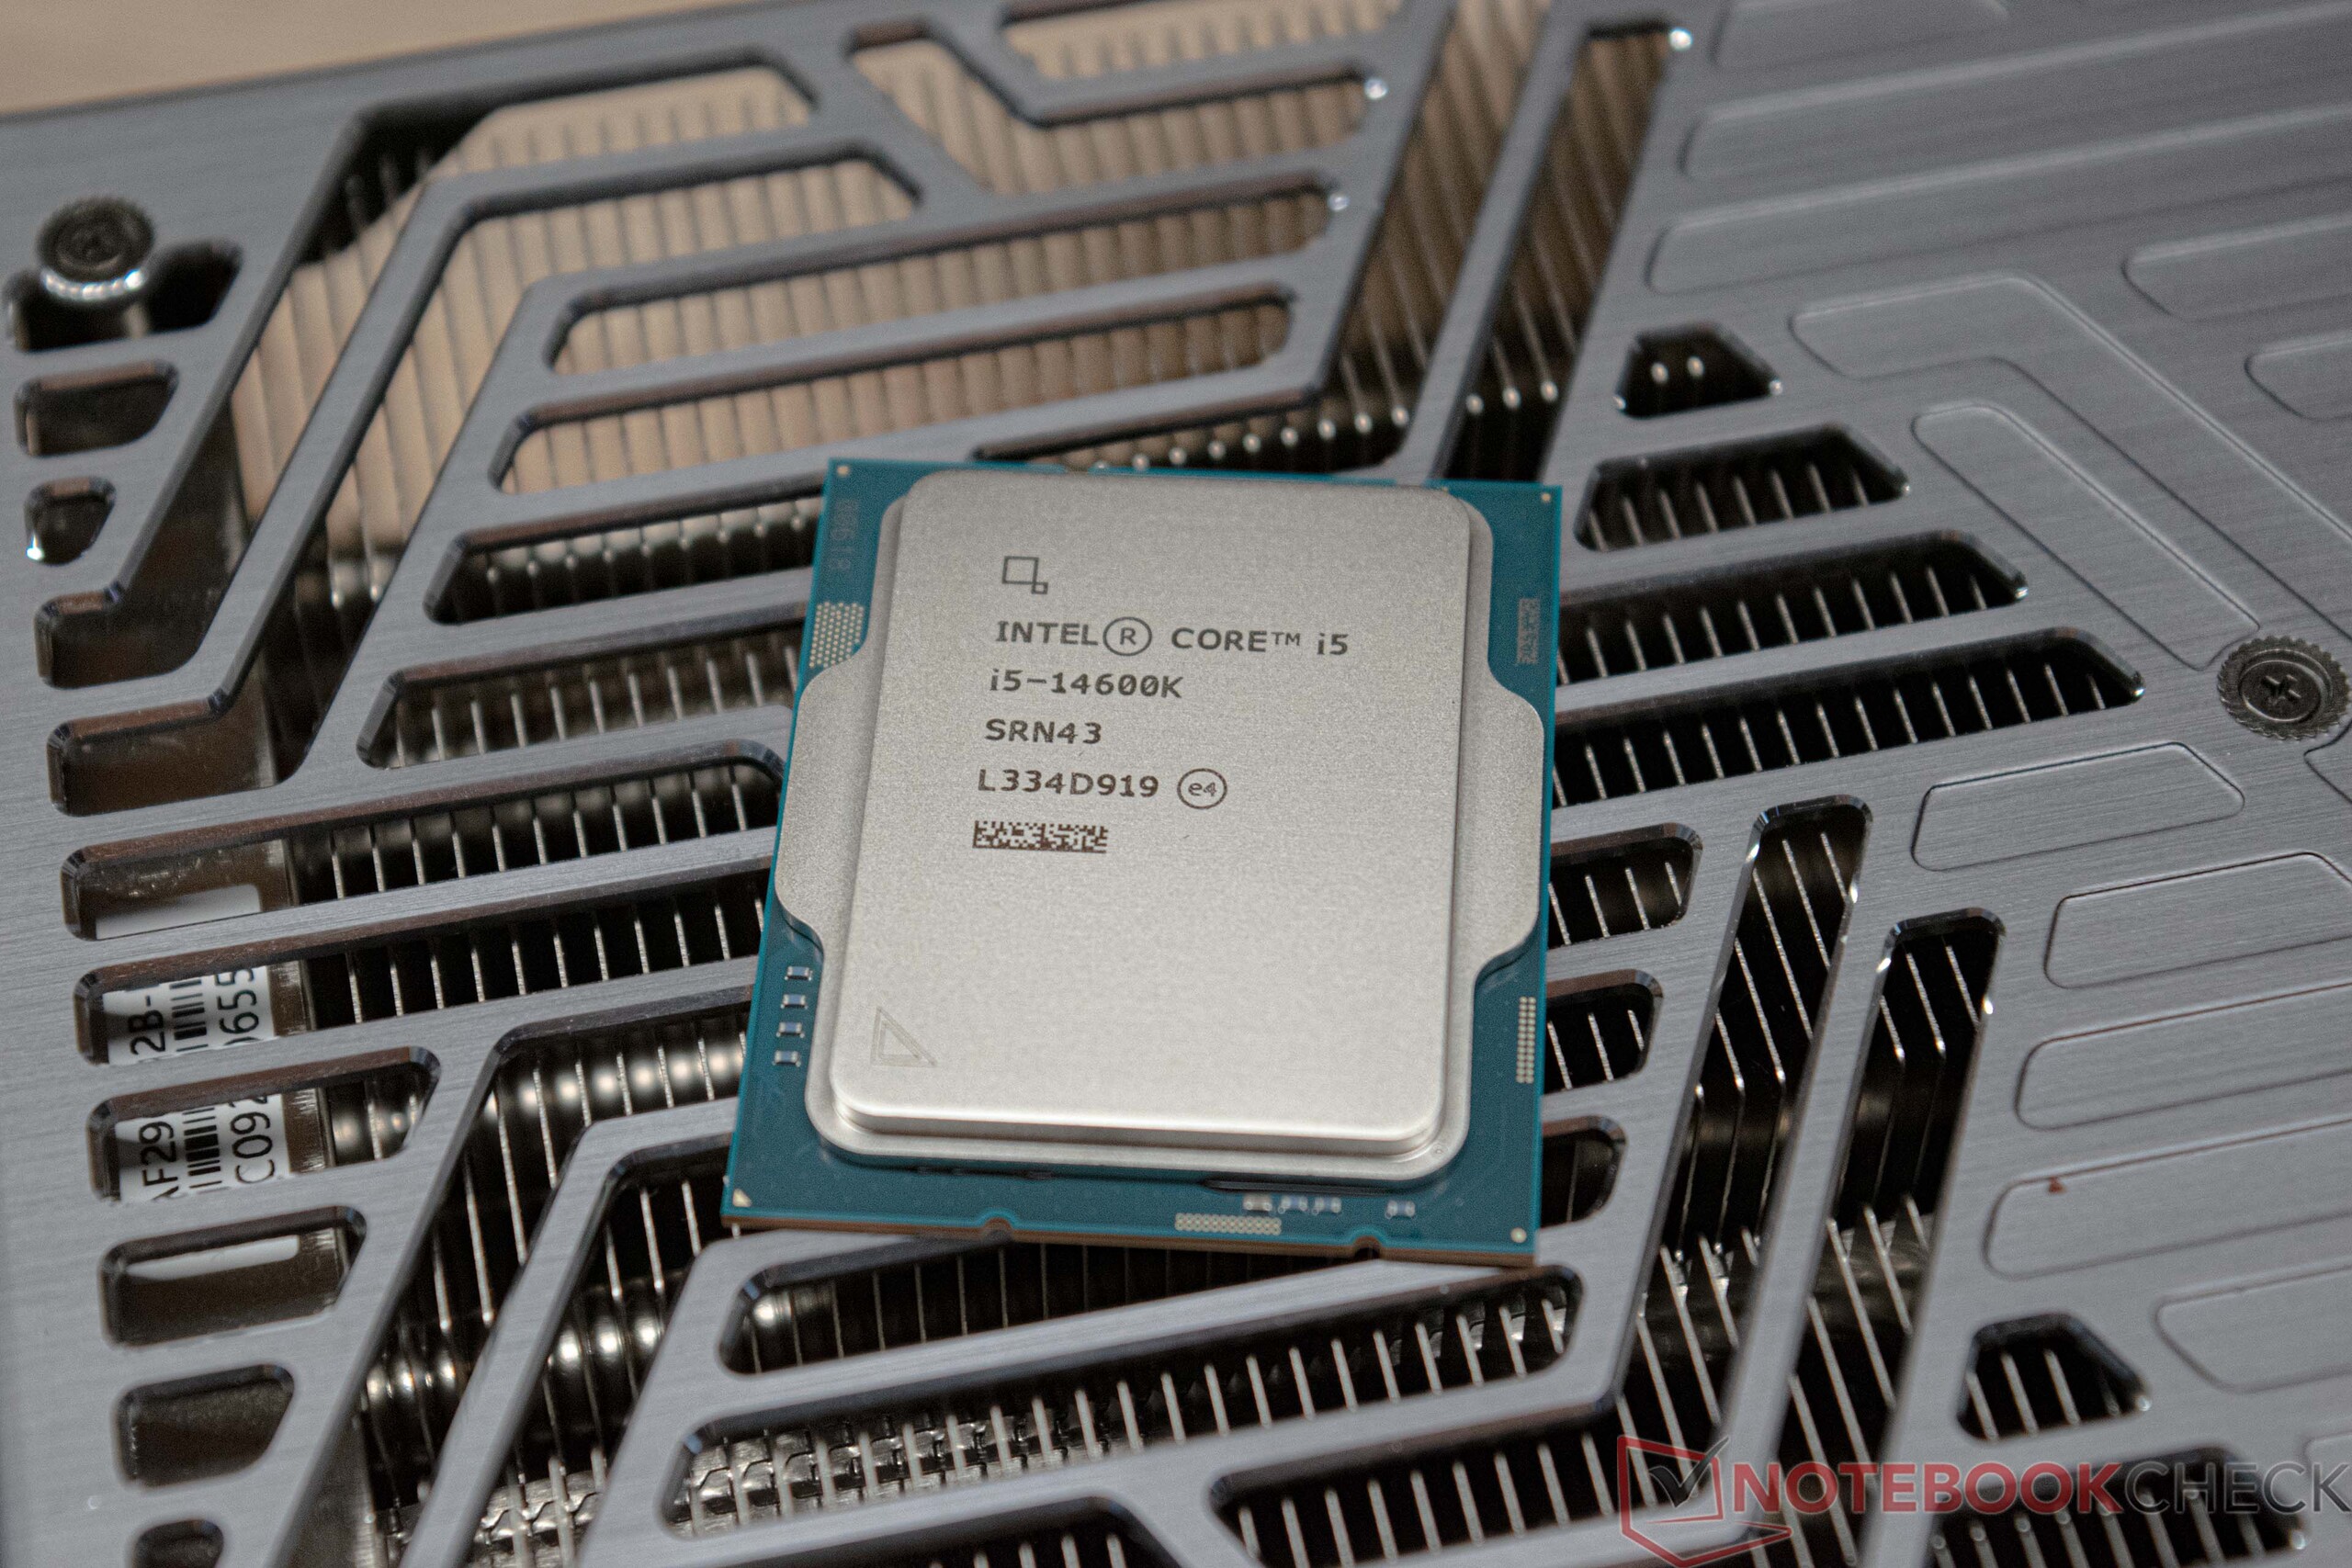
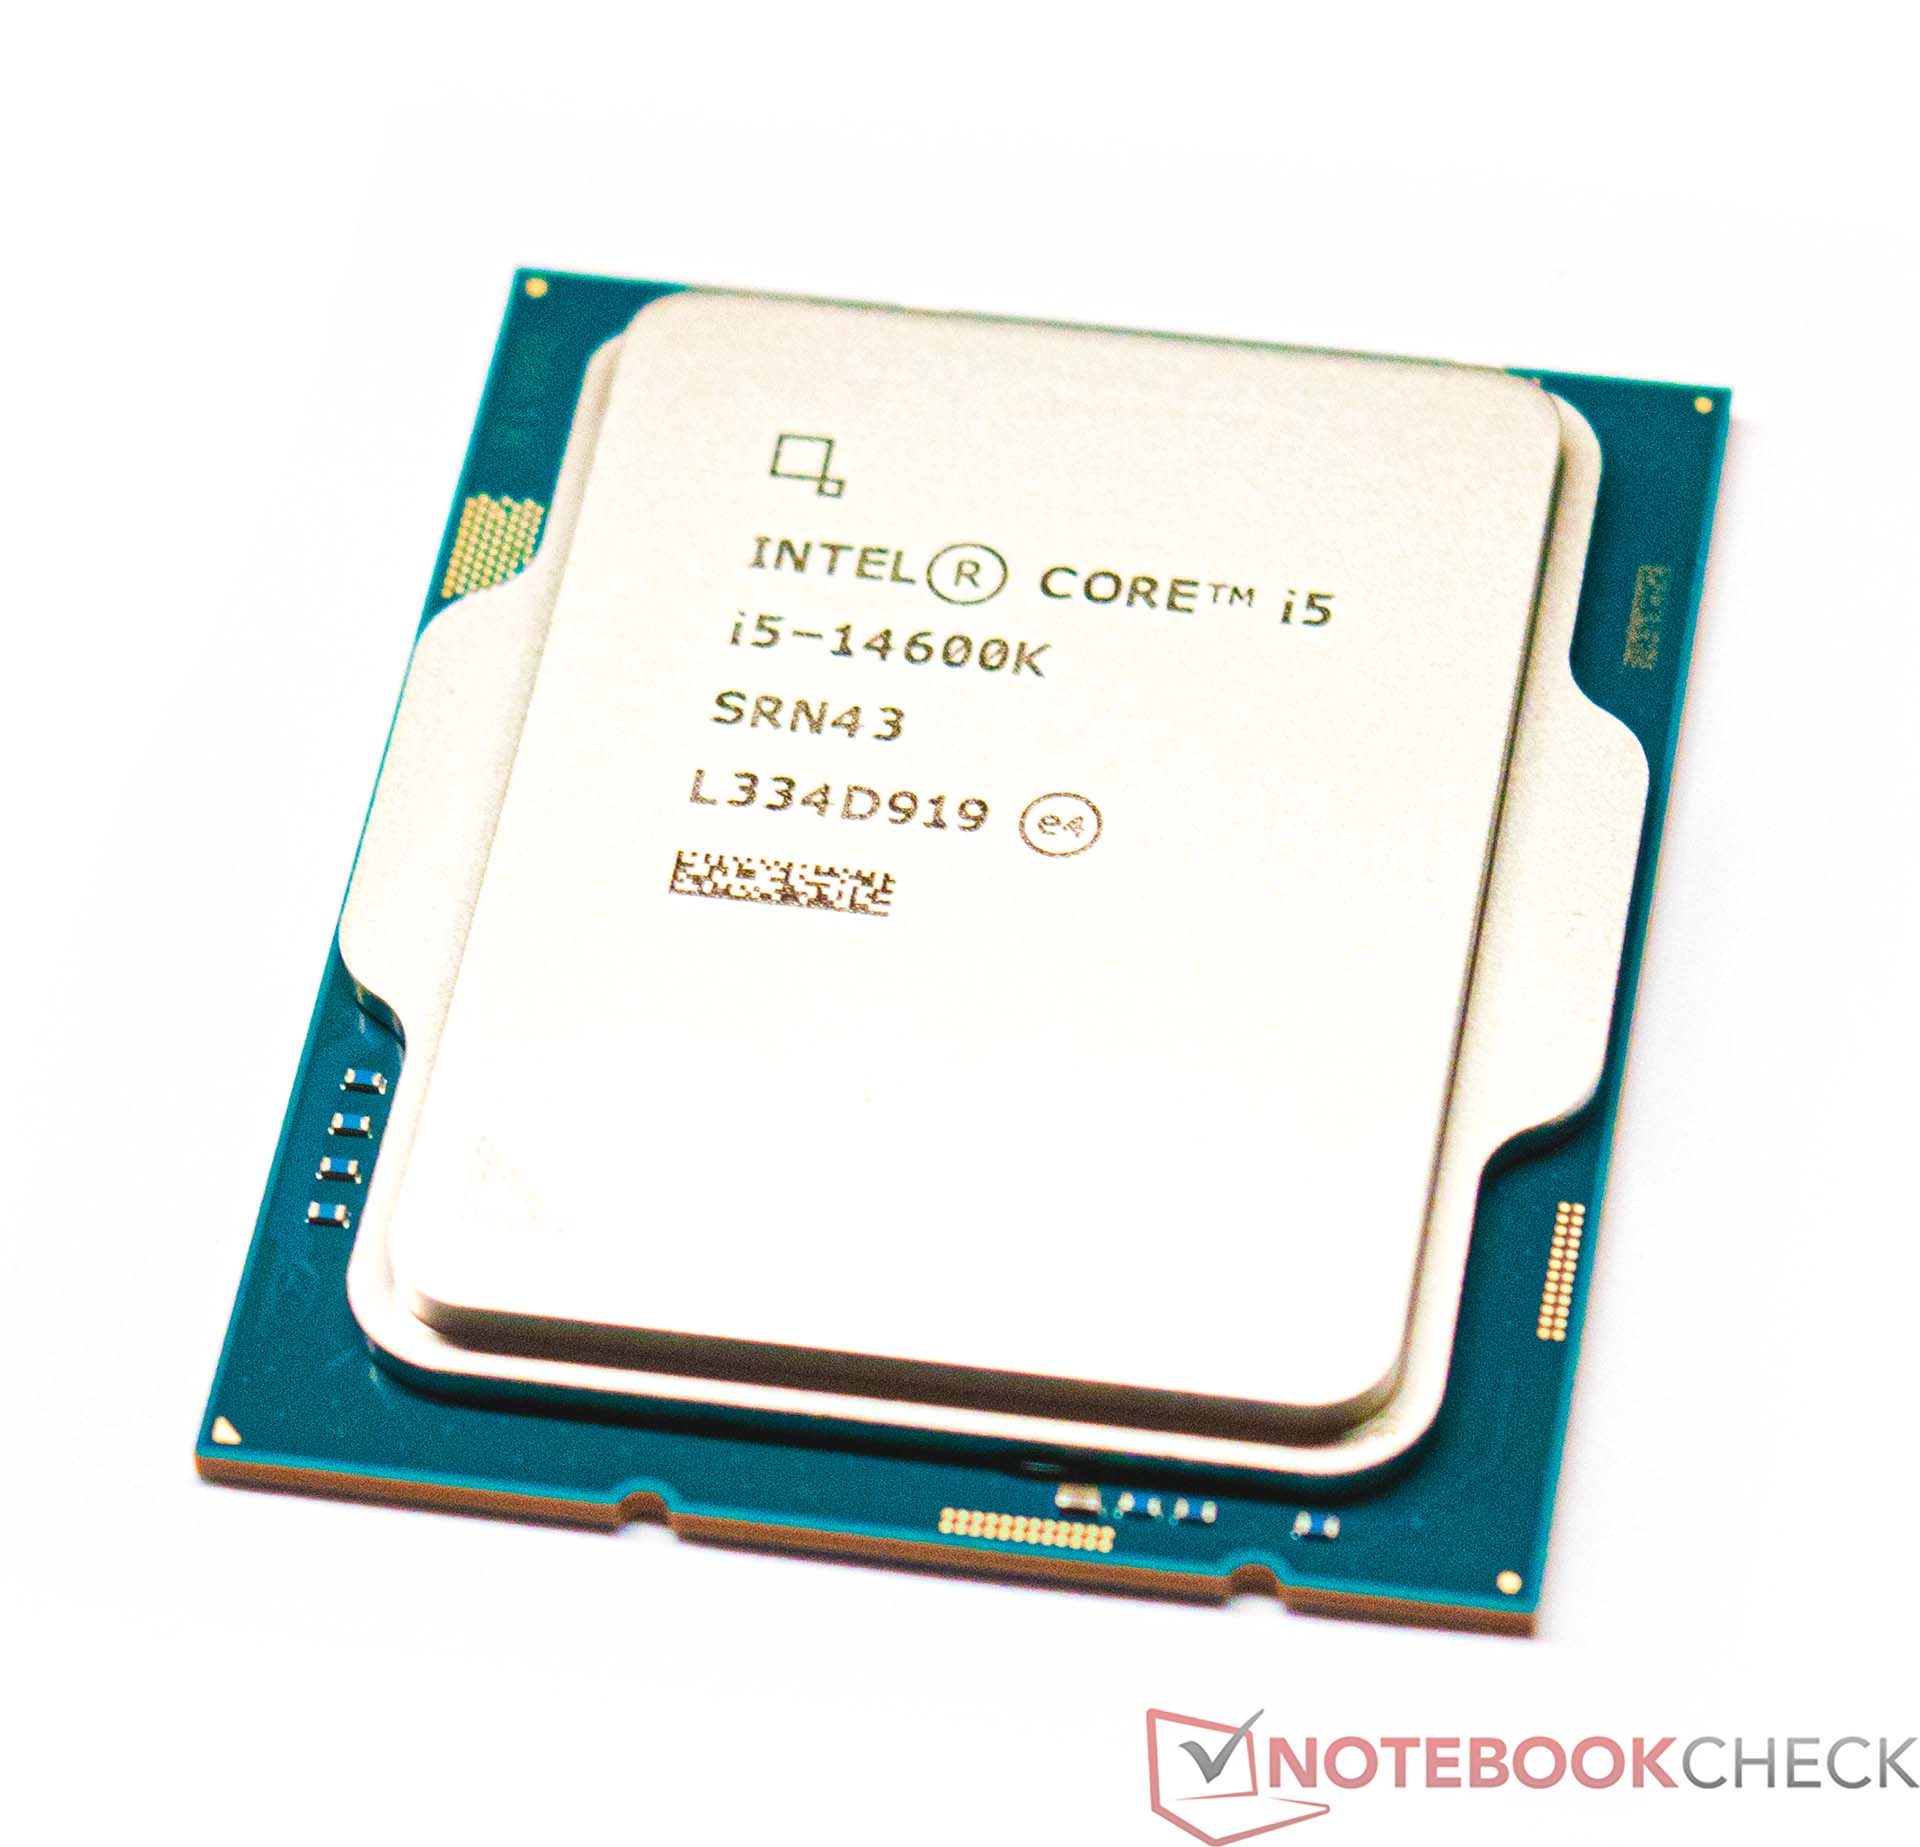
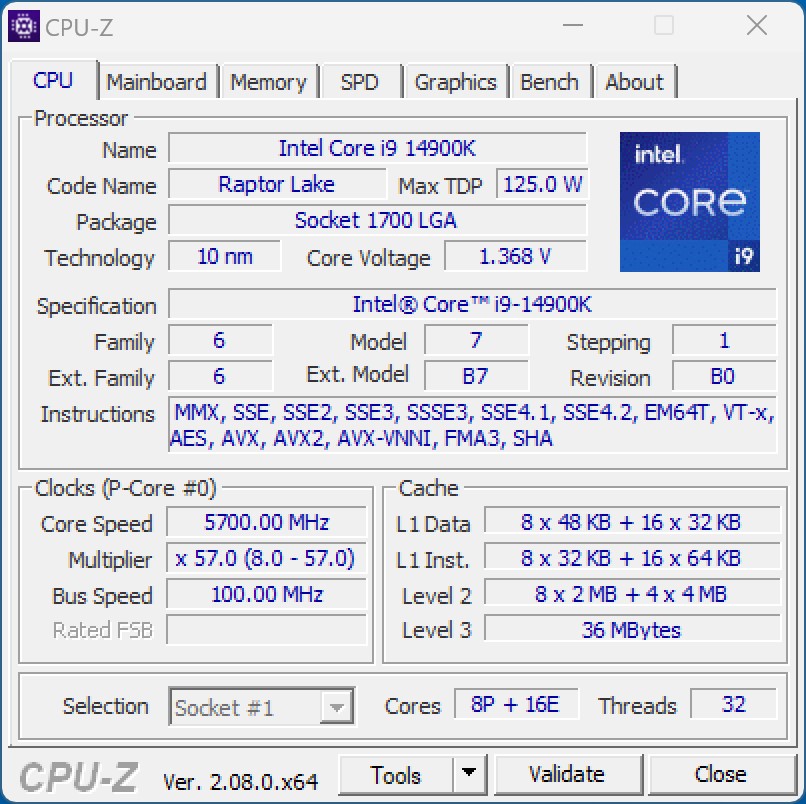
Contro le aspettative di introdurre un nuovo socket dopo due anni, Intel continua ad utilizzare il socket 1700 per la 14esima generazione di processori Core. Il modello di punta, l'Intel Core i9-14900K, presenta un totale di 24 core di calcolo nativi e 32 thread, che è lo stesso che era già disponibile nell'Intel Core i9-13900K Intel Core i9-13900K. Ma Intel ha introdotto alcuni miglioramenti nelle velocità di clock che ora raggiungono direttamente il limite di 6,0 GHz. Abbiamo potuto documentarlo anche nel nostro test, quindi non si tratta solo di promesse vuote fatte dal produttore. Purtroppo, Intel non ha apportato molte modifiche al consumo energetico, quindi con un massimo di 253 watt, la nuova ammiraglia riceve lo stesso valore PL2 che già conosciamo. Se inoltre si disattivano tutte le restrizioni nel BIOS, il suo consumo energetico continua ad aumentare in modo significativo, come vedremo più avanti nel nostro test. Oltre al modello di punta, in questo test daremo un'occhiata più da vicino anche all'Intel Core i5-14600K. Con 14 core e 20 thread, raggiunge gli stessi numeri dell'Intel Core i5-13600K Intel Core i5-13600K. Ma Intel ha anche aumentato la velocità di clock di questo modello, per ottenere prestazioni leggermente superiori dai suoi core P ed E.
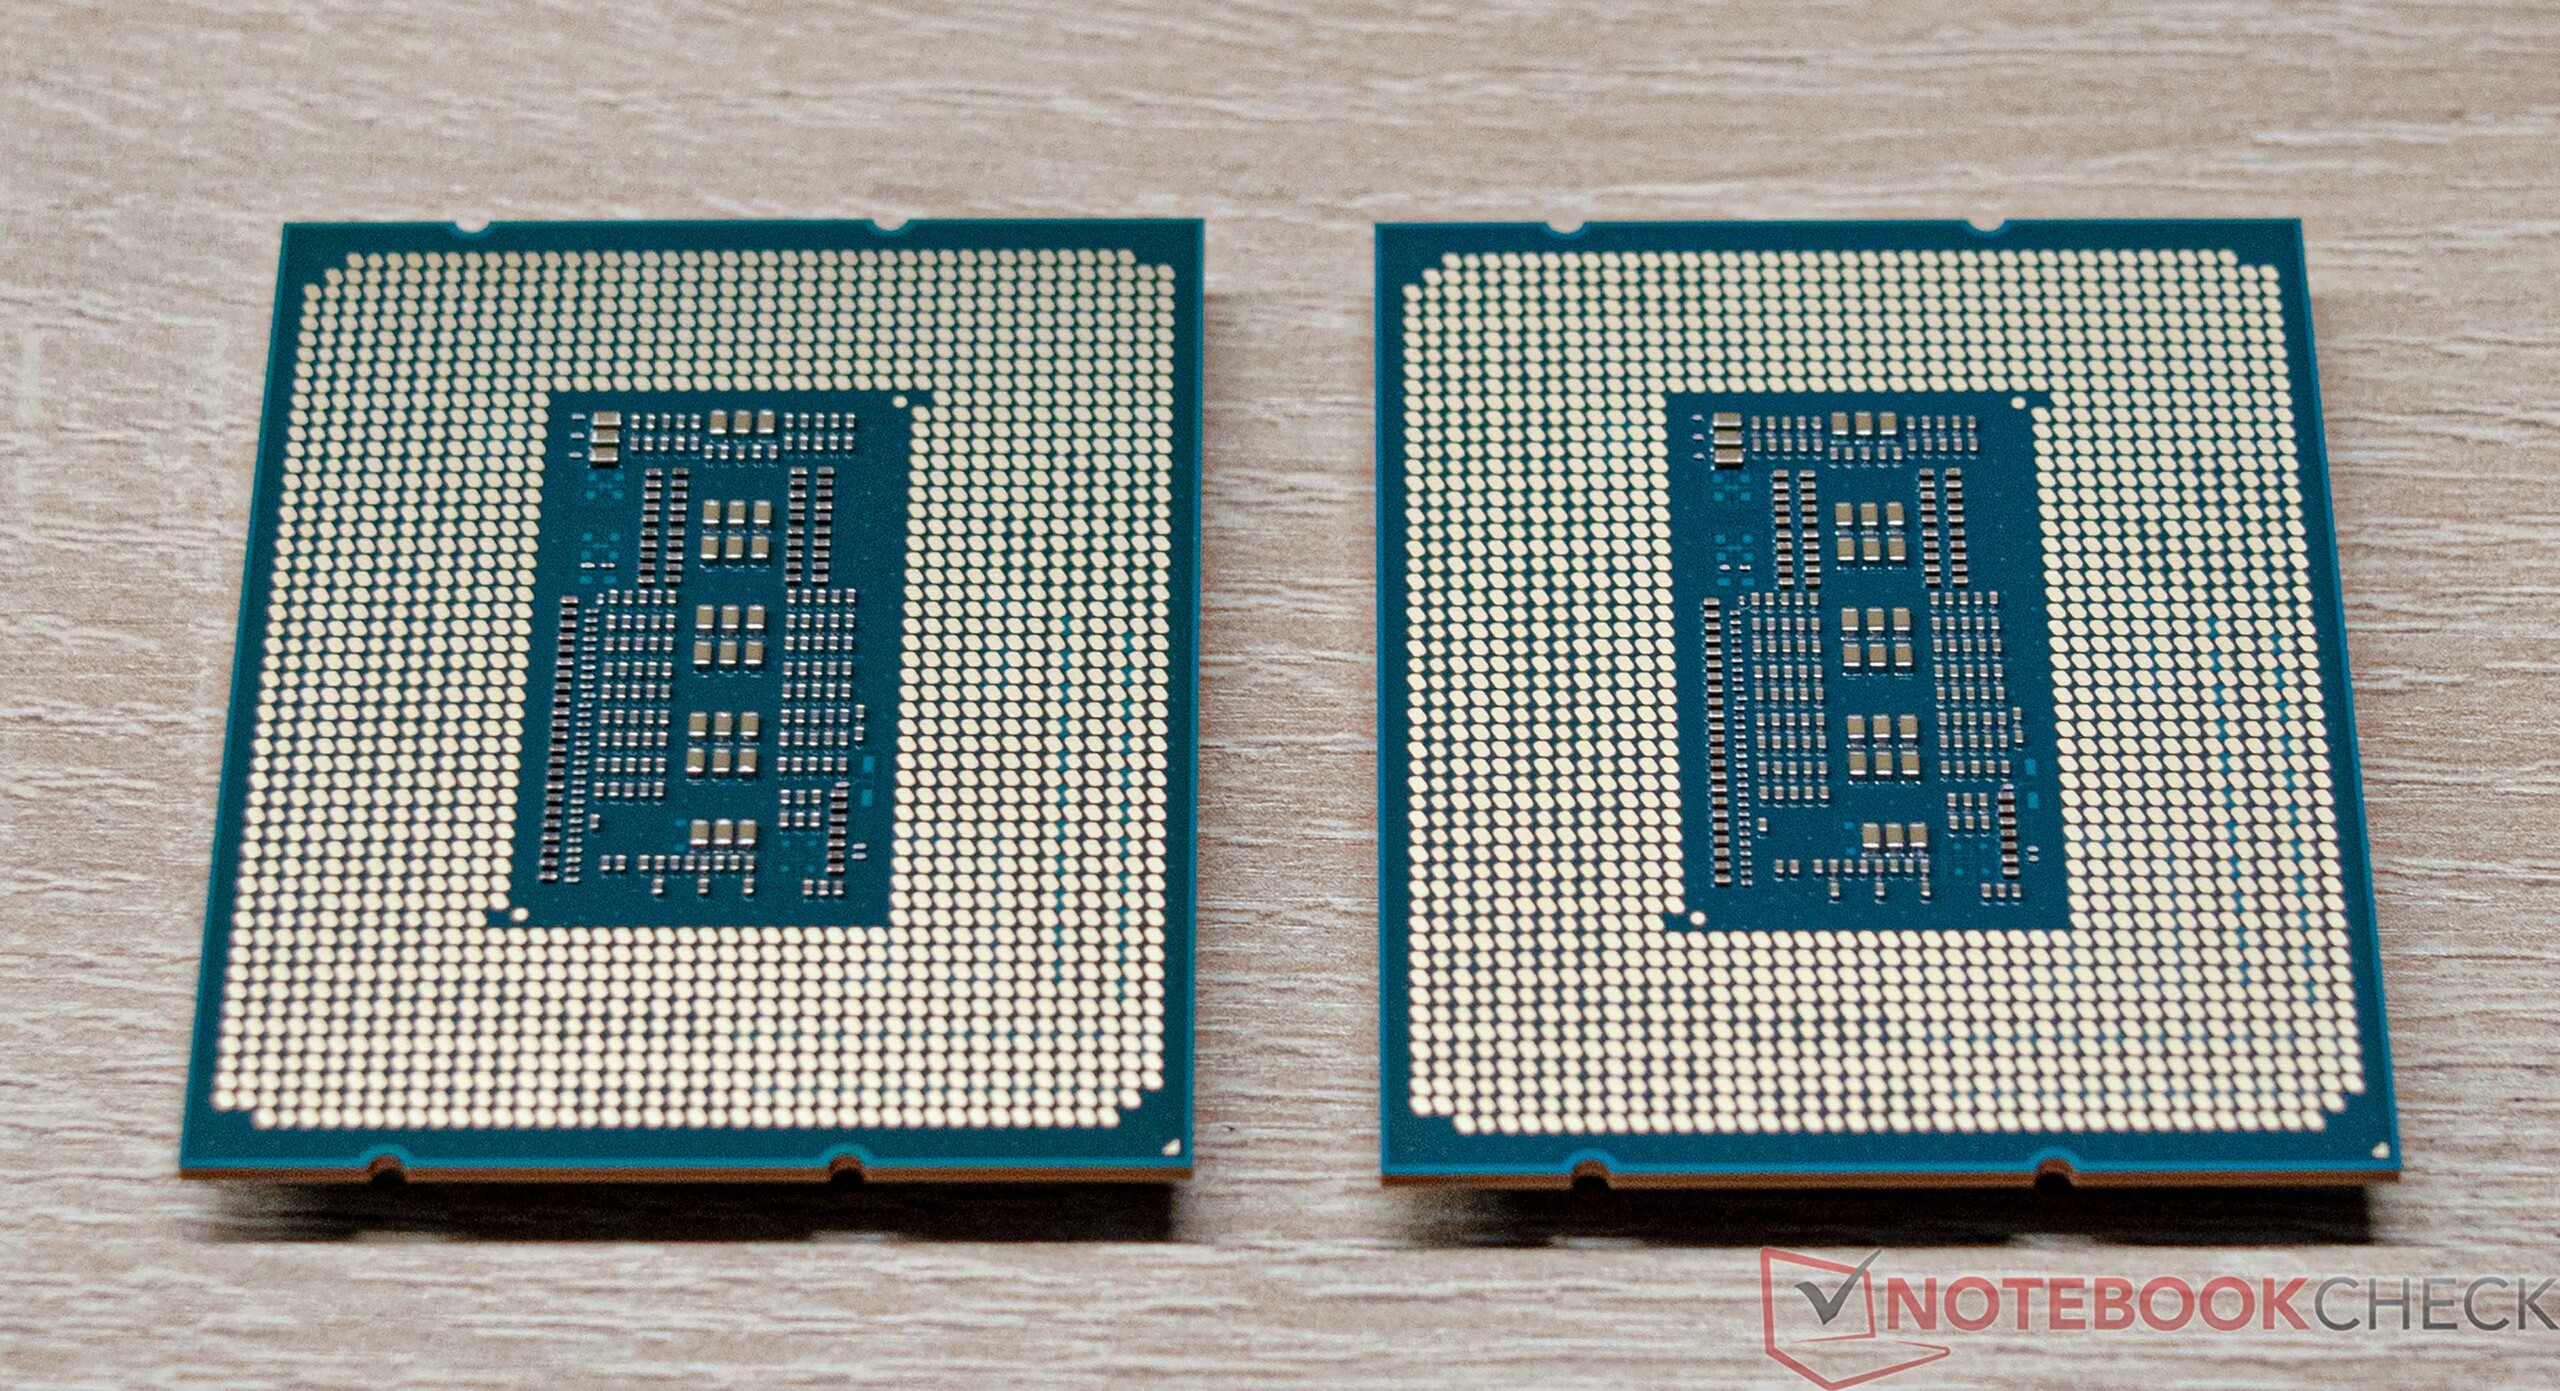
Con questo, non ci aspettiamo un salto maggiore nelle prestazioni, e Intel non ha nemmeno cambiato nulla nella struttura di base della CPU. A questo punto, Intel non offre alcuna controparte alla tecnologia 3D V Cache di AMD, che ha permesso ad AMD di ottenere risultati significativamente migliori nel recente passato e di mettere sotto pressione i suoi concorrenti.
I prezzi di Intel dimostrano inoltre che siamo allo stesso livello di quanto avvenuto durante il lancio dei modelli Raptor Lake S dello scorso anno. A causa della domanda, che di solito aumenta nel quarto trimestre, resta da vedere dove finiranno effettivamente i nuovi modelli. A giocare un ruolo importante (in Europa) è anche il tasso di cambio euro-dollaro.
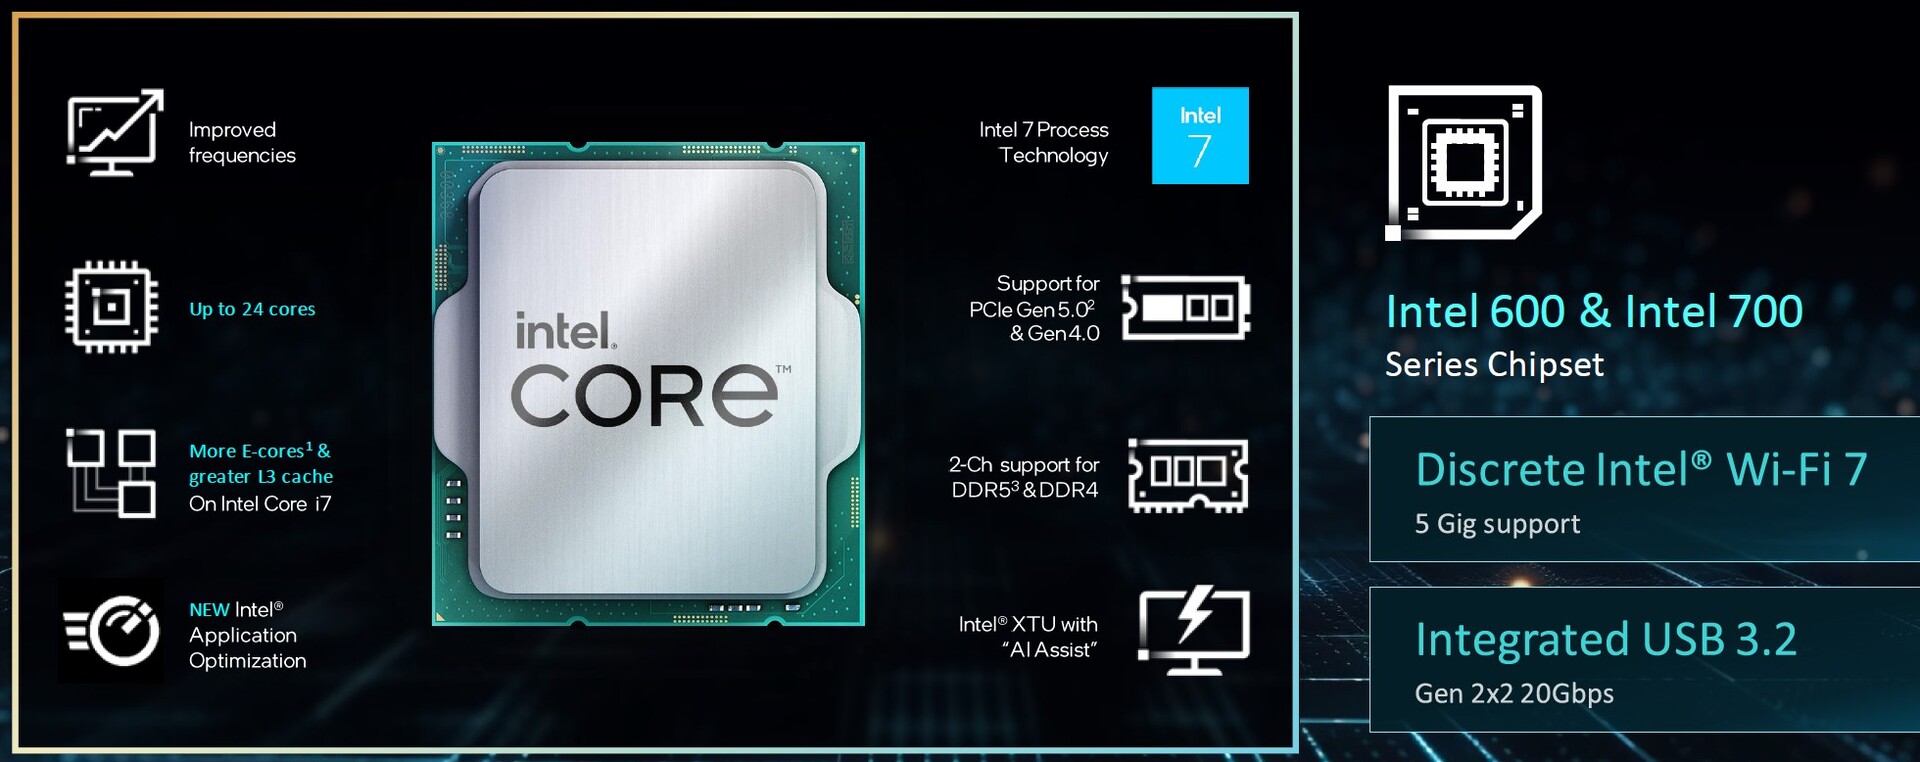
Piccoli miglioramenti nei processori Intel di 14ª generazione
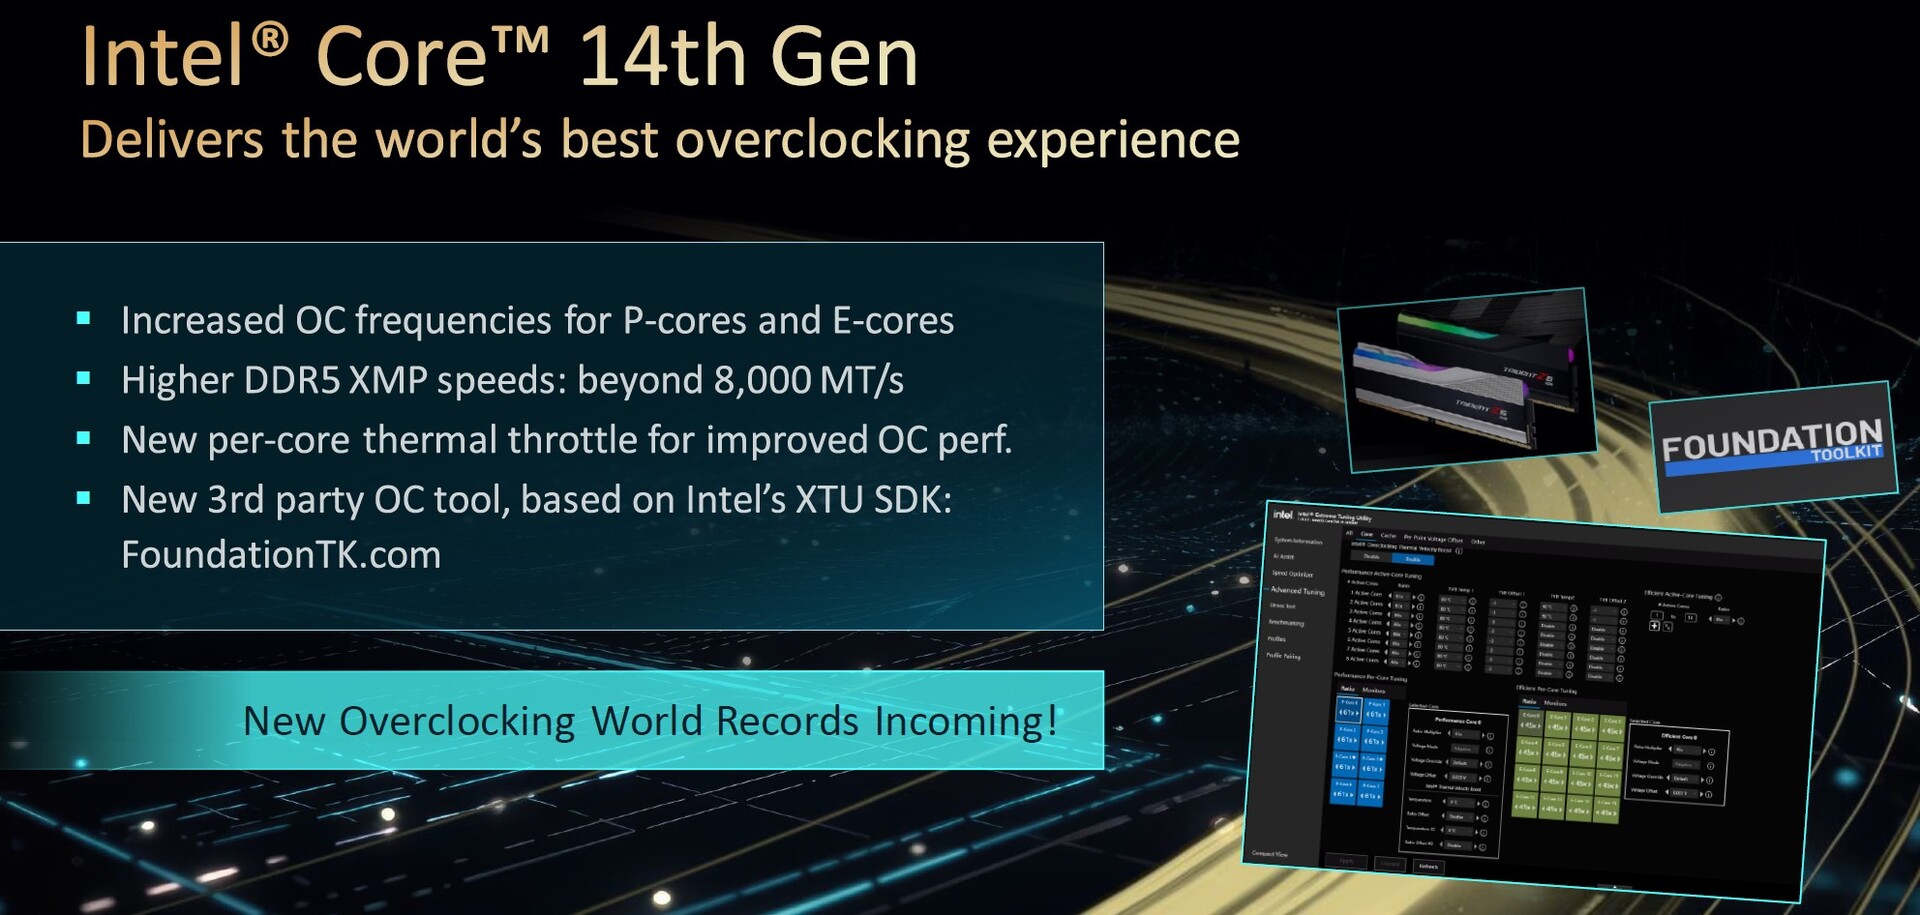
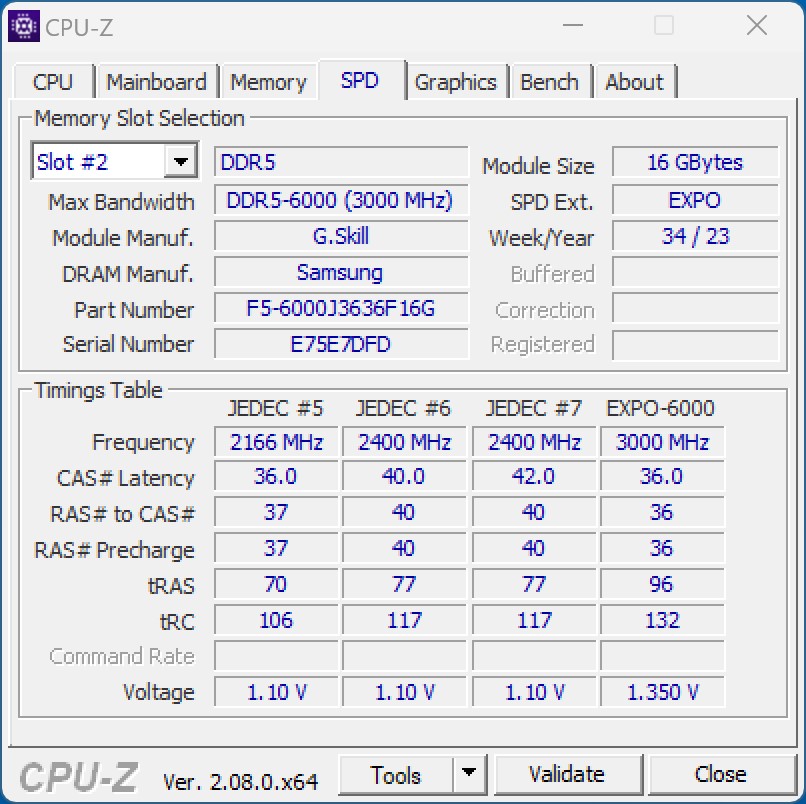
Oltre all'aumento della velocità di clock, Intel enfatizza anche le velocità della RAM pubblicizzate, con XMP e fino a 8.000 MT/s. Tuttavia, in passato, queste velocità di clock elevate hanno spesso portato a problemi con la memoria di lavoro. Questo è probabilmente anche il motivo della riprogettazione delle schede principali, i cui miglioramenti dovrebbero consentire di raggiungere queste velocità di clock. Intel stessa autorizza l'Intel Core i9-14900K per DDR5 5.600 MT/s. Ma in pratica, l'utilizzo di una memoria di lavoro con velocità di clock superiori non crea problemi, anche se la stabilità potrebbe risentirne. Uno sguardo agli elenchi QVL dei produttori di schede madri mostra quali moduli RAM sono supportati.
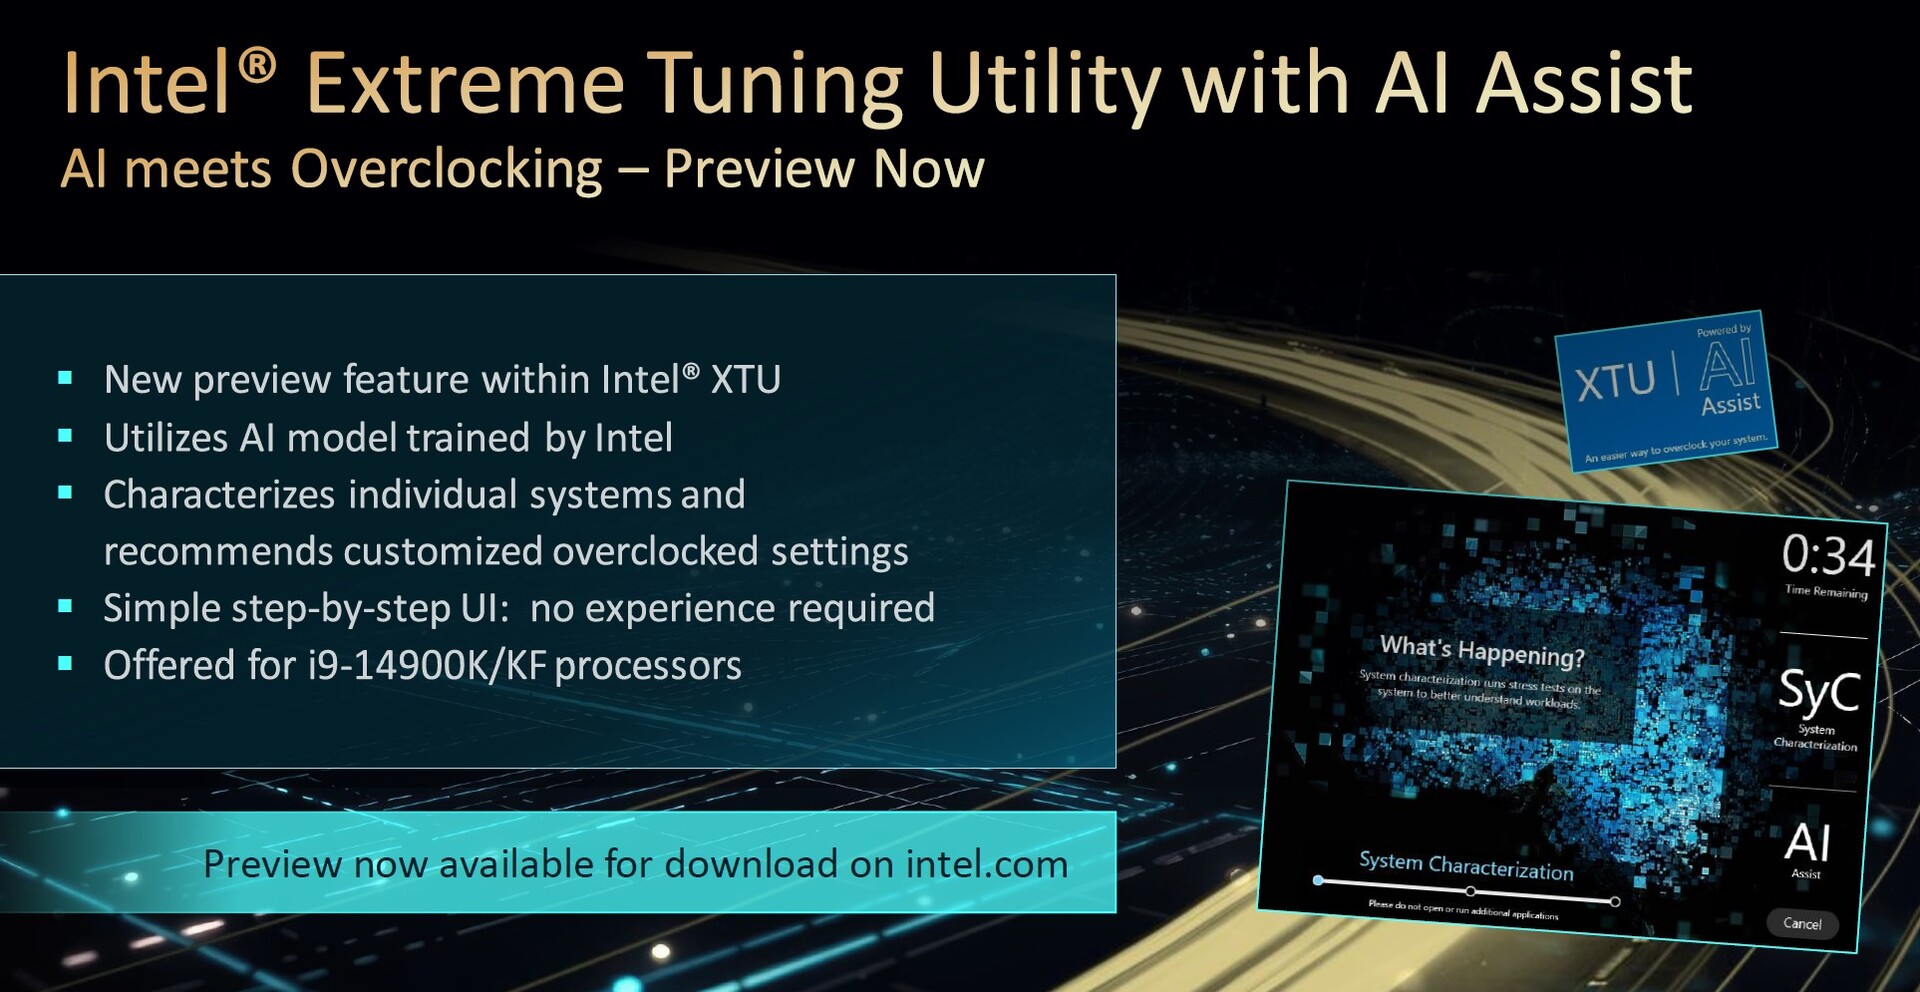
Inoltre, Intel punta sempre più sull'utilizzo dell'AI, che dovrebbe facilitare soprattutto l'overclocking. La versione attuale dell'Intel Extreme Utility (XTU) supporta questo aspetto. Con un solo clic, l'intero sistema viene analizzato per trovare le impostazioni migliori in termini di tensione, moltiplicatore e target di potenza.
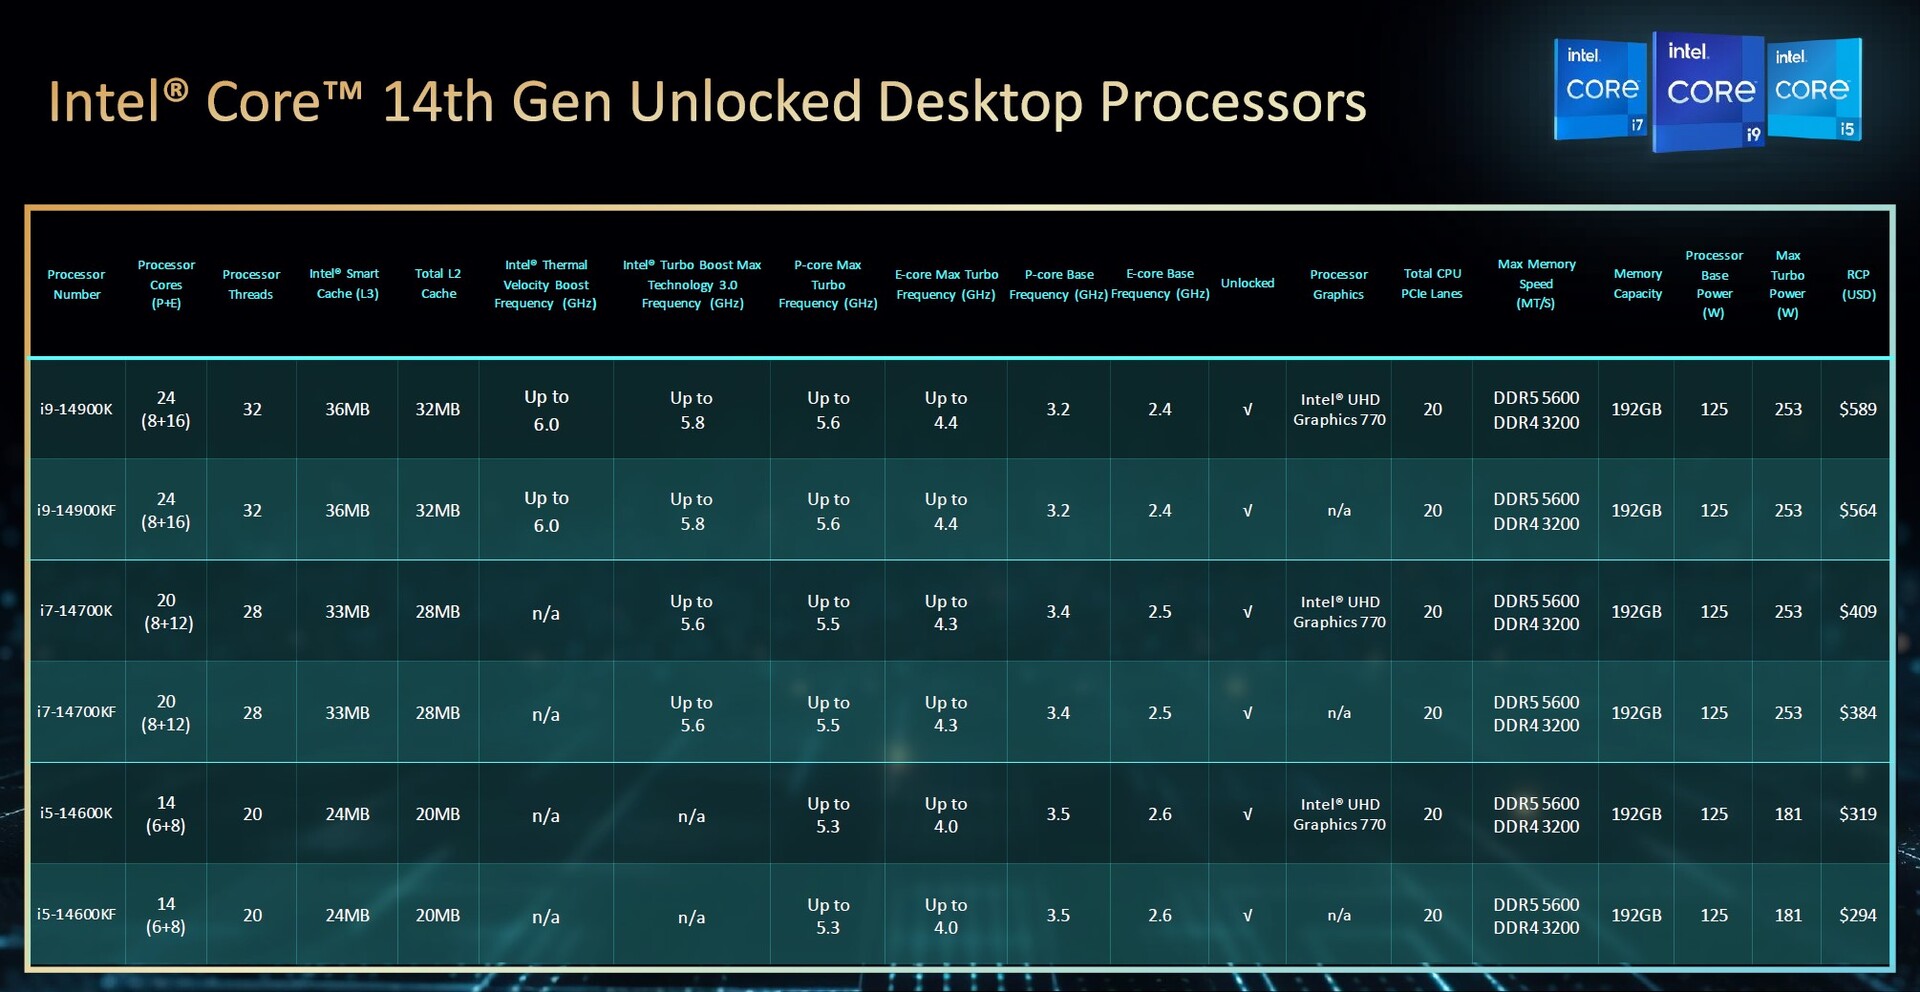
Per questo test, Intel ci ha fornito l'Intel Core i9-14900K e l'Intel Core i5-14600K. Tuttavia, uno sguardo alla tabella dei nuovi processori mostrerà rapidamente che l'Intel Core i7-14700K è chiaramente il prodotto più interessante della serie. Il Core i7 è l'unico modello a ricevere più core, quindi il suo aumento di prestazioni rispetto all'Intel Core i7-13700K dovrebbe essere significativamente più ampio in un confronto diretto. Cercheremo di ottenere anche un campione di questa CPU da sottoporre ai nostri test.
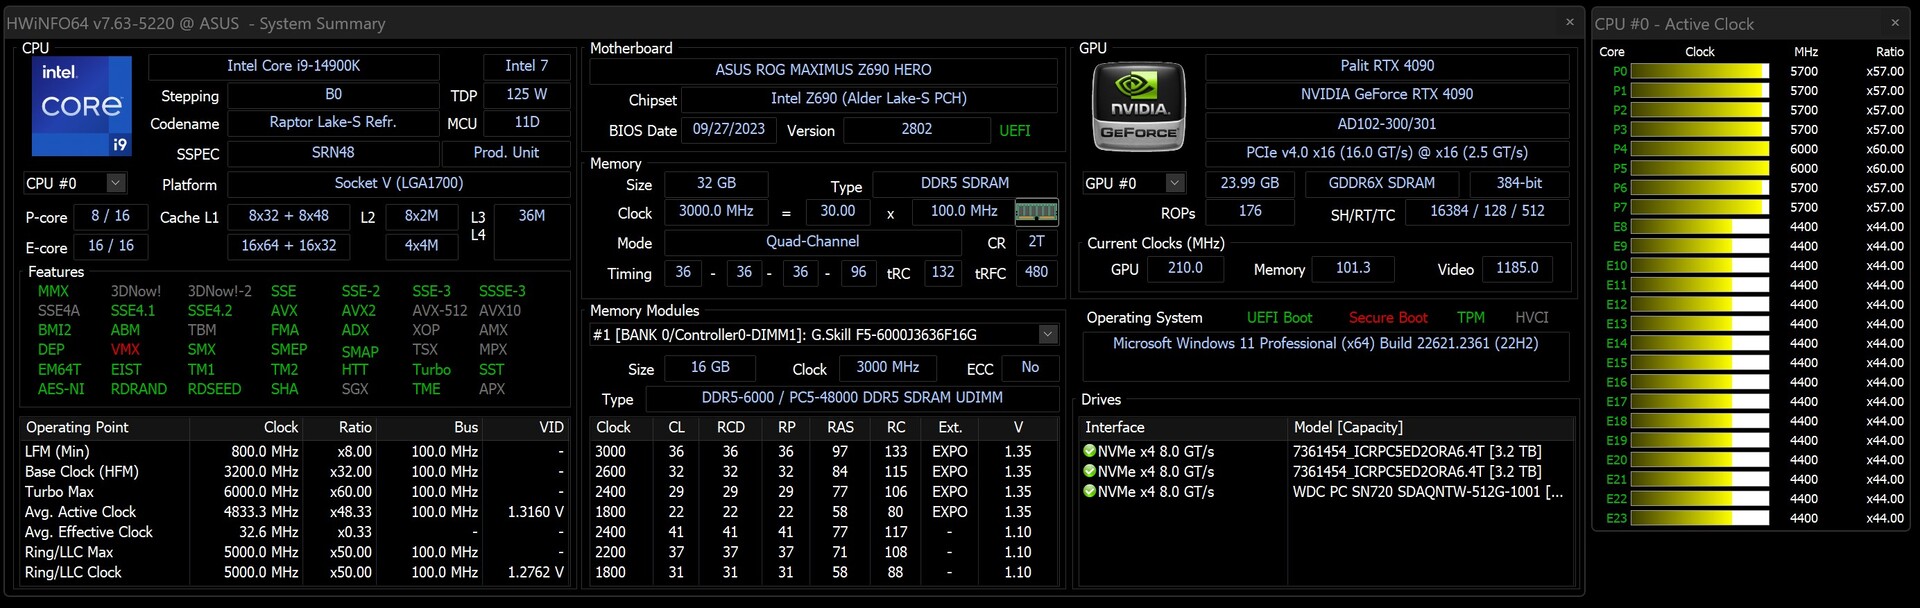
Dettagli sul nostro sistema di test
Per i nostri test e benchmark utilizziamo il seguente sistema:
- Banco di prova aperto Streacom BC1 V2
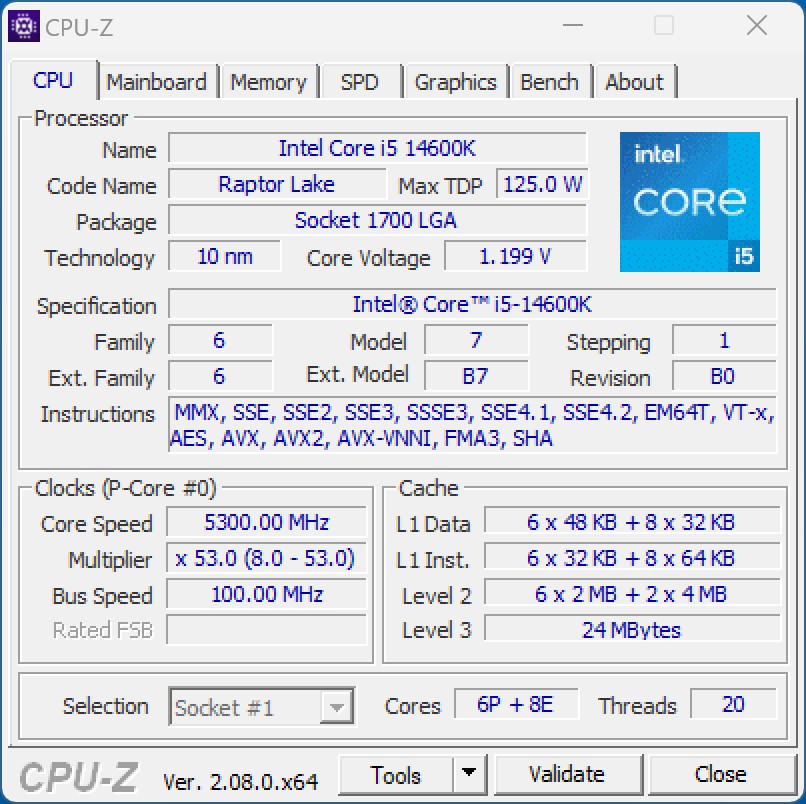
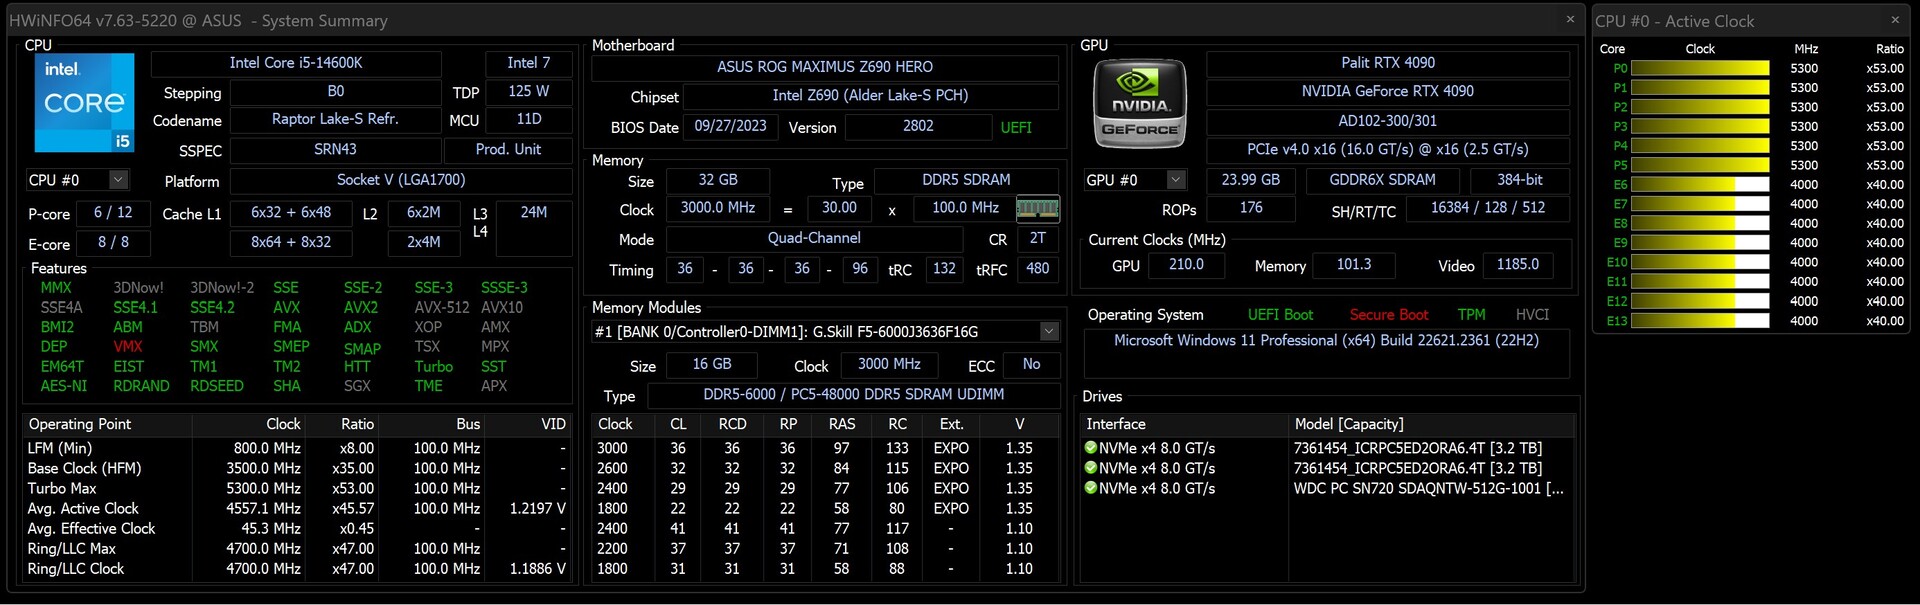
- Intel Core i9-14900K, Intel Core i5-14600K
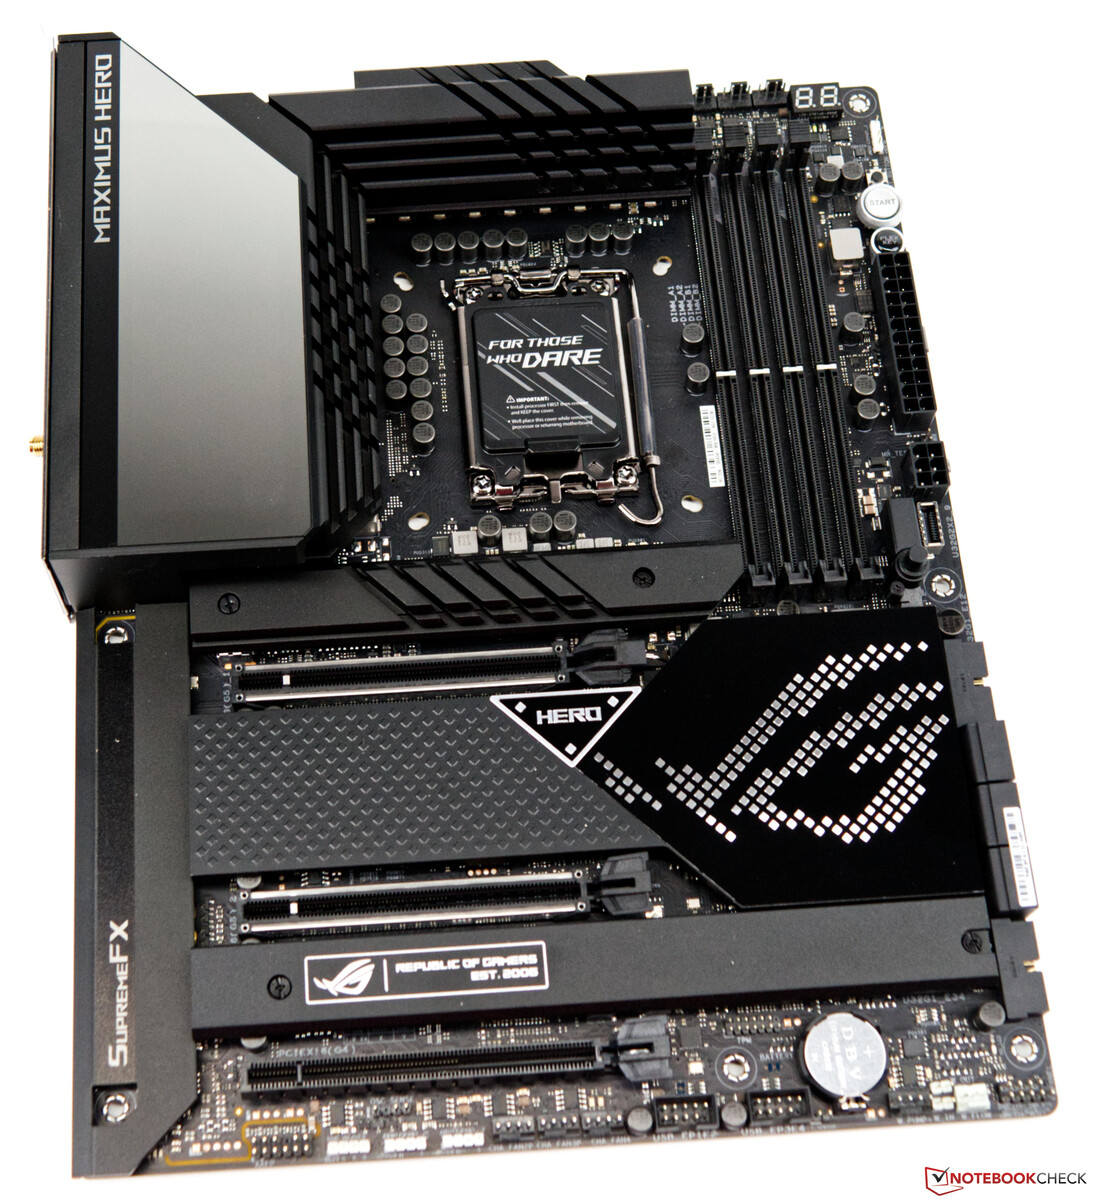
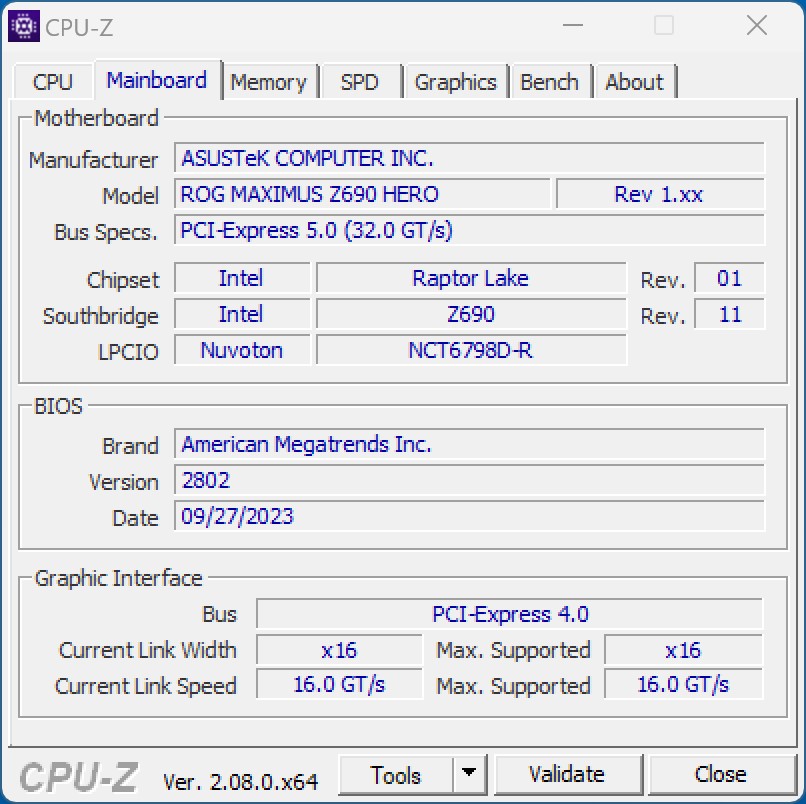
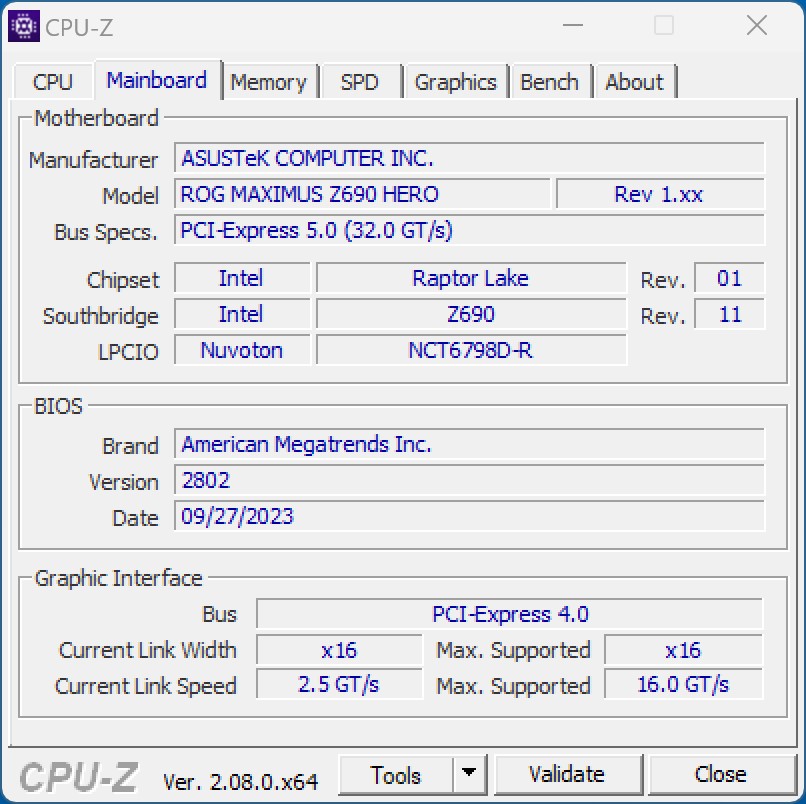
- Asus ROG Maximus Z690 Hero (BIOS v2802)
- Raffreddamento ad acqua ad anello personalizzato (pompa: Watercool WCP D5, radiatore: EK MO-RA3 420 Pro)
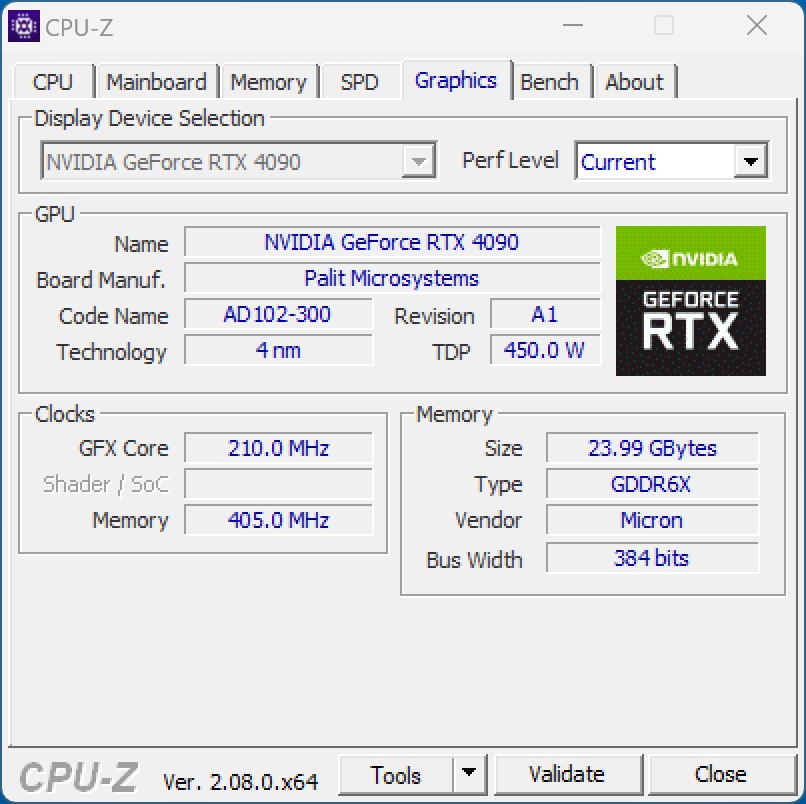
- Nvidia GeForce RTX 4090 Founder's Edition (Driver: 537.42)
- EVGA SuperNOVA P+ 1.600 W
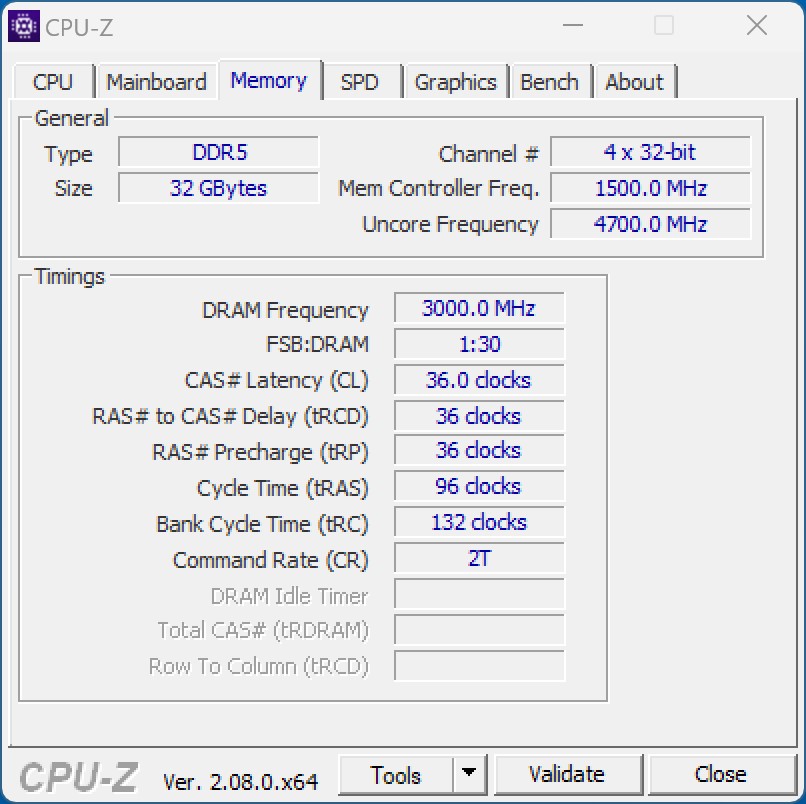
- G.Skill Ripjaws S5 (2x 16 GB - DDR5 6000 XMP)
- Western Digital SN720 - 512 GB (sistema)
- Intel SSD DC P4618 - 6,4 TB (benchmark)
- Microsoft Windows 11 Professional 64 bit (versione 22H2)
Processori Intel a confronto
| Modello | Core / Threads |
P Core Clock Speed / Turbo | E Core Clock Speed / Turbo | Cache L2 + L3 | Grafica | PBP | MTB | Prezzo (MSRP) |
| Core i9-14900K | 24 (8P + 16E) /32 | 3,4 GHz / 6,0 GHz | 2,4 GHz / 4,4 GHz | 32 + 36 MB | UHD770 | 125 Watt | 253 Watt | 589Dollaro USA |
| Core i9-13900K | 24 (8P + 16E) /32 | 3,0 GHz / 5,8 GHz | 2,2 GHz / 4,3 GHz | 32 + 36 MB | UHD 770 | 125 Watt | 253 Watt | 589 dollari USA |
| Core i9-12900K | 16 (8P + 8E) /24 | 3,2 GHz / 5,1 GHz | 2,4 GHz / 3,9 GHz | 14 + 30 MB | UHD 770 | 125 Watt | 241 Watt | 589 Dollari USA |
| Core i7-14700K | 20 (8P + 12E) /28 | 3,4 GHz / 5,6 GHz | 2,5 GHz / 4,3 GHz | 24 + 30 MB | UHD 770 | 125 Watt | 253 Watt | 409 dollari USA |
| Core i7-13700K | 16 (8P + 8E) /24 | 3,4 GHz / 5,4 GHz | 2,5 GHz / 4,2 GHz | 24 + 30 MB | UHD 770 | 125 Watt | 253 Watt | 409 dollari USA |
| Core i7-12700K | 12 (8P + 4E) /20 | 3,6 GHz / 4,9 GHz | 2,7 GHz / 3,8 GHz | 12 + 25 MB | UHD 770 | 125 Watt | 190 Watt | 409 Dollari USA |
| Core i5-14600K | 14 (6P + 8E) /20 | 3,5 GHz / 5,3 GHz | 2,6 GHz / 4,0 GHz | 20 + 24 MB | UHD770 | 125 Watt | 181 Watt | 319 dollari USA |
| Core i5-13600K | 14 (6P + 8E) /20 | 3,5 GHz / 5,1 GHz | 2,6 GHz / 3,9 GHz | 20 + 24 MB | UHD 770 | 125 Watt | 181 Watt | 319 dollari USA |
| Core i5-12600K | 10 (6P + 4E) /16 | 3,7 GHz / 4,9 GHz | 2,8 GHz / 3,6 GHz | 9,5 + 20 MB | UHD 770 | 125 Watt | 150 Watt | 289 Dollari USA |
Condizioni di test - Z690 ancora utilizzabile dopo l'aggiornamento del BIOS
Con Asus ROG Maximus Z690 Hero, per questo test utilizziamo la stessa base che abbiamo già usato per i processori Alder Lake S e Raptor Lake S. Tuttavia, sulla base del chipset Z790, ci sono anche schede madri ridisegnate che dovrebbero spremere prestazioni ancora più elevate dal processore, grazie a migliori funzioni di overclocking. Ma coloro che non sono a caccia di record possono anche far funzionare i nuovi processori di 14esima generazione con un chipset della serie 600. Prima di farlo, deve prima scaricare il BIOS corrispondente dal produttore della scheda madre e aggiornarlo. Per prima cosa abbiamo ricevuto dal produttore una nuova versione del BIOS per la Asus ROG Maximus Z690 Hero. Nel nostro caso non abbiamo riscontrato alcun problema in termini di stabilità e compatibilità della RAM.
Tutti i test sono stati eseguiti con la versione più recente del BIOS (2802) e il profilo XMP attivato. Inoltre, tutte le limitazioni di potenza sono state disattivate per poter ottenere le massime prestazioni dai processori.
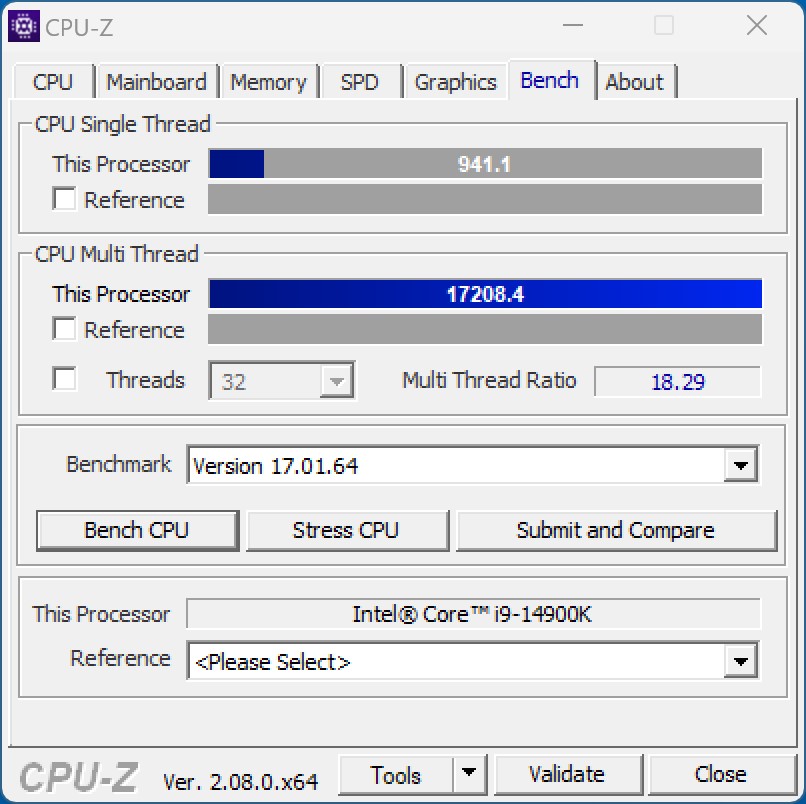
Benchmark del processore
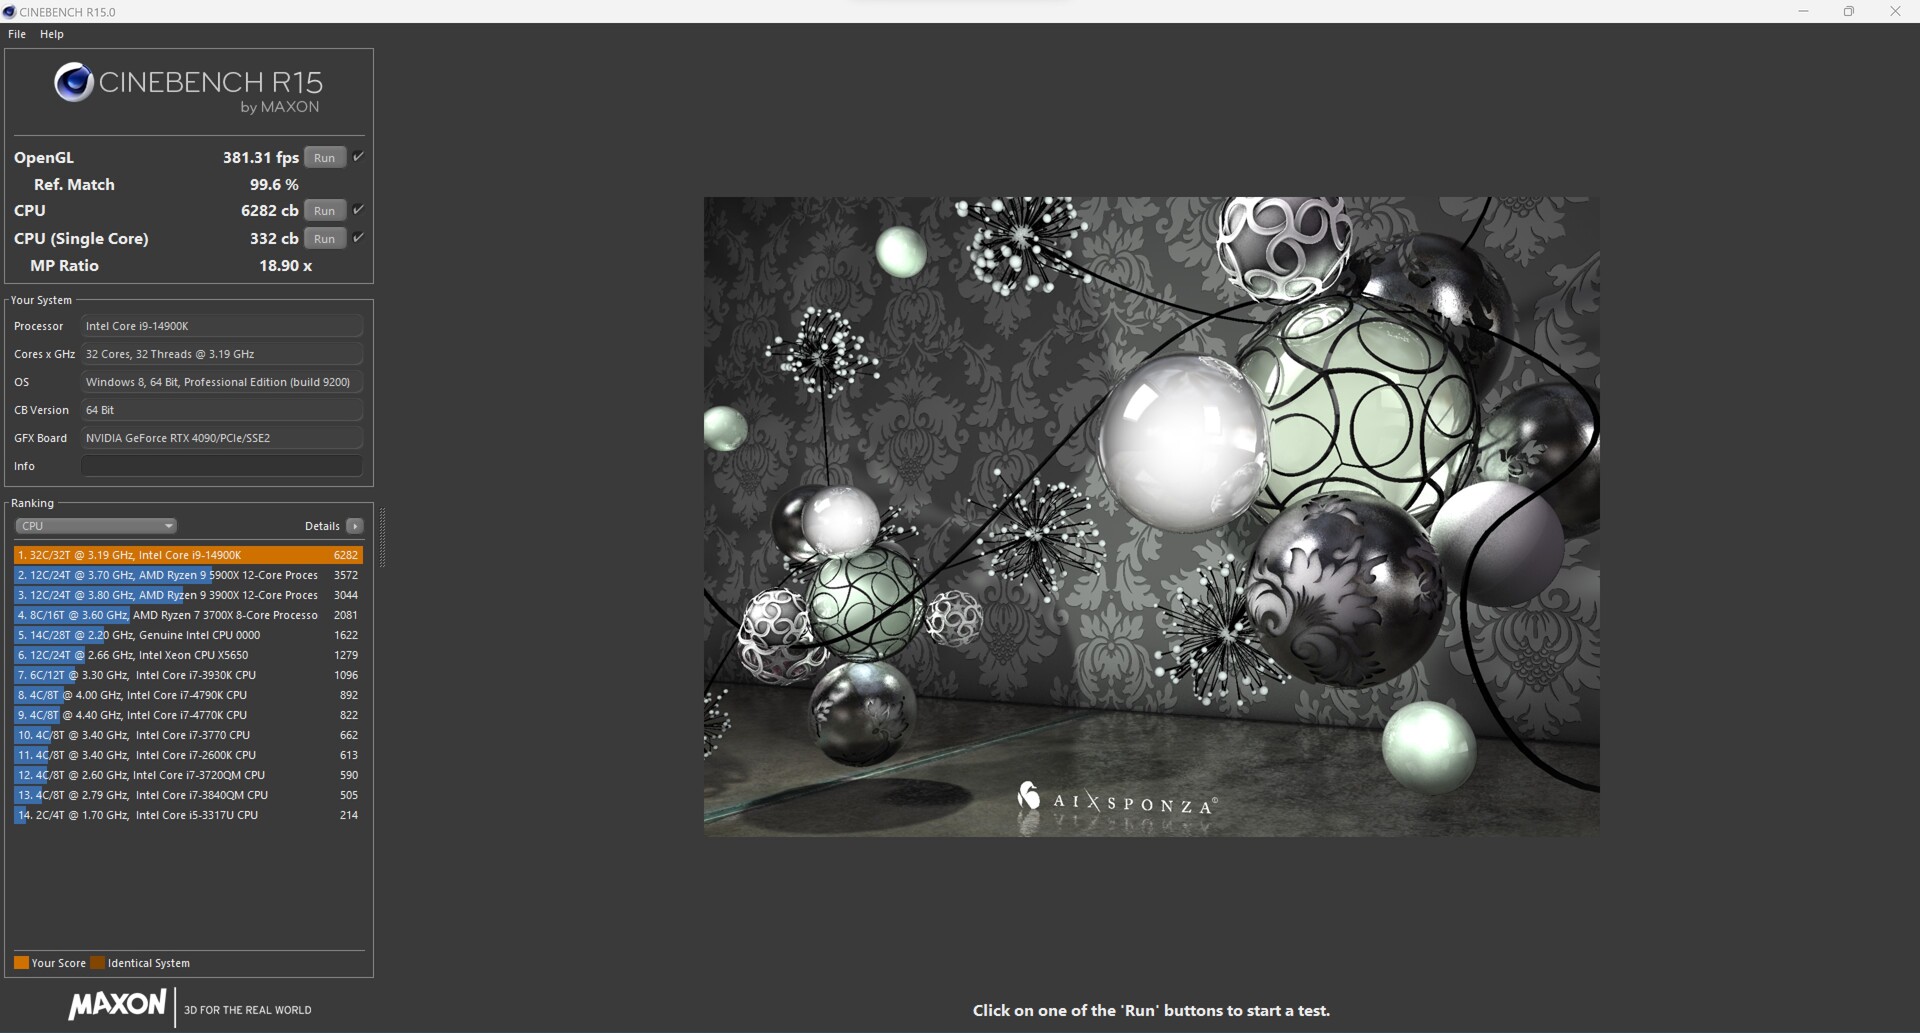
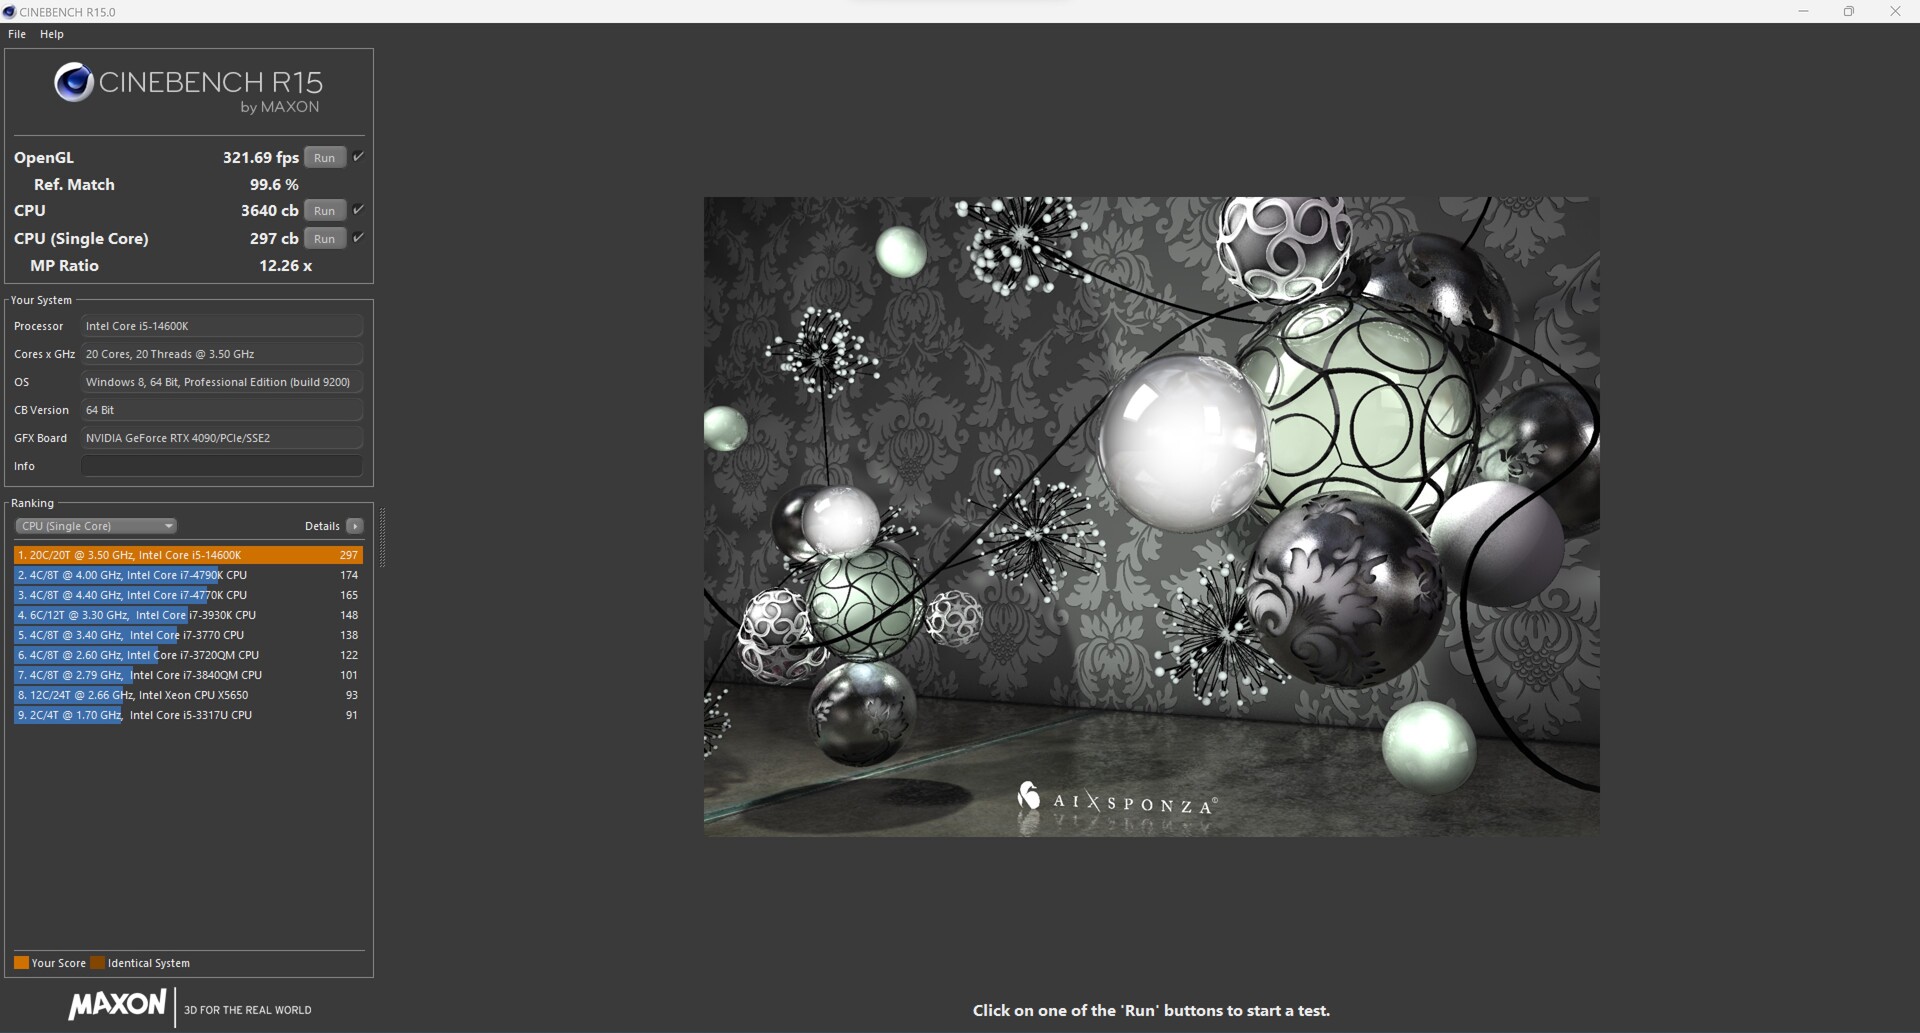
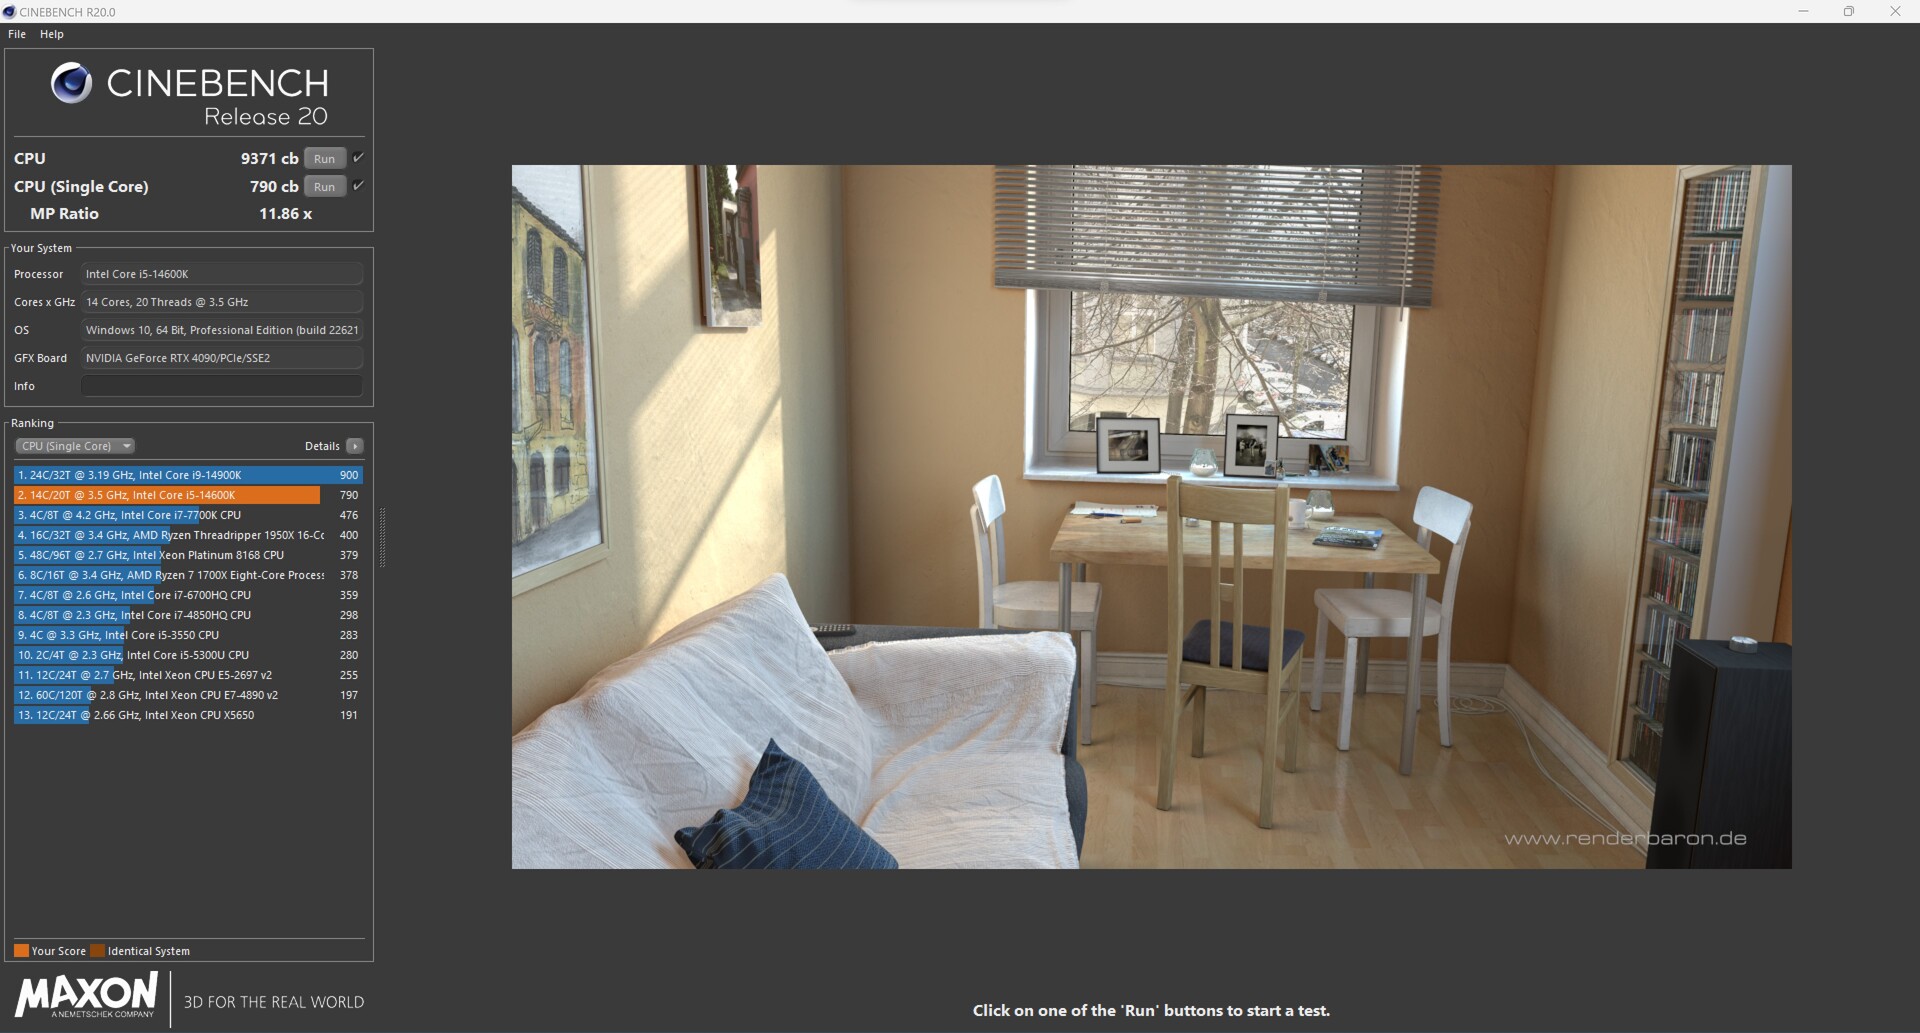
Nei nostri test sulle CPU, Intel è riuscita a superare le prestazioni del Intel Core i9-13900K - ma con soli 3 punti percentuali in più nella valutazione media delle prestazioni, il vantaggio dell'Intel Core i9-14900K si rivela molto piccolo. Anche l'Intel Core i5-14600K si è posizionato davanti al vecchio Intel Core i5-13600K con una piccola distanza. Rispetto ad Alder Lake, il nuovo modello Core-i5 è in grado di competere con un Intel Core i9-12900K.
Nel confronto con AMD, le prestazioni del Ryzen 9 7950Xè stato superato ancora una volta, anche se la differenza è molto piccola anche in questo caso e non si può definire un vantaggio notevole. Il più piccolo Intel Core i5-14600K è stato quasi in grado di tenere il passo con l'AMD Ryzen 9 7900X.AMD Ryzen 9 7900Xe questi due concorrenti sono stati separati solo dal 6% nella nostra valutazione delle prestazioni.
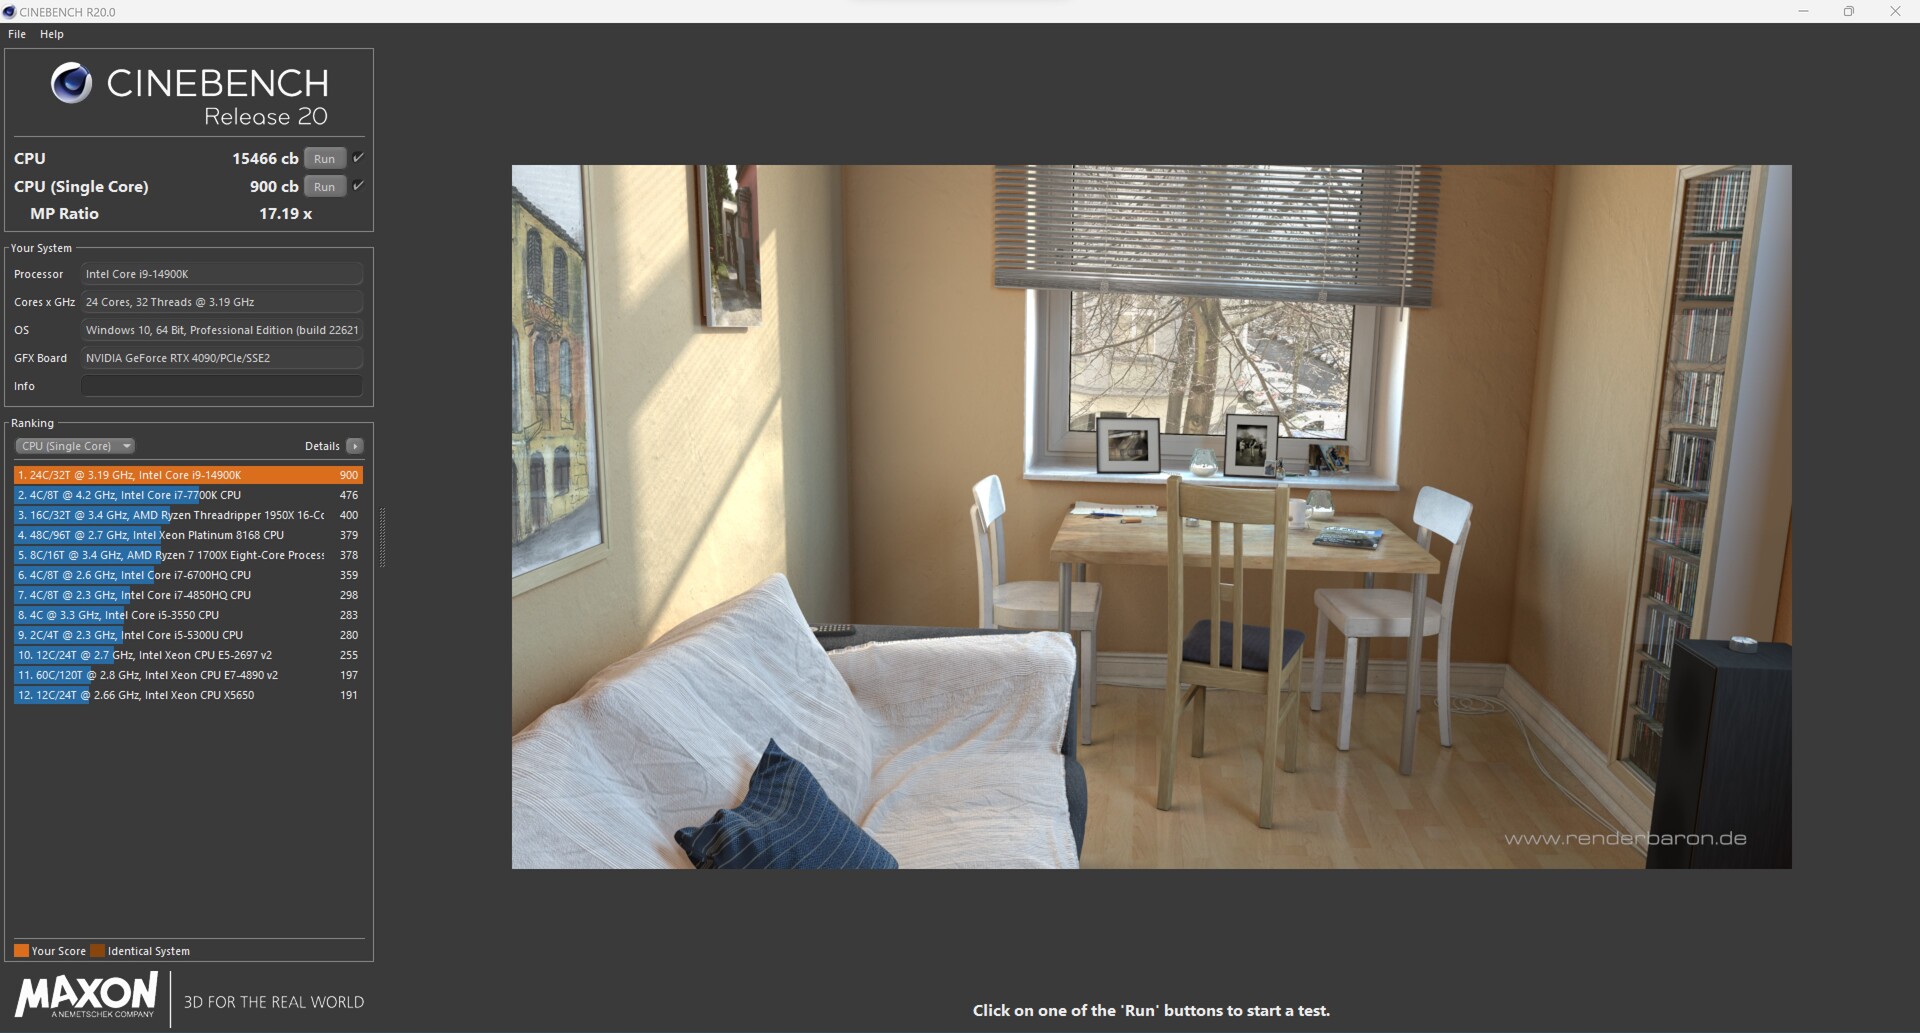
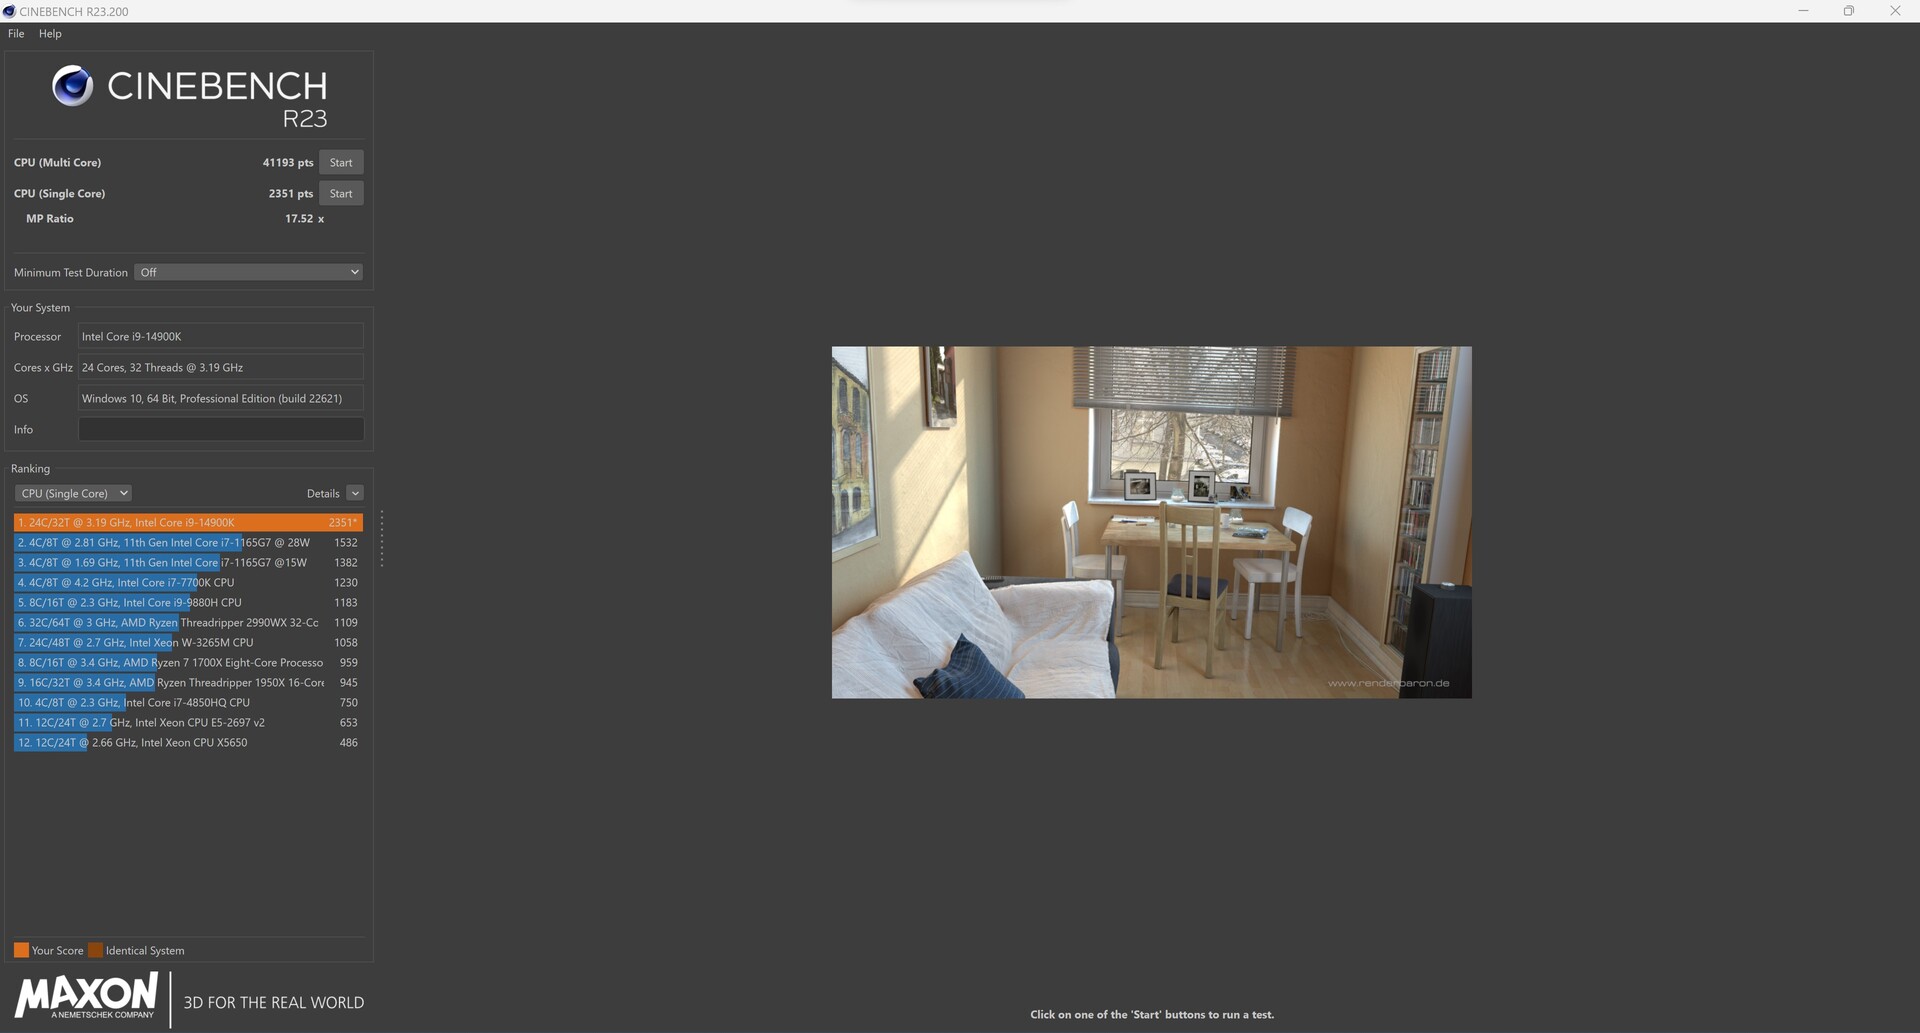
Tuttavia, le differenze di prestazioni risultano significativamente più elevate a seconda del test. Nel complesso, abbiamo notato un chiaro aumento delle prestazioni single-core dell'Intel Core i9-14900K, che non può essere battuto con i suoi 6 GHz.
Può trovare ulteriori benchmark sui processori
qui.Intel Core i9-14900K


Intel Core i5-14600K

| Performance rating - Percent | |
| Intel Core i9-14900K | |
| Intel Core i9-13900K | |
| AMD Ryzen 9 7950X | |
| AMD Ryzen 9 7950X3D | |
| AMD Ryzen 9 7900X | |
| Intel Core i5-14600K | |
| Intel Core i9-12900K | |
| AMD Ryzen 9 5950X | |
| Intel Core i5-13600K | |
| AMD Ryzen 7 7800X3D | |
| AMD Ryzen 5 7600X | |
| Intel Core i5-12600K | |
| Intel Core i5-13400 | |
| Intel Core i5-12400F | |
| Cinebench R15 | |
| CPU Single 64Bit | |
| Intel Core i9-14900K | |
| AMD Ryzen 9 7950X | |
| Intel Core i9-13900K | |
| AMD Ryzen 9 7950X3D | |
| AMD Ryzen 9 7900X | |
| AMD Ryzen 5 7600X | |
| Intel Core i5-14600K | |
| AMD Ryzen 7 7800X3D | |
| Intel Core i5-13600K | |
| Intel Core i9-12900K | |
| Intel Core i5-12600K | |
| AMD Ryzen 9 5950X | |
| Intel Core i5-13400 | |
| Intel Core i5-12400F | |
| CPU Multi 64Bit | |
| Intel Core i9-14900K | |
| AMD Ryzen 9 7950X | |
| Intel Core i9-13900K | |
| AMD Ryzen 9 7950X3D | |
| AMD Ryzen 9 7900X | |
| AMD Ryzen 9 5950X | |
| Intel Core i9-12900K | |
| Intel Core i5-13600K | |
| Intel Core i5-14600K | |
| AMD Ryzen 7 7800X3D | |
| Intel Core i5-12600K | |
| AMD Ryzen 5 7600X | |
| Intel Core i5-13400 | |
| Intel Core i5-12400F | |
| Cinebench R20 | |
| CPU (Single Core) | |
| Intel Core i9-14900K | |
| Intel Core i9-13900K | |
| AMD Ryzen 9 7950X | |
| AMD Ryzen 9 7950X3D | |
| Intel Core i5-14600K | |
| AMD Ryzen 9 7900X | |
| Intel Core i5-13600K | |
| Intel Core i9-12900K | |
| AMD Ryzen 5 7600X | |
| Intel Core i5-12600K | |
| AMD Ryzen 7 7800X3D | |
| Intel Core i5-13400 | |
| Intel Core i5-12400F | |
| AMD Ryzen 9 5950X | |
| CPU (Multi Core) | |
| Intel Core i9-14900K | |
| Intel Core i9-13900K | |
| AMD Ryzen 9 7950X | |
| AMD Ryzen 9 7950X3D | |
| AMD Ryzen 9 7900X | |
| AMD Ryzen 9 5950X | |
| Intel Core i9-12900K | |
| Intel Core i5-14600K | |
| Intel Core i5-13600K | |
| AMD Ryzen 7 7800X3D | |
| Intel Core i5-12600K | |
| Intel Core i5-13400 | |
| AMD Ryzen 5 7600X | |
| Intel Core i5-12400F | |
| Cinebench R23 | |
| Single Core | |
| Intel Core i9-14900K | |
| Intel Core i9-13900K | |
| Intel Core i5-14600K | |
| AMD Ryzen 9 7950X3D | |
| AMD Ryzen 9 7950X | |
| AMD Ryzen 9 7900X | |
| Intel Core i5-13600K | |
| Intel Core i9-12900K | |
| AMD Ryzen 5 7600X | |
| Intel Core i5-12600K | |
| AMD Ryzen 7 7800X3D | |
| Intel Core i5-13400 | |
| Intel Core i5-12400F | |
| AMD Ryzen 9 5950X | |
| Multi Core | |
| Intel Core i9-14900K | |
| Intel Core i9-13900K | |
| AMD Ryzen 9 7950X | |
| AMD Ryzen 9 7950X3D | |
| AMD Ryzen 9 7900X | |
| AMD Ryzen 9 5950X | |
| Intel Core i9-12900K | |
| Intel Core i5-14600K | |
| Intel Core i5-13600K | |
| AMD Ryzen 7 7800X3D | |
| Intel Core i5-12600K | |
| Intel Core i5-13400 | |
| AMD Ryzen 5 7600X | |
| Intel Core i5-12400F | |
| Cinebench R11.5 | |
| CPU Single 64Bit | |
| Intel Core i9-14900K | |
| Intel Core i9-13900K | |
| AMD Ryzen 9 7950X | |
| AMD Ryzen 9 7950X3D | |
| AMD Ryzen 9 7900X | |
| AMD Ryzen 5 7600X | |
| Intel Core i5-14600K | |
| Intel Core i9-12900K | |
| Intel Core i5-13600K | |
| AMD Ryzen 7 7800X3D | |
| Intel Core i5-12600K | |
| AMD Ryzen 9 5950X | |
| Intel Core i5-13400 | |
| Intel Core i5-12400F | |
| CPU Multi 64Bit | |
| Intel Core i9-14900K | |
| Intel Core i9-13900K | |
| AMD Ryzen 9 7950X | |
| AMD Ryzen 9 7950X3D | |
| AMD Ryzen 9 7900X | |
| AMD Ryzen 9 5950X | |
| Intel Core i9-12900K | |
| Intel Core i5-13600K | |
| Intel Core i5-14600K | |
| AMD Ryzen 7 7800X3D | |
| Intel Core i5-12600K | |
| AMD Ryzen 5 7600X | |
| Intel Core i5-13400 | |
| Intel Core i5-12400F | |
| Cinebench R10 | |
| Rendering Single CPUs 64Bit | |
| Intel Core i9-14900K | |
| Intel Core i9-13900K | |
| Intel Core i5-14600K | |
| AMD Ryzen 9 7900X | |
| AMD Ryzen 9 7950X | |
| Intel Core i5-13600K | |
| Intel Core i9-12900K | |
| AMD Ryzen 5 7600X | |
| Intel Core i5-12600K | |
| AMD Ryzen 7 7800X3D | |
| Intel Core i5-13400 | |
| Intel Core i5-12400F | |
| AMD Ryzen 9 5950X | |
| AMD Ryzen 9 7950X3D | |
| Rendering Multiple CPUs 64Bit | |
| Intel Core i9-14900K | |
| Intel Core i9-13900K | |
| AMD Ryzen 9 7950X | |
| AMD Ryzen 9 7900X | |
| Intel Core i5-14600K | |
| Intel Core i9-12900K | |
| Intel Core i5-13600K | |
| AMD Ryzen 9 5950X | |
| AMD Ryzen 7 7800X3D | |
| AMD Ryzen 5 7600X | |
| Intel Core i5-12600K | |
| Intel Core i5-13400 | |
| AMD Ryzen 9 7950X3D | |
| Intel Core i5-12400F | |
| Blender - v2.79 BMW27 CPU | |
| Intel Core i5-12400F | |
| Intel Core i5-13400 | |
| AMD Ryzen 5 7600X | |
| Intel Core i5-12600K | |
| AMD Ryzen 7 7800X3D | |
| Intel Core i5-13600K | |
| Intel Core i5-14600K | |
| Intel Core i9-12900K | |
| AMD Ryzen 9 5950X | |
| AMD Ryzen 9 7900X | |
| AMD Ryzen 9 7950X3D | |
| AMD Ryzen 9 7950X | |
| Intel Core i9-13900K | |
| Intel Core i9-14900K | |
| wPrime 2.10 | |
| 32m | |
| Intel Core i9-12900K | |
| Intel Core i5-12600K | |
| Intel Core i5-12400F | |
| Intel Core i5-13400 | |
| AMD Ryzen 5 7600X | |
| AMD Ryzen 9 5950X | |
| Intel Core i5-13600K | |
| AMD Ryzen 7 7800X3D | |
| Intel Core i5-14600K | |
| Intel Core i9-14900K | |
| AMD Ryzen 9 7950X3D | |
| Intel Core i9-13900K | |
| AMD Ryzen 9 7900X | |
| AMD Ryzen 9 7950X | |
| 1024m | |
| Intel Core i5-13400 | |
| Intel Core i5-12600K | |
| Intel Core i9-12900K | |
| Intel Core i5-13600K | |
| Intel Core i5-14600K | |
| Intel Core i5-12400F | |
| Intel Core i9-13900K | |
| AMD Ryzen 5 7600X | |
| Intel Core i9-14900K | |
| AMD Ryzen 9 5950X | |
| AMD Ryzen 7 7800X3D | |
| AMD Ryzen 9 7900X | |
| AMD Ryzen 9 7950X3D | |
| AMD Ryzen 9 7950X | |
| X264 HD Benchmark 4.0 | |
| Pass 1 | |
| Intel Core i9-14900K | |
| Intel Core i9-13900K | |
| Intel Core i5-14600K | |
| AMD Ryzen 9 7950X3D | |
| Intel Core i5-13600K | |
| AMD Ryzen 9 7950X | |
| AMD Ryzen 9 7900X | |
| Intel Core i9-12900K | |
| AMD Ryzen 5 7600X | |
| AMD Ryzen 7 7800X3D | |
| AMD Ryzen 9 5950X | |
| Intel Core i5-12600K | |
| Intel Core i5-13400 | |
| Intel Core i5-12400F | |
| Pass 2 | |
| Intel Core i9-14900K | |
| Intel Core i9-13900K | |
| AMD Ryzen 9 7950X | |
| AMD Ryzen 9 7950X3D | |
| AMD Ryzen 9 7900X | |
| AMD Ryzen 9 5950X | |
| Intel Core i5-14600K | |
| Intel Core i9-12900K | |
| Intel Core i5-13600K | |
| AMD Ryzen 7 7800X3D | |
| Intel Core i5-12600K | |
| AMD Ryzen 5 7600X | |
| Intel Core i5-13400 | |
| Intel Core i5-12400F | |
| WinRAR - Result | |
| AMD Ryzen 9 7900X | |
| AMD Ryzen 7 7800X3D | |
| AMD Ryzen 9 7950X | |
| AMD Ryzen 5 7600X | |
| Intel Core i9-14900K | |
| AMD Ryzen 9 7950X3D | |
| Intel Core i9-13900K | |
| AMD Ryzen 9 5950X | |
| Intel Core i5-14600K | |
| Intel Core i5-13600K | |
| Intel Core i9-12900K | |
| Intel Core i5-13400 | |
| Intel Core i5-12400F | |
| Intel Core i5-12600K | |
| TrueCrypt | |
| AES Mean 100MB | |
| AMD Ryzen 9 7950X | |
| Intel Core i9-13900K | |
| AMD Ryzen 9 5950X | |
| AMD Ryzen 9 7950X3D | |
| Intel Core i9-14900K | |
| Intel Core i5-14600K | |
| Intel Core i5-13600K | |
| Intel Core i9-12900K | |
| AMD Ryzen 7 7800X3D | |
| AMD Ryzen 9 7900X | |
| AMD Ryzen 5 7600X | |
| Intel Core i5-12600K | |
| Intel Core i5-13400 | |
| Intel Core i5-12400F | |
| Twofish Mean 100MB | |
| Intel Core i9-14900K | |
| Intel Core i9-13900K | |
| AMD Ryzen 9 7950X | |
| AMD Ryzen 9 7950X3D | |
| AMD Ryzen 9 5950X | |
| Intel Core i9-12900K | |
| Intel Core i5-14600K | |
| Intel Core i5-13600K | |
| AMD Ryzen 9 7900X | |
| Intel Core i5-12600K | |
| AMD Ryzen 7 7800X3D | |
| Intel Core i5-13400 | |
| AMD Ryzen 5 7600X | |
| Intel Core i5-12400F | |
| Serpent Mean 100MB | |
| Intel Core i9-13900K | |
| AMD Ryzen 9 7950X | |
| AMD Ryzen 9 7950X3D | |
| Intel Core i9-14900K | |
| AMD Ryzen 9 5950X | |
| Intel Core i9-12900K | |
| Intel Core i5-14600K | |
| Intel Core i5-13600K | |
| AMD Ryzen 9 7900X | |
| Intel Core i5-12600K | |
| AMD Ryzen 7 7800X3D | |
| Intel Core i5-13400 | |
| AMD Ryzen 5 7600X | |
| Intel Core i5-12400F | |
| Geekbench 5.5 | |
| Multi-Core | |
| Intel Core i9-14900K | |
| AMD Ryzen 9 7950X | |
| AMD Ryzen 9 7950X3D | |
| Intel Core i9-13900K | |
| AMD Ryzen 9 7900X | |
| Intel Core i9-12900K | |
| Intel Core i5-14600K | |
| AMD Ryzen 9 5950X | |
| Intel Core i5-13600K | |
| AMD Ryzen 7 7800X3D | |
| Intel Core i5-12600K | |
| Intel Core i5-13400 | |
| AMD Ryzen 5 7600X | |
| Intel Core i5-12400F | |
| Single-Core | |
| AMD Ryzen 9 7950X | |
| AMD Ryzen 9 7950X3D | |
| Intel Core i9-13900K | |
| AMD Ryzen 9 7900X | |
| Intel Core i9-14900K | |
| AMD Ryzen 5 7600X | |
| Intel Core i9-12900K | |
| AMD Ryzen 7 7800X3D | |
| Intel Core i5-14600K | |
| Intel Core i5-13600K | |
| Intel Core i5-12600K | |
| Intel Core i5-13400 | |
| Intel Core i5-12400F | |
| AMD Ryzen 9 5950X | |
| Geekbench 5.0 | |
| 5.0 Multi-Core | |
| Intel Core i9-14900K | |
| AMD Ryzen 9 7950X | |
| Intel Core i9-13900K | |
| AMD Ryzen 9 7950X3D | |
| AMD Ryzen 9 7900X | |
| Intel Core i9-12900K | |
| Intel Core i5-14600K | |
| Intel Core i5-13600K | |
| AMD Ryzen 9 5950X | |
| AMD Ryzen 7 7800X3D | |
| Intel Core i5-12600K | |
| AMD Ryzen 5 7600X | |
| Intel Core i5-13400 | |
| Intel Core i5-12400F | |
| 5.0 Single-Core | |
| Intel Core i9-14900K | |
| AMD Ryzen 9 7950X | |
| Intel Core i9-13900K | |
| AMD Ryzen 9 7900X | |
| AMD Ryzen 9 7950X3D | |
| AMD Ryzen 5 7600X | |
| Intel Core i5-14600K | |
| Intel Core i9-12900K | |
| AMD Ryzen 7 7800X3D | |
| Intel Core i5-13600K | |
| Intel Core i5-12600K | |
| Intel Core i5-13400 | |
| AMD Ryzen 9 5950X | |
| Intel Core i5-12400F | |
| Geekbench 4.4 | |
| 64 Bit Single-Core Score | |
| Intel Core i9-14900K | |
| Intel Core i9-13900K | |
| AMD Ryzen 9 7950X | |
| AMD Ryzen 9 7950X3D | |
| AMD Ryzen 9 7900X | |
| AMD Ryzen 7 7800X3D | |
| AMD Ryzen 5 7600X | |
| Intel Core i5-14600K | |
| Intel Core i9-12900K | |
| Intel Core i5-13600K | |
| Intel Core i5-12600K | |
| Intel Core i5-13400 | |
| Intel Core i5-12400F | |
| AMD Ryzen 9 5950X | |
| 64 Bit Multi-Core Score | |
| AMD Ryzen 9 7950X | |
| Intel Core i9-14900K | |
| AMD Ryzen 9 7950X3D | |
| Intel Core i9-13900K | |
| AMD Ryzen 9 7900X | |
| Intel Core i5-14600K | |
| Intel Core i9-12900K | |
| AMD Ryzen 9 5950X | |
| Intel Core i5-13600K | |
| AMD Ryzen 7 7800X3D | |
| AMD Ryzen 5 7600X | |
| Intel Core i5-12600K | |
| Intel Core i5-13400 | |
| Intel Core i5-12400F | |
| 3DMark 11 - 1280x720 Performance Physics | |
| AMD Ryzen 9 7950X3D | |
| AMD Ryzen 7 7800X3D | |
| Intel Core i9-13900K | |
| Intel Core i9-14900K | |
| Intel Core i5-14600K | |
| Intel Core i5-13600K | |
| AMD Ryzen 9 7900X | |
| AMD Ryzen 9 7950X | |
| Intel Core i9-12900K | |
| AMD Ryzen 5 7600X | |
| AMD Ryzen 9 5950X | |
| Intel Core i5-12600K | |
| Intel Core i5-13400 | |
| Intel Core i5-12400F | |
| 7-Zip 18.03 | |
| 7z b 4 | |
| AMD Ryzen 9 7950X | |
| AMD Ryzen 9 7950X3D | |
| Intel Core i9-14900K | |
| Intel Core i9-13900K | |
| AMD Ryzen 9 5950X | |
| AMD Ryzen 9 7900X | |
| Intel Core i9-12900K | |
| Intel Core i5-14600K | |
| Intel Core i5-13600K | |
| AMD Ryzen 7 7800X3D | |
| AMD Ryzen 5 7600X | |
| Intel Core i5-12600K | |
| Intel Core i5-13400 | |
| Intel Core i5-12400F | |
| 7z b 4 -mmt1 | |
| AMD Ryzen 9 7950X | |
| AMD Ryzen 9 7950X3D | |
| AMD Ryzen 9 7900X | |
| AMD Ryzen 7 7800X3D | |
| AMD Ryzen 5 7600X | |
| Intel Core i9-14900K | |
| Intel Core i9-13900K | |
| AMD Ryzen 9 5950X | |
| Intel Core i5-14600K | |
| Intel Core i9-12900K | |
| Intel Core i5-13600K | |
| Intel Core i5-12600K | |
| Intel Core i5-13400 | |
| Intel Core i5-12400F | |
| HWBOT x265 Benchmark v2.2 - 4k Preset | |
| AMD Ryzen 9 7950X | |
| Intel Core i9-14900K | |
| Intel Core i9-13900K | |
| AMD Ryzen 9 7950X3D | |
| AMD Ryzen 9 7900X | |
| AMD Ryzen 9 5950X | |
| Intel Core i5-12600K | |
| Intel Core i9-12900K | |
| Intel Core i5-14600K | |
| Intel Core i5-13600K | |
| AMD Ryzen 7 7800X3D | |
| AMD Ryzen 5 7600X | |
| Intel Core i5-13400 | |
| Intel Core i5-12400F | |
| R Benchmark 2.5 - Overall mean | |
| Intel Core i5-12400F | |
| Intel Core i5-13400 | |
| AMD Ryzen 9 5950X | |
| Intel Core i5-12600K | |
| Intel Core i9-12900K | |
| AMD Ryzen 7 7800X3D | |
| Intel Core i5-13600K | |
| Intel Core i5-14600K | |
| AMD Ryzen 5 7600X | |
| AMD Ryzen 9 7900X | |
| AMD Ryzen 9 7950X3D | |
| AMD Ryzen 9 7950X | |
| Intel Core i9-13900K | |
| Intel Core i9-14900K | |
| LibreOffice - 20 Documents To PDF | |
| Intel Core i5-12600K | |
| Intel Core i5-12400F | |
| AMD Ryzen 9 5950X | |
| AMD Ryzen 7 7800X3D | |
| Intel Core i9-12900K | |
| Intel Core i5-13400 | |
| AMD Ryzen 9 7950X3D | |
| AMD Ryzen 5 7600X | |
| Intel Core i9-13900K | |
| AMD Ryzen 9 7950X | |
| Intel Core i5-13600K | |
| AMD Ryzen 9 7900X | |
| Intel Core i9-14900K | |
| Intel Core i5-14600K | |
| WebXPRT 3 - Overall | |
| AMD Ryzen 9 7950X3D | |
| Intel Core i9-14900K | |
| AMD Ryzen 9 7900X | |
| AMD Ryzen 9 7950X | |
| AMD Ryzen 5 7600X | |
| Intel Core i9-13900K | |
| Intel Core i5-14600K | |
| AMD Ryzen 7 7800X3D | |
| Intel Core i5-13600K | |
| Intel Core i9-12900K | |
| Intel Core i5-13400 | |
| Intel Core i5-12600K | |
| AMD Ryzen 9 5950X | |
| Intel Core i5-12400F | |
| Mozilla Kraken 1.1 - Total | |
| Intel Core i5-12400F | |
| AMD Ryzen 9 5950X | |
| Intel Core i5-13400 | |
| Intel Core i5-12600K | |
| AMD Ryzen 7 7800X3D | |
| Intel Core i9-12900K | |
| Intel Core i5-13600K | |
| Intel Core i5-14600K | |
| AMD Ryzen 5 7600X | |
| AMD Ryzen 9 7950X3D | |
| AMD Ryzen 9 7950X | |
| Intel Core i9-13900K | |
| AMD Ryzen 9 7900X | |
| Intel Core i9-14900K | |
| 3DMark | |
| 3840x2160 Fire Strike Ultra Physics | |
| Intel Core i9-14900K | |
| Intel Core i9-13900K | |
| AMD Ryzen 9 7950X3D | |
| AMD Ryzen 9 7900X | |
| AMD Ryzen 9 7950X | |
| Intel Core i5-14600K | |
| Intel Core i9-12900K | |
| AMD Ryzen 9 5950X | |
| Intel Core i5-13600K | |
| AMD Ryzen 7 7800X3D | |
| AMD Ryzen 5 7600X | |
| Intel Core i5-12600K | |
| Intel Core i5-13400 | |
| Intel Core i5-12400F | |
| 1920x1080 Fire Strike Physics | |
| Intel Core i9-14900K | |
| Intel Core i9-13900K | |
| AMD Ryzen 9 7950X3D | |
| AMD Ryzen 9 7900X | |
| AMD Ryzen 9 7950X | |
| Intel Core i5-14600K | |
| AMD Ryzen 9 5950X | |
| Intel Core i9-12900K | |
| Intel Core i5-13600K | |
| AMD Ryzen 7 7800X3D | |
| AMD Ryzen 5 7600X | |
| Intel Core i5-12600K | |
| Intel Core i5-13400 | |
| Intel Core i5-12400F | |
| 2560x1440 Time Spy CPU | |
| Intel Core i9-14900K | |
| Intel Core i9-13900K | |
| Intel Core i5-14600K | |
| Intel Core i9-12900K | |
| AMD Ryzen 9 7950X3D | |
| Intel Core i5-13600K | |
| AMD Ryzen 9 7900X | |
| AMD Ryzen 9 7950X | |
| AMD Ryzen 7 7800X3D | |
| Intel Core i5-12600K | |
| AMD Ryzen 9 5950X | |
| Intel Core i5-13400 | |
| AMD Ryzen 5 7600X | |
| Intel Core i5-12400F | |
* ... Meglio usare valori piccoli
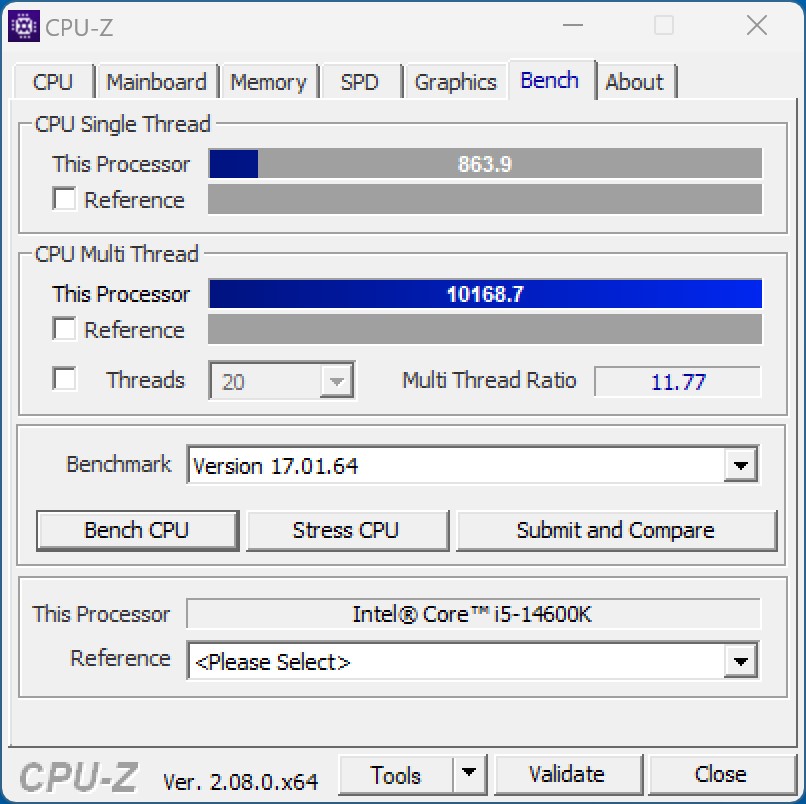
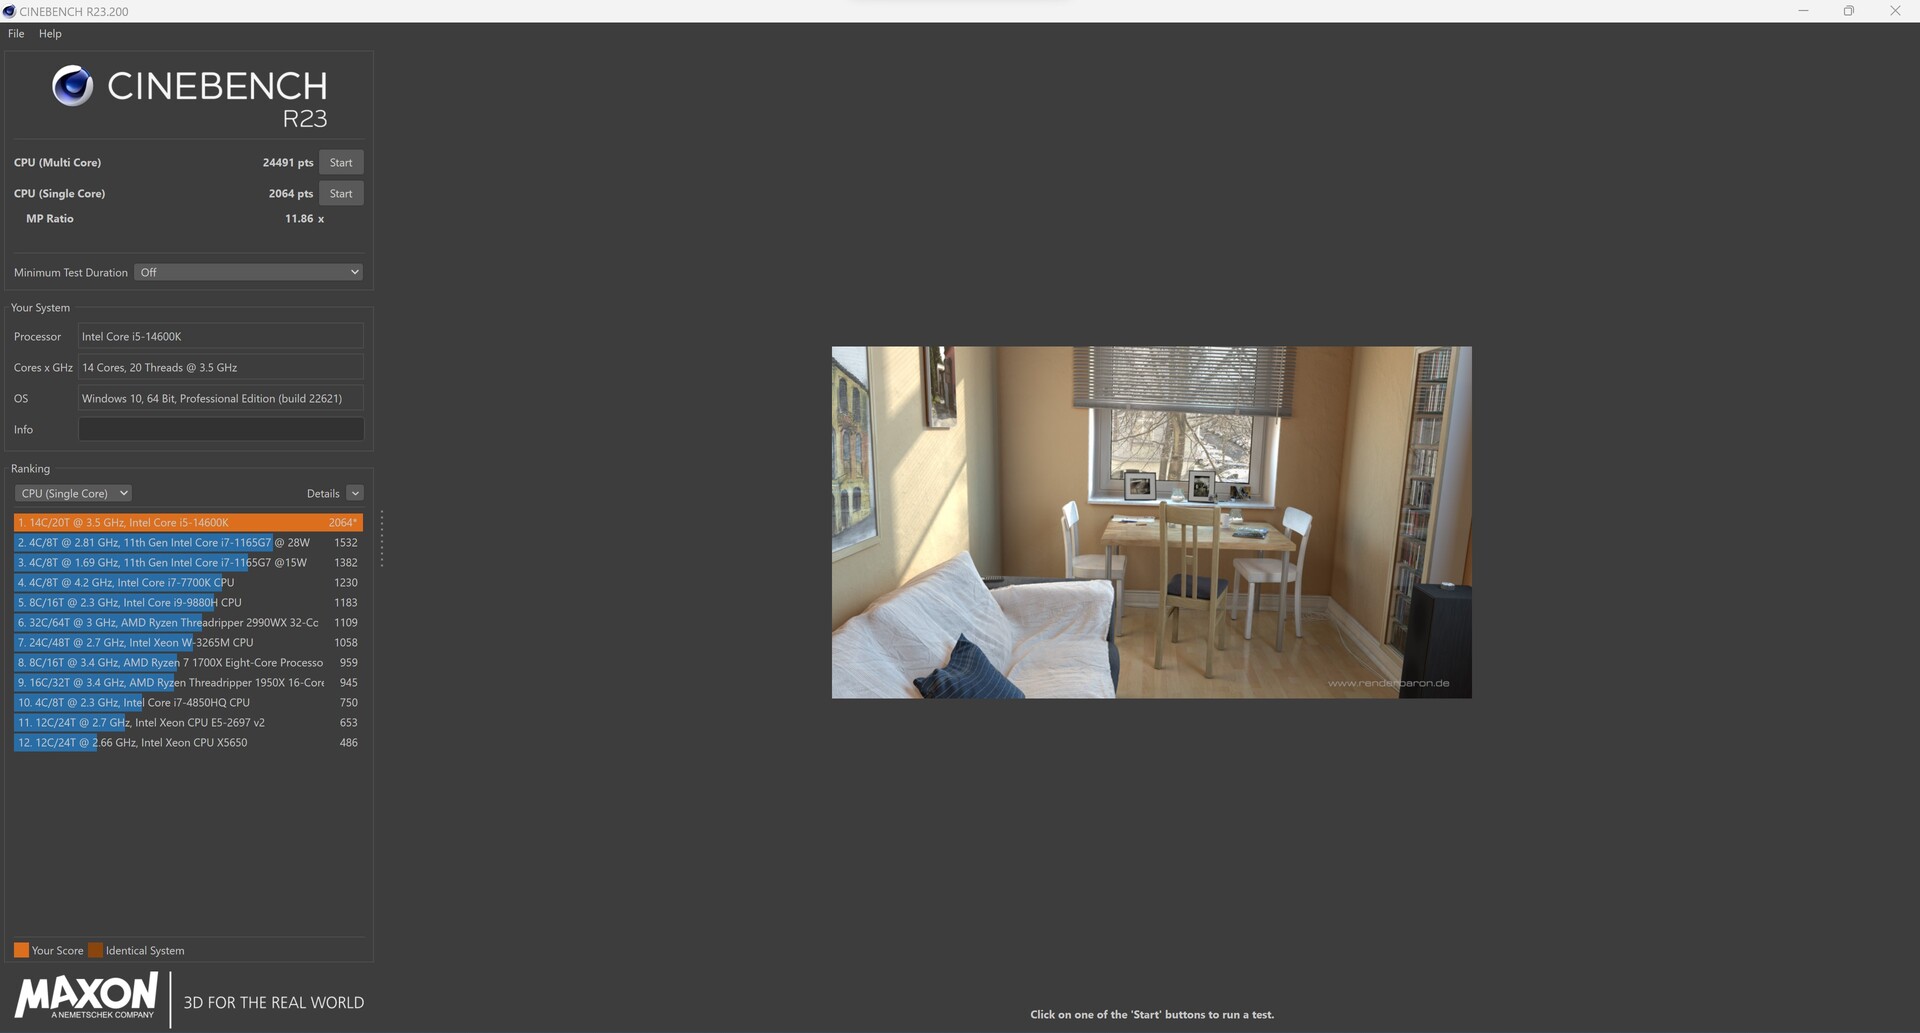
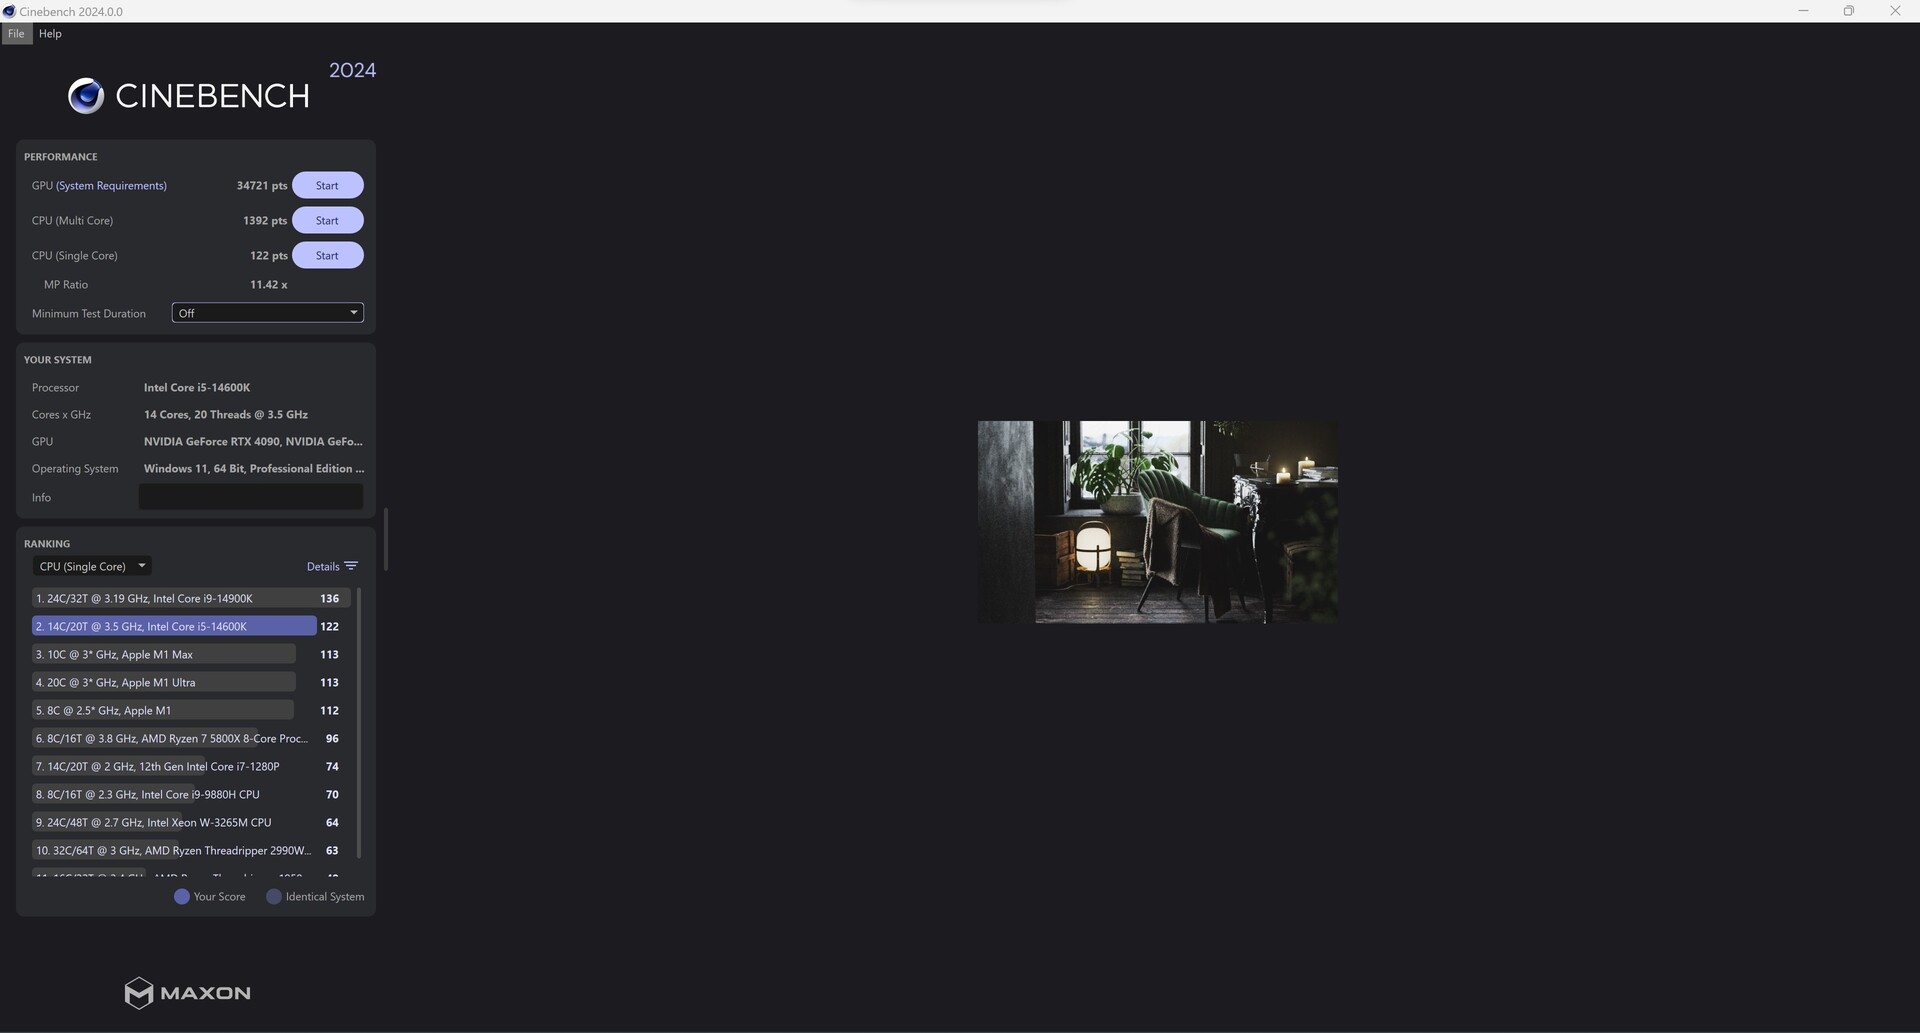
Risultati Cinebench dell'Intel Core i9-14900K

Risultati Cinebench dell'Intel Core i5-14600K
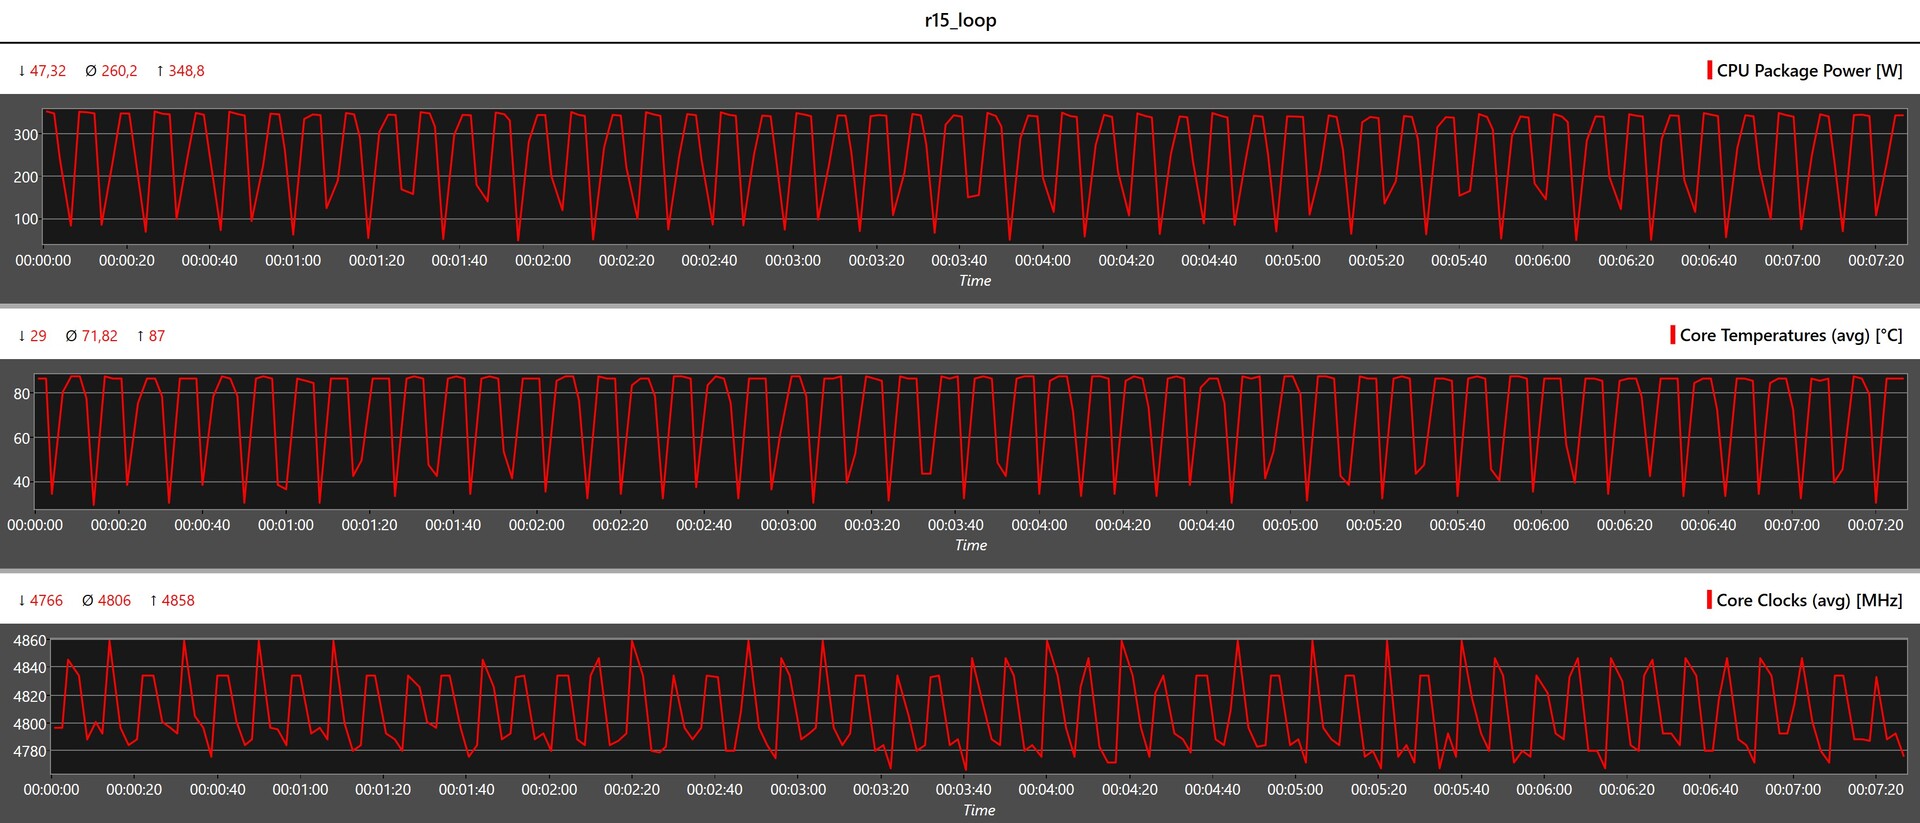
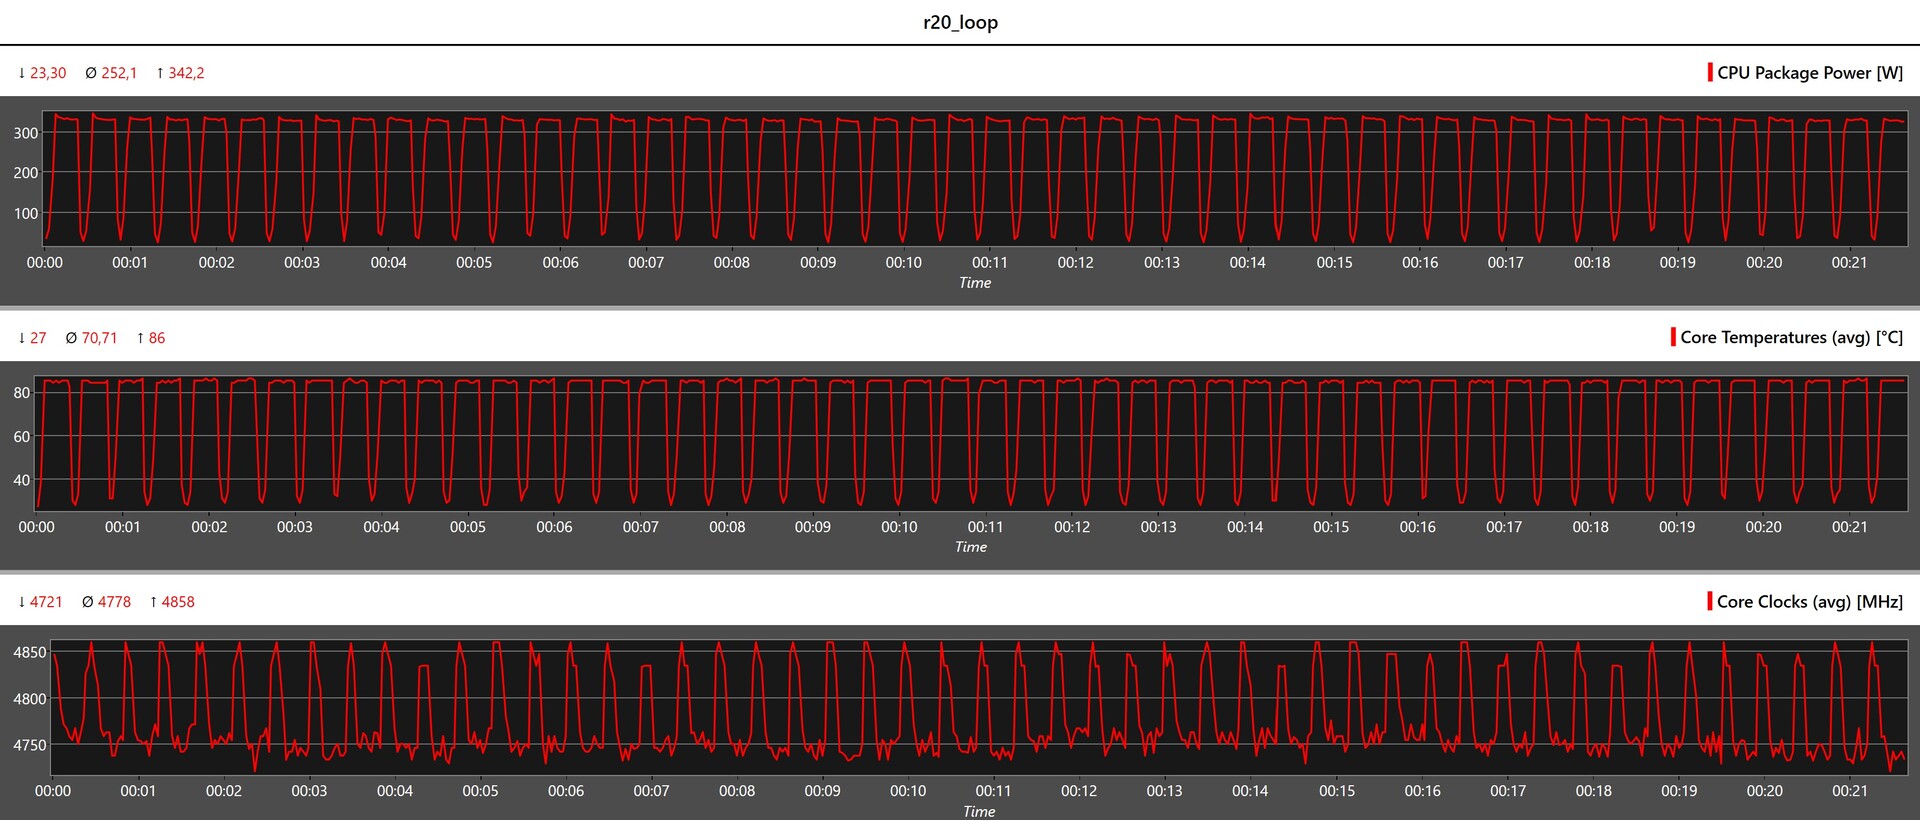
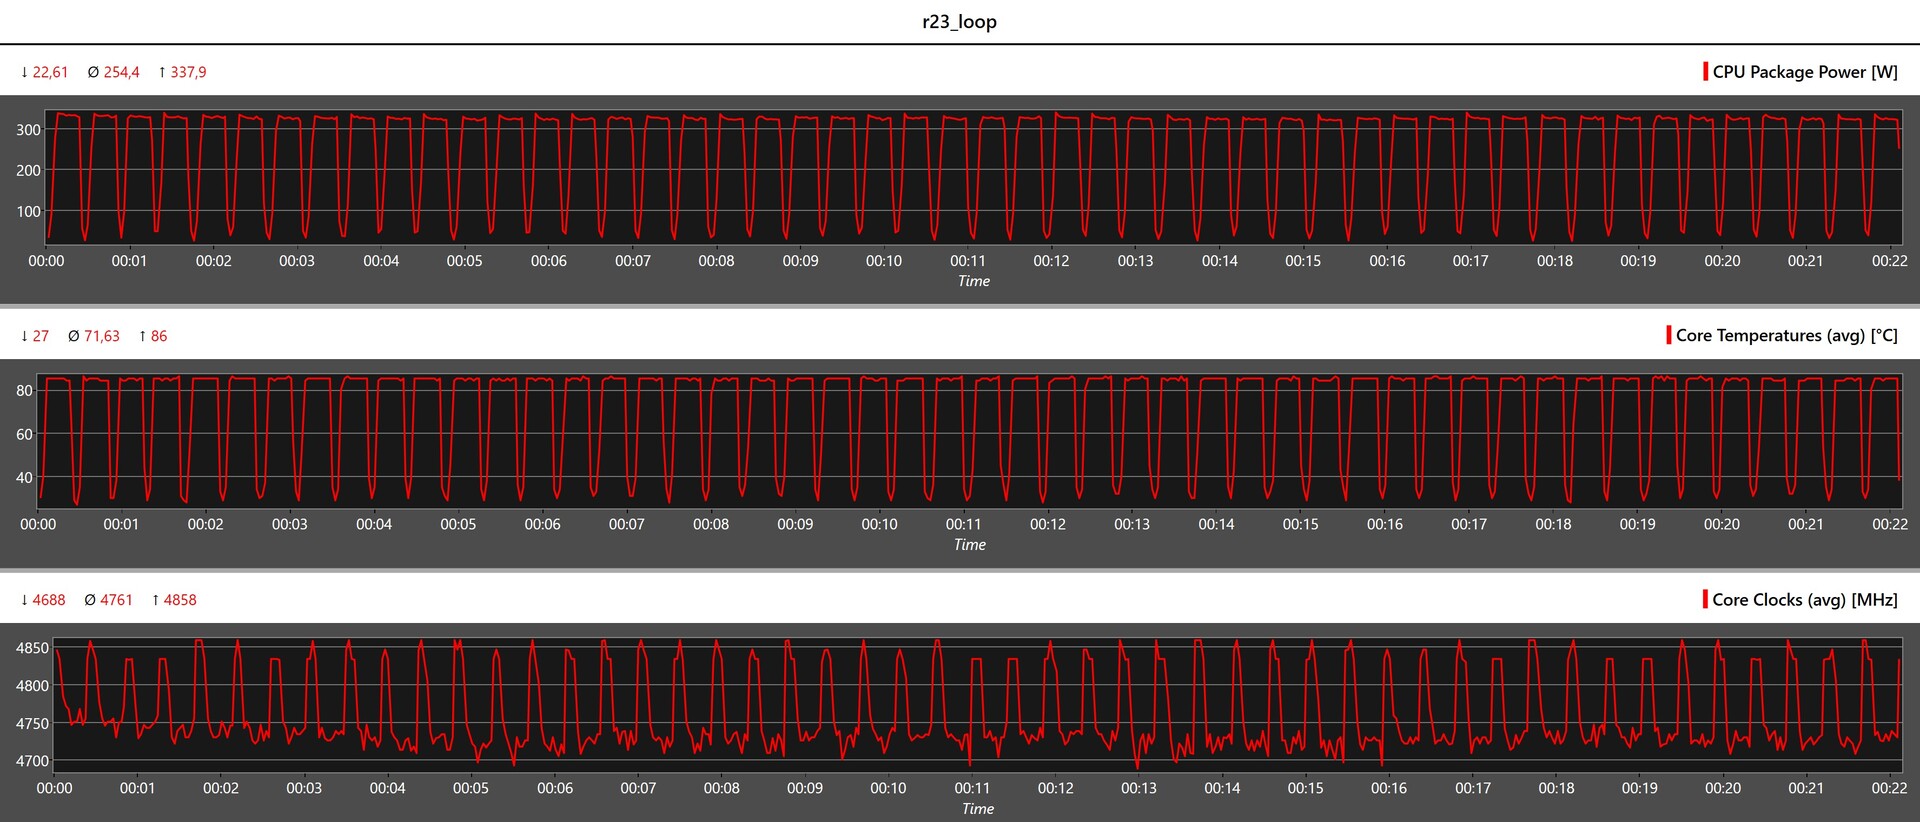
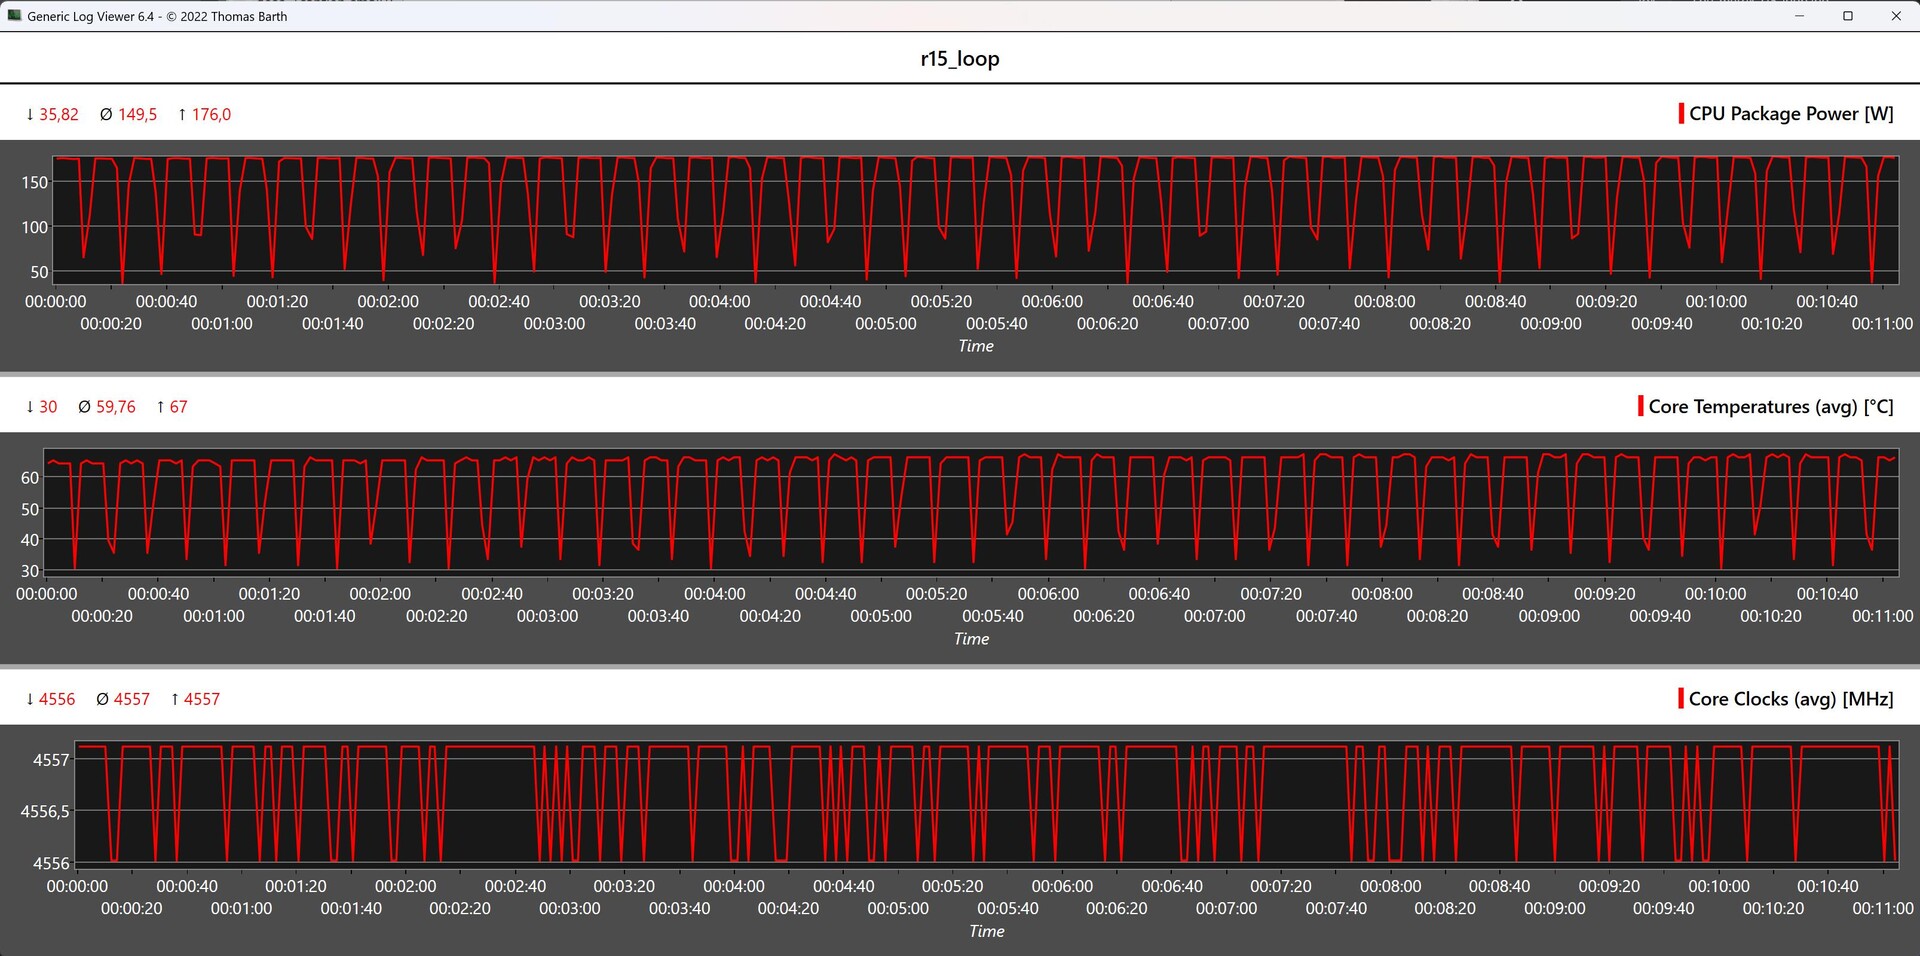
Core i9-14900K e Core i5-14600K contro Cinebench R15 Multi Loop
Per il nostro primo test di carico più lungo, abbiamo esaminato il comportamento del processore durante il ciclo costante di Cinebench R15. Inizialmente abbiamo visto una prestazione stabile di tutti i modelli del nostro test. Tuttavia, l'Intel Core i9-14900K non è riuscito a mantenere il primo posto. Ci vuole molto impegno per raffreddare la CPU, dato che l'Intel Core i9-14900K è molto assetato di energia e consuma fino a 348 watt. Di conseguenza, la CPU ha raggiunto ripetutamente il suo limite termico di 100 °C (212 °F), il che significa che ha ottenuto solo il terzo miglior risultato nel nostro confronto.
Con l'Intel Core i5-14600K, abbiamo notato un risultato minimamente migliore rispetto all'Intel Core i5-13600K Recensione di Intel Core i9-13900K e Intel Core i5-13600K: Più core e una velocità di clock più elevata con Raptor Lake , ma il vantaggio era così piccolo che abbiamo potuto attribuirlo alle tolleranze di misurazione. Con un consumo leggermente superiore a 180 watt, è significativamente più facile raffreddare l'Intel Core i5-13600K.
Tutti i test della CPU sono stati eseguiti nelle stesse condizioni, il che significa anche che non sono stati definiti limiti di potenza nel BIOS.
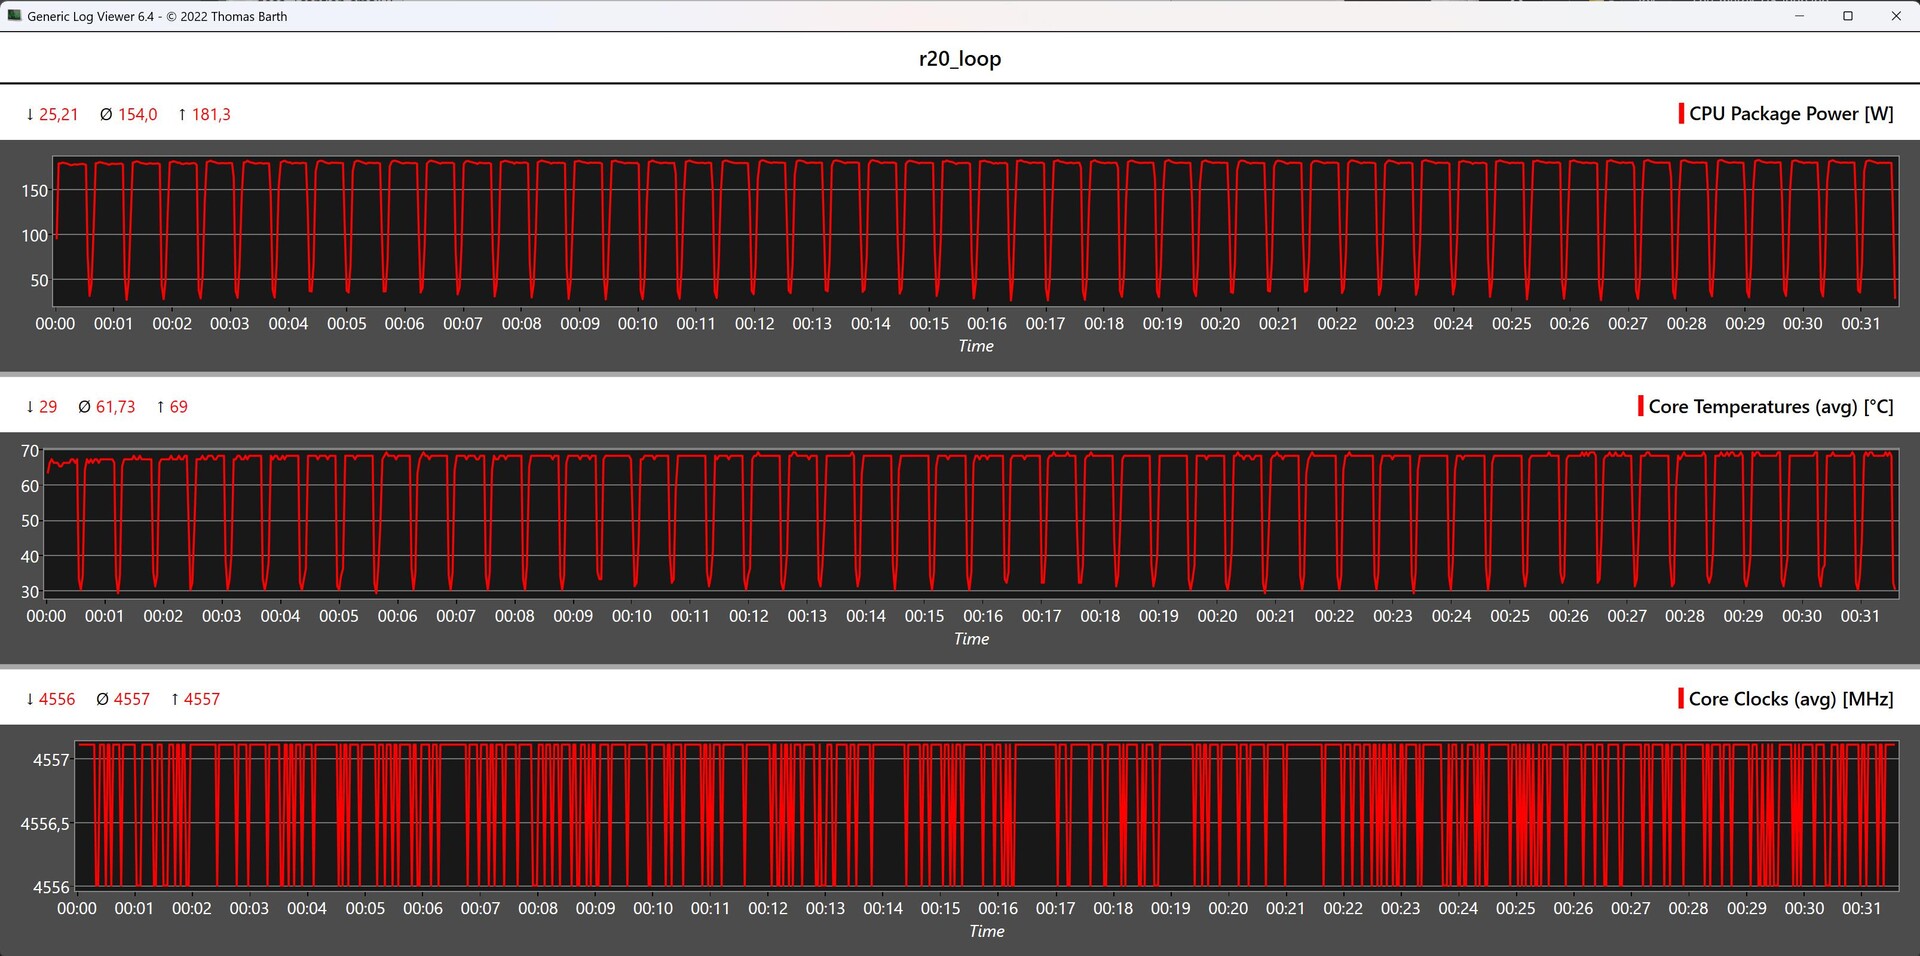
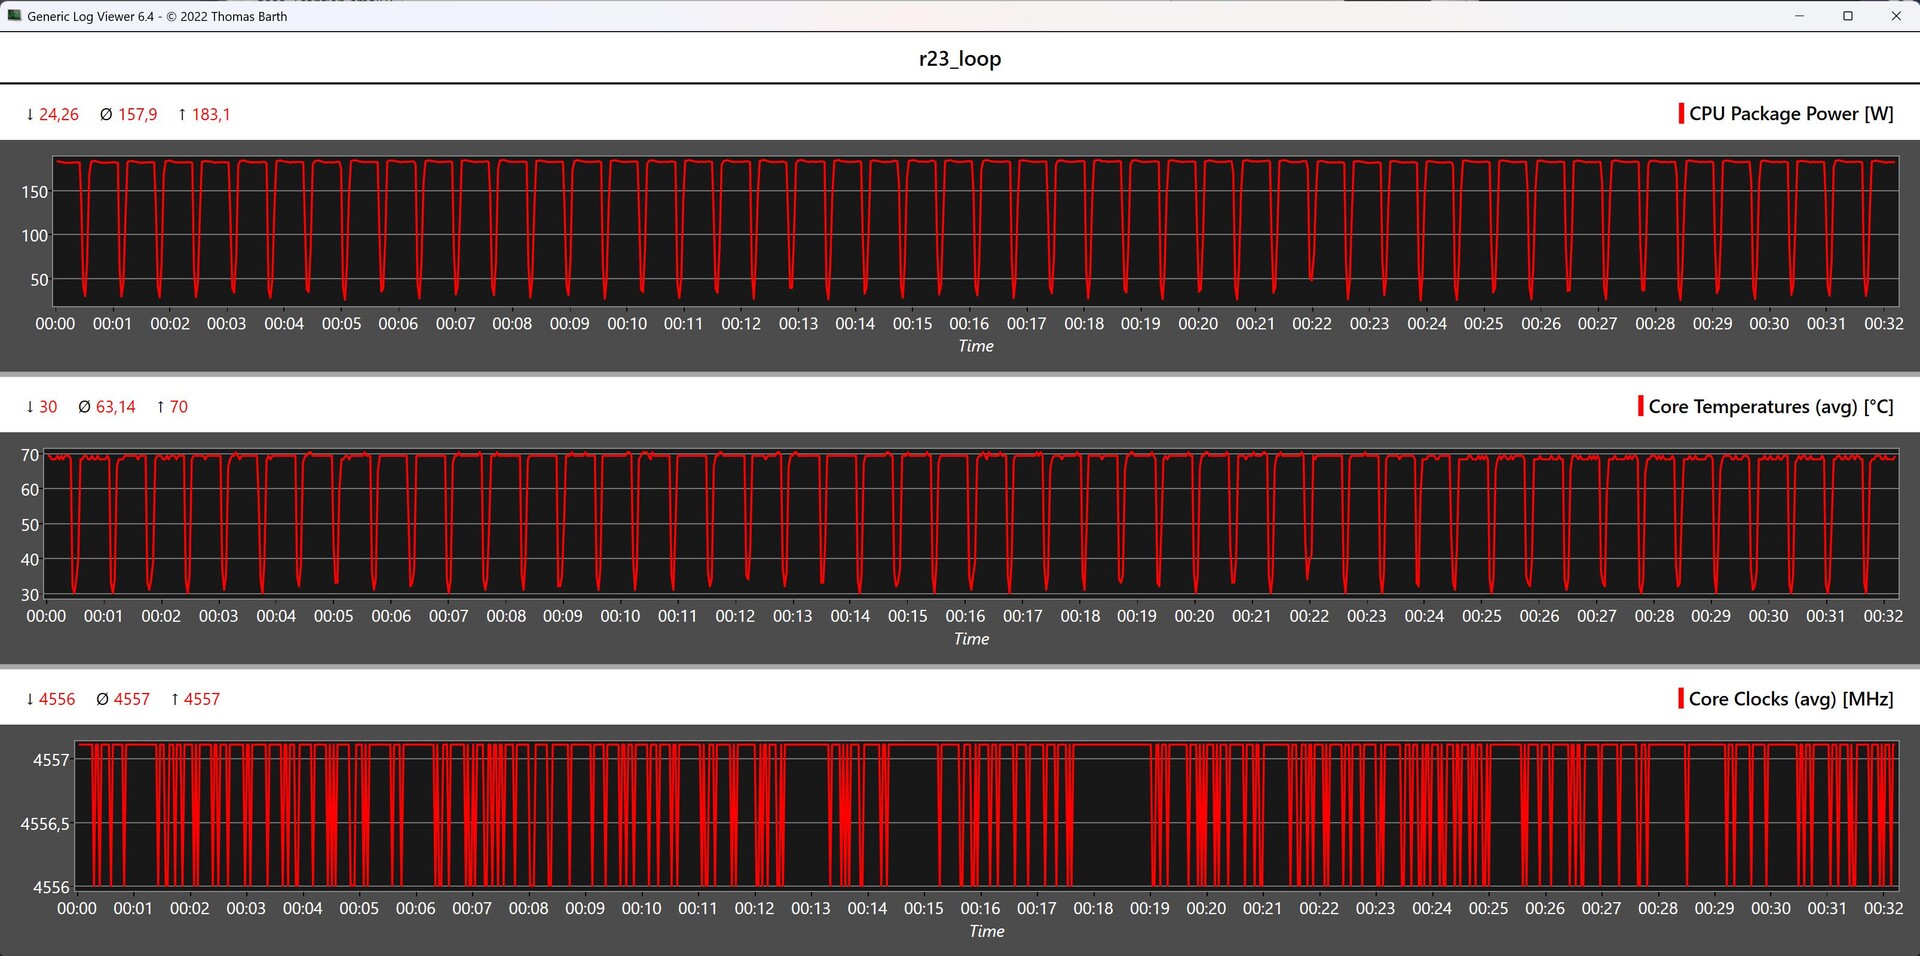
Metriche della CPU durante i loop di Cinebench (R15, R20, R23)
Intel Core i9-14900K
Intel Core i5-14600K
Benchmark sintetici e prestazioni delle applicazioni
Dopo che AMD è riuscita a superare l'Intel Core i9-13900K con il Ryzen 9 7950X, ora le carte in tavola si sono invertite di nuovo, dando il vantaggio a Intel. Ma questo vantaggio è sottile come un rasoio se diamo un'occhiata più da vicino ai risultati del benchmark PCMark 10.
Entrambi i modelli Raptor Lake Refresh hanno superato a pieni voti i test sulla RAM. Con la RAM DDR5-6000 installata, l'Intel Core i9-14900K è riuscito ad assicurarsi il primo posto. AMD è stata superata in modo significativo, anche se le velocità di clock sono le stesse.
| PCMark 10 - Score | |
| Intel Core i9-14900K | |
| AMD Ryzen 9 7950X | |
| Intel Core i9-13900K | |
| Intel Core i5-14600K | |
| AMD Ryzen 7 7800X3D | |
| AMD Ryzen 5 7600X | |
| Intel Core i5-13600K | |
| Intel Core i9-12900K | |
| Intel Core i5-12600K | |
| 3DMark | |
| 1920x1080 Fire Strike Physics | |
| Intel Core i9-14900K | |
| Intel Core i9-13900K | |
| AMD Ryzen 9 7950X | |
| Intel Core i5-14600K | |
| Intel Core i9-12900K | |
| Intel Core i5-13600K | |
| AMD Ryzen 7 7800X3D | |
| AMD Ryzen 5 7600X | |
| Intel Core i5-12600K | |
| 2560x1440 Time Spy CPU | |
| Intel Core i9-14900K | |
| Intel Core i9-13900K | |
| Intel Core i5-14600K | |
| Intel Core i9-12900K | |
| Intel Core i5-13600K | |
| AMD Ryzen 9 7950X | |
| AMD Ryzen 7 7800X3D | |
| Intel Core i5-12600K | |
| AMD Ryzen 5 7600X | |
| 3DMark 11 - 1280x720 Performance Physics | |
| AMD Ryzen 7 7800X3D | |
| Intel Core i9-13900K | |
| Intel Core i9-14900K | |
| Intel Core i5-14600K | |
| Intel Core i5-13600K | |
| AMD Ryzen 9 7950X | |
| Intel Core i9-12900K | |
| AMD Ryzen 5 7600X | |
| Intel Core i5-12600K | |
| CrossMark - Overall | |
| Intel Core i9-14900K | |
| Intel Core i9-13900K | |
| AMD Ryzen 9 7950X | |
| Intel Core i5-14600K | |
| Intel Core i5-13600K | |
| AMD Ryzen 5 7600X | |
| AMD Ryzen 7 7800X3D | |
| AIDA64 / Memory Copy | |
| Intel Core i9-14900K | |
| Intel Core i9-14900K | |
| Intel Core i5-14600K | |
| Intel Core i9-13900K | |
| AMD Ryzen 9 7950X3D | |
| Intel Core i9-12900K | |
| AMD Ryzen 9 7950X | |
| Intel Core i5-13600K | |
| Intel Core i5-12600K | |
| AMD Ryzen 7 7800X3D | |
| AMD Ryzen 5 7600X | |
| Media della classe (4514 - 234662, n=2203) | |
| AIDA64 / Memory Read | |
| Intel Core i9-14900K | |
| Intel Core i9-14900K | |
| Intel Core i5-14600K | |
| Intel Core i9-13900K | |
| Intel Core i9-12900K | |
| AMD Ryzen 9 7950X3D | |
| AMD Ryzen 9 7950X | |
| Intel Core i5-12600K | |
| Intel Core i5-13600K | |
| AMD Ryzen 7 7800X3D | |
| AMD Ryzen 5 7600X | |
| Media della classe (4031 - 271066, n=2165) | |
| AIDA64 / Memory Write | |
| AMD Ryzen 7 7800X3D | |
| AMD Ryzen 9 7950X3D | |
| Intel Core i5-14600K | |
| Intel Core i9-14900K | |
| Intel Core i9-14900K | |
| AMD Ryzen 5 7600X | |
| AMD Ryzen 9 7950X | |
| Intel Core i9-13900K | |
| Intel Core i5-12600K | |
| Intel Core i9-12900K | |
| Intel Core i5-13600K | |
| Media della classe (3506 - 242868, n=2170) | |
| AIDA64 / Memory Latency | |
| Media della classe (6.1 - 536, n=2232) | |
| Intel Core i5-13600K | |
| Intel Core i9-13900K | |
| Intel Core i9-14900K | |
| Intel Core i9-14900K | |
| Intel Core i5-14600K | |
| AMD Ryzen 7 7800X3D | |
| AMD Ryzen 9 7950X3D | |
| AMD Ryzen 5 7600X | |
| AMD Ryzen 9 7950X | |
* ... Meglio usare valori piccoli
| Performance rating - Percent | |
| Intel Core i9-14900K | |
| Intel Core i5-14600K | |
| AMD Ryzen 7 7800X3D | |
| AMD Ryzen 9 7950X3D | |
| AMD Ryzen 9 7950X | |
| Intel Core i9-13900K | |
| 3DMark | |
| 2560x1440 Time Spy Graphics | |
| Intel Core i5-14600K | |
| Intel Core i9-14900K | |
| AMD Ryzen 7 7800X3D | |
| AMD Ryzen 9 7950X | |
| AMD Ryzen 9 7950X3D | |
| Intel Core i9-13900K | |
| Fire Strike Extreme Graphics | |
| AMD Ryzen 7 7800X3D | |
| Intel Core i5-14600K | |
| Intel Core i9-14900K | |
| AMD Ryzen 9 7950X | |
| AMD Ryzen 9 7950X3D | |
| Intel Core i9-13900K | |
| 3840x2160 Fire Strike Ultra Graphics | |
| AMD Ryzen 7 7800X3D | |
| Intel Core i5-14600K | |
| Intel Core i9-14900K | |
| AMD Ryzen 9 7950X | |
| AMD Ryzen 9 7950X3D | |
| Intel Core i9-13900K | |
| 1920x1080 Fire Strike Graphics | |
| Intel Core i5-14600K | |
| AMD Ryzen 7 7800X3D | |
| AMD Ryzen 9 7950X3D | |
| AMD Ryzen 9 7950X | |
| Intel Core i9-14900K | |
| Intel Core i9-13900K | |
| Unigine Heaven 4.0 | |
| Extreme Preset DX11 | |
| AMD Ryzen 9 7950X3D | |
| AMD Ryzen 9 7950X | |
| Intel Core i9-14900K | |
| Intel Core i5-14600K | |
| Intel Core i9-13900K | |
| AMD Ryzen 7 7800X3D | |
| Extreme Preset OpenGL | |
| Intel Core i9-14900K | |
| AMD Ryzen 9 7950X3D | |
| Intel Core i5-14600K | |
| AMD Ryzen 9 7950X | |
| Intel Core i9-13900K | |
| AMD Ryzen 7 7800X3D | |
| Unigine Valley 1.0 | |
| 1920x1080 Extreme HD DirectX AA:x8 | |
| Intel Core i9-14900K | |
| Intel Core i5-14600K | |
| Intel Core i9-13900K | |
| AMD Ryzen 9 7950X3D | |
| AMD Ryzen 9 7950X | |
| AMD Ryzen 7 7800X3D | |
| 1920x1080 Extreme HD Preset OpenGL AA:x8 | |
| Intel Core i9-14900K | |
| Intel Core i9-13900K | |
| Intel Core i5-14600K | |
| AMD Ryzen 9 7950X3D | |
| AMD Ryzen 9 7950X | |
| AMD Ryzen 7 7800X3D | |
| Intel Core i9-14900K, NVIDIA GeForce RTX 4090 GeForce RTX 4090, i9-14900K, WDC PC SN720 SDAQNTW-512G | Intel Core i5-14600K, NVIDIA GeForce RTX 4090 GeForce RTX 4090, i5-14600K, WDC PC SN720 SDAQNTW-512G | Intel Core i9-13900K, NVIDIA GeForce RTX 4090 GeForce RTX 4090, i9-13900K | Intel Core i7-13700K, NVIDIA GeForce RTX 4090 GeForce RTX 4090, i7-13700K, Intel Optane 905P 480GB 2.5 | AMD Ryzen 9 7950X, NVIDIA GeForce RTX 4090 GeForce RTX 4090, R9 7950X, Corsair MP600 GS | AMD Ryzen 9 7950X3D, NVIDIA GeForce RTX 4090 GeForce RTX 4090, R9 7950X3D | AMD Ryzen 7 7800X3D, NVIDIA GeForce RTX 4090 GeForce RTX 4090, R7 7800X3D, Corsair MP600 | |
|---|---|---|---|---|---|---|---|
| SPECviewperf 12 | -2% | -14% | -4% | -15% | -7% | -7% | |
| 1900x1060 3ds Max (3dsmax-05) (fps) | 565 | 563 0% | 543 -4% | 543 -4% | 571 1% | 560 -1% | 564 0% |
| 1900x1060 Catia (catia-04) (fps) | 291 | 277 -5% | 263 -10% | 273 -6% | 257 -12% | 274 -6% | 263 -10% |
| 1900x1060 Creo (creo-01) (fps) | 127 | 122 -4% | 123 -3% | 124 -2% | 115 -9% | 118 -7% | 114 -10% |
| 1900x1060 Energy (energy-01) (fps) | 84.7 | 84.5 0% | 56.7 -33% | 83.8 -1% | 54.7 -35% | 80.1 -5% | 83.1 -2% |
| 1900x1060 Maya (maya-04) (fps) | 340 | 314 -8% | 290 -15% | 304 -11% | 317 -7% | 329 -3% | 306 -10% |
| 1900x1060 Medical (medical-01) (fps) | 303 | 299 -1% | 131 -57% | 284 -6% | 119 -61% | 212 -30% | 238 -21% |
| 1900x1060 Showcase (showcase-01) (fps) | 398 | 440 11% | 432 9% | 434 9% | 457 15% | 427 7% | 442 11% |
| 1900x1060 Siemens NX (snx-02) (fps) | 31.4 | 30 -4% | 28.7 -9% | 28.3 -10% | 27.1 -14% | 27.4 -13% | 28.8 -8% |
| 1900x1060 Solidworks (sw-03) (fps) | 139 | 133 -4% | 132 -5% | 132 -5% | 126 -9% | 130 -6% | 127 -9% |
| SPECviewperf 13 | -2% | -4% | -3% | -5% | -2% | -4% | |
| 3ds Max (3dsmax-06) (fps) | 567 | 563 -1% | 542 -4% | 529 -7% | 563 -1% | 573 1% | 575 1% |
| Catia (catia-05) (fps) | 428 | 406 -5% | 398 -7% | 408 -5% | 402 -6% | 427 0% | 412 -4% |
| Creo (creo-02) (fps) | 618 | 584 -6% | 570 -8% | 599 -3% | 552 -11% | 577 -7% | 562 -9% |
| Energy (energy-02) (fps) | 127 | 127 0% | 126 -1% | 127 0% | 126 -1% | 127 0% | 127 0% |
| Maya (maya-05) (fps) | 881 | 829 -6% | 736 -16% | 807 -8% | 715 -19% | 748 -15% | 679 -23% |
| Medical (medical-02) (fps) | 180 | 179 -1% | 190 6% | 190 6% | 186 3% | 189 5% | 186 3% |
| Showcase (showcase-02) (fps) | 400 | 440 10% | 436 9% | 430 8% | 455 14% | 456 14% | 438 10% |
| Siemens NX (snx-03) (fps) | 56.3 | 53.8 -4% | 51.9 -8% | 51.4 -9% | 49.1 -13% | 49.3 -12% | 51.6 -8% |
| Solidworks (sw-04) (fps) | 199 | 189 -5% | 189 -5% | 188 -6% | 186 -7% | 191 -4% | 182 -9% |
| SPECviewperf 2020 | -2% | -7% | -2% | -9% | -7% | -8% | |
| 3840x2160 Siemens NX (snx-04) (fps) | 47.2 | 46.3 -2% | 44.7 -5% | 43.4 -8% | 41.3 -13% | 42.5 -10% | 44.3 -6% |
| 3840x2160 Medical (medical-03) (fps) | 40.3 | 40.2 0% | 42 4% | 43.7 8% | 45.9 14% | 46.2 15% | 46.2 15% |
| 3840x2160 Energy (energy-03) (fps) | 230 | 229 0% | 141 -39% | 228 -1% | 141 -39% | 140 -39% | 140 -39% |
| 3840x2160 Creo (creo-03) (fps) | 148 | 139 -6% | 146 -1% | 139 -6% | 133 -10% | 140 -5% | 129 -13% |
| 3840x2160 CATIA (catia-06) (fps) | 97.1 | 94.3 -3% | 99.8 3% | 97.9 1% | 95.3 -2% | 95.9 -1% | 93.3 -4% |
| 3840x2160 3ds Max (3dsmax-07) (fps) | 236 | 235 0% | 231 -2% | 229 -3% | 228 -3% | 236 0% | 237 0% |
| Media totale (Programma / Settaggio) | -2% /
-2% | -8% /
-8% | -3% /
-3% | -10% /
-9% | -5% /
-5% | -6% /
-6% |
Parametri di gioco
Negli anni passati, il trono delle prestazioni era sempre occupato dai processori Intel quando si trattava di benchmark di gioco. Ma con l'introduzione della piattaforma AM5 e delle CPU Ryzen della serie 7000, che ora sono dotate anche di cache 3D V, le carte in tavola sono cambiate. Con il suo Core i9-14900K, Intel ha colmato un po' il divario con AMD, ma era ancora sufficiente per il terzo posto nel nostro confronto. In termini di prestazioni di gioco pure, al momento è equipaggiato in modo ottimale con ilRyzen 7 7800X3D. La nuova ammiraglia di Intel ha accumulato un piccolo distacco di circa 10 punti percentuali. D'altra parte, l'Intel Core i9-14900K ha vinto il duello contro l'AMD Ryzen 9 7950X.
Con l'Intel Core i5-14600K, attualmente si ottiene anche una CPU molto potente, in grado di superare l'Intel Core i7-13700K Intel Core i7-13700K.
Tutti i sistemi elencati in questo confronto sono stati testati con la stessa scheda grafica. La scheda utilizzata qui è una Pait GeForce RTX 4090 Gamerock OC.
| Performance rating - Percent | |
| AMD Ryzen 7 7800X3D | |
| AMD Ryzen 9 7950X3D | |
| Intel Core i9-14900K | |
| AMD Ryzen 9 7950X | |
| Intel Core i9-13900K | |
| AMD Ryzen 5 7600X | |
| Intel Core i5-14600K | |
| Intel Core i7-13700K | |
| Intel Core i7-13700 | |
| Intel Core i7-12700 | |
| Intel Core i5-13400 | |
| Intel Core i5-12400F | |
| F1 22 | |
| 1920x1080 Low Preset AA:T AF:16x | |
| AMD Ryzen 7 7800X3D | |
| AMD Ryzen 9 7950X3D | |
| Intel Core i9-14900K | |
| AMD Ryzen 9 7950X | |
| AMD Ryzen 5 7600X | |
| Intel Core i9-13900K | |
| Intel Core i7-13700K | |
| Intel Core i5-14600K | |
| Intel Core i7-13700 | |
| Intel Core i7-12700 | |
| Intel Core i5-12400F | |
| Intel Core i5-13400 | |
| 1920x1080 Ultra High Preset AA:T AF:16x | |
| AMD Ryzen 7 7800X3D | |
| Intel Core i9-14900K | |
| Intel Core i5-14600K | |
| AMD Ryzen 5 7600X | |
| AMD Ryzen 9 7950X3D | |
| AMD Ryzen 9 7950X | |
| Intel Core i9-13900K | |
| Intel Core i7-13700K | |
| Intel Core i7-13700 | |
| Intel Core i7-12700 | |
| Intel Core i5-12400F | |
| Intel Core i5-13400 | |
| Far Cry 5 | |
| 1920x1080 Ultra Preset AA:T | |
| AMD Ryzen 7 7800X3D | |
| AMD Ryzen 9 7950X3D | |
| Intel Core i9-14900K | |
| Intel Core i9-13900K | |
| Intel Core i5-14600K | |
| AMD Ryzen 9 7950X | |
| AMD Ryzen 5 7600X | |
| Intel Core i7-13700 | |
| Intel Core i7-13700K | |
| Intel Core i7-12700 | |
| Intel Core i5-13400 | |
| Intel Core i5-12400F | |
| 1280x720 Low Preset AA:T | |
| AMD Ryzen 7 7800X3D | |
| AMD Ryzen 9 7950X3D | |
| Intel Core i9-14900K | |
| Intel Core i9-13900K | |
| Intel Core i5-14600K | |
| Intel Core i7-13700K | |
| AMD Ryzen 5 7600X | |
| AMD Ryzen 9 7950X | |
| Intel Core i7-13700 | |
| Intel Core i7-12700 | |
| Intel Core i5-13400 | |
| Intel Core i5-12400F | |
| X-Plane 11.11 | |
| 1920x1080 high (fps_test=3) | |
| AMD Ryzen 7 7800X3D | |
| AMD Ryzen 9 7950X3D | |
| Intel Core i9-14900K | |
| Intel Core i9-13900K | |
| AMD Ryzen 9 7950X | |
| AMD Ryzen 5 7600X | |
| Intel Core i5-14600K | |
| Intel Core i7-13700K | |
| Intel Core i7-13700 | |
| Intel Core i7-12700 | |
| Intel Core i5-13400 | |
| Intel Core i5-12400F | |
| 1280x720 low (fps_test=1) | |
| Intel Core i9-13900K | |
| Intel Core i9-14900K | |
| Intel Core i5-14600K | |
| AMD Ryzen 9 7950X3D | |
| Intel Core i7-13700K | |
| AMD Ryzen 9 7950X | |
| AMD Ryzen 7 7800X3D | |
| Intel Core i7-13700 | |
| AMD Ryzen 5 7600X | |
| Intel Core i7-12700 | |
| Intel Core i5-13400 | |
| Intel Core i5-12400F | |
| Final Fantasy XV Benchmark | |
| 1920x1080 High Quality | |
| Intel Core i9-14900K | |
| AMD Ryzen 9 7950X | |
| AMD Ryzen 7 7800X3D | |
| Intel Core i5-14600K | |
| Intel Core i9-13900K | |
| AMD Ryzen 9 7950X3D | |
| Intel Core i7-13700K | |
| AMD Ryzen 5 7600X | |
| Intel Core i7-13700 | |
| Intel Core i7-12700 | |
| Intel Core i5-13400 | |
| Intel Core i5-12400F | |
| 1280x720 Lite Quality | |
| Intel Core i9-13900K | |
| AMD Ryzen 9 7950X | |
| AMD Ryzen 5 7600X | |
| Intel Core i7-13700 | |
| Intel Core i7-13700K | |
| AMD Ryzen 7 7800X3D | |
| Intel Core i5-14600K | |
| Intel Core i9-14900K | |
| AMD Ryzen 9 7950X3D | |
| Intel Core i7-12700 | |
| Intel Core i5-12400F | |
| Intel Core i5-13400 | |
| Dota 2 Reborn | |
| 1920x1080 ultra (3/3) best looking | |
| AMD Ryzen 7 7800X3D | |
| AMD Ryzen 9 7950X3D | |
| AMD Ryzen 9 7950X | |
| Intel Core i9-13900K | |
| Intel Core i9-14900K | |
| AMD Ryzen 5 7600X | |
| Intel Core i5-14600K | |
| Intel Core i7-13700K | |
| Intel Core i7-13700 | |
| Intel Core i7-12700 | |
| Intel Core i5-13400 | |
| Intel Core i5-12400F | |
| 1280x720 min (0/3) fastest | |
| AMD Ryzen 7 7800X3D | |
| AMD Ryzen 9 7950X3D | |
| AMD Ryzen 9 7950X | |
| Intel Core i9-14900K | |
| Intel Core i9-13900K | |
| AMD Ryzen 5 7600X | |
| Intel Core i5-14600K | |
| Intel Core i7-13700K | |
| Intel Core i7-13700 | |
| Intel Core i7-12700 | |
| Intel Core i5-12400F | |
| Intel Core i5-13400 | |
| The Witcher 3 | |
| 1920x1080 Ultra Graphics & Postprocessing (HBAO+) | |
| Intel Core i9-13900K | |
| AMD Ryzen 9 7950X | |
| Intel Core i5-14600K | |
| AMD Ryzen 7 7800X3D | |
| Intel Core i9-14900K | |
| AMD Ryzen 5 7600X | |
| Intel Core i7-13700K | |
| Intel Core i7-13700 | |
| AMD Ryzen 9 7950X3D | |
| Intel Core i7-12700 | |
| Intel Core i5-13400 | |
| Intel Core i5-12400F | |
| 1024x768 Low Graphics & Postprocessing | |
| AMD Ryzen 9 7950X3D | |
| AMD Ryzen 7 7800X3D | |
| Intel Core i9-14900K | |
| AMD Ryzen 9 7950X | |
| Intel Core i9-13900K | |
| AMD Ryzen 5 7600X | |
| Intel Core i7-13700K | |
| Intel Core i7-13700 | |
| Intel Core i5-14600K | |
| Intel Core i7-12700 | |
| Intel Core i5-13400 | |
| Intel Core i5-12400F | |
| GTA V | |
| 1920x1080 Highest AA:4xMSAA + FX AF:16x | |
| AMD Ryzen 7 7800X3D | |
| Intel Core i9-14900K | |
| Intel Core i9-13900K | |
| Intel Core i5-14600K | |
| AMD Ryzen 9 7950X | |
| AMD Ryzen 9 7950X3D | |
| Intel Core i7-13700K | |
| AMD Ryzen 5 7600X | |
| Intel Core i7-13700 | |
| Intel Core i7-12700 | |
| Intel Core i5-13400 | |
| Intel Core i5-12400F | |
| 1024x768 Lowest Settings possible | |
| AMD Ryzen 7 7800X3D | |
| AMD Ryzen 9 7950X | |
| AMD Ryzen 9 7950X3D | |
| AMD Ryzen 5 7600X | |
| Intel Core i9-14900K | |
| Intel Core i9-13900K | |
| Intel Core i7-13700 | |
| Intel Core i5-14600K | |
| Intel Core i7-13700K | |
| Intel Core i7-12700 | |
| Intel Core i5-13400 | |
| Intel Core i5-12400F | |
| Borderlands 3 | |
| 1280x720 Very Low Overall Quality (DX11) | |
| AMD Ryzen 7 7800X3D | |
| AMD Ryzen 9 7950X3D | |
| Intel Core i9-14900K | |
| Intel Core i9-13900K | |
| AMD Ryzen 9 7950X | |
| Intel Core i5-14600K | |
| AMD Ryzen 5 7600X | |
| Intel Core i7-13700 | |
| Intel Core i7-13700K | |
| Intel Core i7-12700 | |
| Intel Core i5-13400 | |
| Intel Core i5-12400F | |
| 1920x1080 Badass Overall Quality (DX11) | |
| AMD Ryzen 9 7950X3D | |
| AMD Ryzen 7 7800X3D | |
| Intel Core i9-14900K | |
| AMD Ryzen 9 7950X | |
| Intel Core i9-13900K | |
| Intel Core i5-14600K | |
| AMD Ryzen 5 7600X | |
| Intel Core i7-13700K | |
| Intel Core i7-13700 | |
| Intel Core i7-12700 | |
| Intel Core i5-13400 | |
| Intel Core i5-12400F | |
| Far Cry New Dawn | |
| 1280x720 Low Preset | |
| AMD Ryzen 7 7800X3D | |
| AMD Ryzen 9 7950X3D | |
| Intel Core i9-14900K | |
| Intel Core i9-13900K | |
| Intel Core i5-14600K | |
| Intel Core i7-13700 | |
| Intel Core i7-13700K | |
| AMD Ryzen 9 7950X | |
| AMD Ryzen 5 7600X | |
| Intel Core i7-12700 | |
| Intel Core i5-13400 | |
| Intel Core i5-12400F | |
| 1920x1080 Ultra Preset | |
| AMD Ryzen 7 7800X3D | |
| AMD Ryzen 9 7950X3D | |
| Intel Core i9-14900K | |
| Intel Core i9-13900K | |
| Intel Core i5-14600K | |
| AMD Ryzen 9 7950X | |
| Intel Core i7-13700K | |
| AMD Ryzen 5 7600X | |
| Intel Core i7-13700 | |
| Intel Core i7-12700 | |
| Intel Core i5-13400 | |
| Intel Core i5-12400F | |
| Shadow of the Tomb Raider | |
| 1280x720 Lowest Preset | |
| AMD Ryzen 7 7800X3D | |
| AMD Ryzen 9 7950X3D | |
| AMD Ryzen 9 7950X | |
| Intel Core i9-14900K | |
| AMD Ryzen 5 7600X | |
| Intel Core i9-13900K | |
| Intel Core i5-14600K | |
| Intel Core i7-13700 | |
| Intel Core i7-13700K | |
| Intel Core i7-12700 | |
| Intel Core i5-13400 | |
| Intel Core i5-12400F | |
| 1920x1080 Highest Preset AA:T | |
| AMD Ryzen 7 7800X3D | |
| AMD Ryzen 9 7950X3D | |
| Intel Core i9-14900K | |
| AMD Ryzen 9 7950X | |
| Intel Core i9-13900K | |
| AMD Ryzen 5 7600X | |
| Intel Core i5-14600K | |
| Intel Core i7-13700K | |
| Intel Core i7-13700 | |
| Intel Core i7-12700 | |
| Intel Core i5-13400 | |
| Intel Core i5-12400F | |
| Tiny Tina's Wonderlands | |
| 1920x1080 Low Preset (DX12) | |
| AMD Ryzen 7 7800X3D | |
| Intel Core i9-14900K | |
| AMD Ryzen 9 7950X3D | |
| Intel Core i5-14600K | |
| AMD Ryzen 9 7950X | |
| AMD Ryzen 5 7600X | |
| Intel Core i9-13900K | |
| Intel Core i7-13700 | |
| Intel Core i7-13700K | |
| Intel Core i7-12700 | |
| Intel Core i5-13400 | |
| Intel Core i5-12400F | |
| 1920x1080 Badass Preset (DX12) | |
| AMD Ryzen 7 7800X3D | |
| Intel Core i9-14900K | |
| AMD Ryzen 9 7950X3D | |
| Intel Core i5-14600K | |
| AMD Ryzen 9 7950X | |
| AMD Ryzen 5 7600X | |
| Intel Core i9-13900K | |
| Intel Core i7-13700 | |
| Intel Core i7-13700K | |
| Intel Core i7-12700 | |
| Intel Core i5-13400 | |
| Intel Core i5-12400F | |
| Strange Brigade | |
| 1280x720 lowest AF:1 | |
| AMD Ryzen 5 7600X | |
| Intel Core i9-14900K | |
| AMD Ryzen 7 7800X3D | |
| Intel Core i5-14600K | |
| AMD Ryzen 9 7950X | |
| Intel Core i9-13900K | |
| AMD Ryzen 9 7950X3D | |
| Intel Core i7-13700K | |
| Intel Core i7-13700 | |
| Intel Core i7-12700 | |
| Intel Core i5-12400F | |
| Intel Core i5-13400 | |
| 1920x1080 ultra AA:ultra AF:16 | |
| Intel Core i9-14900K | |
| AMD Ryzen 5 7600X | |
| AMD Ryzen 7 7800X3D | |
| AMD Ryzen 9 7950X | |
| Intel Core i9-13900K | |
| Intel Core i5-14600K | |
| AMD Ryzen 9 7950X3D | |
| Intel Core i7-13700K | |
| Intel Core i7-13700 | |
| Intel Core i7-12700 | |
| Intel Core i5-12400F | |
| Intel Core i5-13400 | |
| Metro Exodus | |
| 1280x720 Low Quality AF:4x | |
| AMD Ryzen 7 7800X3D | |
| Intel Core i9-14900K | |
| AMD Ryzen 5 7600X | |
| AMD Ryzen 9 7950X | |
| Intel Core i5-14600K | |
| AMD Ryzen 9 7950X3D | |
| Intel Core i7-13700 | |
| Intel Core i9-13900K | |
| Intel Core i7-13700K | |
| Intel Core i7-12700 | |
| Intel Core i5-12400F | |
| Intel Core i5-13400 | |
| 1920x1080 Ultra Quality AF:16x | |
| AMD Ryzen 7 7800X3D | |
| Intel Core i9-14900K | |
| Intel Core i5-14600K | |
| AMD Ryzen 9 7950X | |
| AMD Ryzen 5 7600X | |
| AMD Ryzen 9 7950X3D | |
| Intel Core i9-13900K | |
| Intel Core i7-13700 | |
| Intel Core i7-13700K | |
| Intel Core i7-12700 | |
| Intel Core i5-13400 | |
| Intel Core i5-12400F | |
| F1 2020 | |
| 1280x720 Ultra Low Preset | |
| AMD Ryzen 7 7800X3D | |
| Intel Core i9-14900K | |
| AMD Ryzen 9 7950X3D | |
| AMD Ryzen 9 7950X | |
| AMD Ryzen 5 7600X | |
| Intel Core i9-13900K | |
| Intel Core i7-13700K | |
| Intel Core i7-13700 | |
| Intel Core i5-14600K | |
| Intel Core i7-12700 | |
| Intel Core i5-12400F | |
| Intel Core i5-13400 | |
| 1920x1080 Ultra High Preset AA:T AF:16x | |
| AMD Ryzen 7 7800X3D | |
| AMD Ryzen 9 7950X3D | |
| Intel Core i9-14900K | |
| AMD Ryzen 5 7600X | |
| AMD Ryzen 9 7950X | |
| Intel Core i9-13900K | |
| Intel Core i5-14600K | |
| Intel Core i7-13700K | |
| Intel Core i7-13700 | |
| Intel Core i7-12700 | |
| Intel Core i5-12400F | |
| Intel Core i5-13400 | |
| F1 2021 | |
| 1280x720 Ultra Low Preset | |
| AMD Ryzen 7 7800X3D | |
| Intel Core i9-14900K | |
| AMD Ryzen 5 7600X | |
| AMD Ryzen 9 7950X3D | |
| AMD Ryzen 9 7950X | |
| Intel Core i9-13900K | |
| Intel Core i7-13700K | |
| Intel Core i7-13700 | |
| Intel Core i5-14600K | |
| Intel Core i7-12700 | |
| Intel Core i5-12400F | |
| Intel Core i5-13400 | |
| 1920x1080 Ultra High Preset + Raytracing AA:T AF:16x | |
| AMD Ryzen 7 7800X3D | |
| Intel Core i9-14900K | |
| Intel Core i5-14600K | |
| AMD Ryzen 5 7600X | |
| Intel Core i9-13900K | |
| AMD Ryzen 9 7950X | |
| AMD Ryzen 9 7950X3D | |
| Intel Core i7-13700K | |
| Intel Core i7-13700 | |
| Intel Core i7-12700 | |
| Intel Core i5-12400F | |
| Intel Core i5-13400 | |
Intel Core i9-14900K with Nvidia GeForce RTX 4090
| basso | medio | alto | ultra | QHD | 4K DLSS | 4K | |
|---|---|---|---|---|---|---|---|
| GTA V (2015) | 187.9 | 187.8 | 187.6 | 170.9 | 171.9 | 187.6 | |
| The Witcher 3 (2015) | 829 | 750 | 661 | 314 | 273 | 293 | |
| Dota 2 Reborn (2015) | 299.9 | 258.2 | 248.2 | 231.4 | 227.8 | ||
| Final Fantasy XV Benchmark (2018) | 235 | 233 | 234 | 229 | 161.9 | ||
| X-Plane 11.11 (2018) | 244 | 212 | 161 | 136.3 | |||
| Far Cry 5 (2018) | 280 | 246 | 234 | 217 | 216 | 187 | |
| Strange Brigade (2018) | 762 | 619 | 612 | 602 | 542 | 291 | |
| Shadow of the Tomb Raider (2018) | 332 | 326 | 318 | 313 | 293 | 189.7 | |
| Far Cry New Dawn (2019) | 235 | 202 | 194 | 175 | 174 | 161 | |
| Metro Exodus (2019) | 319 | 288 | 250 | 214 | 194.6 | 143.4 | |
| Borderlands 3 (2019) | 263 | 232 | 215 | 204 | 198.4 | 137.9 | |
| F1 2020 (2020) | 598 | 503 | 497 | 450 | 426 | 289 | |
| F1 2021 (2021) | 733 | 683 | 586 | 307 | 291 | 203 | |
| Far Cry 6 (2021) | 264 | 228 | 202 | 204 | 195.6 | 141.9 | |
| Forza Horizon 5 (2021) | 416 | 337 | 317 | 224 | 207 | 162 | |
| God of War (2022) | 283 | 283 | 274 | 215 | 183.3 | 134 | |
| GRID Legends (2022) | 290 | 257 | 238 | 230 | 225 | 191.2 | |
| Tiny Tina's Wonderlands (2022) | 502 | 427 | 359 | 305 | 234 | 131.7 | |
| F1 22 (2022) | 462 | 483 | 429 | 217 | 161.1 | 83.4 | |
| The Quarry (2022) | 432 | 343 | 297 | 261 | 198.7 | 81.8 | |
| The Witcher 3 v4 (2023) | 378 | 325 | 289 | 270 | 266 | 170.7 | |
| F1 23 (2023) | 454 | 472 | 453 | 213 | 155.5 | 134.4 | 80.1 |
| Cyberpunk 2077 (2023) | 198.8 | 199.9 | 188.4 | 179.5 | 161.7 | 78.9 | |
| F1 24 (2024) | 377 | 408 | 389 | 217 | 177.5 | 93.9 | |
| F1 25 (2025) | 299 | 290 | 277 | 95.9 | 60.4 | 29.4 |
Intel Core i5-14600K with Nvidia GeForce RTX 4090
| basso | medio | alto | ultra | QHD | 4K DLSS | 4K | |
|---|---|---|---|---|---|---|---|
| GTA V (2015) | 187.7 | 187.6 | 186.9 | 162.3 | 163.5 | 187.4 | |
| The Witcher 3 (2015) | 632 | 585 | 550 | 316 | 275 | 288 | |
| Dota 2 Reborn (2015) | 261.5 | 239.2 | 229.9 | 217 | 211.5 | ||
| Final Fantasy XV Benchmark (2018) | 236 | 237 | 233 | 226 | 161.5 | ||
| X-Plane 11.11 (2018) | 228 | 196.9 | 147.8 | 124.6 | |||
| Far Cry 5 (2018) | 255 | 219 | 211 | 196 | 195 | 181 | |
| Strange Brigade (2018) | 717 | 542 | 548 | 546 | 514 | 289 | |
| Shadow of the Tomb Raider (2018) | 281 | 272 | 279 | 272 | 266 | 188.8 | |
| Far Cry New Dawn (2019) | 216 | 189 | 180 | 163 | 162 | 153 | |
| Metro Exodus (2019) | 296 | 271 | 238 | 202 | 188.8 | 142.1 | |
| Borderlands 3 (2019) | 237 | 209 | 192.9 | 182 | 179.3 | 136.1 | |
| F1 2020 (2020) | 403 | 402 | 406 | 373 | 368 | 288 | |
| F1 2021 (2021) | 562 | 541 | 468 | 278 | 268 | 201 | |
| Far Cry 6 (2021) | 230 | 199.8 | 178.3 | 182.4 | 175.5 | 139.4 | |
| Forza Horizon 5 (2021) | 364 | 300 | 292 | 214 | 199 | 162 | |
| God of War (2022) | 244 | 245 | 244 | 214 | 180 | 130.9 | |
| GRID Legends (2022) | 248 | 220 | 208 | 201 | 201 | 181.6 | |
| Tiny Tina's Wonderlands (2022) | 429 | 372 | 319 | 291 | 232 | 130.4 | |
| F1 22 (2022) | 379 | 390 | 380 | 210 | 160.3 | 83.5 | |
| The Quarry (2022) | 359 | 312 | 277 | 252 | 197.1 | 82.9 | |
| The Witcher 3 v4 (2023) | 317 | 285 | 313 | 226 | 225 | 169 | |
| F1 23 (2023) | 376 | 393 | 374 | 199.7 | 154.5 | 134 | 79.9 |
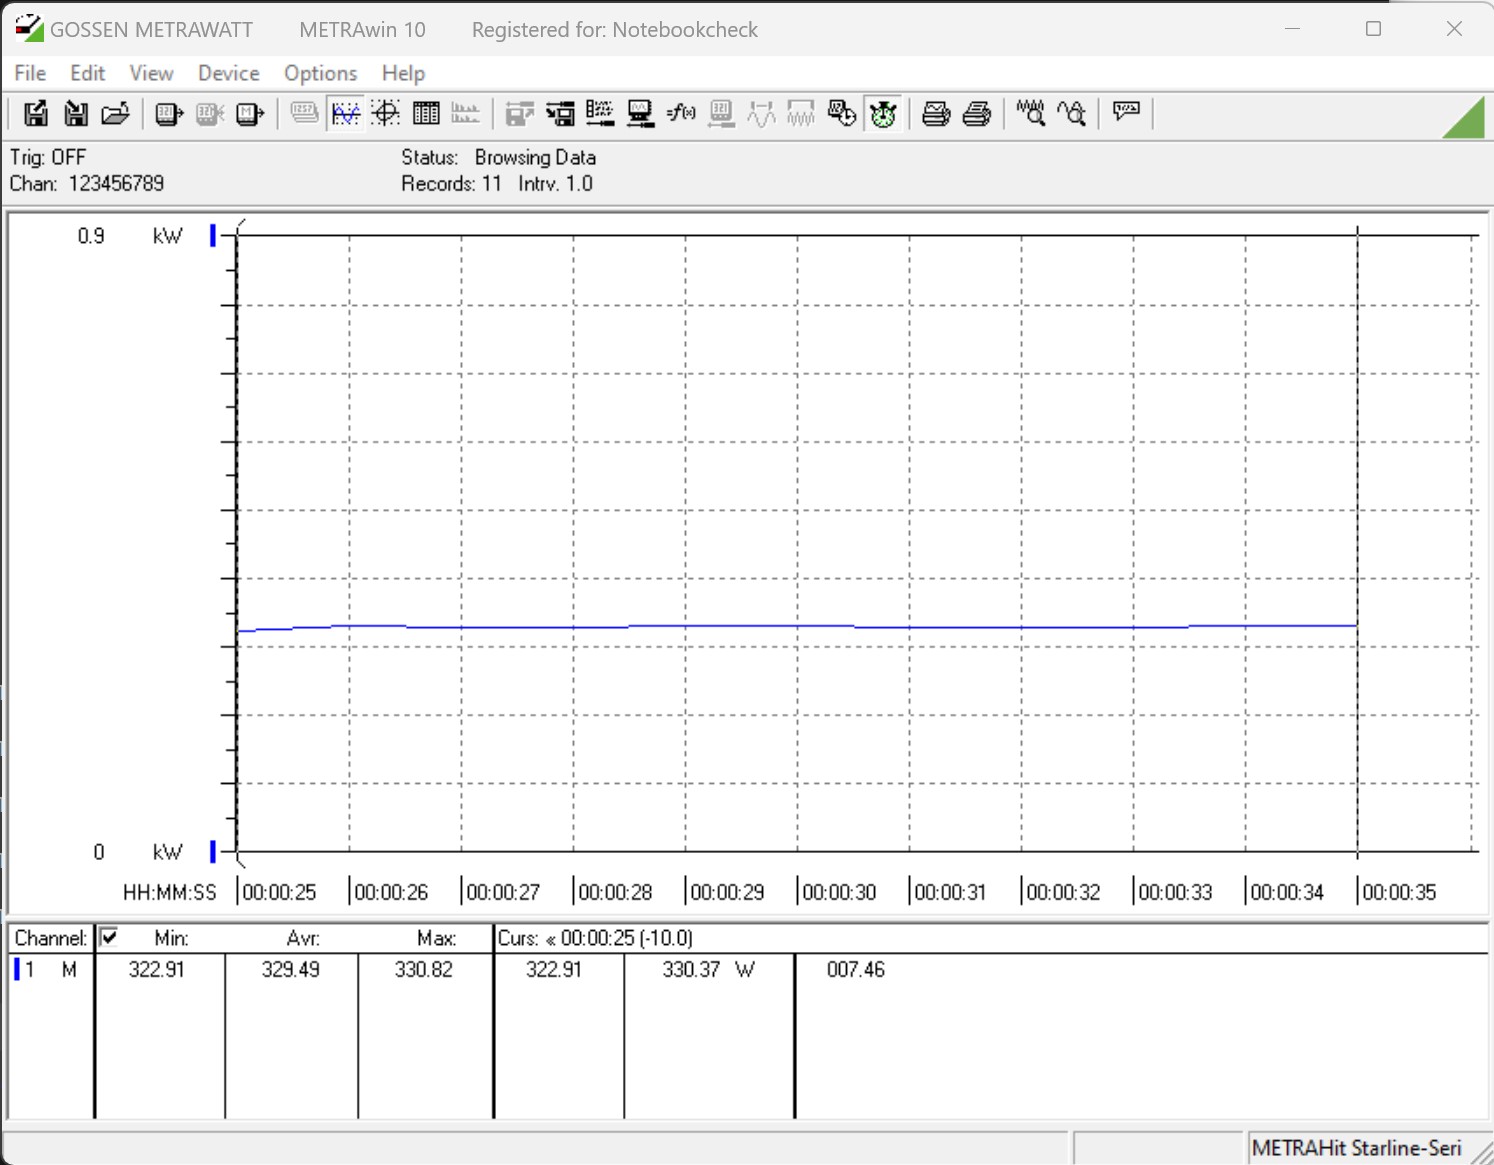
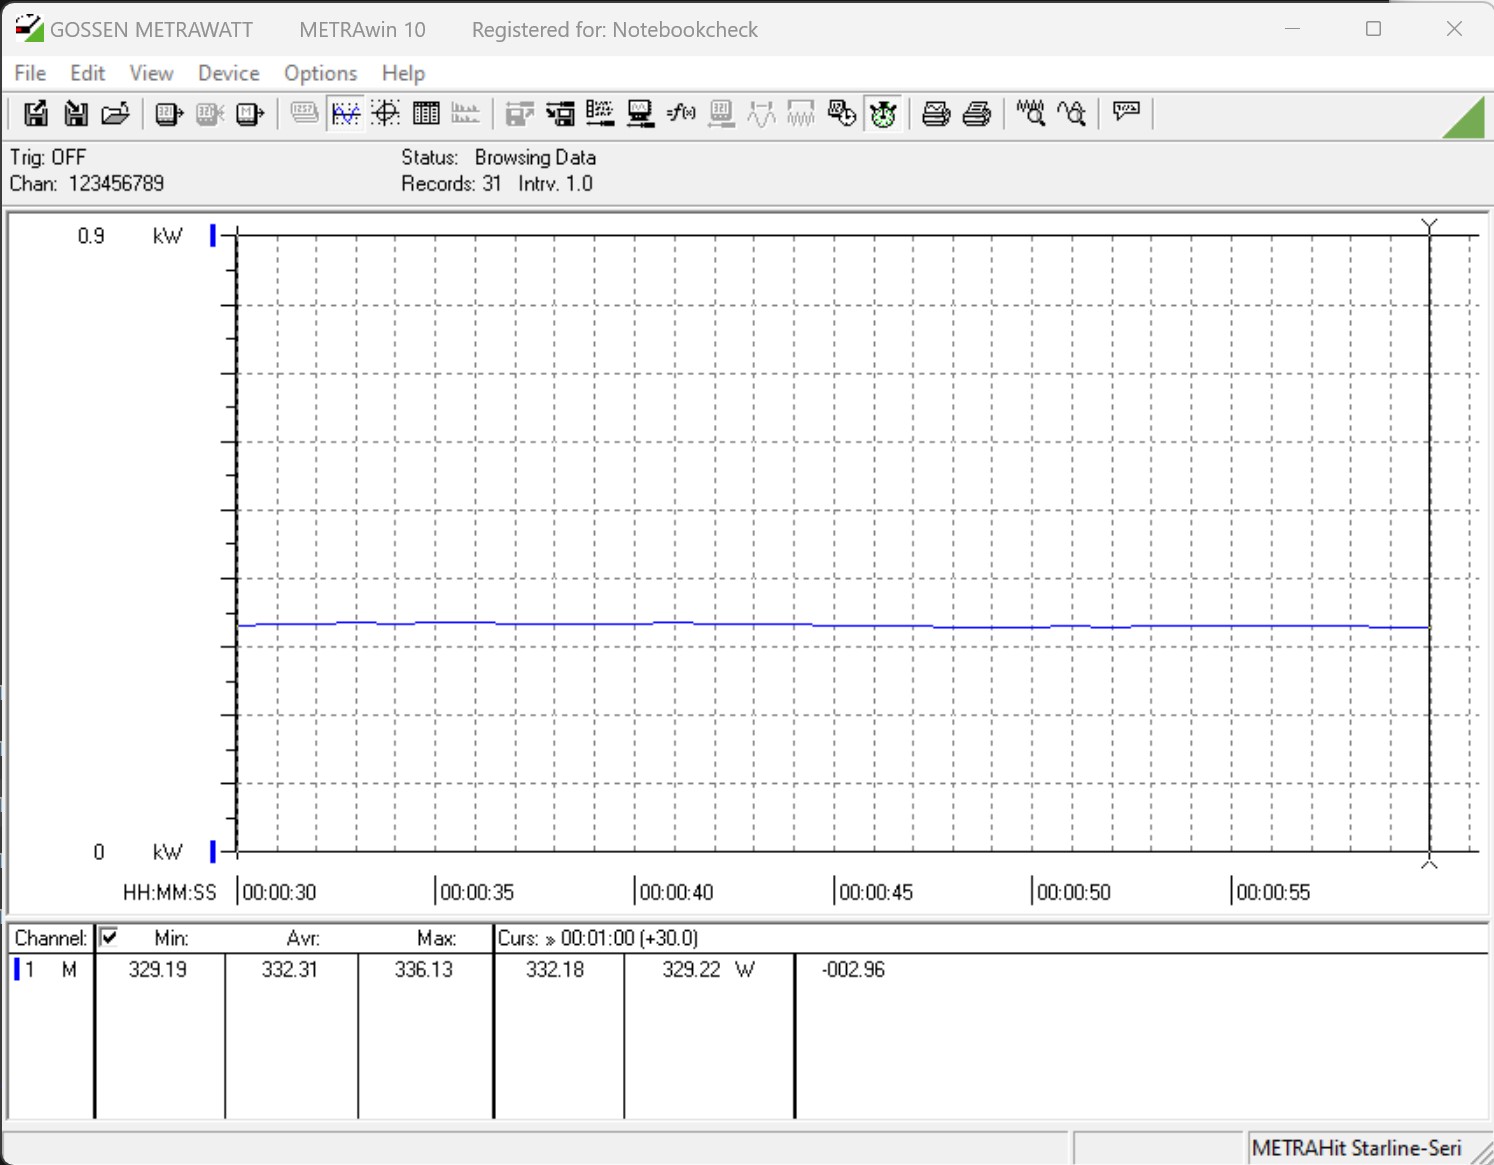
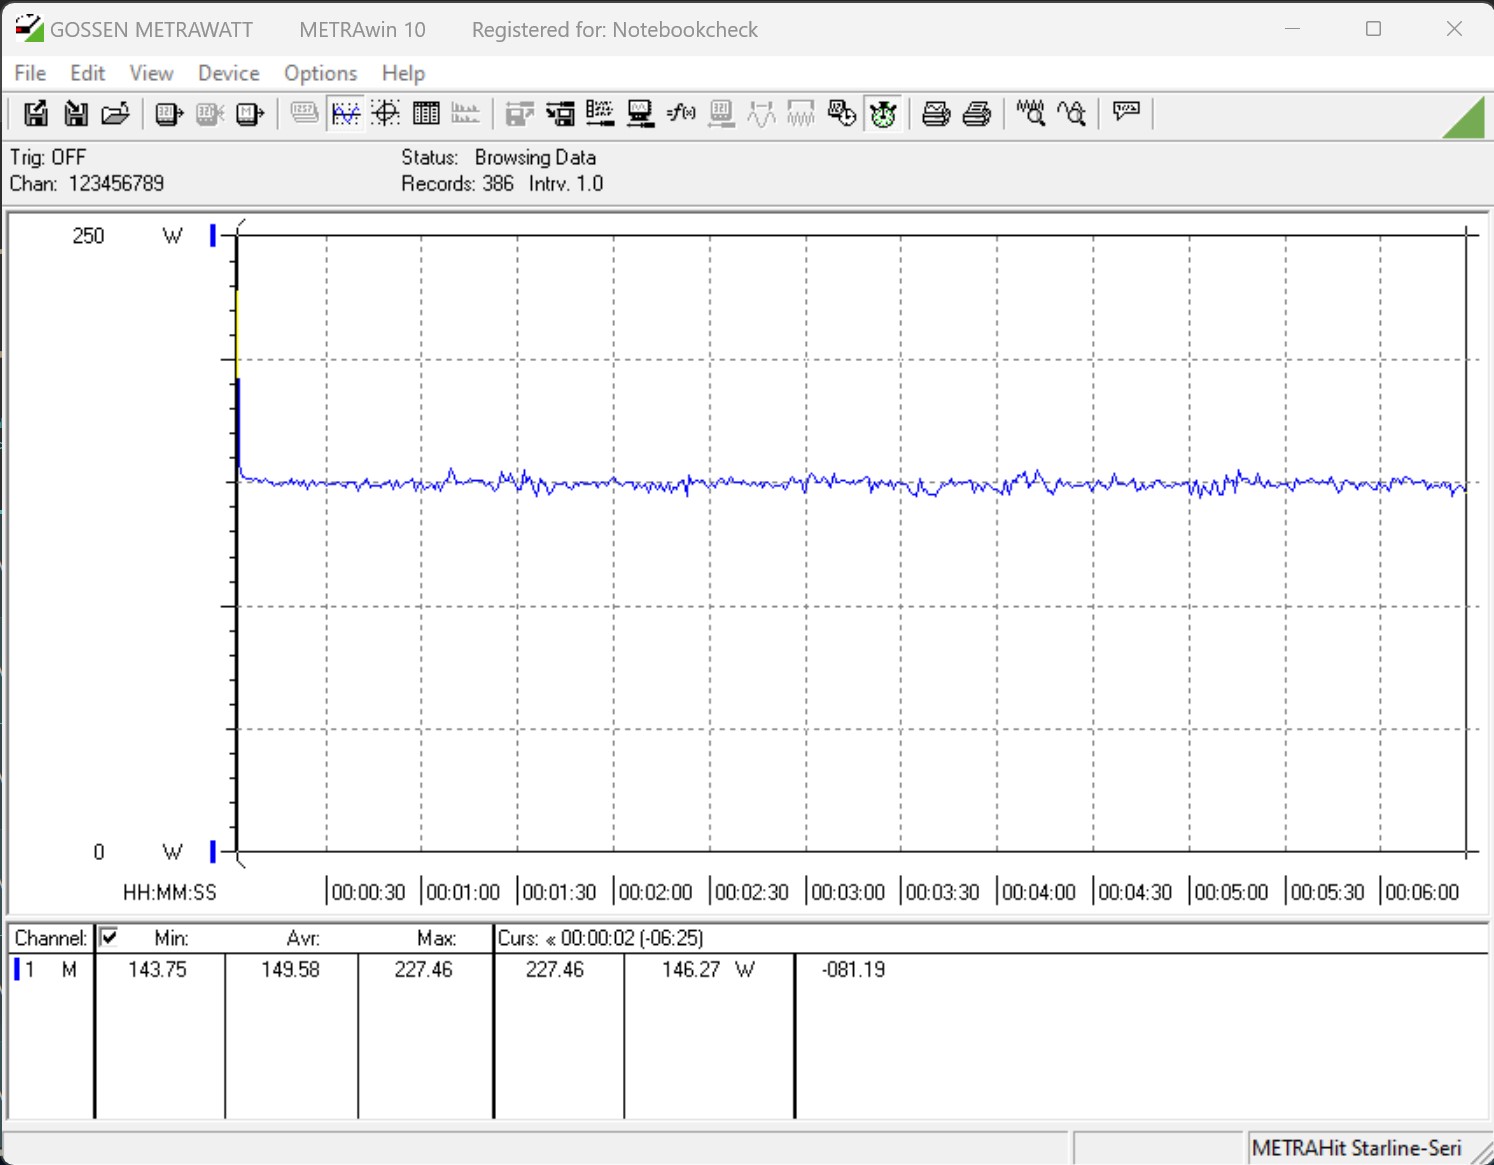
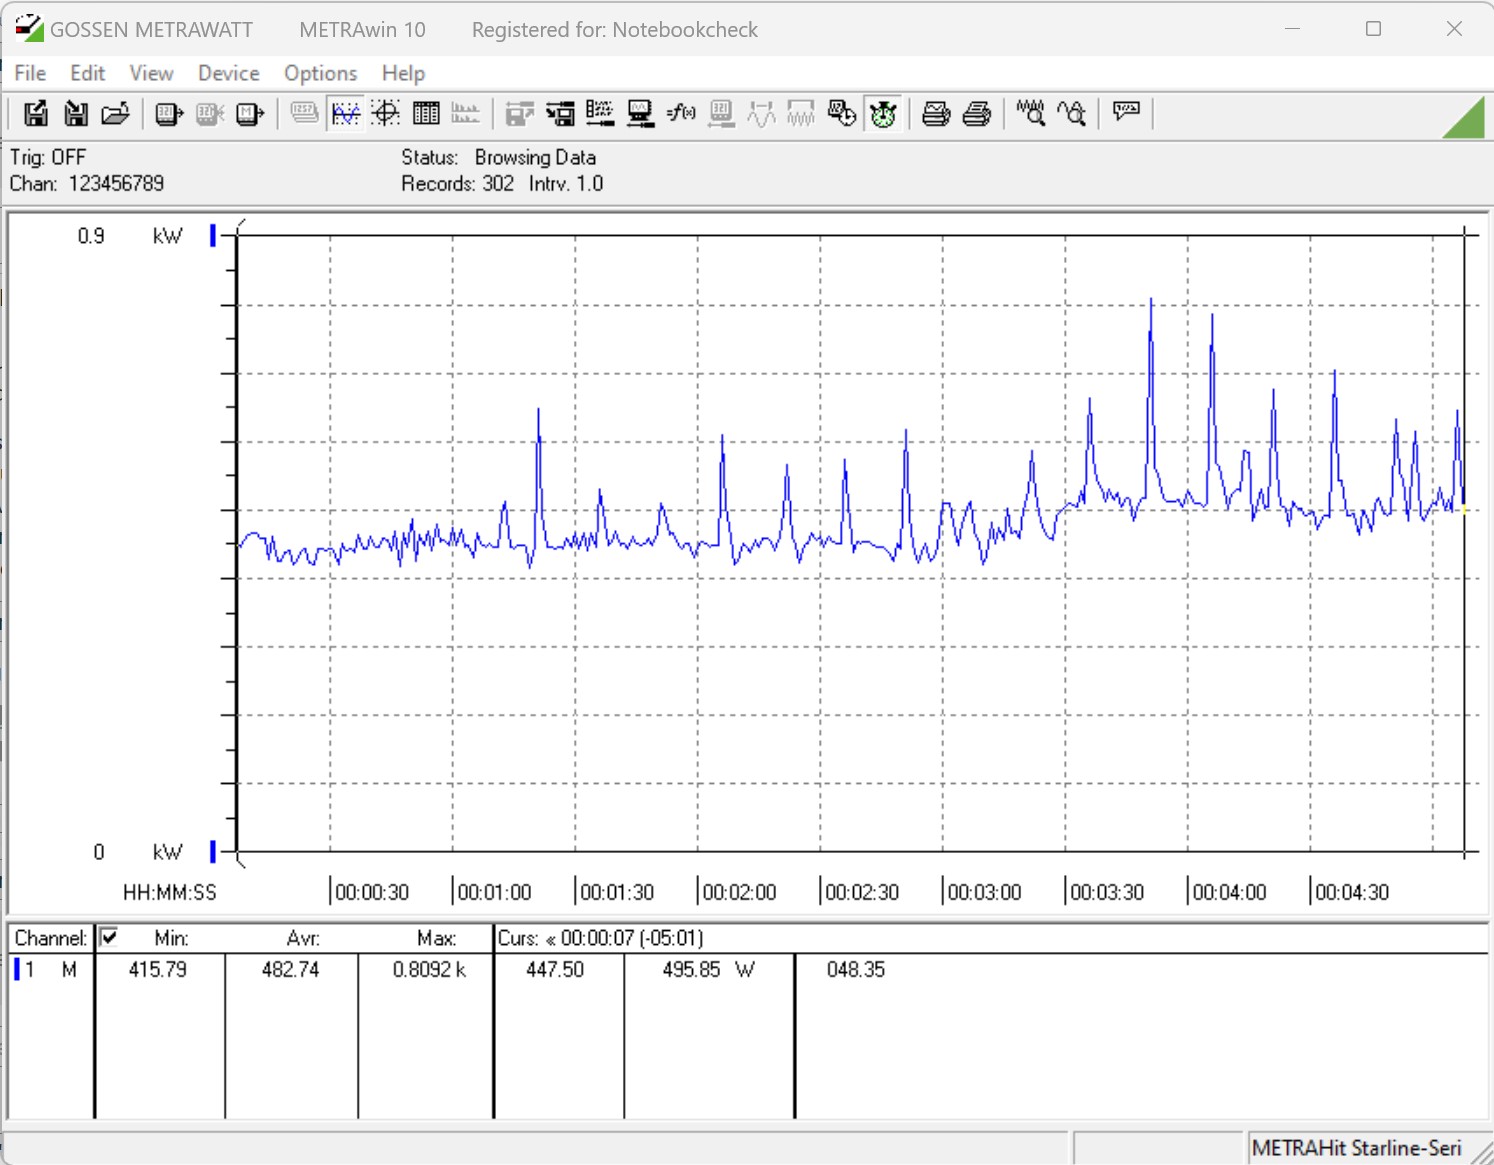
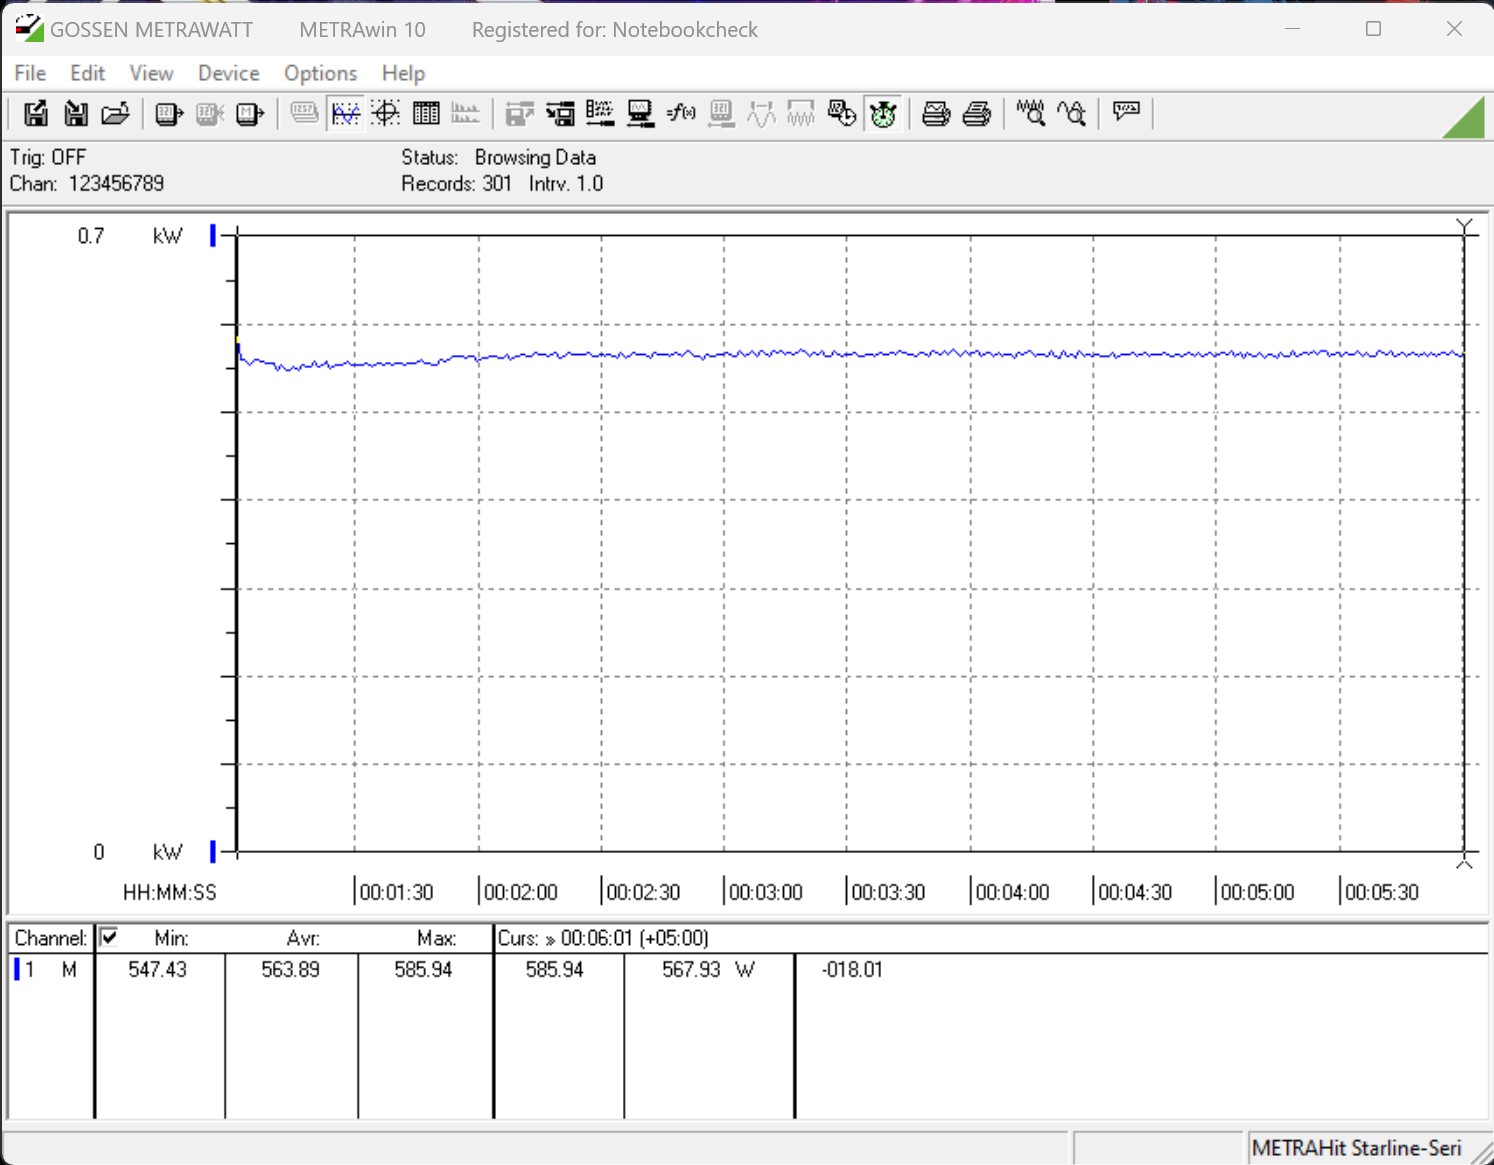
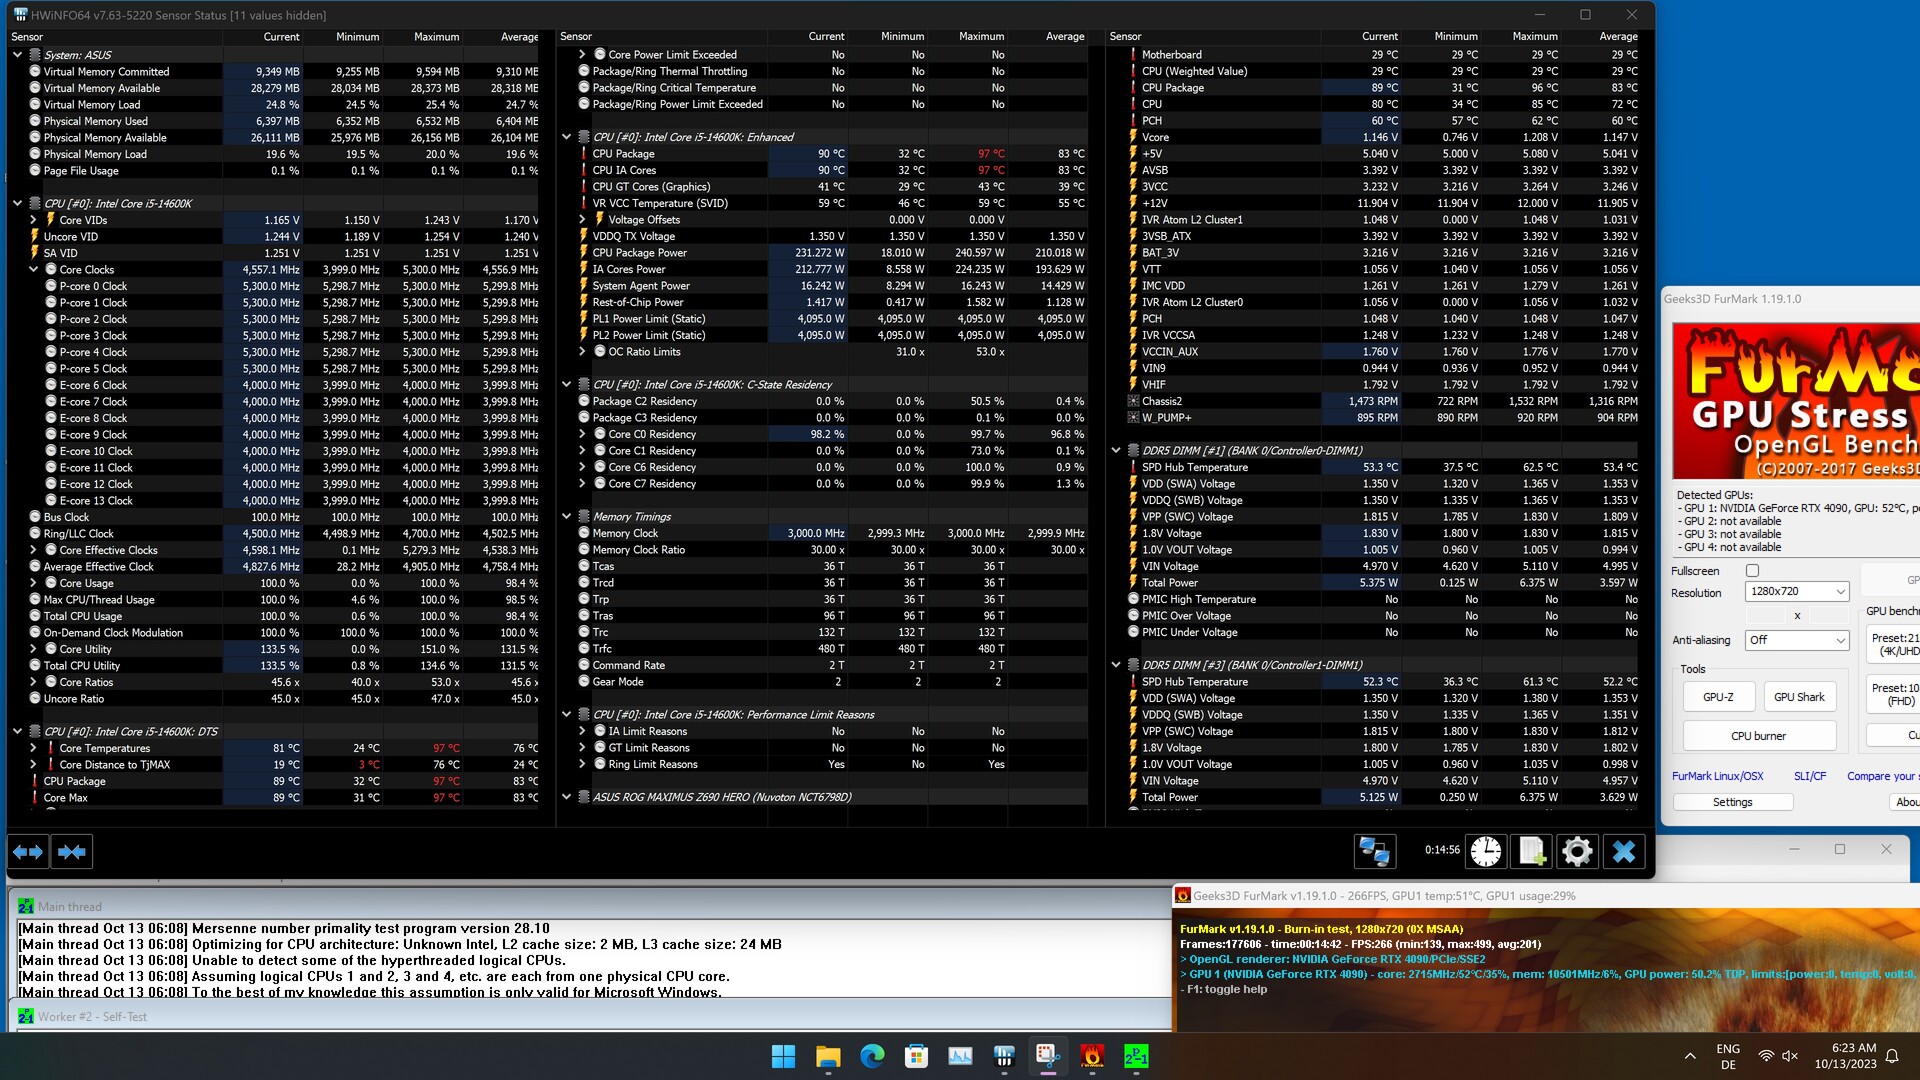
Consumo di energia
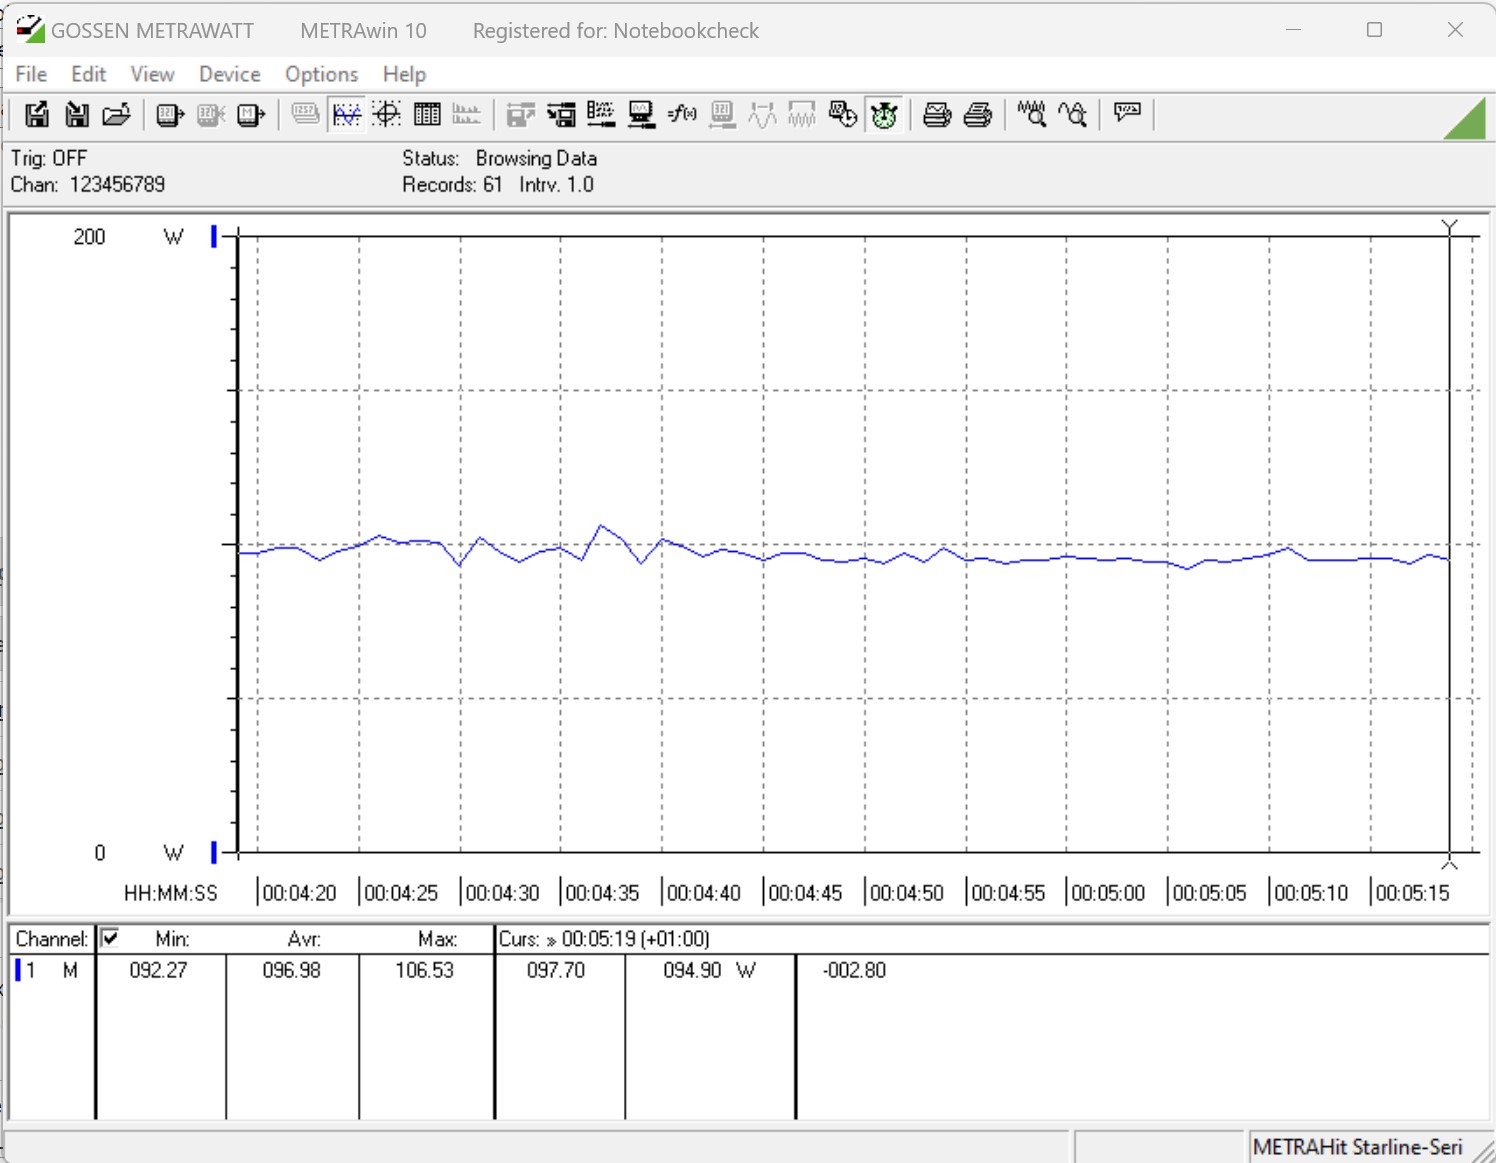
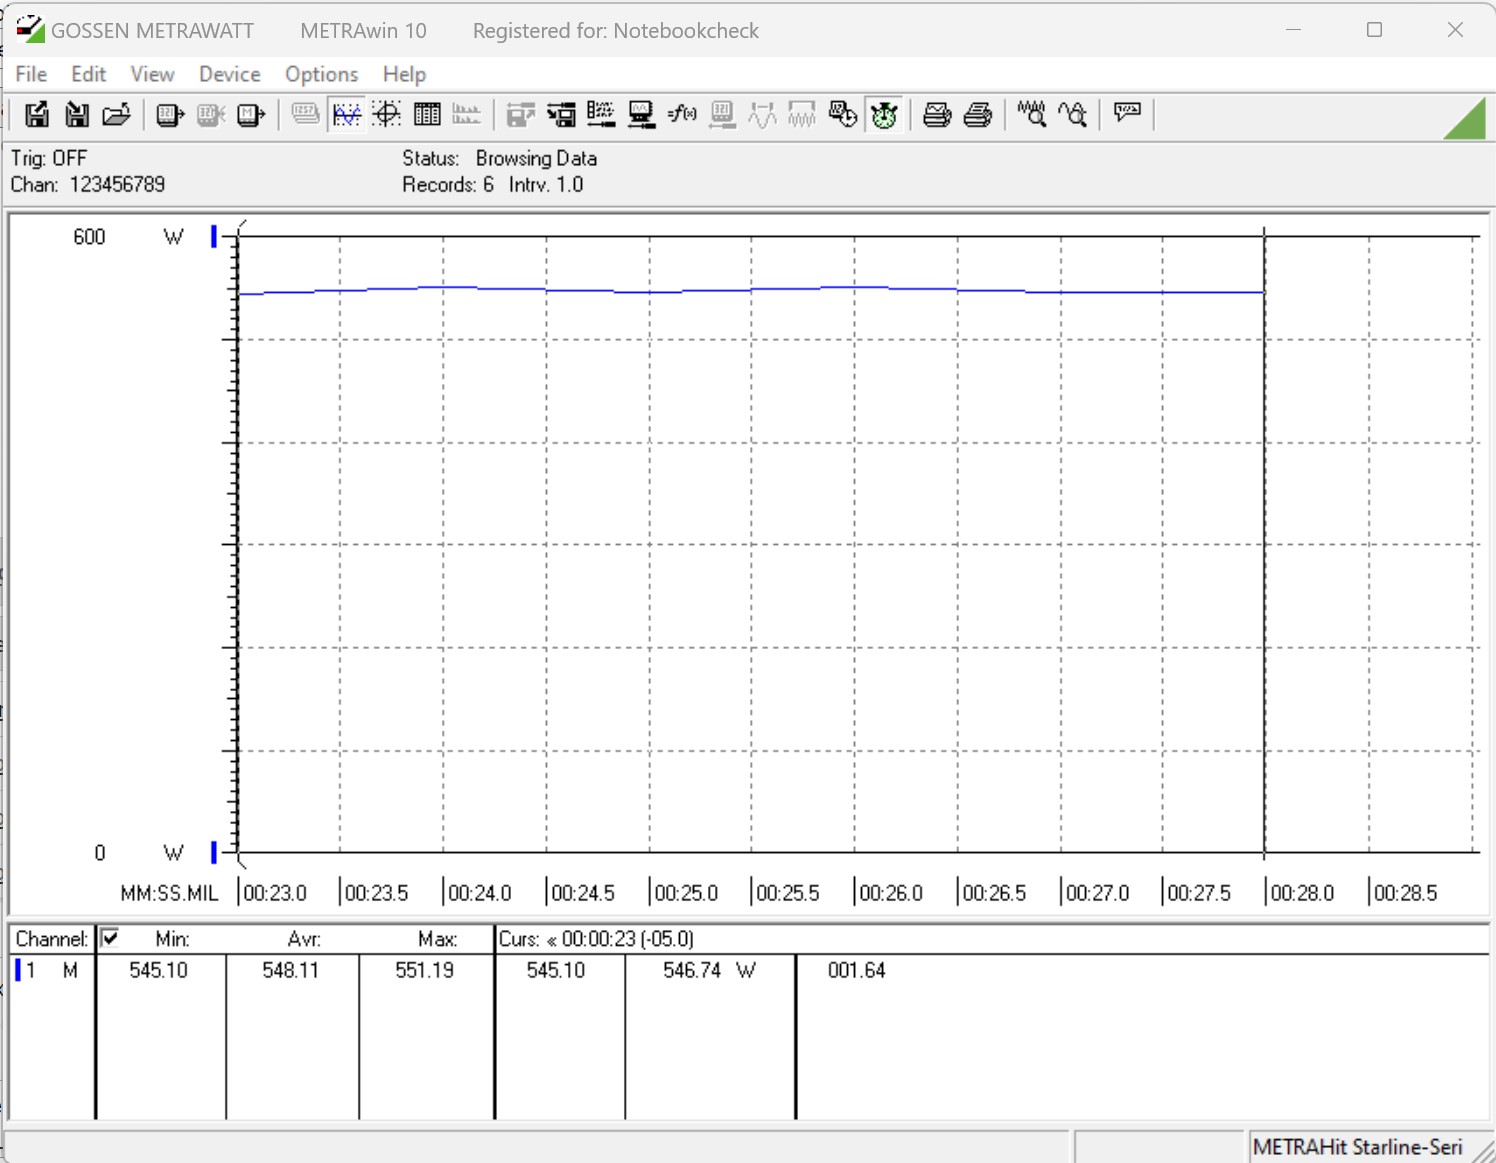
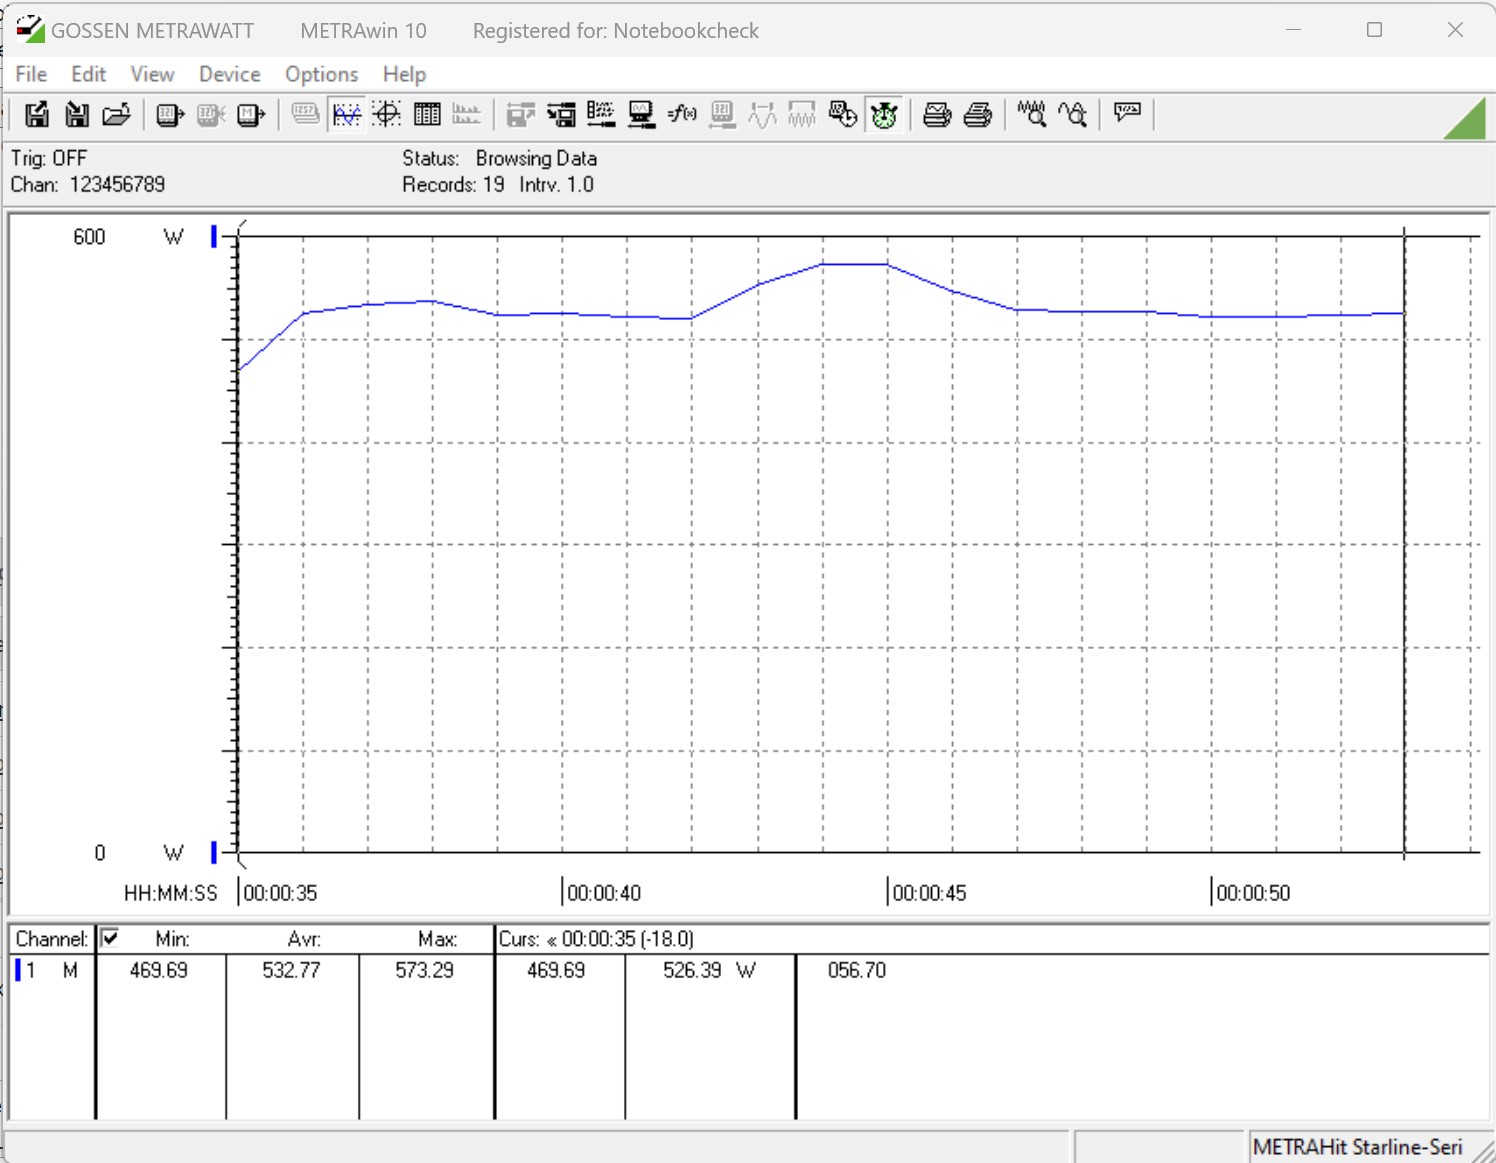
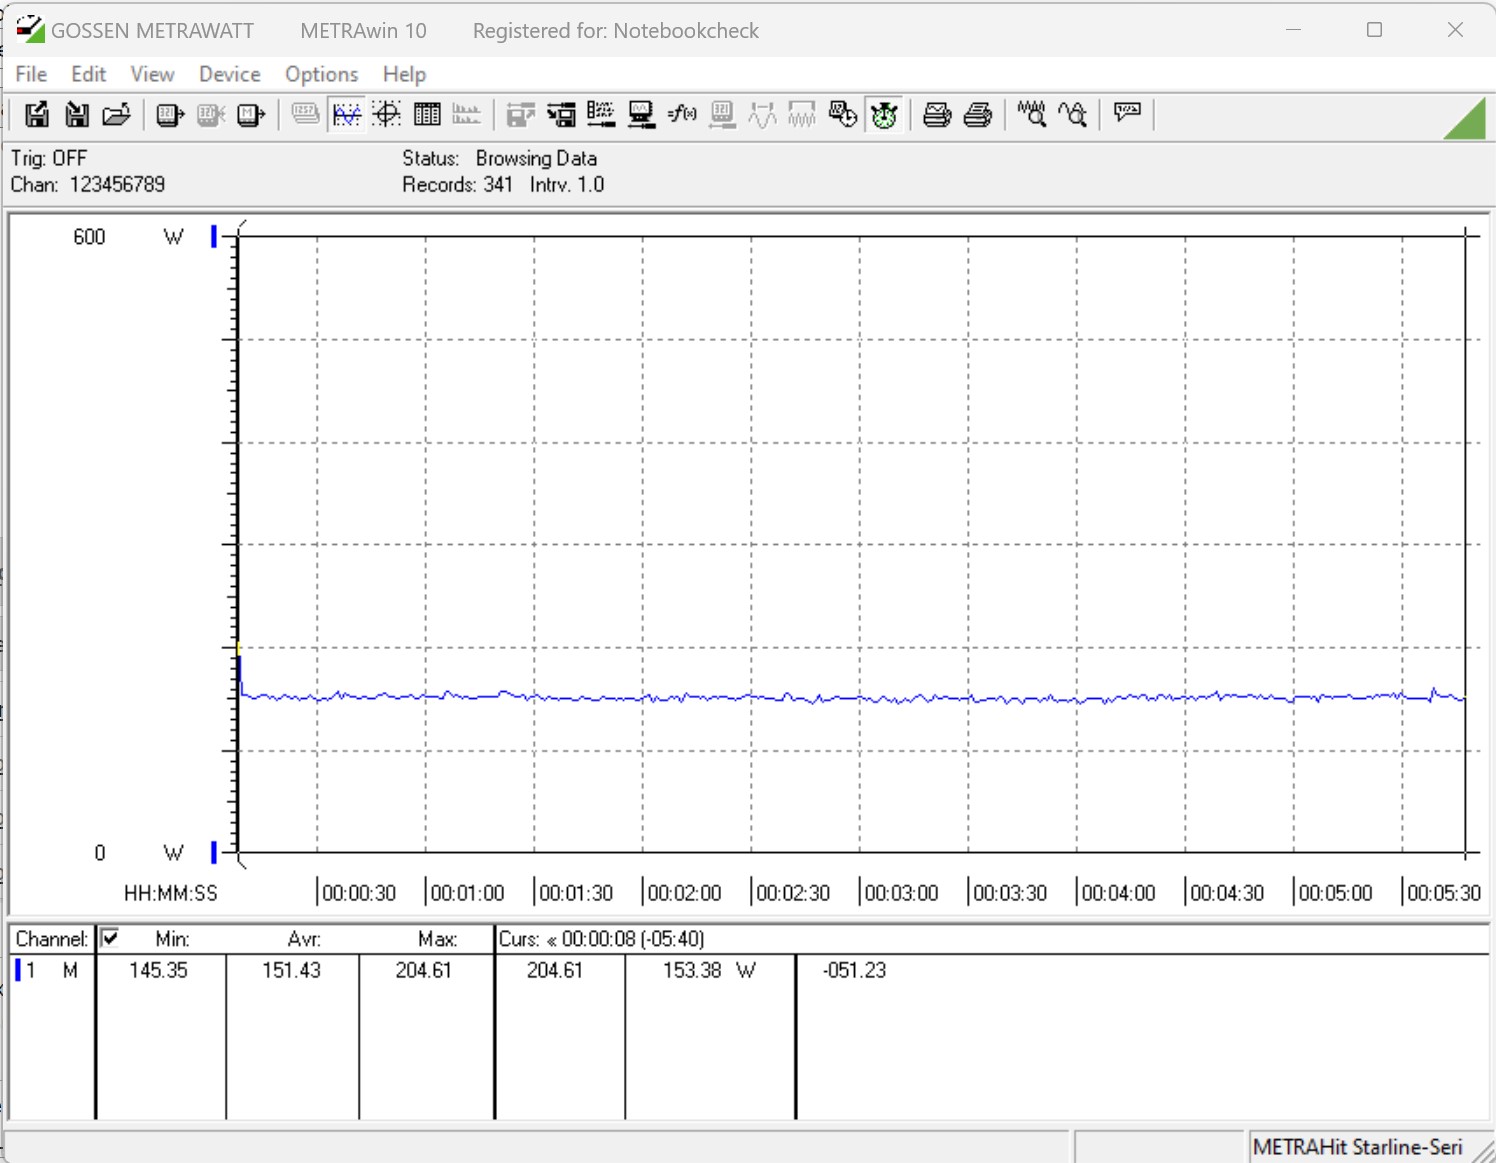
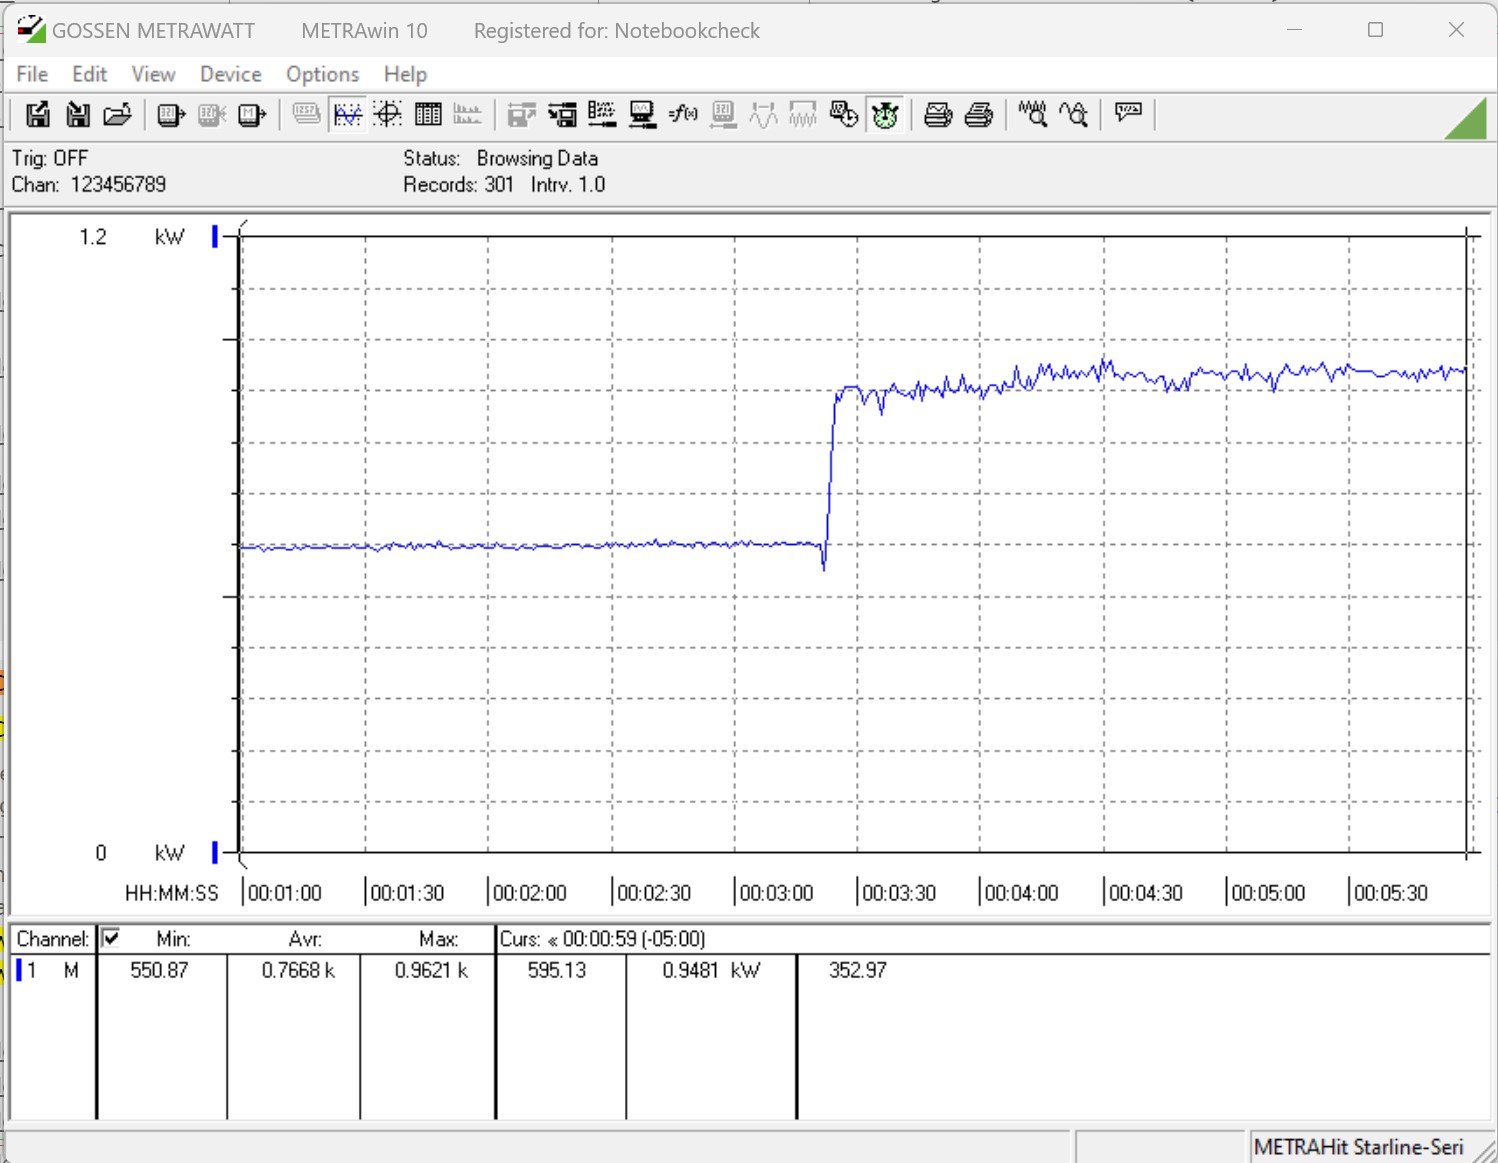
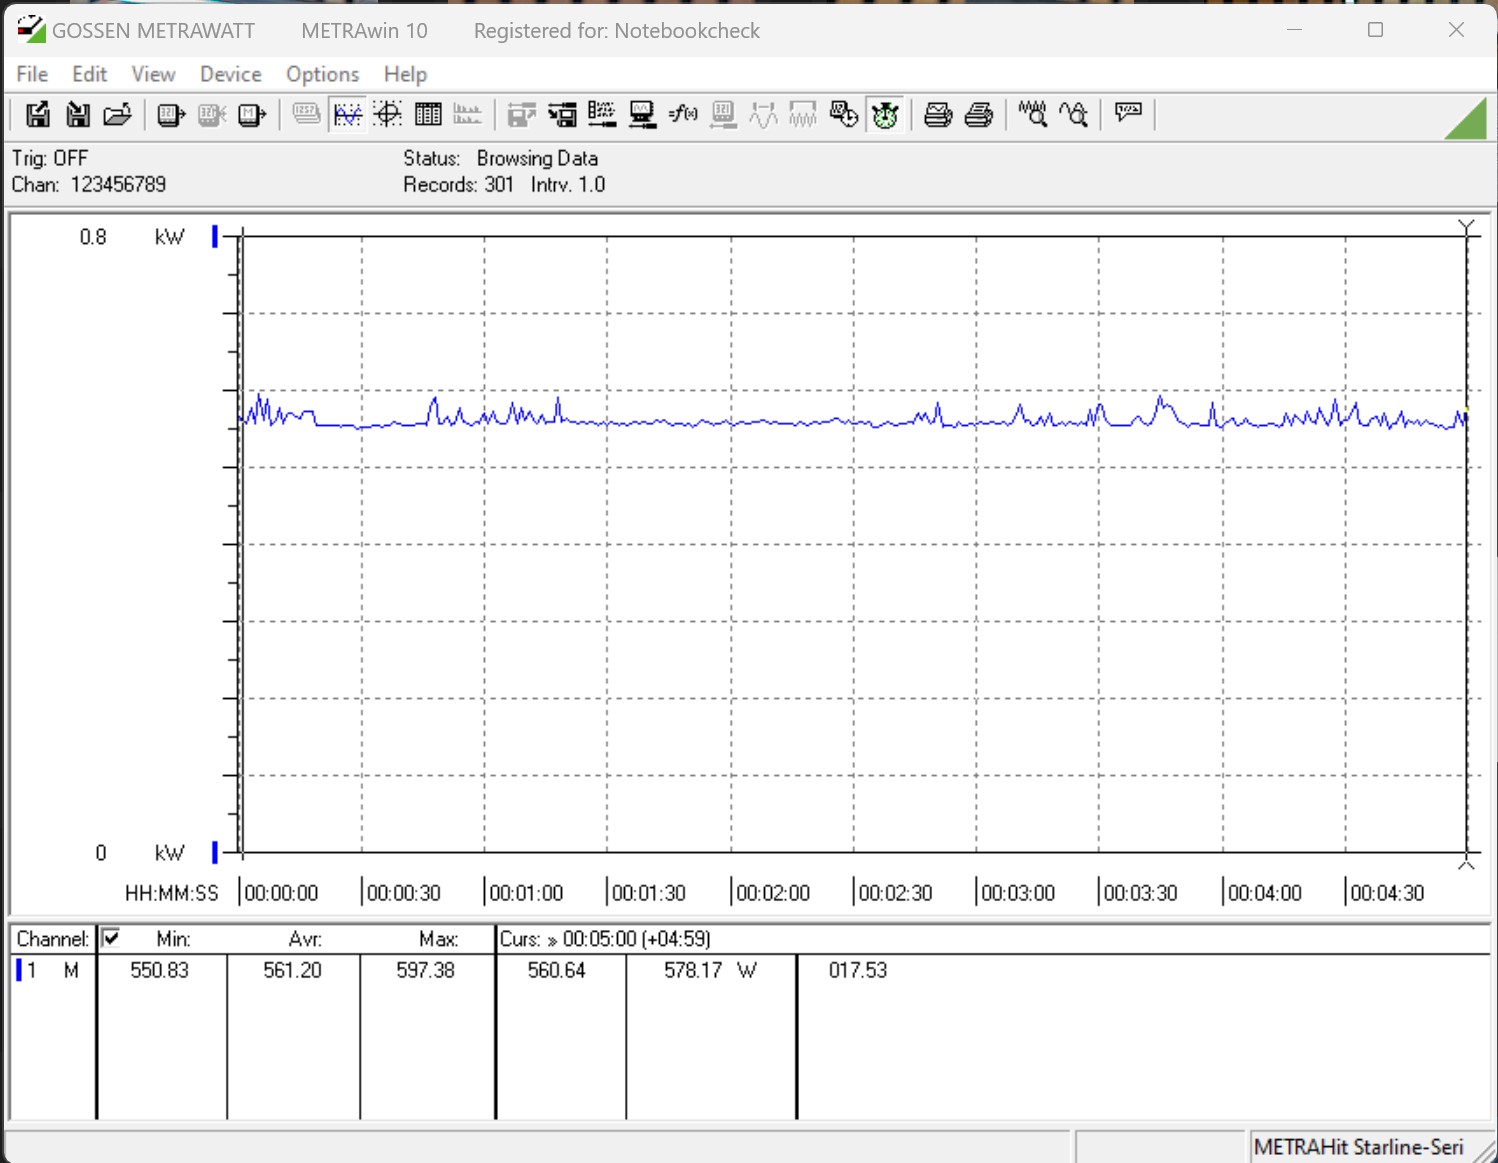
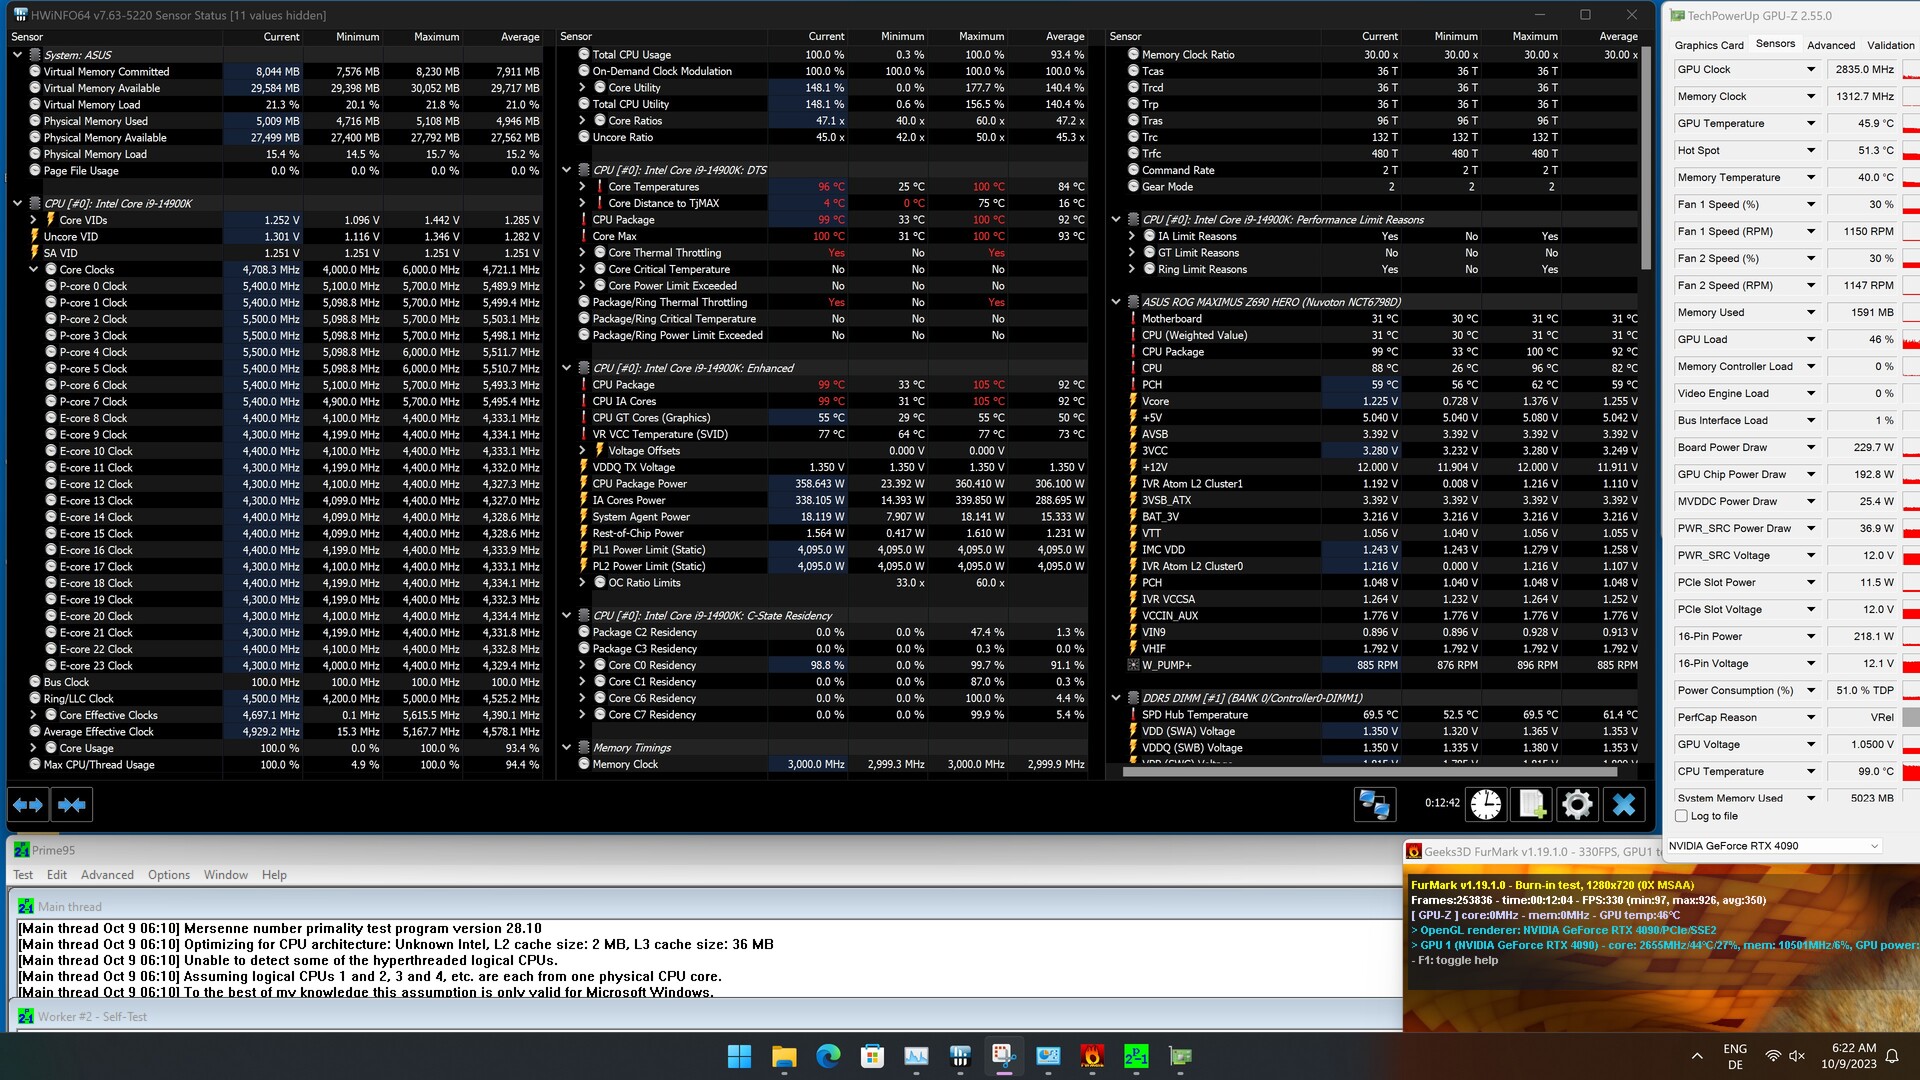
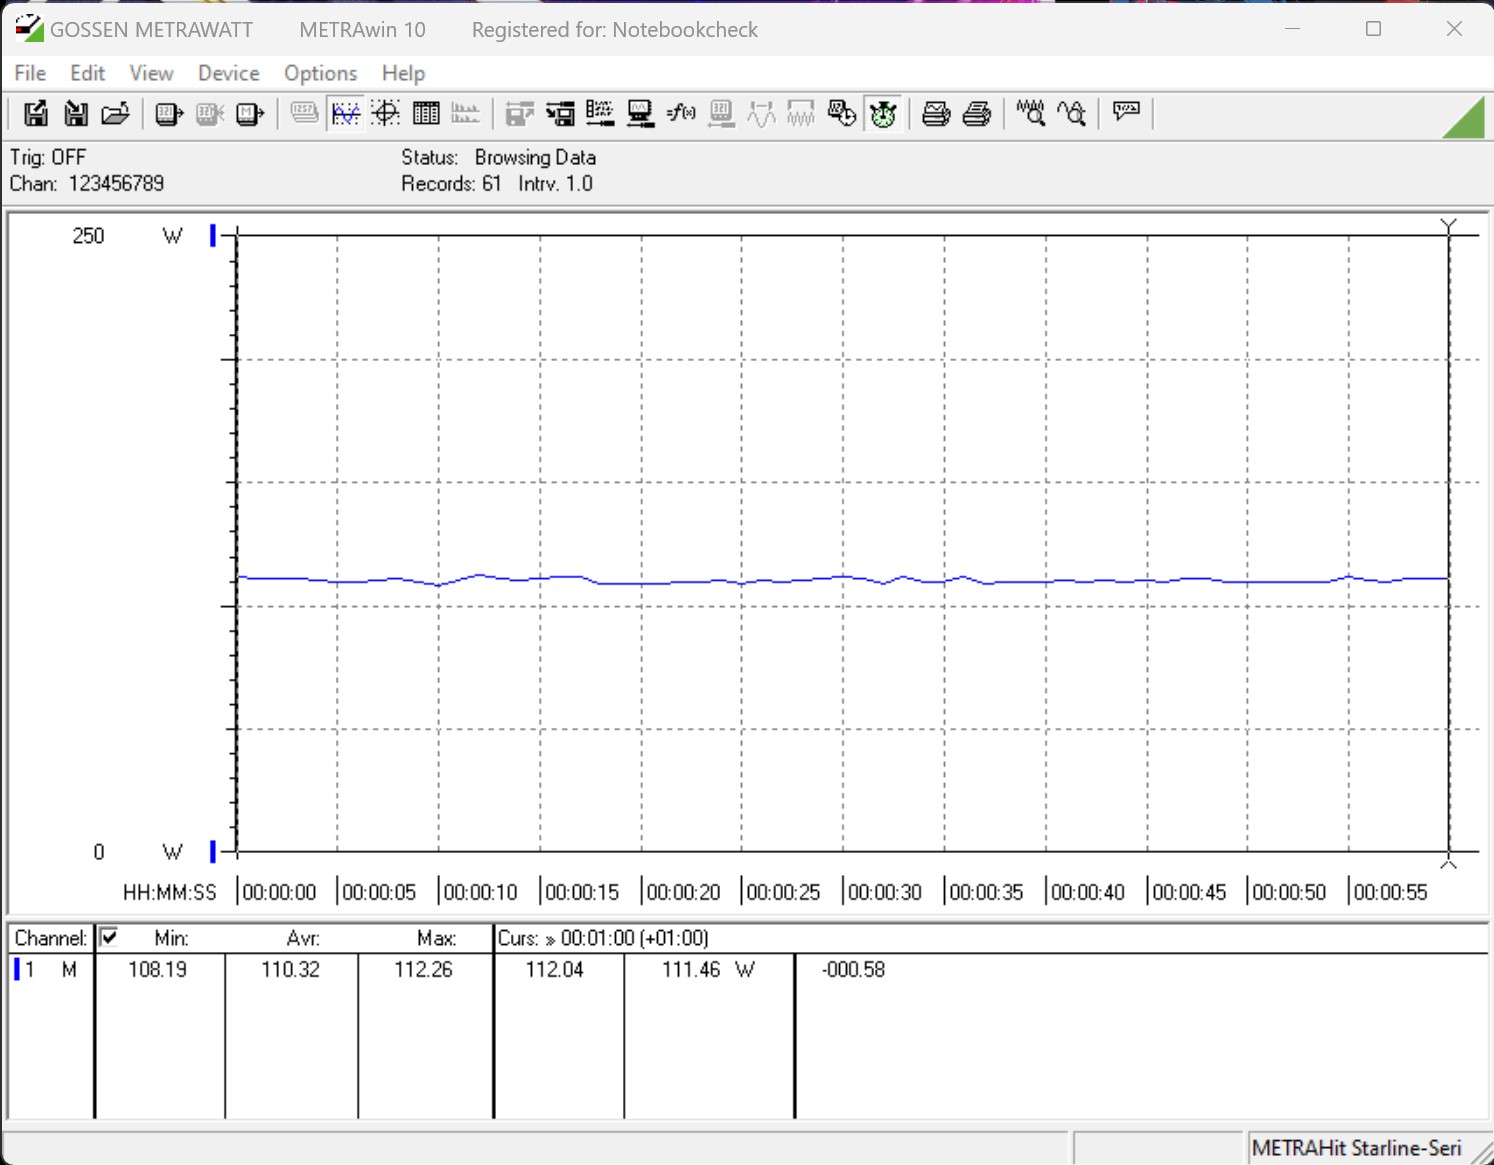
Secondo i dati tecnici del produttore, non ci sono cambiamenti nelle specifiche del consumo energetico: Mentre il suo limite PL1 rimane a 125 watt, il valore PL2 del Core i9-14900K è di 253 watt. Per l'Intel Core i5-14600K, il produttore continua a specificare 181 watt come limite PL2. Come già detto, abbiamo eseguito tutti i test con limiti di potenza aperti. Ciò significa anche che solo il limite di temperatura è in grado di limitare la CPU. Non sorprende quindi che abbiamo raggiunto ripetutamente i 100 °C (212 °F) durante il nostro stress test. Lo abbiamo già visto in precedenza nel ciclo di Cinebench. In termini di consumo energetico, abbiamo notato un consumo massimo della CPU di 360 watt per il Core i9-14900K e 240 watt per il Core i5-14600K. Grazie al potente sistema di raffreddamento ad acqua, il consumo energetico aumenta drasticamente.
Se confrontiamo questi valori con i sistemi AMD, Intel ha ancora molto da recuperare. L'altrettanto affamato AMD Ryzen 9 7950X è ancora significativamente più efficiente, con un consumo di sistema di 364 watt, e se prendiamo in considerazione anche la controparte X3D, le prospettive diventano ancora più cupe per Intel.
Pertanto, consigliamo di impostare il limite di potenza a un massimo di 253 watt sotto carico costante, seguendo le specifiche del produttore. Allo stesso tempo, dovrebbe comunque utilizzare una soluzione di raffreddamento AiO potente con un radiatore da 360 millimetri. Chi sta pensando di acquistare l'Intel Core i5-14600K dovrebbe essere in grado di tenerlo sotto controllo abbastanza facilmente, grazie al suo consumo energetico inferiore. Ma se si eliminano anche tutti i limiti qui presenti, si dovrebbe utilizzare anche un sistema di raffreddamento AiO da 360 millimetri.
Intel Core i9-14900K
Intel Core i5-14600K
| Power Consumption / Cinebench R15 Multi (external Monitor) | |
| Intel Core i9-14900K | |
| Intel Core i9-13900K | |
| AMD Ryzen 9 7950X (Idle: 95.2 W) | |
| Intel Core i7-13700K | |
| Intel Core i5-14600K | |
| Intel Core i5-13600K | |
| Intel Core i7-12700 | |
| AMD Ryzen 9 7950X3D | |
| AMD Ryzen 7 7800X3D | |
| Intel Core i5-13400 | |
| Intel Core i5-12400F | |
| Power Consumption / Prime95 V2810 Stress (external Monitor) | |
| Intel Core i9-14900K | |
| Intel Core i9-13900K | |
| Intel Core i5-14600K | |
| Intel Core i7-13700K | |
| Intel Core i5-13600K | |
| AMD Ryzen 9 7950X (Idle: 95.2 W) | |
| Intel Core i7-12700 | |
| AMD Ryzen 9 7950X3D | |
| Intel Core i5-12400F | |
| Intel Core i5-13400 | |
| AMD Ryzen 7 7800X3D | |
| Power Consumption / Cinebench R23 Multi (external Monitor) | |
| Intel Core i9-14900K | |
| AMD Ryzen 9 7950X (95.2) | |
| Intel Core i5-14600K | |
| AMD Ryzen 9 7950X3D | |
| AMD Ryzen 7 7800X3D | |
| Power Consumption / Cinebench R23 Single (external Monitor) | |
| AMD Ryzen 7 7800X3D | |
| AMD Ryzen 9 7950X (95.2) | |
| Intel Core i9-14900K | |
| Intel Core i5-14600K | |
* ... Meglio usare valori piccoli
| Power Consumption / The Witcher 3 ultra (external Monitor) | |
| Intel Core i5-14600K | |
| Intel Core i9-14900K | |
| Intel Core i7-13700 | |
| Intel Core i7-13700K | |
| AMD Ryzen 9 7950X | |
| AMD Ryzen 9 7950X3D | |
| Intel Core i9-13900K | |
| Intel Core i7-12700 | |
| Intel Core i5-13400 | |
| AMD Ryzen 7 7800X3D | |
| Intel Core i5-12400F | |
* ... Meglio usare valori piccoli
Power Consumption With External Monitor
Pro
Contro
Verdetto - Le prestazioni più elevate comportano un consumo energetico più elevato

La nuova versione della serie Raptor Lake di Intel ha aumentato di nuovo leggermente le prestazioni. Tuttavia, i salti di prestazioni rispetto alla 13esima generazione si sono rivelati relativamente piccoli. Nel complesso, con l'Intel Core i9-14900K, si ottiene un processore davvero veloce che è in grado di ottenere punti in tutte le aree. Il nuovo modello di fascia alta è in grado di padroneggiare i compiti multi-thread così come quelli single-core, e con 6 GHz in boost, anche i giochi beneficiano di queste prestazioni. D'altro canto, consideriamo il consumo energetico elevato come il principale svantaggio di questo modello. Ma il suo consumo energetico probabilmente non sarà costantemente così elevato durante il funzionamento quotidiano, e anche i giochi, con ogni probabilità, non richiederanno le prestazioni complete della CPU. AMD fa chiaramente un lavoro migliore qui, mostrando come si possono fare le cose con i suoi processori X3D.
Le nuove versioni dei processori Intel Raptor Lake sono chiaramente dei buoni multitalenti. Ma l'Intel Core i9-14900K non guadagnerà sicuramente la corona in termini di efficienza.
Con una velocità di clock superiore e un consumo energetico più elevato, Intel ha lavorato molto per ottenere questa posizione. Con 253 watt, Intel fortunatamente non ha aumentato ulteriormente i limiti di consumo energetico. Il più piccolo Intel Core i5-14600K consuma ancora 181 watt a pieno carico. Inoltre, richiede un sistema di raffreddamento ottimale per poter sfruttare tutte le prestazioni. Insieme a ciò, si aggiungono anche i costi più elevati, e i 162 watt dell'AMD Ryzen 9 7950X.AMD Ryzen 9 7950X3Dsono molto più facili da controllare rispetto ai 253 watt dell'Intel Core i9-14900K.
Apprezziamo la sua compatibilità con le schede madri con socket 1700 già in uso. Ma non sappiamo se questo sia stato intenzionale o se sia nato dalla necessità. In passato, Intel ha cambiato il socket dopo due generazioni di CPU. Solo con la generazione di CPU successiva, Intel inizierà a utilizzare il socket 1851, introducendo ulteriori cambiamenti con Arrow Lake. Quindi possiamo solo sperare che Intel si ispiri ad AMD e utilizzi anche una sorta di cache 3D, migliorando l'efficienza in modo significativo.
Transparency
La selezione dei dispositivi da recensire viene effettuata dalla nostra redazione. Il campione di prova è stato fornito gratuitamente all'autore dal produttore a scopo di revisione. Non vi è stata alcuna influenza di terze parti su questa recensione, né il produttore ne ha ricevuto una copia prima della pubblicazione. Non vi era alcun obbligo di pubblicare questa recensione. In quanto società mediatica indipendente, Notebookcheck non è soggetta all'autorità di produttori, rivenditori o editori.
Ecco come Notebookcheck esegue i test
Ogni anno, Notebookcheck esamina in modo indipendente centinaia di laptop e smartphone utilizzando procedure standardizzate per garantire che tutti i risultati siano comparabili. Da circa 20 anni sviluppiamo continuamente i nostri metodi di prova e nel frattempo stabiliamo gli standard di settore. Nei nostri laboratori di prova, tecnici ed editori esperti utilizzano apparecchiature di misurazione di alta qualità. Questi test comportano un processo di validazione in più fasi. Il nostro complesso sistema di valutazione si basa su centinaia di misurazioni e parametri di riferimento ben fondati, che mantengono l'obiettività.
