Recensione della GPU desktop Palit GeForce RTX 4090 GameRock OC: Prestazioni di alto livello con un prezzo all'altezza

Il nuovo modello di punta di Nvidia porta il nome di GeForce RTX 4090 e dispone di ben 24 GB di VRAM, come il suo predecessore. Di conseguenza, si sta sempre più affermando come standard nel segmento di fascia alta delle schede grafiche consumer. Anche la Radeon RX 7900 XTX di AMD, presentata di recente, segue l'esempio ed è dotata di 24 GB di VRAM.
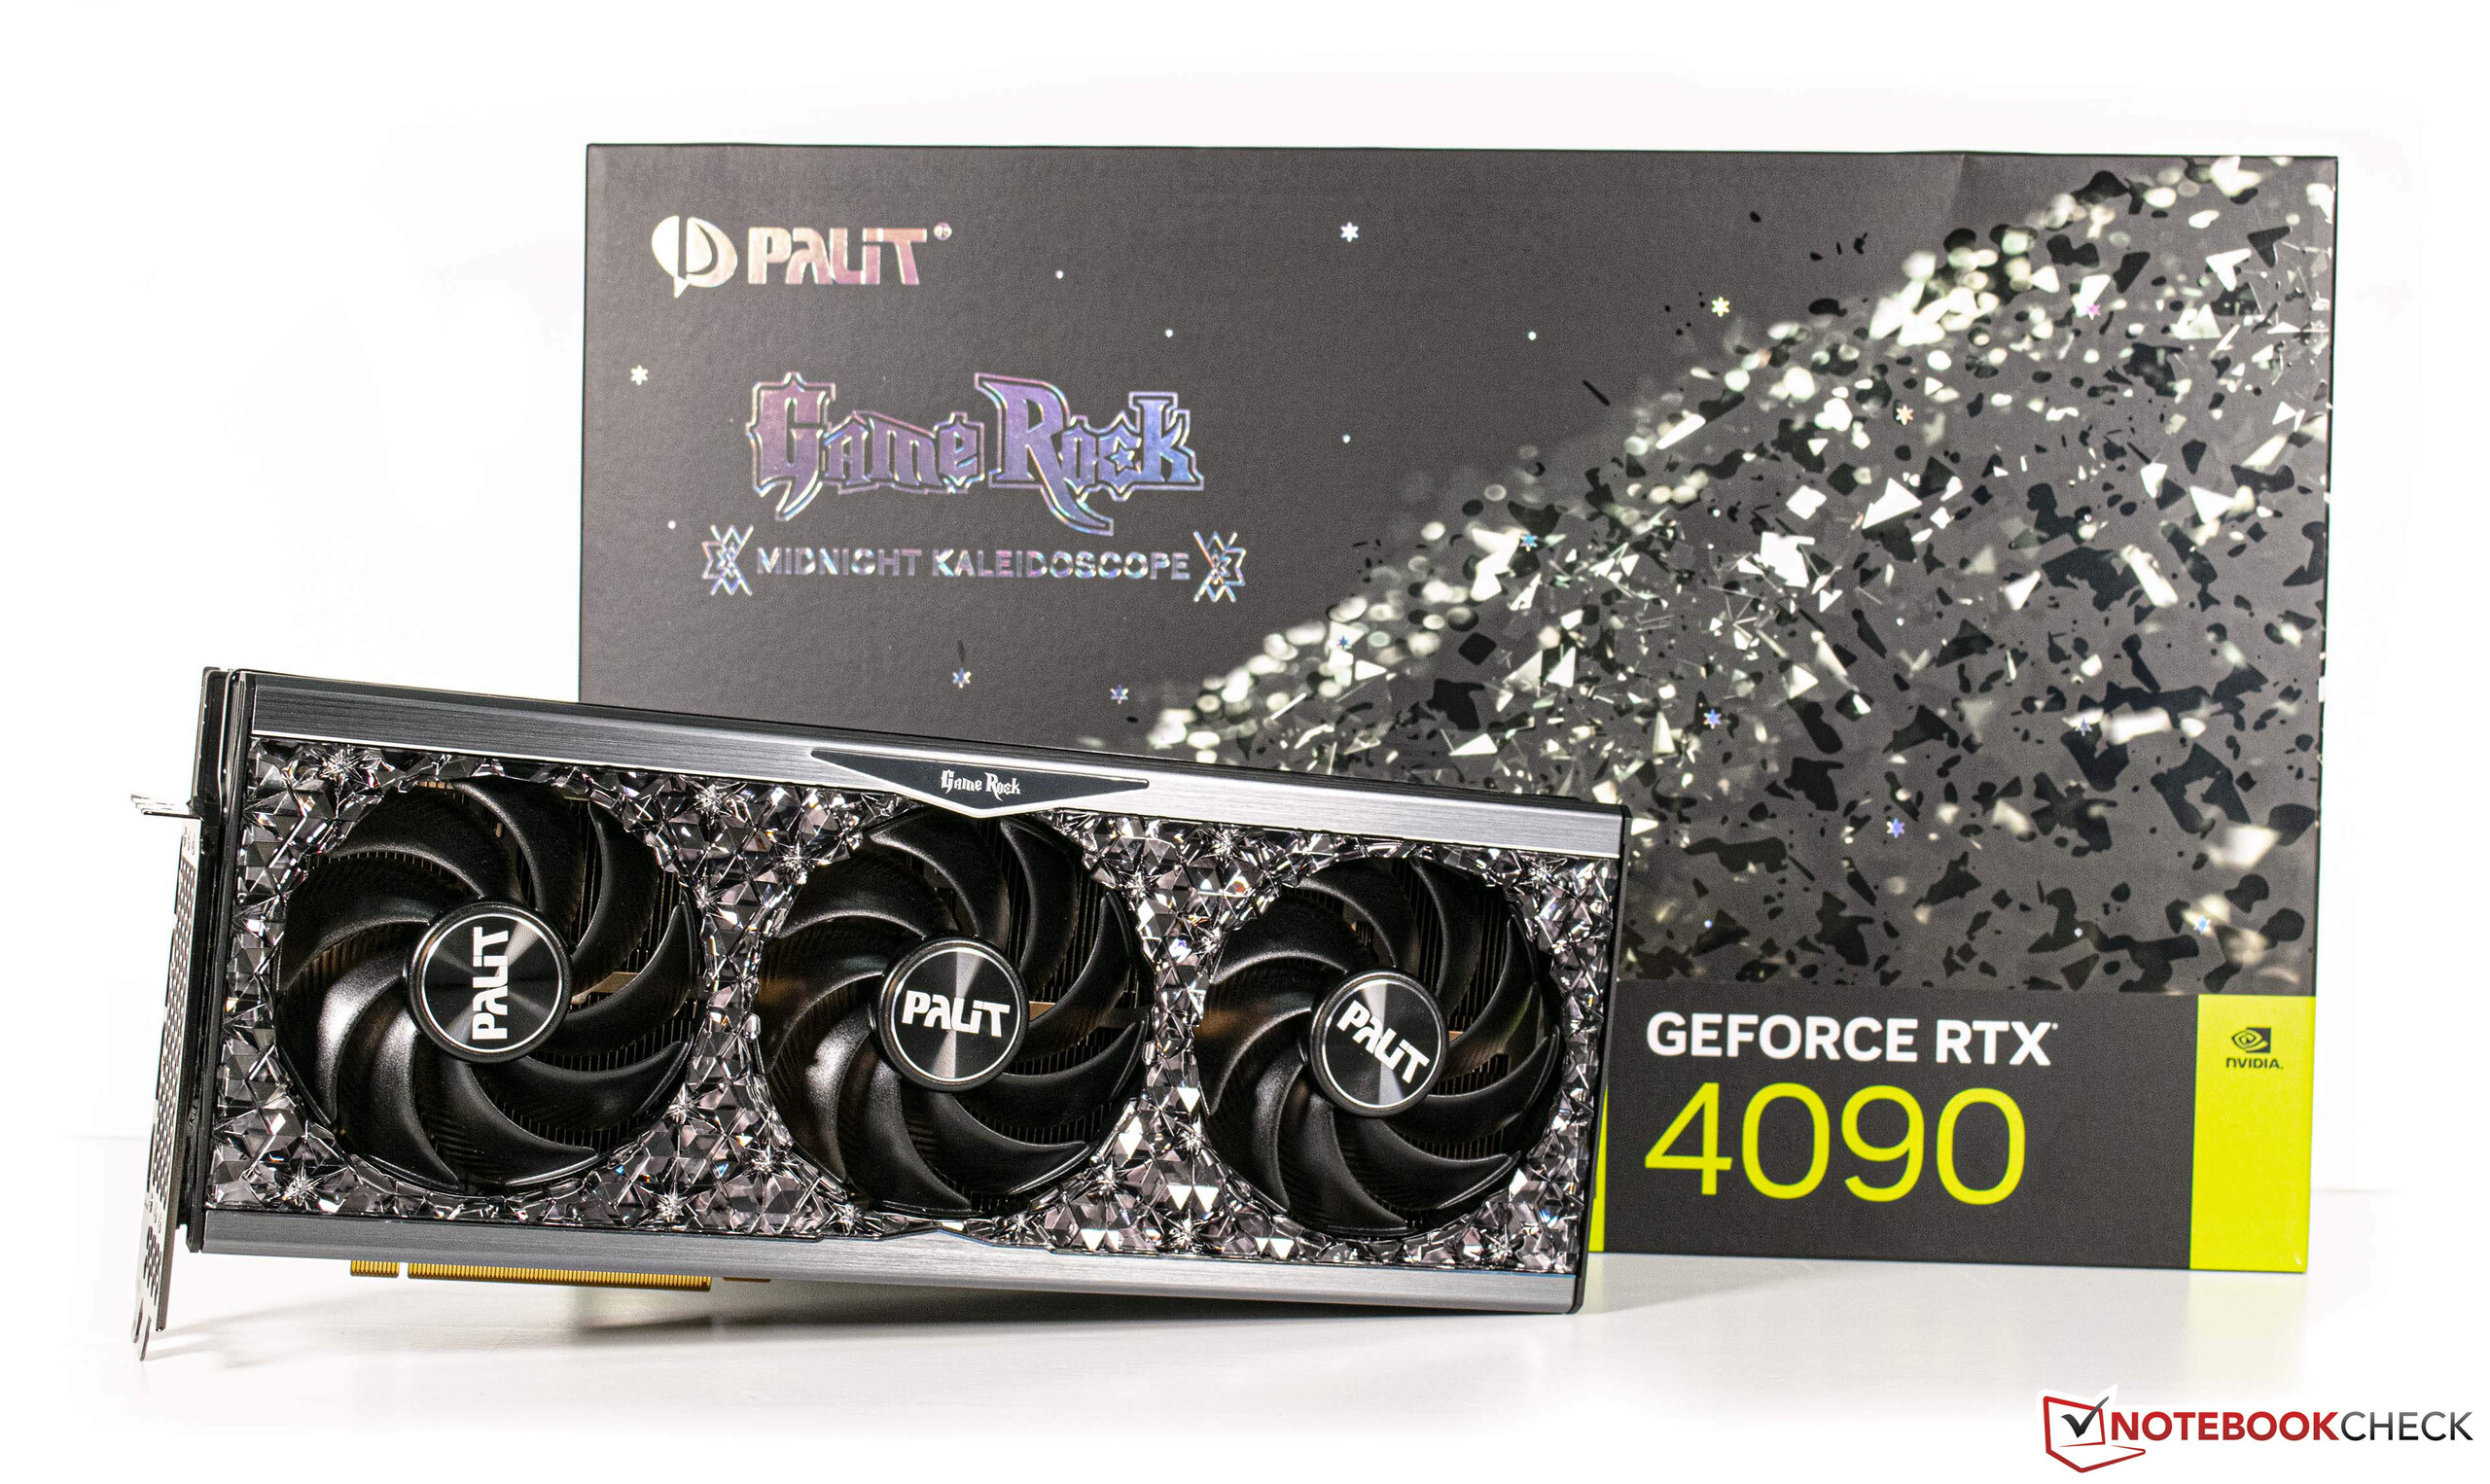
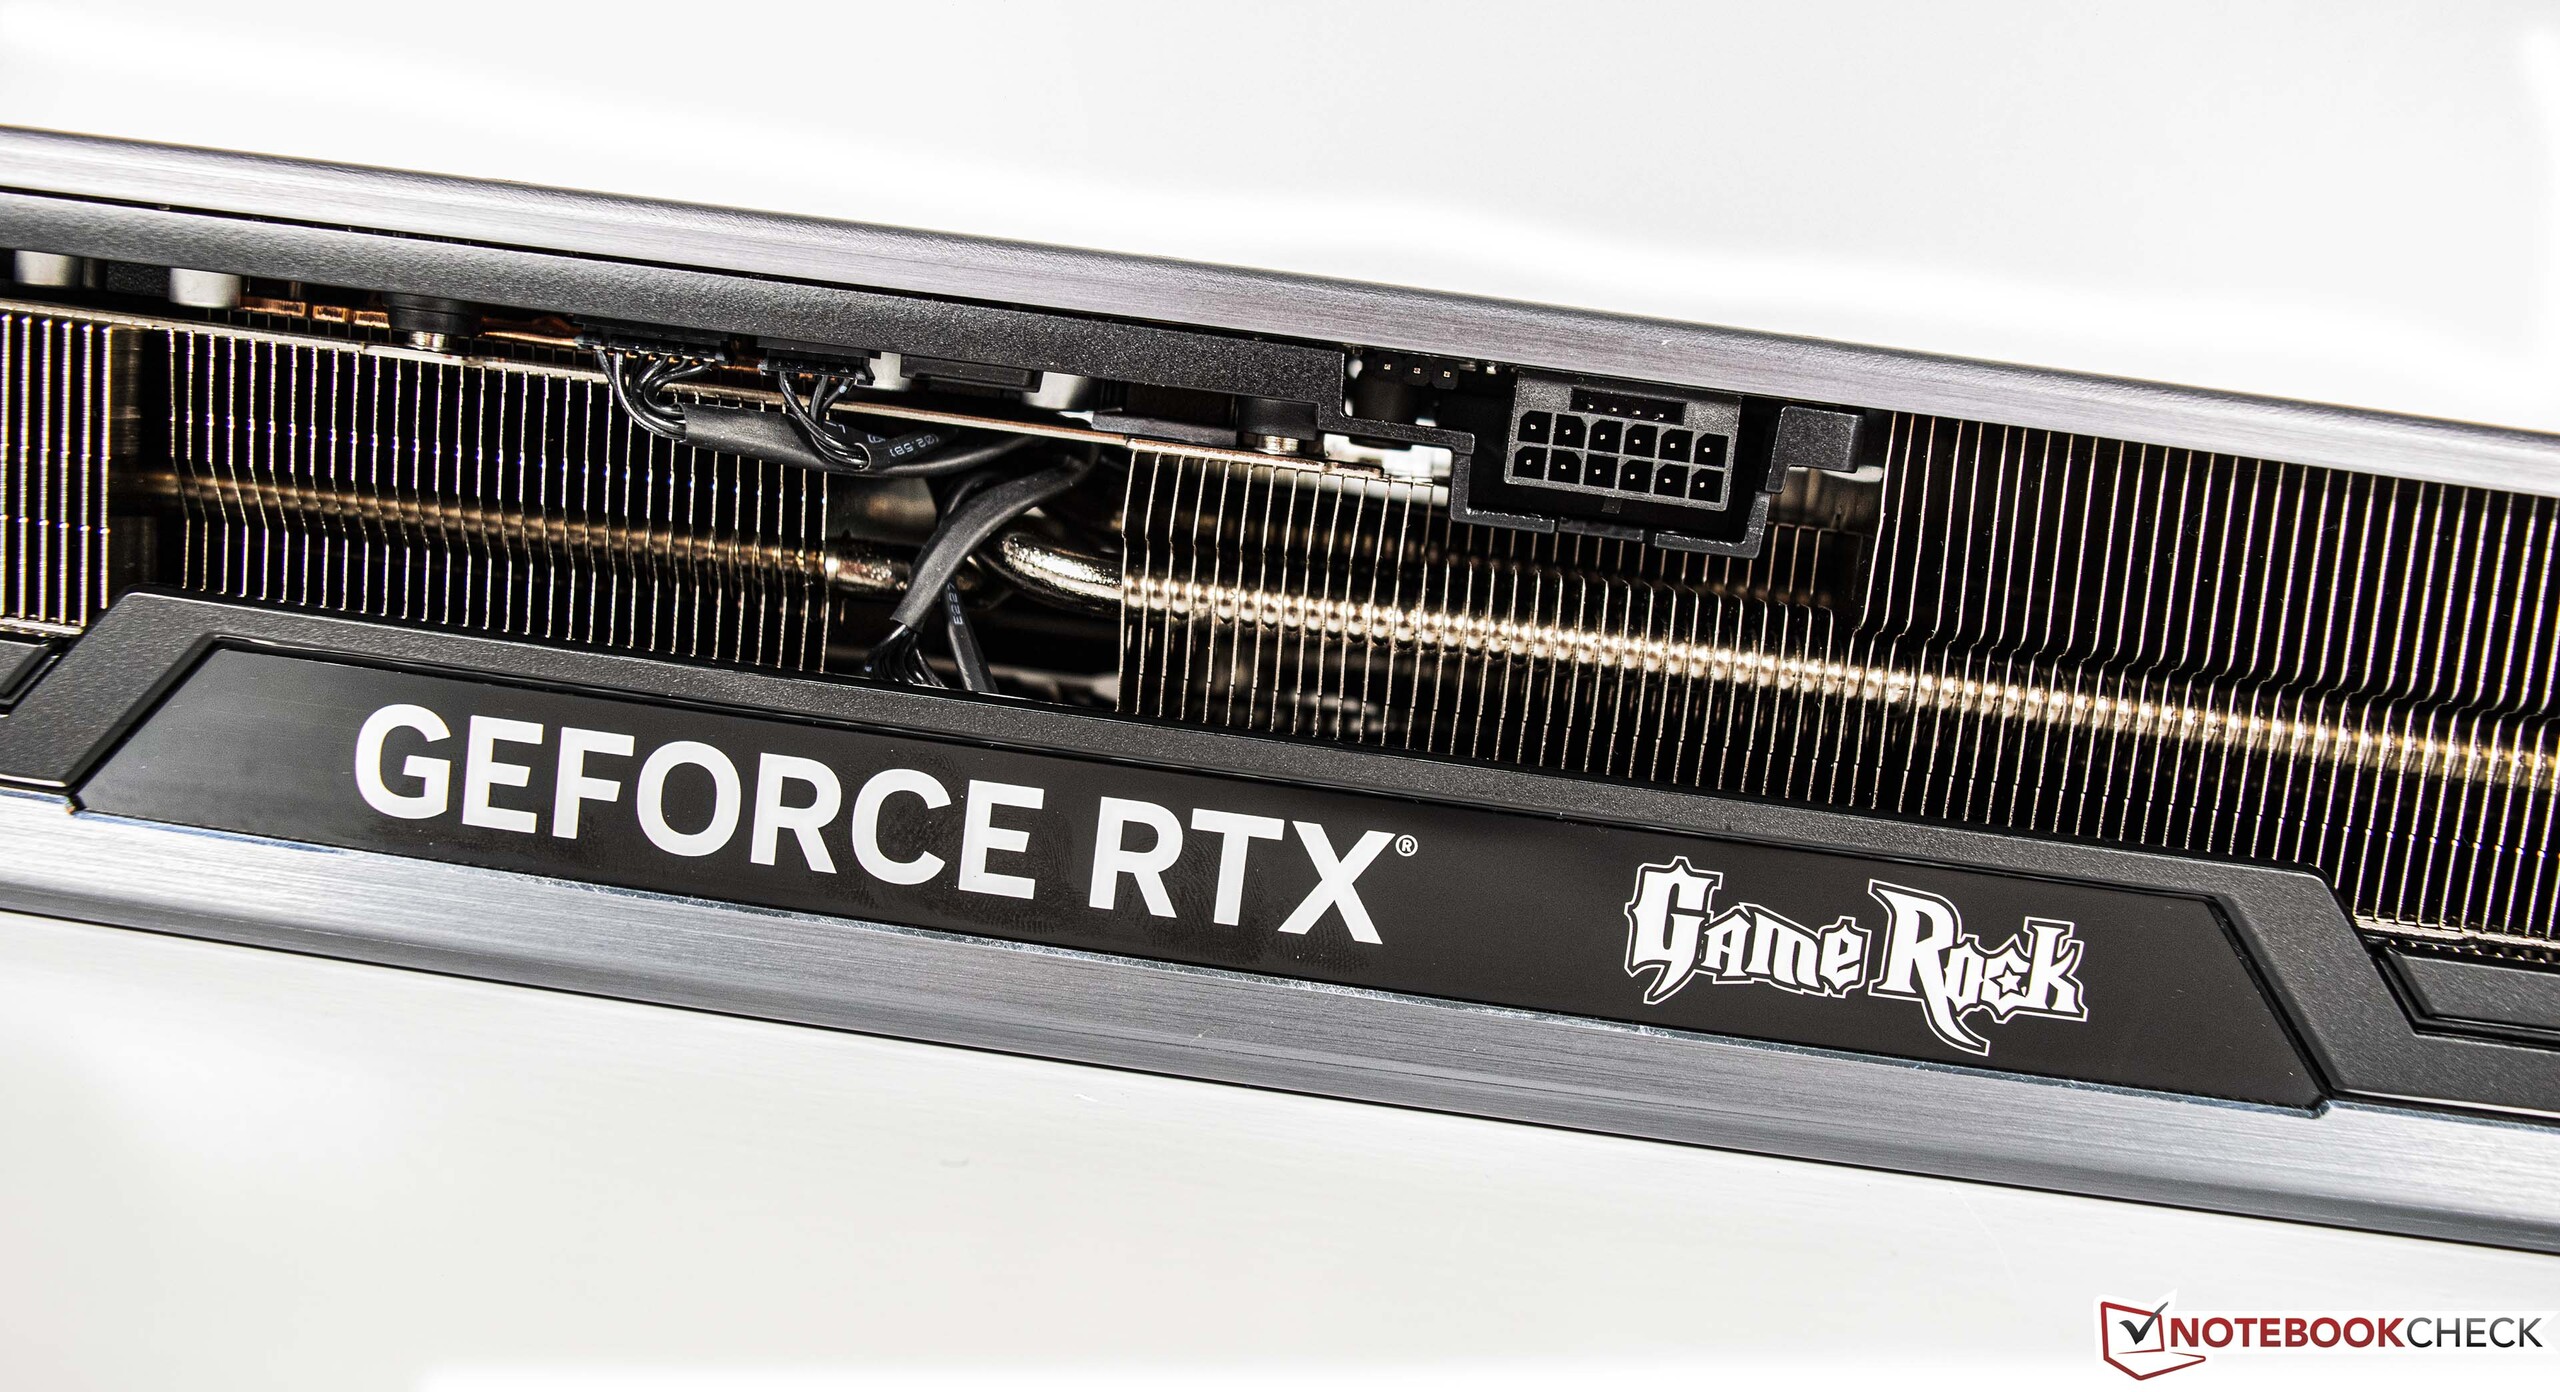
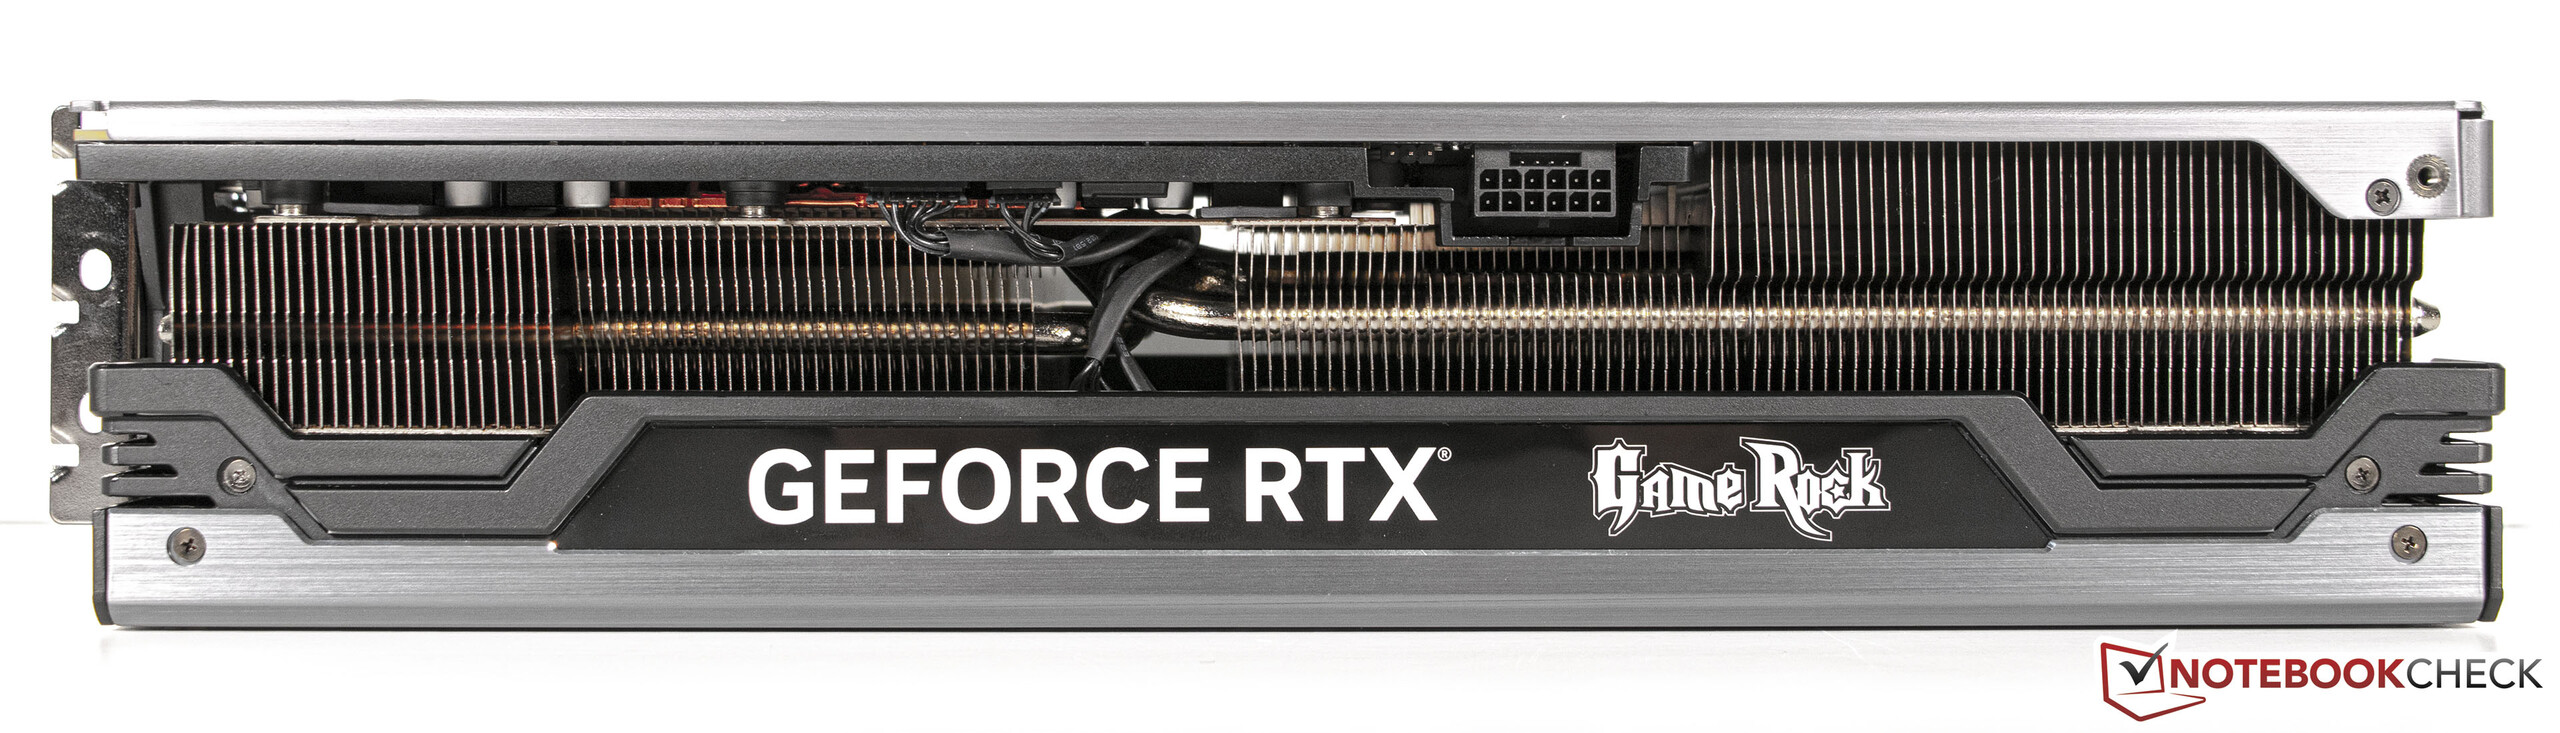
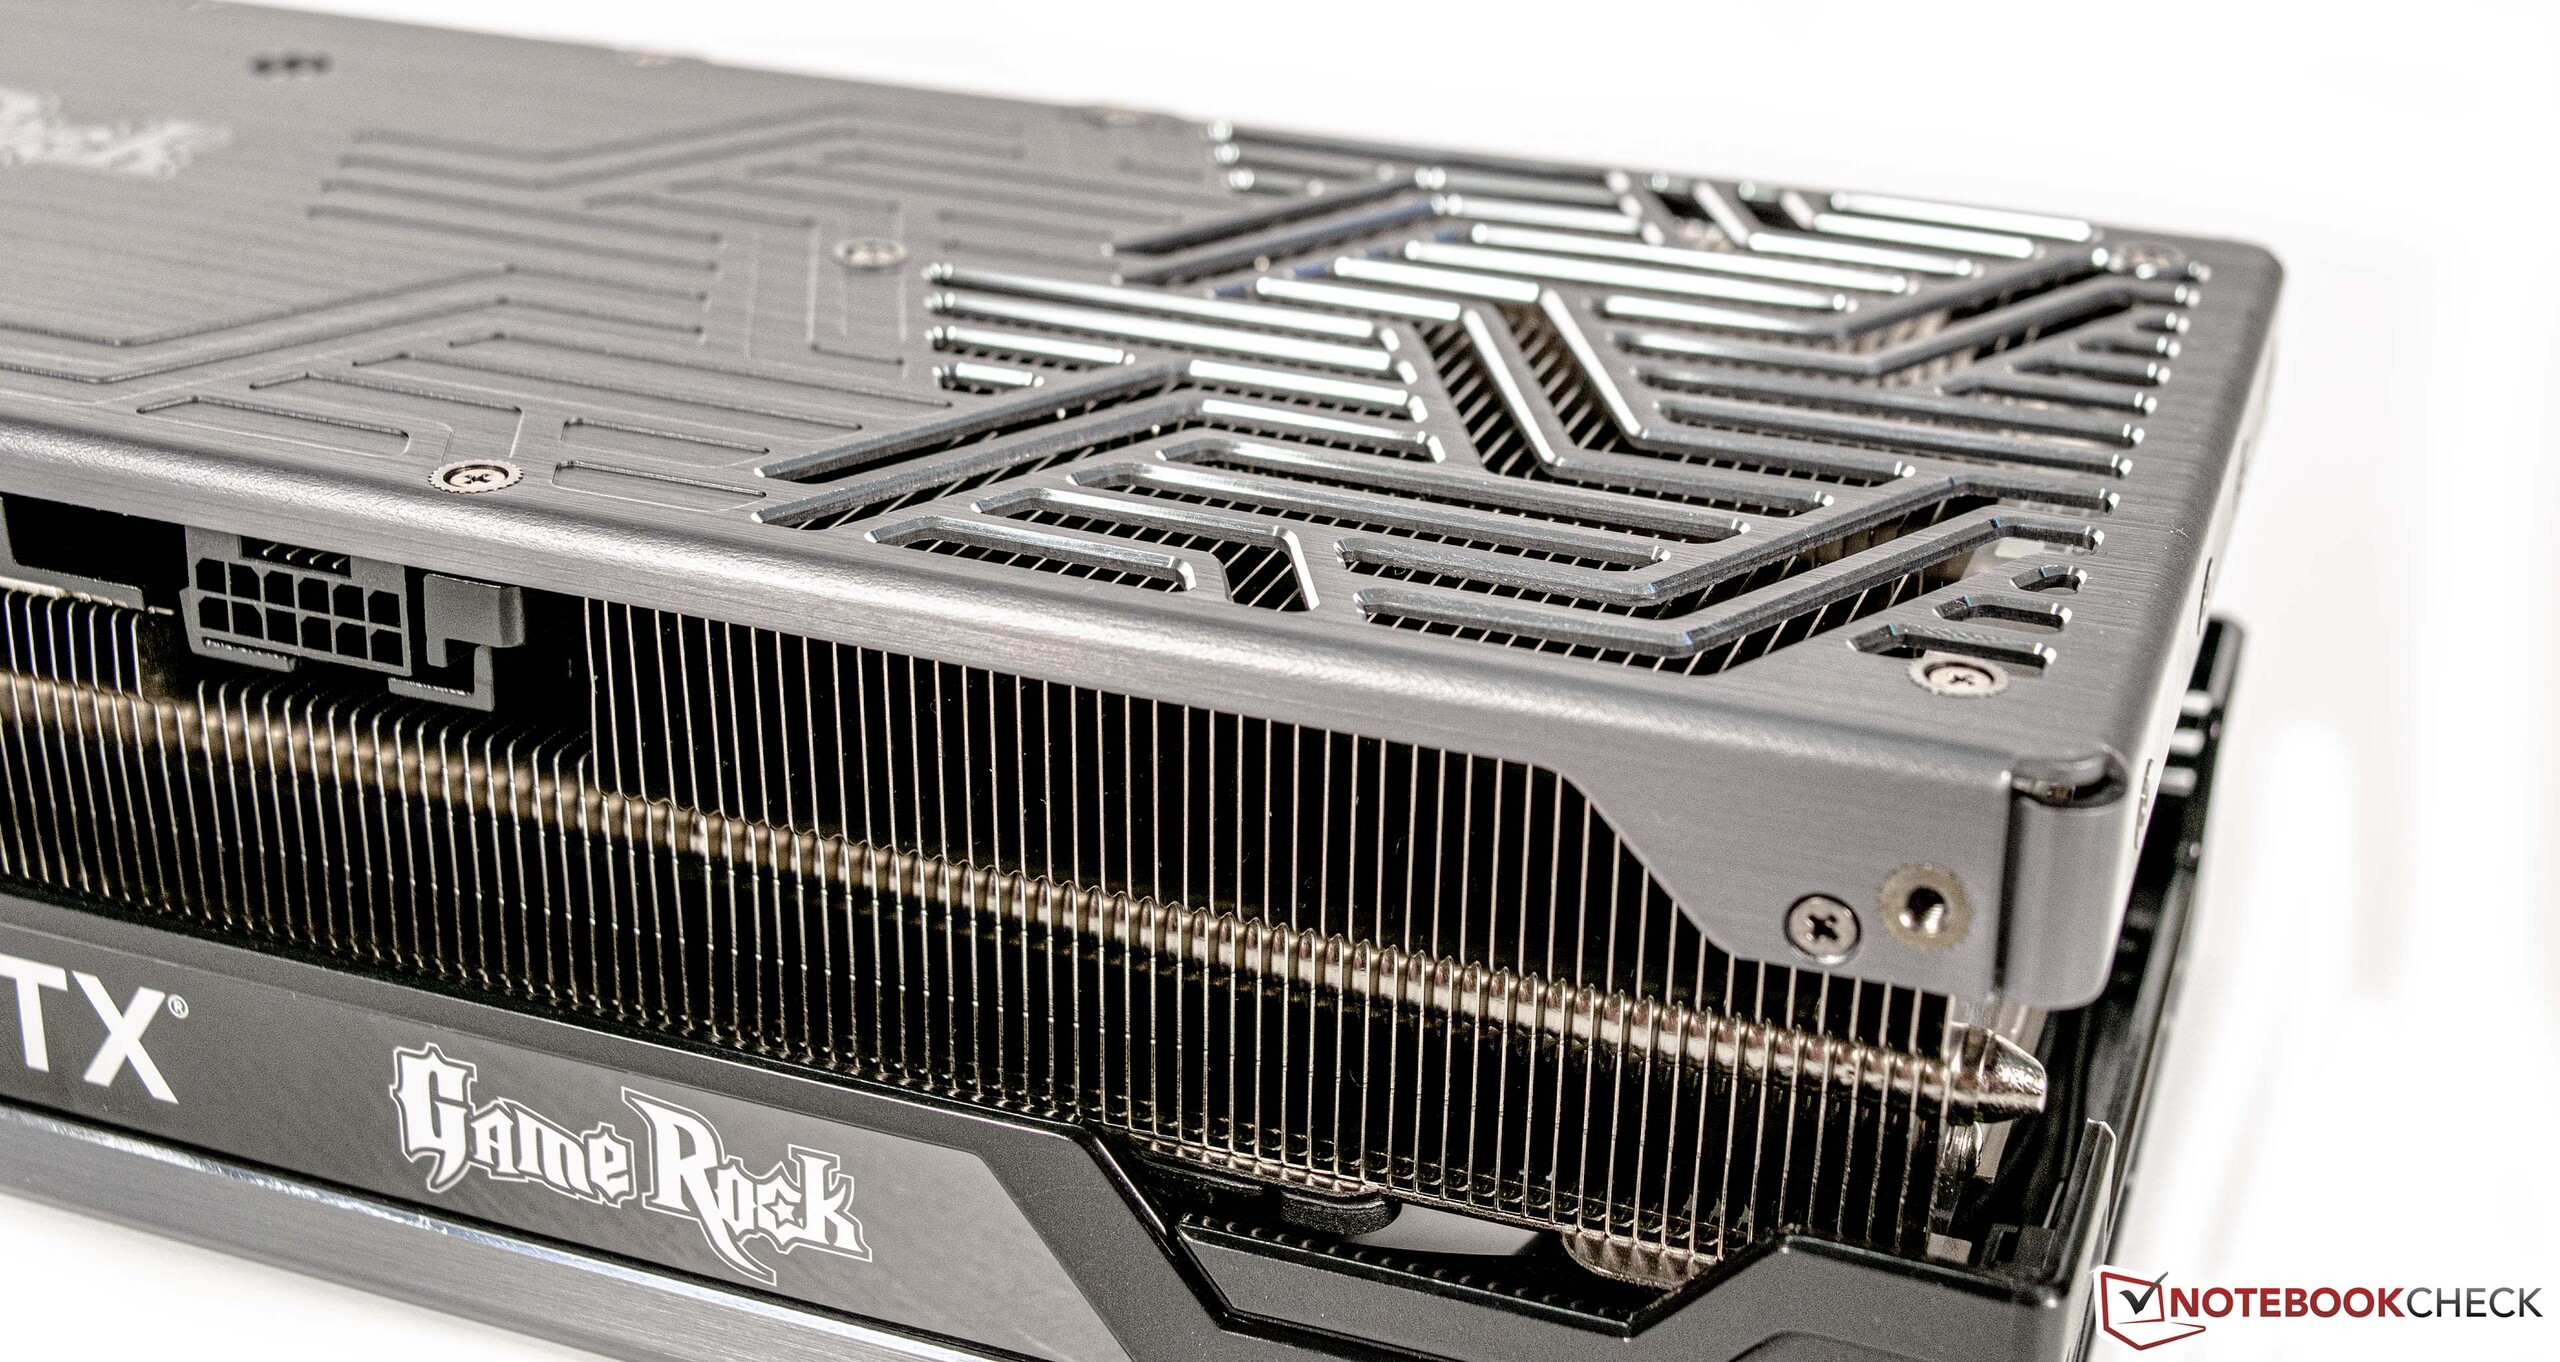
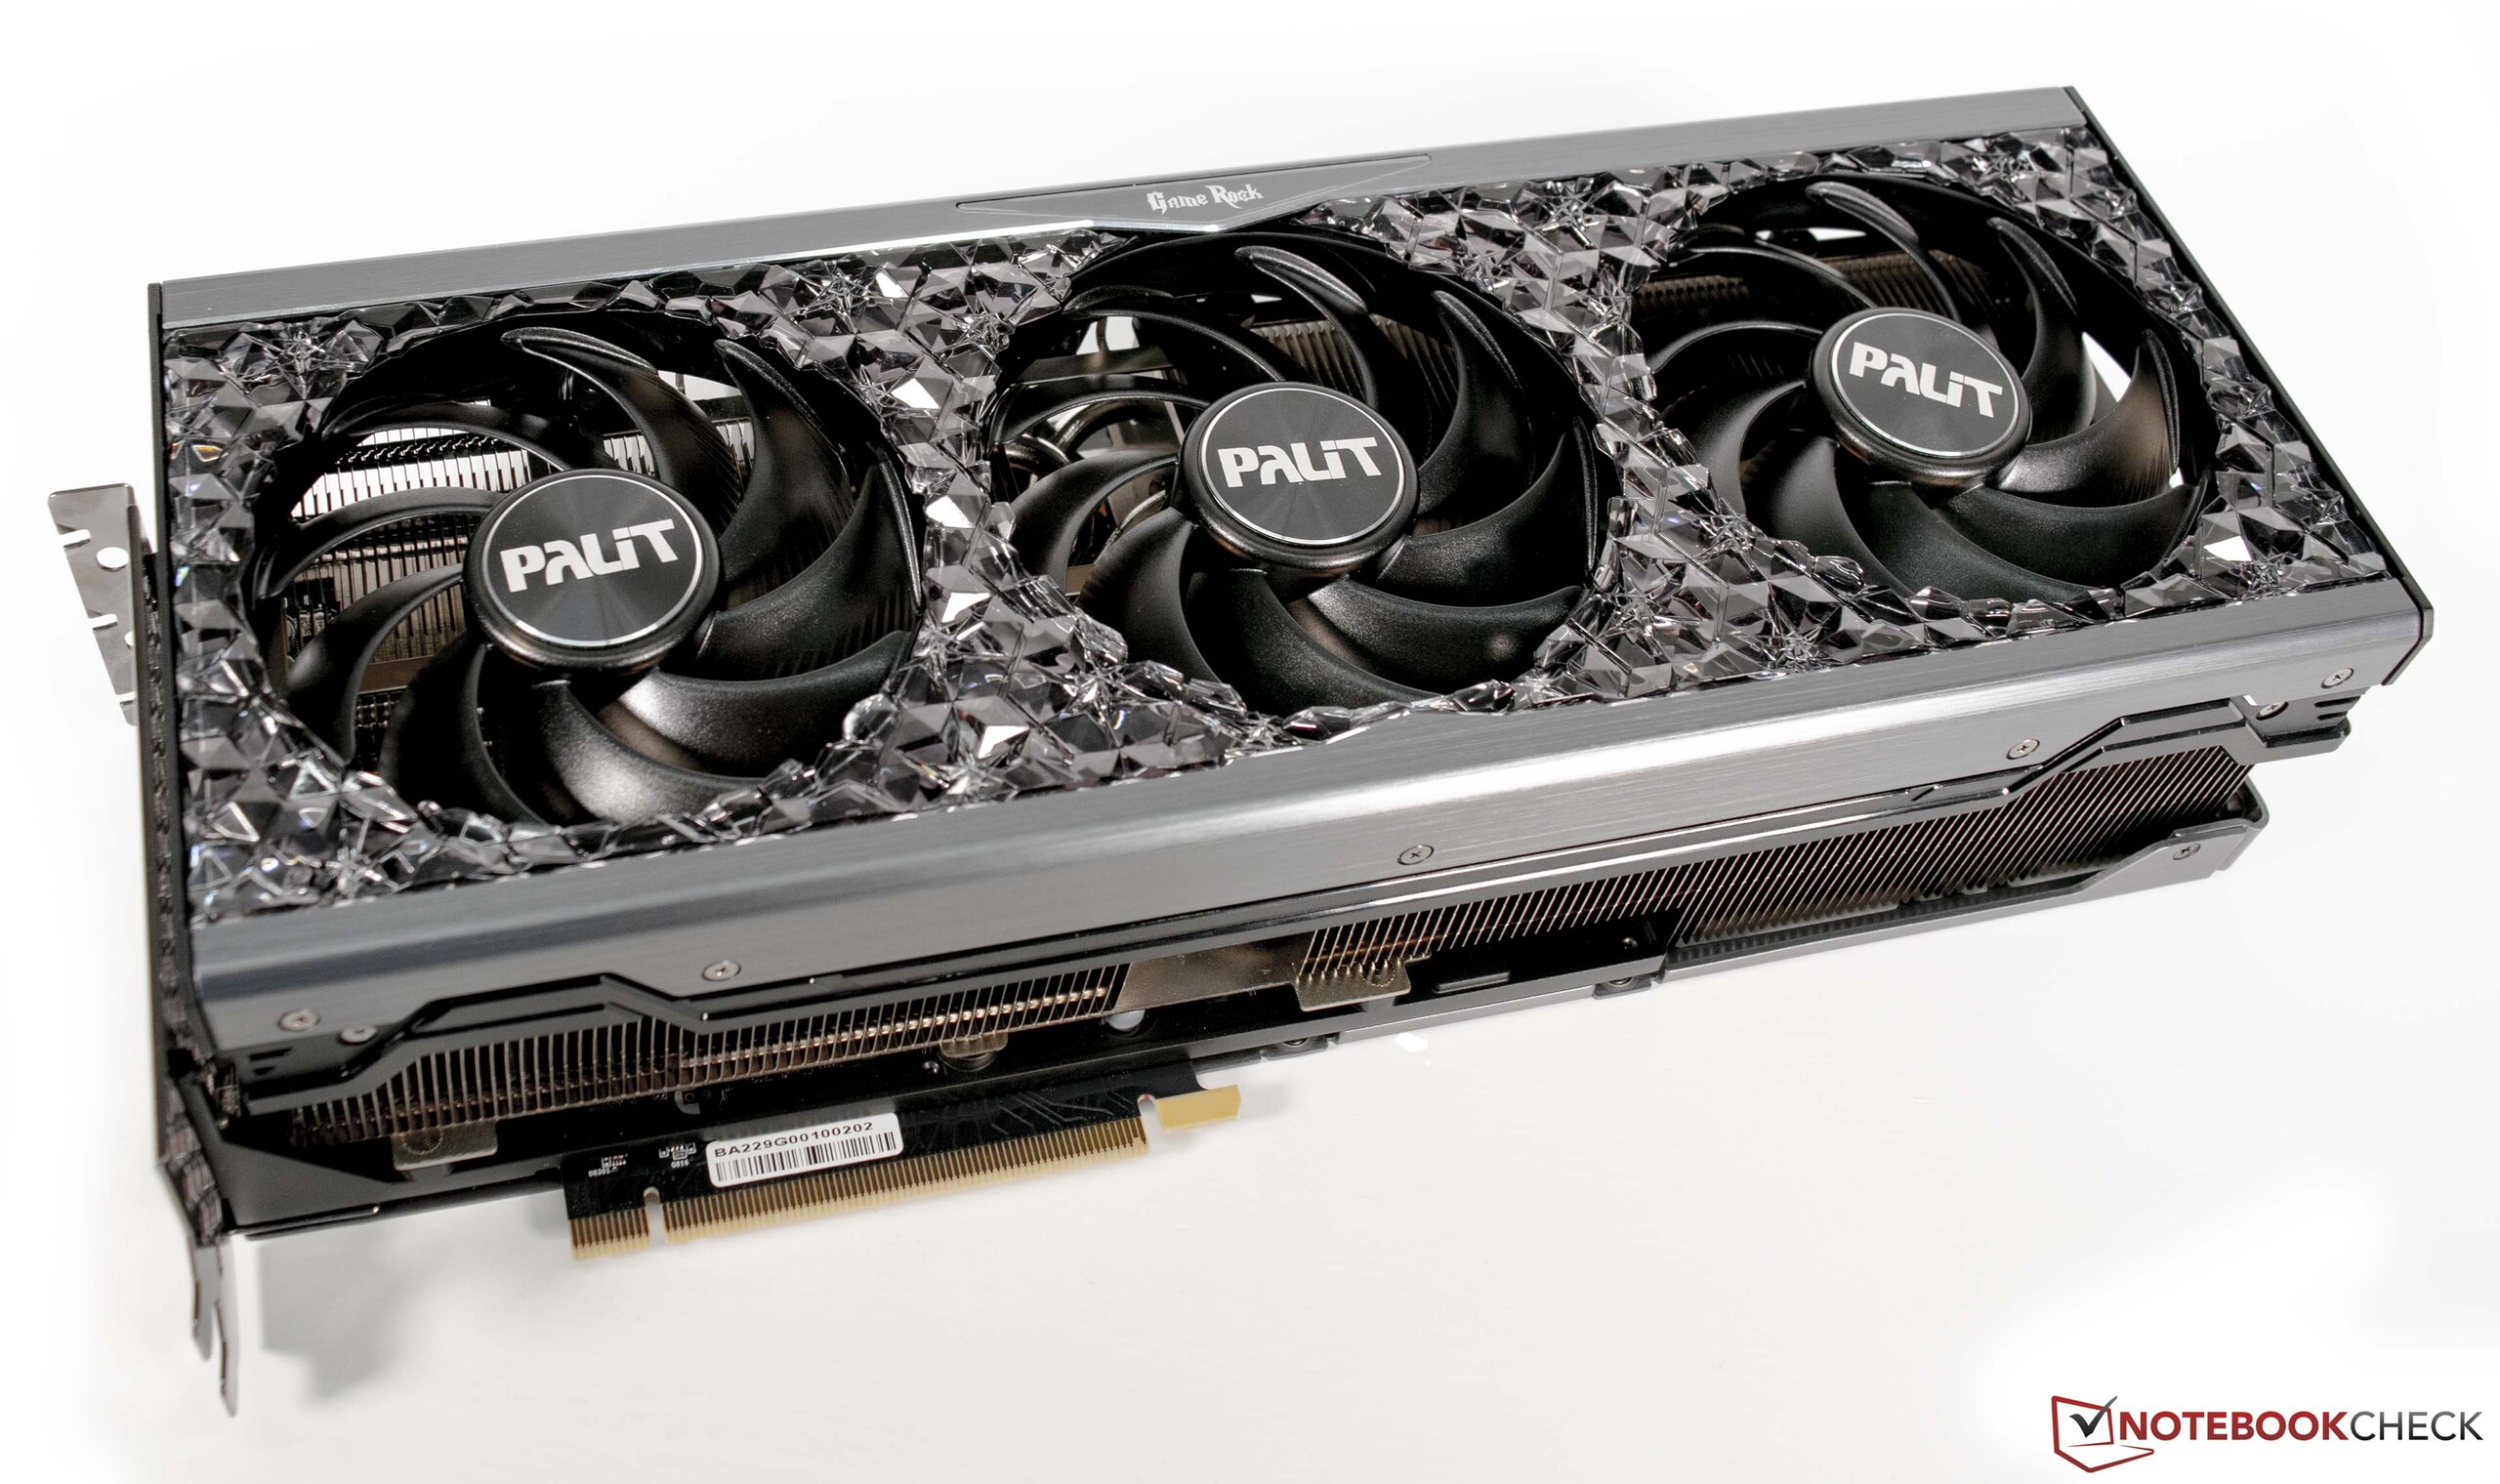
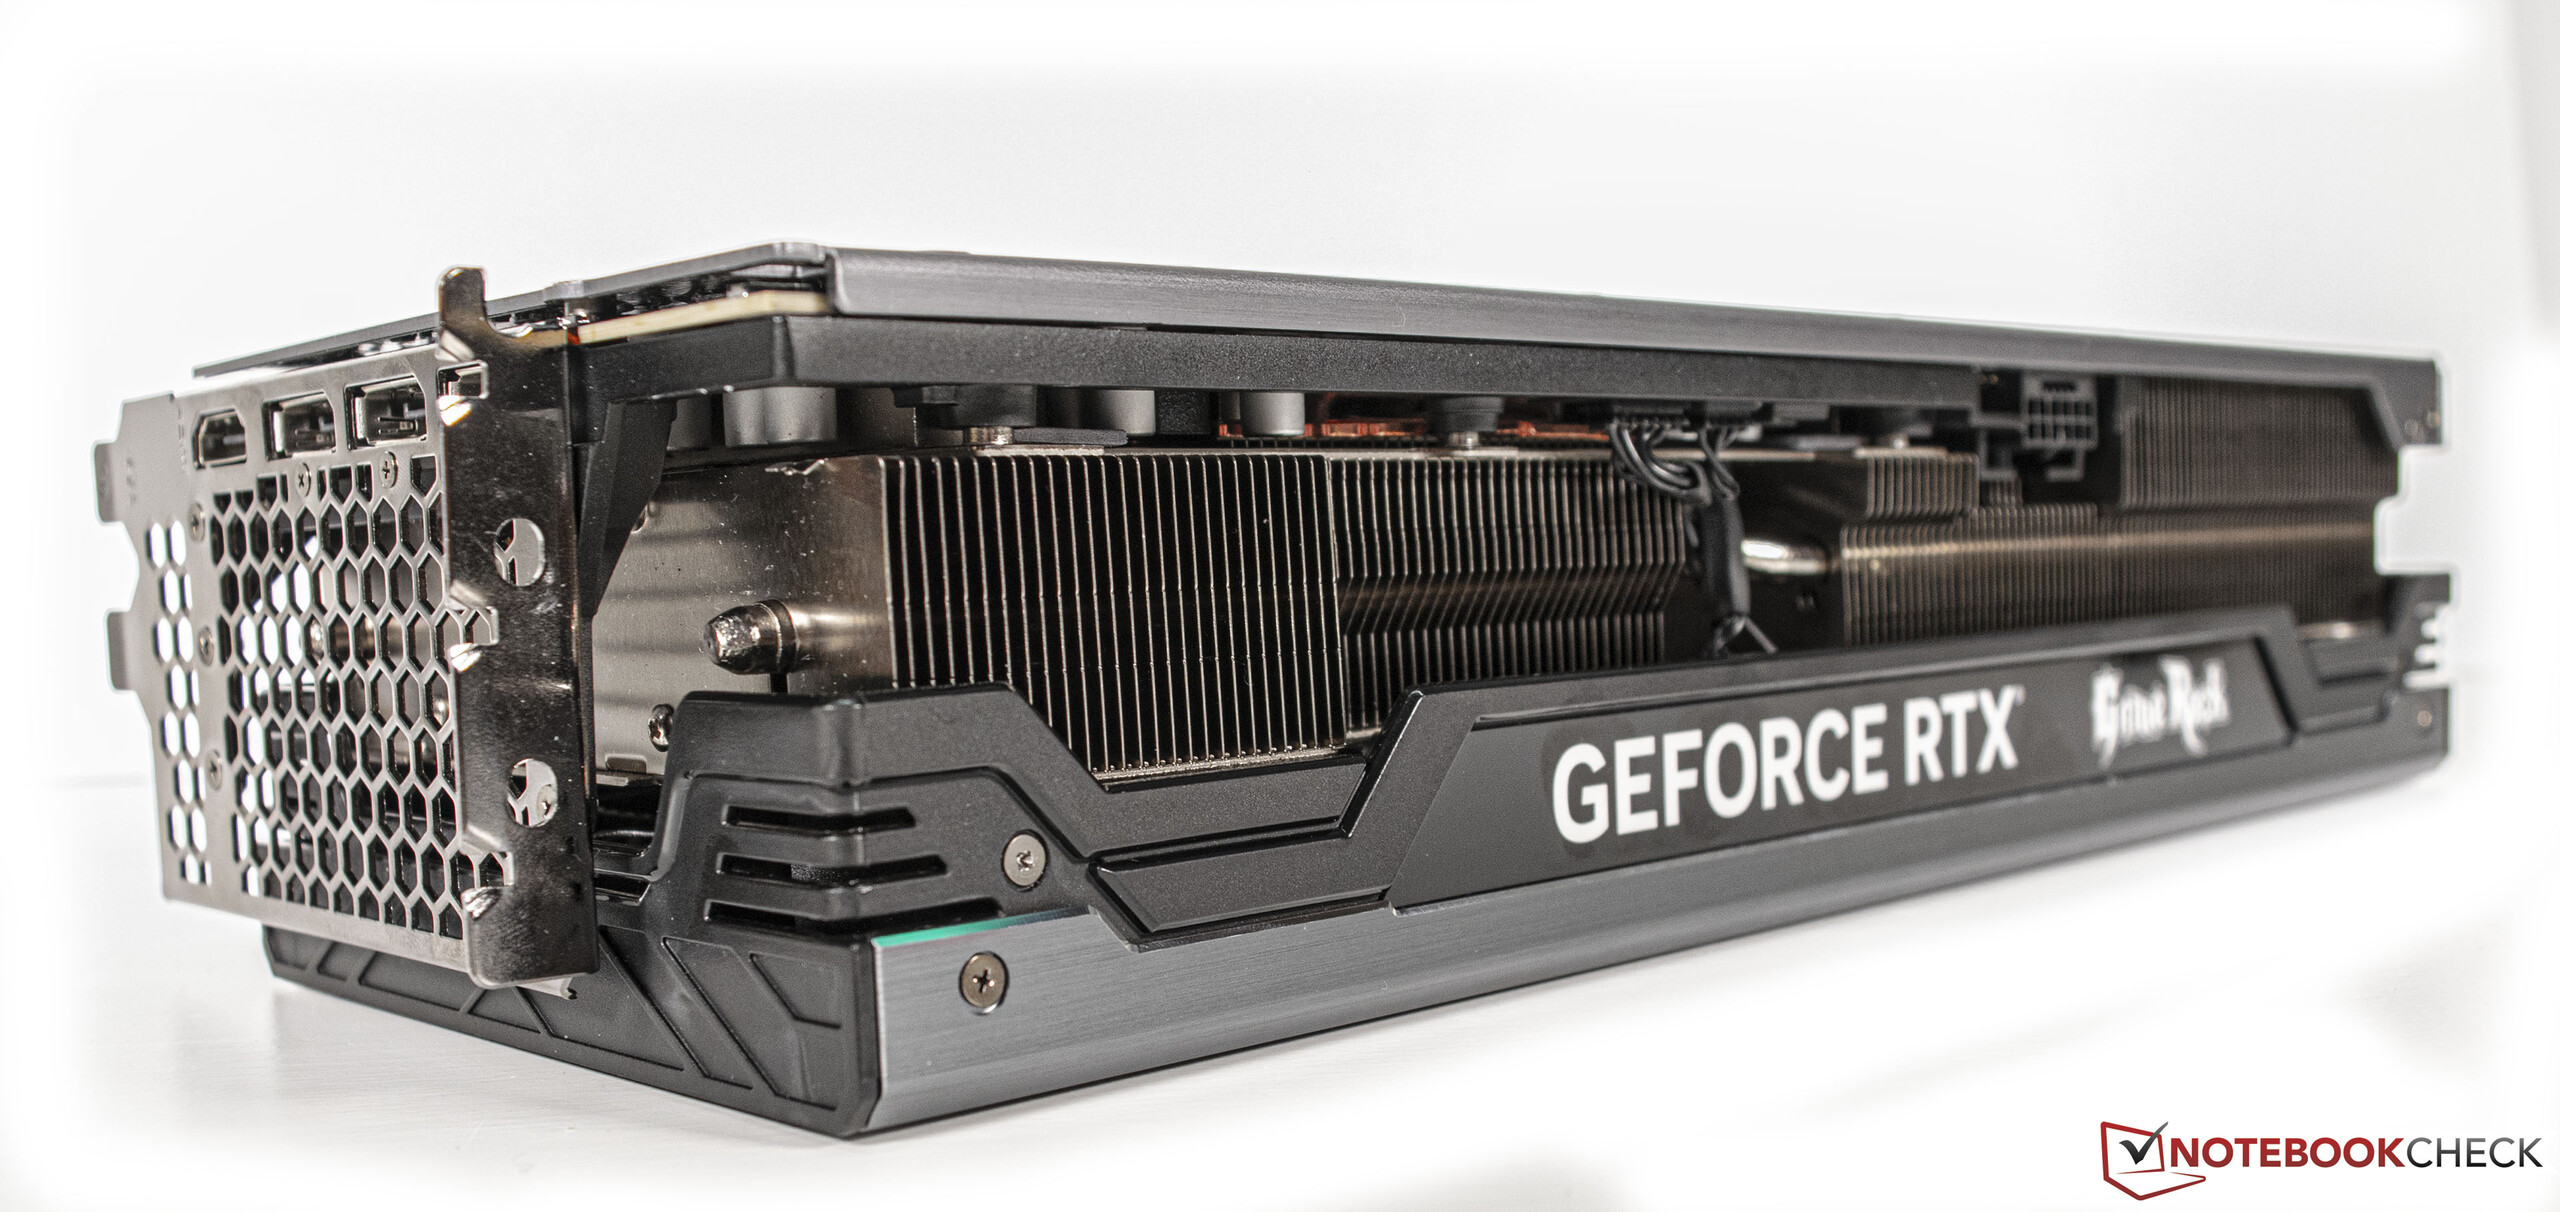
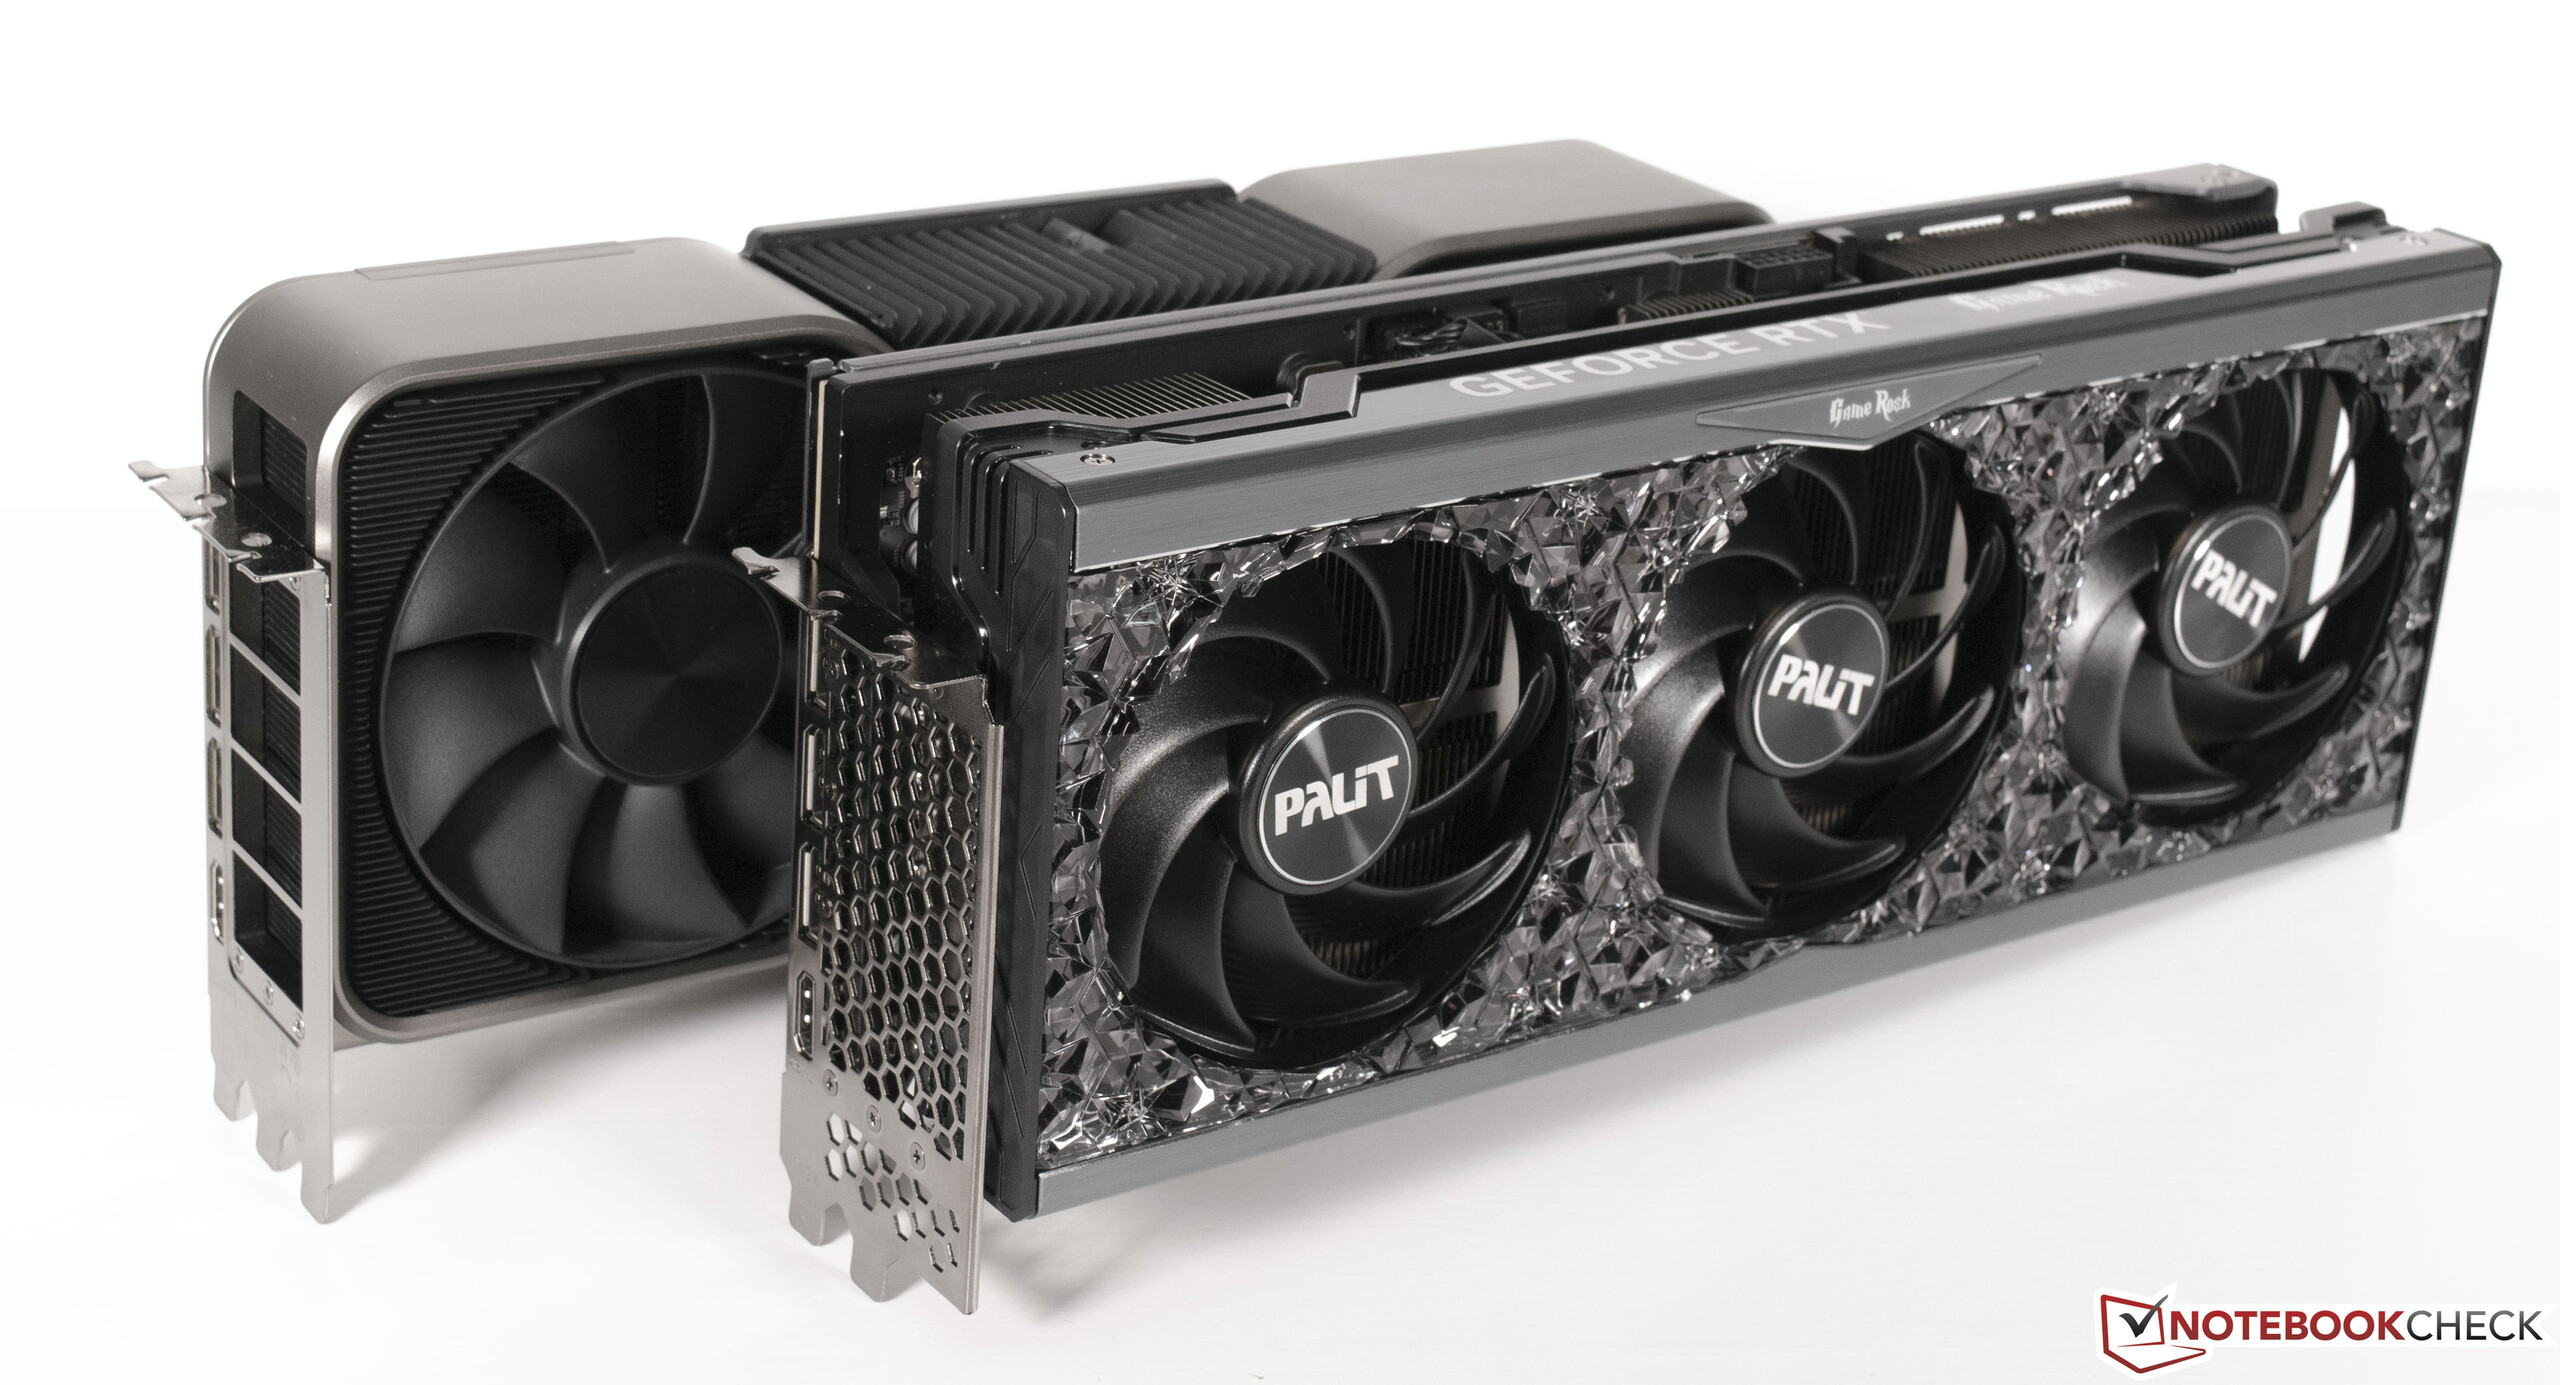
Per questa recensione, utilizziamo la Palit GeForce RTX 4090 GameRock OC che, dal punto di vista visivo, differisce notevolmente dalla Founders Edition. Il design di raffreddamento a 3,5 slot richiede un notevole spazio all'interno del case ed è dotato di tre ventole da 90 millimetri. La dissipazione di potenza da 600 watt delle nuove schede grafiche di fascia alta è il motivo di questa potente struttura di raffreddamento e si ritrova in tutta la serie GeForce RTX 4090, indipendentemente dal produttore. Questo è un aspetto positivo, in quanto non si riscontrano problemi di temperatura né per il chip né per la VRAM, e questo lo possiamo già dire. In definitiva, l'assorbimento di potenza della scheda grafica è di 450 watt.
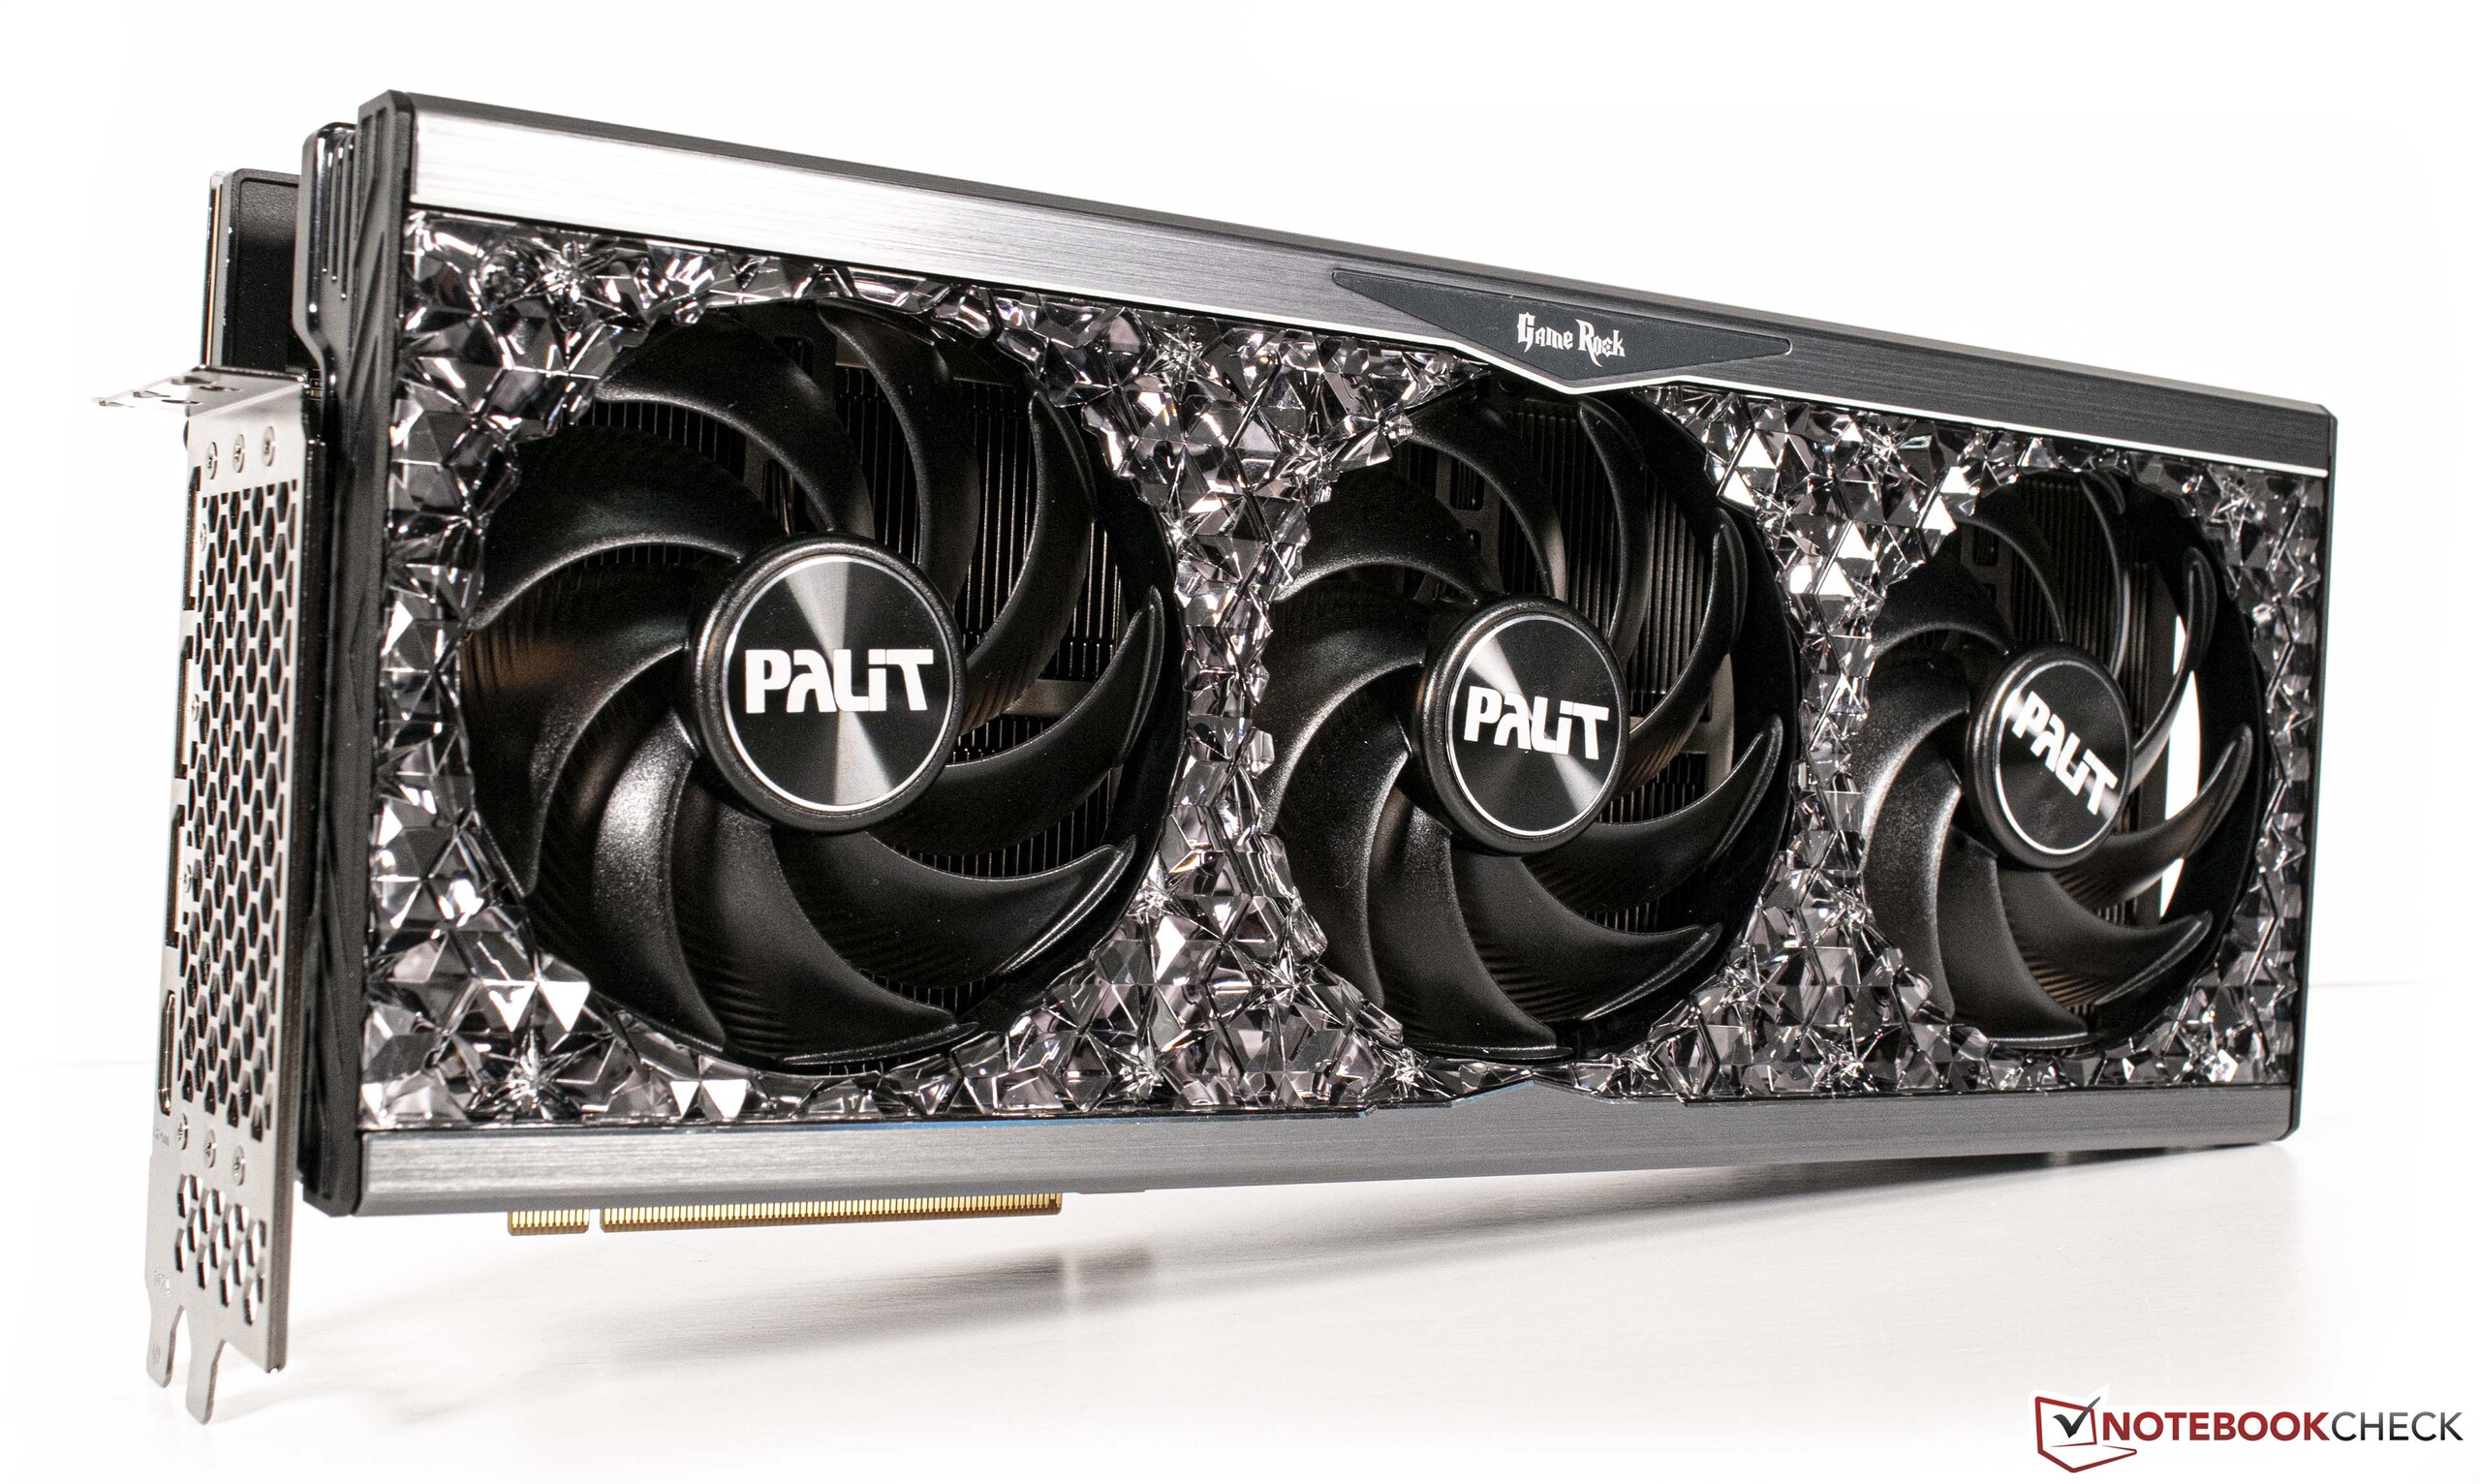
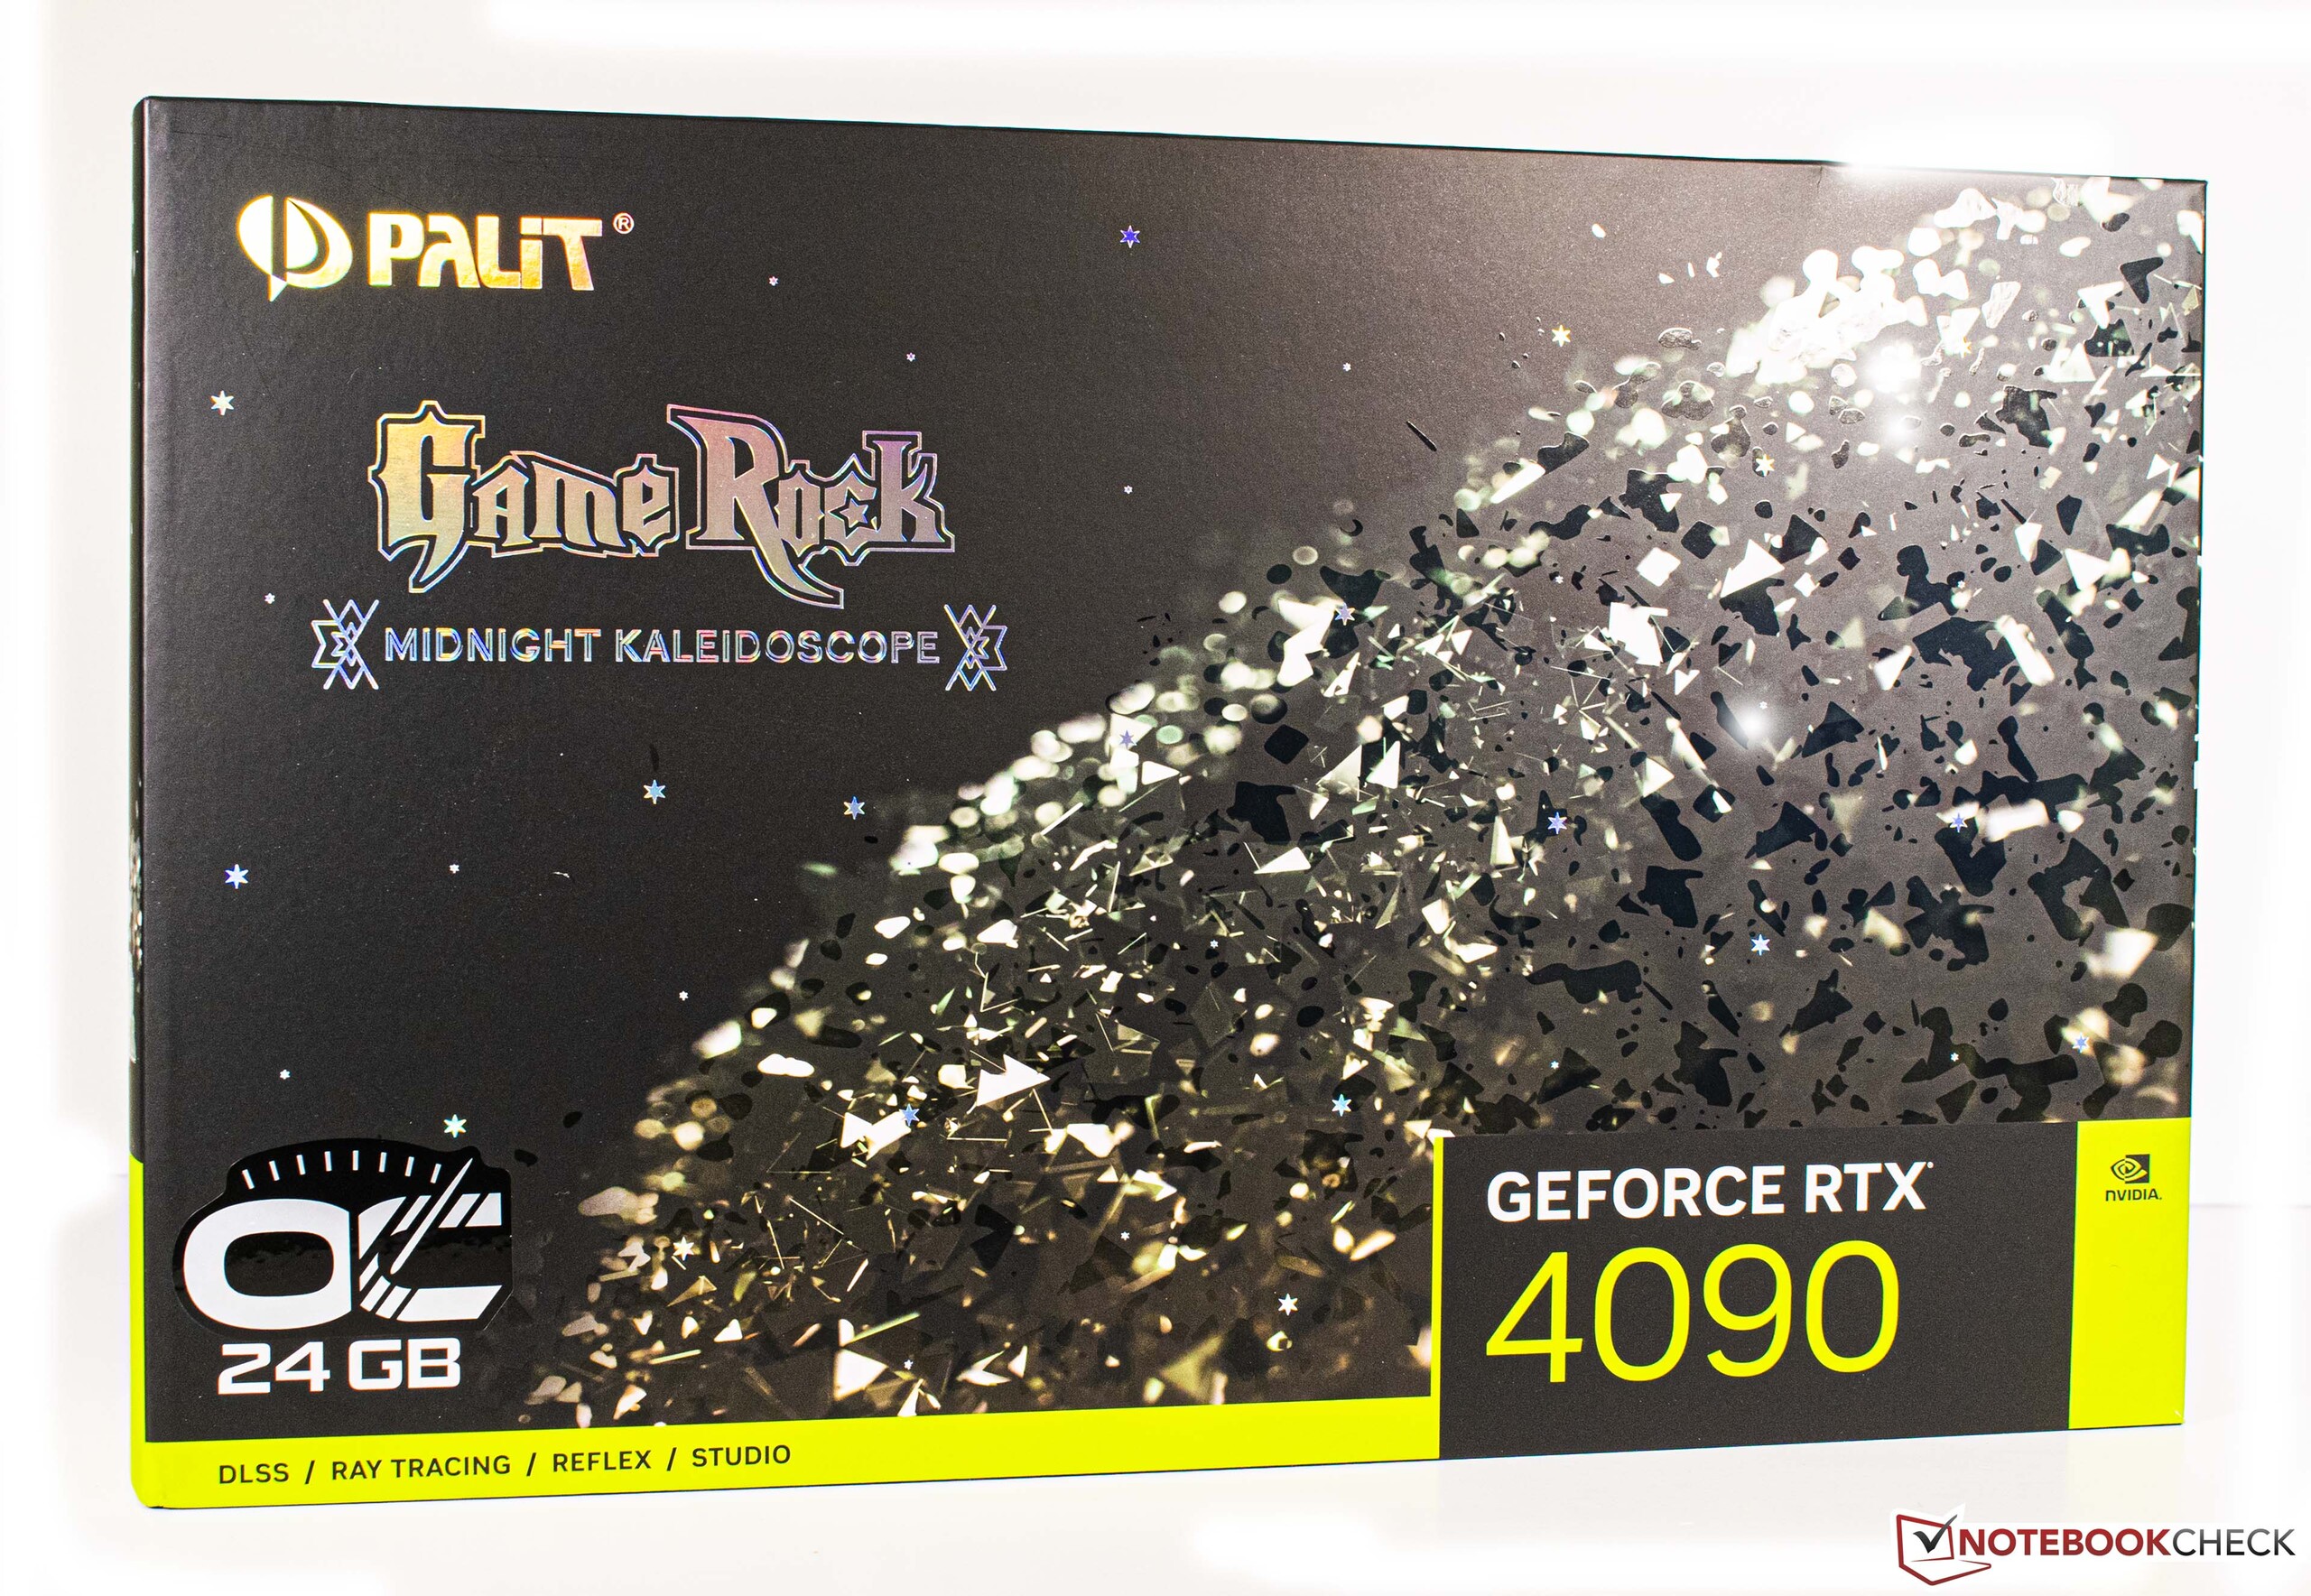
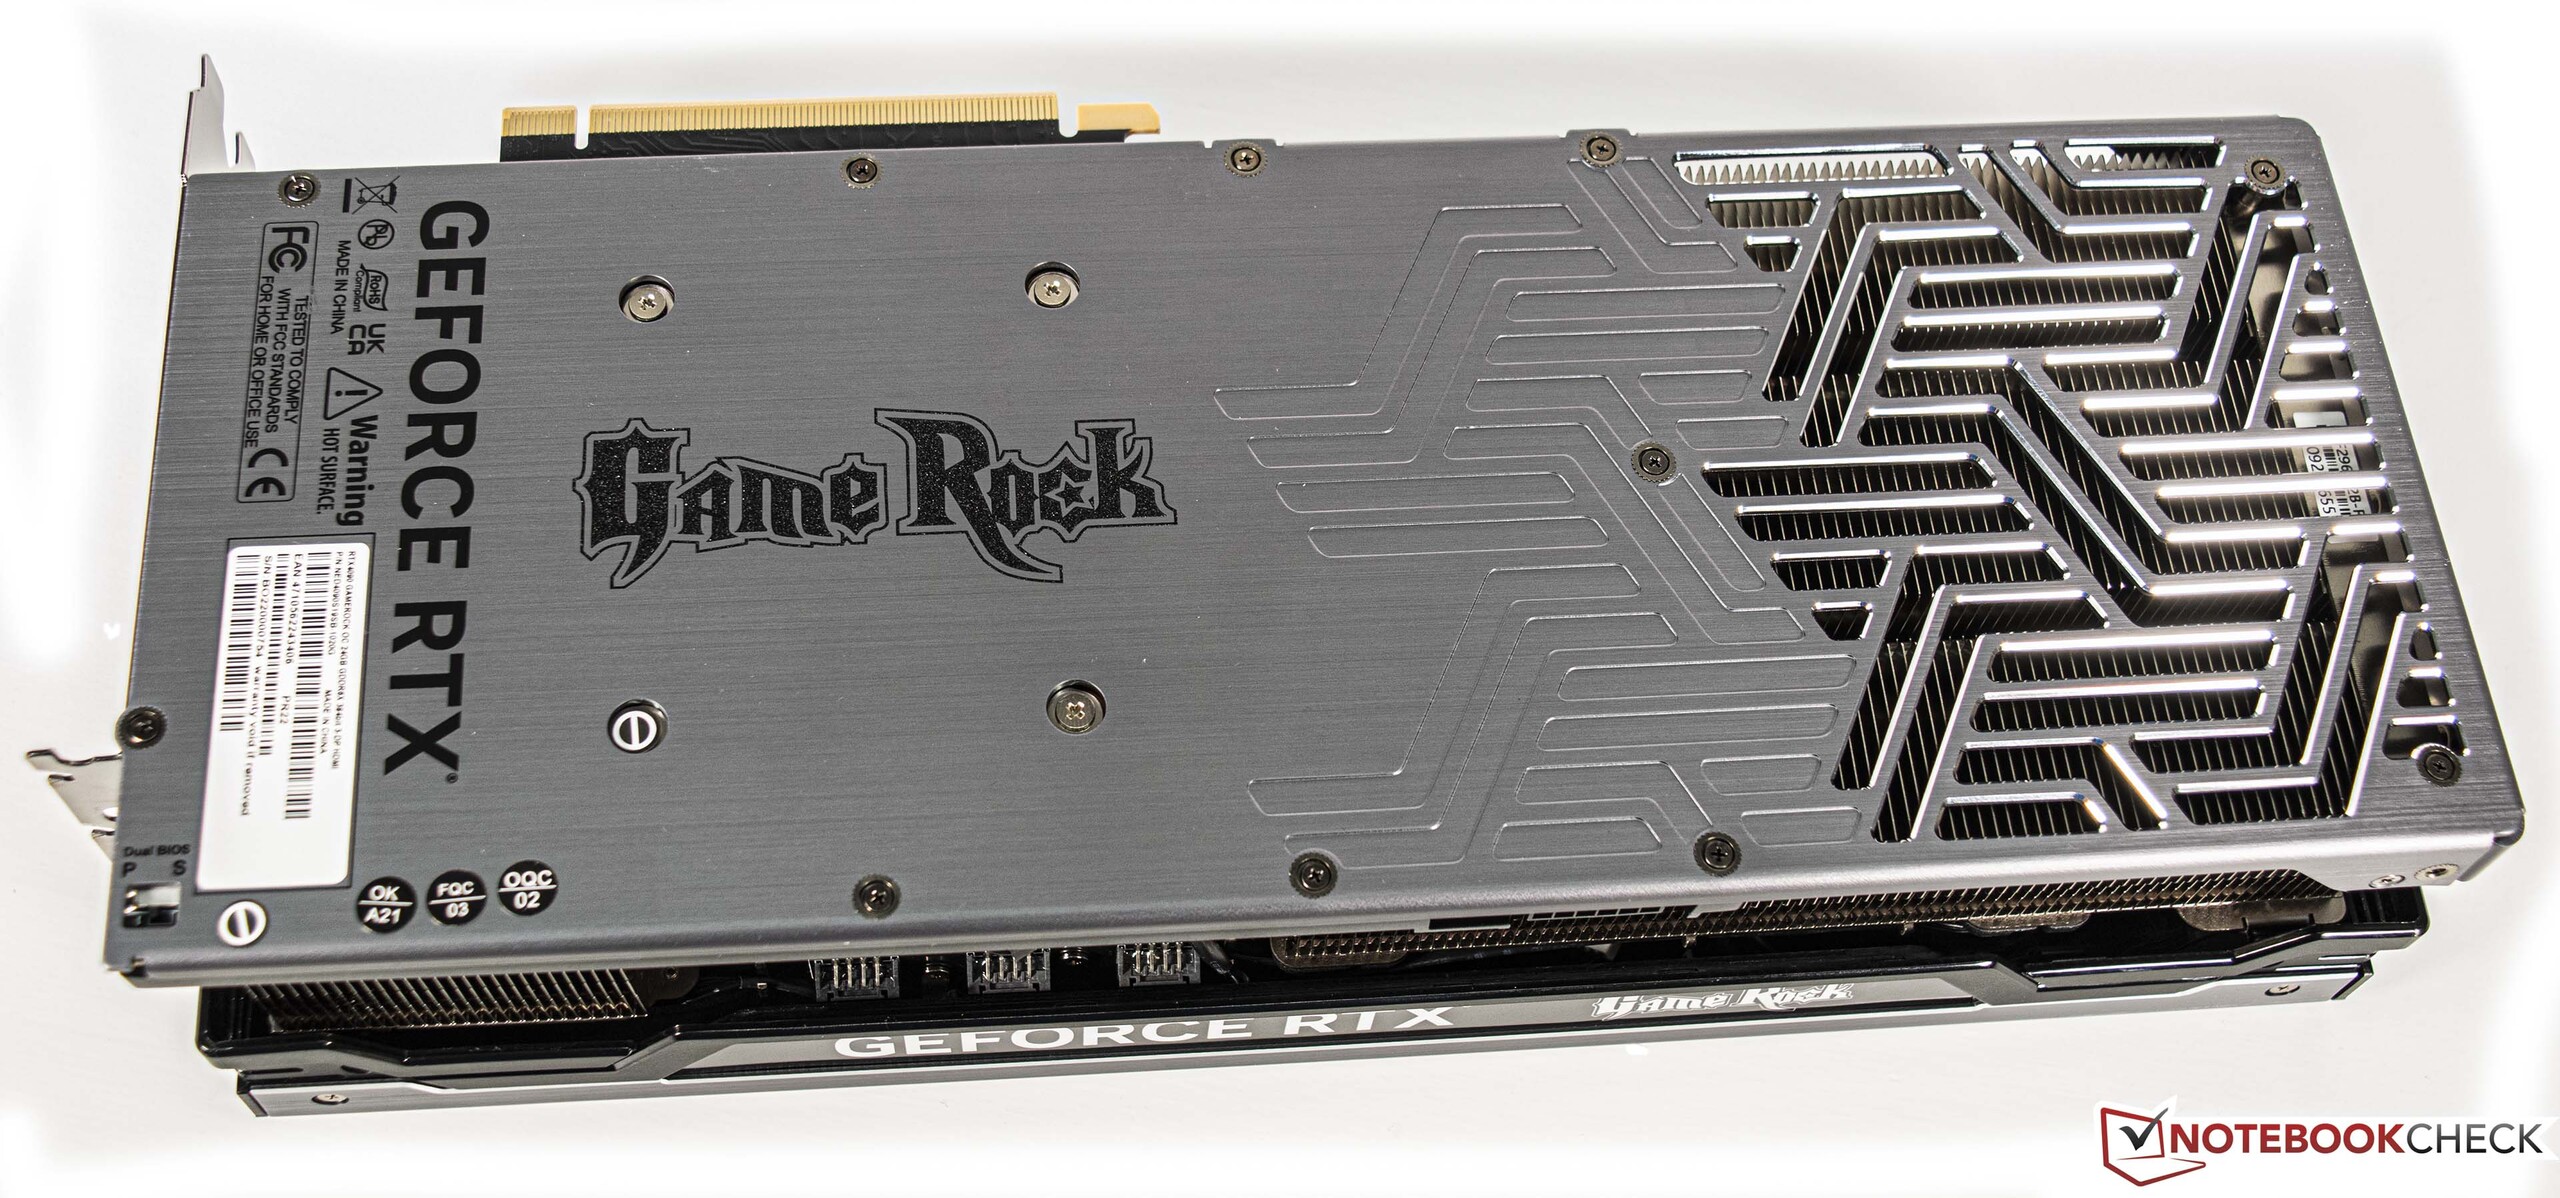
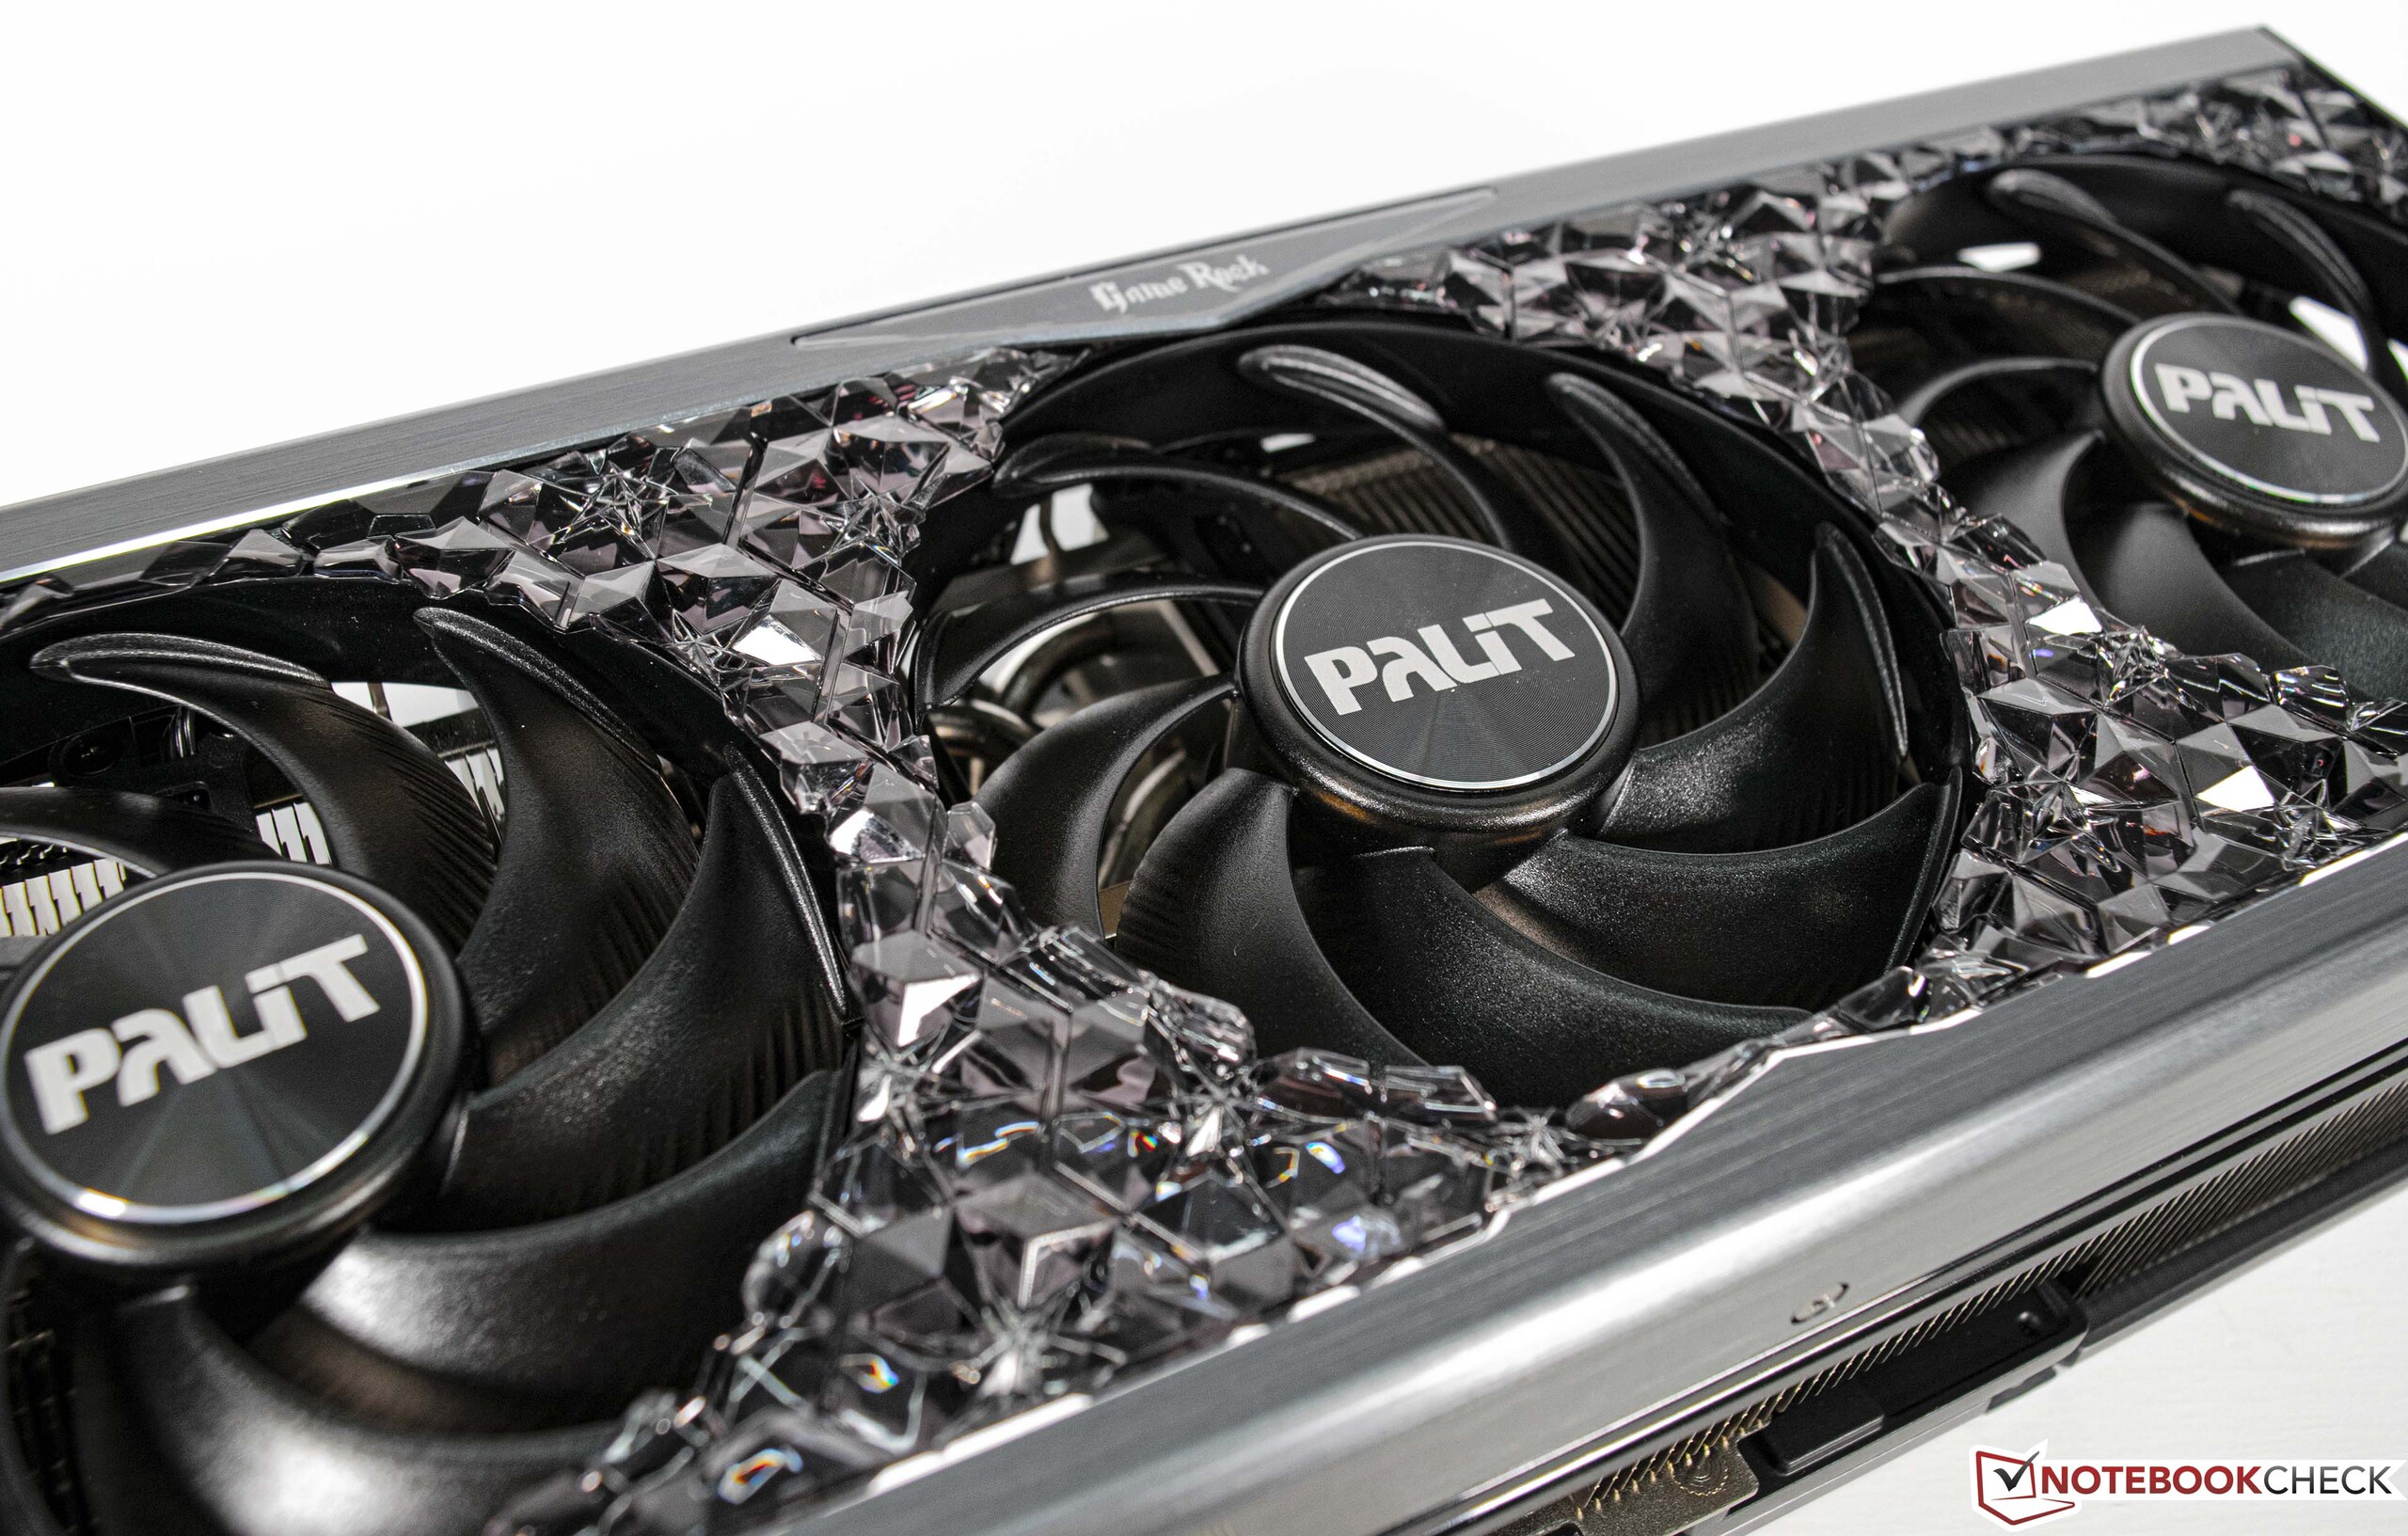
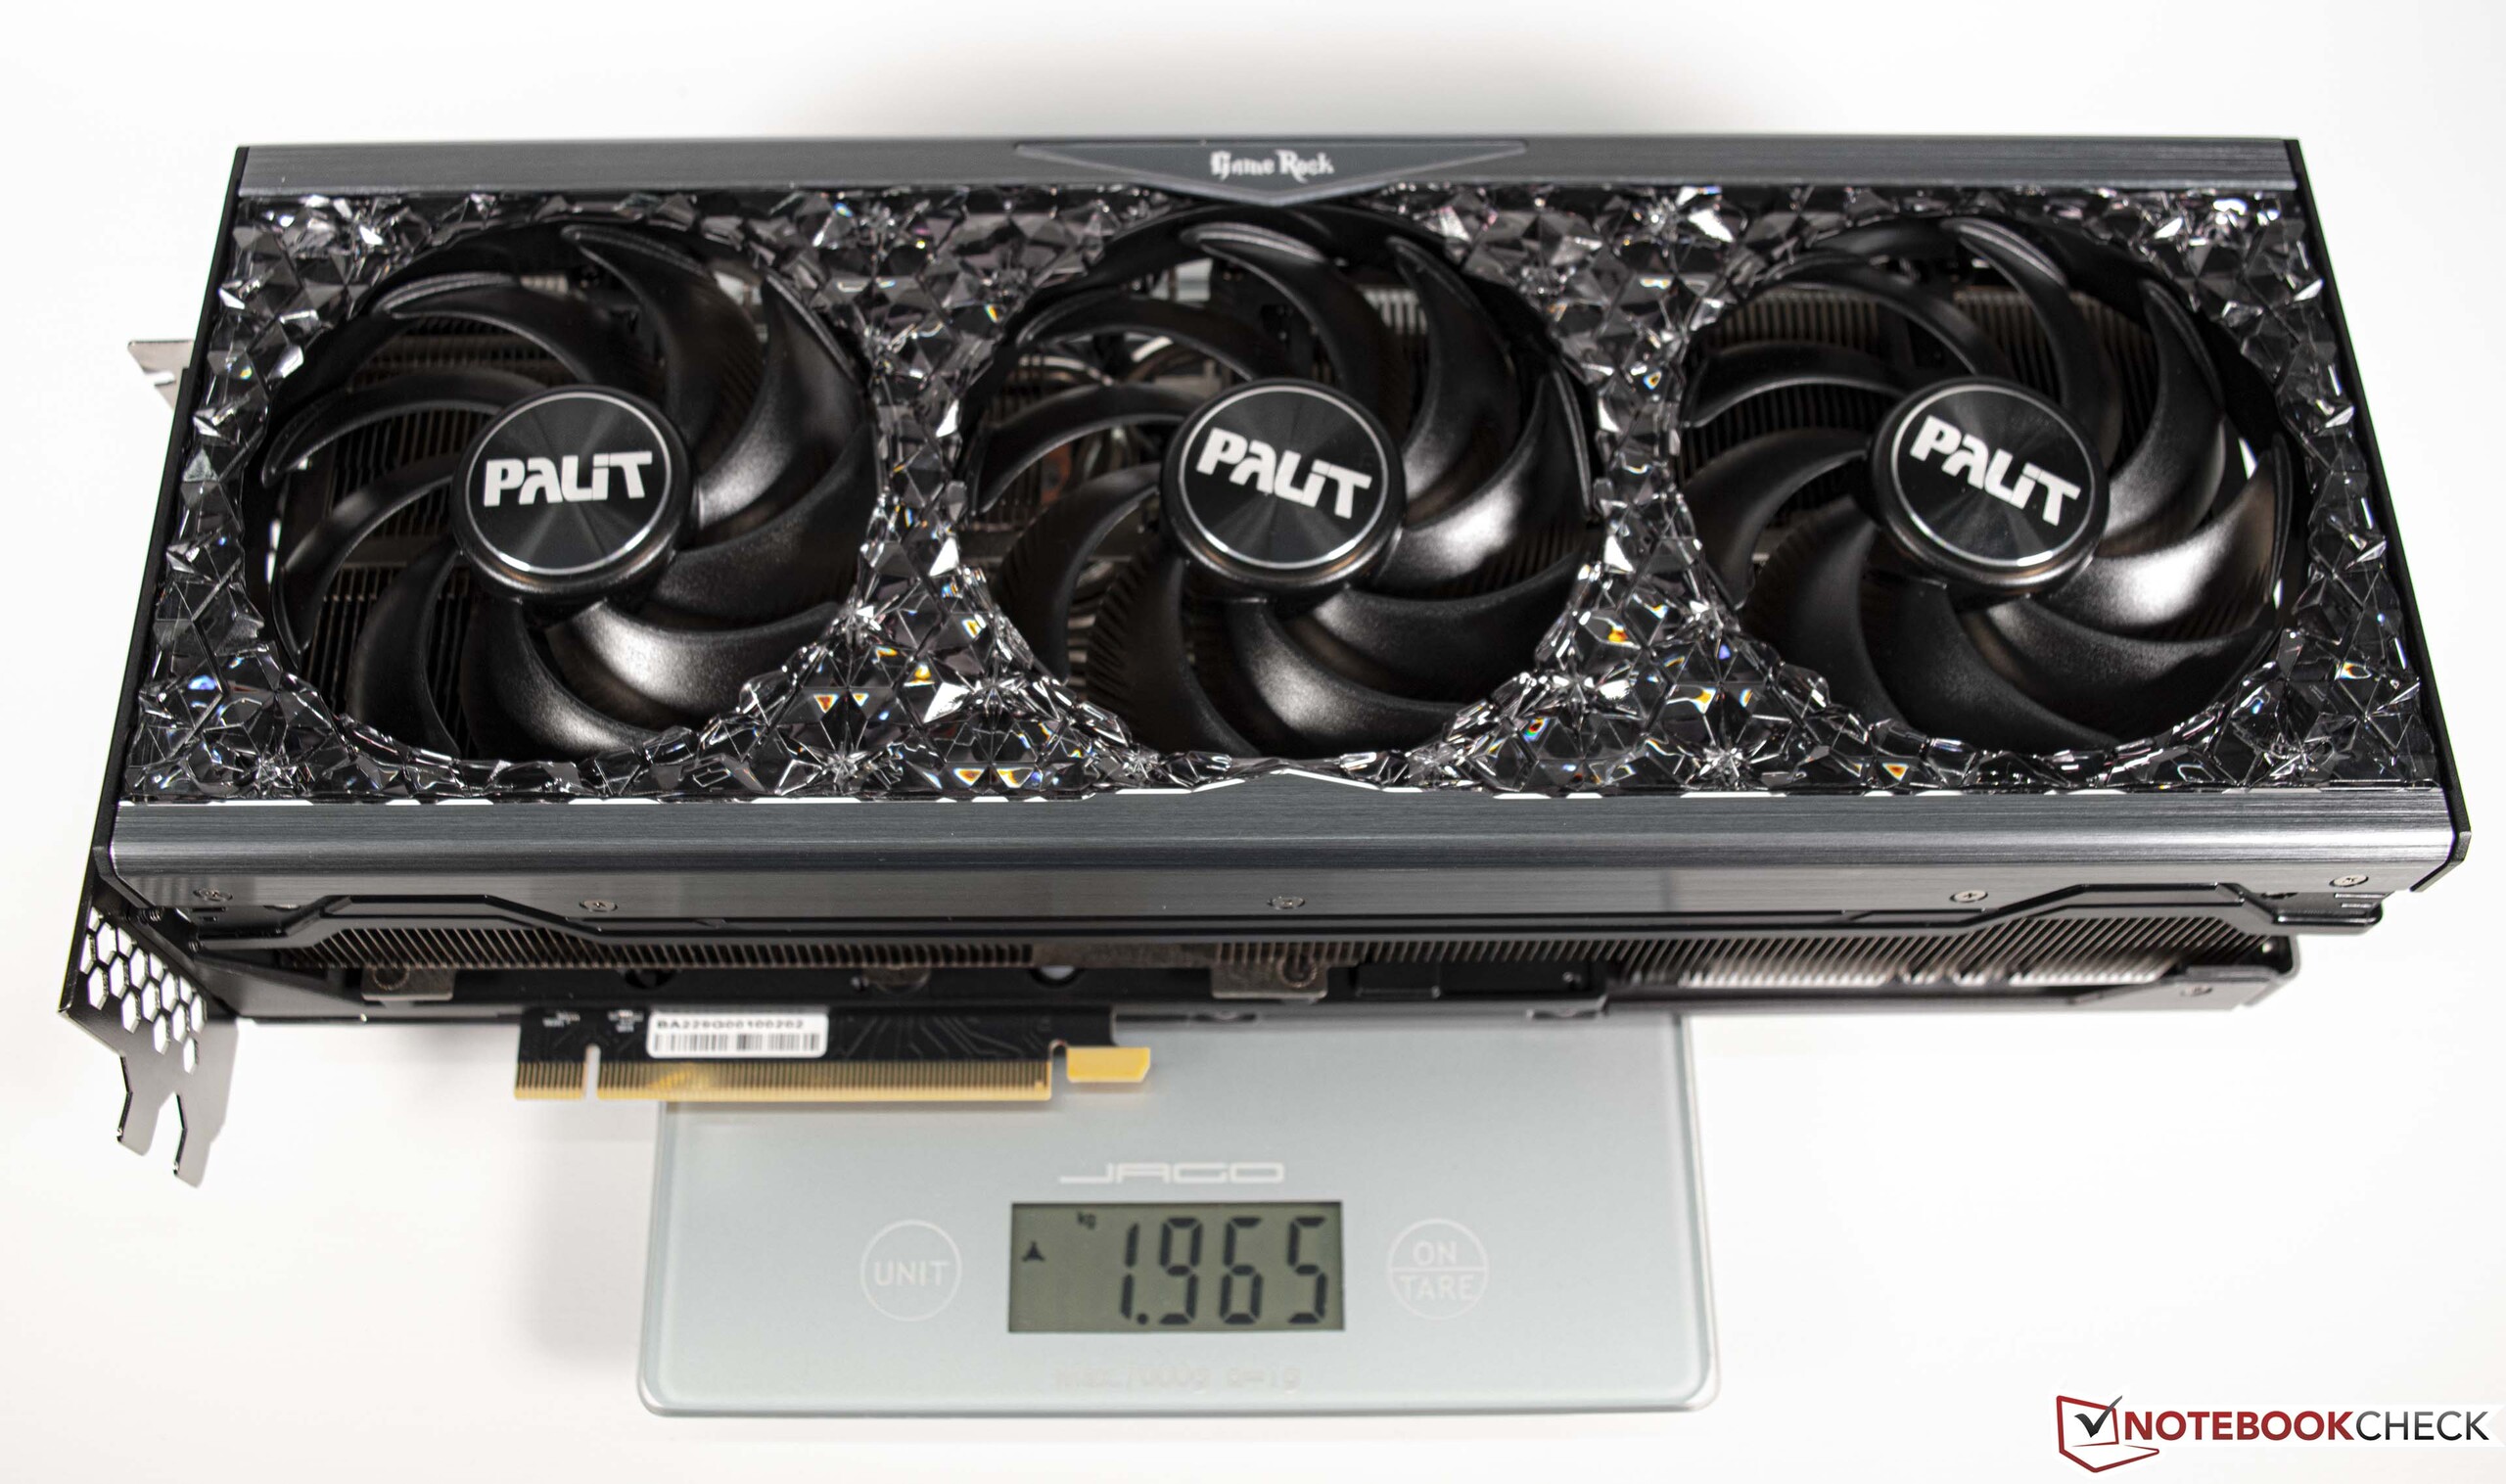
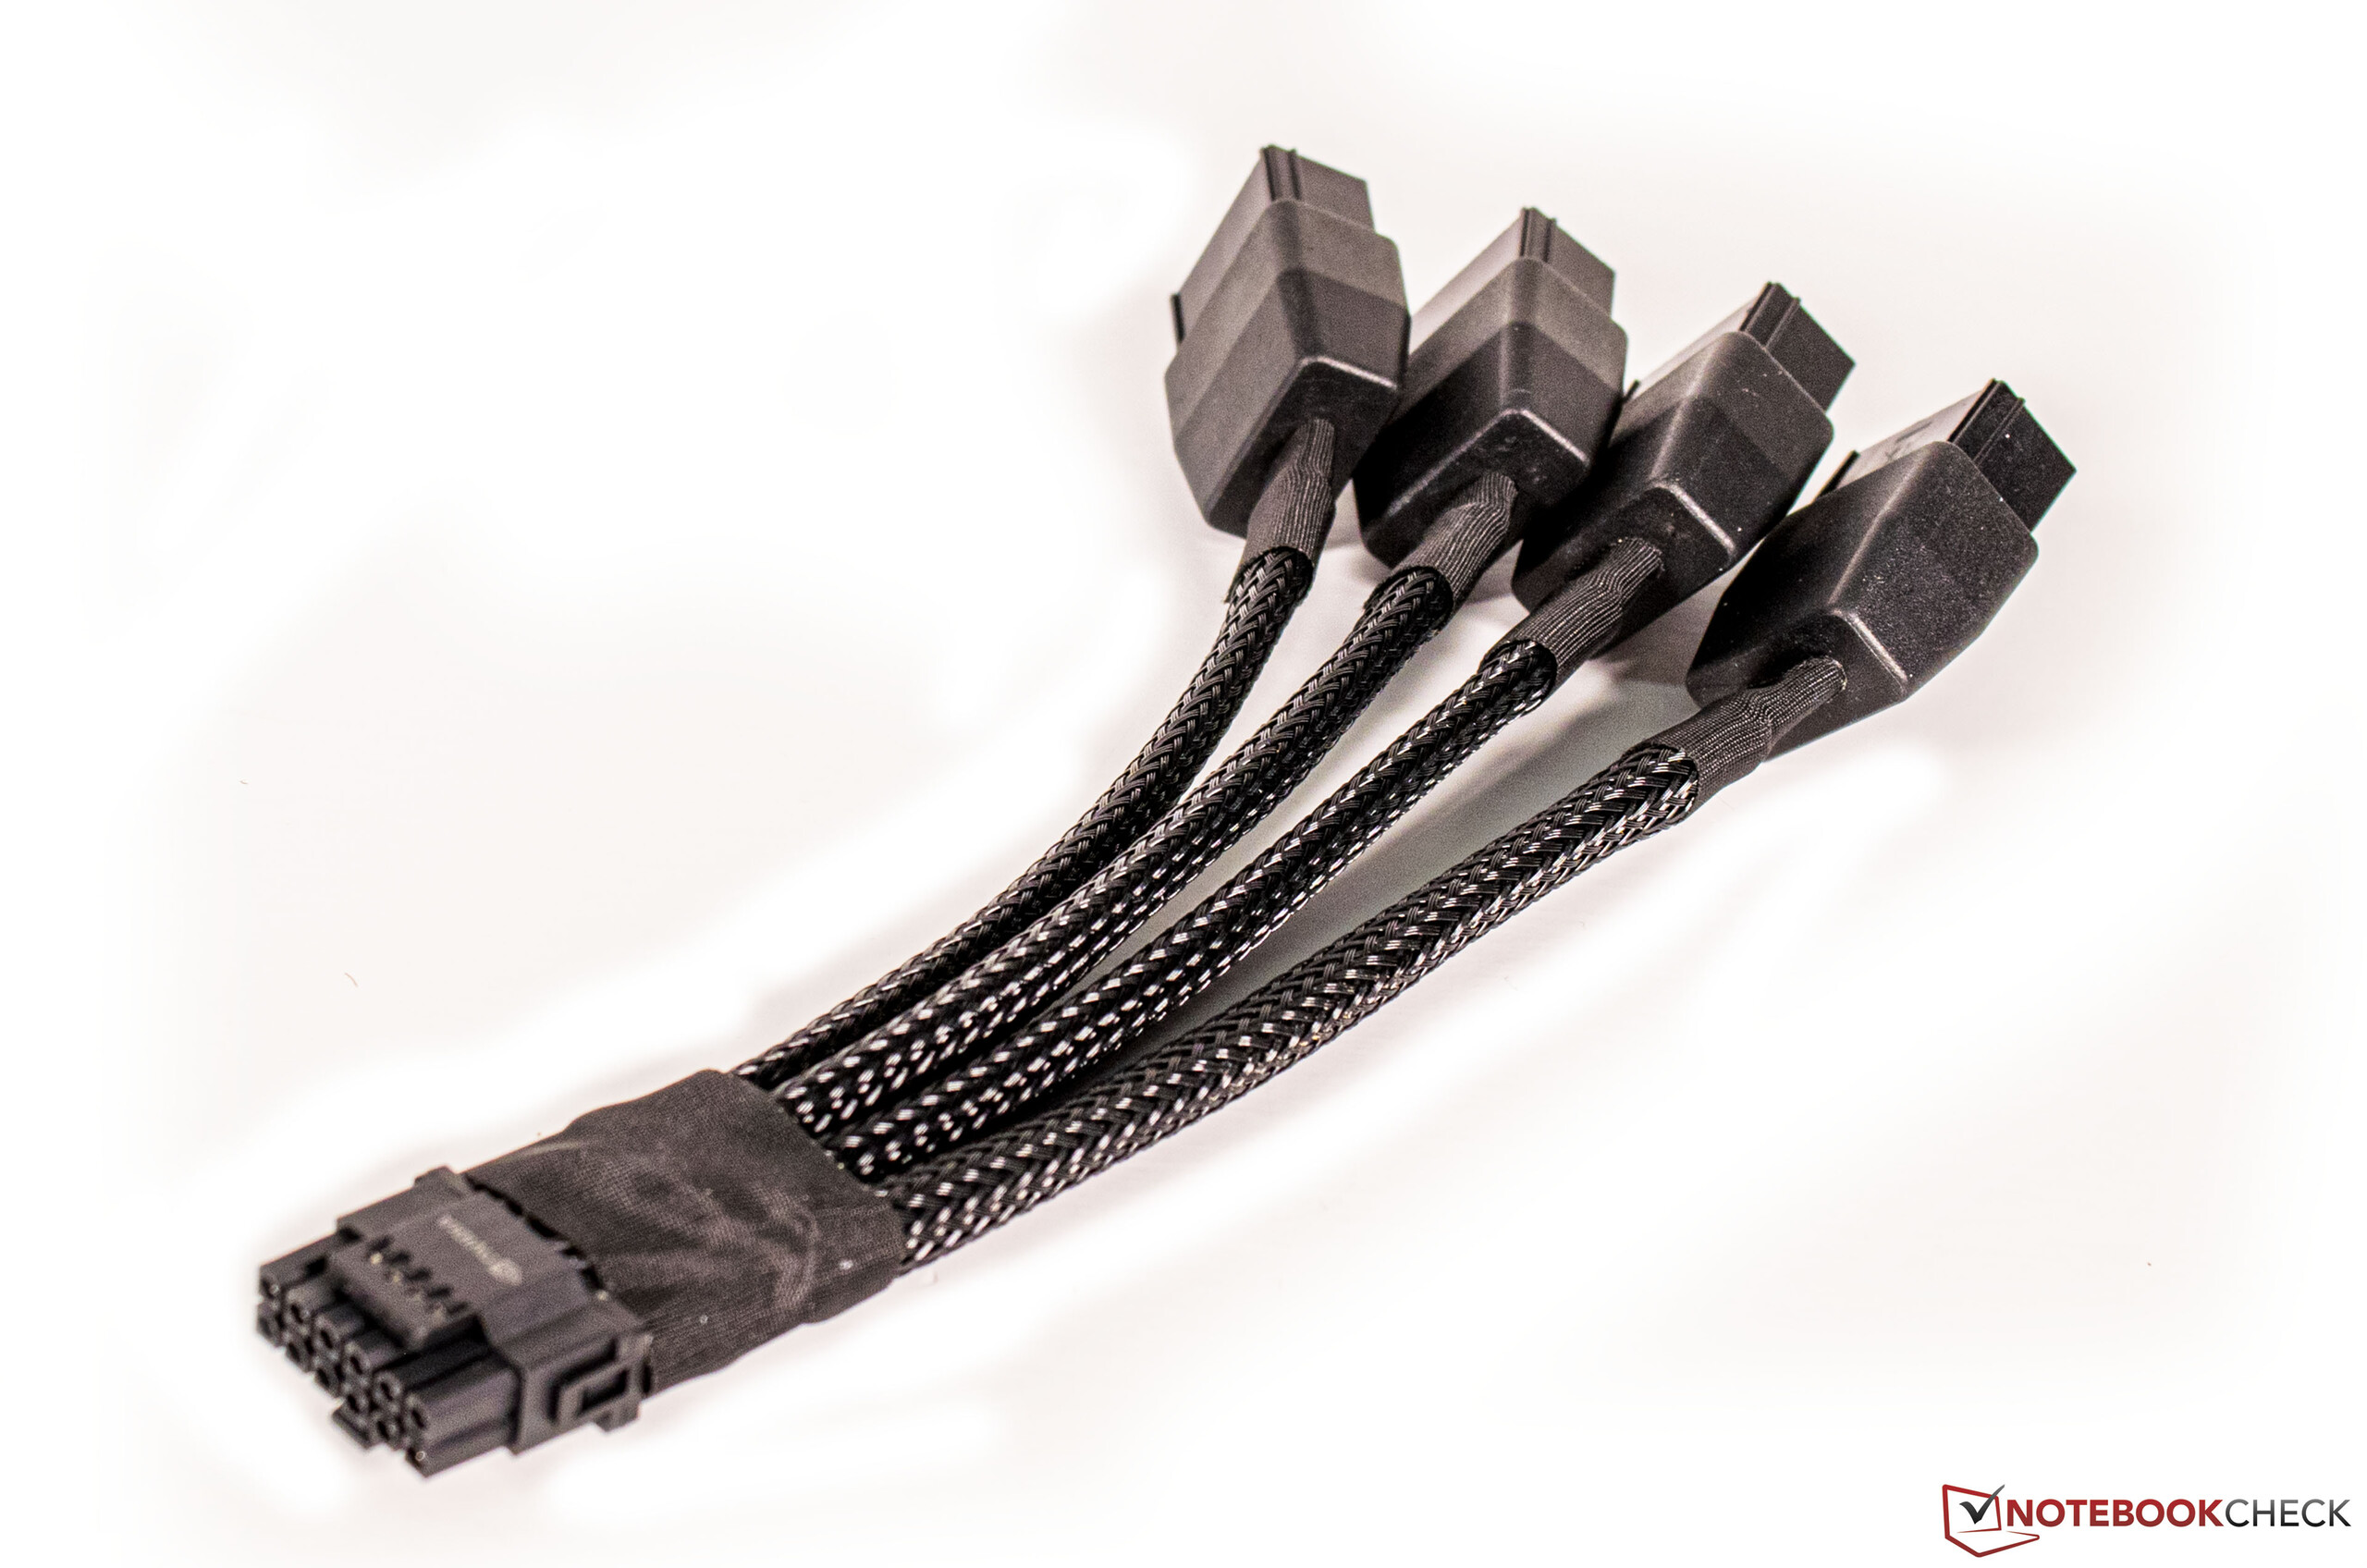
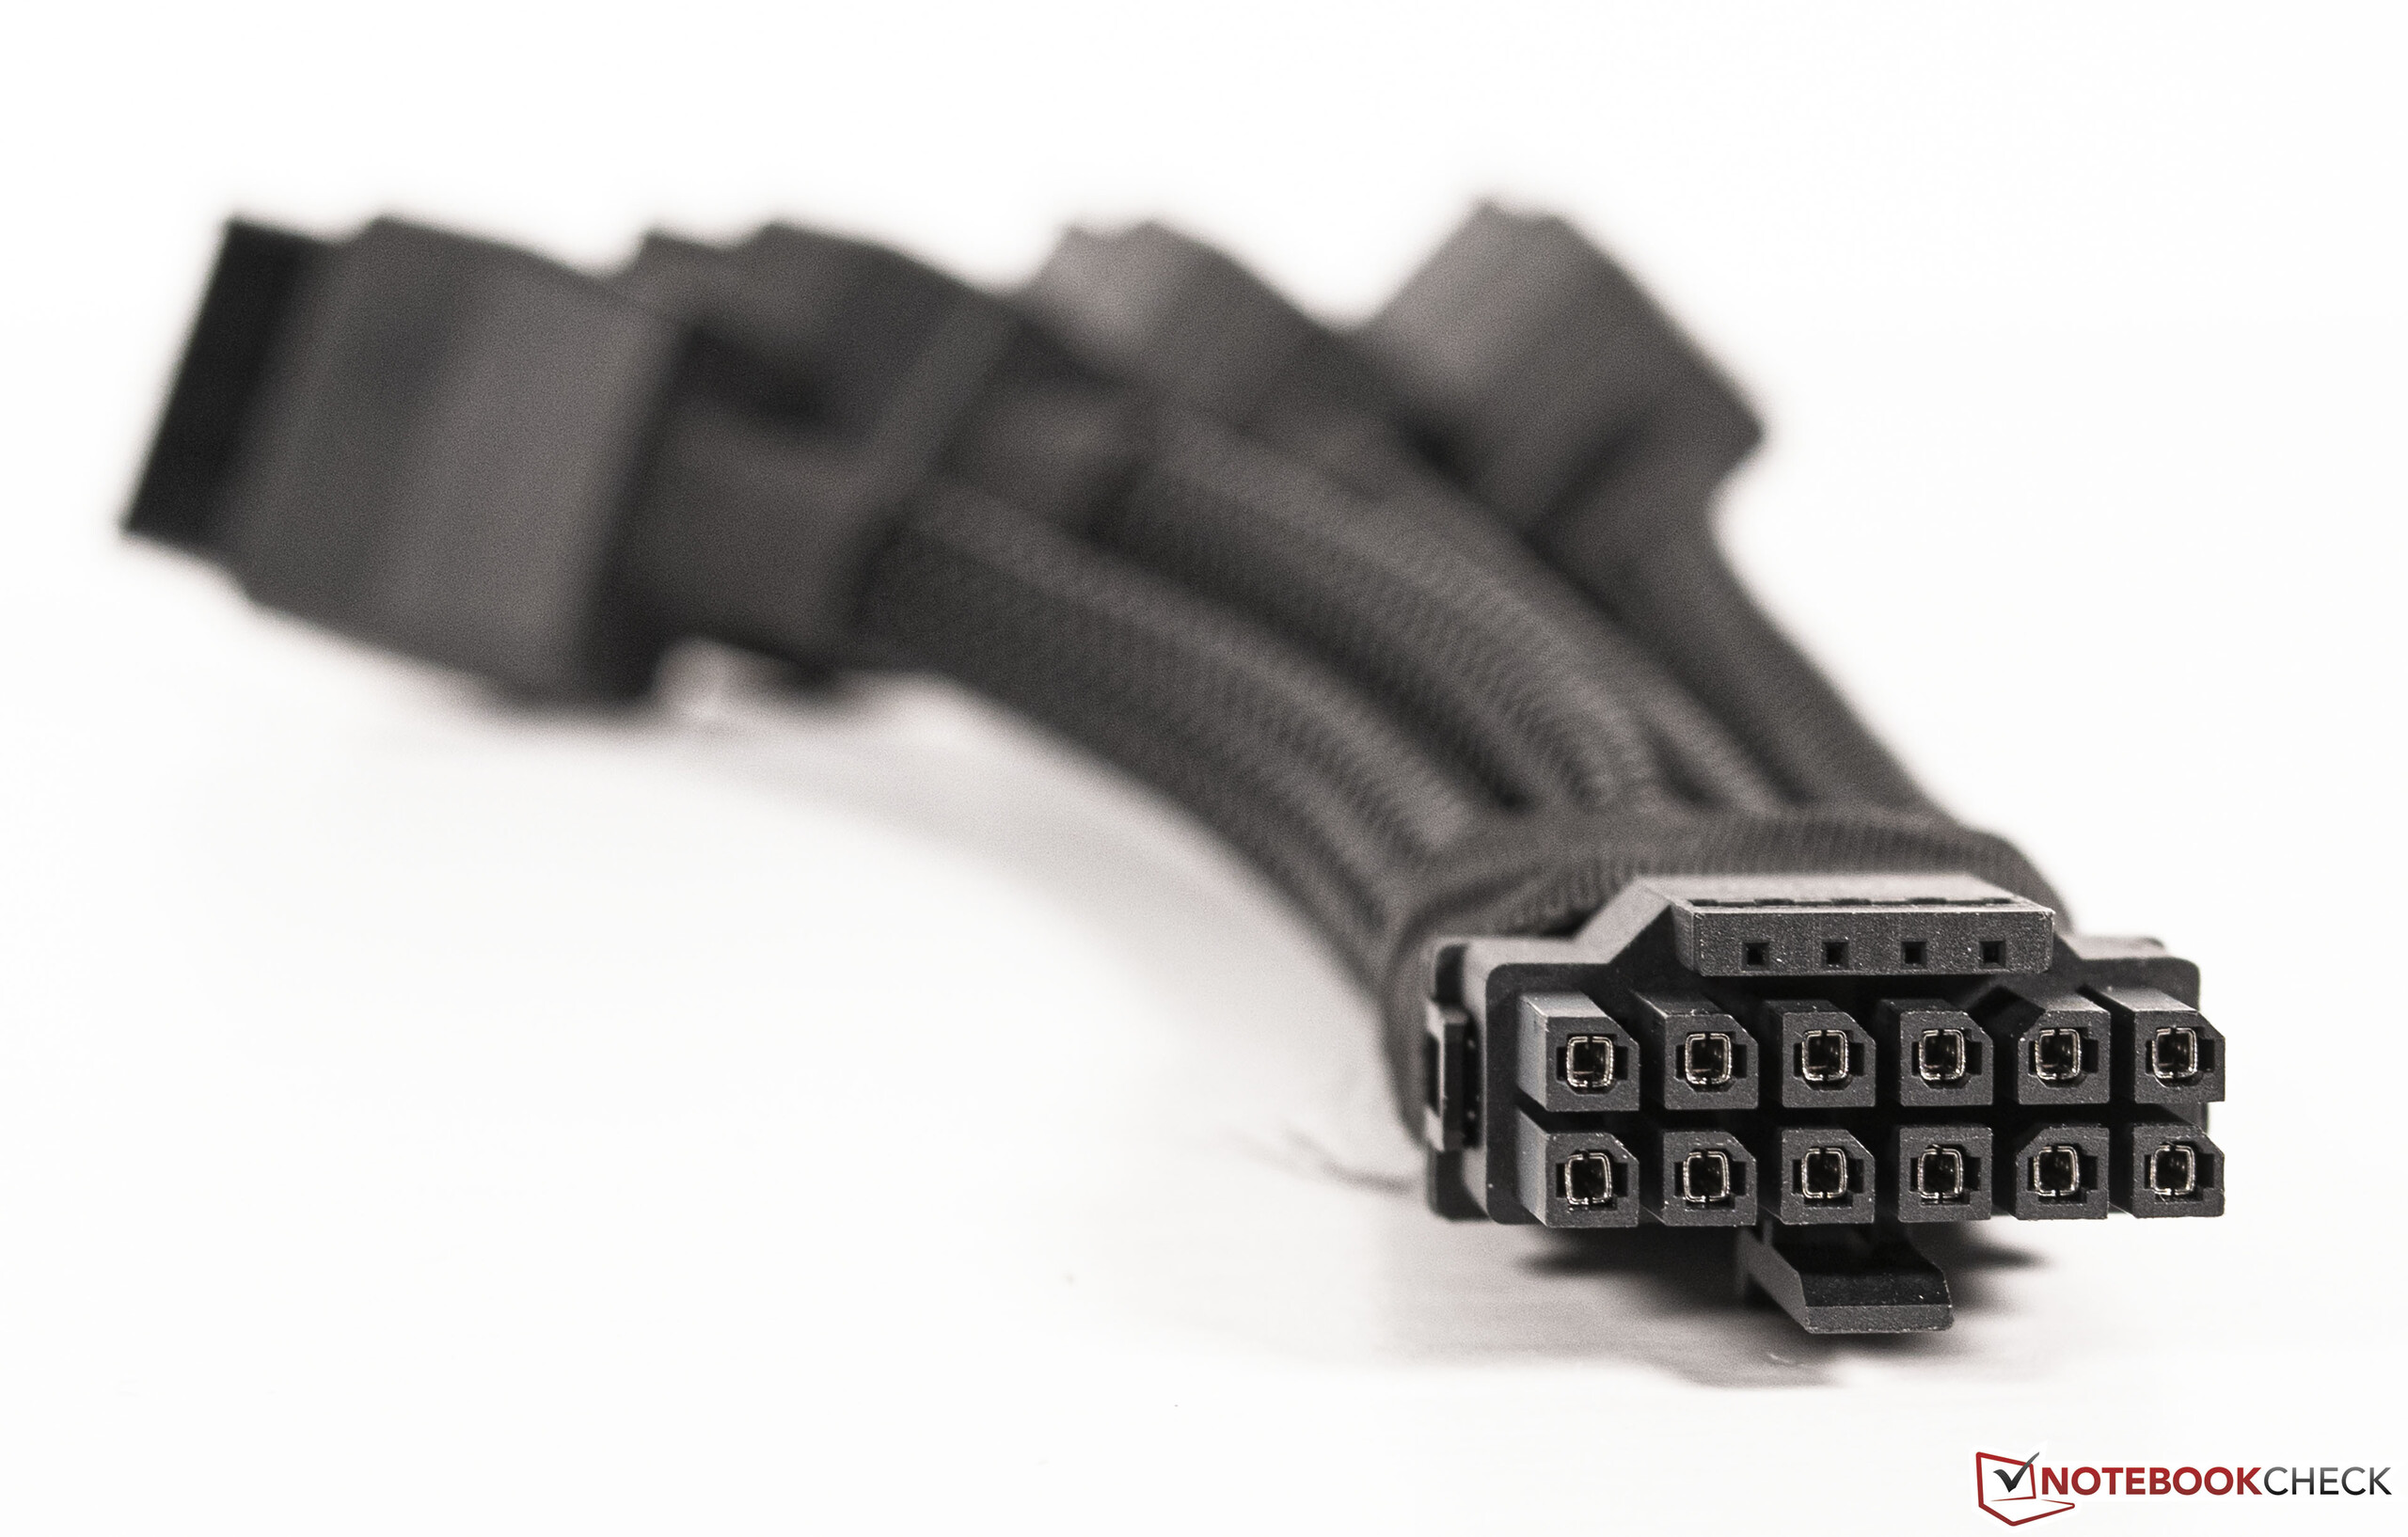
Il modello Palit GeForce RTX 4090 GameRock OC è un vero e proprio richiamo visivo grazie al cosiddetto Midnight Kaleidoscope Design, che include una sottile illuminazione RGB. Con un peso di poco inferiore ai 2 kg (4,4 libbre), il nostro esemplare in prova fa parte dei pesi leggeri rispetto ad altre schede grafiche RTX 4090. Tuttavia, nella confezione è incluso un supporto per la scheda grafica, che aiuta a supportare l'installazione orizzontale della scheda. Inoltre, c'è anche il tanto discusso adattatore di rete che unisce quattro connettori di alimentazione a 8 pin al nuovo connettore 12VHPWR della scheda grafica. A questo punto, non vogliamo entrare nel merito delle caratteristiche tecniche e della precisione. Tuttavia, l'adattatore deve essere maneggiato con cura per evitare potenziali malfunzionamenti. Si consiglia di utilizzare un cavo connettore appropriato del produttore dell'alimentatore. Tutti i nostri test sono stati eseguiti con l'adattatore corrispondente, finora senza riscontrare alcun problema.
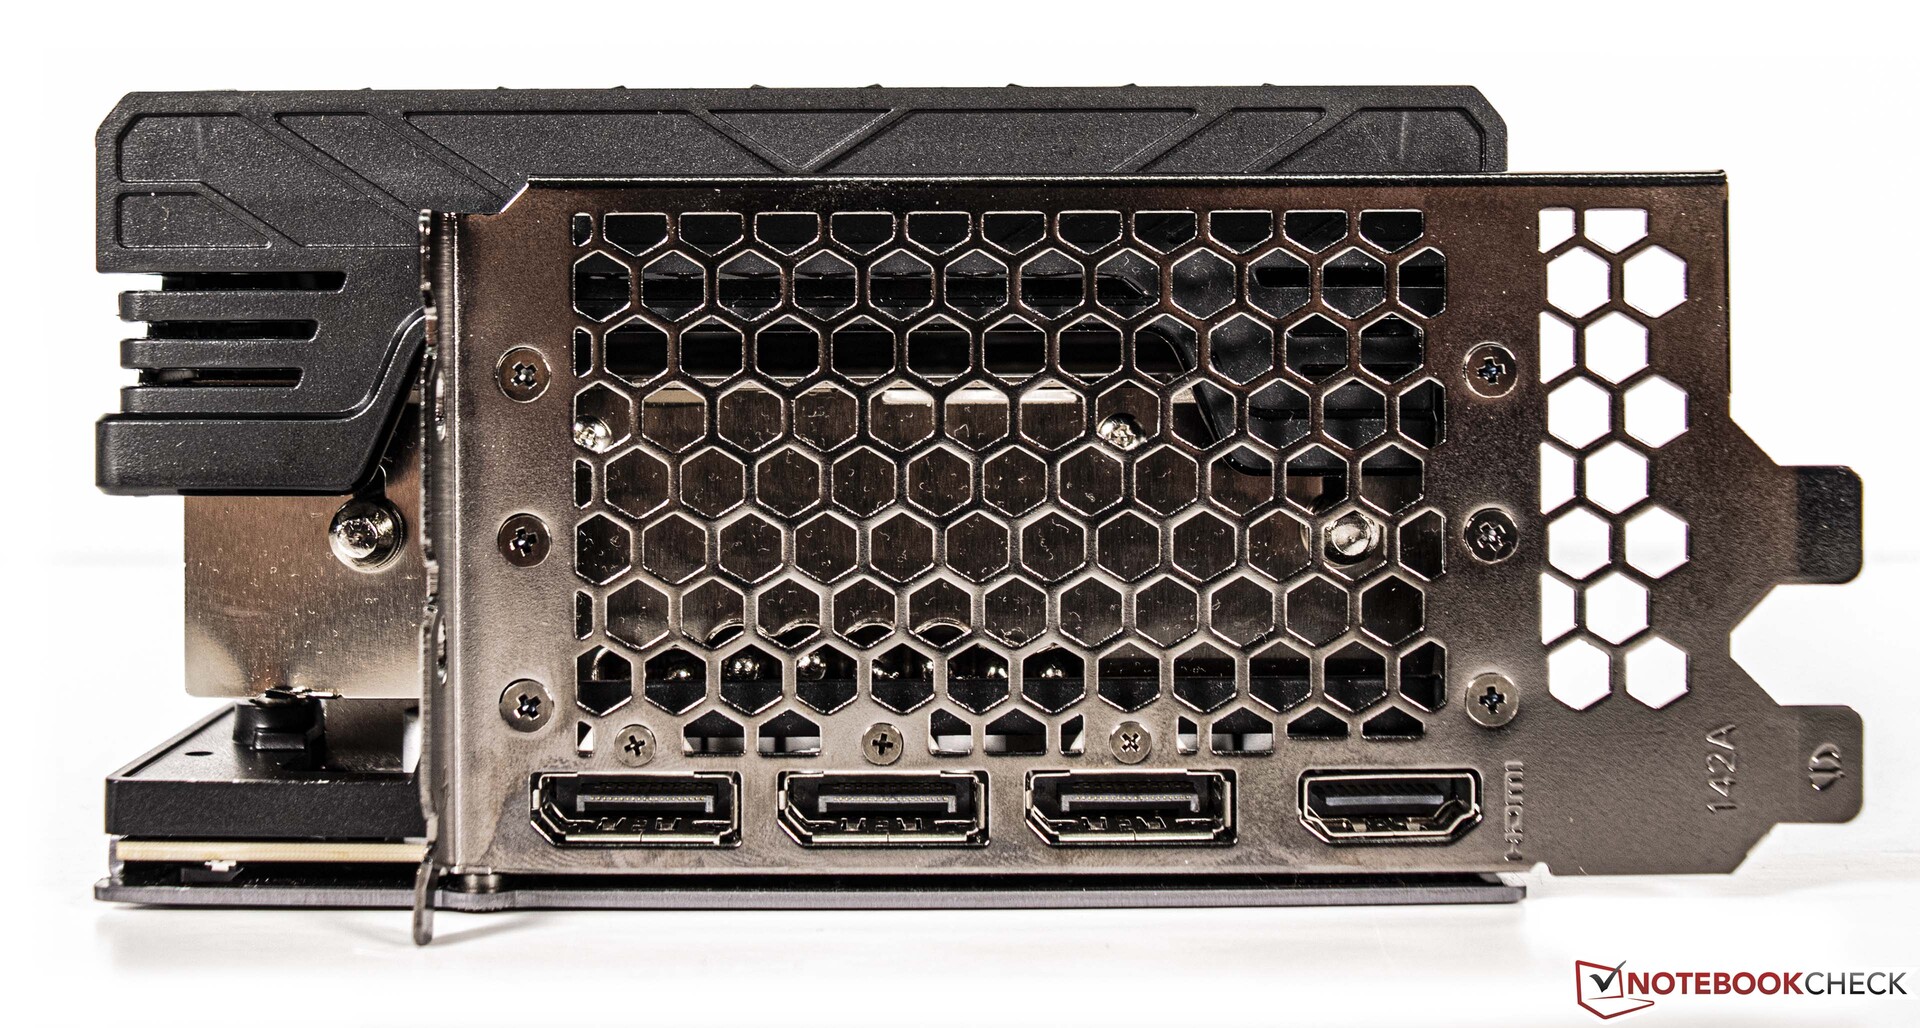
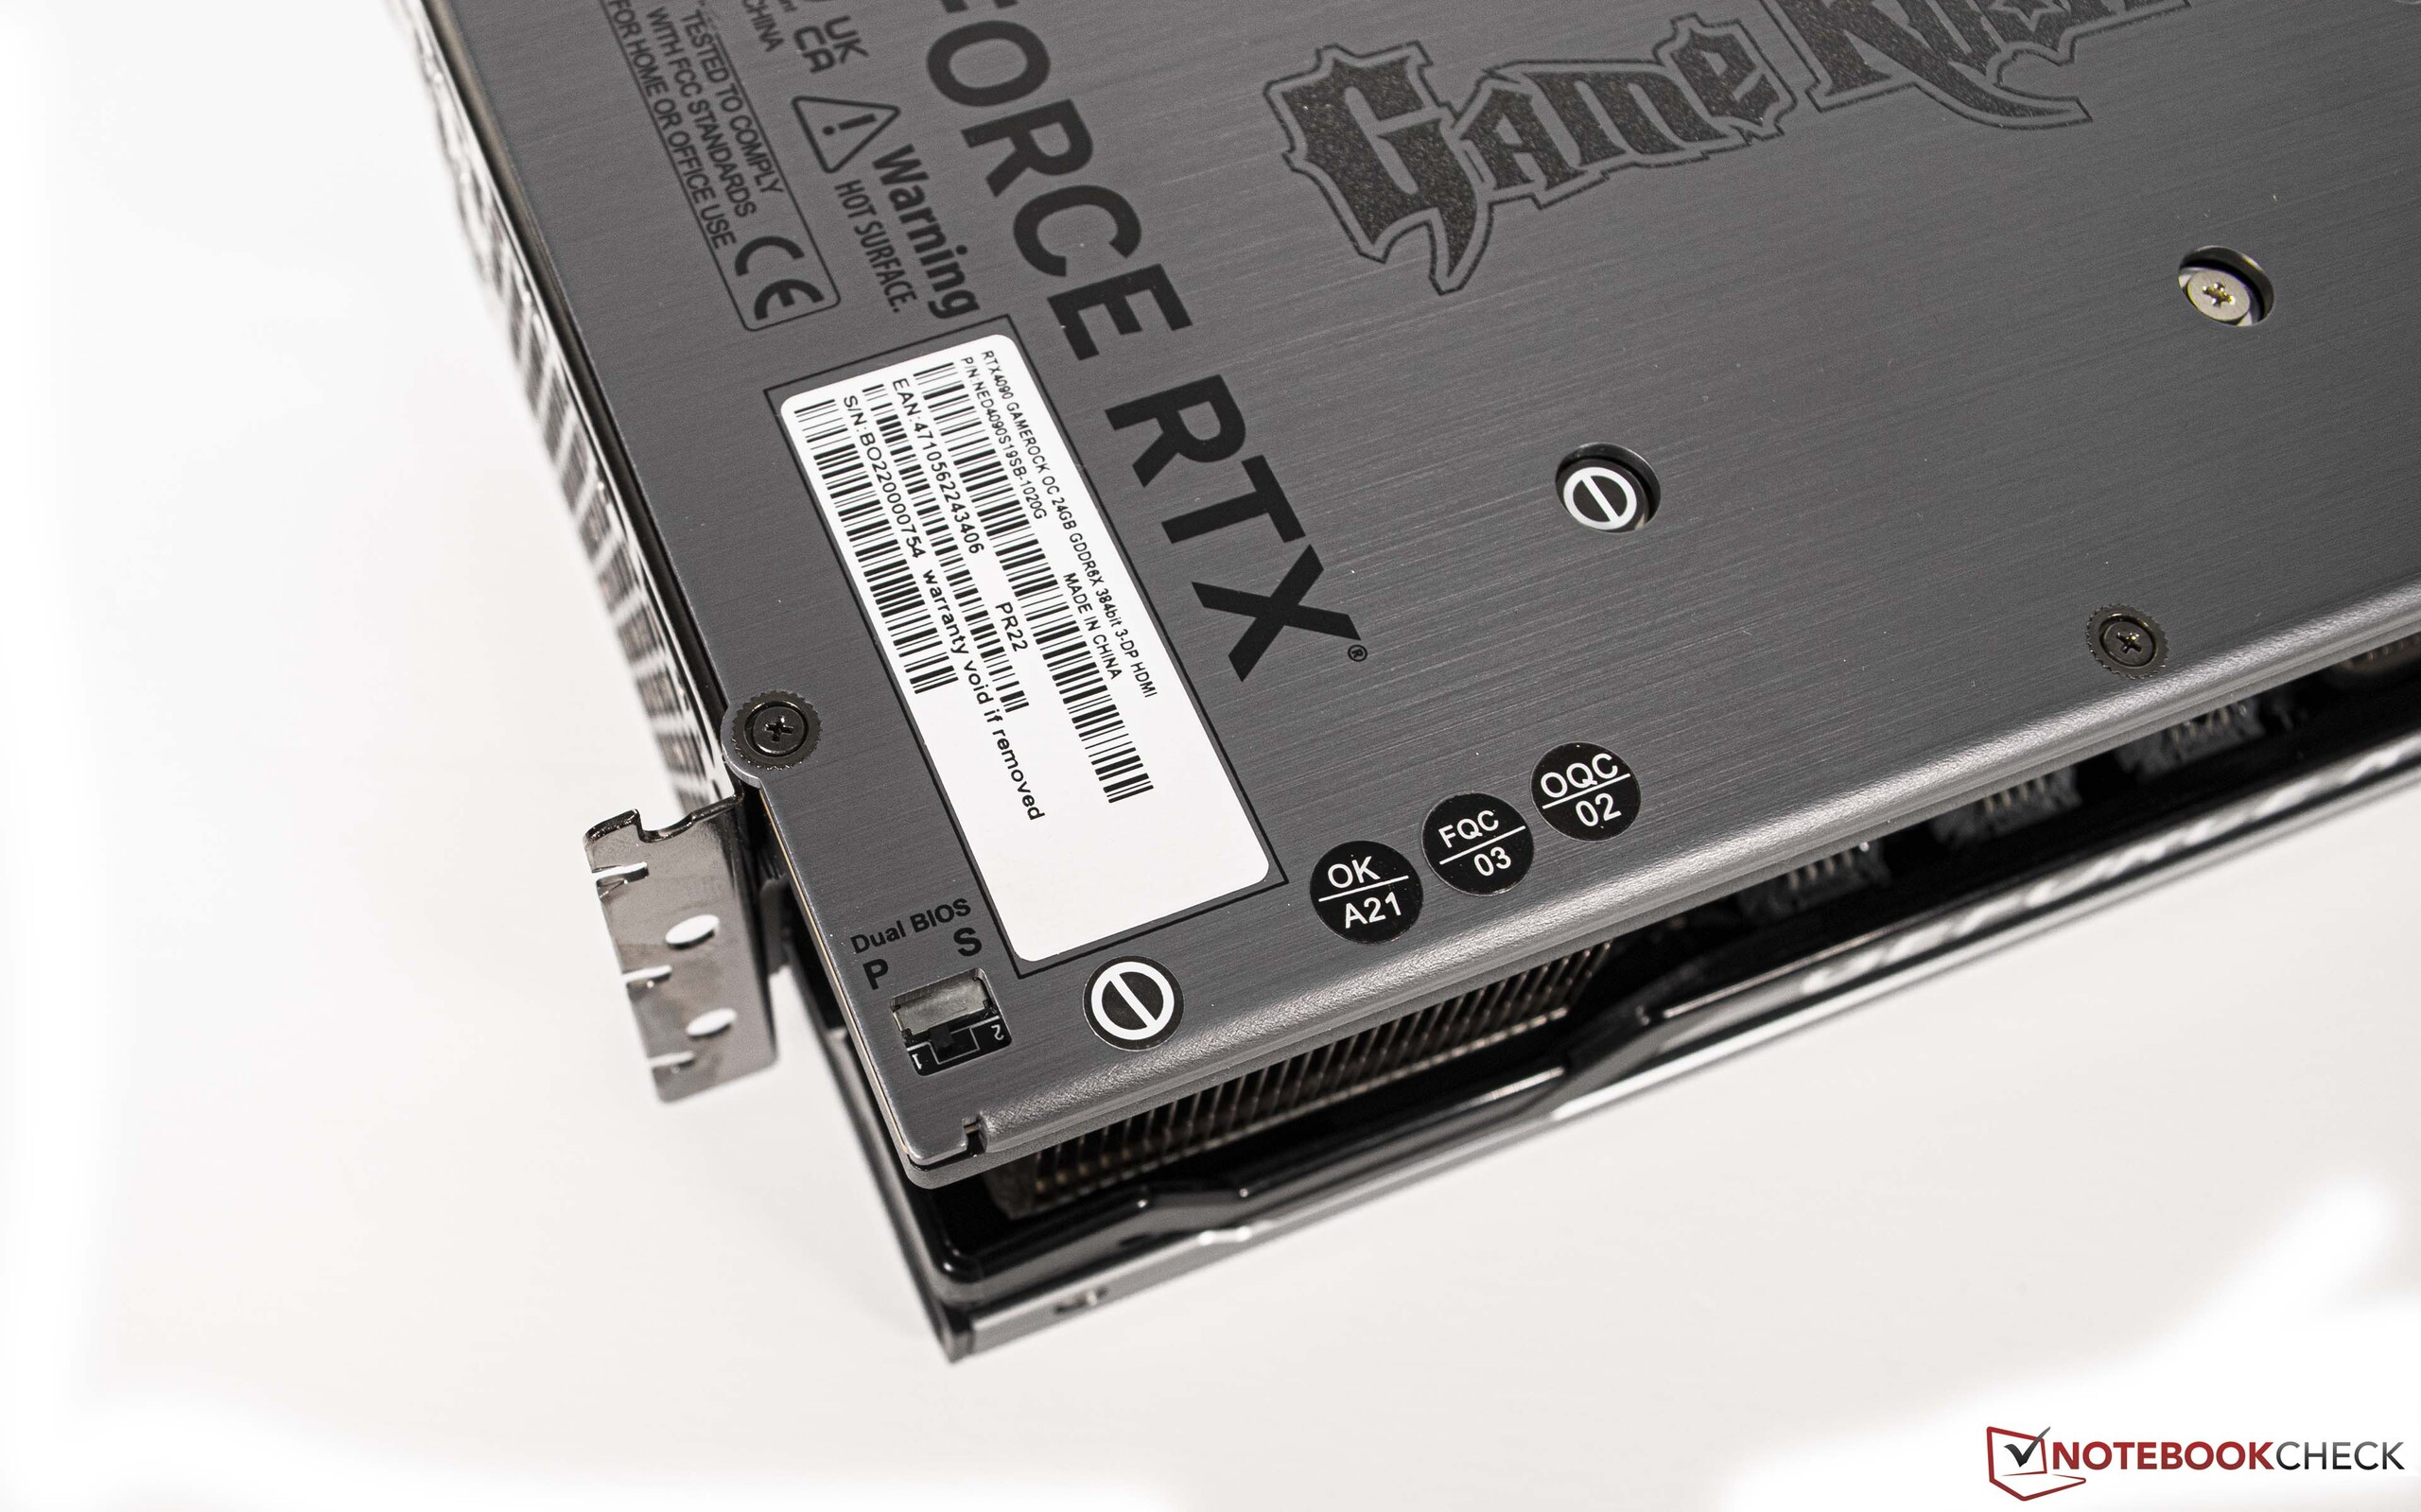
Esternamente, Palit GeForce RTX 4090 GameRock OC è dotato di 1x HDMI 2.1a e 3x DisplayPort 1.4a.
Schede grafiche di punta GeForce: Specifiche
| RTX 4090 (FE) | RTX 4080 | RTX 3090 Ti | RTX 3090 (FE) | RTX 3080 Ti (FE) | RTX 3080 (FE) | Titan RTX | |
| GPU | AD102 | AD103 | GA102 | GA102 | GA102 | GA102 | TU102 |
| Processo FinFET | 4 nm | 4 nm | 8 nm | 8 nm | 8 nm | 8 nm | 12 nm |
| CUDA Cores | 16.384 | 9.728 | 10.752 | 10.496 | 10.240 | 8.704 | 4.608 |
| Unità di texture | 512 | 304 | 336 | 328 | 320 | 272 | 288 |
| Nuclei tensoriali | 512 Gen 4 | 304 Gen 4 | 336 Gen 3 | 328 Gen 3 | 320 Gen 3 | 272 Gen 3 | 576 Gen 2 |
| Core RT | 128 | 76 | 84 | 82 | 80 | 68 | 72 |
| Velocità di clock GPU Base | 2.235 MHz | 2.205 | 1.560 MHz | 1.395 MHz | 1.365 MHz | 1.440 MHz | 1.350 MHz |
| Velocità di clock GPU Boost | 2.520 MHz | 2.505 | 1.860 MHz | 1.695 MHz | 1.665 MHz | 1.710 MHz | 1.770 MHz |
| Bus di memoria | 384 bit | 256 bit | 384 bit | 384 bit | 384 bit | 320 bit | 384 bit |
| Larghezza di banda della memoria | 1,008 GB/s | 735,7 GB/s | 1,008 GB/s | 936 GB/s | 912,4 GB/s | 760 GB/s | 672 GB/s |
| VRAM | 24 GB GDDR6X | 16 GB GDDR6X | 24 GB GDDR6X | 24 GB GDDR6X | 12 GB GDDR6X | 10 GB GDDR6X | 24 GB GDDR6 |
| Consumo di energia | 450 W | 320 W | 450 W | 350 W | 350 W | 320 W | 280 W |
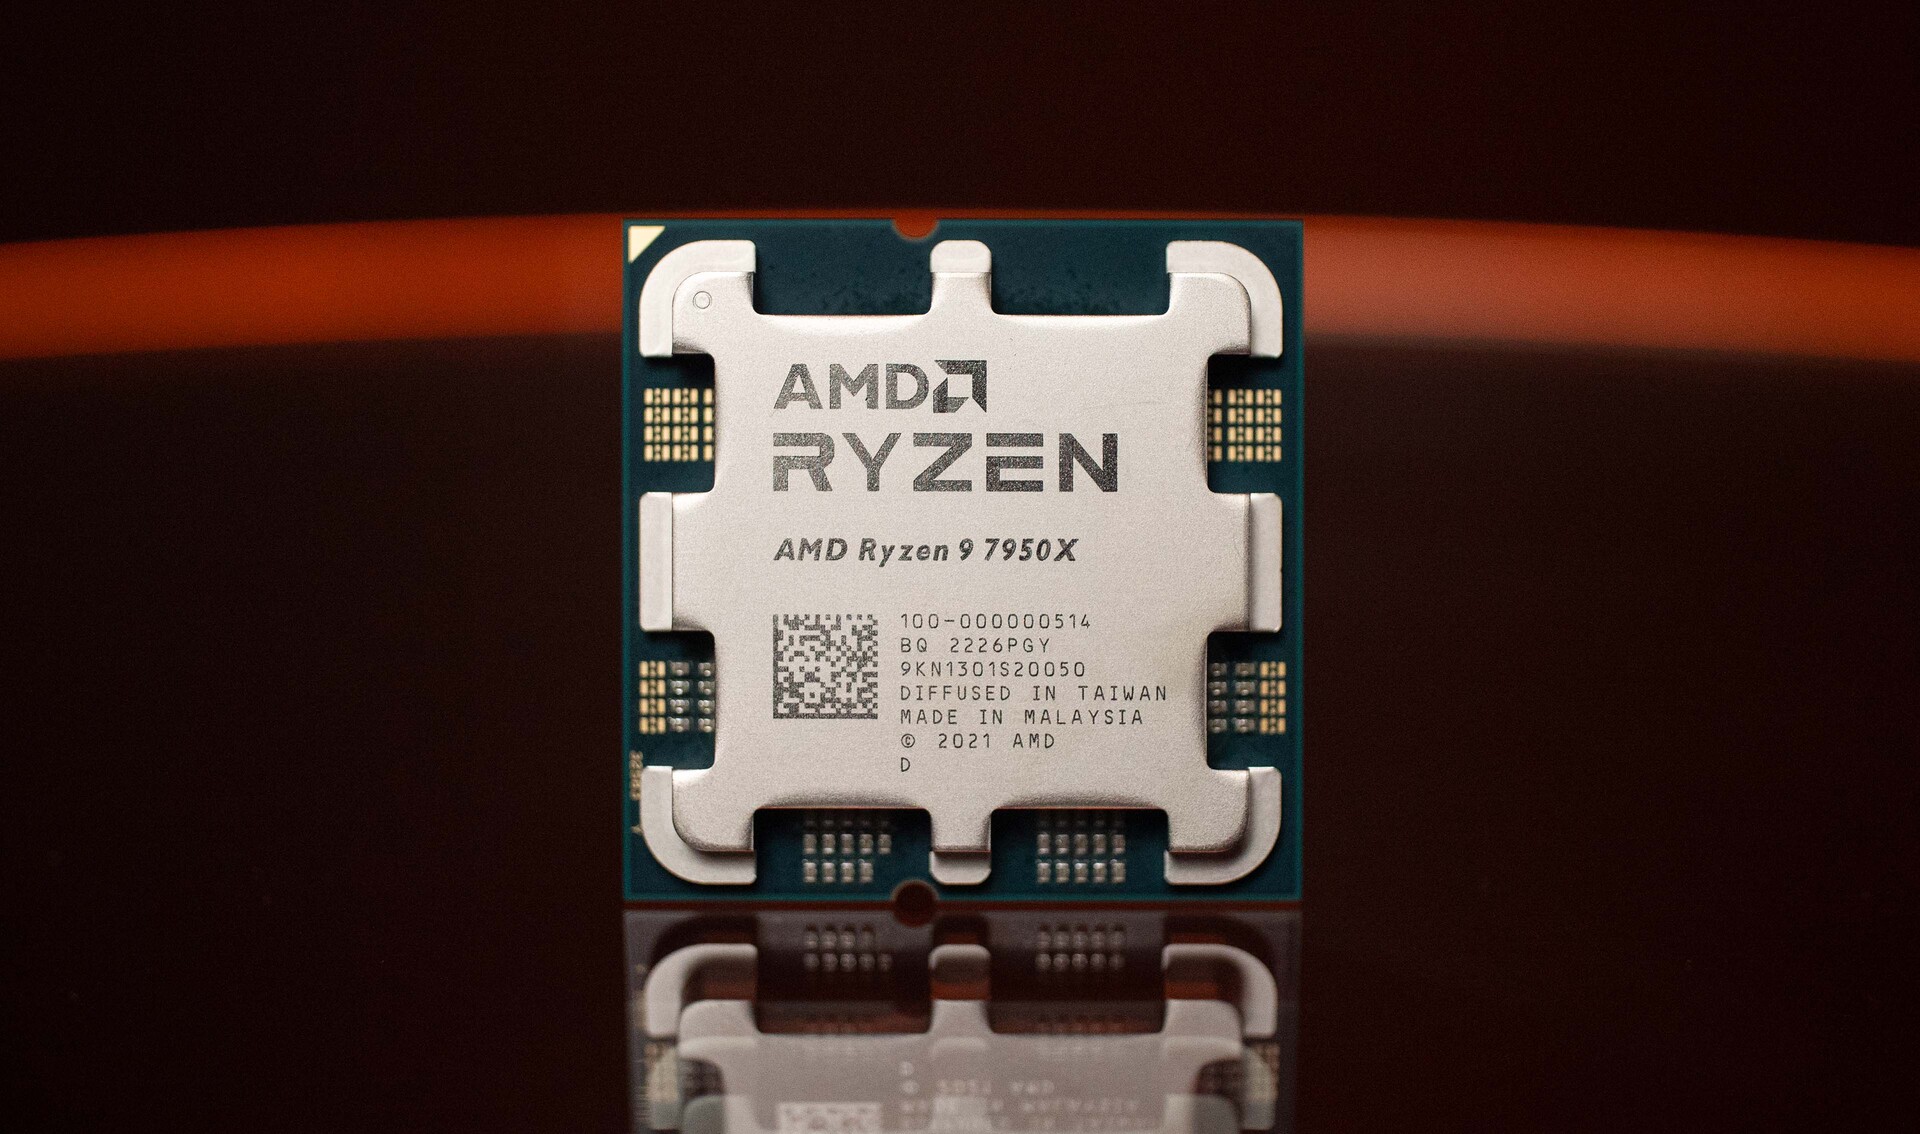
La nostra unità di recensione con AMD Ryzen 9 7950X come base
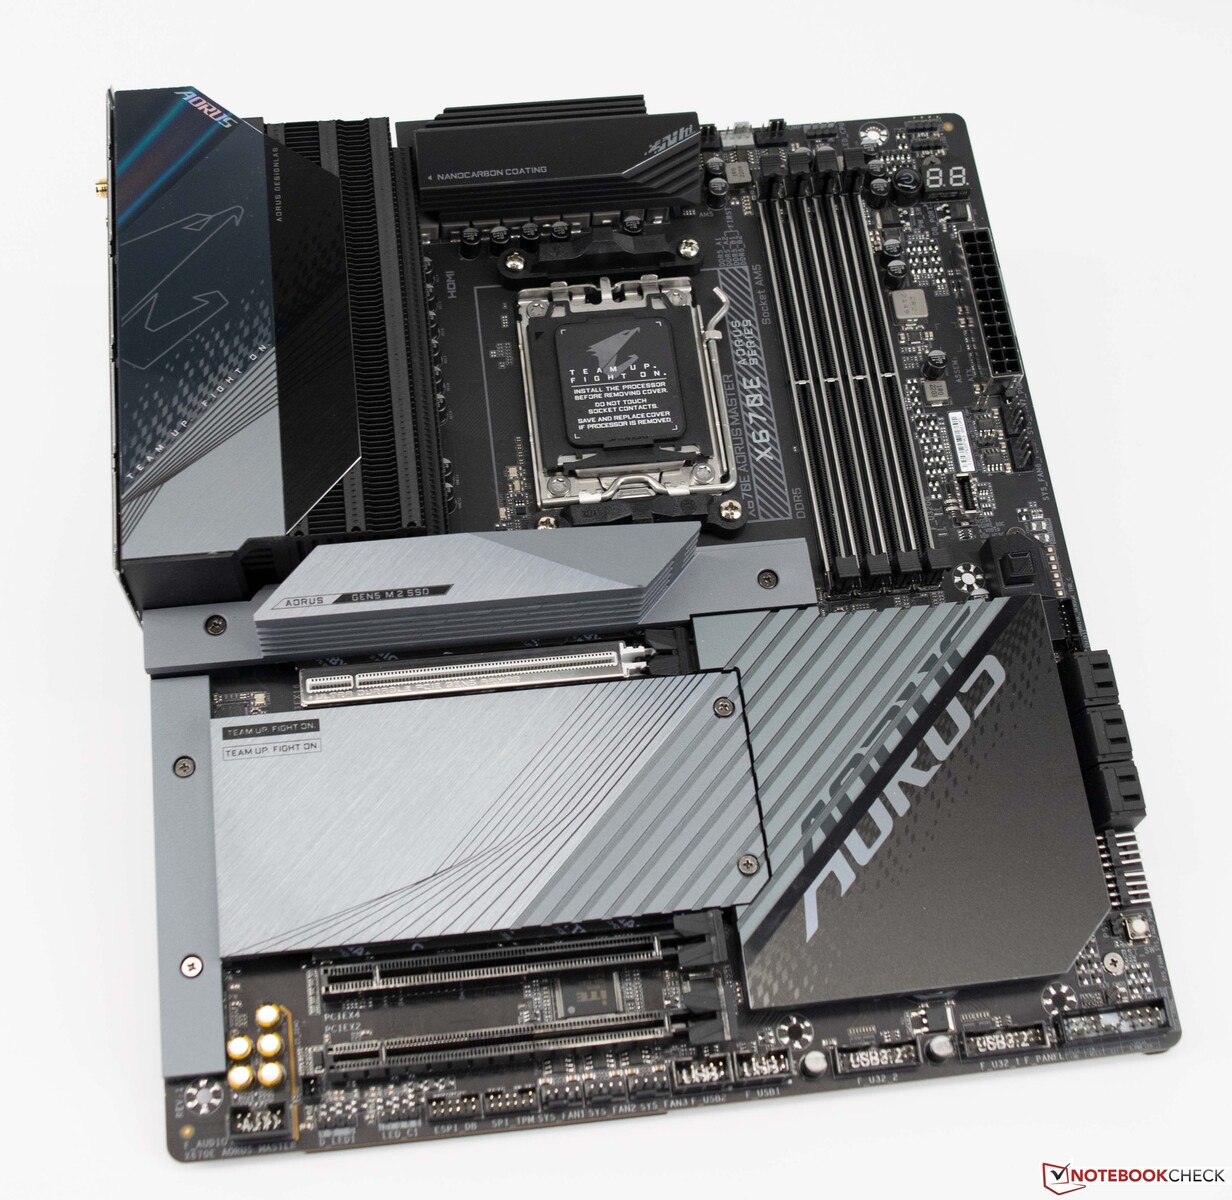
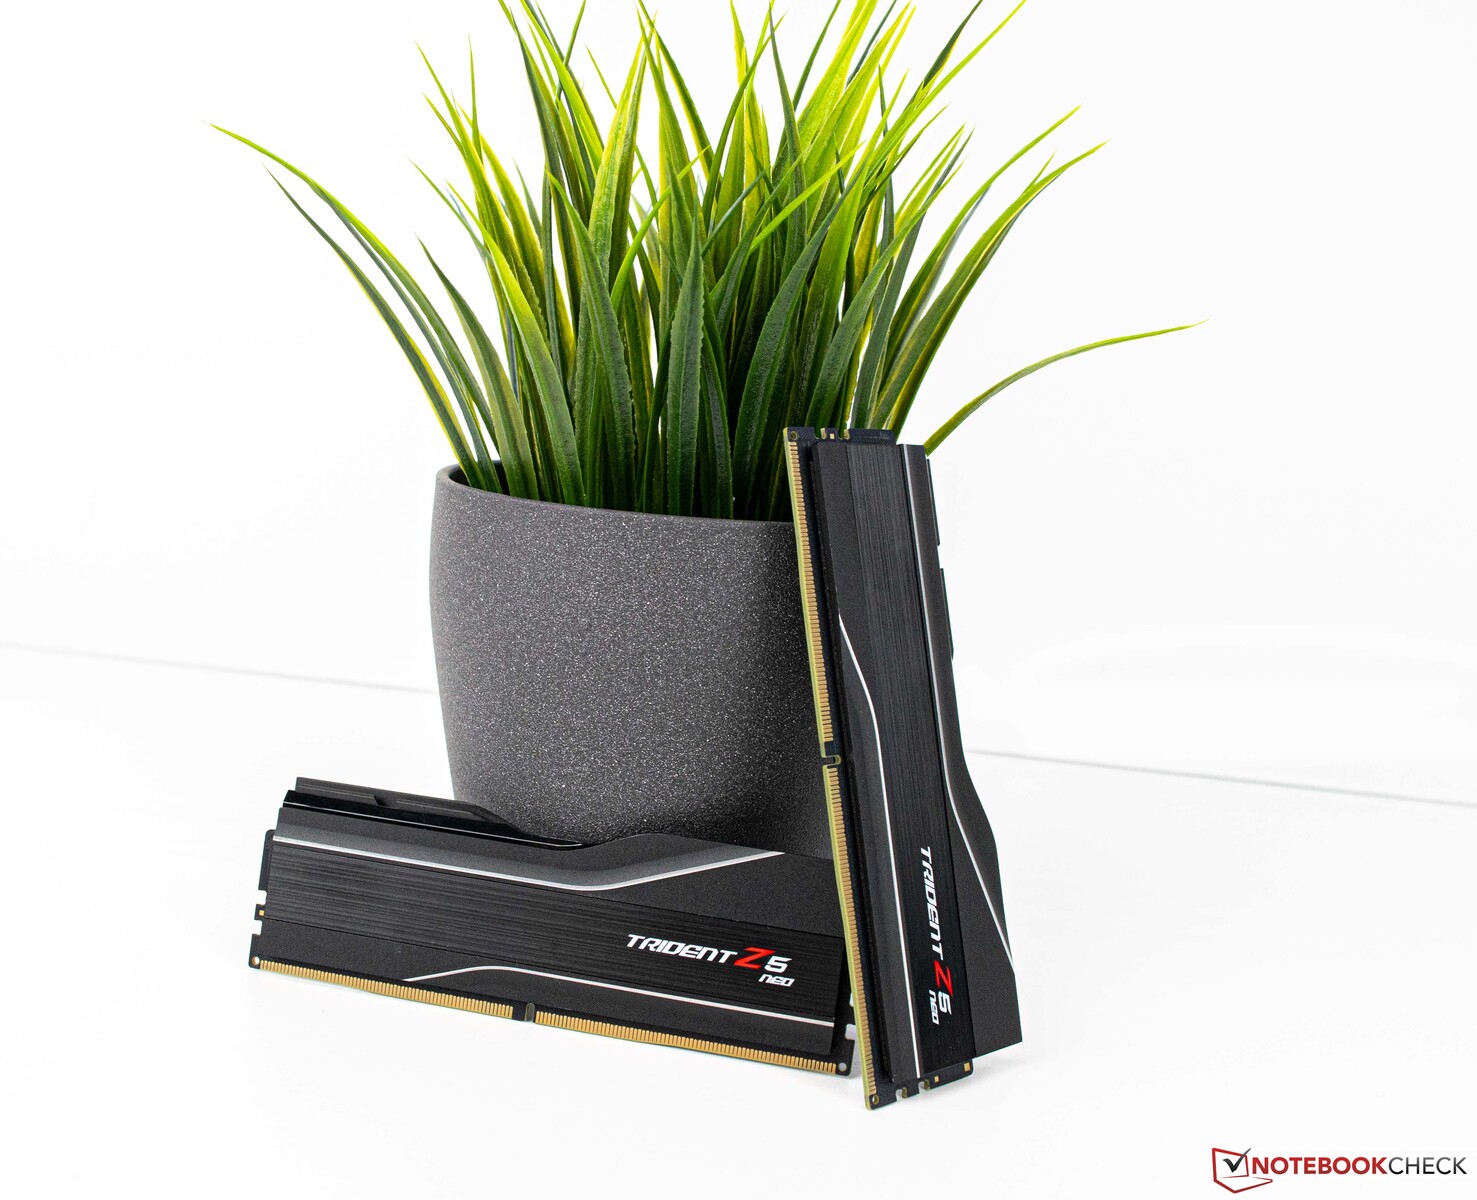
Come sistema di prova abbiamo utilizzato un'attuale piattaforma AMD basata sulla scheda madre Gigabyte X670E Aorus Master. La CPU (AMD Ryzen 9 7950X) offre buone prestazioni e per il raffreddamento abbiamo utilizzato una soluzione AiO di Alphacool (Alphacool Eisbear Aurora 360 mm). La RAM da 32 GB proviene da G.Skill e utilizza un profilo EXPO adeguato. Il monitor utilizzato è il Gigabyte M32U.
Dettagli del nostro sistema
Per i seguenti benchmark e test abbiamo utilizzato questo sistema
- Lian-Li O11 dinamico
- AMD Ryzen 9 7950X
- Gigabyte X670E Aorus Master, BIOS: F8a
- Alphacool Eisbear 360 AiO
- Alimentatore Corsair RM 1000x
- G.Skill Trident Z5 Neo DDR5-6000 2x 16 GB, EXPO (DDR5-6000 CL30-38-38-96)
- Corsair MP600 2 TB
- Crucial MX500 2 TB
- Microsoft Windows 11 Professional 64-Bit (versione 22H2)
Benchmark sintetici
I test sintetici dimostrano già chiaramente di cosa è capace la Nvidia GeForce RTX 4090. Le prestazioni degli attuali modelli di punta vengono quasi completamente polverizzate e nella valutazione complessiva dei benchmark sintetici la Palit GeForce RTX 4090 GameRock OC supera le prestazioni della Nvidia RTX 3090 Ti.Nvidia GeForce RTX 3090 Tidel 52%. Il precedente modello di punta di AMD (AMD Radeon RX 6950 XT) si trova più indietro nel gruppo e si posiziona al quarto posto dietro la Nvidia GeForce RTX 3090 Founders Edition.
| Performance rating - Percent | |
| NVIDIA GeForce RTX 4090 | |
| NVIDIA Titan RTX | |
| AMD Radeon RX 6950 XT | |
| NVIDIA GeForce RTX 3090 | |
| NVIDIA GeForce RTX 3090 Ti -8! | |
| AMD Radeon RX 6900 XT | |
| NVIDIA GeForce RTX 3080 12 GB | |
| 3DMark | |
| 2560x1440 Time Spy Graphics | |
| NVIDIA GeForce RTX 4090 | |
| AMD Radeon RX 6950 XT | |
| NVIDIA GeForce RTX 3090 Ti | |
| NVIDIA GeForce RTX 3090 | |
| AMD Radeon RX 6900 XT | |
| NVIDIA GeForce RTX 3080 12 GB | |
| NVIDIA Titan RTX | |
| Fire Strike Extreme Graphics | |
| NVIDIA GeForce RTX 4090 | |
| AMD Radeon RX 6950 XT | |
| NVIDIA GeForce RTX 3090 Ti | |
| AMD Radeon RX 6900 XT | |
| NVIDIA GeForce RTX 3090 | |
| NVIDIA GeForce RTX 3080 12 GB | |
| NVIDIA Titan RTX | |
| 3840x2160 Fire Strike Ultra Graphics | |
| NVIDIA GeForce RTX 4090 | |
| AMD Radeon RX 6950 XT | |
| NVIDIA GeForce RTX 3090 Ti | |
| AMD Radeon RX 6900 XT | |
| NVIDIA GeForce RTX 3090 | |
| NVIDIA GeForce RTX 3080 12 GB | |
| NVIDIA Titan RTX | |
| 1920x1080 Fire Strike Graphics | |
| NVIDIA GeForce RTX 4090 | |
| AMD Radeon RX 6950 XT | |
| NVIDIA GeForce RTX 3090 Ti | |
| AMD Radeon RX 6900 XT | |
| NVIDIA GeForce RTX 3090 | |
| NVIDIA GeForce RTX 3080 12 GB | |
| NVIDIA Titan RTX | |
| Unigine Superposition | |
| 7680x4320 8k Optimized | |
| NVIDIA GeForce RTX 4090 | |
| NVIDIA GeForce RTX 3090 Ti | |
| NVIDIA GeForce RTX 3090 | |
| AMD Radeon RX 6950 XT | |
| NVIDIA GeForce RTX 3080 12 GB | |
| AMD Radeon RX 6900 XT | |
| NVIDIA Titan RTX | |
| 3840x2160 4k Optimized | |
| NVIDIA GeForce RTX 4090 | |
| NVIDIA GeForce RTX 3090 Ti | |
| AMD Radeon RX 6950 XT | |
| NVIDIA GeForce RTX 3090 | |
| NVIDIA GeForce RTX 3080 12 GB | |
| AMD Radeon RX 6900 XT | |
| NVIDIA Titan RTX | |
| 1920x1080 1080p Extreme | |
| NVIDIA GeForce RTX 4090 | |
| NVIDIA GeForce RTX 3090 Ti | |
| AMD Radeon RX 6950 XT | |
| NVIDIA GeForce RTX 3090 | |
| NVIDIA GeForce RTX 3080 12 GB | |
| AMD Radeon RX 6900 XT | |
| NVIDIA Titan RTX | |
| 1920x1080 1080p High | |
| NVIDIA GeForce RTX 4090 | |
| NVIDIA GeForce RTX 3090 Ti | |
| AMD Radeon RX 6950 XT | |
| NVIDIA GeForce RTX 3090 | |
| AMD Radeon RX 6900 XT | |
| NVIDIA GeForce RTX 3080 12 GB | |
| NVIDIA Titan RTX | |
| 1280x720 720p Low | |
| NVIDIA GeForce RTX 4090 | |
| NVIDIA Titan RTX | |
| NVIDIA GeForce RTX 3090 | |
| NVIDIA GeForce RTX 3090 Ti | |
| NVIDIA GeForce RTX 3080 12 GB | |
| AMD Radeon RX 6900 XT | |
| AMD Radeon RX 6950 XT | |
| Unigine Heaven 4.0 | |
| Extreme Preset DX11 | |
| NVIDIA GeForce RTX 4090 | |
| NVIDIA GeForce RTX 3090 | |
| NVIDIA GeForce RTX 3090 Ti | |
| AMD Radeon RX 6950 XT | |
| NVIDIA GeForce RTX 3080 12 GB | |
| AMD Radeon RX 6900 XT | |
| NVIDIA Titan RTX | |
| Extreme Preset OpenGL | |
| NVIDIA GeForce RTX 4090 | |
| NVIDIA GeForce RTX 3090 Ti | |
| NVIDIA GeForce RTX 3090 | |
| NVIDIA GeForce RTX 3080 12 GB | |
| AMD Radeon RX 6950 XT | |
| NVIDIA Titan RTX | |
| AMD Radeon RX 6900 XT | |
| Unigine Valley 1.0 | |
| 1920x1080 Extreme HD DirectX AA:x8 | |
| NVIDIA GeForce RTX 4090 | |
| NVIDIA GeForce RTX 3090 | |
| AMD Radeon RX 6950 XT | |
| NVIDIA GeForce RTX 3080 12 GB | |
| NVIDIA GeForce RTX 3090 Ti | |
| AMD Radeon RX 6900 XT | |
| NVIDIA Titan RTX | |
| 1920x1080 Extreme HD Preset OpenGL AA:x8 | |
| NVIDIA GeForce RTX 4090 | |
| NVIDIA GeForce RTX 3090 Ti | |
| NVIDIA GeForce RTX 3090 | |
| NVIDIA GeForce RTX 3080 12 GB | |
| AMD Radeon RX 6950 XT | |
| AMD Radeon RX 6900 XT | |
| NVIDIA Titan RTX | |
| 3DMark 11 | |
| 1280x720 Performance GPU | |
| NVIDIA GeForce RTX 4090 | |
| AMD Radeon RX 6950 XT | |
| NVIDIA GeForce RTX 3090 Ti | |
| NVIDIA GeForce RTX 3090 | |
| AMD Radeon RX 6900 XT | |
| NVIDIA GeForce RTX 3080 12 GB | |
| NVIDIA Titan RTX | |
| 1280x720 Performance | |
| NVIDIA GeForce RTX 4090 | |
| NVIDIA GeForce RTX 3090 Ti | |
| NVIDIA GeForce RTX 3090 | |
| NVIDIA Titan RTX | |
| AMD Radeon RX 6950 XT | |
| AMD Radeon RX 6900 XT | |
| NVIDIA GeForce RTX 3080 12 GB | |
| ComputeMark v2.1 | |
| 1024x600 Normal, QJuliaRayTrace | |
| NVIDIA GeForce RTX 4090 | |
| NVIDIA GeForce RTX 3090 | |
| NVIDIA GeForce RTX 3080 12 GB | |
| AMD Radeon RX 6950 XT | |
| AMD Radeon RX 6900 XT | |
| NVIDIA Titan RTX | |
| 1024x600 Normal, Mandel Scalar | |
| NVIDIA GeForce RTX 4090 | |
| AMD Radeon RX 6950 XT | |
| NVIDIA GeForce RTX 3090 | |
| AMD Radeon RX 6900 XT | |
| NVIDIA GeForce RTX 3080 12 GB | |
| NVIDIA Titan RTX | |
| 1024x600 Normal, Mandel Vector | |
| NVIDIA GeForce RTX 4090 | |
| NVIDIA GeForce RTX 3090 | |
| AMD Radeon RX 6950 XT | |
| AMD Radeon RX 6900 XT | |
| NVIDIA GeForce RTX 3080 12 GB | |
| NVIDIA Titan RTX | |
| 1024x600 Normal, Fluid 2DTexArr | |
| NVIDIA GeForce RTX 4090 | |
| NVIDIA GeForce RTX 3090 | |
| AMD Radeon RX 6950 XT | |
| NVIDIA GeForce RTX 3080 12 GB | |
| AMD Radeon RX 6900 XT | |
| NVIDIA Titan RTX | |
| 1024x600 Normal, Fluid 3DTex | |
| NVIDIA GeForce RTX 4090 | |
| AMD Radeon RX 6950 XT | |
| NVIDIA GeForce RTX 3090 | |
| AMD Radeon RX 6900 XT | |
| NVIDIA GeForce RTX 3080 12 GB | |
| NVIDIA Titan RTX | |
| 1024x600 Normal, Score | |
| NVIDIA GeForce RTX 4090 | |
| NVIDIA GeForce RTX 3090 | |
| AMD Radeon RX 6950 XT | |
| NVIDIA GeForce RTX 3080 12 GB | |
| AMD Radeon RX 6900 XT | |
| NVIDIA Titan RTX | |
| LuxMark v2.0 64Bit | |
| Sala GPUs-only | |
| AMD Radeon RX 6950 XT | |
| AMD Radeon RX 6900 XT | |
| NVIDIA GeForce RTX 4090 | |
| NVIDIA GeForce RTX 3090 | |
| NVIDIA GeForce RTX 3080 12 GB | |
| NVIDIA Titan RTX | |
| Room GPUs-only | |
| NVIDIA GeForce RTX 4090 | |
| NVIDIA GeForce RTX 3090 | |
| NVIDIA GeForce RTX 3080 12 GB | |
| AMD Radeon RX 6950 XT | |
| AMD Radeon RX 6900 XT | |
| NVIDIA Titan RTX | |
Palit GeForce RTX 4090 GameRock OC with Ryzen 9 vs. Core i9
| Performance rating - Percent | |
| NVIDIA GeForce RTX 4090, AMD Ryzen 9 7950X | |
| NVIDIA GeForce RTX 4090, Intel Core i9-13900K | |
| 3DMark | |
| 2560x1440 Time Spy Graphics | |
| NVIDIA GeForce RTX 4090, Intel Core i9-13900K | |
| NVIDIA GeForce RTX 4090, AMD Ryzen 9 7950X | |
| Fire Strike Extreme Graphics | |
| NVIDIA GeForce RTX 4090, AMD Ryzen 9 7950X | |
| NVIDIA GeForce RTX 4090, Intel Core i9-13900K | |
| 3840x2160 Fire Strike Ultra Graphics | |
| NVIDIA GeForce RTX 4090, Intel Core i9-13900K | |
| NVIDIA GeForce RTX 4090, AMD Ryzen 9 7950X | |
| 1920x1080 Fire Strike Graphics | |
| NVIDIA GeForce RTX 4090, AMD Ryzen 9 7950X | |
| NVIDIA GeForce RTX 4090, Intel Core i9-13900K | |
| Unigine Superposition | |
| 7680x4320 8k Optimized | |
| NVIDIA GeForce RTX 4090, AMD Ryzen 9 7950X | |
| NVIDIA GeForce RTX 4090, Intel Core i9-13900K | |
| 3840x2160 4k Optimized | |
| NVIDIA GeForce RTX 4090, Intel Core i9-13900K | |
| NVIDIA GeForce RTX 4090, AMD Ryzen 9 7950X | |
| 1920x1080 1080p Extreme | |
| NVIDIA GeForce RTX 4090, Intel Core i9-13900K | |
| NVIDIA GeForce RTX 4090, AMD Ryzen 9 7950X | |
| 1920x1080 1080p High | |
| NVIDIA GeForce RTX 4090, Intel Core i9-13900K | |
| NVIDIA GeForce RTX 4090, AMD Ryzen 9 7950X | |
| 1280x720 720p Low | |
| NVIDIA GeForce RTX 4090, Intel Core i9-13900K | |
| NVIDIA GeForce RTX 4090, AMD Ryzen 9 7950X | |
| Unigine Heaven 4.0 | |
| Extreme Preset DX11 | |
| NVIDIA GeForce RTX 4090, AMD Ryzen 9 7950X | |
| NVIDIA GeForce RTX 4090, Intel Core i9-13900K | |
| Extreme Preset OpenGL | |
| NVIDIA GeForce RTX 4090, Intel Core i9-13900K | |
| NVIDIA GeForce RTX 4090, AMD Ryzen 9 7950X | |
| Unigine Valley 1.0 | |
| 1920x1080 Extreme HD DirectX AA:x8 | |
| NVIDIA GeForce RTX 4090, Intel Core i9-13900K | |
| NVIDIA GeForce RTX 4090, AMD Ryzen 9 7950X | |
| 1920x1080 Extreme HD Preset OpenGL AA:x8 | |
| NVIDIA GeForce RTX 4090, Intel Core i9-13900K | |
| NVIDIA GeForce RTX 4090, AMD Ryzen 9 7950X | |
| 3DMark 11 | |
| 1280x720 Performance GPU | |
| NVIDIA GeForce RTX 4090, AMD Ryzen 9 7950X | |
| NVIDIA GeForce RTX 4090, Intel Core i9-13900K | |
| 1280x720 Performance | |
| NVIDIA GeForce RTX 4090, AMD Ryzen 9 7950X | |
| NVIDIA GeForce RTX 4090, Intel Core i9-13900K | |
Compute Benchmarks and professional applications
| ComputeMark v2.1 | |
| 1024x600 Normal, QJuliaRayTrace | |
| NVIDIA GeForce RTX 4090 | |
| NVIDIA GeForce RTX 3090 | |
| NVIDIA GeForce RTX 3080 12 GB | |
| AMD Radeon RX 6950 XT | |
| AMD Radeon RX 6900 XT | |
| NVIDIA Titan RTX | |
| 1024x600 Normal, Mandel Scalar | |
| NVIDIA GeForce RTX 4090 | |
| AMD Radeon RX 6950 XT | |
| NVIDIA GeForce RTX 3090 | |
| AMD Radeon RX 6900 XT | |
| NVIDIA GeForce RTX 3080 12 GB | |
| NVIDIA Titan RTX | |
| 1024x600 Normal, Mandel Vector | |
| NVIDIA GeForce RTX 4090 | |
| NVIDIA GeForce RTX 3090 | |
| AMD Radeon RX 6950 XT | |
| AMD Radeon RX 6900 XT | |
| NVIDIA GeForce RTX 3080 12 GB | |
| NVIDIA Titan RTX | |
| 1024x600 Normal, Fluid 2DTexArr | |
| NVIDIA GeForce RTX 4090 | |
| NVIDIA GeForce RTX 3090 | |
| AMD Radeon RX 6950 XT | |
| NVIDIA GeForce RTX 3080 12 GB | |
| AMD Radeon RX 6900 XT | |
| NVIDIA Titan RTX | |
| 1024x600 Normal, Fluid 3DTex | |
| NVIDIA GeForce RTX 4090 | |
| AMD Radeon RX 6950 XT | |
| NVIDIA GeForce RTX 3090 | |
| AMD Radeon RX 6900 XT | |
| NVIDIA GeForce RTX 3080 12 GB | |
| NVIDIA Titan RTX | |
| 1024x600 Normal, Score | |
| NVIDIA GeForce RTX 4090 | |
| NVIDIA GeForce RTX 3090 | |
| AMD Radeon RX 6950 XT | |
| NVIDIA GeForce RTX 3080 12 GB | |
| AMD Radeon RX 6900 XT | |
| NVIDIA Titan RTX | |
| LuxMark v2.0 64Bit | |
| Sala GPUs-only | |
| AMD Radeon RX 6950 XT | |
| AMD Radeon RX 6900 XT | |
| NVIDIA GeForce RTX 4090 | |
| NVIDIA GeForce RTX 3090 | |
| NVIDIA GeForce RTX 3080 12 GB | |
| NVIDIA Titan RTX | |
| Room GPUs-only | |
| NVIDIA GeForce RTX 4090 | |
| NVIDIA GeForce RTX 3090 | |
| NVIDIA GeForce RTX 3080 12 GB | |
| AMD Radeon RX 6950 XT | |
| AMD Radeon RX 6900 XT | |
| NVIDIA Titan RTX | |
| Blender - v3.3 Classroom CUDA | |
| NVIDIA Titan RTX | |
| Geekbench 5.5 | |
| OpenCL Score | |
| NVIDIA GeForce RTX 4090 | |
| NVIDIA GeForce RTX 3090 Ti | |
| NVIDIA GeForce RTX 3090 | |
| NVIDIA GeForce RTX 3080 12 GB | |
| AMD Radeon RX 6950 XT | |
| AMD Radeon RX 6900 XT | |
| NVIDIA Titan RTX | |
| Vulkan Score 5.5 | |
| NVIDIA GeForce RTX 3090 Ti | |
| NVIDIA GeForce RTX 4090 | |
| NVIDIA Titan RTX | |
| NVIDIA GeForce RTX 3090 | |
| AMD Radeon RX 6900 XT | |
| AMD Radeon RX 6950 XT | |
| NVIDIA GeForce RTX 3080 12 GB | |
| V-Ray 5 Benchmark | |
| GPU CUDA | |
| NVIDIA GeForce RTX 4090 | |
| NVIDIA GeForce RTX 3090 | |
| NVIDIA GeForce RTX 3080 12 GB | |
| AMD Radeon RX 6950 XT | |
| GPU RTX | |
| NVIDIA GeForce RTX 4090 | |
| NVIDIA GeForce RTX 3090 | |
* ... Meglio usare valori piccoli
Parametri di gioco
Palit GeForce RTX 4090 GameRock OC si comporta molto bene non solo nei benchmark sintetici, ma anche nei test di gioco: guadagni del 50-60% sono un gioco da ragazzi per questo mostro di scheda grafica. Anche se AMD è molto indietro, la nuova AMD Radeon RX 7900 XTX è già ai blocchi di partenza.
Per un confronto equo, abbiamo anche testato la Palit GeForce RTX 4090 GameRock OC con l'Intel Core i9-13900K Intel Core i9-13900K. Qui è possibile estrarre un po' più di prestazioni dalla scheda grafica. Ancora una volta, questo conferma che il Core i9-13900K di Intel offre attualmente la soluzione di CPU da gioco più veloce. Le prestazioni in coppia con unAMD Ryzen 9 7950Xnon è niente da invidiare. Tuttavia, se l'obiettivo è spremere fino all'ultimo fotogramma al secondo dalla scheda grafica, al momento non c'è alternativa alla piattaforma Intel. Per l'enorme potenza della Palit GeForce RTX 4090 GameRock OC è necessario utilizzare uno schermo 4K. Anche a questa risoluzione elevata, a volte abbiamo raggiunto i limiti della CPU, rallentando in qualche modo la GPU. Attualmente ci sono solo pochi giochi, ad esempio Cyberpunk 2077, F1 2022 o The Quarry, che fanno sudare la GeForce RTX 4090 in 4K. Grazie a funzioni come il DLSS, questo problema può essere contrastato, in modo da ottenere frame rate a tre cifre anche in questo caso. Abbiamo determinato tutti i risultati dei benchmark utilizzando il DLSS di Nvidia.
Il nuovo DLSS 3.0, basato su DLSS 2.0 e ampliato con la funzionalità Frame Generation (FG), contribuisce drasticamente ad aumentare i frame rate. Il gioco più famoso che ne ha beneficiato è Cyberpunk 2077. Con la risoluzione 4K nativa e il Ray Tracing Ultra Preset, persino la RTX 4090 di GeForce si aggira su una media di soli 43 fotogrammi al secondo. Attivando il DLSS è possibile raggiungere oltre 100 fotogrammi al secondo, triplicando quasi le prestazioni. DLSS 3.0 si basa sul Tensor Core di quarta generazione, attualmente utilizzato solo nella serie RTX 4000. Un elenco di giochi che supportano già il DLSS 3.0 o che saranno supportati in futuro con questa funzione è disponibile qui:
| GTA V - 3840x2160 High/On (Advanced Graphics Off) AA:FX AF:8x | |
| NVIDIA GeForce RTX 4090, AMD Ryzen 9 7950X | |
| NVIDIA GeForce RTX 3090 Ti, AMD Ryzen 7 5800X3D | |
| NVIDIA GeForce RTX 3090, AMD Ryzen 9 7950X | |
| AMD Radeon RX 6950 XT, AMD Ryzen 9 5900X | |
| NVIDIA GeForce RTX 3080 12 GB, AMD Ryzen 9 5900X | |
| NVIDIA Titan RTX, AMD Ryzen 9 7950X | |
| The Witcher 3 - 3840x2160 High Graphics & Postprocessing (Nvidia HairWorks Off) | |
| NVIDIA GeForce RTX 4090, AMD Ryzen 9 7950X | |
| NVIDIA GeForce RTX 3090 Ti, AMD Ryzen 7 5800X3D | |
| NVIDIA GeForce RTX 3090, AMD Ryzen 9 7950X | |
| AMD Radeon RX 6950 XT, AMD Ryzen 9 5900X | |
| NVIDIA GeForce RTX 3080 12 GB, AMD Ryzen 9 5900X | |
| AMD Radeon RX 6900 XT, AMD Ryzen 9 5950X | |
| NVIDIA Titan RTX, AMD Ryzen 9 7950X | |
| Final Fantasy XV Benchmark - 3840x2160 High Quality | |
| NVIDIA GeForce RTX 4090, AMD Ryzen 9 7950X | |
| NVIDIA GeForce RTX 3090 Ti, AMD Ryzen 7 5800X3D | |
| NVIDIA GeForce RTX 3090, AMD Ryzen 9 7950X | |
| AMD Radeon RX 6950 XT, AMD Ryzen 9 5900X | |
| NVIDIA GeForce RTX 3080 12 GB, AMD Ryzen 9 5900X | |
| NVIDIA Titan RTX, AMD Ryzen 9 7950X | |
| Strange Brigade - 3840x2160 ultra AA:ultra AF:16 | |
| NVIDIA GeForce RTX 4090, AMD Ryzen 9 7950X | |
| AMD Radeon RX 6950 XT, AMD Ryzen 9 5900X | |
| NVIDIA GeForce RTX 3090, AMD Ryzen 9 7950X | |
| NVIDIA GeForce RTX 3080 12 GB, AMD Ryzen 9 5900X | |
| NVIDIA Titan RTX, AMD Ryzen 9 7950X | |
| Far Cry 5 - 3840x2160 Ultra Preset AA:T | |
| NVIDIA GeForce RTX 4090, AMD Ryzen 9 7950X | |
| AMD Radeon RX 6950 XT, AMD Ryzen 9 5900X | |
| NVIDIA GeForce RTX 3090, AMD Ryzen 9 7950X | |
| NVIDIA GeForce RTX 3080 12 GB, AMD Ryzen 9 5900X | |
| NVIDIA Titan RTX, AMD Ryzen 9 7950X | |
| Far Cry New Dawn - 3840x2160 Ultra Preset | |
| NVIDIA GeForce RTX 4090, AMD Ryzen 9 7950X | |
| AMD Radeon RX 6950 XT, AMD Ryzen 9 5900X | |
| NVIDIA GeForce RTX 3090, AMD Ryzen 9 7950X | |
| AMD Radeon RX 6900 XT, AMD Ryzen 9 5950X | |
| NVIDIA GeForce RTX 3080 12 GB, AMD Ryzen 9 5900X | |
| NVIDIA Titan RTX, AMD Ryzen 9 7950X | |
| Far Cry 6 - 3840x2160 Ultra Graphics Quality + HD Textures AA:T | |
| NVIDIA GeForce RTX 4090, AMD Ryzen 9 7950X | |
| NVIDIA GeForce RTX 3090 Ti, AMD Ryzen 7 5800X3D | |
| AMD Radeon RX 6950 XT, AMD Ryzen 9 5900X | |
| NVIDIA GeForce RTX 3090, AMD Ryzen 9 7950X | |
| NVIDIA Titan RTX, AMD Ryzen 9 7950X | |
| NVIDIA GeForce RTX 3080 12 GB, AMD Ryzen 9 5900X | |
| Metro Exodus - 3840x2160 Ultra Quality AF:16x | |
| NVIDIA GeForce RTX 4090, AMD Ryzen 9 7950X | |
| NVIDIA GeForce RTX 3090 Ti, AMD Ryzen 7 5800X3D | |
| NVIDIA GeForce RTX 3090, AMD Ryzen 9 7950X | |
| AMD Radeon RX 6950 XT, AMD Ryzen 9 5900X | |
| AMD Radeon RX 6900 XT, AMD Ryzen 9 5950X | |
| NVIDIA GeForce RTX 3080 12 GB, AMD Ryzen 9 5900X | |
| NVIDIA Titan RTX, AMD Ryzen 9 7950X | |
| F1 2020 - 3840x2160 Ultra High Preset AA:T AF:16x | |
| NVIDIA GeForce RTX 4090, AMD Ryzen 9 7950X | |
| AMD Radeon RX 6950 XT, AMD Ryzen 9 5900X | |
| NVIDIA GeForce RTX 3090, AMD Ryzen 9 7950X | |
| AMD Radeon RX 6900 XT, AMD Ryzen 9 5950X | |
| AMD Radeon RX 6900 XT, AMD Ryzen 9 5950X | |
| NVIDIA GeForce RTX 3080 12 GB, AMD Ryzen 9 5900X | |
| NVIDIA Titan RTX, AMD Ryzen 9 7950X | |
| F1 2021 - 3840x2160 Ultra High Preset + Raytracing AA:T AF:16x | |
| NVIDIA GeForce RTX 4090, AMD Ryzen 9 7950X | |
| NVIDIA GeForce RTX 3090 Ti, AMD Ryzen 7 5800X3D | |
| NVIDIA GeForce RTX 3090, AMD Ryzen 9 7950X | |
| AMD Radeon RX 6950 XT, AMD Ryzen 9 5900X | |
| NVIDIA GeForce RTX 3080 12 GB, AMD Ryzen 9 5900X | |
| NVIDIA Titan RTX, AMD Ryzen 9 7950X | |
| F1 22 - 3840x2160 Ultra High Preset AA:T AF:16x | |
| NVIDIA GeForce RTX 4090, AMD Ryzen 9 7950X | |
| NVIDIA GeForce RTX 3090, AMD Ryzen 9 7950X | |
| AMD Radeon RX 6950 XT, AMD Ryzen 9 5900X | |
| NVIDIA Titan RTX, AMD Ryzen 9 7950X | |
| Borderlands 3 - 3840x2160 Badass Overall Quality (DX11) | |
| NVIDIA GeForce RTX 4090, AMD Ryzen 9 7950X | |
| NVIDIA GeForce RTX 3090 Ti, AMD Ryzen 7 5800X3D | |
| NVIDIA GeForce RTX 3090, AMD Ryzen 9 7950X | |
| NVIDIA GeForce RTX 3080 12 GB, AMD Ryzen 9 5900X | |
| AMD Radeon RX 6950 XT, AMD Ryzen 9 5900X | |
| AMD Radeon RX 6900 XT, AMD Ryzen 9 5950X | |
| AMD Radeon RX 6900 XT, AMD Ryzen 9 5950X | |
| NVIDIA Titan RTX, AMD Ryzen 9 7950X | |
| Cyberpunk 2077 1.6 - 3840x2160 Ultra Preset | |
| NVIDIA GeForce RTX 4090, AMD Ryzen 9 7950X | |
| NVIDIA GeForce RTX 3090 Ti, AMD Ryzen 7 5800X3D | |
| AMD Radeon RX 6950 XT, AMD Ryzen 9 5900X | |
Palit GeForce RTX 4090 GameRock OC with Ryzen 9 vs. Core i9
| Performance rating - Percent | |
| Palit GeForce RTX 4090 GameRock OC -1! | |
| Palit GeForce RTX 4090 GameRock OC | |
| GTA V - 3840x2160 Highest AA:4xMSAA + FX AF:16x | |
| Palit GeForce RTX 4090 GameRock OC | |
| Palit GeForce RTX 4090 GameRock OC | |
| The Witcher 3 - 3840x2160 Ultra Graphics & Postprocessing (HBAO+) | |
| Palit GeForce RTX 4090 GameRock OC | |
| Palit GeForce RTX 4090 GameRock OC | |
| Dota 2 Reborn - 3840x2160 ultra (3/3) best looking | |
| Palit GeForce RTX 4090 GameRock OC | |
| Palit GeForce RTX 4090 GameRock OC | |
| Final Fantasy XV Benchmark - 3840x2160 High Quality | |
| Palit GeForce RTX 4090 GameRock OC | |
| Palit GeForce RTX 4090 GameRock OC | |
| X-Plane 11.11 - 3840x2160 high (fps_test=3) | |
| Palit GeForce RTX 4090 GameRock OC | |
| Palit GeForce RTX 4090 GameRock OC | |
| Shadow of the Tomb Raider - 3840x2160 Highest Preset AA:T | |
| Palit GeForce RTX 4090 GameRock OC | |
| Palit GeForce RTX 4090 GameRock OC | |
| Far Cry 5 - 3840x2160 Ultra Preset AA:T | |
| Palit GeForce RTX 4090 GameRock OC | |
| Palit GeForce RTX 4090 GameRock OC | |
| Far Cry New Dawn - 3840x2160 Ultra Preset | |
| Palit GeForce RTX 4090 GameRock OC | |
| Palit GeForce RTX 4090 GameRock OC | |
| Far Cry 6 - 3840x2160 Ultra Graphics Quality + HD Textures AA:T | |
| Palit GeForce RTX 4090 GameRock OC | |
| Palit GeForce RTX 4090 GameRock OC | |
| GRID Legends - 3840x2160 Ultra Preset | |
| Palit GeForce RTX 4090 GameRock OC | |
| Palit GeForce RTX 4090 GameRock OC | |
| Metro Exodus - 3840x2160 Ultra Quality AF:16x | |
| Palit GeForce RTX 4090 GameRock OC | |
| Palit GeForce RTX 4090 GameRock OC | |
| Forza Horizon 5 - 3840x2160 Extreme Preset | |
| Palit GeForce RTX 4090 GameRock OC | |
| F1 2020 - 3840x2160 Ultra High Preset AA:T AF:16x | |
| Palit GeForce RTX 4090 GameRock OC | |
| Palit GeForce RTX 4090 GameRock OC | |
| F1 2021 - 3840x2160 Ultra High Preset + Raytracing AA:T AF:16x | |
| Palit GeForce RTX 4090 GameRock OC | |
| Palit GeForce RTX 4090 GameRock OC | |
| F1 22 - 3840x2160 Ultra High Preset AA:T AF:16x | |
| Palit GeForce RTX 4090 GameRock OC | |
| Palit GeForce RTX 4090 GameRock OC | |
| Borderlands 3 - 3840x2160 Badass Overall Quality (DX11) | |
| Palit GeForce RTX 4090 GameRock OC | |
| Palit GeForce RTX 4090 GameRock OC | |
| Tiny Tina's Wonderlands - 3840x2160 Badass Preset (DX12) | |
| Palit GeForce RTX 4090 GameRock OC | |
| Palit GeForce RTX 4090 GameRock OC | |
| God of War - 3840x2160 Ultra Preset | |
| Palit GeForce RTX 4090 GameRock OC | |
| Palit GeForce RTX 4090 GameRock OC | |
| The Quarry - 3840x2160 Ultra Preset | |
| Palit GeForce RTX 4090 GameRock OC | |
| Palit GeForce RTX 4090 GameRock OC | |
| Cyberpunk 2077 1.6 | |
| 3840x2160 Ray Tracing Ultra Preset (DLSS off) | |
| Palit GeForce RTX 4090 GameRock OC | |
| Palit GeForce RTX 4090 GameRock OC | |
| 3840x2160 Ultra Preset | |
| Palit GeForce RTX 4090 GameRock OC | |
| Palit GeForce RTX 4090 GameRock OC | |
| basso | medio | alto | ultra | QHD | 4K DLSS | 4K | |
|---|---|---|---|---|---|---|---|
| GTA V (2015) | 188.2 | 187.9 | 187.4 | 162 | 164.8 | 187.5 | |
| The Witcher 3 (2015) | 826 | 747 | 642 | 320 | 284 | ||
| Dota 2 Reborn (2015) | 310.6 | 276 | 262.9 | 239.2 | 234.4 | ||
| Rise of the Tomb Raider (2016) | 494 | 403 | 379 | 378 | 239 | ||
| Final Fantasy XV Benchmark (2018) | 236 | 233 | 233 | 225 | 161.1 | ||
| X-Plane 11.11 (2018) | 223 | 196.3 | 151.6 | 124.5 | |||
| Far Cry 5 (2018) | 238 | 209 | 200 | 188 | 185 | 175 | |
| Strange Brigade (2018) | 698 | 575 | 570 | 565 | 512 | 281 | |
| Shadow of the Tomb Raider (2018) | 332 | 325 | 323 | 304 | 279 | 186 | |
| Far Cry New Dawn (2019) | 200 | 177 | 171 | 154 | 152 | 145 | |
| Metro Exodus (2019) | 300 | 265 | 234 | 201 | 185.8 | 139.7 | |
| Anno 1800 (2019) | 211 | 199.3 | 143.1 | 73.6 | 72.8 | 66.9 | |
| Control (2019) | 240 | 240 | 240 | 219 | 113.3 | ||
| Borderlands 3 (2019) | 242 | 216 | 200 | 186.8 | 186 | 135 | |
| F1 2020 (2020) | 563 | 475 | 471 | 412 | 407 | 286 | |
| Crysis Remastered (2020) | 491 | 446 | 327 | 284 | 231 | 147.3 | |
| Mafia Definitive Edition (2020) | 292 | 266 | 237 | 226 | 162.7 | ||
| Watch Dogs Legion (2020) | 184.6 | 178.7 | 160.3 | 149.7 | 146.5 | 116.7 | |
| Dirt 5 (2020) | 385.7 | 356.1 | 333.8 | 325.7 | 287.4 | 190.4 | |
| F1 2021 (2021) | 677 | 642 | 529 | 271 | 263 | 199.1 | |
| New World (2021) | 215 | 188 | 183.5 | 175.3 | 174.8 | 149.3 | |
| Far Cry 6 (2021) | 209 | 189.4 | 169.5 | 173.9 | 168.4 | 136.9 | |
| Riders Republic (2021) | 318 | 309 | 292 | 279 | 229 | 149 | |
| Forza Horizon 5 (2021) | 411 | 302 | 283 | 208 | 197 | 162 | |
| God of War (2022) | 278 | 276 | 269 | 212 | 179.5 | 130.1 | |
| GRID Legends (2022) | 330 | 297 | 262 | 252 | 244 | 201 | |
| Cyberpunk 2077 1.6 (2022) | 229 | 225 | 215 | 207 | 149.6 | 78 | |
| Ghostwire Tokyo (2022) | 284 | 281 | 280 | 277 | 277 | 163.4 | |
| Tiny Tina's Wonderlands (2022) | 428 | 354 | 311 | 289 | 229 | 130.3 | |
| Vampire Bloodhunt (2022) | 460 | 398 | 394 | 382 | 374 | 254 | |
| F1 22 (2022) | 443 | 414 | 414 | 194.5 | 157.5 | 82.5 | |
| The Quarry (2022) | 427 | 337 | 290 | 256 | 193.8 | 75.4 | |
| FIFA 23 (2022) | 276 | 273 | 270 | 267 | 248 | 245 | |
| A Plague Tale Requiem (2022) | 179.6 | 173.6 | 167.9 | 154.3 | 125.8 | 73.7 | |
| Uncharted Legacy of Thieves Collection (2022) | 146.3 | 145.5 | 144.5 | 143.7 | 143.6 | 100.7 | |
| Call of Duty Modern Warfare 2 2022 (2022) | 304 | 287 | 245 | 240 | 191 | 183 | 128 |
| Spider-Man Miles Morales (2022) | 208 | 198.9 | 174.5 | 175.4 | 174.4 | 130.8 | |
| The Callisto Protocol (2022) | 229 | 222 | 202 | 201 | 183 | 127 | |
| Need for Speed Unbound (2022) | 178.2 | 171.1 | 154.3 | 153.7 | 152.8 | 146.3 | |
| High On Life (2023) | 388 | 357 | 307 | 293 | 224 | 106.6 | |
| The Witcher 3 v4 (2023) | 289 | 255 | 229 | 212 | 212 | 164.2 | |
| Dead Space Remake (2023) | 266 | 265 | 246 | 248 | 199.7 | 106.5 | |
| Hogwarts Legacy (2023) | 162.1 | 142.9 | 129.6 | 121.5 | 120.3 | 86 | |
| Returnal (2023) | 214 | 212 | 208 | 201 | 174 | 109 | |
| Atomic Heart (2023) | 316 | 251 | 234 | 223 | 181.6 | 110.9 | |
| Company of Heroes 3 (2023) | 383.1 | 364 | 344.8 | 330.8 | 302.8 | 205.7 | |
| Sons of the Forest (2023) | 133.3 | 126.3 | 122.3 | 120.7 | 118 | 114.2 | |
| Resident Evil 4 Remake (2023) | 287 | 303 | 294 | 213 | 188.9 | 121.8 | |
| The Last of Us (2023) | 169.6 | 163.2 | 163 | 162.8 | 136.9 | 118.1 | 77.4 |
| Dead Island 2 (2023) | 326 | 312 | 280 | 250 | 261 | 165.1 | |
| Star Wars Jedi Survivor (2023) | 170.6 | 166.3 | 160 | 155.4 | 150.3 | 80.4 | |
| Diablo 4 (2023) | 398 | 399 | 399 | 398 | 392 | 239 | 220 |
| F1 23 (2023) | 476 | 509 | 472 | 210 | 154 | 134 | 79.6 |
| Ratchet & Clank Rift Apart (2023) | 231 | 217 | 184.7 | 153.5 | 147.1 | 108.8 | |
| Atlas Fallen (2023) | 194.9 | 192.5 | 187 | 185.4 | 184.2 | 168.4 | |
| Immortals of Aveum (2023) | 155.6 | 138.2 | 124.4 | 97.3 | 126.1 | 62.6 | |
| Armored Core 6 (2023) | 119.7 | 119.6 | 119.8 | 119.5 | 119.5 | 119.3 | |
| Starfield (2023) | 138.9 | 139.2 | 130 | 124.5 | 78.1 | ||
| Lies of P (2023) | 330 | 327 | 303 | 286 | 264 | 237 | 166.7 |
| Baldur's Gate 3 (2023) | 323 | 299 | 274 | 265 | 203 | 189.4 | 112.6 |
| Counter-Strike 2 (2023) | 351 | 340 | 339 | 340 | 312 | 202 | |
| EA Sports FC 24 (2023) | 382 | 323 | 266 | 264 | 263 | 254 | |
| Assassin's Creed Mirage (2023) | 247 | 240 | 230 | 170 | 162 | 144 | 126 |
| Total War Pharaoh (2023) | 565.7 | 348.2 | 231.3 | 187.1 | 186.2 | 158.2 | |
| Lords of the Fallen (2023) | 181.7 | 174.2 | 155 | 116 | 88.6 | 88.6 | 53.2 |
| Alan Wake 2 (2023) | 152.4 | 149.3 | 144.4 | 126.7 | 58.7 | 72.2 | |
| EA Sports WRC (2023) | 255 | 170.6 | 157.8 | 152.6 | 147.4 | 139.6 | 121 |
| Call of Duty Modern Warfare 3 2023 (2023) | 330 | 306 | 265 | 254 | 199 | 129 | |
| Avatar Frontiers of Pandora (2023) | 251 | 234 | 209 | 170 | 124 | 113 | 69 |
| The Finals (2023) | 332 | 309 | 295 | 300 | 256 | 209 | 139.2 |
| Ready or Not (2023) | 336 | 356 | 336 | 323 | 263 | 243 | 132.4 |
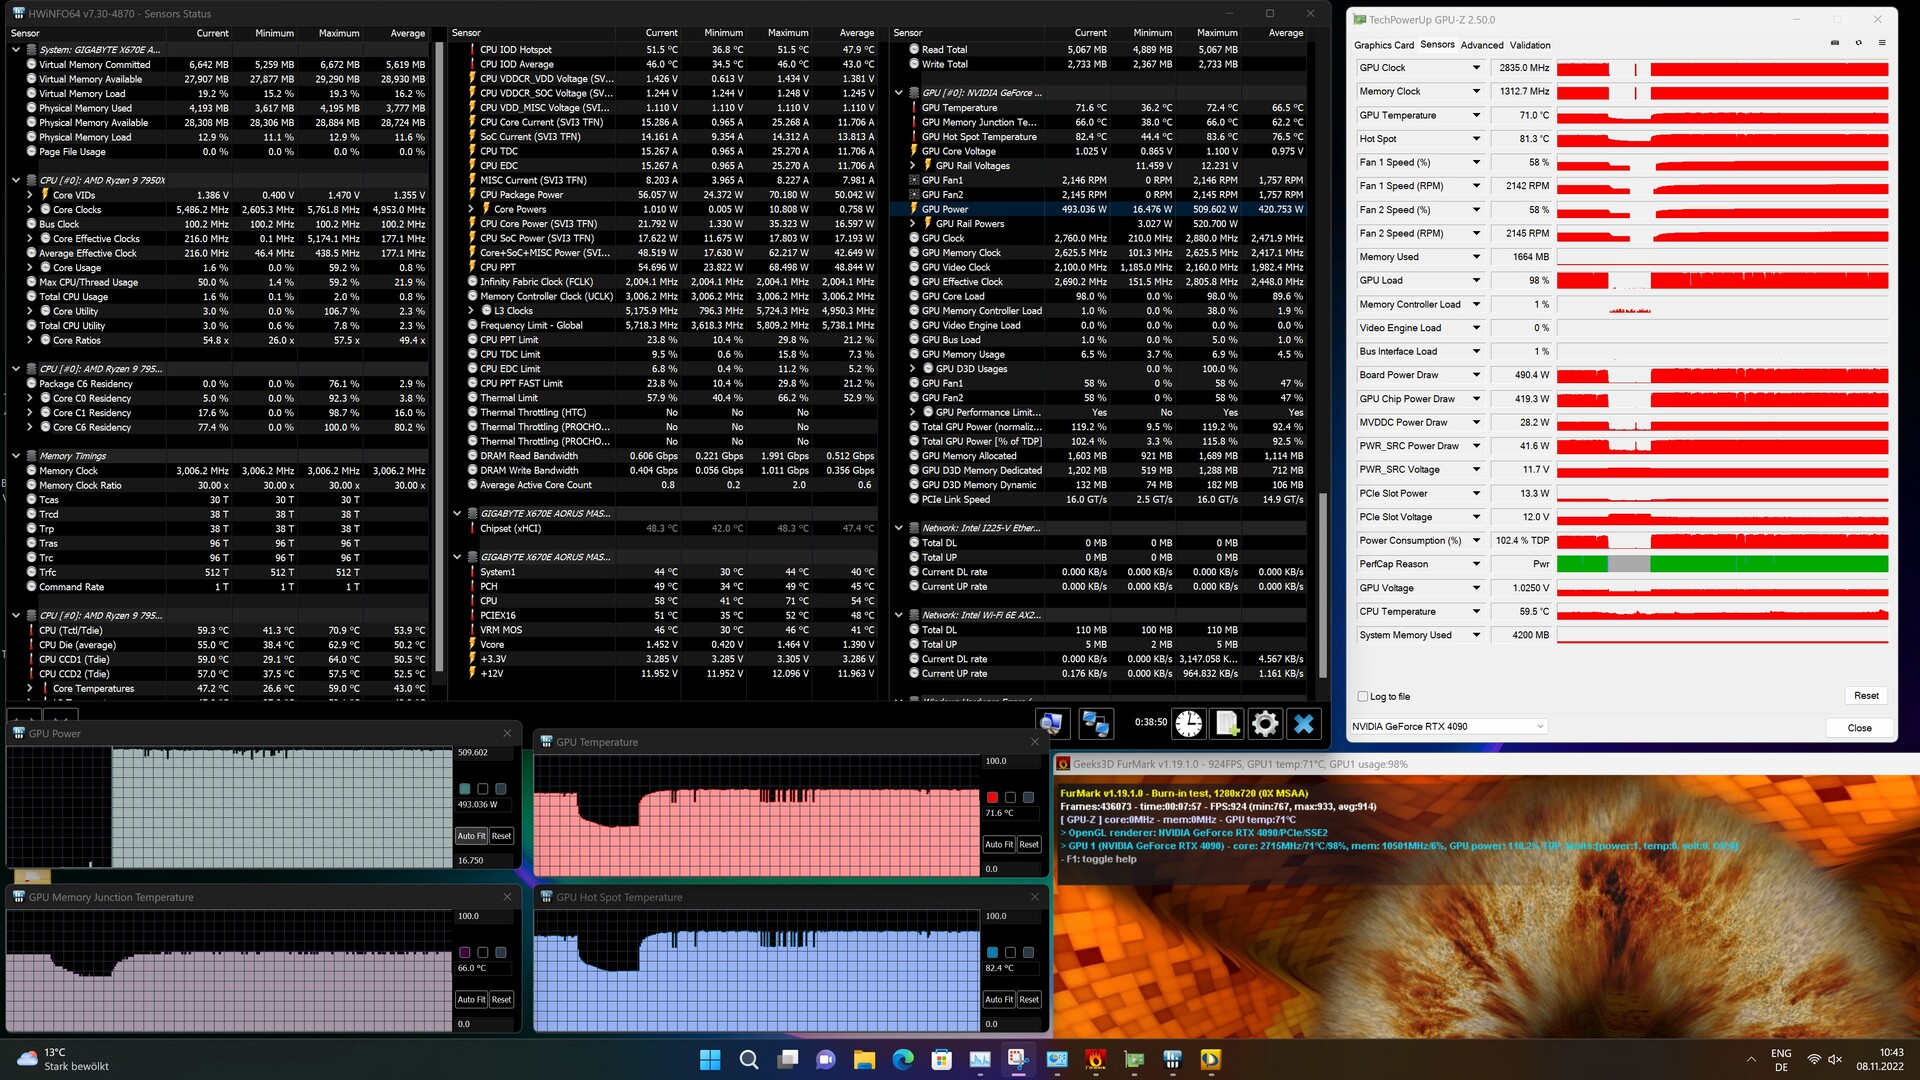
Palit GeForce RTX 4090 GameRock OC Emissions
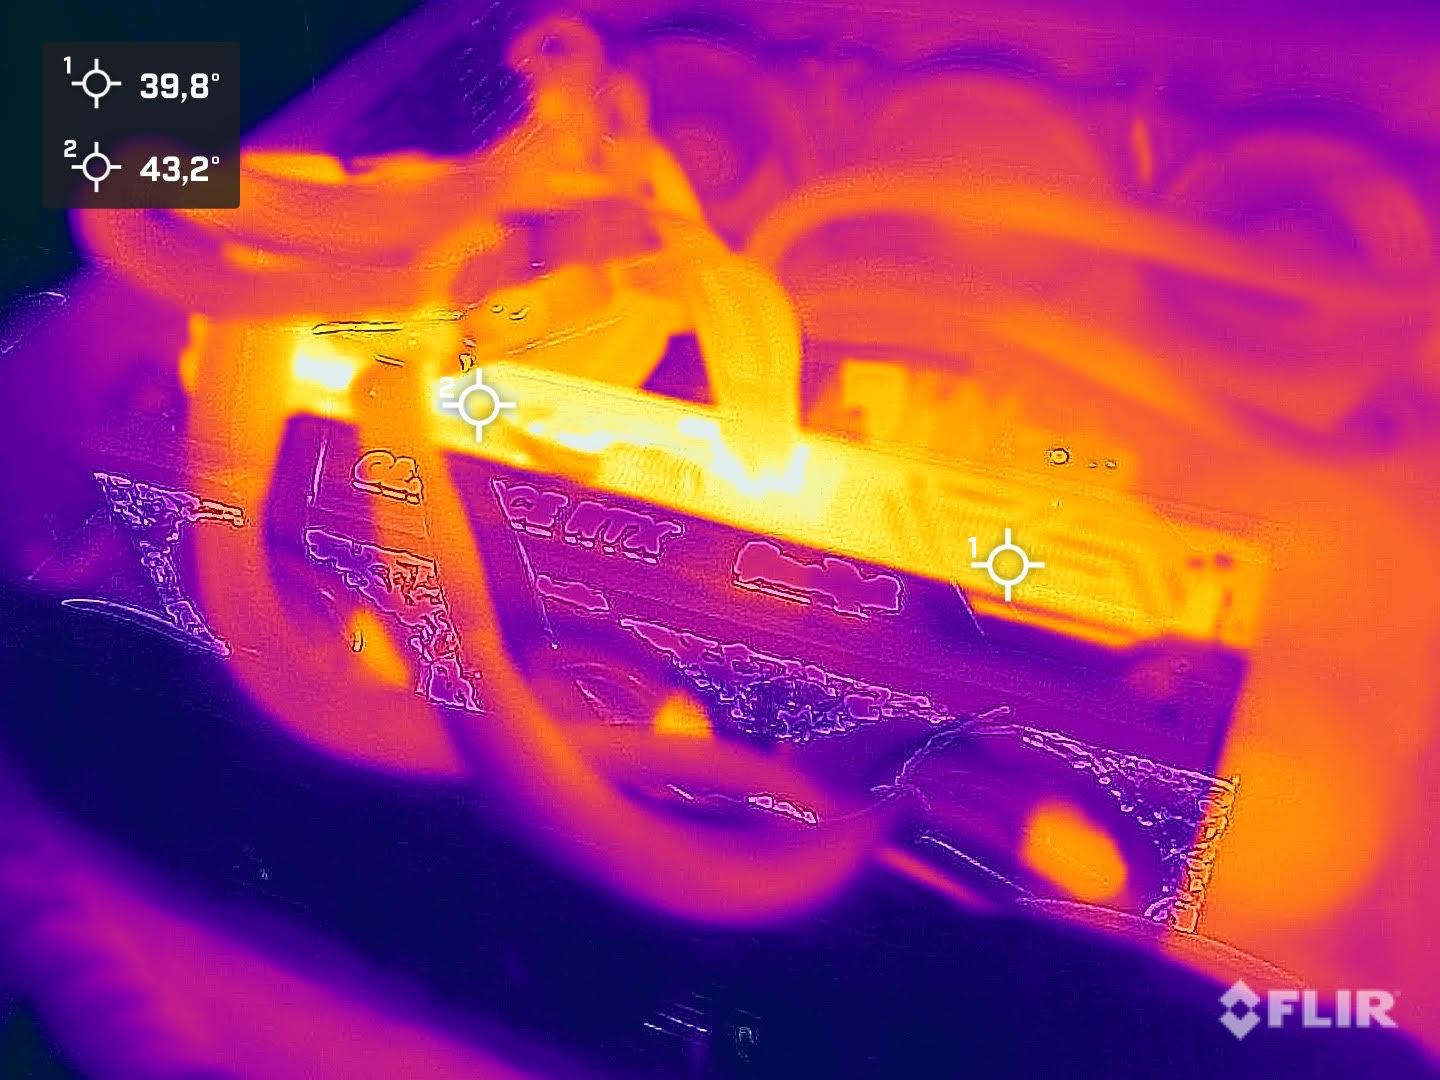
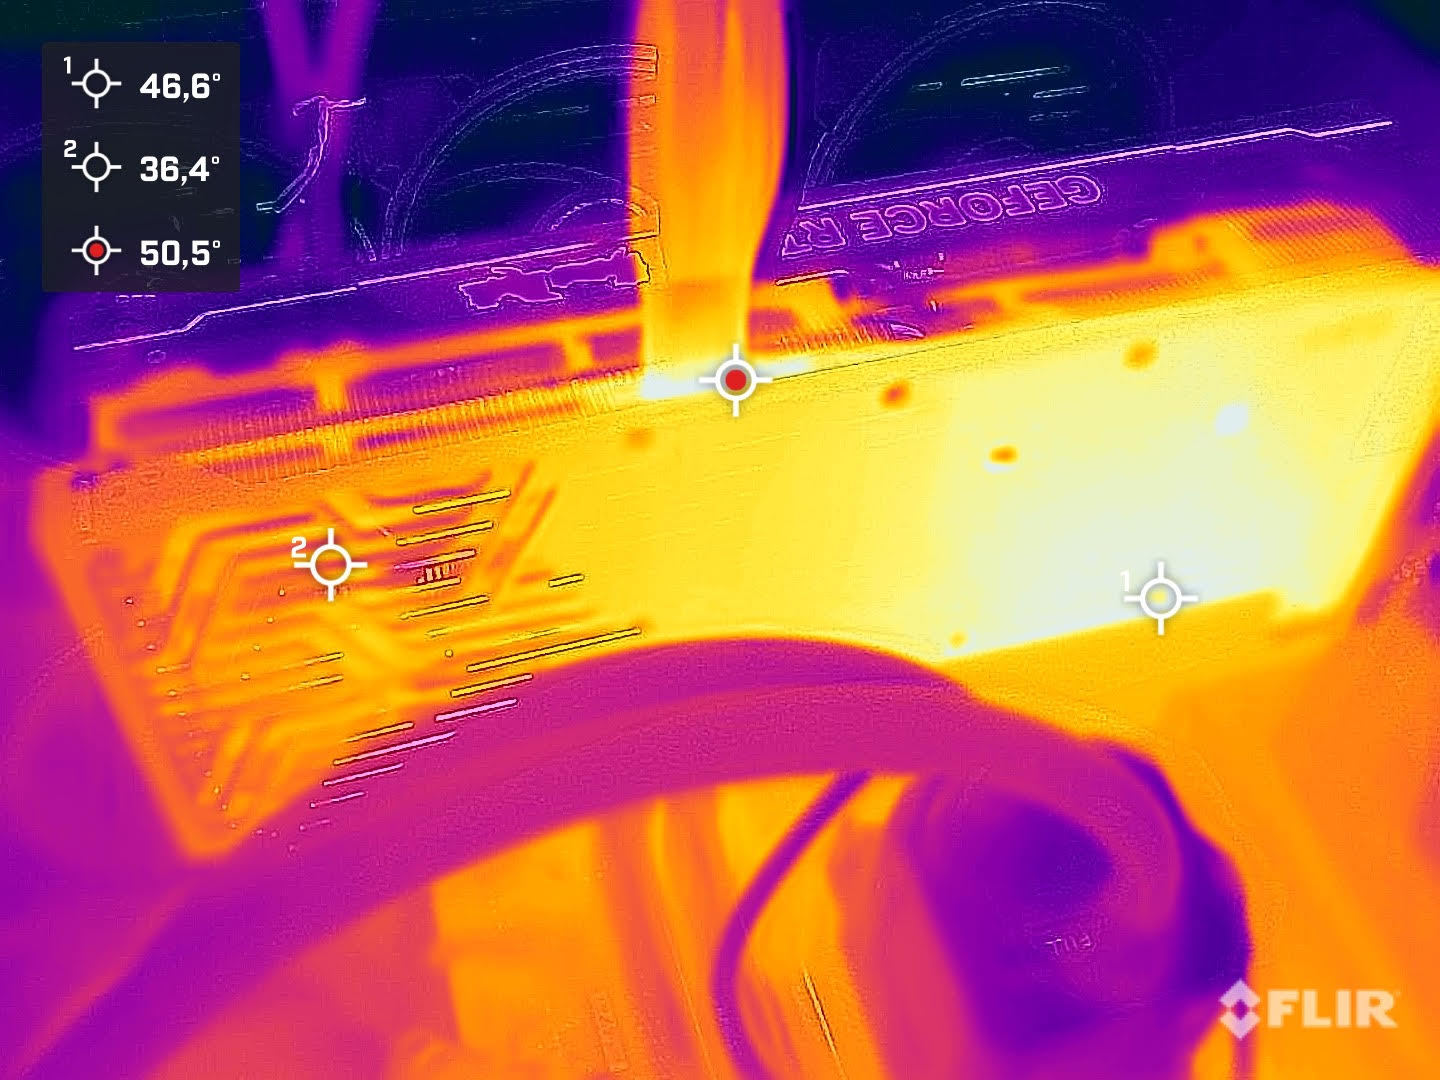
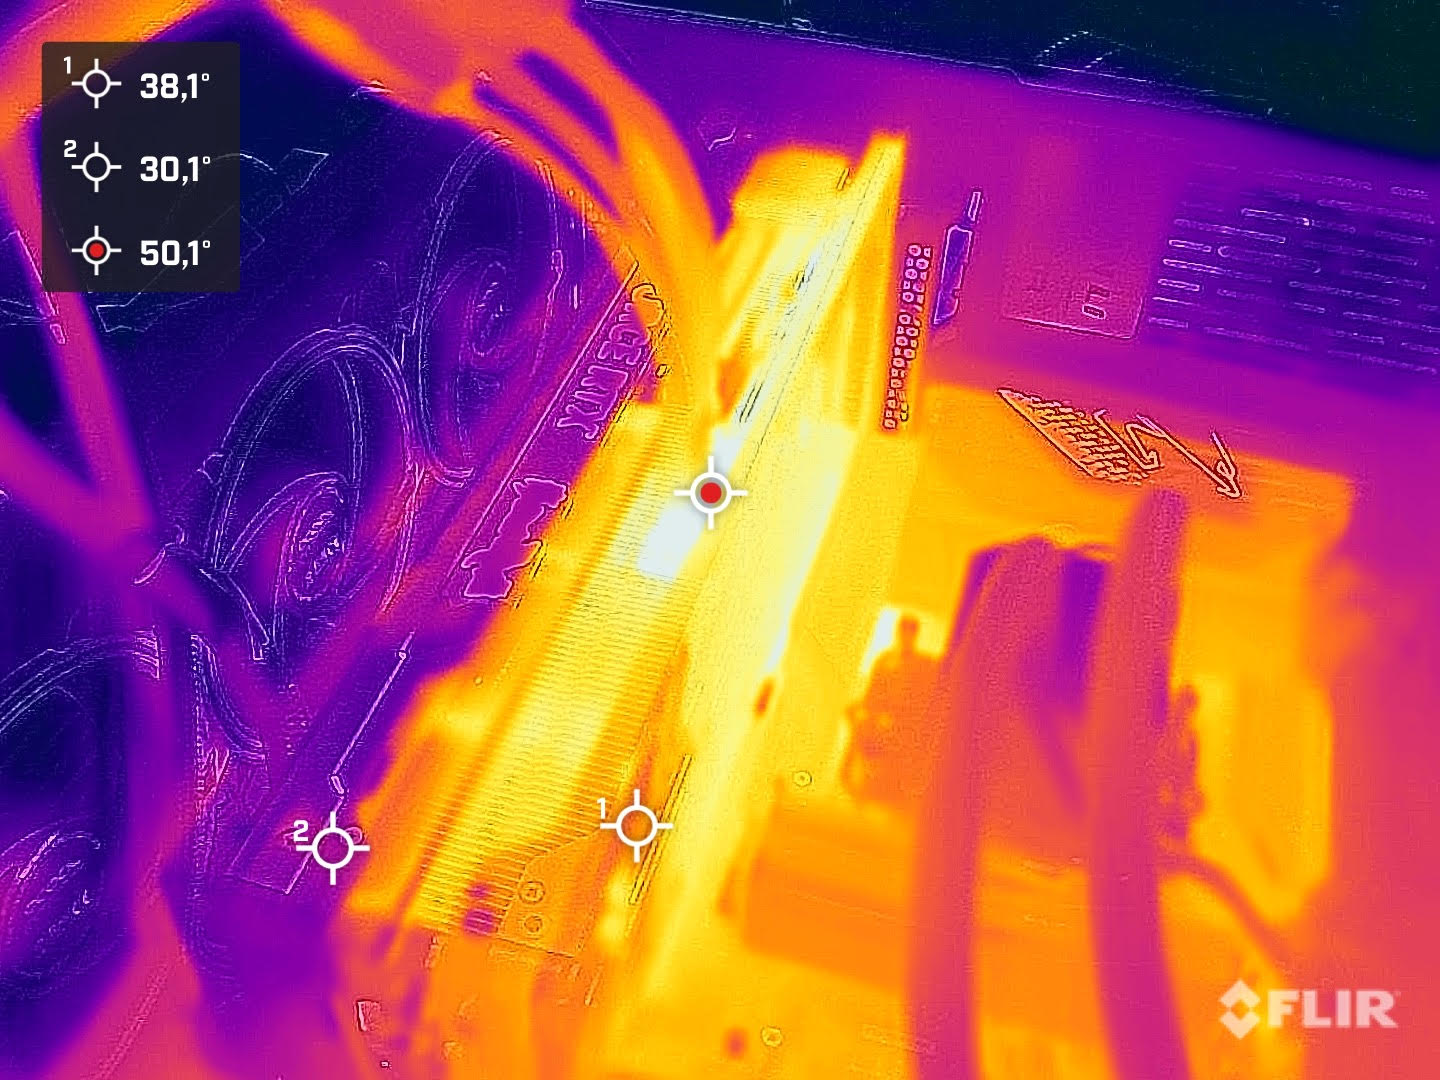
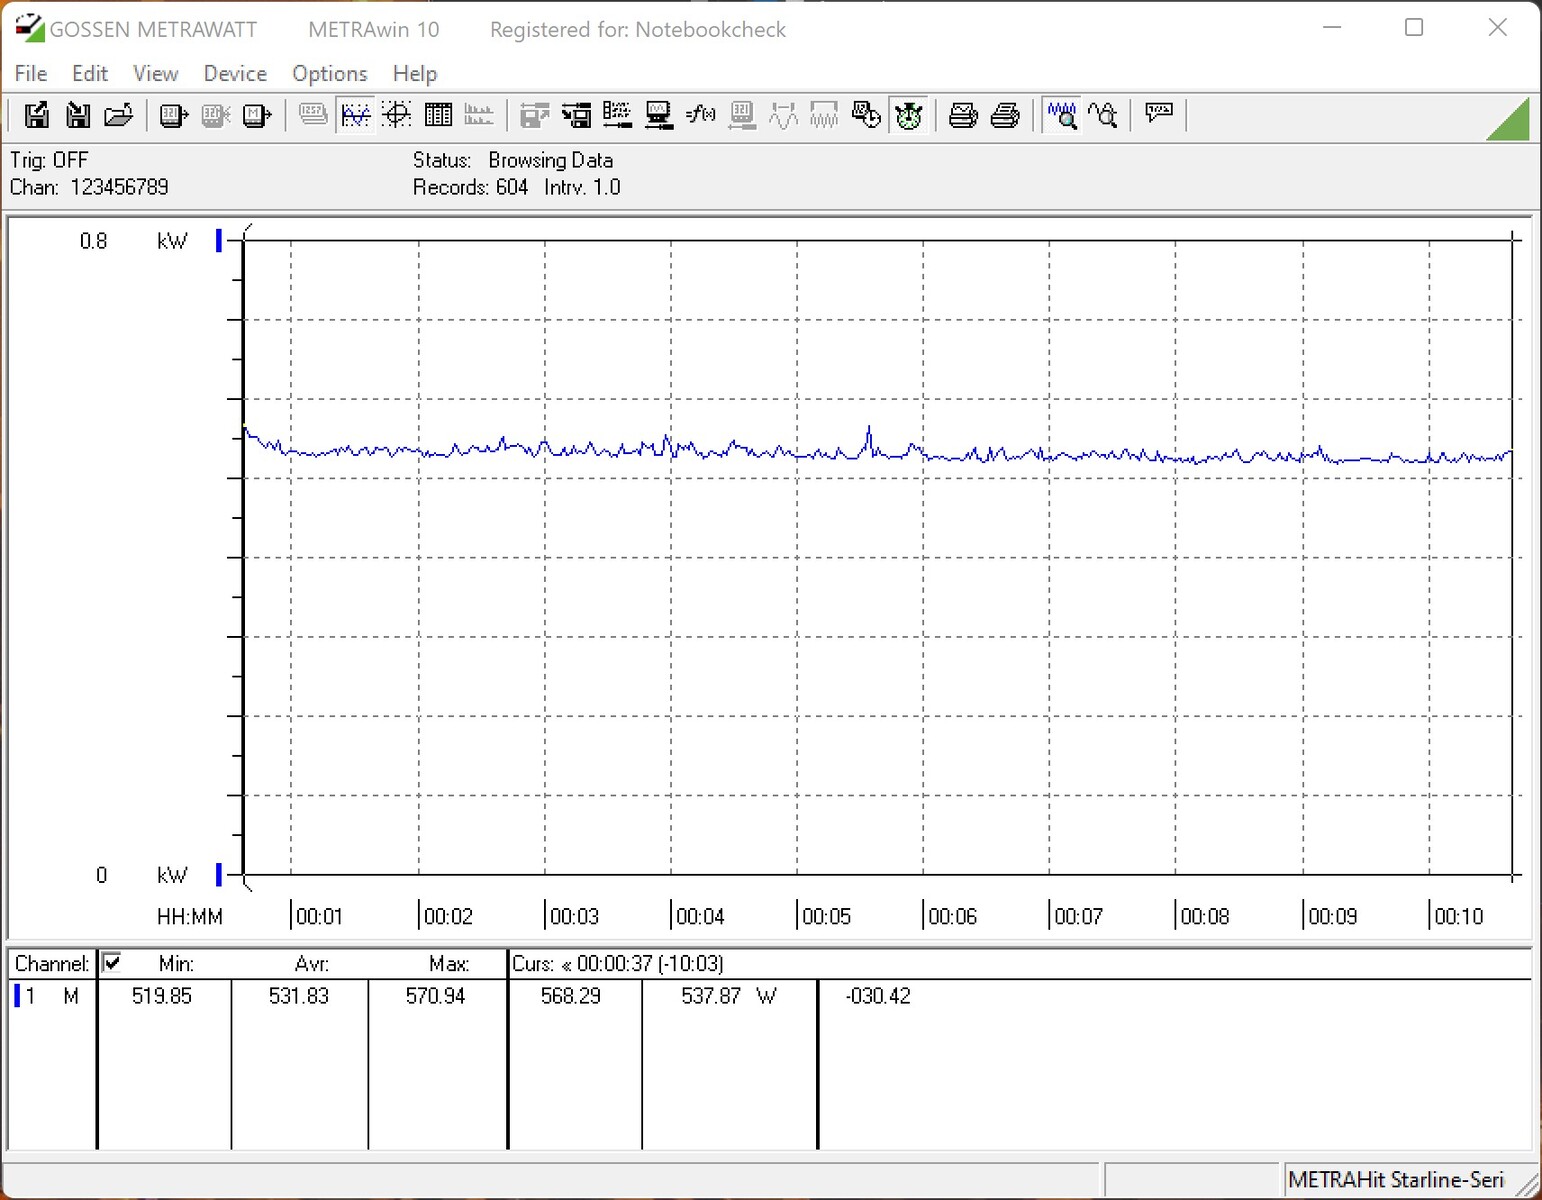
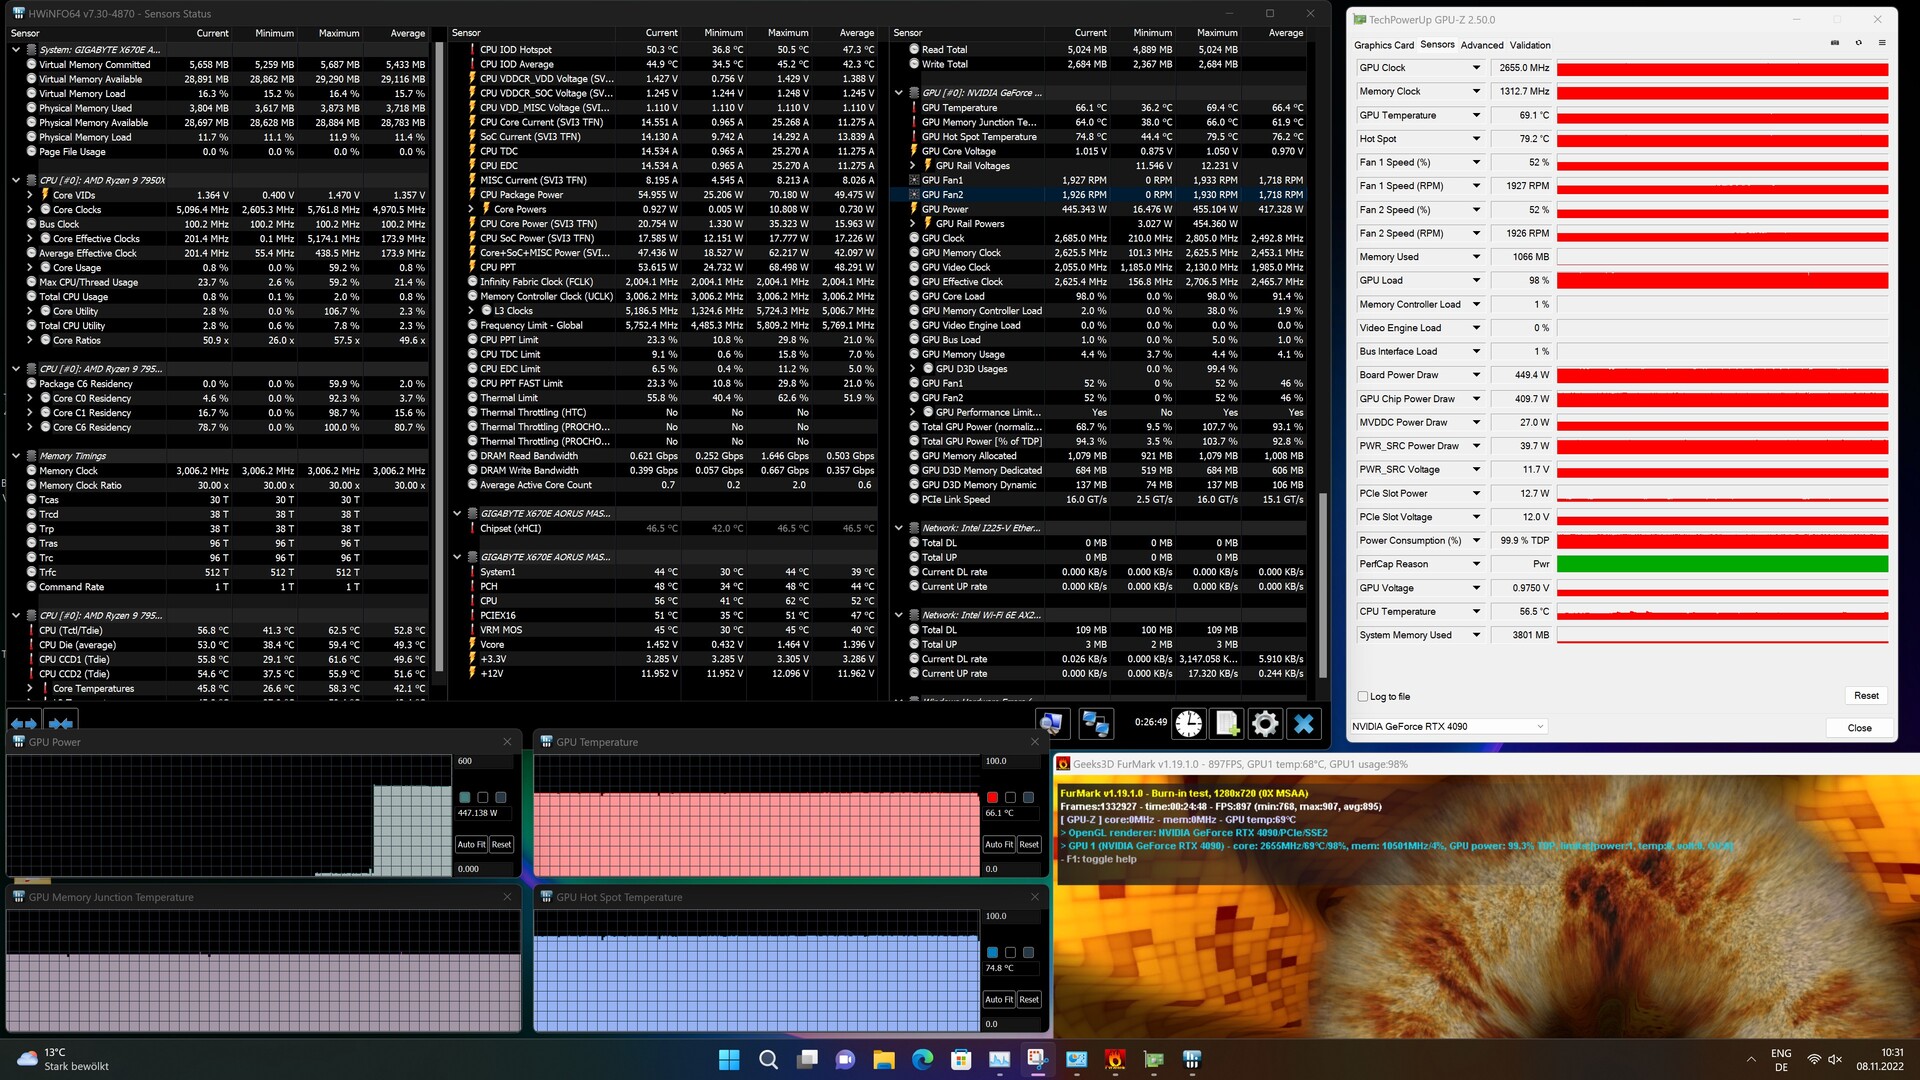
Con 450 watt la Nvidia GeForce RTX 4090 Ti è allo stesso livello della Nvidia GeForce RTX 3090 Ti. Tuttavia, il consumo energetico aumenta di esattamente 100 watt rispetto alla Nvidia RTX 3090 Ti Nvidia GeForce RTX 3090una tendenza che si è consolidata negli ultimi anni e possiamo solo sperare che il limite attuale sia stato raggiunto. Chi è alla ricerca delle massime prestazioni dovrebbe prestare poca attenzione all'argomento del consumo energetico. I 450 watt consumati dalla Palit GeForce RTX 4090 GameRock OC durante lo stress test vengono dissipati con successo. A quasi 70 °C il chip della GPU rimane relativamente fresco, così come la VRAM, dove non siamo riusciti a rilevare alcun problema di temperatura a 66 °C al massimo. L'obiettivo di potenza e la tensione della CPU possono essere aumentati leggermente, per cui la scheda grafica raggiunge un massimo di 509 watt sotto carico. Di conseguenza, anche la temperatura del chip aumenta leggermente. La ventola integrata fa un buon lavoro e raffredda la scheda grafica nel funzionamento standard a circa 2000 giri al minuto. La scheda grafica si sente appena dall'interno del case.
Quando si tratta di giocare, Palit GeForce RTX 4090 GameRock OC non ha motivo di nascondersi. Qui laAMD Radeon RX 6950 XTcosì come la Nvidia GeForce RTX 3090 Ti richiedono più energia. Tuttavia, in questo test siamo vicini ai limiti della CPU, il che significa che la GPU non può raggiungere le massime prestazioni. Quando si confronta il consumo energetico nell'ambito dello stress test FurMark, la situazione si ribalta contro la Palit GeForce RTX 4090 GameRock OC. Con una media di 611 watt, il consumo energetico delle nuove schede grafiche di fascia alta è notevolmente elevato. Pertanto, è necessario utilizzare un alimentatore potente per far funzionare la scheda grafica. Palit stessa raccomanda l'uso di un alimentatore da 1000 watt, che abbiamo utilizzato durante i test. In tutti i test e i benchmark non ci sono stati problemi con l'alimentatore.
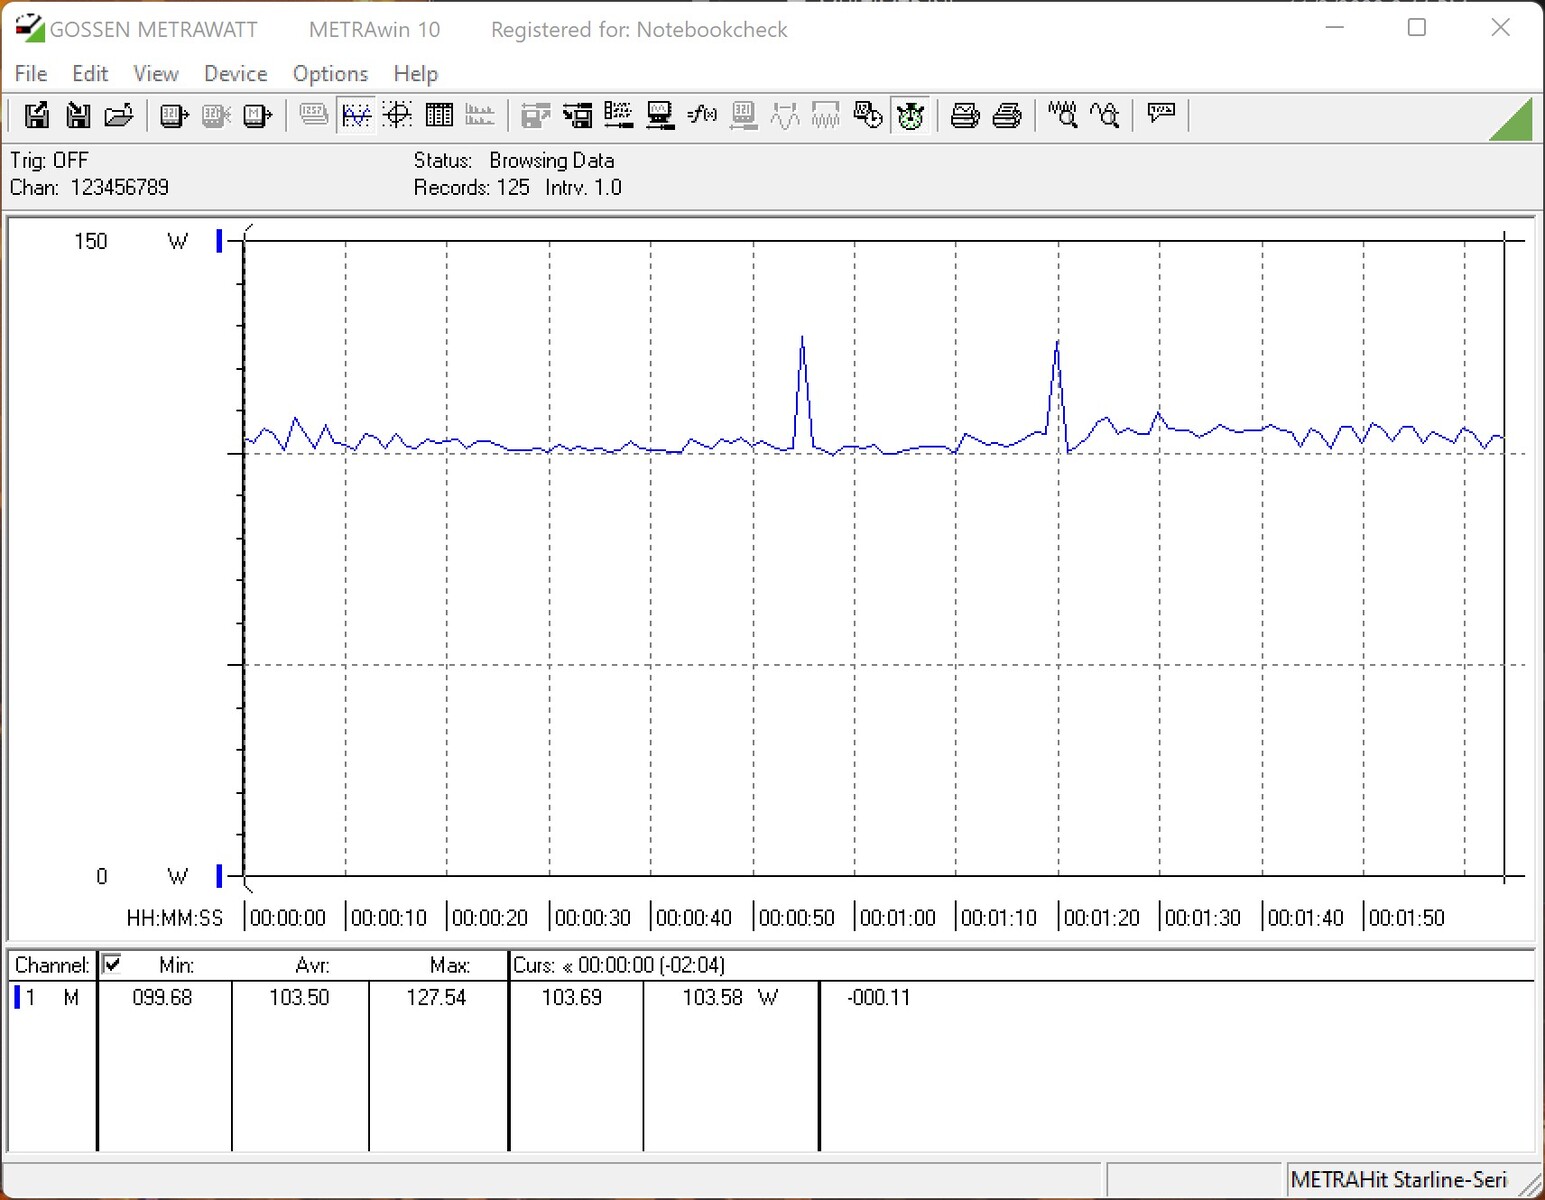
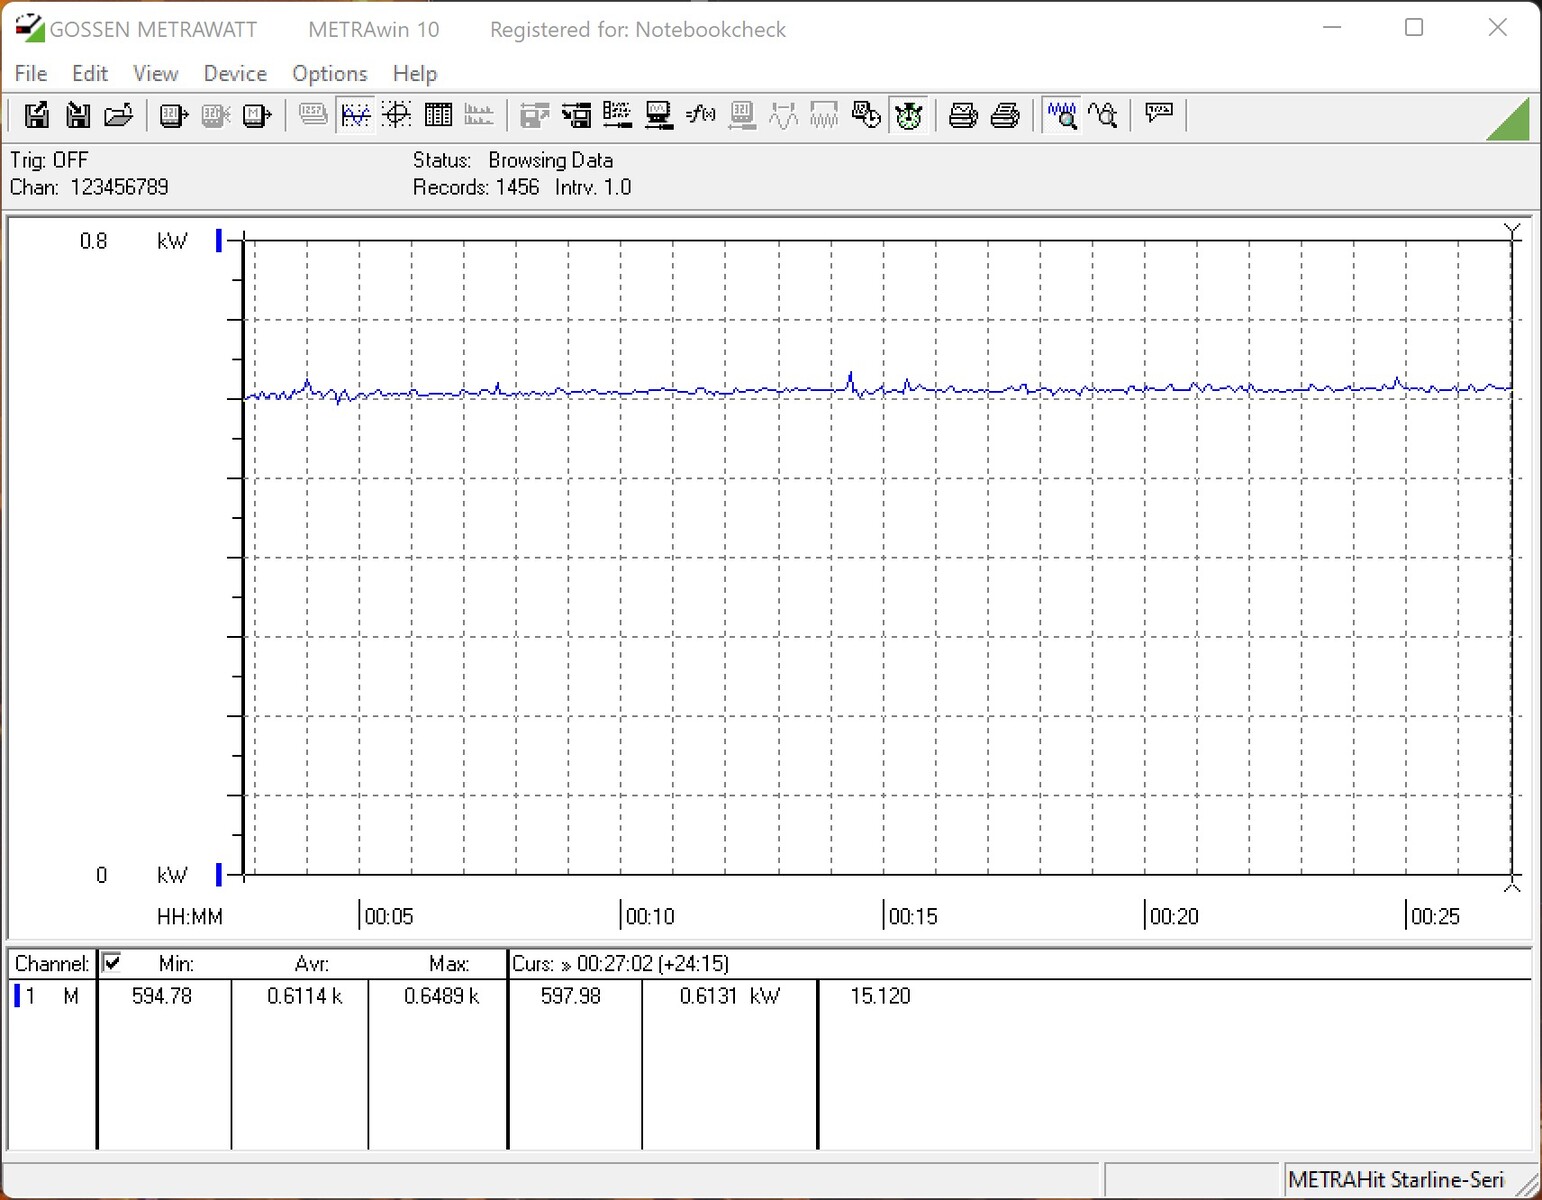
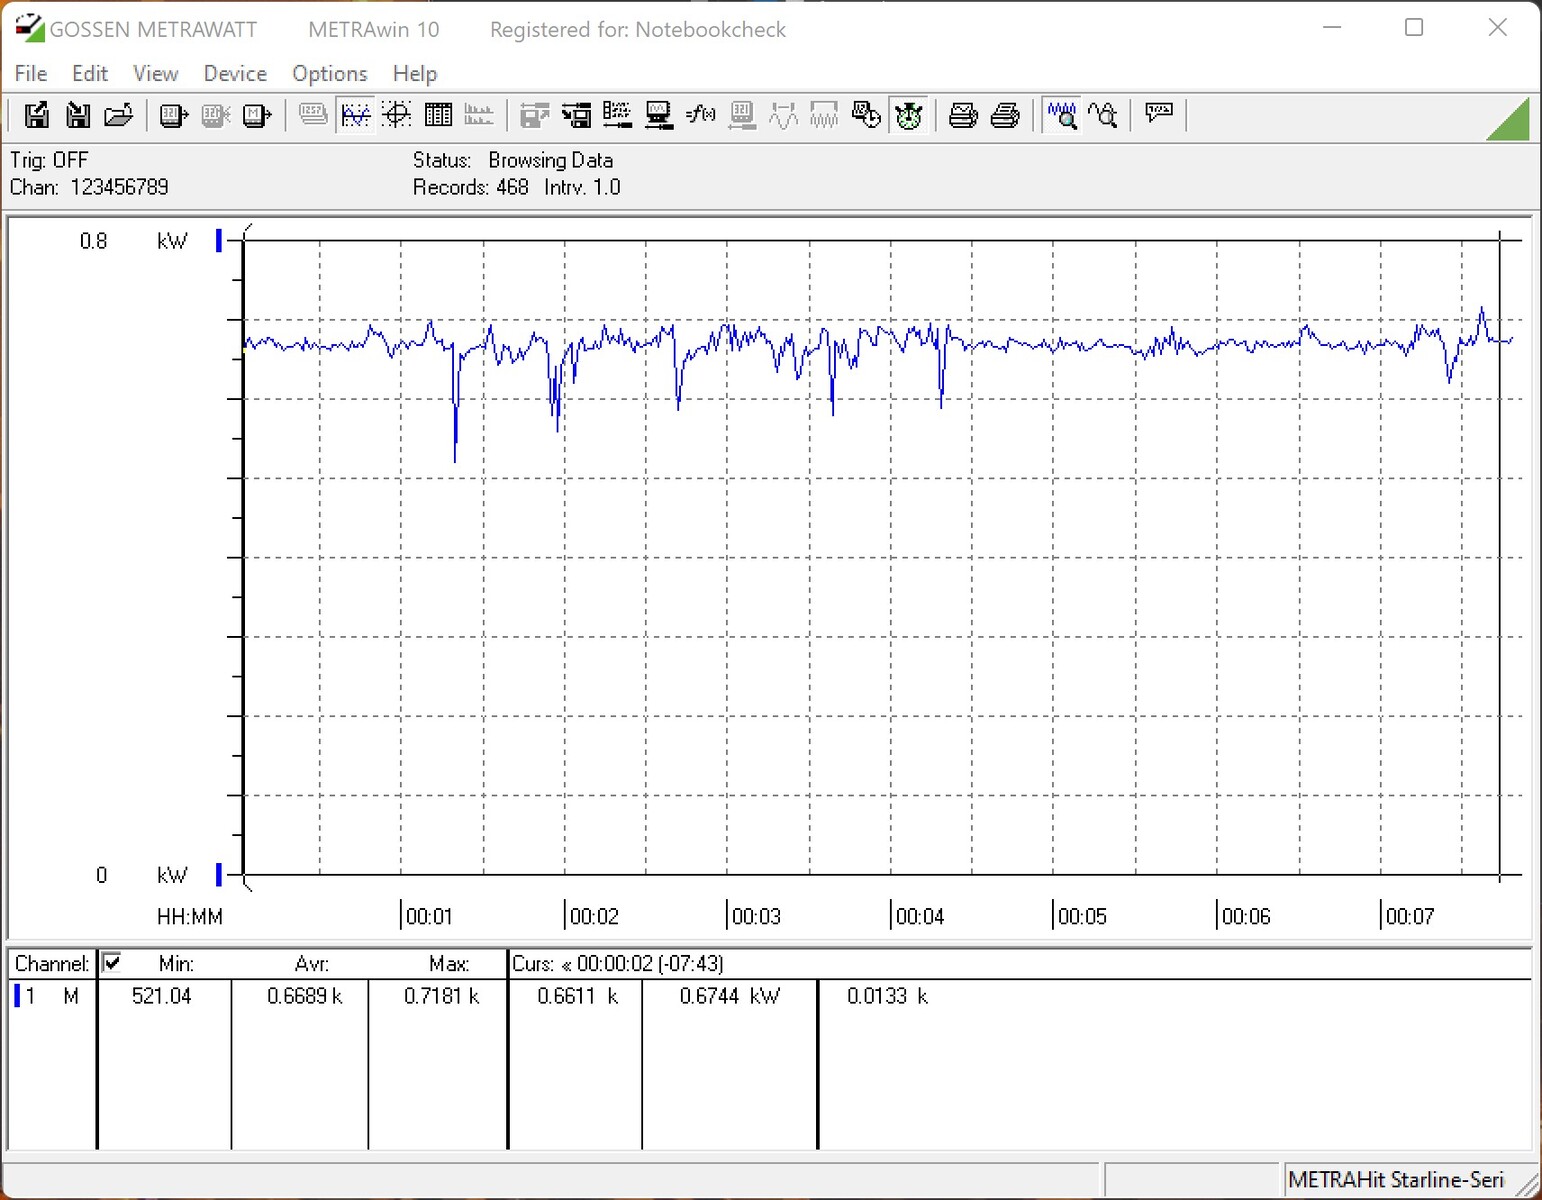
| Power Consumption / The Witcher 3 ultra (external Monitor) | |
| AMD Radeon RX 6950 XT, AMD Ryzen 9 5900X | |
| NVIDIA GeForce RTX 3090 Ti, AMD Ryzen 7 5800X3D (Idle: 102 W) | |
| NVIDIA GeForce RTX 3090, AMD Ryzen 9 7950X | |
| NVIDIA GeForce RTX 4090, AMD Ryzen 9 7950X | |
| NVIDIA GeForce RTX 3080 12 GB, AMD Ryzen 9 5900X | |
| AMD Radeon RX 6900 XT, AMD Ryzen 9 5950X (Idle: 99.15 W) | |
| Power Consumption / FurMark 1.19 GPU Stress Test (external Monitor) | |
| NVIDIA GeForce RTX 4090, AMD Ryzen 9 7950X | |
| AMD Radeon RX 6950 XT, AMD Ryzen 9 5900X | |
| NVIDIA GeForce RTX 3090, AMD Ryzen 9 7950X | |
| NVIDIA GeForce RTX 3080 12 GB, AMD Ryzen 9 5900X | |
| AMD Radeon RX 6900 XT, AMD Ryzen 9 5950X (Idle: 99.15 W) | |
* ... Meglio usare valori piccoli
Pro
Contro
Verdetto - Potenza bruta senza problemi di temperatura

La nuova ammiraglia di Nvidia, GeForce RTX 4090, mette in ombra tutto ciò che l'ha preceduta, e non solo. Il salto di prestazioni rispetto alla Nvidia GeForce RTX 3090 è enorme. In alcuni casi questo significa quasi raddoppiare il frame rate. Nel complesso, tuttavia, l'aumento delle prestazioni si attesta tra il 50 e il 70%, un risultato comunque impressionante. Allo stesso modo, anche AMD si trova in svantaggio con la sua ultima Radeon RX 6950 XT. Presentata solo pochi giorni fa, la AMD Radeon RX 7900 XTX sta facendo del suo meglio per tenerle testa.
Le prestazioni della GeForce RTX 4090 GameRock OC utilizzata nella nostra recensione sono sempre eccellenti. Grazie a funzioni ben note come DLSS e raytracing, Nvidia è riuscita ancora una volta a incrementare notevolmente le prestazioni con innovazioni attualmente offerte solo dalla serie RTX 4000 e, così facendo, a invogliare i potenziali acquirenti. Resta da vedere se AMD riuscirà a seguire l'esempio in questo senso. Tuttavia, le caratteristiche promettono molto bene, dato che sempre più giochi utilizzano questa tecnologia per migliorare la velocità dei fotogrammi senza perdere in qualità dell'immagine. Ma anche senza DLSS, la RTX 4090 di GeForce offre una potenza enorme per quasi tutti i giochi attuali a 2160p con le impostazioni più alte.
Per chi sta valutando l'acquisto, vale la pena ricordare che è necessaria una CPU molto veloce. Inoltre, non ha senso sprecare la potenza della scheda grafica per giocare solo a 1080p o 1440p. La scheda grafica si annoierà rapidamente.
Palit GeForce RTX 4090 GameRock OC attira l'attenzione con il design Midnight Kaleidoscope. Grazie ad Ada Lovelace, il design è all'altezza delle prestazioni ed è possibile giocare in 4K senza limiti.
Le opinioni si dividono quando si parla di consumo energetico e del connettore 12VHPWR implementato. Da un lato, i 450 watt sono ancora entro i limiti, se teniamo conto del consumo di energia della Radeon RX 7900 XTX.Nvidia GeForce RTX 3090 Ti tenendo presente la Nvidia RTX 3090 Ti. Questa ha lo stesso TBP e non può raggiungere le prestazioni della Nvidia GeForce RTX 4090 Ti. Di conseguenza, Nvidia è ancora una volta in grado di aumentare drasticamente l'efficienza con la nuova architettura Ada Lovelace. Il nuovo connettore di alimentazione è stato messo sotto accusa ultimamente. Finora non siamo riusciti a rilevare alcun problema legato a questo connettore. Tuttavia, continueremo a monitorare la situazione e a tenervi aggiornati, nel caso in cui questo destino dovesse toccare anche a noi. Il design della Palit GeForce RTX 4090 GameRock OC è un successo anche grazie alla sua superficie diamantata. Il pacchetto è ben completato da una sottile illuminazione RGB. Allo stesso modo, il dissipatore Palit integrato fa tutto bene: la scheda grafica rimane piacevolmente silenziosa sotto carico, nonostante l'elevato assorbimento di potenza.
Prezzo e disponibilità
Le schede grafiche rimangono difficili da reperire. Quando i modelli sono disponibili per l'acquisto, spesso hanno un forte sovrapprezzo rispetto al prezzo di listino di Nvidia di 1949 euro. Attualmente, l'esemplare oggetto della nostra recensione è in vendita su Amazon per 2679 dollari. Tuttavia, i tempi di consegna vanno dalle 4 alle 6 settimane. Il modello non OC della Palit GeForce RTX 4090 GameRock è attualmente disponibile su Amazon per 2369 dollari.
Price comparison

